Article

Research on Confined Compression and Breakage Behaviour as Well as Stress Evolution of Rice Under Framework of Cohesion Zone Model
College of Engineering, Northeast Agricultural University, Harbin 150030, China
*
Author to whom correspondence should be addressed.
Agriculture 2026, 16(2), 208; https://doi.org/10.3390/agriculture16020208

Submission received: 5 December 2025 / Revised: 6 January 2026 / Accepted: 12 January 2026 / Published: 13 January 2026
(This article belongs to the Special Issue Innovations in Grain Storage, Handling, and Processing)

Abstract

Agricultural materials frequently undergo fragmentation due to high-stress conditions during processing, storage, and transportation. Throughout these processes, the spatial arrangement and morphology of particles continuously evolve, rendering the breakage behaviour of particle groups particularly complex. Thus, an in-depth understanding of the fracture processes and breakage mechanisms within particle beds holds significant research value. This study systematically investigates the breakage behaviour of rice particle groups under confined compression through an integrated methodology combining experimental testing, X-ray CT imaging, and finite element modelling (FEM) based on the cohesive zone model (CZM). Results demonstrate that, at the granular assembly scale, external loads are transmitted through force chains and progressively attenuate. As compression proceeds, stress disseminates toward peripheral particle regions. At the individual particle level, particle breakage results from the intricate interaction between coordination number (CN) and localized contact stress, with tensile stress playing a predominant role in the fracture process. An increase in coordination number promotes a more uniform stress distribution and inhibits breakage, thereby exhibiting a “protective effect”. These findings provide valuable insights for the design and optimization of grain processing equipment, contributing to a deeper comprehension of particle breakage characteristics.

1. Introduction

In the fields of science and engineering, rice grains are typically regarded as granular materials (GM), whose complex mechanical behaviour has attracted extensive research. As a staple food for over half of the global population, rice often exists in the form of particle groups during harvesting, processing, and transportation, where it is subjected to static or dynamic loads. Under such conditions, interactions among particles and between particles and equipment often place the particle group in a state of high stress, leading to significant particle breakage and even various engineering issues such as collapse and fragmentation. Although relevant processing equipment has been continuously improved, breakage remains frequent in practical production due to an insufficient understanding of the breakage characteristics and damage mechanisms of the granular material itself. Therefore, systematically revealing the damage evolution process and fracture mechanisms of particle groups under high-stress conditions is essential for fundamentally understanding their damage processes and intrinsic mechanisms. This also provides a theoretical basis for reducing loss and damage during grain processing, storage, and other stages.
Currently, research on the fragmentation of granular materials primarily follows two paths: single-particle breakage and compression-induced damage in particle groups. Among these, studies on single-particle breakage have reached considerable depth, with scholars systematically investigating the influence of both external factors (such as loading methods, particle size, and morphology) and internal factors (such as moisture content) [1,2,3,4,5]. These studies have not only established a theoretical framework for understanding the mechanisms of single-particle breakage but have also made their testing methods an important means of obtaining key mechanical parameters such as breakage strength and critical conditions [6]. However, in actual processing environments, particles exist in complex collective states, exhibiting mechanical responses differ significantly from those of single particles. To simulate these complex working conditions, confined compression tests have become an effective and simplified research approach [7]. By placing a particle group within a confined space and applying axial loads, this method simulates the mechanical state of particles under high stress with surrounding constraints, providing a viable pathway for investigating the mechanical behaviour and particle breakage mechanisms of particle groups.
From a macroscopic perspective, the breakage morphology and evolutionary patterns of a particle group during compression are markedly distinct from those observed in single particles. This divergence stems from interparticle friction, rearrangement, and the dynamic evolution of force chain networks within the assembly. The frictional interactions and relative motion among particles introduce a higher degree of complexity into the breakage evolution within the granular bed. For instance, Yu et al. [8] experimentally investigated the evolution and distribution of particle size in coal particles under varying temperatures and stresses. Schnoert et al., through experimentation, revealed that particle breakage characteristics vary with the number, size, and stress state of adjacent particles [9,10]. Although such experimental studies have explored the compression behaviour of particle groups, providing a foundation for understanding force transmission and macroscopic breakage, a reliance solely on experimentation presents limitations for probing the underlying mechanisms of particle breakage at a microscopic scale. Consequently, combined approach integrating numerical simulation with experimentation has emerged.
Among these, the Discrete Element Method (DEM) has been applied due to its advantages in simulating granular mechanical behaviour. During uniaxial confined compression process, force chains are randomly generated within the particle bed. Early research often employed photoelastic experiments to observe the force chain network [11,12,13]. While this method is intuitive, it requires materials to possess birefringent properties, rendering it unsuitable for opaque biomass materials like rice grains. With the continuous development of DEM, obtaining force chains through numerical simulation has become a viable approach. Li et al. [14] utilised DEM to simulate the compression process of rice grains, discovering that force chain transmission exhibits a top-down attenuation characteristic. Yu et al. [15] employed DEM simulations to analyse crack shapes and characteristic stress distributions in particles, revealing the inherent connection between the principal stress direction and crack distribution. Furthermore, particle deflection causes continuous force chain reconfiguration, while particle breakage behaviour further complicates this process. As pressure within the bed and number of broken particles increase, the porosity of the particle bed continuously decreases, and the system gradually densifies. Consequently, numerous scholars have focused on understanding the pressure-volume relationship and the structural evolution of the particle bed during compression [12]. Additionally, the shape of particles within the bed further influences force chain formation and particle breakage. Therefore, Barrios et al. used a DEM particle replacement model to simulate the breakage process in particle beds and proposed a modelling method for particle breakage [16,17]. Although novel approaches such as particle replacement methods have been introduced, they still exhibit limitations when simulating the complex damage pathways in particle groups. Moreover, most DEM simulations simplify particles as spheres, failing to fully account for the influence of realistic shapes; its typical use of idealised geometric shapes cannot accurately reflect the actual mechanical response of particle groups under external loads. Moreover, this idealized simplification cannot provide a sufficiently accurate representation of the resulting fracture morphologies. Additionally, the reliability of DEM in simulating particle breakage has yet to reach a consensus [18].
By contrast, the finite element method (FEM) exhibits distinct advantages in simulating damage in particulate materials, demonstrating notable effectiveness in addressing problems such as impact, compression, and composite material failure. Within the field of agricultural engineering, FEM has been effectively employed to simulate the breakage behaviour of grain particles. For instance, Han et al. [19,20] investigated the influence of impact velocity, equivalent particle size, and moisture content on the breakage probability and modes of rice grains through a combined experimental and simulation approach. Xu et al. [21] utilised FEM to simulate damage in rice grains caused by oblique impacts from threshing teeth during the threshing process. These studies provide strong evidence for the applicability and reliability of the FEM in simulating the fracture of granular materials. Furthermore, FEM holds certain advantages in the investigation of composite materials. Given the stochastic nature of fracture initiation in particle damage, and the need for a suitable model when employing FEM to investigate particle breakage, the Cohesive Zone Model (CZM) emerges as a fitting candidate. Renowned for its capability to simulate the random generation of cracks and its significant advantages when handling composite materials. For example, Deng et al. [22] developed a three-dimensional zero-thickness cohesive element based on the traction-separation law of the CZM. This was integrated with bilinear and potential-based constitutive laws to simulate delamination and fracture in composite materials, demonstrating the advantages of the PP cohesive model for simulating crack propagation. Zhang et al. [23] and Wang et al. [24] employed the FEM to study the impact response of composite laminates and the breakage behaviour of steel wire rope reinforced with carbon fibre-reinforced polymer (CFRP), respectively. These investigations provide crucial references for extending the CZM to the simulation of breakage in elastoplastic materials such as rice grains. Therefore, the FEM based on the CZM provides a viable solution to a long-standing problem: previous research on confined compression could only describe the macroscopic breakage morphology but was unable to elucidate the underlying microscopic breakage mechanisms and provide breakage morphologies consistent with the macroscopic observations. A primary challenge in constructing a FEM is obtaining accurate spatial position data for the particles. In exploring the arrangement of particle groups, researchers have proposed two pre-testing methods: freeze-drying and epoxy resin infusion, followed by sectioning to obtain cross-sectional information on particle arrangement. Although these methods can acquire particle packing information, they are cumbersome, destructive, and preclude subsequent mechanical testing. Advancements in high-resolution optical and radiographic equipment, coupled with sophisticated image processing techniques, have significantly enhanced the accuracy and efficiency of particle morphology extraction and characterisation. Computed Tomography (CT) scanning has emerged as a transformative method for acquiring positional information of particle groups. This technique allows data acquisition without altering the physical properties of the particles, enabling subsequent experiments and providing a basis for model validation [25,26,27]. In summary, despite advancements in particle breakage research, a systematic investigation that concurrently considers realistic particle geometry, the effects of force chain networks, and the complete process of damage evolution from a micromechanical perspective remains lacking. To address this gap, an integrated methodology combining the reconstruction of realistic packing structures with CZM-based finite element simulation is presented as a viable framework for quantitatively revealing the mesoscopic breakage mechanisms of rice particle groups under confined compression. In contrast to the majority of previous studies, which focused solely on macroscopic mechanical responses or provided qualitative descriptions of breakage phenomena, this integrated approach establishes a seamless link between realistic particle packing and microscopic fracture behaviour. It thereby contributes to a deeper understanding of the damage mechanisms in granular materials.
Therefore, this study aims to reveal the breakage evolution behaviour and underlying mechanisms of rice particle groups under confined compression from a microscopic perspective. To this end, CZM parameters for FEM simulation were first calibrated through single-grain compression experiments. Subsequently, corresponding confined compression tests on particle groups were conducted using a dedicated experimental apparatus. Building upon this experimental foundation, a high-fidelity FEM of rice particle group was meticulously reconstructed. This model was validated through CT scanning techniques, with its effectiveness corroborated by comparisons with macroscopic mechanical responses. Then employing this model, the breakage behaviour of rice grains within the particle group under compressive loading was simulated, yielding microstructural mechanical information into the fracture process. Finally, a systematic analysis of the fracture evolution of rice grains was conducted, the study provides a deeper understanding of the macroscopic breakage behaviour and its associated microscopic mechanisms in brown rice particle groups.

2. Materials and Methods

2.1. Experimental Materials

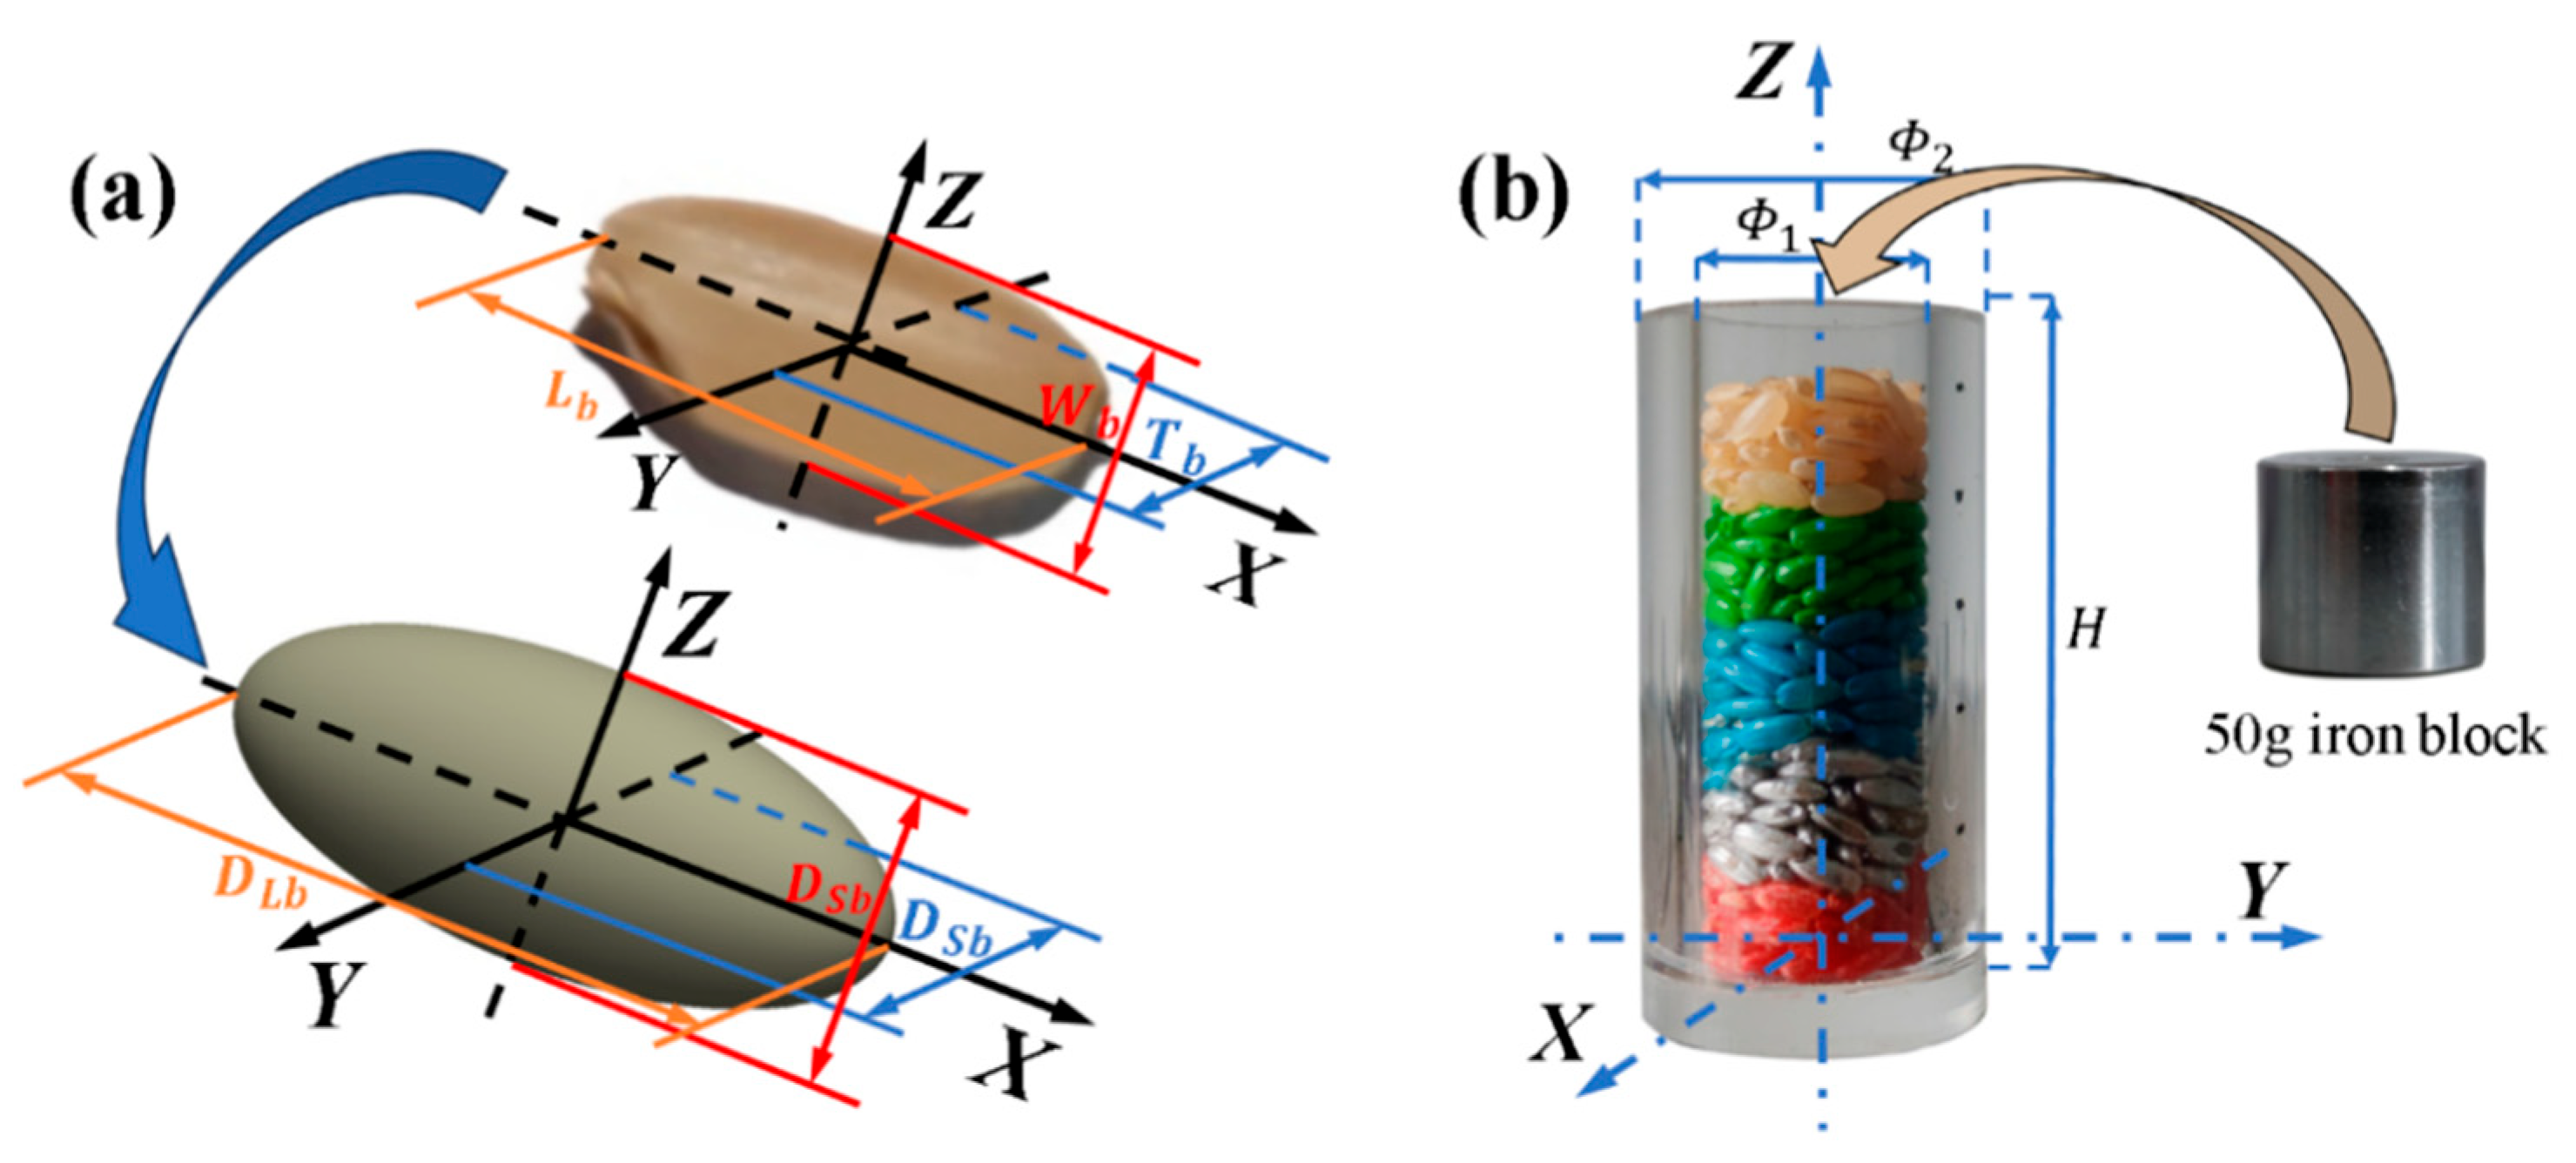
The rice variety used in the experiment was Suijin No. 18, provided by the Rice Research Institute of Northeast Agricultural University in Harbin, China, and stored at room temperature until October 2024. To ensure material consistency, the paddy rices underwent cleaning, impurity removal, and dehulling prior to testing. The moisture content was standardized to 13.5% using a 105 °C oven-drying method. Furthermore, manual selection was conducted to ensure that all rice grains were intact and uniform. A vernier caliper was used to perform triaxial dimensional measurements on 100 rice grains to obtain relevant data for their length (Lb), width (Wb), and thickness (Tb). Based on the consensus that rice grains are typically regarded as ellipsoidal in shape, this study simplifies rice into an ellipsoidal model. Although this model neglects the indentation at the germ, it has been demonstrated to effectively simulate its macroscopic breakage behaviour [19]. As shown in Figure 1a, the dimensions of the actual rice grain and the simplified model used in the simulation are presented. Based on the measured dimensions, the long-axis length (DLb) and the equivalent diameter of the radial cross-section (DSb) were defined. It is important to note that, to distinguish between the long-axis length of the simplified ellipsoidal model and the experimentally measured length (Lb) of the rice grain, the notation DSb is used for the former. However, their numerical values are identical. The equivalent diameter was calculated using the following formula [28]:
D S b = L b · W b + T b 2 4 1 / 3  
To facilitate subsequent observation, rice grains of equal quantity were dyed using atomized spray painting. It is important to note that the physical properties of the rice grains remain unaffected by the dyeing process [29]. After dyeing, the grains were sequentially placed into the experimental container in the order of red, silver, blue, green, and undyed rice (Figure 1b). To achieve a specific initial packing state and reduce bed porosity, a 50 g iron block was placed atop the filled particle bed. This pre-compression procedure aimed to minimize test variability caused by differences in grain orientation, thereby ensuring experimental repeatability and defining a consistent compression baseline. To effectively capture particle rearrangement and breakage processes before and during failure, and to avoid scale effects (specimen size or particle size) influencing the confined compression results, the ratio standard in rock mechanics (less than 1:5) was applied [8]. When the specimen diameter is less than five times the maximum particle diameter, mechanical behaviour of rice may be significantly affected by the loading head. Based on the calculated DSb of 3.4 mm, the inner diameter of the experimental container should greater 18 mm and its height should be exceed than 34 mm. Accordingly, a container with an inner diameter of Φ1 = 20 mm, outer diameter of Φ2 = 30 mm, and height H = 55 mm was selected. To allow direct observation of grain packing orientation and changes during compression, the experimental container was fabricated from high-transparency, high-strength plexiglass. Its stiffness is substantially higher than that of the rice grains, allowing the assumption that the container undergoes negligible deformation during loading, while the specimen deforms axially.

2.2. Cohesive Zone Model

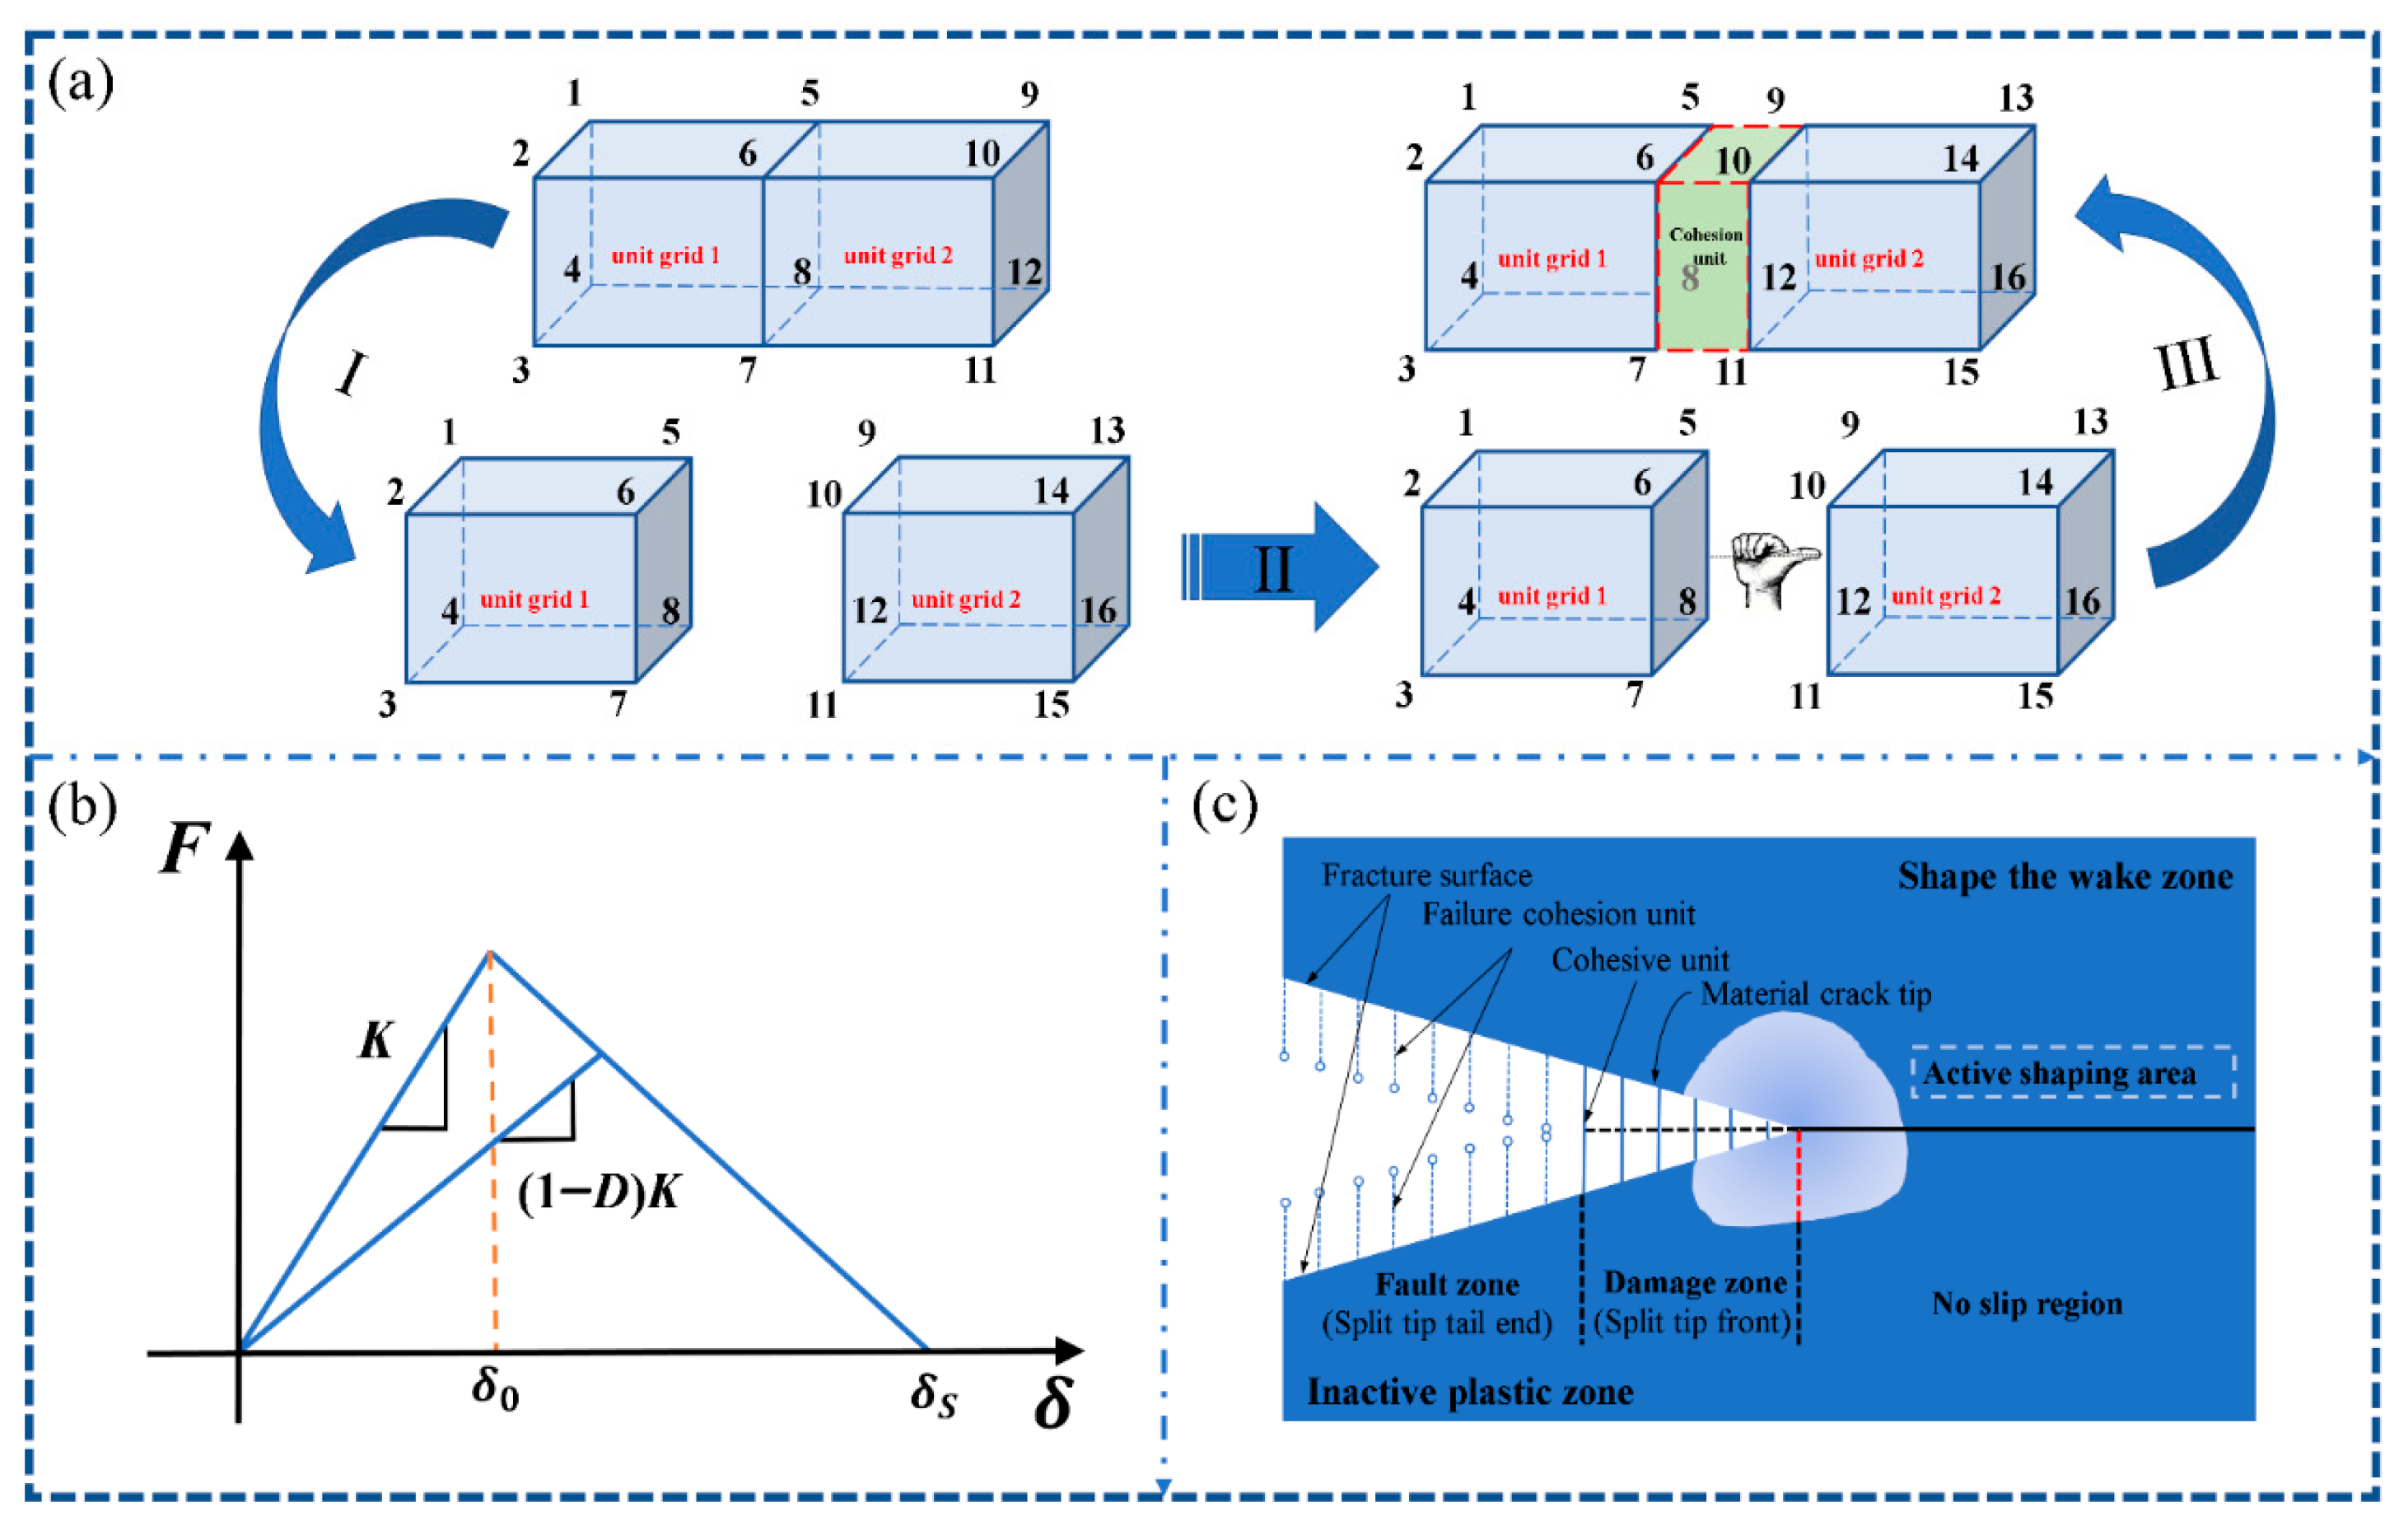
Figure 2a schematically illustrates the finite element mesh before and after the insertion of zero-thickness cohesive interface elements, as well as the crack elements. It should be noted that the embedded zero-thickness cohesive elements possess no geometric thickness. The depiction with volume in the figure is solely for visualizing their location. To achieve the embedding of zero-thickness cohesive elements, the initial finite element mesh requires specific processing. The embedding procedure consists of three main steps: Step I: Element Discretization. After discretizing the solid into finite elements, a self-developed program reads all element and node information from the entire model. The nodes of each element are reordered so that every element comprises nodes not shared with any other element. Step II: Node Sequence Determination. Adjacent element faces are identified using a coordinate-matching algorithm. The nodes on these adjacent faces are then reordered according to ABAQUS requirements for zero-thickness cohesive element connectivity. For an eight-node zero-thickness cohesive element, the first four nodes must belong to one face and the last four to the corresponding opposite face. The sequence of the first four nodes must follow the right-hand rule, with the thumb pointing towards the opposite face. Step III: Cohesive Element Generation. The eight nodes from the coincident faces, arranged as described in Step II, are outputted, assigned new element numbers and the appropriate element type. This completes the insertion of one zero-thickness cohesive element. Based on the above embedding scheme, a Python (3.12) script was developed to enable the rapid batch insertion of zero-thickness cohesive interface elements, thereby facilitating the establishment of the rice breakage failure model. It is important to note that, in the actual modelling process, a zero-thickness cohesive element was inserted between every pair of adjacent solid elements within the discretized model to represent the initiation and propagation of micro-cracks inside the grain.
In the finite element simulation of material damage, the CZM offers distinct advantages for crack simulation. While various forms of CZM exist [30,31,32,33], the bilinear model is frequently employed for brittle and elastic-plastic materials. Doitrand et al. demonstrated that results from a bilinear CZM show similarities to those obtained using coupled criteria [34]. The bilinear model effectively represents intra-layer crack propagation in laminated composites [35,36,37,38]. Consequently, this study adopts the bilinear CZM to establish the failure criterion for the rice fracture model. Figure 2b illustrates the bilinear constitutive relationship for the zero-thickness cohesive interface element. The bilinear model can be divided into two stages. The first stage is the linear elastic region (0 < δ < δ0), described by Equation (2). Within this stage, the material can recover its original state upon removal of the external load, analogous to the ‘damage zone’ shown in Figure 2c, which would revert upon load removal. When δ = δ0, the corresponding traction reaches its maximum value T, marking the onset of damage. The second stage is the damage evolution stage (δ0 < δ < δs), where plastic deformation occurs. Complete fracture is achieved when δ = δs [39,40,41]. This phenomenon corresponds to the ‘fault zone’ in Figure 2c, which signifies the failure of the cohesive element.
t n t s t t = K n K s K t δ n δ s δ n
Here, ti (where i = n, s, t) denotes the normal and tangential stresses within the cohesive element, Ki (where i = n, s, t) represents the stiffness corresponding to the traction in each of the three directions, and δi (where i = n, s, t) signifies the separation displacements in the three directions. To determine the onset of damage and evaluate the strength of the cohesive interface, the maximum stress (MAXS) criterion is adopted in this study [42].
m a x t n t n m a x , t s t s m a x , t t t t m a x = 1
t i m a x , where (i = n, s, t) denotes the traction strengths in the normal and two tangential directions (contact stresses), as documented in the ABAQUS User Guide (2017) [43]. To determine the onset of damage, the second stage (the damage evolution phase) can be expressed as follows:
t n ´ t s ´ t t ´ = 1 Δ K n 1 Δ K s 1 Δ K t ε n ´ ε s ´ ε n ´ = E δ
In the equation, Δ denotes the degree of damage to the cohesive element, where Δ ∈ [0, 1]. A value of Δ = 0 indicates no damage, while Δ = 1 signifies complete failure. During the damage evolution process, the fracture energy GIC is defined as follows: GIC equals the integral of the curve in Figure 2b [44].

2.3. Acquisition of Model Parameters

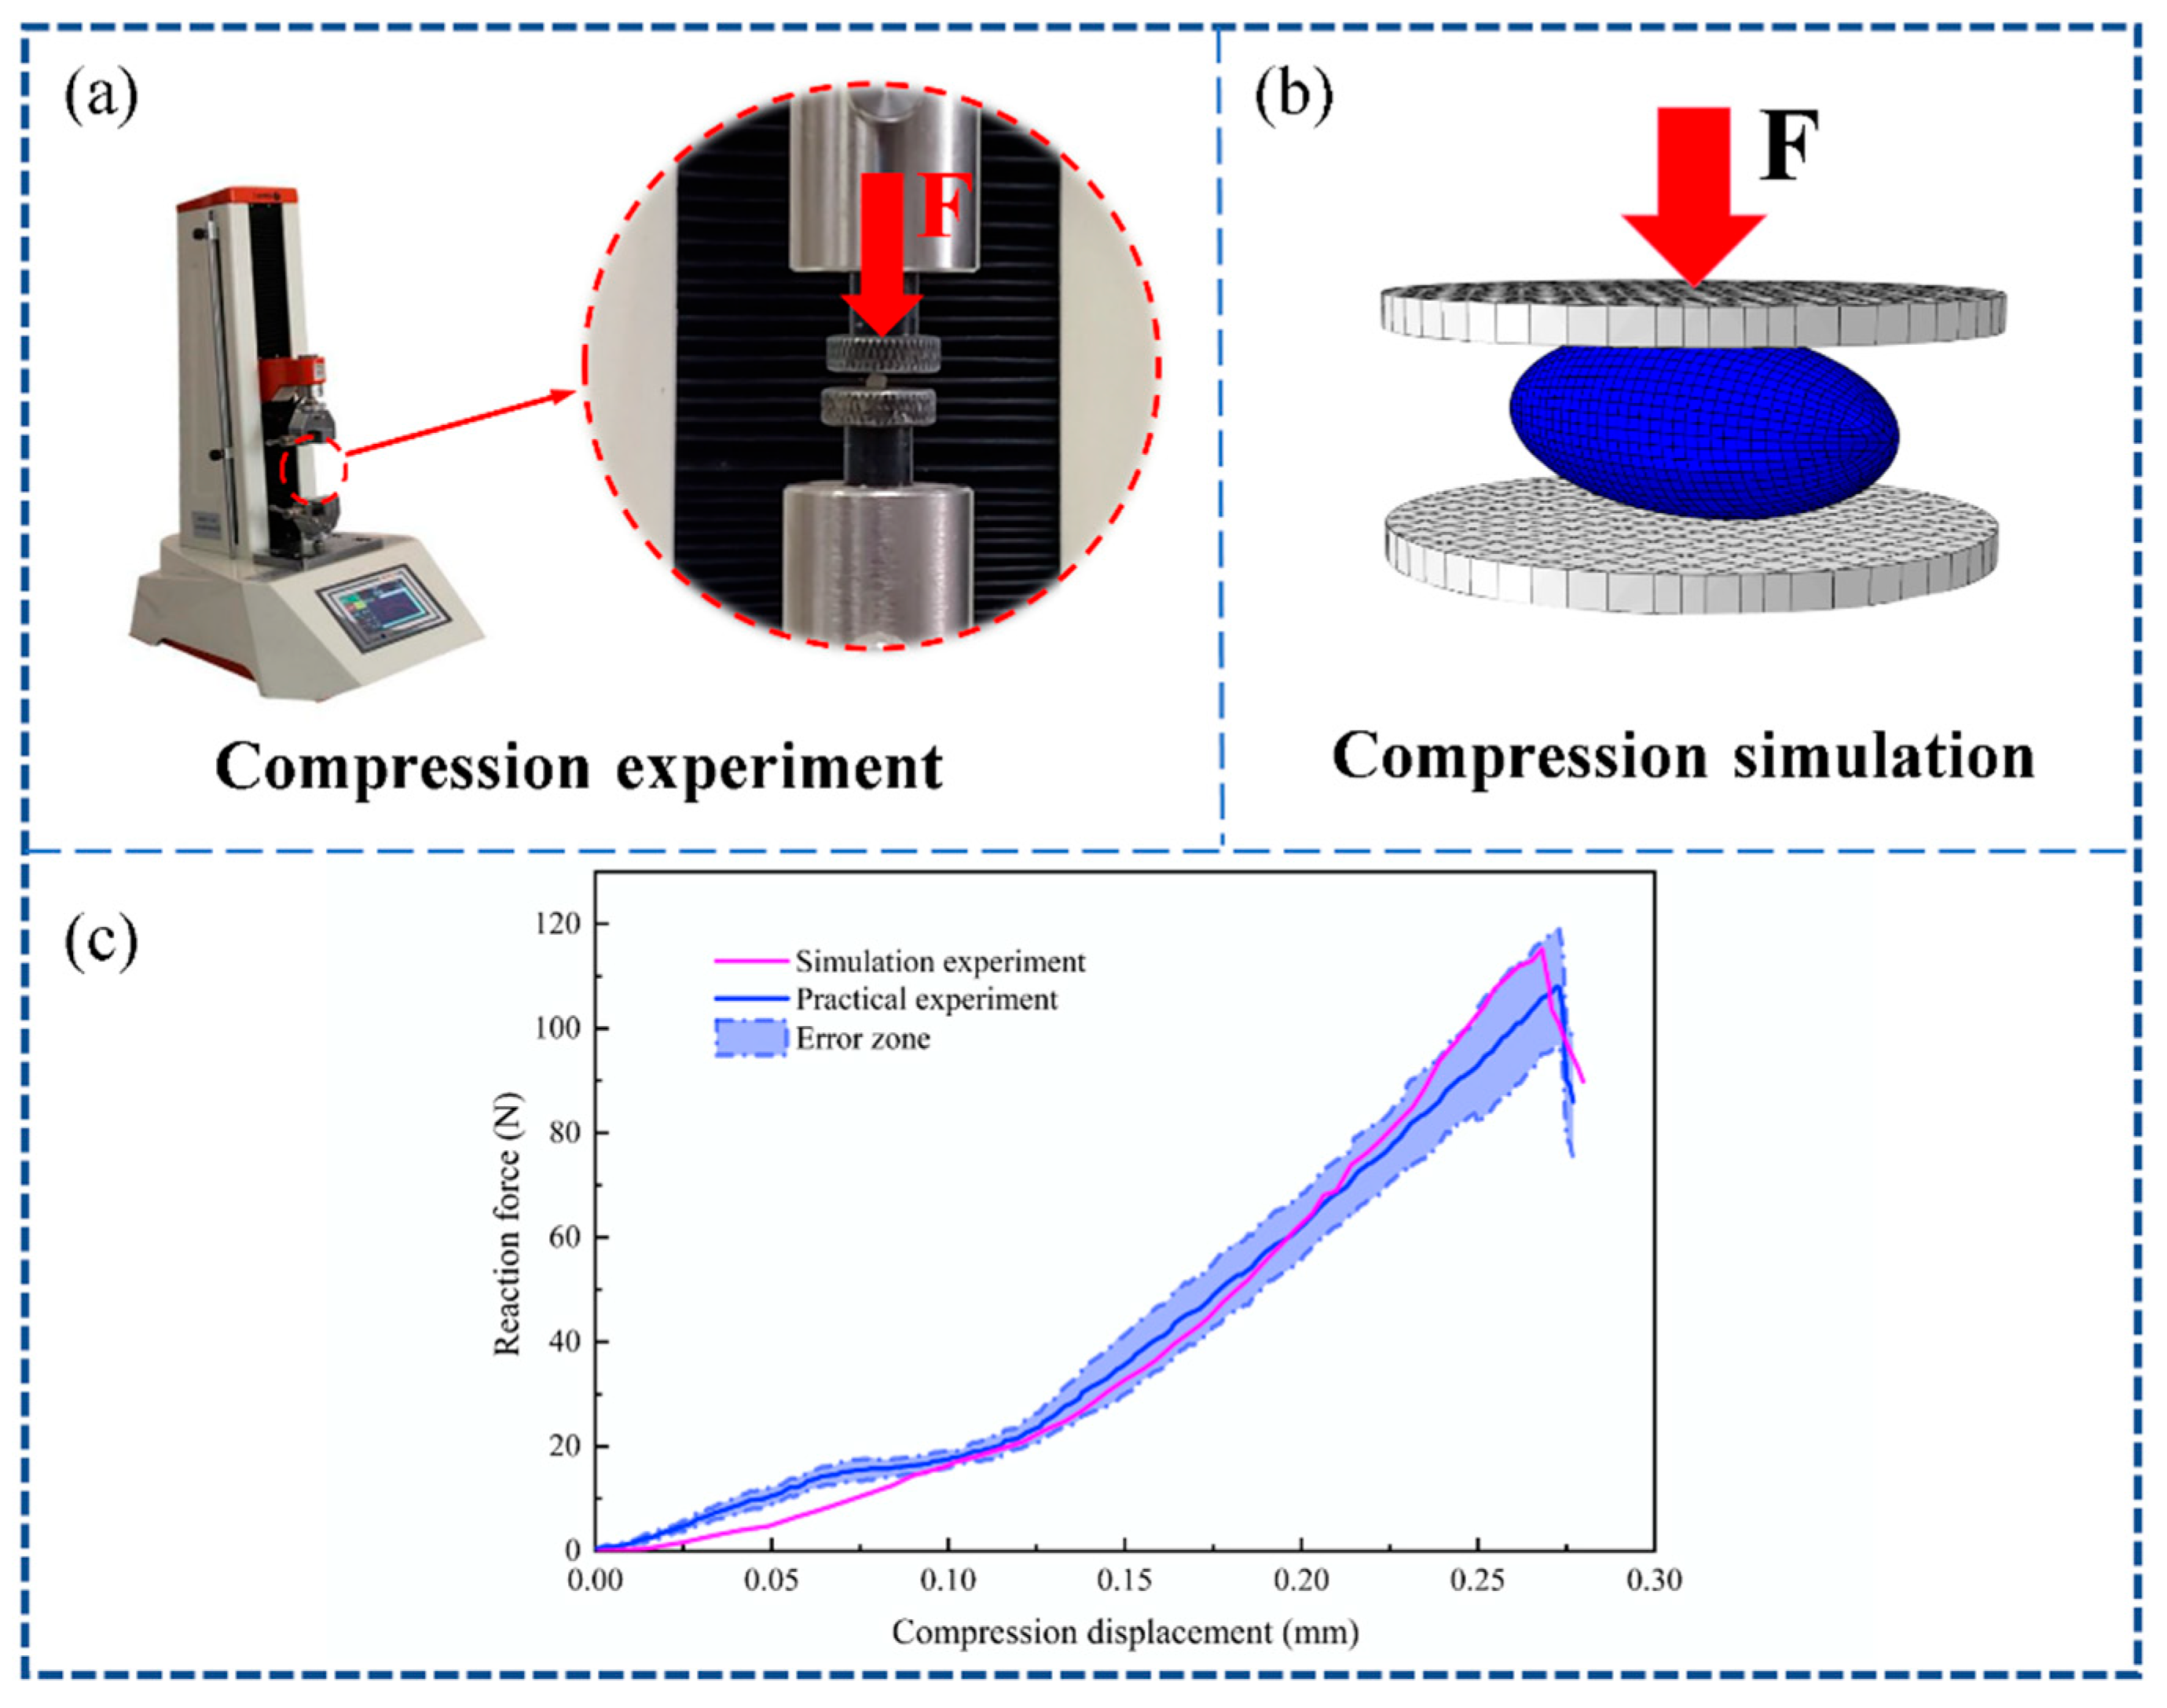
Uniaxial compression testing serves as a conventional method for determining fundamental mechanical properties of materials, such as Young’s modulus, Poisson’s ratio, and force–displacement relationships. To obtain the numerical parameters required for simulating of rice particles, experiments were conducted using a universal testing machine (ZQ-990A, Zhiqu Precision Instrument Co., Ltd., Dongguan, China), as shown in Figure 3a. During the tests, the rigid base of the machine remained stationary while the loading head moved downward at a constant velocity to apply compressive deformation. Individual rice grain was positioned on the rigid base, and the loading head advanced at a rate of 5 mm/min. Since the parameters in the numerical simulation are derived based on the traction-separation law (TSL), and conducting direct tensile tests on rice grains is impractical, compression tests were employed as a substitute for tensile tests. This substitution method has been validated for rice grains. However, its applicability to other materials requires further investigation. For brevity, further details are not elaborated here, and the specific methodology is described in reference [45]. To ensure data reliability, the test was repeated ten times to obtain accurate force–displacement curves. The corresponding Young’s modulus was calculated according to Hooke’s law.
E r i c e = 2 F ( 3 + v ) ε · π D L
where Erice represents the apparent Young’s modulus of the rice grain (MPa), L denotes the axial length (mm), D is the equivalent circular diameter (mm), F indicates the applied parallel force on the rice grain (N), and ν is Poisson’s ratio.
Following the experimental determination of material intrinsic properties, a corresponding single-particle compression model was established in the simulation (Figure 3b) to replicate the corresponding compression test process and obtain the corresponding force–displacement curve. The process for obtaining relevant simulation parameters is detailed in Section 2.2. To validate the accuracy of the simulation model, the simulated results were compared with the force–displacement curve from experimental data, as shown in Figure 3c. The figure indicates that the simulation results align reasonably well with the experimental outcomes. However, subtle discrepancies remain, potentially arising from the simplification of rice grain into ellipsoids, which overlooks surface irregularities and inherent microcracks within the material [19]. Material parameters are detailed in Table 1. It is important to note that the calibrated CZM parameters should be understood as “effective, phenomenological parameters”. They are capable of reproducing the macroscopic fracture behaviour of rice grains but do not strictly represent intrinsic tensile fracture properties. These parameters were calibrated by matching the macroscopic force–displacement response (e.g., peak load) obtained from single-particle compression tests. This response inherently integrates the combined effects of various force components acting during the fracture process. Consequently, the calibrated parameters effectively capture the overall fracture resistance of rice grains under complex stress states.
In numerical simulations, the discretization of element size significantly impacts model quality, computational cost, and the accuracy of results [46]. Consequently, determining an appropriate element size is of paramount importance. Munjiza et al. [47] investigated the influence of mesh size on fracture patterns, noting that reliable results require the element size to be smaller than the length of the Fracture Process Zone (FPZ). To accurately capture stress intensity at crack tips and obtain reliable numerical results for compressive failure using the Cohesive Zone Model (CZM), the element size must be smaller than the FPZ length. According to the formulation summarized by Turon et al. [48], the FPZ length (Ifpz) is calculated as follows:
I f p z = M E G I C σ 2
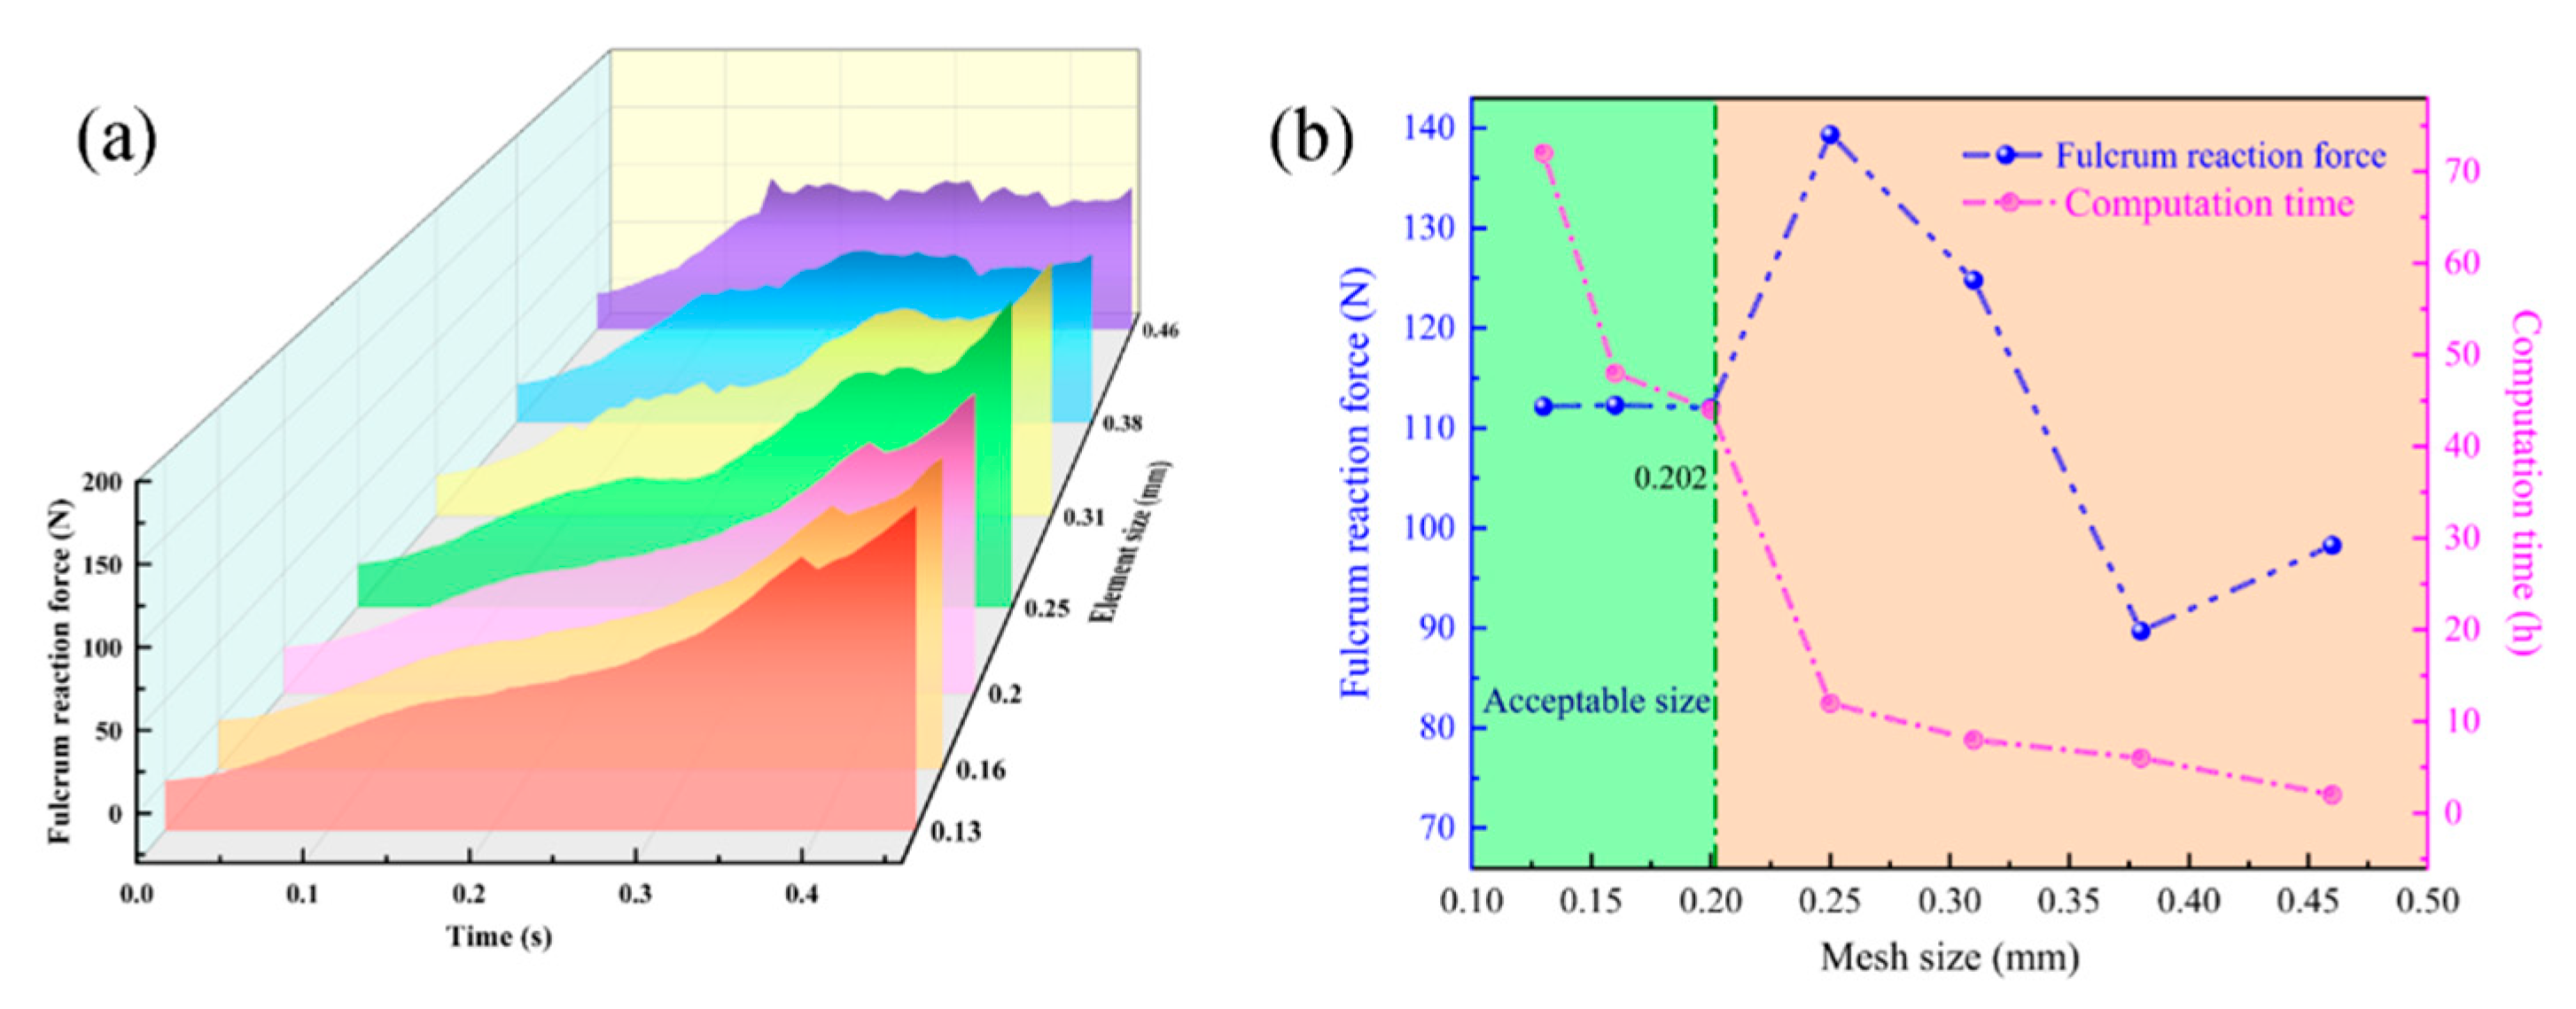
where E is the Elastic Modulus (N/mm2), GIC is the critical fracture energy release rate (MJ), σ is the maximum interface initiation strength (N), and M is a constant derived from the Muskhelishvili and Westergaard solutions, with values bounded between 0.21 and 0.75 [49]. Based on the material parameters provided in Table 1, the calculated FPZ length falls within the range of 0.13 ≤ Ifpz ≤ 0.46. To investigate the effect of average element size on the compressive failure behaviour of rice grains, a mesh sensitivity analysis was conducted using seven different element sizes: 0.13 mm, 0.16 mm, 0.20 mm, 0.25 mm, 0.31 mm, 0.38 mm, and 0.46 mm. Comparison of the results, as shown in Figure 4, reveals that the force–displacement curves remain essentially consistent for mesh sizes of 0.20 mm, 0.16 mm, and 0.13 mm (Figure 4a). Furthermore, Figure 4b demonstrates that the force variation trend stabilizes once the mesh size is refined below 0.20 mm. Therefore, to adequately capture the detailed evolution of particles during compression while balancing computational accuracy and resource efficiency, an element size of 0.20 mm was selected for discretizing the solid elements. The solid domain was meshed exclusively with 8-node hexahedron elements (C3D8R). This element type offers high accuracy, computational efficiency in large-scale contact simulations, and effectively reduces shear locking in bending dominated scenarios [50]. Ultimately, the developed finite element model for a single rice grain consisted of 37,320 elements and 76,416 nodes.

2.4. Model Construction

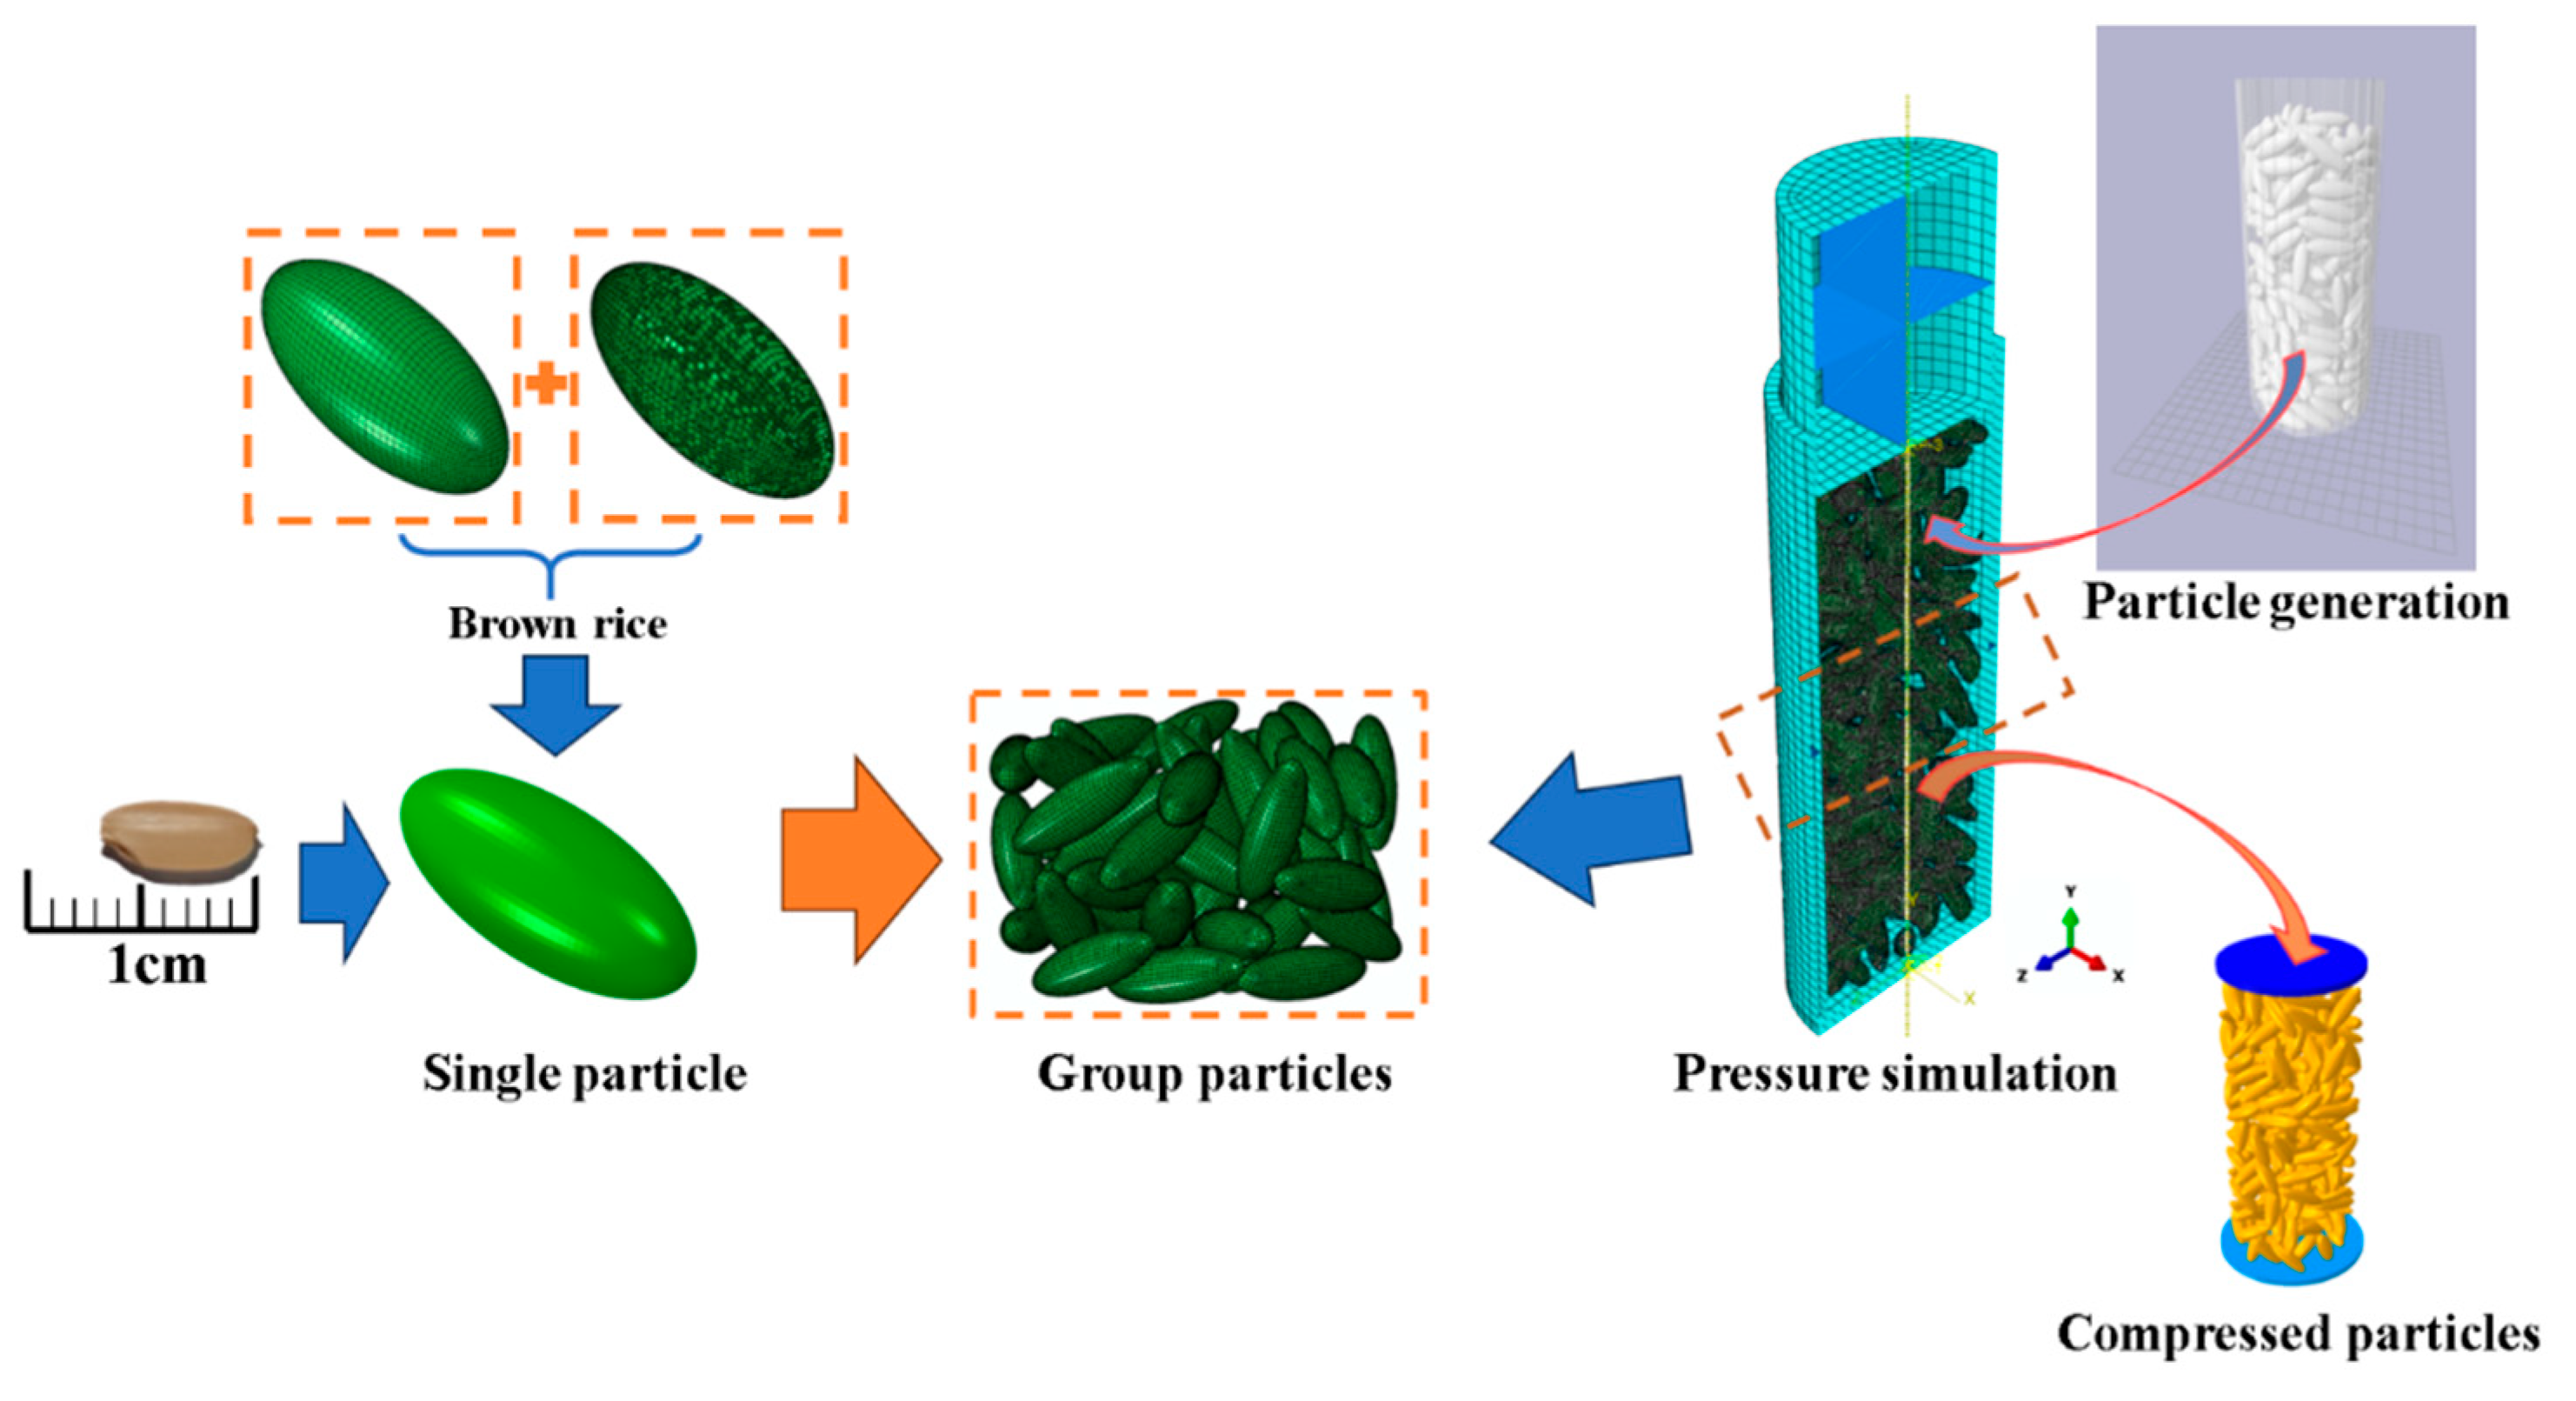
In the construction of the simulation model, the FEM was employed to construct a confined particle bed model and simulate its compression process. Firstly, cohesive elements are incorporated into the modelling of rice grains to construct the model, with the specific procedure illustrated in Figure 2a. Given that the thickness of cohesive elements influences both the mechanical behaviour of the interfacial damage and computational convergence [51], zero-thickness cohesive elements were adopted in this study. Thus, the rice model consists of solid elements and embedded cohesive elements, as shown in Figure 5. To achieve the random arrangement of particle groups observed in experiments, a random distribution method was employed to generate individual particles during the construction of the rice grain model. Specifically, this random generation method utilised a script developed on the PyCharm (3.12) platform. Within this script, a gravitational field was applied to generate particles. Once the particles within the bed had stabilised, corresponding positional data was generated. Subsequently, this data is utilised to reconstruct the geometric model within Abaqus, thereby replicating the experimental randomness of the packing in the numerical simulation. The results are presented in Figure 5.
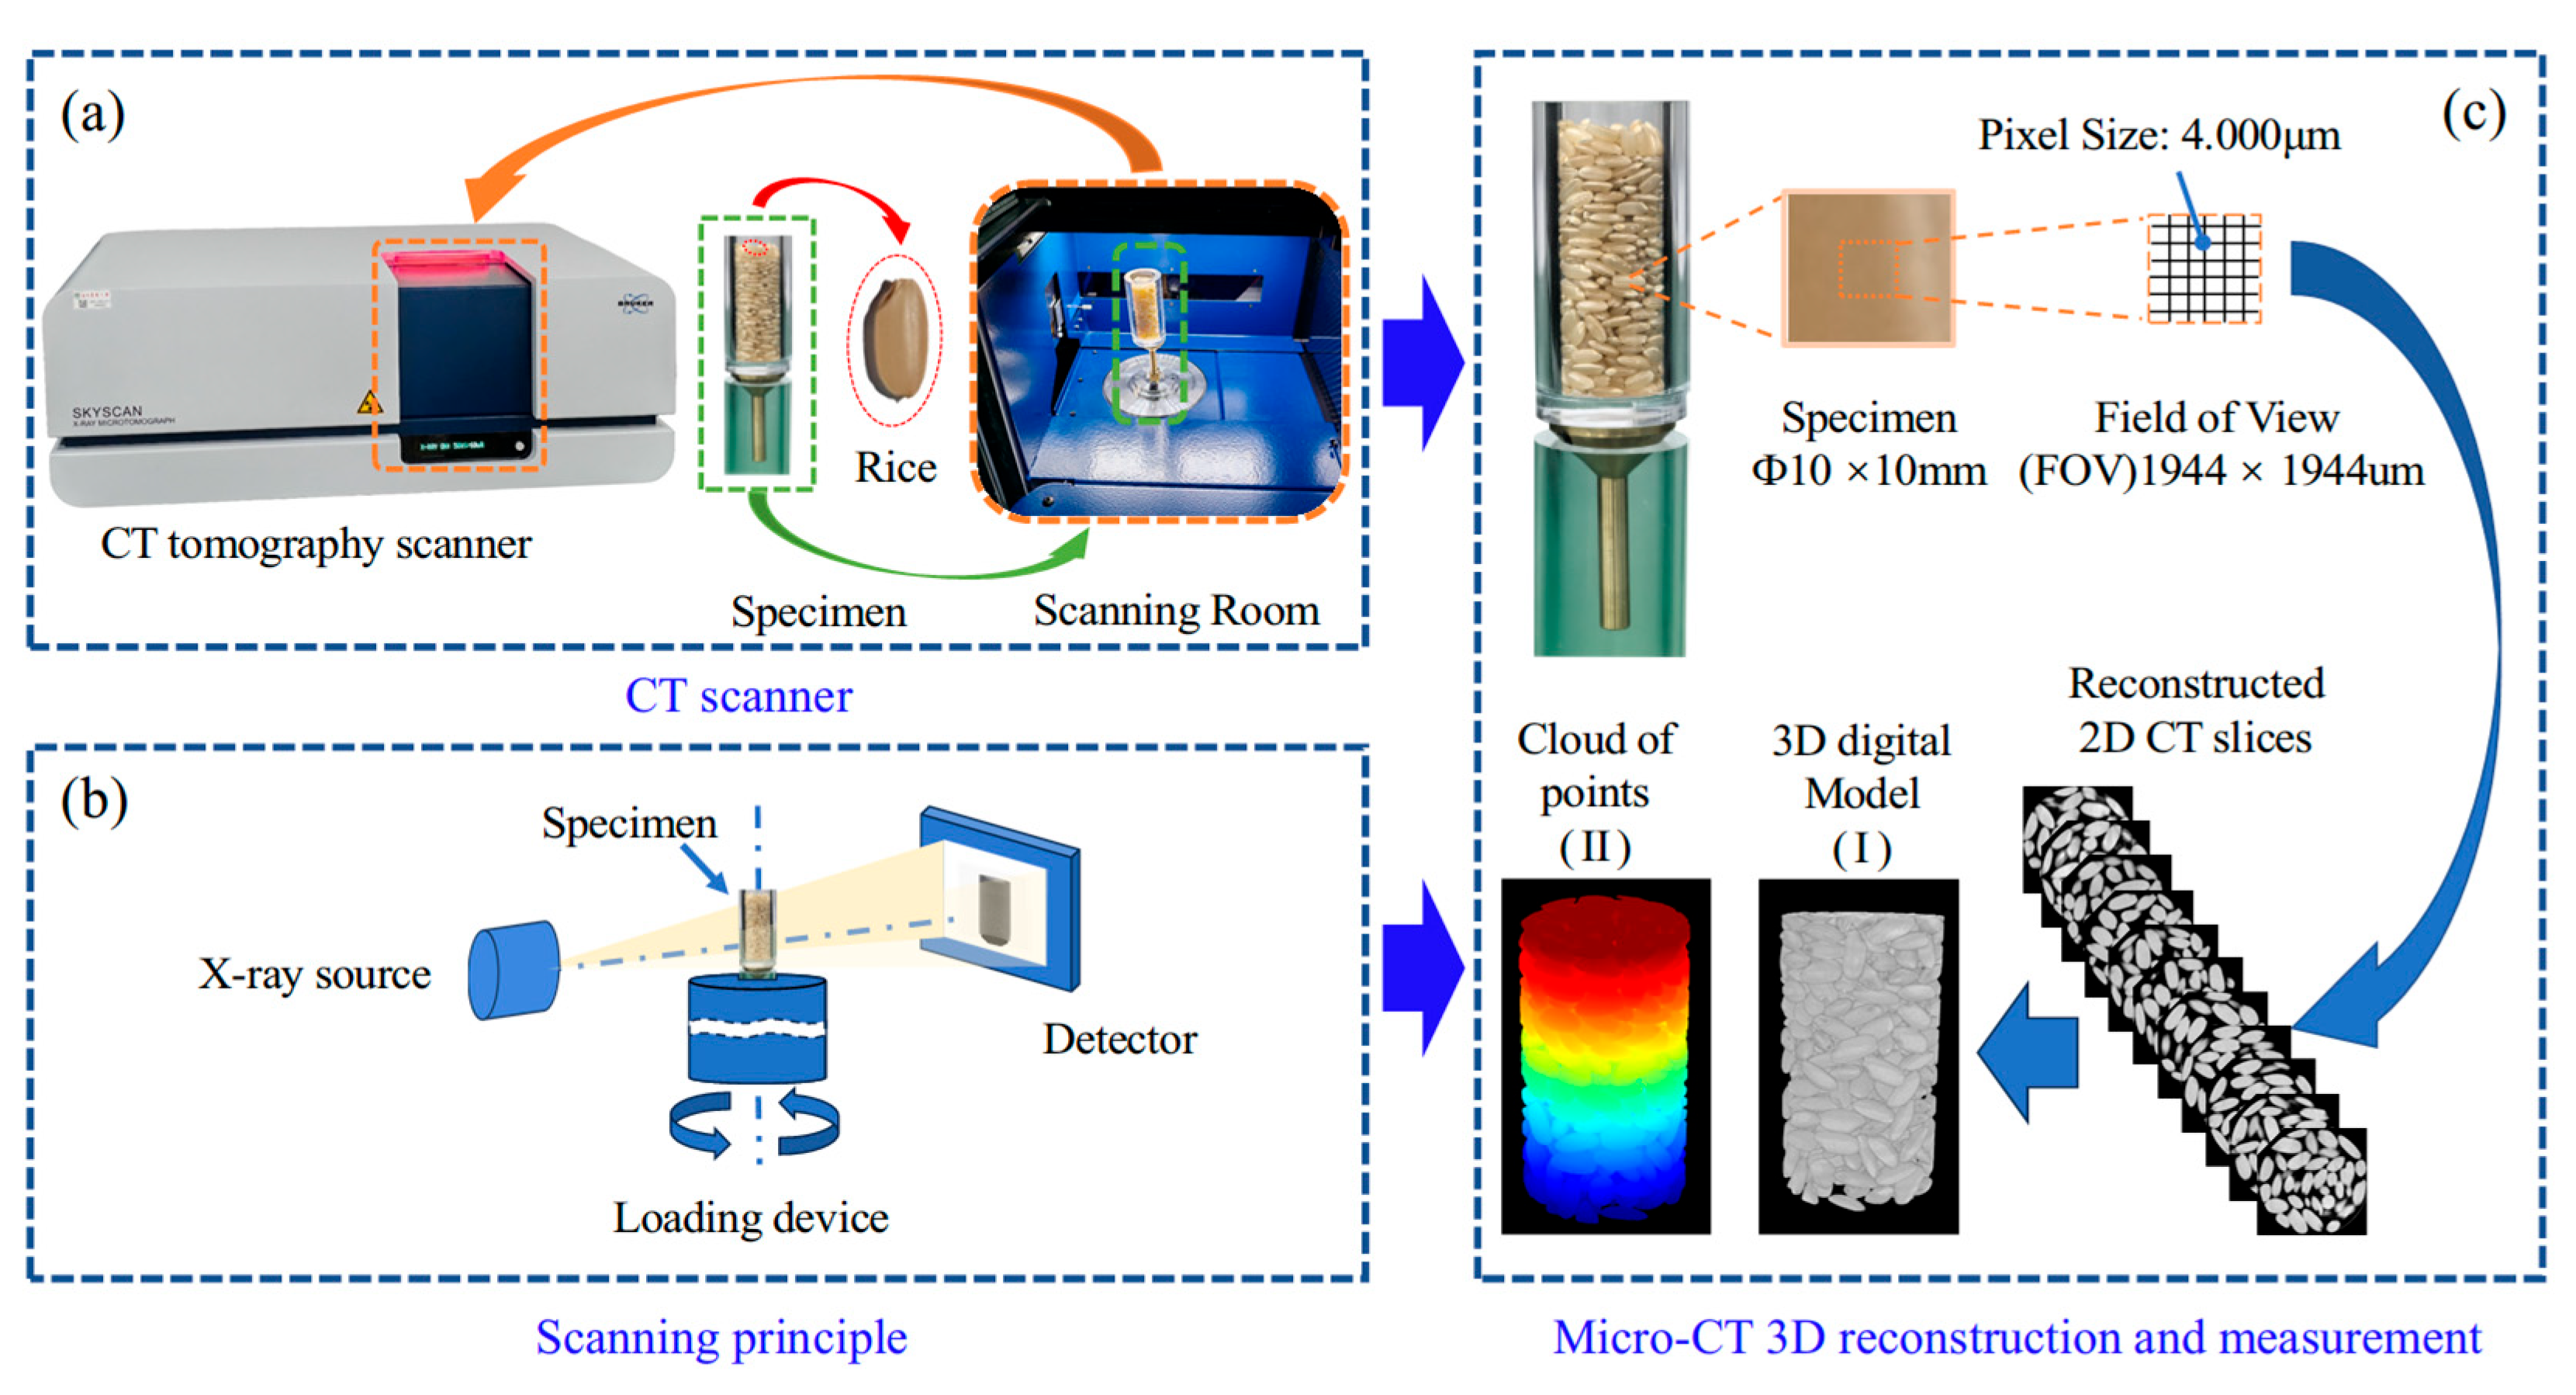
X-ray computed tomography (CT) scanning has been successfully employed to obtain structural information and mechanical characteristics at the microscopic scale for granular materials [52,53,54,55,56,57,58,59]. To validate the effectiveness of the model construction, CT scans were performed on experimental samples. Figure 6 illustrates the process of obtaining positional data from the scanned particle bed. Prior to scanning, rice was filled into the experimental vessel, which was then placed within the scanning chamber (Figure 6a). To capture the arrangement profile of the rice grains within the cylinder and minimise artefacts (ghosting) in the two-dimensional slices during post-processing, the scanned region of the particle group was confined to a cylindrical area close to the sample axis, as shown in Figure 6b. Subsequently, the reconstructed two-dimensional slices obtained from the CT scan underwent threshold-based segmentation processing to construct a three-dimensional model capable of distinguishing between particles and voids, as depicted in Figure 6c. Finally, precise spatial positioning information of the grains was obtained through three-dimensional contour reconstruction of the model file. Comprehensive comparison of the numerical simulation results with the CT-reconstructed actual structure and lateral confinement compression experimental data fully validated the effectiveness and reliability of the modelling approach.
In numerical simulations, the loading rate of the indenter matches that of the experiment. When simulating the confined compression of granular materials, accurately defining contact characteristics is paramount. This study employs the generalised contact algorithm within Abaqus/Explicit [43] to realise contact interactions between rice grains and between rice grains and the container walls. Normal interactions are implemented via rigid contact, whilst tangential interactions are handled using a penalty friction formulation. For brevity, detailed theoretical aspects of the contact formulation are referred to in the Abaqus User’s Guide [43].

3. Results and Discussion

3.1. Compression Tests and Particle Breakage Morphology

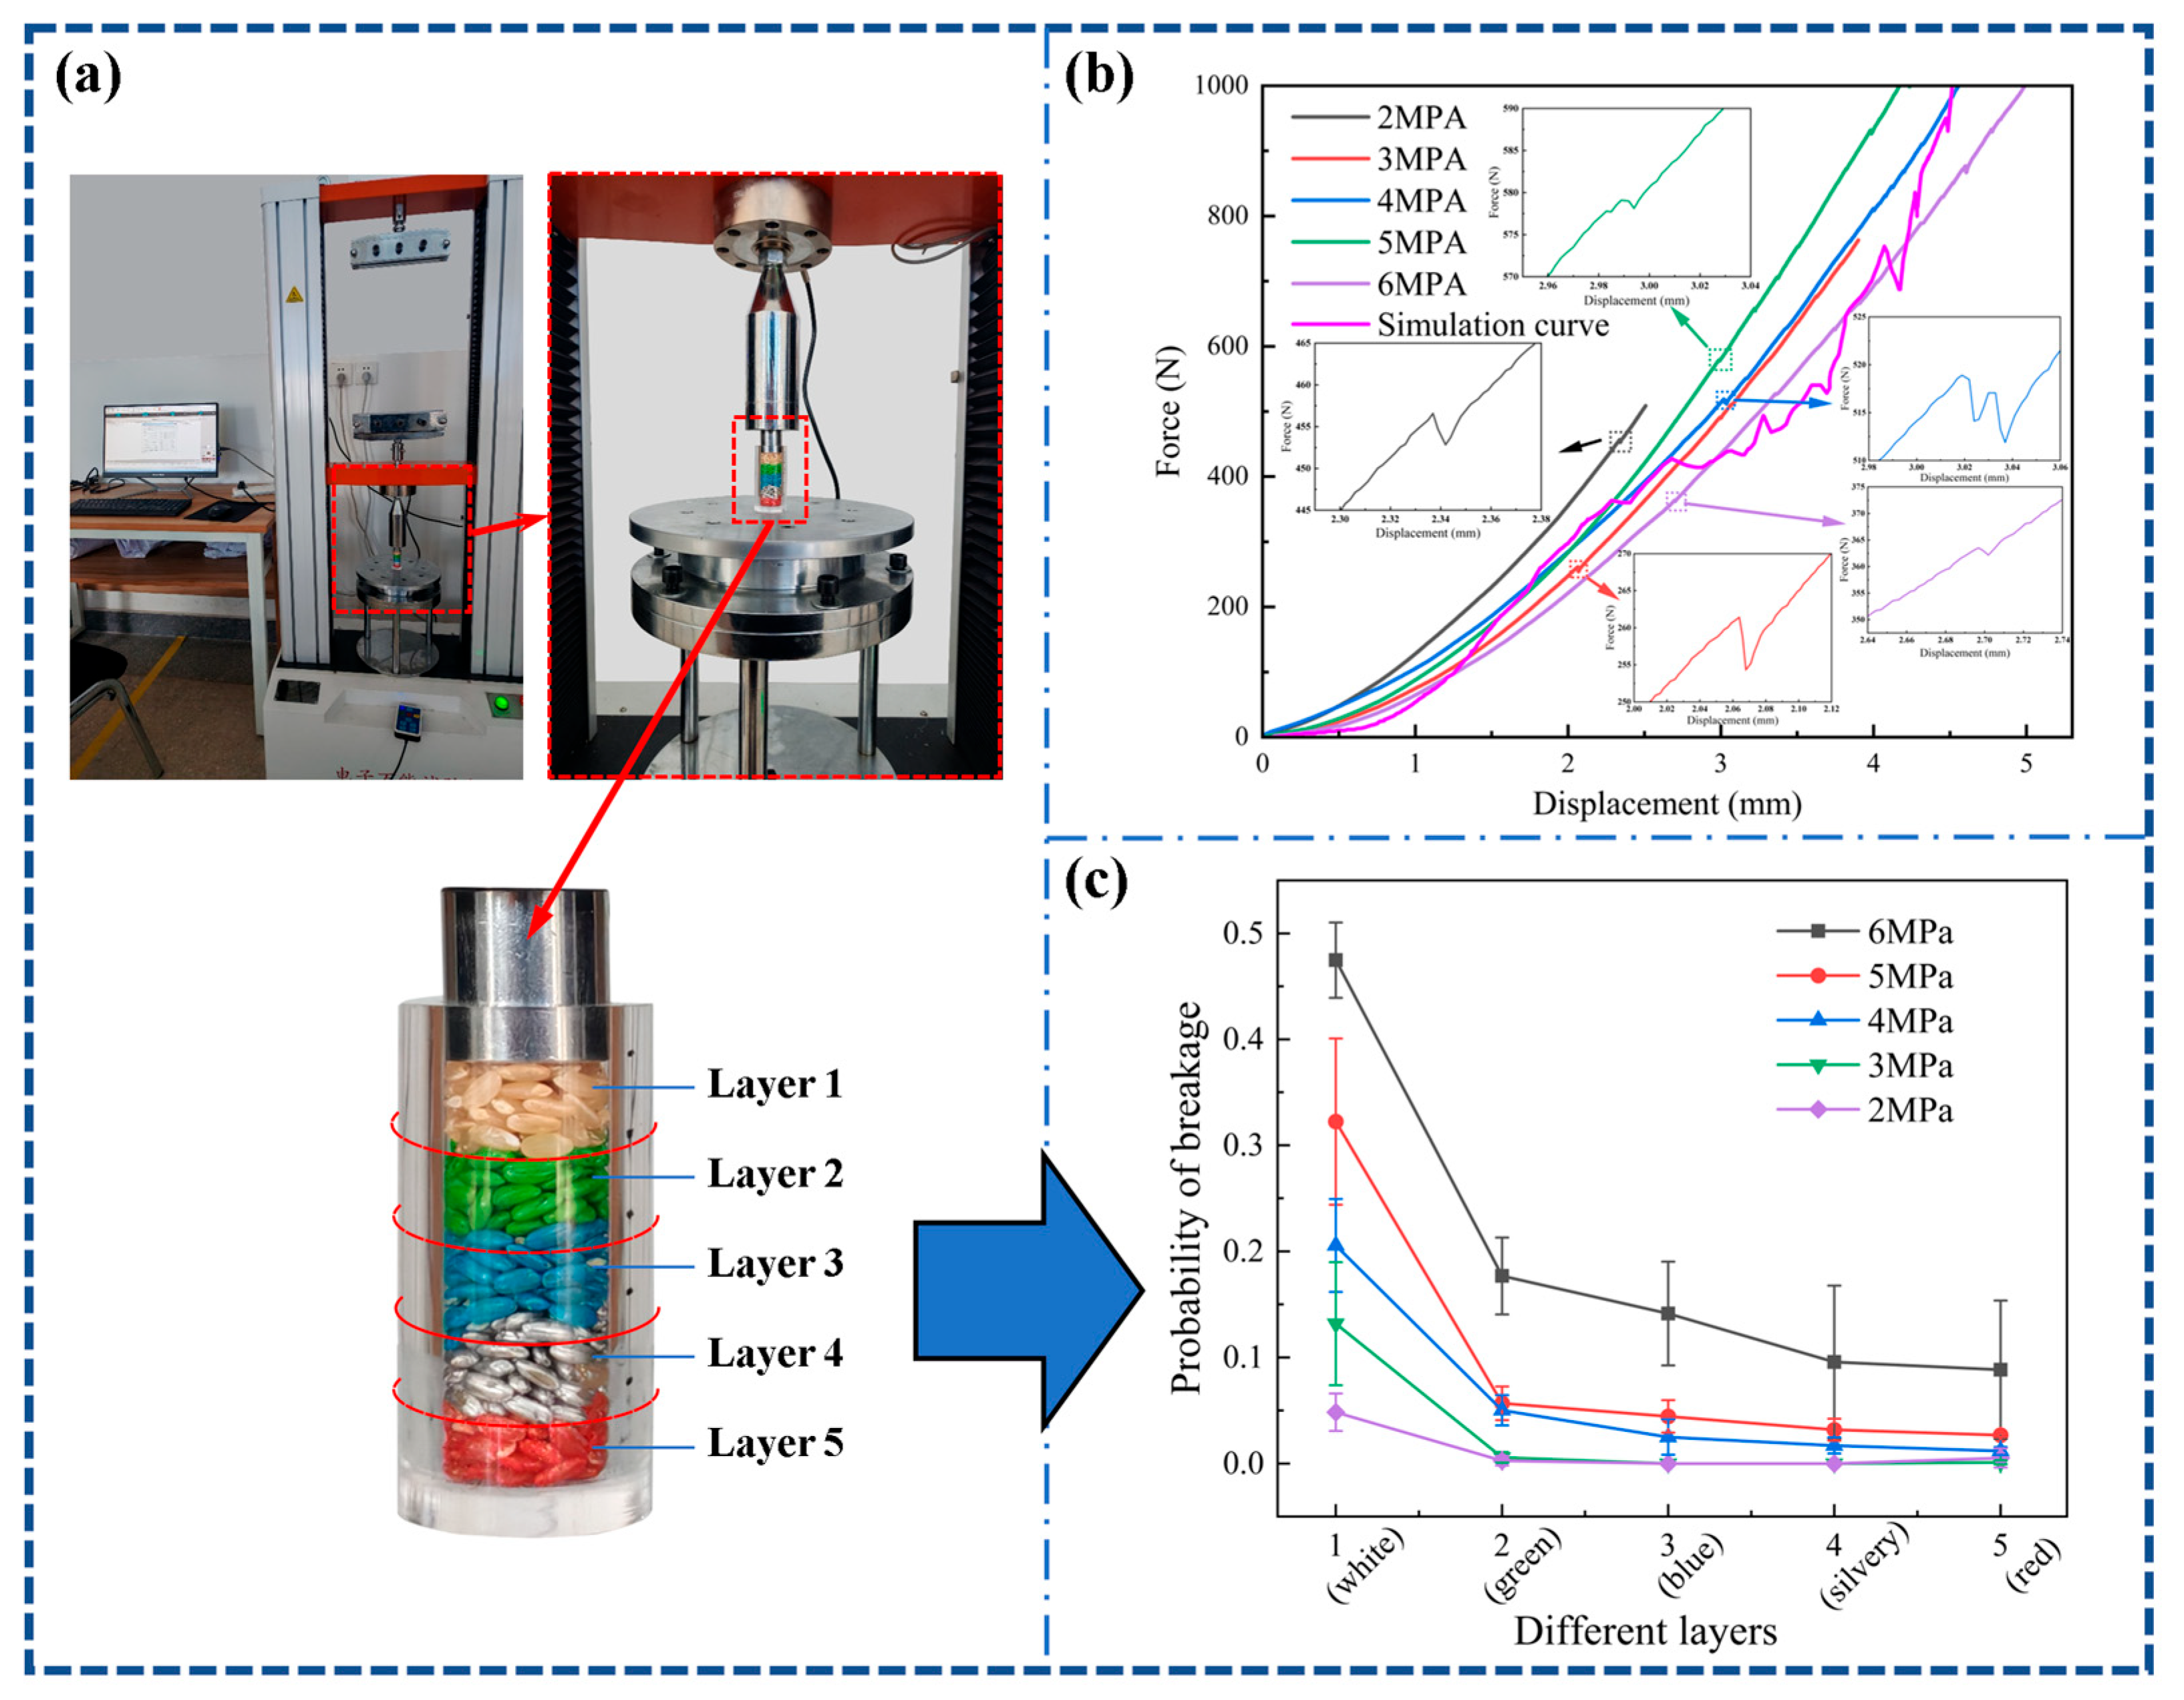
To investigate the compression characteristics of the particle bed, compression tests were conducted on specimens at pressures of 2 MPa, 3 MPa, 4 MPa, 5 MPa, and 6 MPa, with each test repeated three times. The experimental results are shown in Figure 7b, revealing that the generally consistent trends on the force–displacement curves remained largely consistent throughout the compression process. Notably, all compression curves exhibit pronounced fluctuations or bouncing phenomena (see inset in Figure 7b). This phenomenon can be attributed to particle breakage within the bed. During compression, force chains form within the bed, transmitting downward pressure from the top loading head. When particles undergo breakage, the original force chains undergo changes (breakage or evolution), causing an instantaneous drop in load-bearing capacity (curve dip). Subsequently, the breakage sub-particles rapidly fill the surrounding voids and form new force chains with other particles, thereby restoring and continuing load transmission (curve rebound). This ‘breakage–reorganisation–reloading’ process manifests macroscopically as repeated fluctuations in the curve, while simultaneously altering the pore structure and force transmission pathways within particle bed. This observation is consistent with the simulation study by Kang et al. [60].
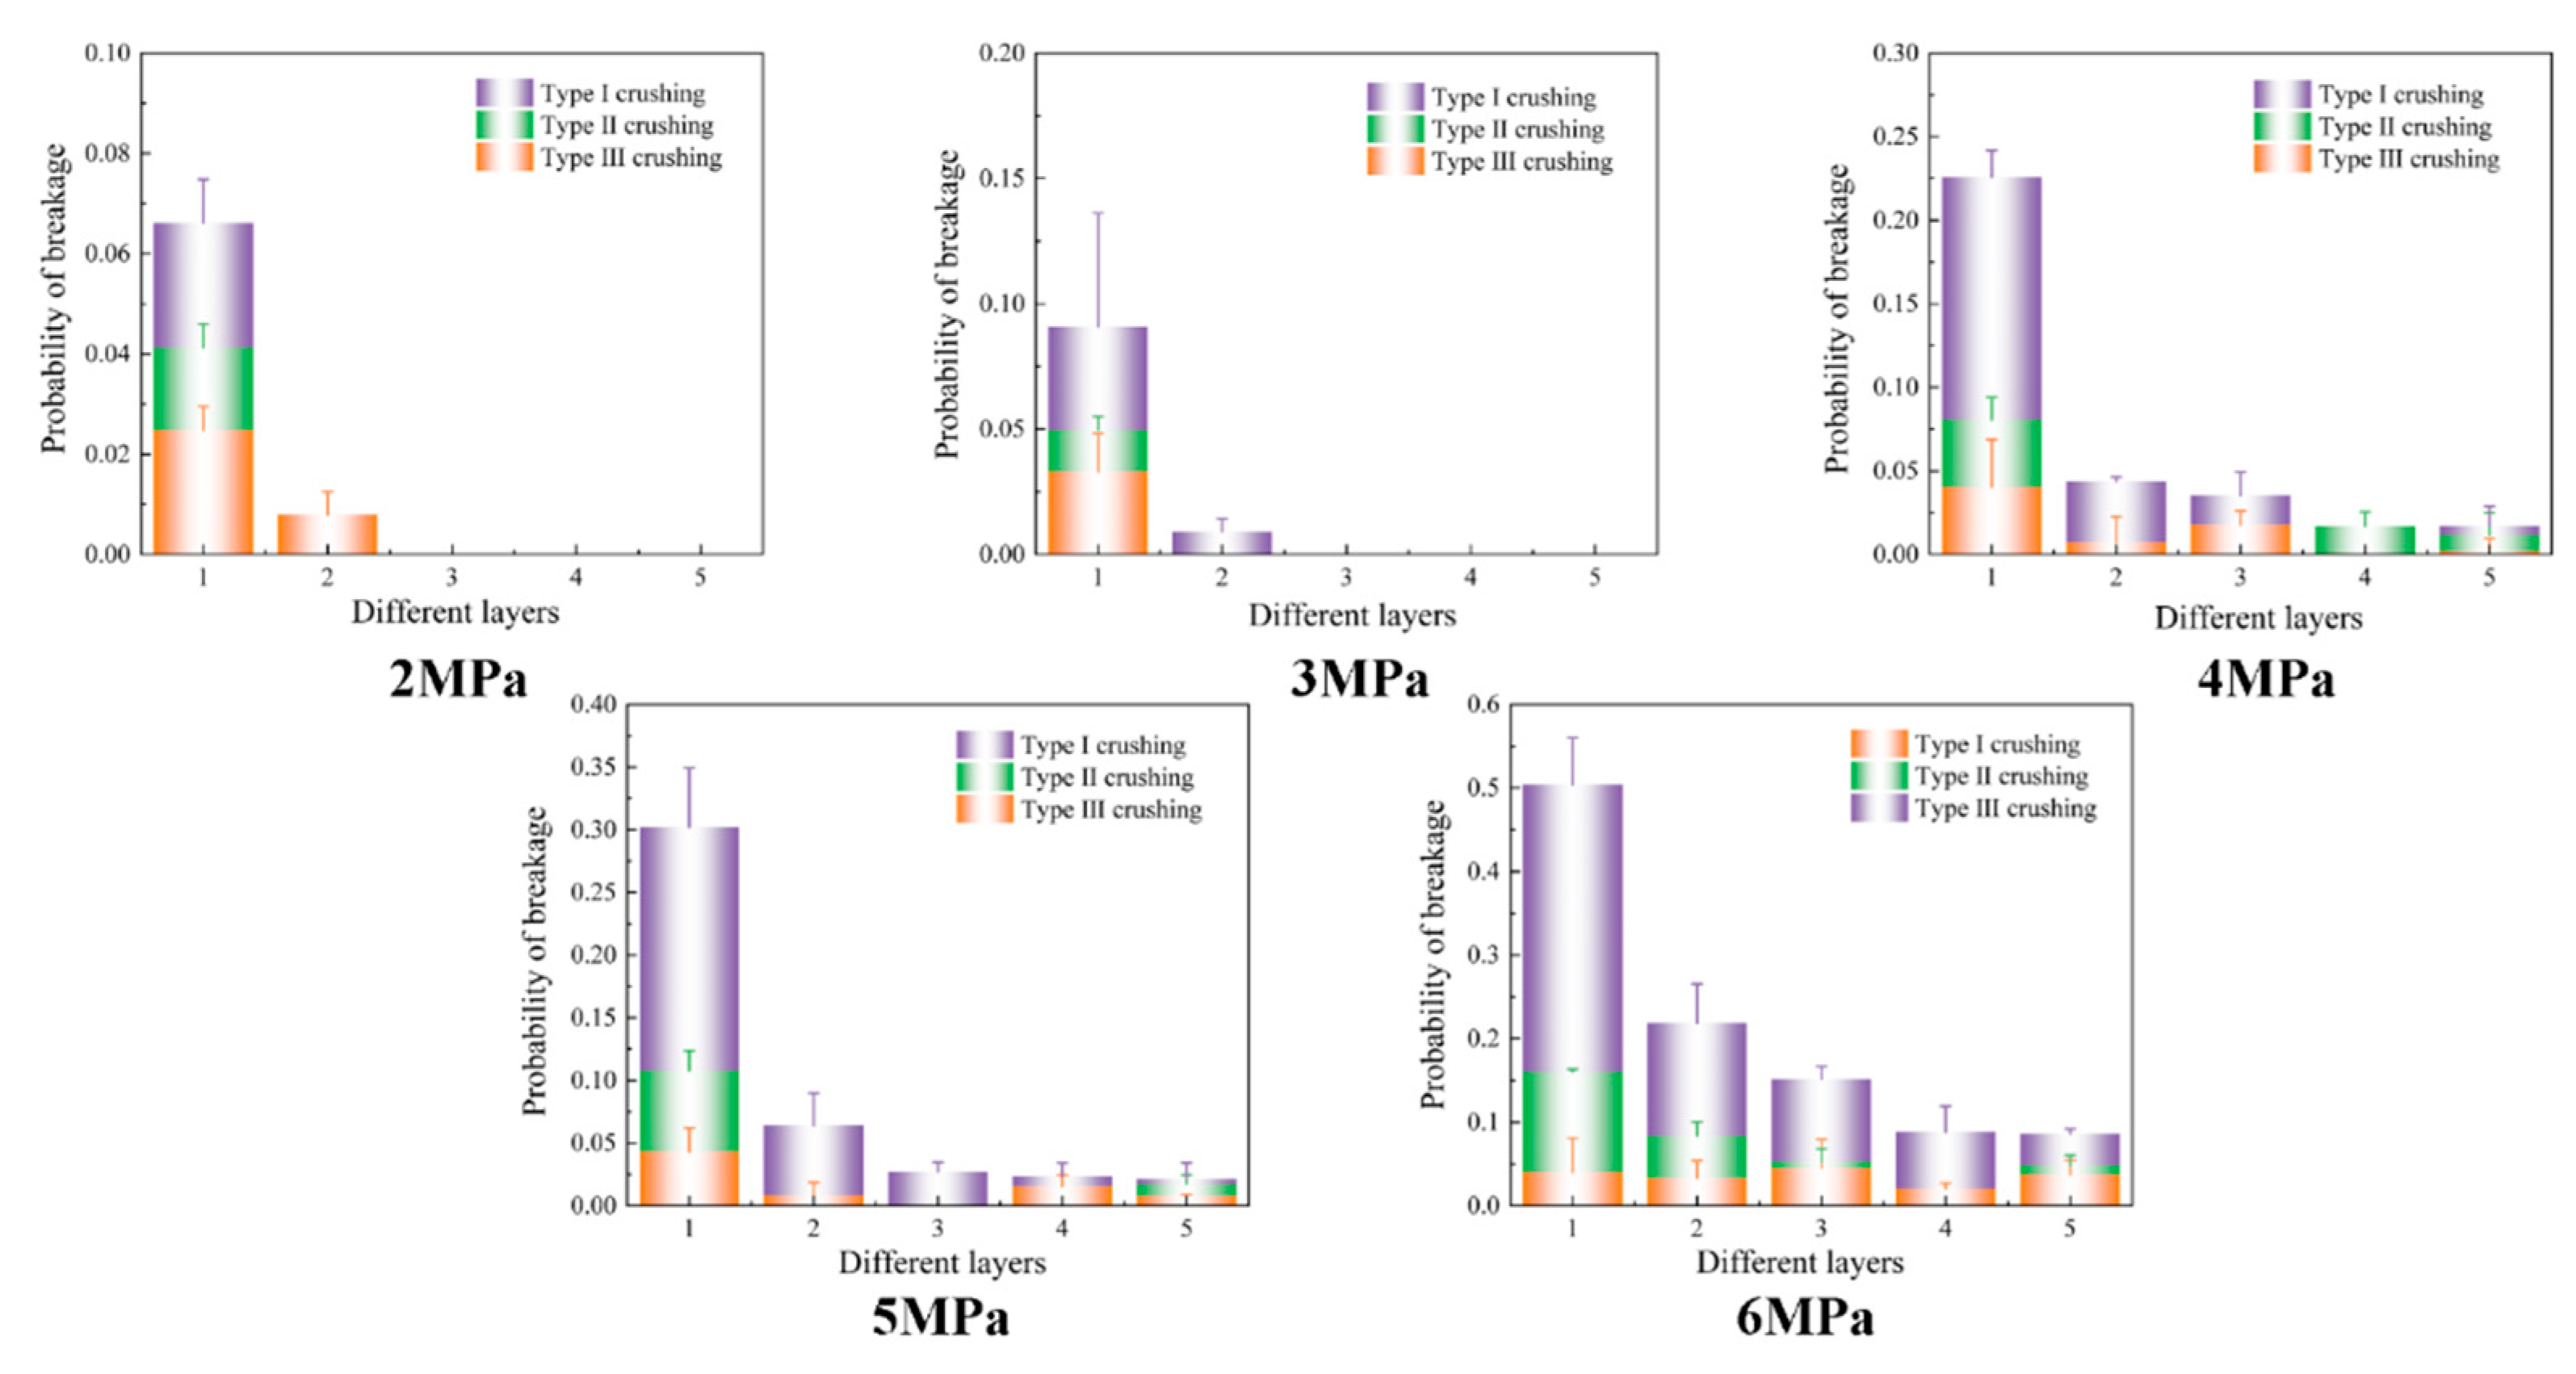
Breakage probability serves as a critical indicator in compression experiments. Particle breakage is generally governed by both intrinsic factors and external loading conditions. Given that our team’s prior research [7] has systematically examined intrinsic factors (such as particle size and moisture content), this study focuses specifically on the impact of varying axial stresses on the breakage behaviour within particle bed. Figure 7a illustrates the corresponding compression testing process. Figure 7c presents the quantified breakage probabilities across different layers within the granular bed under applied stresses of 2, 3, 4, 5, and 6 MPa. This study defines breakage probability as the ratio of the number of broken particles to the total number of particles within that layer. The results show a clear decreasing trend in breakage probability from Layer 1 (top) to Layer 5 (bottom). For a given layer, the breakage probability increases with increasing axial stress. Under relatively low stresses (2–3 MPa), significant breakage is primarily confined to the top layer. However, when the applied stress exceeds 4 MPa, particle breakage becomes prevalent throughout all layers. This behaviour is fundamentally governed by the downward transmission and dissipation of load: particles in the upper layers bear higher stresses along the transmission path and therefore break earlier. The layer-wise breakage distribution observed in this study is consistent with the findings reported by Li et al. [14].
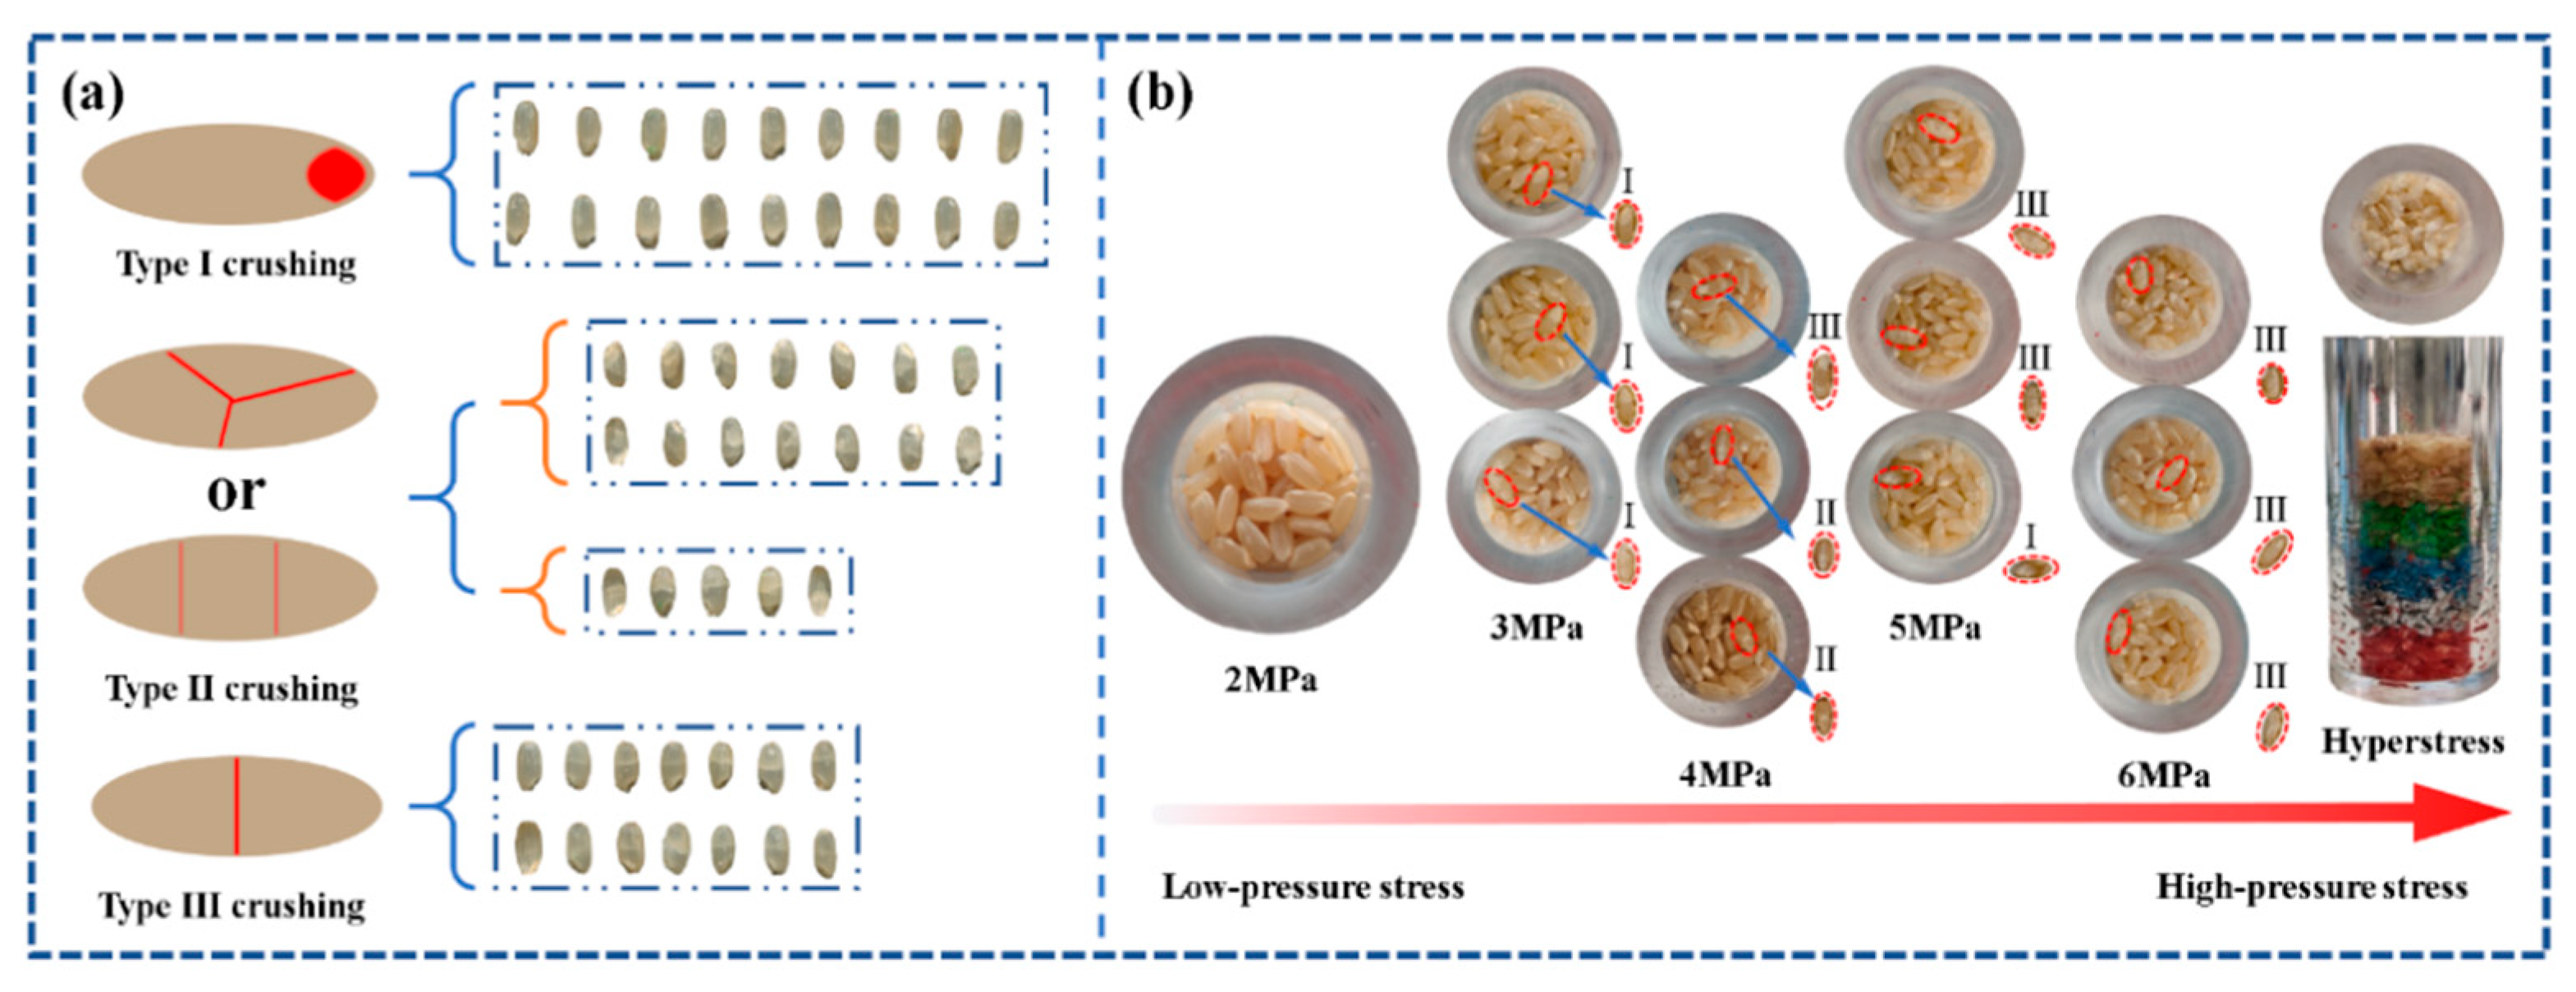
To gain deeper insight into the particle breakage mechanisms, a systematic statistical analysis of the breakage morphologies was performed, as shown in Figure 8a. Owing to the relatively high breakage probability of the first layer (white layer) and the presence of breakage phenomena within all layers, a statistical classification of the breakage morphology of rice grains subjected to direct compression by the compression head in the first layer is undertaken here. This breakage morphology exhibits similarities to that of particle breakage in geotechnical mechanics. Therefore, drawing upon the classification methods for particle breakage in geotechnical mechanics, the modes are categorised as exfoliation (detachment of surface fragments), fragmentation (dispersal into multiple fragments), and cleavage (fracturing along axial planes). Under sustained pressure, these breakage modes demonstrate a dynamic evolutionary trend: both exfoliation and cleavage tend to progress towards more complete fragmentation. Furthermore, based on crack distribution characteristics, crushing morphologies can be categorised into three types: Type I crushing, where breakage is predominantly concentrated in the two end sections (apexes). Type II crushing, where cracks primarily cluster near the centre. Type III crushing, characterised by a single crack concentrated near the centre, bisecting the particle. It should be emphasised that the breakage behaviour under collective compression of a granular assembly differs markedly from that observed in single particle under compression. The former, due to the greater number and complex spatial distribution of interparticle contacts, produces crack patterns more closely resembling failure modes observed in shear or three-point bending tests. This contrasts distinctly with the breakage mechanisms of single particles under idealized loading conditions.
Simultaneously, the compressed top-layer contact surfaces were examined. As illustrated in Figure 8b, images of the top surface adjacent to the platen are presented for granular beds subjected to compression at 2, 3, 4, 5, and 6 MPa. It can be observed that under relatively low compressive stresses, the top-layer particles, which serve as the starting point of force transmission, do not exhibit significant breakage. As compression intensity increases progressively, the frequency of breakage rises concomitantly, accompanied by a deepening degree of fragmentation. Initial breakage predominantly occurs as damage at the two ends of the particles, corresponding to Type I crushing. This stems primarily from stress concentration at the grain ends, coupled with the relative fragility of the rice germ region, rendering these areas more susceptible to breakage. Furthermore, the random packing of grains introduces positional randomness, increasing void presence. Consequently, some grains were positioned in a three-point bending configuration, becoming locally constrained and leading to the emergence of Type III crushing. As compression continues, the deformation of the particle groups within the cavity increases. The initial particle rearrangement effect weakens further, allowing broken particles to continuously fill the voids. This leads to a point where, once the porosity decreases to a certain level, changes in particle spatial positions tend to stagnate. At this stage, breakage becomes the primary energy dissipation pathway. Consequently, the further breakage of existing Type I and Type III crushings, driving their evolution toward Type II crushing. Notably, even under extremely high compressive stress, the rice grains did not pulverise as typical brittle materials would, instead exhibiting an agglomerated state characterised by ‘breakage without dispersion’. Another intriguing phenomenon is that breakage predominantly occurs within the cylindrical region centred on the indenter axis. This observation aligns with the findings of Jiang et al. [18] and is more clearly reproduced in subsequent numerical simulations.
To investigate the distribution of breakage patterns under different stress levels, a statistical analysis was conducted on the probability of different breakage morphologies across layers under distinct stresses, with results presented in Figure 9. The statistical results indicate that particle breakage is dominated by Type I, followed by Type III, with Type II being the least frequent. Concurrently, with increasing axial stress, a tendency for both Type I and Type III crushing to evolve towards Type II crushing can be observed. Analysis shows that the top layer particles, which bear the load directly, exhibit all three crushing types. This indicates that the top layer undergoes particle rearrangement and compaction first. As the load transfers downward and gradually attenuates, the stress on the lower layers decreases, and their breakage modes correspondingly become dominated by Type I and Type III, with a lower proportion of Type II. This interlayer distribution discrepancy spatially corroborates the aforementioned overall statistical pattern: namely, that particle fracturing is generally dominated by Types I and III, with a tendency towards more complete Type II crushing.

3.2. Evolution and Damage Modes in Confined Compression

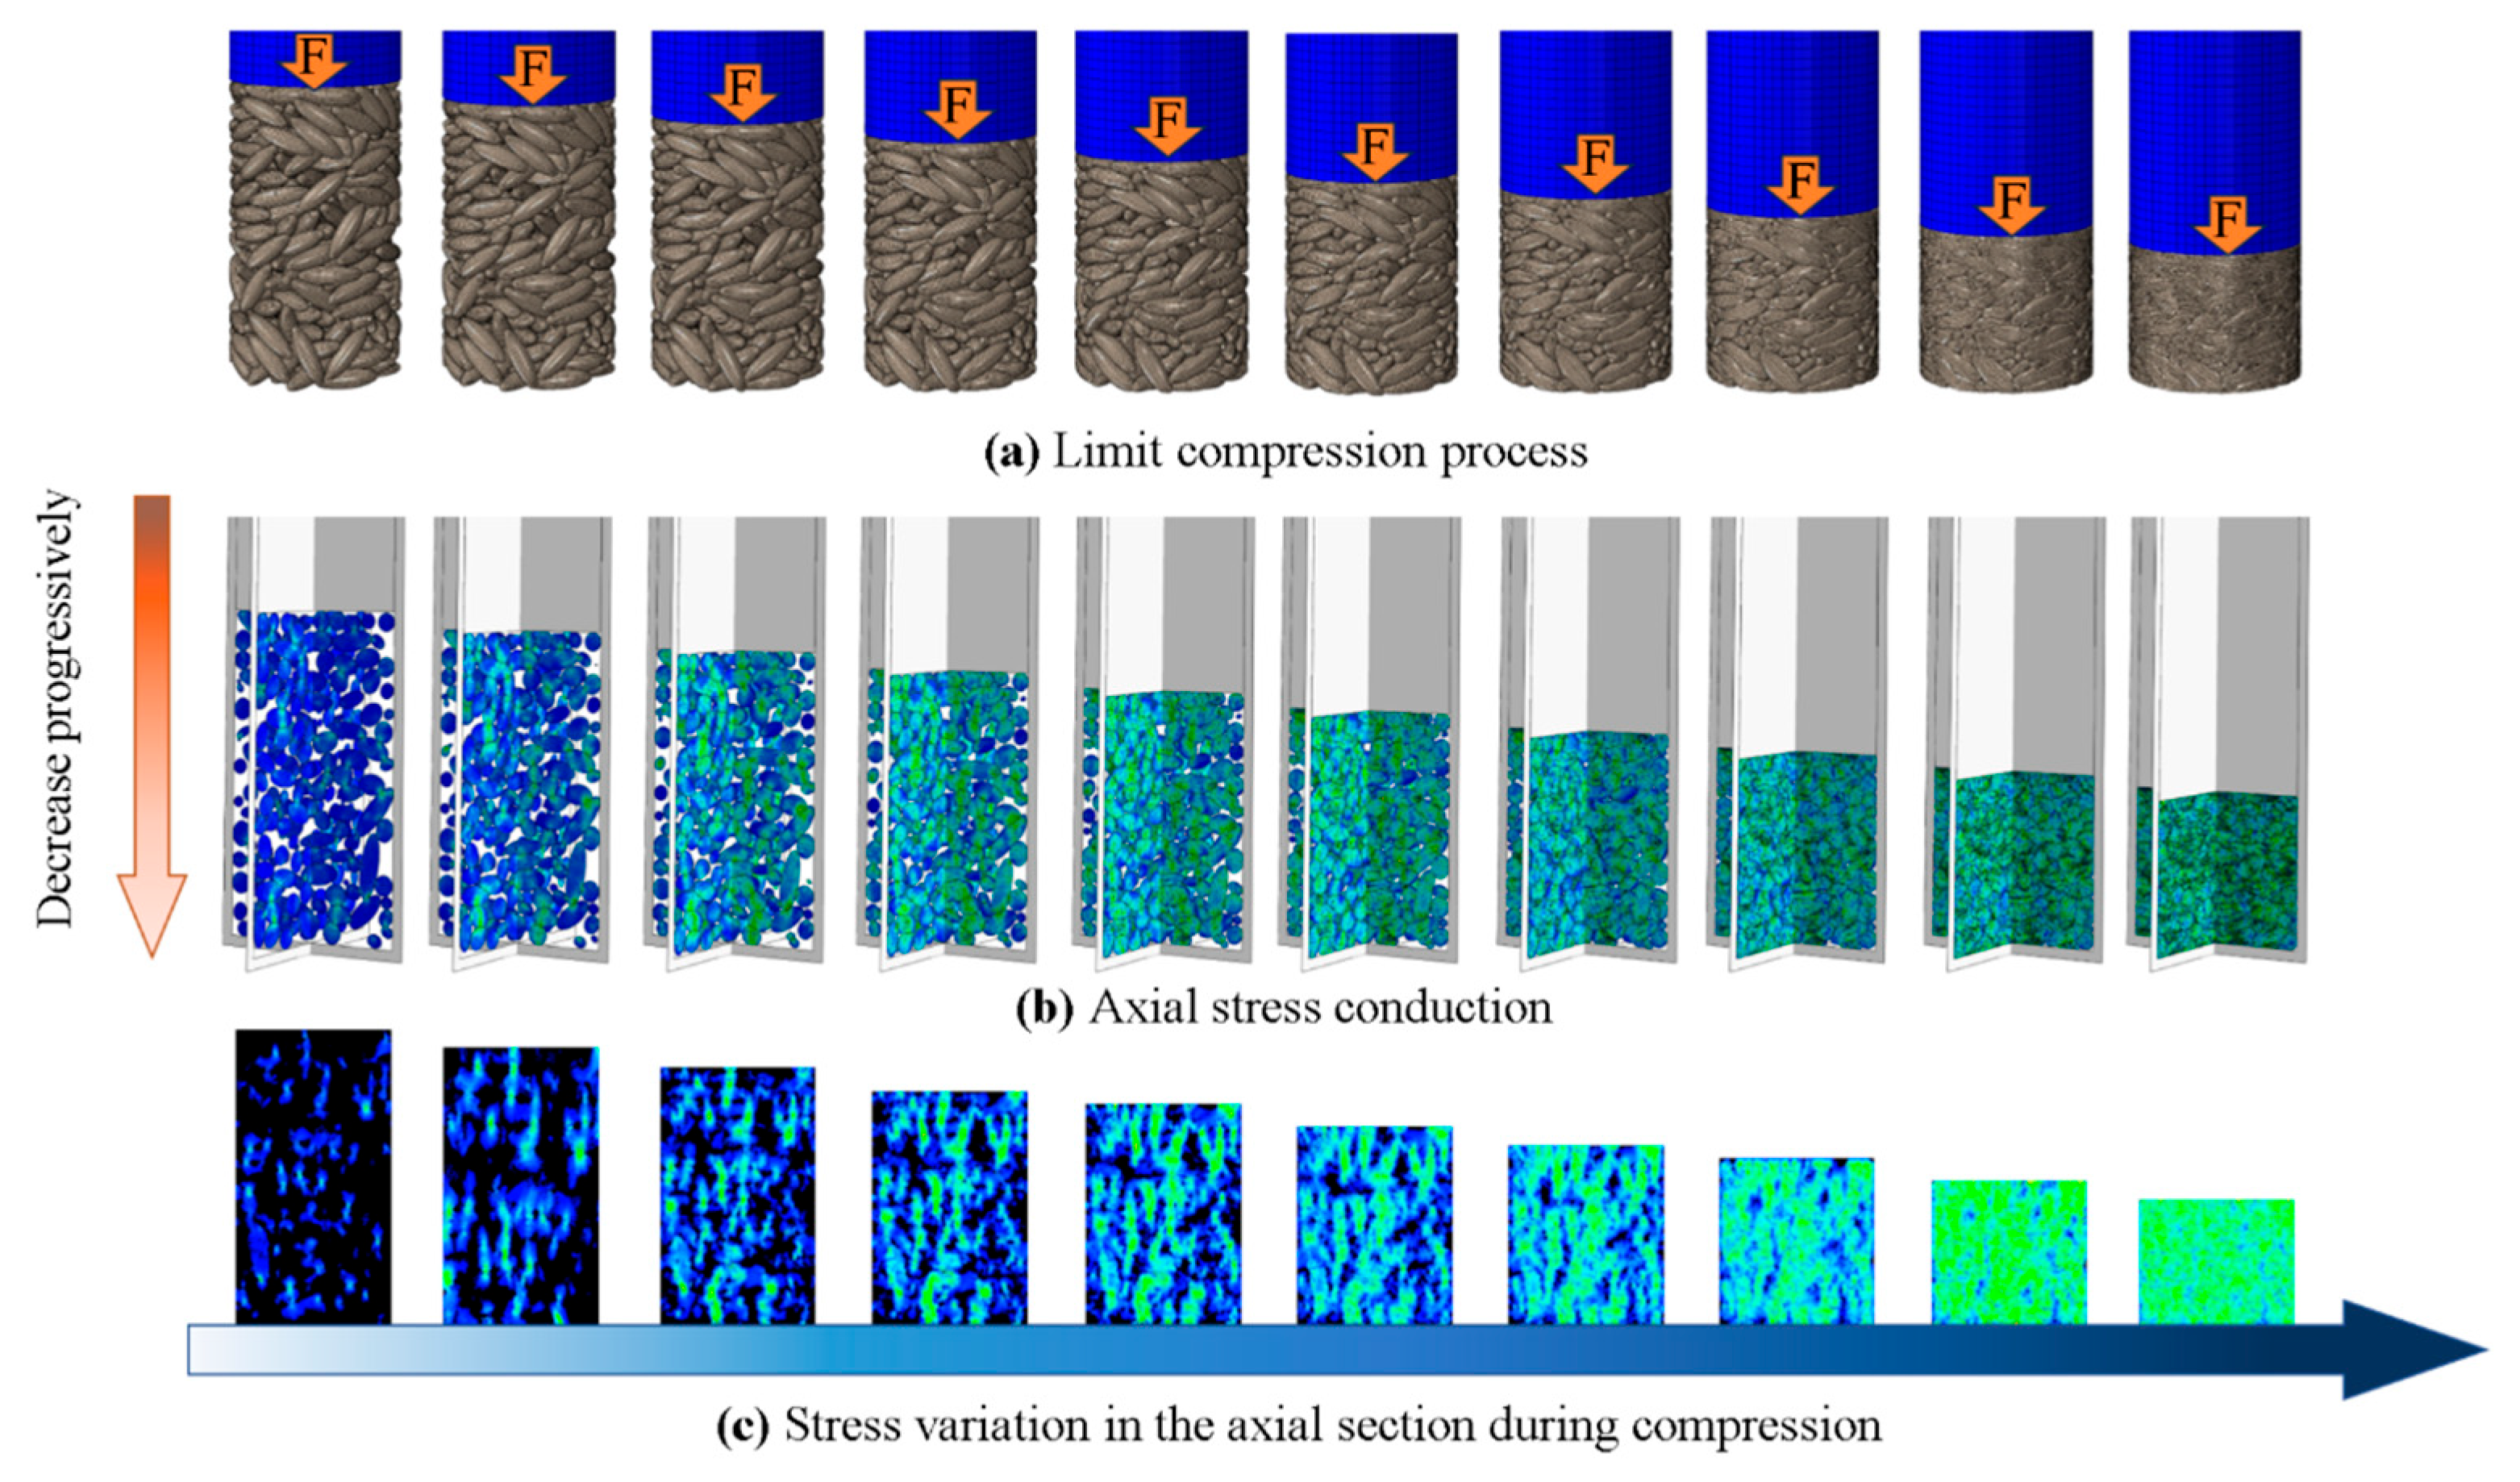
To gain deeper insight into the causes of breakage during the confined compression process, a corresponding numerical simulation of the experiment was conducted. The results are presented in Figure 10, which illustrates the compression process from 0 to 8.44 mm. Specifically, Figure 10a shows the confined compression simulation process, where the numerical simulation results exhibit good agreement with experimental observations from a macroscopic perspective. As the compression displacement progressively increases, the volume of the compression chamber diminishes continuously. This leads to enhanced interparticle contact, with particles further transmitting loads under the influence of force chains, resulting in sustained deformation of the granular mass. Within the finite element framework, the discrete particle model struggles to directly extract classical force chain structures. Consequently, stress distribution serves as an effective alternative indicator for characterising contact evolution and load transfer. Therefore, stress is employed here to observe contact changes and force propagation. As illustrated in Figure 10b, force chain propagation within the particle bed manifests as strips or bands, gradually forming a top-to-bottom continuous stress chain during compression. These stress chains continuously intensify and diffuse into surrounding granular regions. Particle breakage and reduced porosity further accelerate propagation, ultimately forming a cohesive, ‘coalescence’ interconnected zone. The compression simulation results exhibit remarkable consistency with experimental phenomena observed under high-stress compression. Particle breakage under high compressive stress is characterized by fragment filling and adhesion, as depicted by the ‘coalesced bonding’ phenomenon in the stress contour plots. Simultaneously, the onset of damage causes resulting small fragments to continuously fill voids, exacerbating this ‘coalesced bonding’. Unbroken larger particles become enveloped by broken smaller ones, ultimately leading to significant plastic distortion of the rice grains. The breakage morphology of grains does not remain as initially observed (where breakage features are relatively well-preserved), but undergoes continuous deformation and mixing with other grains. This phenomenon also aligns with the mechanical response observed in experiments. During the tests, new coalescence chunk gradually transitioned from a stage dominated by plastic deformation to one governed primarily by elastic deformation. This transition further promotes the evolution of Type I and Type III crushing towards Type II crushing.
Based on the aforementioned stress evolution process, it can be inferred that during compression, the formation of stress chains is instantaneous and propagates axially from top to bottom, driving the particle system from a rearrangement phase to a densification phase. Stress distributions across layers reveal significantly higher stresses in the top layer compared to the bottom layer, indicating a top-down load transfer direction with progressive attenuation. Notably, force transmission in confined compression propagates in the form of connected chains, rather than as waves propagation. Interparticle contacts provide the physical foundation for the formation and transmission of these force chains. To quantitatively characterize this process, axial stress nephograms at key compression stages were extracted (Figure 10c), exhibiting stress distribution patterns consistent with findings from Yu et al.’s study [15].
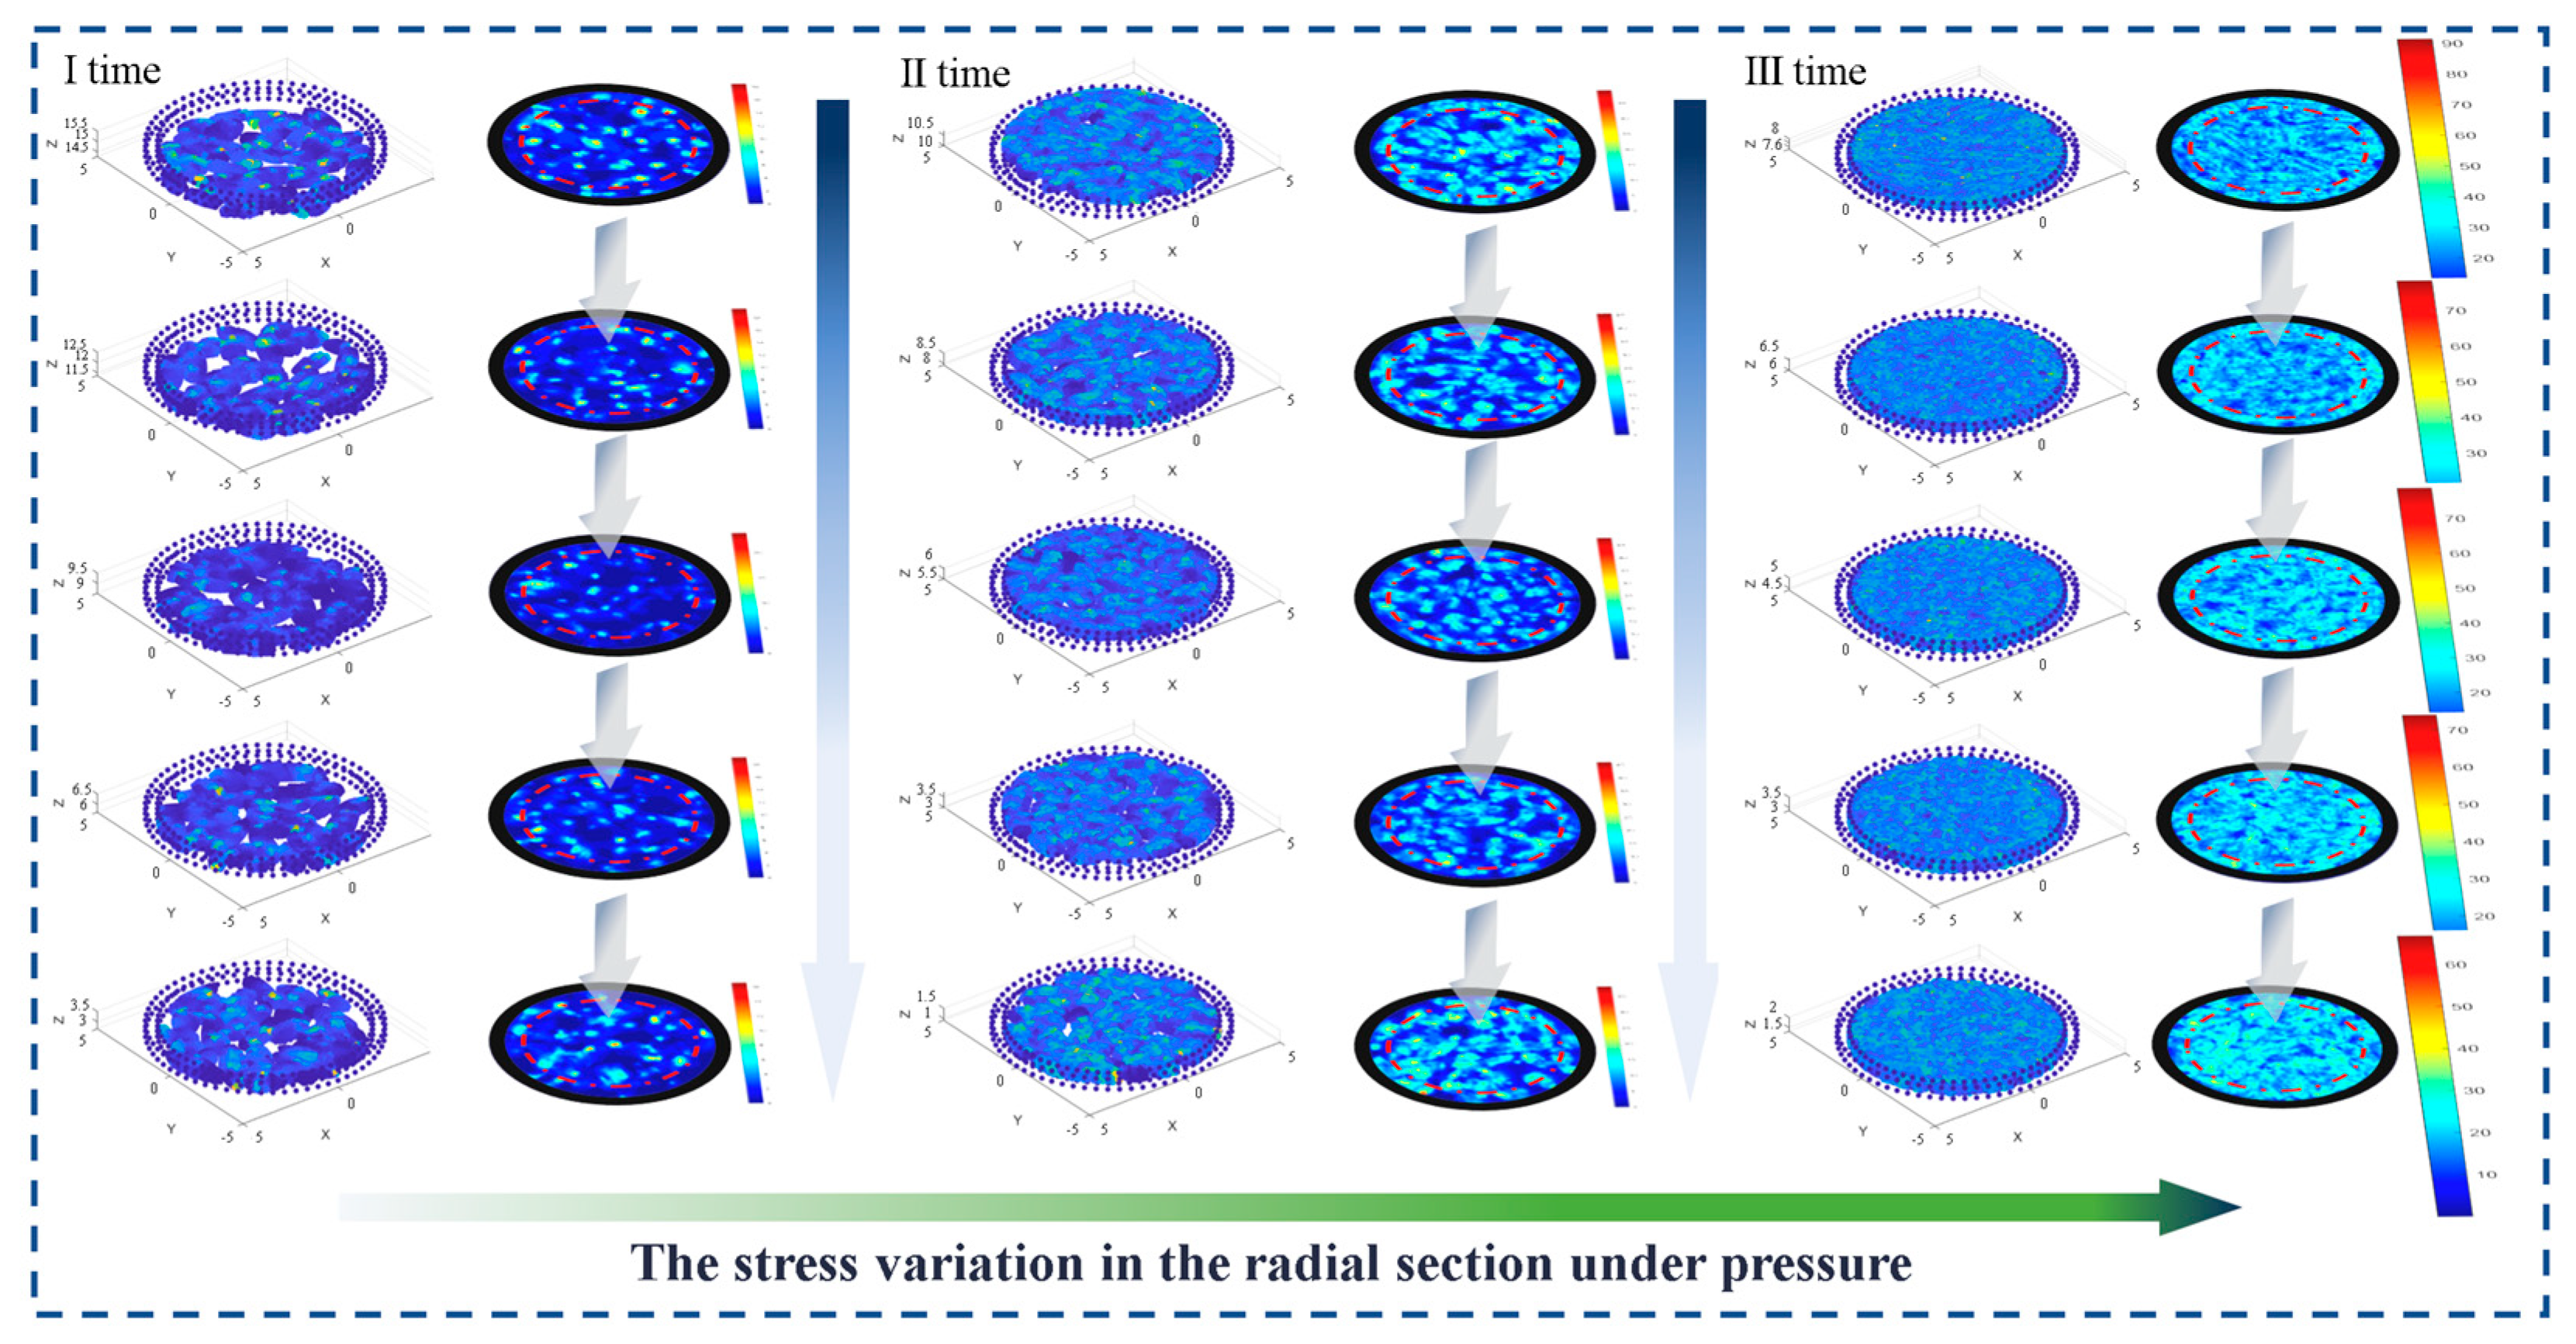
To visually illustrate the distribution characteristics of stress propagating from top to bottom and gradually attenuating during the compression of the particle bed, extracted and analysed stress nephograms of the intermediate radial cross-section at each layer. The results are presented in Figure 11, which depicting three time points within the compression displacement range of 0 to 8.44 mm. By comparing the nephograms across layers alongside the colour scale on the right, it is evident that the stress level decreases progressively from the top layer to the bottom layer, indicating a pronounced attenuation effect during load transfer. As compression proceeds advances, the particle assembly transitions gradually from the initial rearrangement phase to the densification phase. Correspondingly, stress distribution within the particle bed becomes increasingly concentrated, localizing within a circular region aligned along the compression axis. This further explains the macroscopic phenomenon that particle breakage is concentrated in the central region during compression experiments.
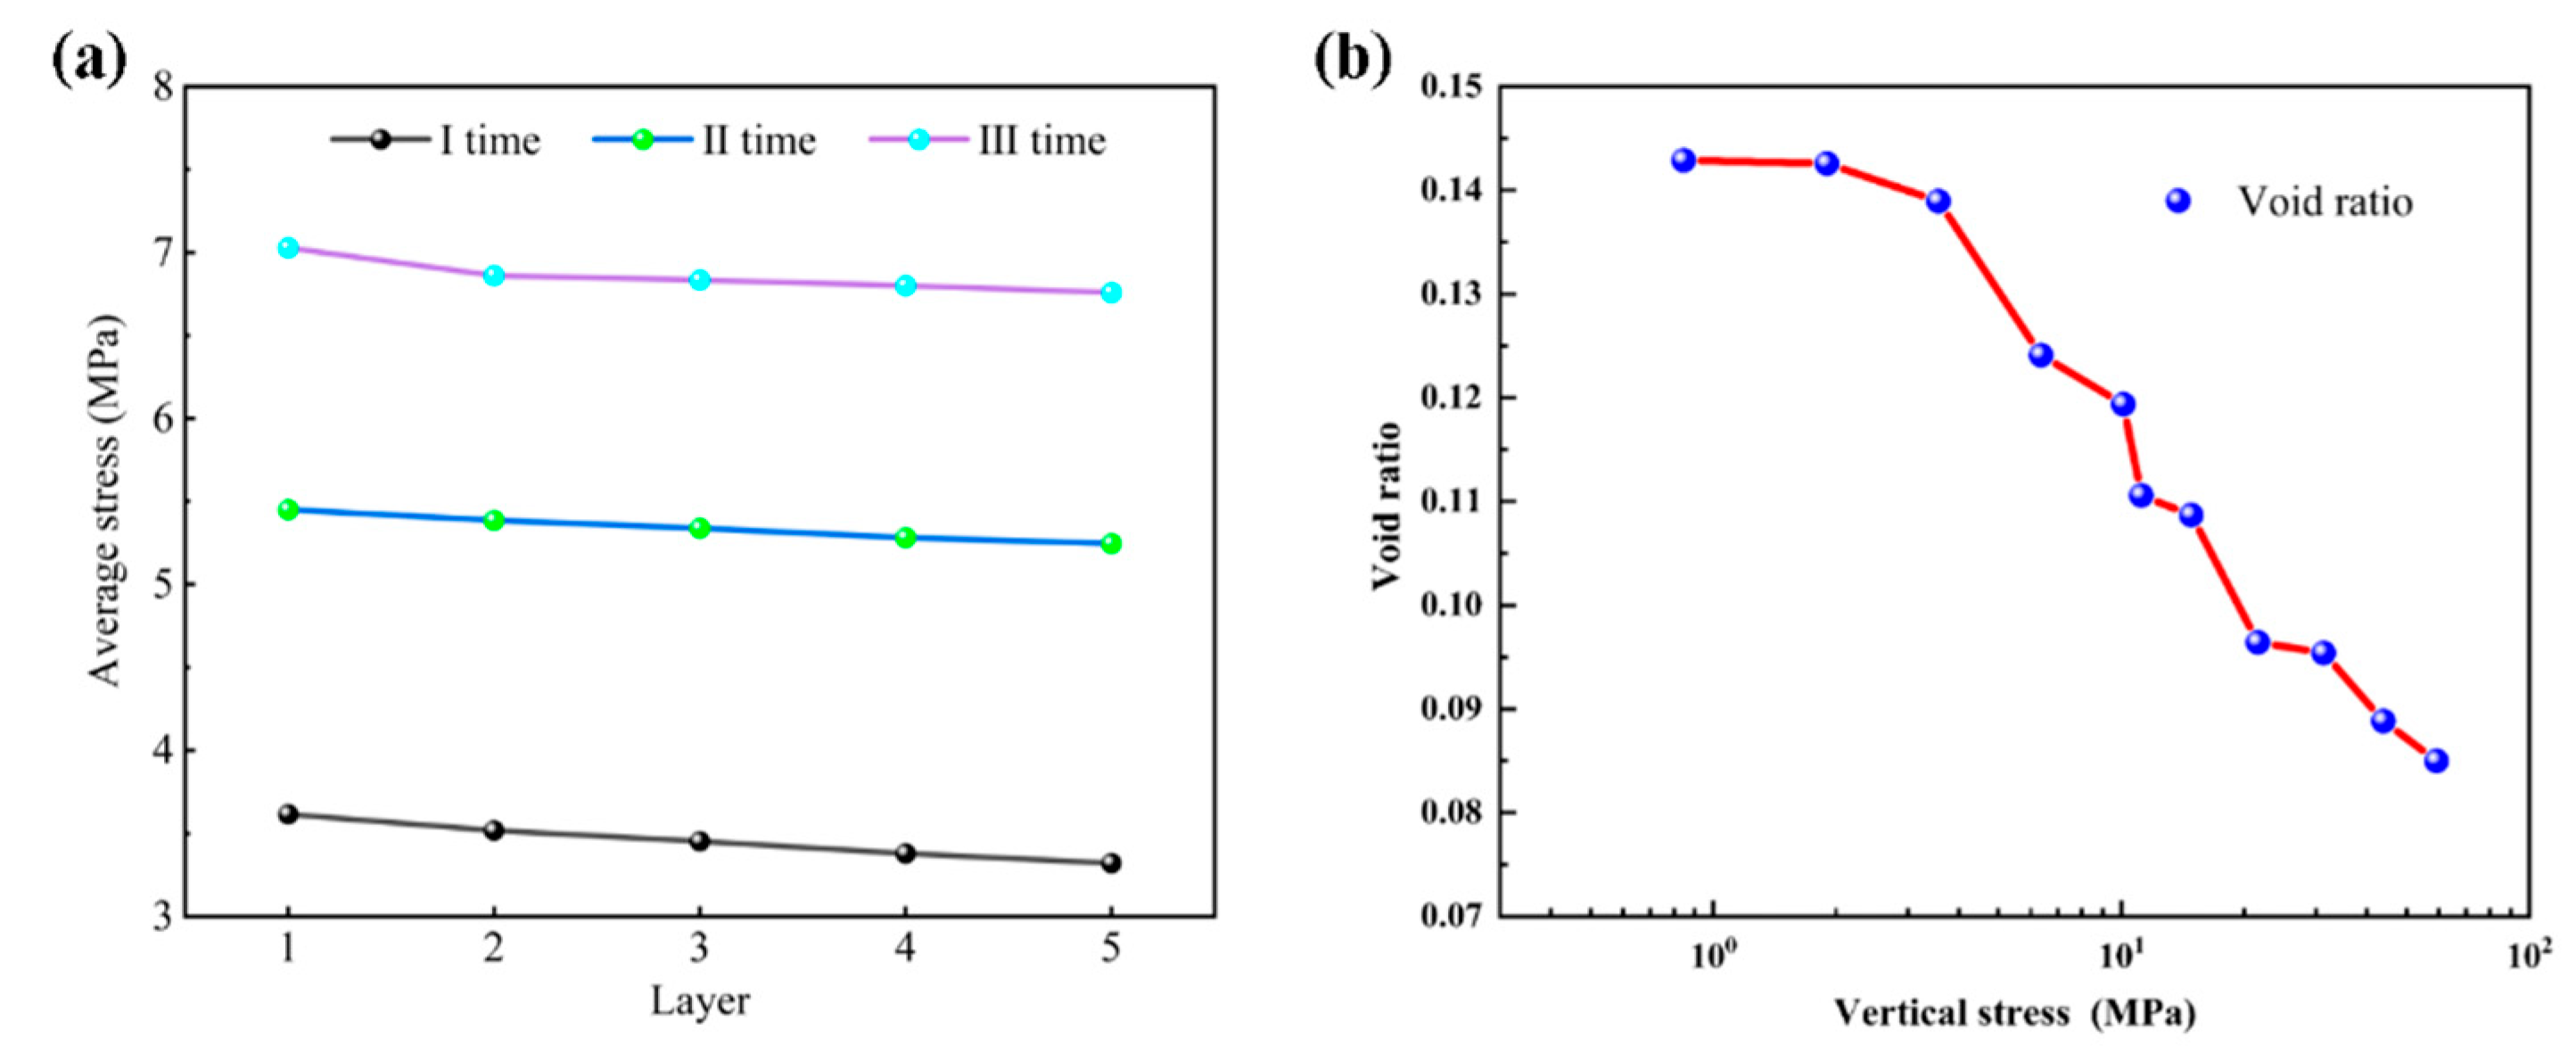
To quantitatively analyse the mechanical response of the granular bed during compression, the average stress for each layer at three key compression stages corresponding to Figure 11 was extracted, as shown in Figure 12a. The data reveal a progressive decrease in stress from the top layer downwards, consistent with the distribution characteristics observed in the stress nephograms of Figure 11. This further corroborates the attenuation mechanism of load transmission within the granular system. Concurrently, the evolution of the void ratio in relation to stress during compression was analysed, as depicted in Figure 12b. Particles in their initial randomly packed state possess a certain porosity. As compression proceeds, the void ratio continuously decreases. However, limited by the finite volume of the particles themselves, the void ratio cannot decrease indefinitely, and its value gradually approaches zero. During this process, the particle coordination number continuously increases, accompanied by intensified deformation and fragmentation. It is important to note that the coordination number referred to here specifically denotes the number of pressure-bearing contacts on a particle. These contacts, and the associated parameters, were identified and extracted using the post-processing capabilities of the general-purpose finite element software ABAQUS (2023). In the field of soil mechanics, when the stress exceeds the yield point, the relationship between the void ratio and the logarithm of stress is typically linear. This segment is known as the Normal Compression Line (NCL), and its initial yield is generally regarded as the onset of particle breakage [60,61,62,63]. A similar phenomenon is observed in this study. As the axial stress increases, the void ratio continues to decline. When the compressive stress exceeds the yield point, the void ratio declines sharply. This reflects the progressively diminishing influence of particle breakage on the pore structure with ongoing compression, alongside a further increase in the number of inter-particle contacts. It should be noted that the increase in the coordination number (CN) during compression is not unbounded. Studies indicate that the average coordination number of a particle assembly typically lies between 2 and 9. Zhu et al. [64] pointed out that particle breakage has a significant effect on the coordination number distribution, while shearing exerts a more pronounced influence on the shape of the coordination number distribution curve. This is because shear induces adjustments to the overall structure of the particle assembly, whereas any specific particle breakage event only causes a localised structural change in the material.
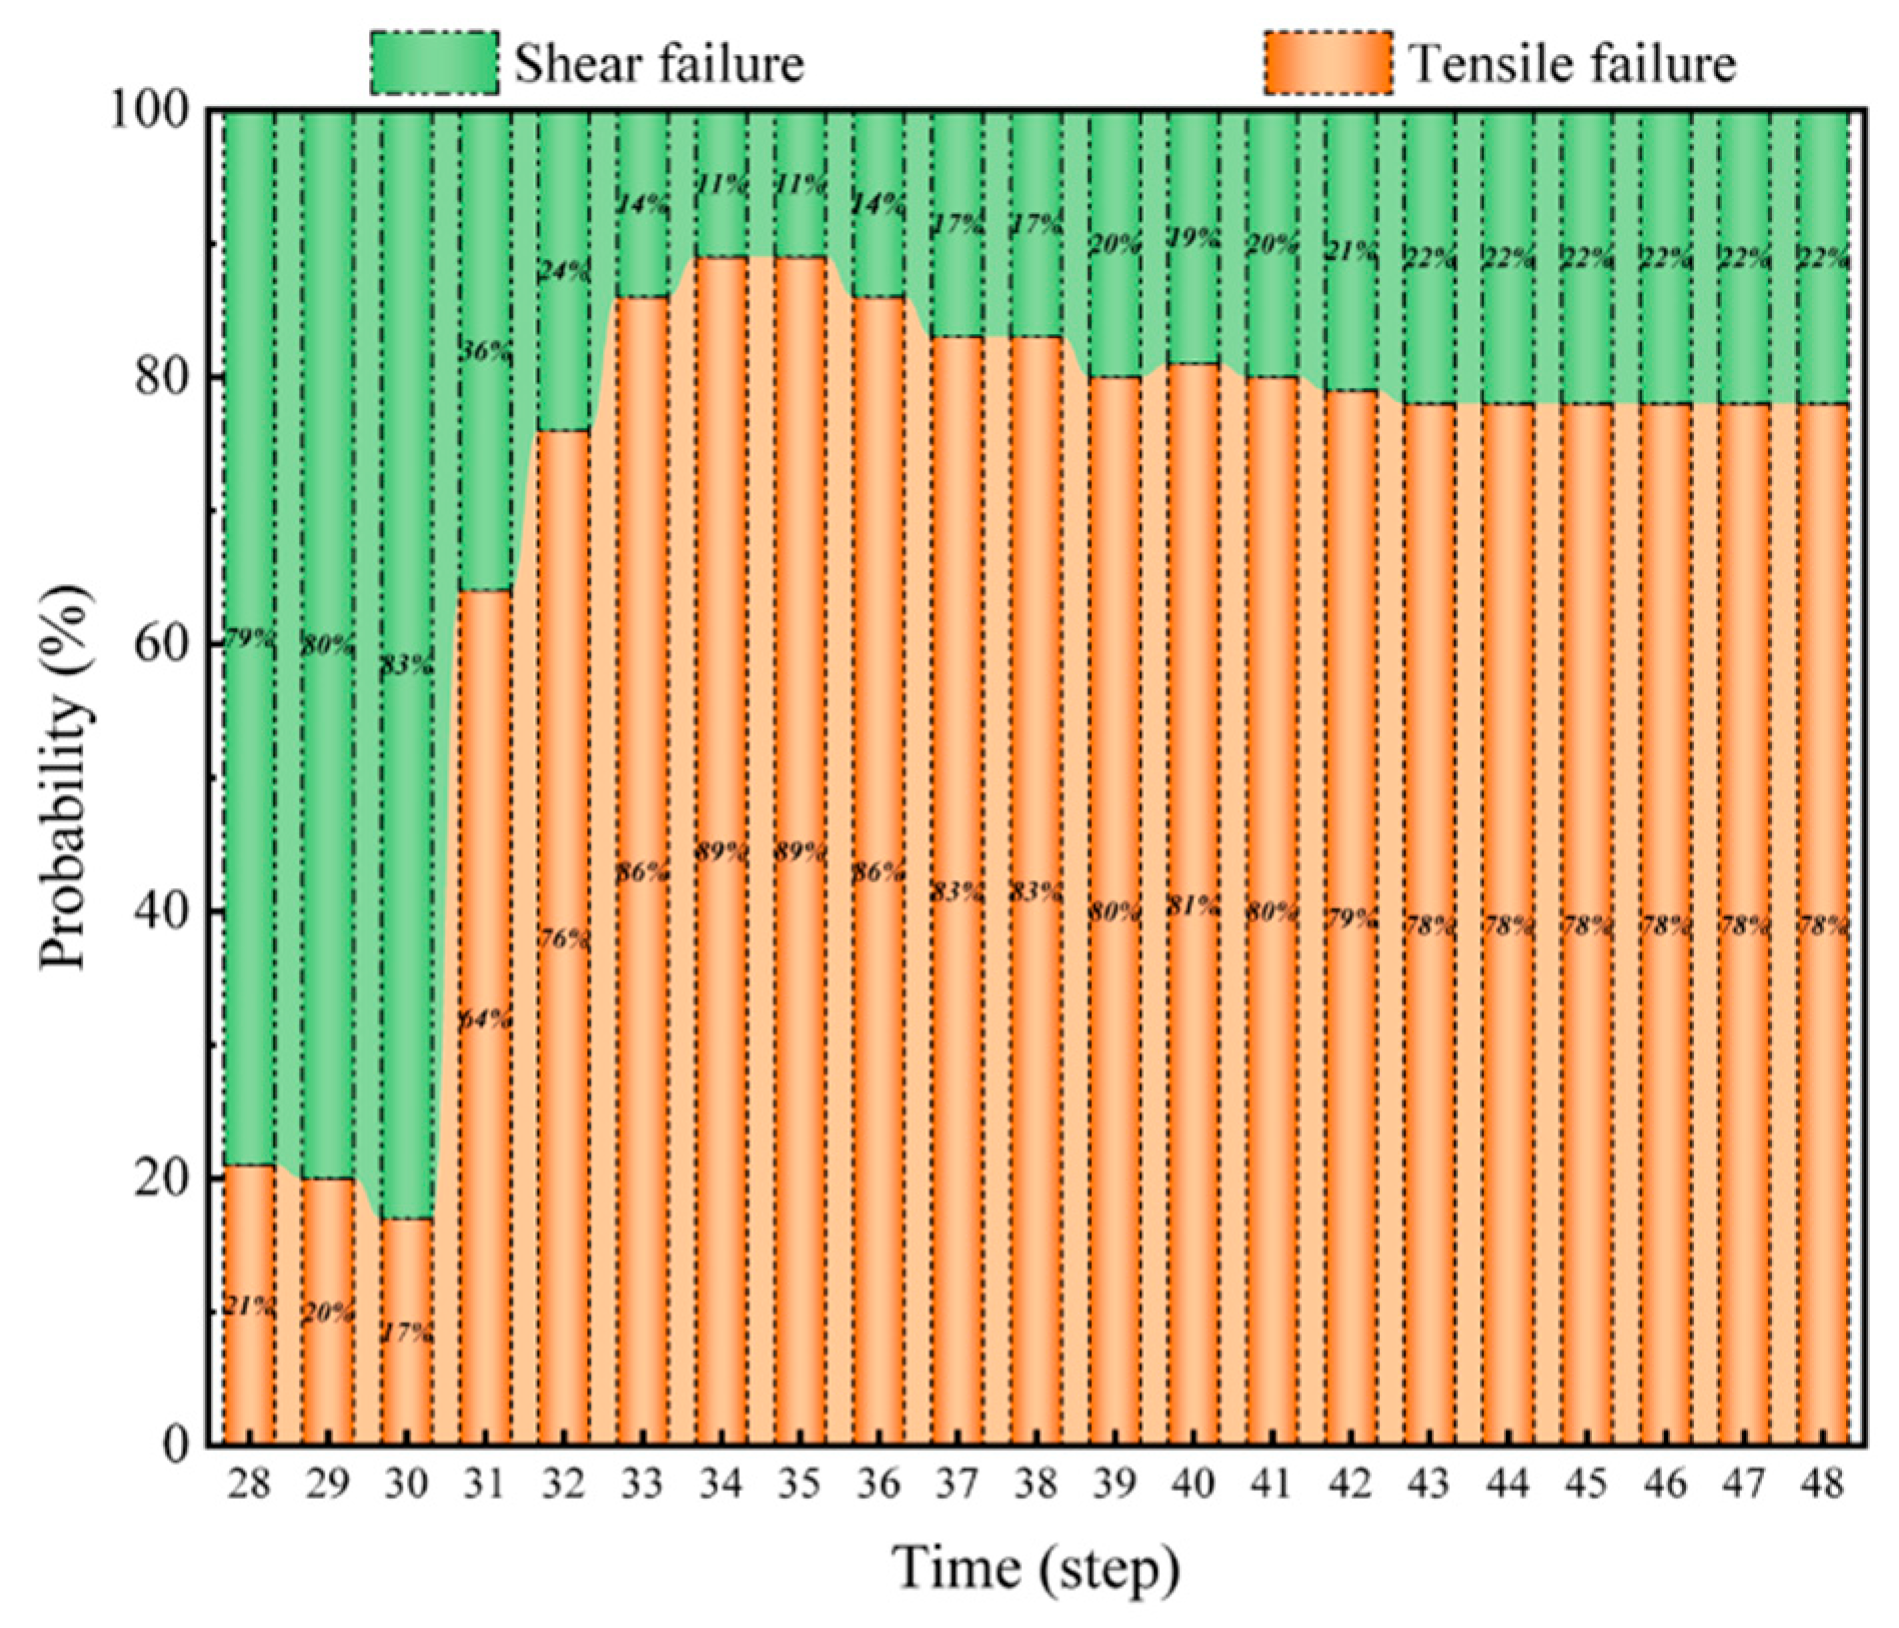
To analyse the damage evolution mechanism, this study extracted the element damage state within the particle bed during compression. The damage was characterised using the damage variable (SDEG) of the cohesive elements, where SDEG = 1 indicates complete failure of the cohesive element. Concurrently, the failure mode was determined by combining the corresponding MMEMIN data: a value between 0 and 0.5 indicates tensile failure, while a value between 0.5 and 1 indicates shear failure. Consequently, the element damage state was extracted for selected time intervals during the process. The results are presented in Figure 13.
The results indicate that tensile failure dominates the overall breakage process. It should be clarified that this conclusion represents the overall trend throughout the complete compression and breakage process and does not contradict the fact that individual particles can experience either tensile or compressive failure. The ellipsoidal shape of the rice grains, coupled with the irregular spatial constraints imposed by neighbouring particles and the container wall, results in a particle system with high initial porosity and a relatively loose structure in the initial stages. Under compressive loading, discrete contact forces generate a heterogeneous stress field within each particle. Compressive stresses are concentrated at the direct contact points, while tensile stresses develop in the regions between these contact points, analogous to tensile zones in bending deformation. This stress state, combined with the occurrence of relative sliding and rotation between particles, leads to a certain proportion of shear failure. As compression proceeds, the particle groups undergo progressive densification. The sliding and rotation of particles become increasingly constrained, which more particles exhibit breakage behaviour more closely aligned with three-point or multi-point bending modes. Consequently, the proportion of tensile failure increases rapidly and becomes dominant during this phase. Although initial breakage exhibits characteristics of bending failure, the continued reduction in bed volume and void ratio under confined compression constrains subsequent damage development, making it difficult to maintain a pure bending path. The continuous filling of voids by particles leads to a gradual shift in the damage mode of some particles towards shear failure. It should be clarified that the figure illustrates the proportion of each crushing type at each selected time step during compression. Throughout the entire compression process, the total system damage accumulates continuously, but the overall breakage rate of the granular bed eventually stabilises at a certain value. As the vertical stress increases, the breakage probability gradually approaches a constant, indicating that the system reaches a final steady state. Even under extremely high stress, the final breakage probability remains less than 1, demonstrating that not all parent particles breakage [65,66]. This phenomenon has been validated in both ultra-high-pressure experiments and numerical simulations. The underlying mechanism may stem from the ‘encapsulation effect’ where fine fragments produced from breakage surround the parent particles, inhibiting their further fracture [67].

3.3. Damage Evolution of Individual Particles Within a Granular Assembly

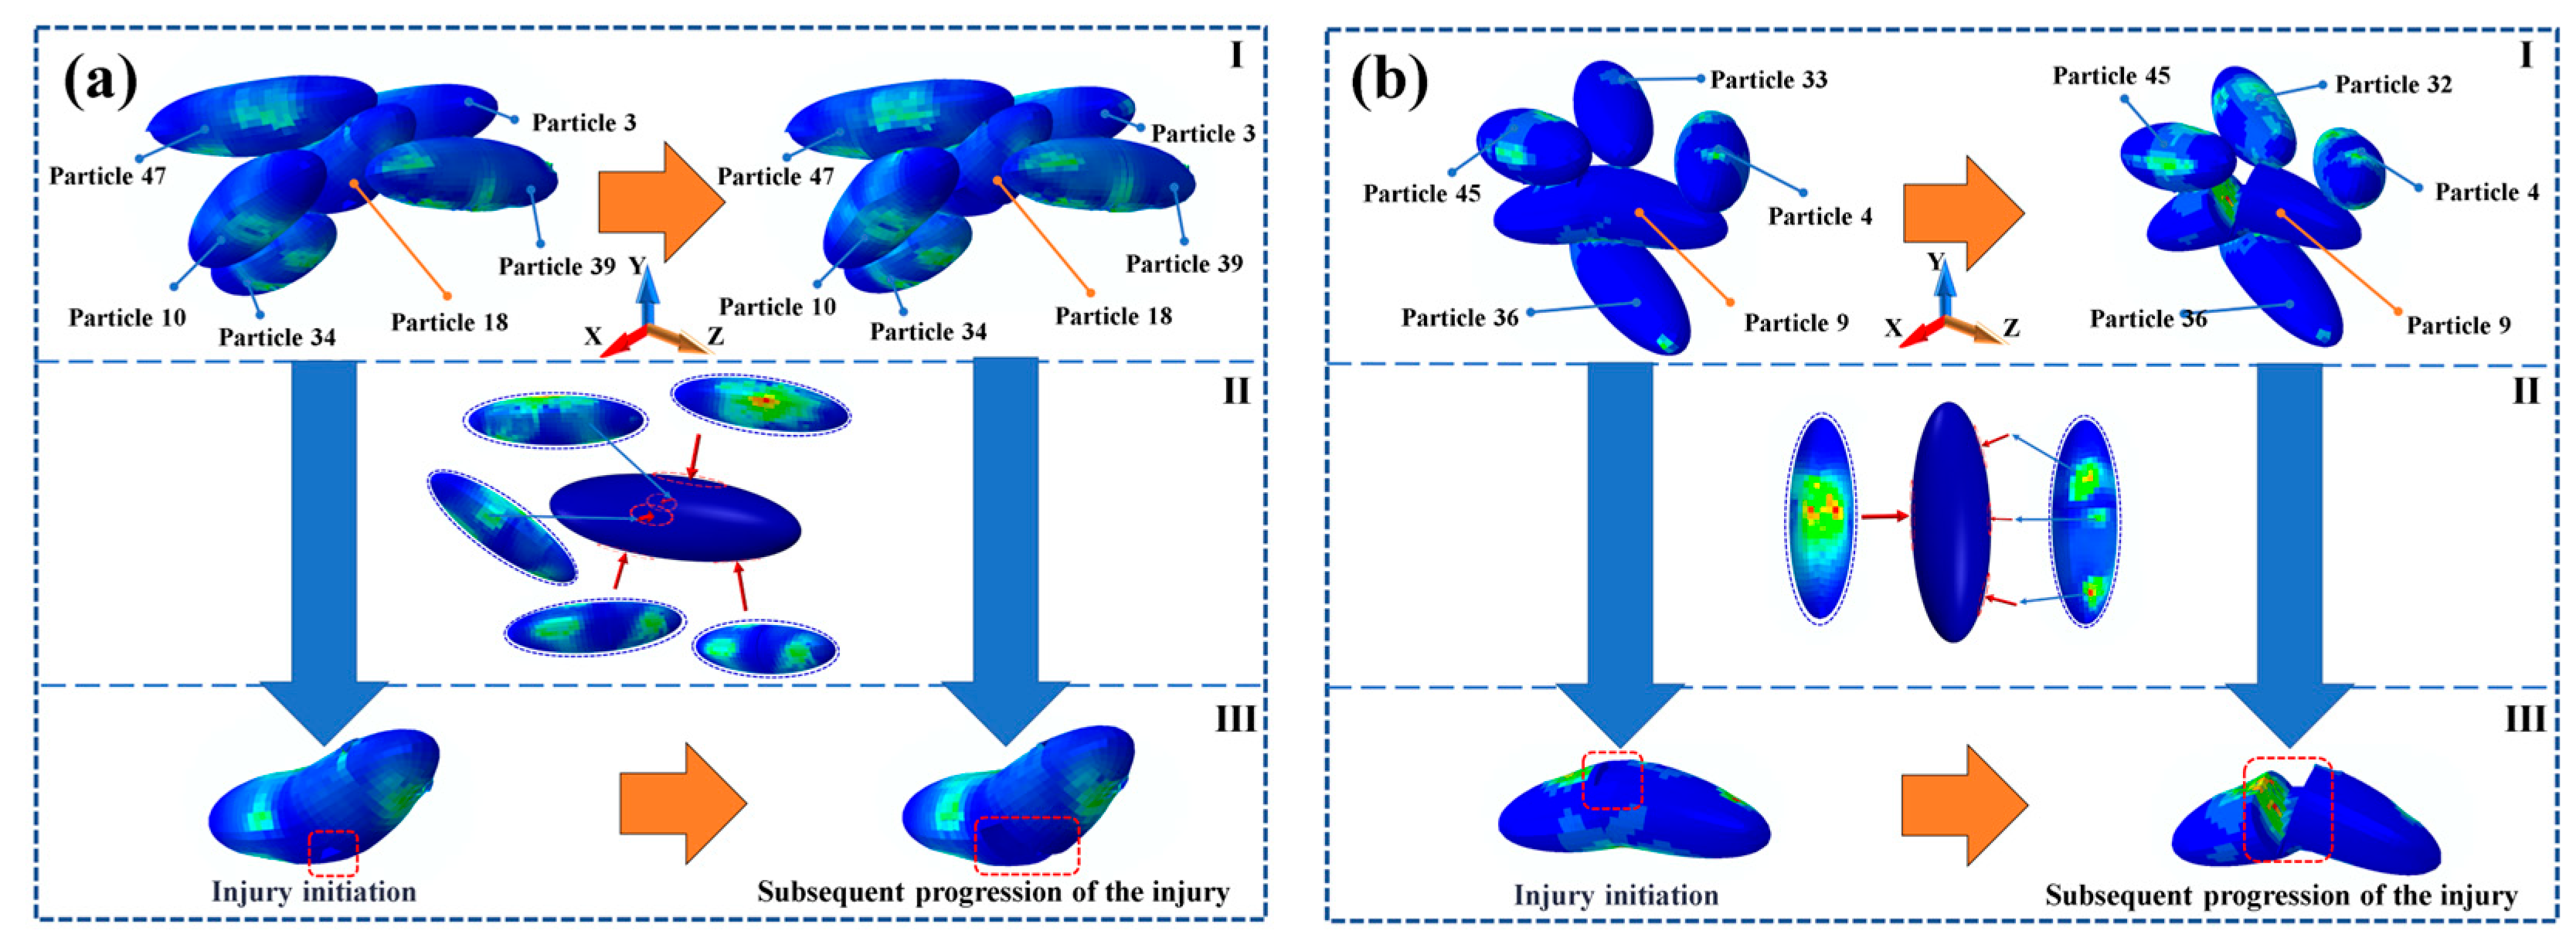
Particle breakage results from the combined effect of the spatial position (CN) of a particle and the localised contact stress. To further investigate the mechanisms underlying particle breakage, several representative particle types were selected for single-particle breakage analysis, as illustrated in Figure 14. Although both Particle 18 (Figure 14a) and Particle 9 (Figure 14b) exhibit Type III crushing morphology, their breakage processes differ slightly, as do their initial positions at the onset of breakage. Despite having different numbers of contact points, their final breakage morphologies are quite similar. Further analysis reveals that the primary contact forces leading to breakage are consistent in number for both particles. However, in the former case, pressure is applied at one end while the particle is supported by two points at the opposite end, causing fracture. In the latter case, pressure is applied via two contacts at one end, with the opposite end providing support. Furthermore, the stages at which damage initiates also differ: breakage in Particle 18 occurs during the downward loading phase, while damage in Particle 9 develops during the overall densification process of the particle bed. This discrepancy further corroborates the top-down load transfer path within the particle assembly and indicates that breakage behaviour depends not only on local stress levels but also on the compression stage and the surrounding confinement state. Therefore, particle breakage is governed by both the number of contacts and the magnitude of contact stress. It is important to note that the CN here was investigated at specific time steps, as particle breakage can occur at different stages of the compression process. Meanwhile, the CN is treated as a quantitative structural indicator. It quantifies the number of effective, load-bearing contacts for each particle and directly reflects the degree of mechanical constraint imposed on it by its neighbouring particles.
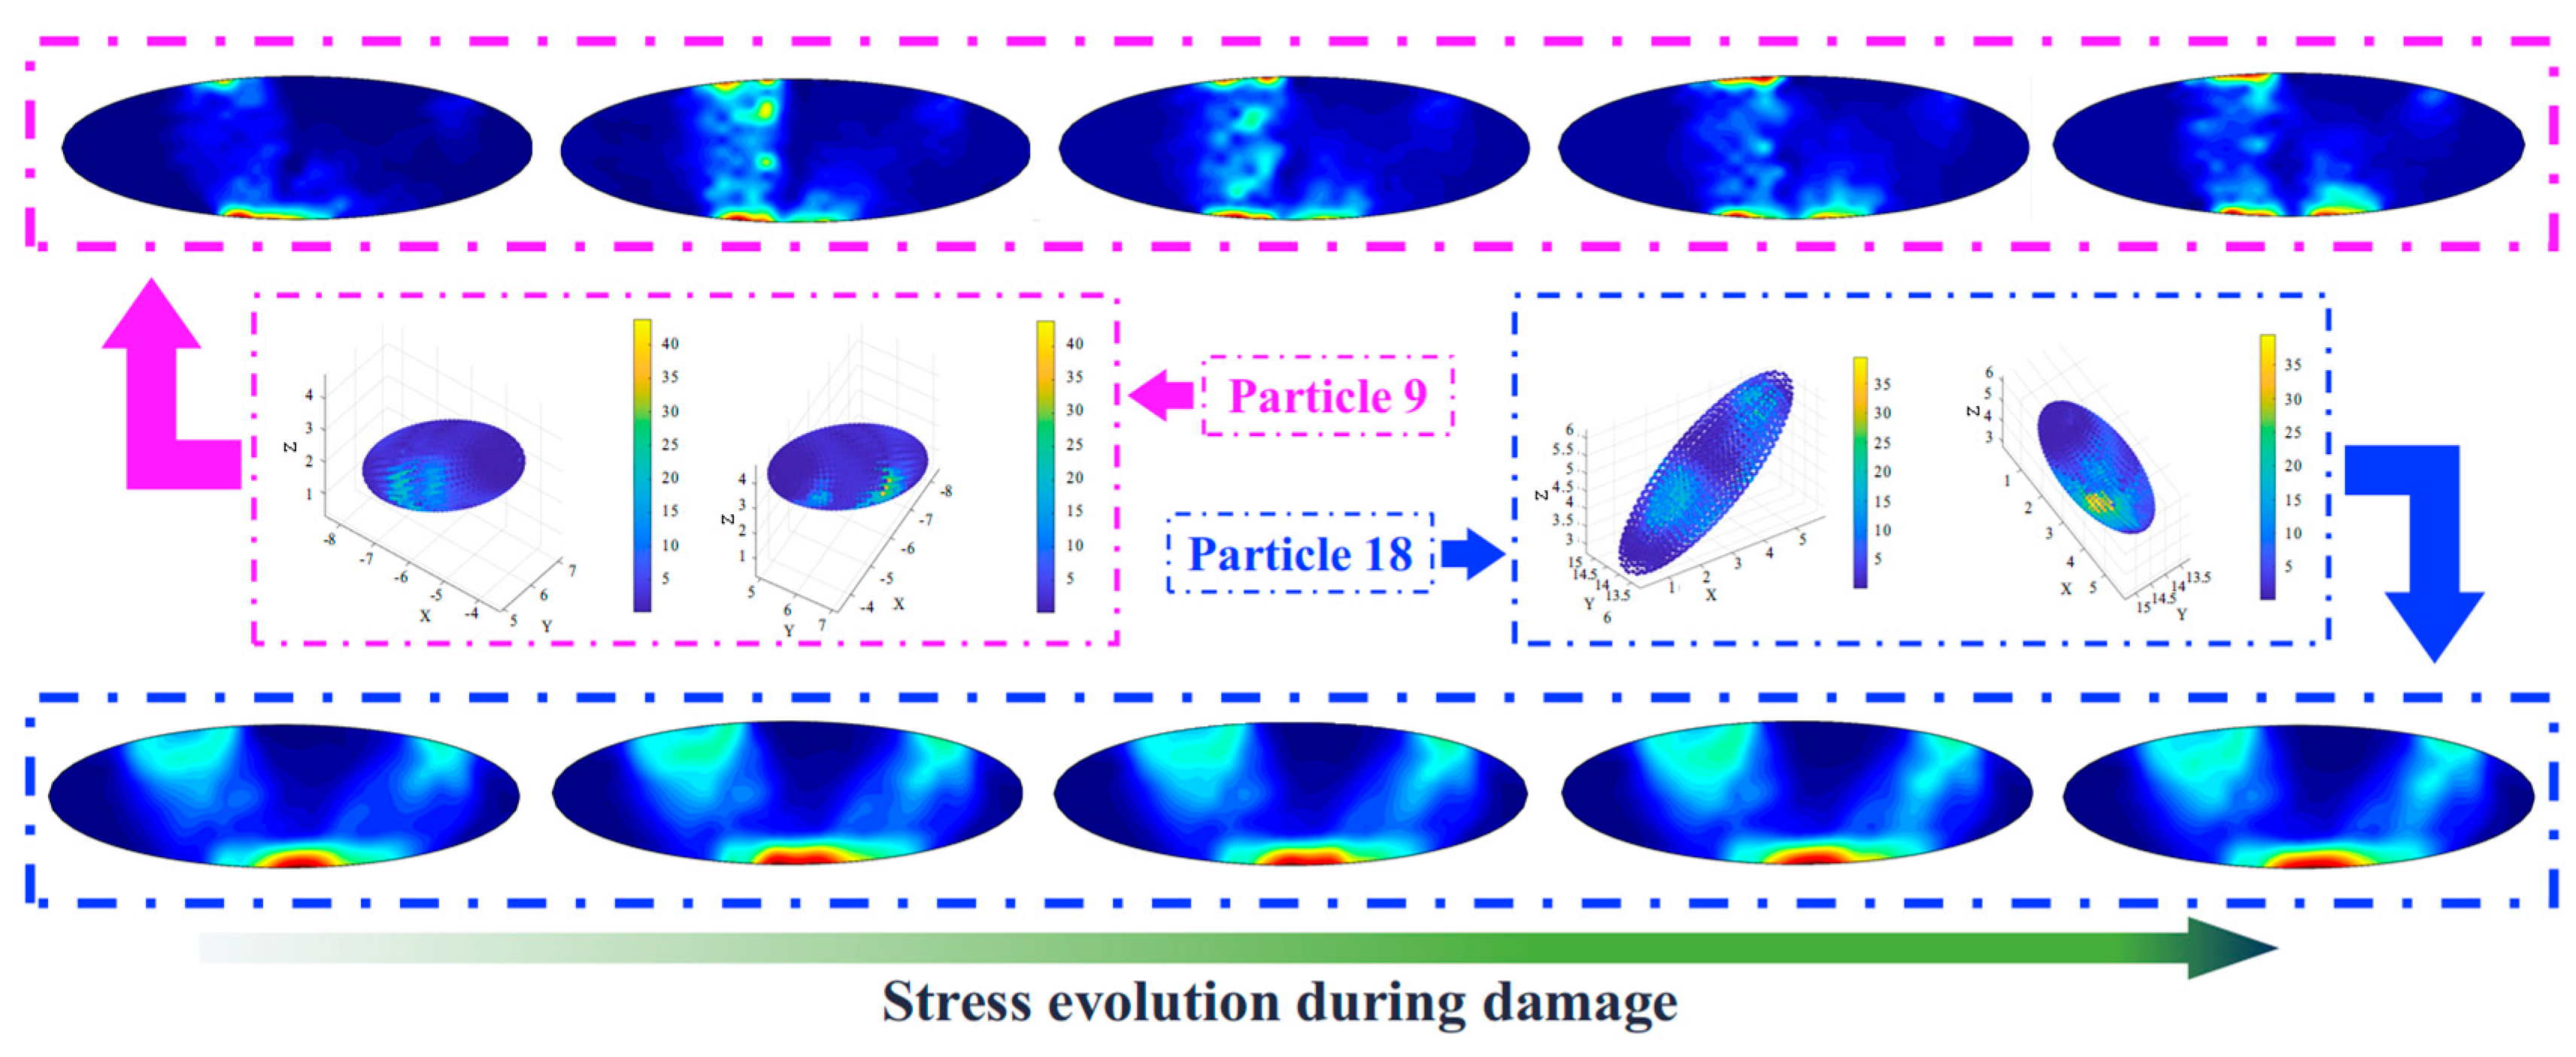
Simultaneously, stress nephograms were extracted for Particle 18 and Particle 9 during the compression breakage process to investigate the mechanical mechanism of particle breakage, with results shown in Figure 15. Although the scatter plots of particle stress indicate differences in the distribution of contact locations, the number of contact points involved in the breakage process is essentially consistent for both particles, and their stress evolution characteristics exhibit similarities. Initially, contact stresses arise at the contact points. As the compression process intensifies, the contact stresses within the contact regions progressively increase. This promotes the initiation of cracks on the particle surface. The cracks then progressively propagate through the damaged zones, ultimately leading to macroscopic fracture of the particles. It is important to note that the difference in the breakage stage results in distinct peak contact stresses for the two particles. This phenomenon can be verified by the stress distribution range indicated in the colour scale on the right side of Figure 15. The breakage of Particle 18 occurs during the particle rearrangement stage, whereas the breakage of Particle 9 takes place during the system densification stage. Consequently, the peak stress sustained by Particle 9 is significantly higher than that of Particle 18.
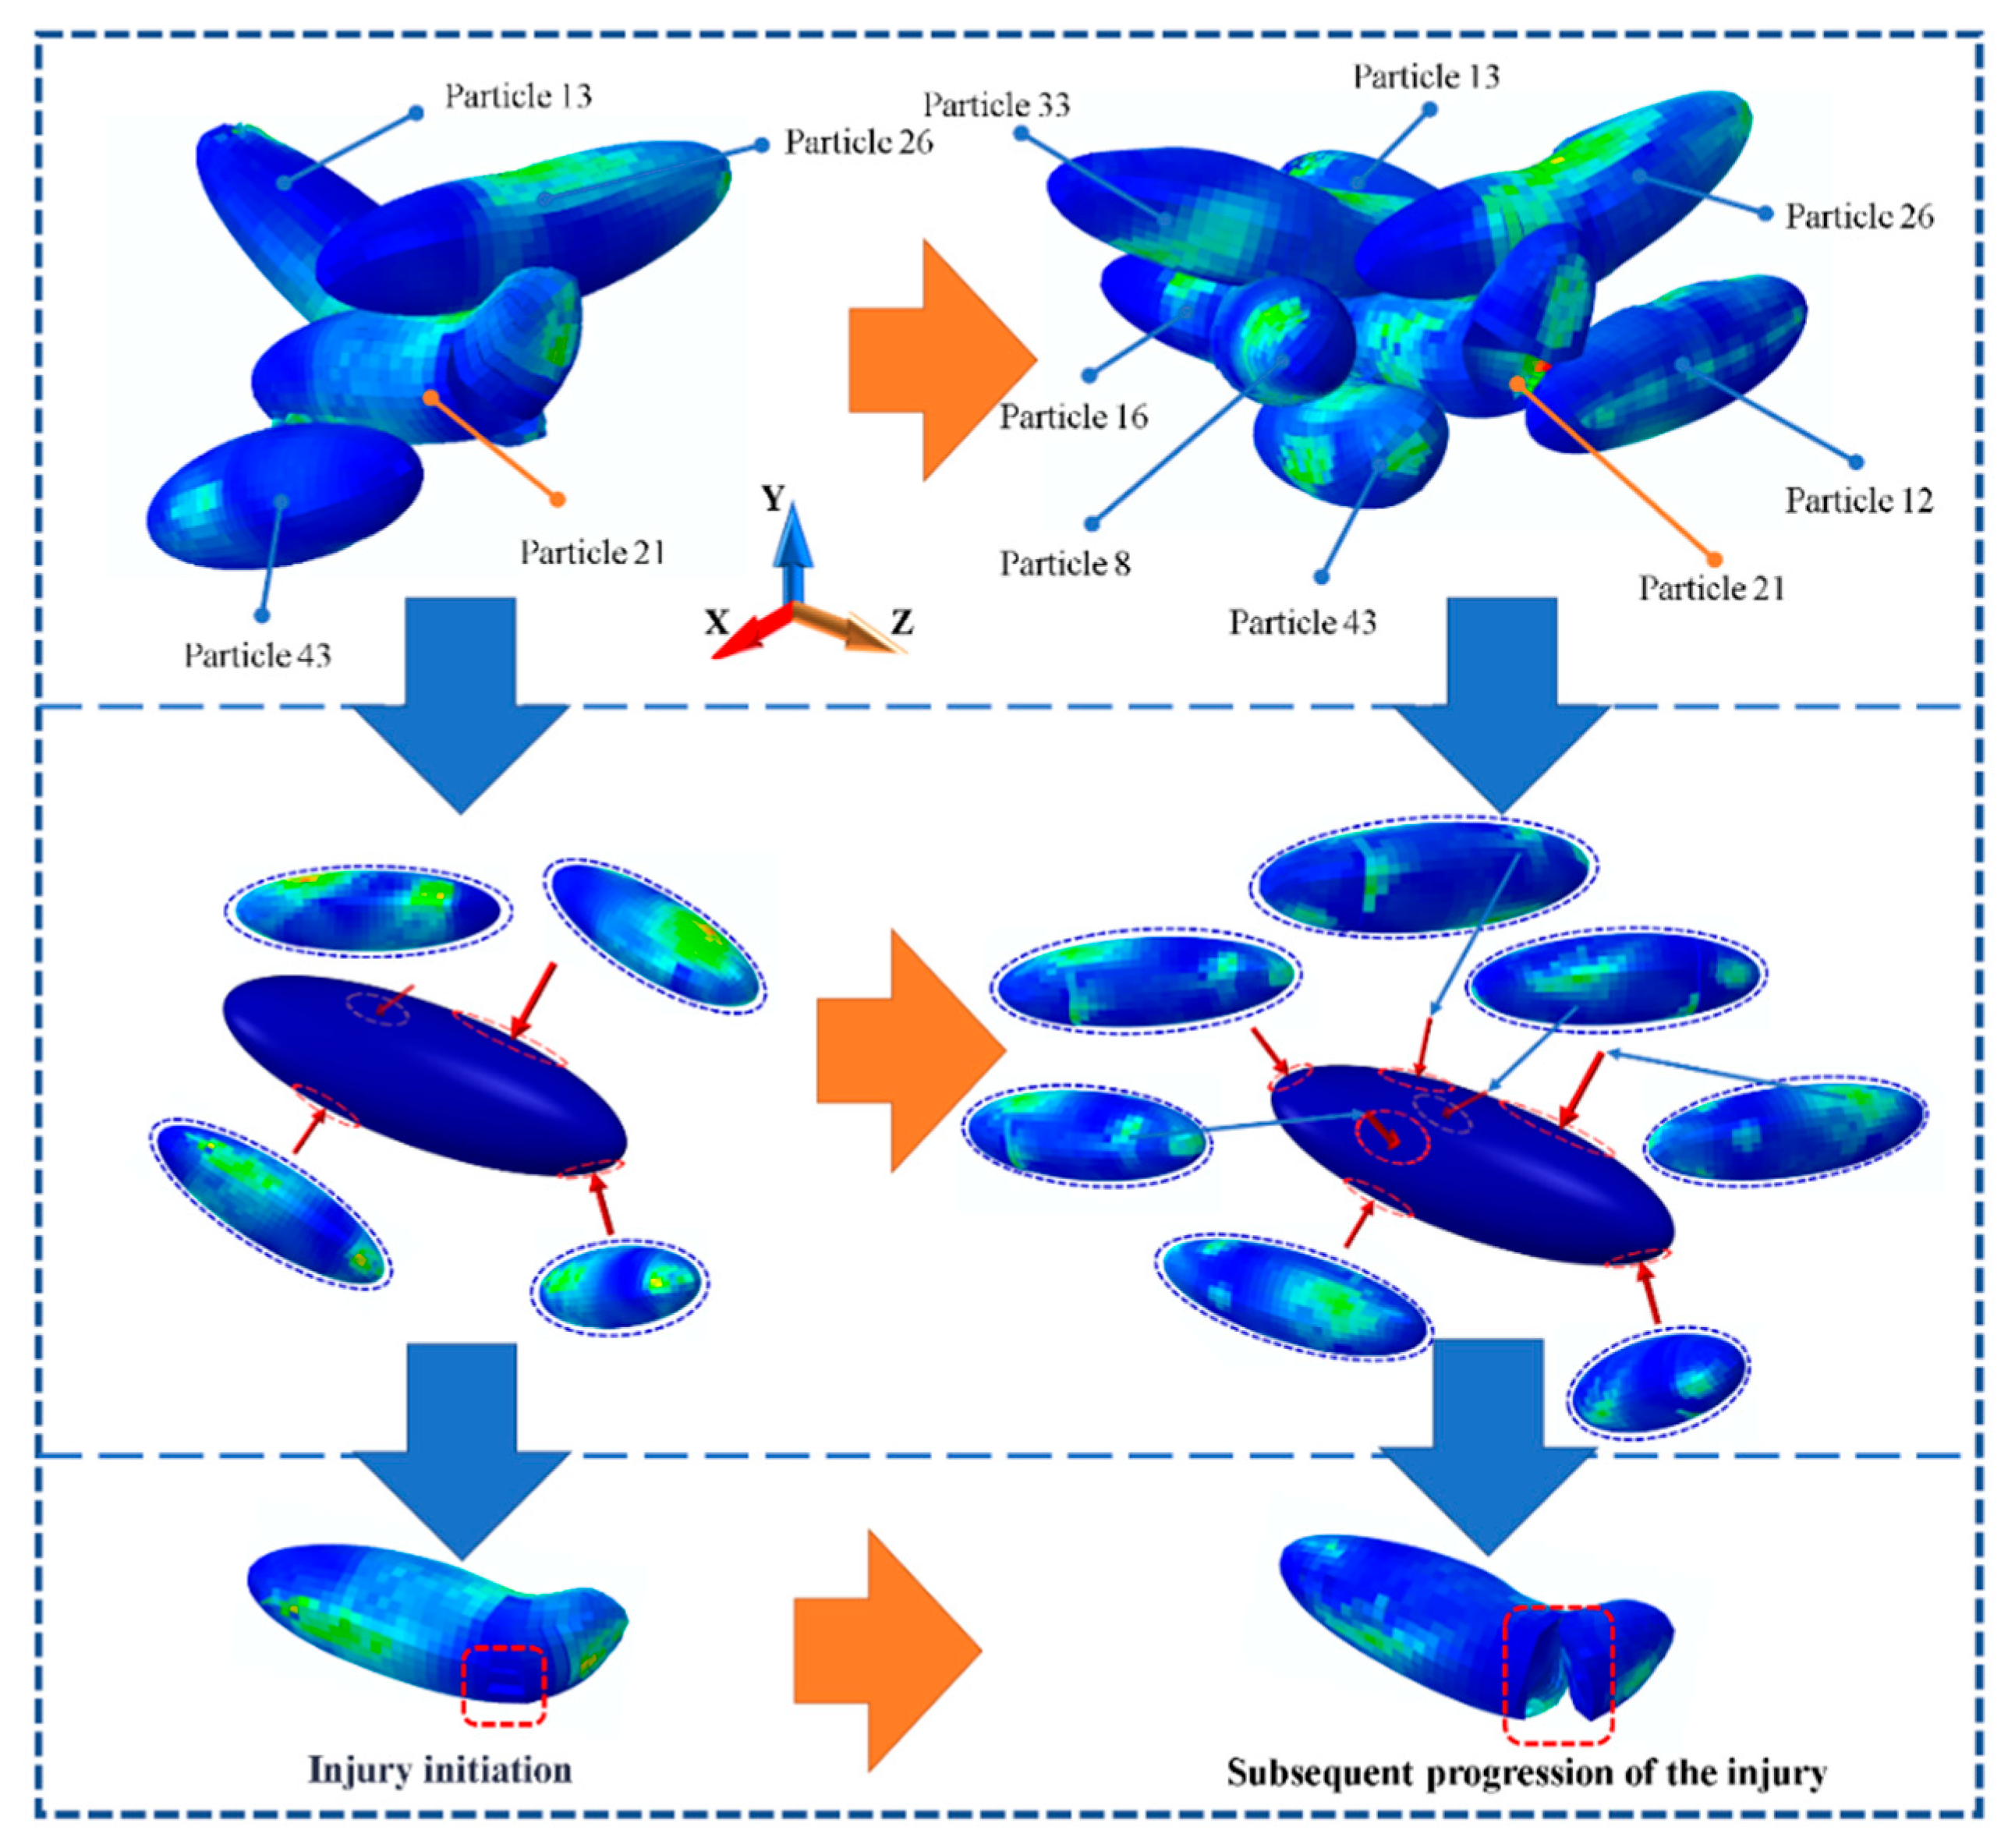
As shown in Figure 16, Particle 21 is observed to exhibit Type I crushing, which aligns with the experimental observations and result of the combined action at multiple contact locations. Although Particle 21 is surrounded by seven neighbouring particles, not all of them are the dominant factors in its breakage. The critical particles responsible for the fracture of Particle 21 are Particles 13, 26, and 43. Specifically, Particles 13 and 43 provide a clamping effect, while Particle 26 introduces a three-point bending load configuration. Their synergistic action ultimately induces the Type I crushing of Particle 21. As compression proceeds, the void ratio continues to decrease, and surrounding particles converge further towards Particle 21. Consequently, its fragments become enveloped by adjacent unbroken particles. Due to the relatively small size of these fragments, a structure of ‘large particles encapsulating small ones’ gradually forms. This ‘protective effect’ inhibits, to some extent, the further breakage of Particle 21. From the perspective of contact evolution, during the initiation and subsequent progression of damage, the contact area and stress magnitude change little, while the number of contacts increases significantly. In summary, particle breakage can be attributed to the influence of its stress state, whereas the specific fracture morphology is primarily determined by the CN conditions of the particles.
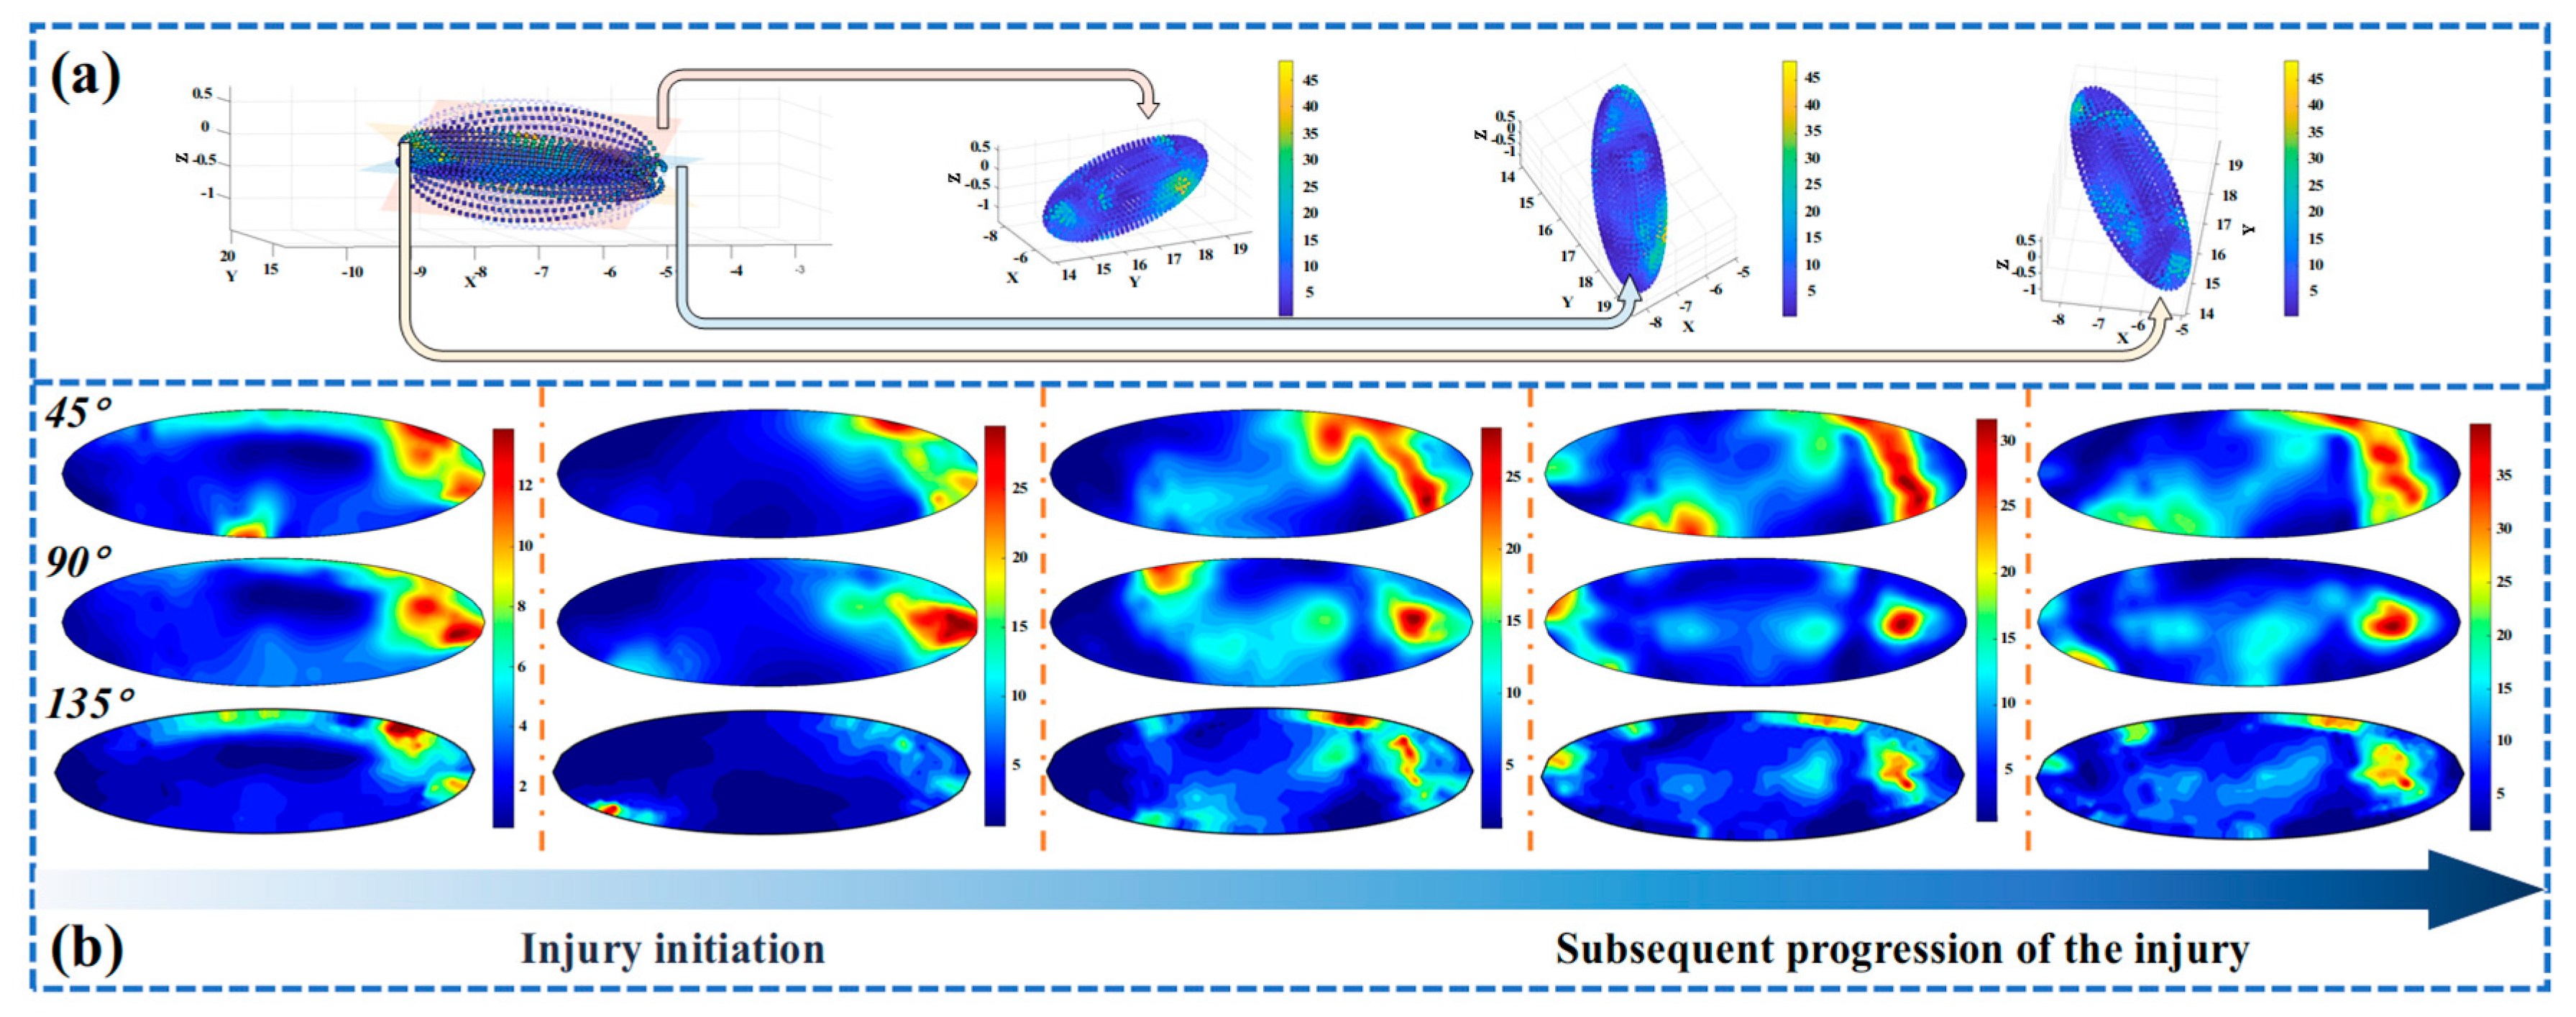
Figure 17a further illustrates the distribution of contact points acting on Particle 21 during its breakage process. Due to the complex morphological changes of this particle during breakage, stress nephograms along three cross-sections oriented at 45°, 90°, and 135° relative to its long axis were extracted to comprehensively capture its stress evolution (Figure 17b). The results reveal that the high-stress zones (red regions in the figure) precisely correspond to the locations where Particles 13, 26, and 43 act, indicating these three are the primary stress sources initiating fragmentation. Although the remaining contact points also participate in stress transmission, they are not the dominant factors leading to fracture and serve mainly auxiliary constraining roles. It is noteworthy that the initial contacts play a dominant role in breakage evolution, whereas subsequently formed contacts primarily undertake clamping and stabilizing functions, promoting stability in the breakage system. As the CN increases, the stress level at individual contact points decreases, making the particle less susceptible to further breakage—a clear manifestation of the ‘protective effect’. This process is fundamentally a passive mechanical response formed during system compression.

4. Discussion

This study investigated the macroscopic mechanical response of a rice grain bed through confined compression tests and successfully simulated the compression process of the granular assembly using a FEM based on the CZM. Simulation results indicate that the load is transmitted from top to bottom through force chains with an attenuating trend. As compression progresses, stress further diffuses from the stress chains into the surrounding regions. Breakage behaviour is closely related to local contact stress. Breakage occurring when the stress exceeds strength threshold of the material. Meanwhile, as the load increases, the CN rises accordingly. A higher CN promotes more uniform stress distribution, thereby influencing breakage behaviour. Research indicates that breakage within a particle bed is not determined solely by stress level, but rather results from the complex interaction between CN and local contact stress. This reasonably explains the spatial heterogeneity of breakage patterns both vertically across layers and within each layer. During processing, breakage of rice grains under high pressure constitutes a primary cause of loss. Our team’s prior research has systematically examined the compression breakage mechanisms and causes in rice grains, providing a detailed analysis of force distribution and transmission during compression and establishing a model to predict the stress transfer performance of granular beds [7,14].
Although the current research elucidates the breakage mechanism from a microscopic viewpoint and identifies the complex interplay between coordination number and local contact stress as the cause of breakage, it does not address the prediction of fracture morphology or the more detailed influence of CN on breakage. Consequently, future work should further derive and validate models for breakage probability and breakage patterns, thereby extending the applicability to practical predictions of grain breakage during processing. In the simulations, rice grains were simplified as ellipsoidal particles. This simplification did not account for natural surface irregularities found in real grains (such as ventral depressions) or inherent internal micro-cracks, nor did it incorporate particle size gradation. However, this simplification does not compromise the reliability of the study’s core conclusions. The primary focus was on elucidating the intrinsic mechanical mechanisms and overall macroscopic response of the particle system, rather than on the influence of local geometric details. Therefore, the model based on the ellipsoidal assumption remains effective in revealing fundamental breakage patterns and mechanisms. Future work could integrate real particle geometries and gradation information obtained from high-resolution CT scans to enhance the model’s accuracy in predicting localised details and the response of realistic structures. Simultaneously, employing a penalty function to describe friction between particles and silo walls, as well as between particles themselves, simplified complex interactions into pure friction control. This approach inadequately accounts for surface effects such as adhesion potentially present in real silos. Despite these limitations, they are inherent to the model design process. These simplifications are necessary prerequisites for enabling finite element analysis while still providing valuable insights into the mechanical behaviour of bulk materials within silos.

5. Conclusions

This study systematically investigated the breakage behaviour of rice grain assemblies under confined compression through an integrated methodology combining experimental testing, X-ray CT imaging, and finite element modelling based on CZM. The main conclusions are as follows.
The research identified and statistically classified three breakage modes. The evolution of these modes clearly depends on stress magnitude and the spatial distribution of forces on particles, showing a trend that progresses from initial Type I and Type III crushing towards the more severe Type II crushing as compression advances. Relevant parameters for rice grains during compression were calibrated through experiments. The established model incorporating zero-thickness cohesive elements successfully reproduced the macroscopic compression process and internal damage evolution. Simulation results indicate that the load is transmitted from top to bottom via instantaneously formed stress chains and undergoes attenuation. The propagation of these stress chains was shown to diffuse laterally as compression progresses, leading to a ‘coalescence’ phenomenon under high compressive stress. Significant breakage in experiments and high-stress zones in simulations were both concentrated within the cylindrical region confined by the loading platen, consistent with the ‘banded’ stress chains and the final ‘coalesced’ stress concentration zones displayed in the stress nephograms. Simulations based on the CZM revealed that tensile failure dominates the overall breakage of the particle group. Initial contacts determine the location of crack initiation and the propagation path, while subsequently formed contacts primarily serve a stabilizing role in the breakage system. Analysis of single-particle breakage further demonstrated that the breakage process is primarily governed by the synergistic interaction between CN and local contact stress. Particle breakage is caused by stress at contact points, while CN further influences the breakage morphology. Furthermore, a notable ‘protective effect’ was observed during the collective compression of the granular bed: broken fragments fill voids and form an encapsulating layer around larger, unbroken particles. This process, accompanied by an increase in coordination number, promotes a more uniform load distribution, inhibits further breakage, and particles may remain intact even under high stress conditions.

Author Contributions

Conceptualization, X.L., A.L., X.W. and M.W.; Data curation, X.L.; Formal analysis, X.L.; Funding acquisition, Y.H.; Investigation, X.W. and T.W.; Methodology, X.L.; Project administration, Y.H.; Resources, Y.H.; Software, X.L. and A.L.; Supervision, A.L.; Validation, X.L., M.W. and T.W.; Visualization, H.G.; Writing—original draft, X.L.; Writing—review and editing, X.L. All authors have read and agreed to the published version of the manuscript.

Funding

This work was financially supported by the China Postdoctoral Science Foundation (2025MD774051), the National Natural Science Foundation of China (11802057), and the Key Project of the “2025 New Era Outstanding Master’s and Doctoral Theses in Longjiang” by the Education Department of Heilongjiang Province (No. 59008810).

Data Availability Statement

The original contributions presented in the study are included in the article, further inquiries can be directed to the corresponding author.

Conflicts of Interest

The authors declare no conflicts of interest.

Abbreviations

The following abbreviations are used in this manuscript:
CNCoordination Number
CTComputed Tomography
CZMCohesive Zone Model
FEMFinite Element Method
FPZFracture Process Zone
GMGranular Material
NCLNormal Compression Line
TLSTraction-separation Law

References

  1. Jägers, J.; Spatz, P.; Wirtz, S.; Scherer, V. Analysis of wood pellet degradation characteristics based on single particle impact tests. Powder Technol. 2021, 378, 704–715. [Google Scholar] [CrossRef]
  2. Verkoeijen, D.; Meesters, G.M.H.; Vercoulen, P.H.W.; Scarlett, B. Determining granule strength as a function of moisture content. Powder Technol. 2002, 124, 195–200. [Google Scholar] [CrossRef]
  3. Russell, A.R.; Muir Wood, D. Point load tests and strength measurements for brittle spheres. Int. J. Rock Mech. Min. Sci. 2009, 46, 272–280. [Google Scholar] [CrossRef]
  4. Tang, C.A.; Xu, X.H.; Kou, S.Q.; Lindqvist, P.-A.; Liu, H.Y. Numerical investigation of particle breakage as applied to mechanical crushing—Part I: Single-particle breakage. Int. J. Rock Mech. Min. Sci. 2001, 38, 1147–1162. [Google Scholar] [CrossRef]
  5. Tsoungui, O.; Vallet, D.; Charmet, J.-C.; Roux, S. Size effects in single grain fragmentation. Granul. Matter 1999, 2, 19–27. [Google Scholar] [CrossRef]
  6. Jaeger, J.C. Failure of rocks under tensile conditions. Int. J. Rock Mech. Min. Sci. Geomech. Abstr. 1967, 4, 219–227. [Google Scholar] [CrossRef]
  7. Shen, S.; Han, Y.; Hao, X.; Chen, P.; Li, A.; Wang, Y.; Zhang, J.; Feng, W.; Fei, J.; Jia, F. Analysis of the breakage characteristics of rice particle beds under confined compression tests. Powder Technol. 2023, 418, 118319. [Google Scholar] [CrossRef]
  8. Yu, M.; Wu, M.; Yang, X.; Lou, R.; Wang, F.; Li, H.; Wang, L. Effect of temperature on the evolution and distribution for particle size of loose broken coal during the uniaxial confined compression process. Fuel 2022, 318, 123592. [Google Scholar] [CrossRef]
  9. Liu, J.; Schönert, K. Modelling of interparticle breakage. Int. J. Miner. Process. 1996, 44–45, 101–115. [Google Scholar] [CrossRef]
  10. Schönert, K. The influence of particle bed configurations and confinements on particle breakage. Int. J. Miner. Process. 1996, 44–45, 1–16. [Google Scholar] [CrossRef]
  11. Liu, H.Y.; Kou, S.Q.; Lindqvist, P.-A. Numerical studies on the inter-particle breakage of a confined particle assembly in rock crushing. Mech. Mater. 2005, 37, 935–954. [Google Scholar] [CrossRef]
  12. Liburkin, R.; Portnikov, D.; Kalman, H. Comparing particle breakage in an uniaxial confined compression test to single particle crush tests—Model and experimental results. Powder Technol. 2015, 284, 344–354. [Google Scholar] [CrossRef]
  13. Kalman, H. Phenomenological study of particulate materials compression—From individual through bed compression to tableting. Powder Technol. 2020, 372, 161–177. [Google Scholar] [CrossRef]
  14. Li, Z.; Han, Y.; Li, H.; Li, A.; Fei, J.; Feng, W.; Sun, Z.; Ji, S.; Jia, F. Analysis of mechanical properties of rice particle beds in confined compression tests and stress transfer predictive model. Powder Technol. 2024, 445, 120135. [Google Scholar] [CrossRef]
  15. Yu, Y.; Zhao, G.; Ren, M. Numerical simulation study on particle breakage behavior of granular materials in confined compression tests. Particuology 2023, 74, 18–34. [Google Scholar] [CrossRef]
  16. Barrios, G.K.P.; Jiménez-Herrera, N.; Tavares, L.M. Simulation of particle bed breakage by slow compression and impact using a DEM particle replacement model. Adv. Powder Technol. 2020, 31, 2749–2758. [Google Scholar] [CrossRef]
  17. Jiménez-Herrera, N.; Barrios, G.K.P.; Tavares, L.M. Comparison of breakage models in DEM in simulating impact on particle beds. Adv. Powder Technol. 2018, 29, 692–706. [Google Scholar] [CrossRef]
  18. Jiang, H.; Zhou, Y.D.; Wang, J.T.; Zhang, C.H. Micromechanical investigation of particle breakage behavior in confined compression tests. Comput. Geotech. 2021, 133, 104075. [Google Scholar] [CrossRef]
  19. Han, Y.; Li, G.; Jia, F.; Meng, X.; Chu, Y.; Chen, P.; Bai, S.; Zhao, H. Analysis of breakage behavior of rice under impact. Powder Technol. 2021, 394, 533–546. [Google Scholar] [CrossRef]
  20. Han, Y.; Zhao, D.; Chu, Y.; Zhen, J.; Li, G.; Zhao, H.; Jia, F. Breakage behaviour of single rice particles under compression and impact. Adv. Powder Technol. 2021, 32, 4635–4650. [Google Scholar] [CrossRef]
  21. Lizhang, X.; Yaoming, L.; Zheng, M.; Zhan, Z.; Chenghong, W. Theoretical analysis and finite element simulation of a rice kernel obliquely impacted by a threshing tooth. Biosyst. Eng. 2013, 114, 146–156. [Google Scholar] [CrossRef]
  22. Deng, D. Research on Crack Propagation of Composite Materials Based on Cohesive Zone Model. Master’s Thesis, Civil Aviation University, Tianjin, China, 2021. [Google Scholar] [CrossRef]
  23. Zhang, J.; Zhang, X. An efficient approach for predicting low-velocity impact force and damage in composite laminates. Compos. Struct. 2015, 130, 85–94. [Google Scholar] [CrossRef]
  24. Wang, Z.; Guo, R.; Zhang, P.; Shi, J.; Li, C.; Hong, B.; Xian, G. Transverse low-velocity impact behaviors of pultruded carbon-fiber-reinforced polymer rods with tensile preloads: Experiment and simulation. Compos. Part B Eng. 2024, 283, 111672. [Google Scholar] [CrossRef]
  25. Ma, G.; Chen, Y.; Yao, F.; Zhou, W.; Wang, Q. Evolution of particle size and shape towards a steady state: Insights from FDEM simulations of crushable granular materials. Comput. Geotech. 2019, 112, 147–158. [Google Scholar] [CrossRef]
  26. Pettersson, S.; Engqvist, J.; Hall, S.; Toft, N.; Hallberg, H. Peel testing of a packaging material laminate studied by in-situ X-ray tomography and cohesive zone modeling. Int. J. Adhes. Adhes. 2019, 95, 102428. [Google Scholar] [CrossRef]
  27. Xiong, W.; Wang, Z.; Wang, J. Tomography-based DEM simulation of Fujian River sand considering multiscale particle morphology. Comput. Geotech. 2025, 182, 107151. [Google Scholar] [CrossRef]
  28. Mohapatra, D.; Bal, S. Physical Properties of Indica Rice in Relation to Some Novel Mechanical Properties Indicating Grain Characteristics. Food Bioproc. Technol. 2011, 5, 2111–2119. [Google Scholar] [CrossRef]
  29. Chen, P.; Jia, F.; Han, Y.; Meng, X.; Li, A.; Chu, Y.; Zhao, H. Study on the segregation of brown rice and rice husks mixture in inclined chute flow. Powder Technol. 2022, 404, 117393. [Google Scholar] [CrossRef]
  30. Jiang, W.; Hallett, S.R.; Green, B.G.; Wisnom, M.R. A concise interface constitutive law for analysis of delamination and splitting in composite materials and its application to scaled notched tensile specimens. Int. J. Numer. Methods Eng. 2006, 69, 1982–1995. [Google Scholar] [CrossRef]
  31. Tian, D.; Gong, Y.; Zou, L.; Lin, W.; Zhang, J.; Zhao, L.; Hu, N. Determining cohesive parameters in an n-segment constitutive law of interfaces through DCB tests. Eng. Fract. Mech. 2023, 289, 109395. [Google Scholar] [CrossRef]
  32. Abdel-Monsef, S.; Tijs, B.H.; Renart, J.; Turon, A. Accurate simulation of delamination under mixed-mode loading using a multilinear cohesive law. Eng. Fract. Mech. 2023, 284, 109233. [Google Scholar] [CrossRef]
  33. De Moura, M.F.S.F.; Campilho, R.D.S.G.; Gonçalves, J.P.M. Mixed-mode cohesive damage model applied to the simulation of the mechanical behaviour of laminated composite adhesive joints. J. Adhes. Sci. Technol. 2009, 23, 1477–1491. [Google Scholar] [CrossRef][Green Version]
  34. Doitrand, A.; Estevez, R.; Leguillon, D. Comparison between cohesive zone and coupled criterion modeling of crack initiation in rhombus hole specimens under quasi-static compression. Theor. Appl. Fract. Mech. 2019, 99, 51–59. [Google Scholar] [CrossRef]
  35. Camanho, P.P.; Davila, C.G.; de Moura, M.F. Numerical simulation of mixed-mode progressive delamination in composite materials. J. Compos. Mater. 2003, 37, 1415–1438. [Google Scholar] [CrossRef]
  36. Le Goff, E.; Bois, C.; Wargnier, H. A progressive intra-and inter-laminar damage model to predict the effect of out-of-plane confinement on pin-bearing behaviour of laminated composites. J. Compos. Mater. 2017, 51, 433–450. [Google Scholar] [CrossRef]
  37. Vandellos, T.; Huchette, C.; Carrere, N. Proposition of a framework for the development of a cohesive zone model adapted to carbon-fiber reinforced plastic laminated composites. Compos. Struct. 2013, 105, 199–206. [Google Scholar] [CrossRef]
  38. Vereecke, J.; Bois, C.; Wahl, J.C.; Briand, T.; Ballère, L.; Lavelle, F. Explicit modelling of meso-scale damage in laminated composites–Comparison between finite fracture mechanics and cohesive zone model. Compos. Sci. Technol. 2024, 253, 110640. [Google Scholar] [CrossRef]
  39. Bellali, M.A.; Serier, B.; Mokhtari, M.; Campilho, R.D.; Lebon, F.; Fekirini, H. XFEM and CZM modeling to predict the repair damage by composite patch of aircraft structures: Debonding parameters. Compos. Struct. 2021, 266, 113805. [Google Scholar] [CrossRef]
  40. Wei, L.; Chen, J. An integrated modeling of barely visible impact damage imaging of CFRP laminates using pre-modulated waves and experimental validation. Compos. Struct. 2023, 304, 116372. [Google Scholar] [CrossRef]
  41. Bouhala, L.; Makradi, A.; Belouettar, S.; Younes, A.; Natarajan, S. An XFEM/CZM based inverse method for identification of composite failure parameters. Comput. Struct. 2015, 153, 91–97. [Google Scholar] [CrossRef]
  42. Bostancı, S.M.; Gürses, E.; Çöker, D. Finite Element Modelling of TBC Failure Mechanisms by Using XFEM and CZM. Procedia Struct. Integr. 2019, 21, 91–100. [Google Scholar] [CrossRef]
  43. Abaqus FEA; Abaqus Inc.: Providence, RI, USA, 2017.
  44. Benzeggagh, M.L.; Kenane, M. Measurement of mixed-mode delamination fracture toughness of unidirectional glass/epoxy composites with mixed-mode bending apparatus. Compos. Sci. Technol. 1996, 56, 439–449. [Google Scholar] [CrossRef]
  45. Kamst, G.F.; Vasseur, J.; Bonazzi, C.; Bimbenet, J.J. A new method for the measurement of the tensile strength of rice grains by using the diametral compression test. J. Food Eng. 1999, 40, 227–232. [Google Scholar] [CrossRef]
  46. Liu, J.; Song, T. FEM analysis of stability of RC spherical shell considering non-linear factors. Build. Sci. 2017, 33, 1–6. [Google Scholar] [CrossRef]
  47. Munjiza, A.; John, N.W.M. Mesh size sensitivity of the combined FEM/DEM fracture and fragmentation algorithms. Eng. Fract. Mech. 2002, 69, 281–295. [Google Scholar] [CrossRef]
  48. Turon, A.; Dávila, C.G.; Camanho, P.P.; Costa, J. An engineering solution for mesh size effects in the simulation of delamination using cohesive zone models. Eng. Fract. Mech. 2007, 74, 1665–1682. [Google Scholar] [CrossRef]
  49. Guo, L.; Xiang, J.; Latham, J.-P.; Izzuddin, B. A numerical investigation of mesh sensitivity for a new three-dimensional fracture model within the combined finite-discrete element method. Eng. Fract. Mech. 2016, 151, 70–91. [Google Scholar] [CrossRef]
  50. Hamoda, A.; Abadel, A.A.; Shahin, R.I.; Ahmed, M.; Baktheer, A.; Yehia, S.A. Shear strengthening of simply supported deep beams using galvanized corrugated sheet filled with high-performance concrete. Case Stud. Constr. Mater. 2024, 21, e04085. [Google Scholar] [CrossRef]
  51. Wei, Y.; Luo, Q.; Li, Q.; Sun, G. On adhesively bonded joints with a mixed failure mode—An experimental and numerical study. Thin-Walled Struct. 2023, 192, 110987. [Google Scholar] [CrossRef]
  52. Thakur, M.M.; Penumadu, D. Triaxial compression in sands using FDEM and micro-X-ray computed tomography. Comput. Geotech. 2020, 124, 103638. [Google Scholar] [CrossRef]
  53. Thakur, M.M.; Penumadu, D.; Bauer, C. Capillary Suction Measurements in granular materials and direct numerical simulations using X-Ray computed tomography microstructure. J. Geotech. Geoenviron. Eng. 2020, 146, 04019121. [Google Scholar] [CrossRef]
  54. Amirrahmat, S.; Druckrey, A.M.; Alshibli, K.A.; Al-Raoush, R.I. Micro shear bands: Precursor for strain localization in sheared granular materials. J. Geotech. Geoenviron. Eng. 2019, 145, 04018104. [Google Scholar] [CrossRef]
  55. Amirrahmat, S.; Alshibli, K.A.; Jarrar, M.F.; Zhang, B.; Regueiro, R.A. Equivalent continuum strain calculations based on 3D particle kinematic measurements of sand. Int. J. Numer. Anal. Methods Geomech. 2018, 42, 999–1015. [Google Scholar] [CrossRef]
  56. Cheng, Z.; Wang, J. Experimental investigation of inter-particle contact evolution of sheared granular materials using X-ray micro-tomography. Soils Found. 2018, 58, 1492–1510. [Google Scholar] [CrossRef]
  57. Borja, R.I.; Song, X.; Rechenmacher, A.L.; Abedi, S.; Wu, W. Shear band in sand with spatially varying density. J. Mech. Phys. Solids 2013, 61, 219–234. [Google Scholar] [CrossRef]
  58. Zhai, C.; Herbold, E.B.; Hall, S.A.; Hurley, R.C. Particle rotations and energy dissipation during mechanical compression of granular materials. J. Mech. Phys. Solids 2019, 129, 19–38. [Google Scholar] [CrossRef]
  59. Thakur, M.M.; Penumadu, D. Sensitivity analysis of pore morphology method and Xray CT imaging in SWCC predictions for Ottawa Sand. In Advances in Computer Methods and Geomechanics; Prashant, A., Sachan, A., Desai, C.S., Eds.; Springer: Singapore, 2020; pp. 105–119. [Google Scholar]
  60. Kang, G.; Ning, Y.; Liu, R.; Chen, P.; Pang, S. Simulation of force chains and particle breakage of granular material by numerical manifold method. Powder Technol. 2021, 390, 464–472. [Google Scholar] [CrossRef]
  61. Hardin, B.O. 1-D strain in normally consolidated cohesionless soils. J. Geotech. Eng. 1987, 113, 1449–1467. [Google Scholar] [CrossRef]
  62. McDowell, G.R.; Bolton, M.D. On the micromechanics of crushable aggregates. Géotechnique 1998, 48, 667–679. [Google Scholar] [CrossRef]
  63. Nakata, Y.; Hyodo, M.; Hyde, A.F.; Kato, Y.; Murata, H. Microscopic particle crushing of sand subjected to high pressure one-dimensional compression. Soils Found. 2001, 41, 69–82. [Google Scholar] [CrossRef]
  64. Zhu, Z.; Wang, J.; Wu, M. DEM simulation of particle crushing in a triaxial test considering the influence of particle morphology and coordination number. Comput. Geotech. 2022, 148, 104769. [Google Scholar] [CrossRef]
  65. Shi, D.; Zheng, L.; Xue, J.; Sun, J. DEM modeling of particle breakage in silica sands under one-dimensional compression. Acta Mech. Solida Sin. 2016, 29, 78–94. [Google Scholar] [CrossRef]
  66. Zhang, S.; Tong, C.X.; Li, X.; Sheng, D. A new method for studying the evolution of particle breakage. Géotechnique 2015, 65, 911–922. [Google Scholar] [CrossRef]
  67. McDowell, G.R.; de Bono, J.P. On the micro mechanics of one-dimensional normal compression. Géotechnique 2013, 63, 895–908. [Google Scholar] [CrossRef]
Figure 1. (a) Brown rice and model simplification; (b) Experimental container.
Agriculture 16 00208 g001
Figure 2. (a) Flowchart for generating zero-thickness cohesive elements; (b) Bilinear cohesive constitutive relationship; (c) Damage in cohesive elements.
Agriculture 16 00208 g002
Figure 3. (a) Single-particle compression experiment; (b) Single-particle simulation experiment; (c) Comparison of Numerical simulation and Experimental results.
Agriculture 16 00208 g003
Figure 4. Grid sensitivity analysis: (a) Force–displacement curves under different grid sizes; (b) Calculate the time first for different grid sizes.
Agriculture 16 00208 g004
Figure 5. The process from the construction of a single particle model to the construction of a particle group model.
Agriculture 16 00208 g005
Figure 6. CT scanning Principle and model Reconstruction: (a) CT scanning chamber and experimental samples; (b) Scanning principle; (c) Micro-CT three-dimensional reconstruction and measurement.
Agriculture 16 00208 g006
Figure 7. (a) Particle bed compression experiment; (b) Load–displacement curves at different pressures; (c) Breaking probabilities of each layer.
Agriculture 16 00208 g007
Figure 8. (a) The crushing morphology of the three types; (b) The particle state at the top of the load after compression.
Agriculture 16 00208 g008
Figure 9. Crushing probabilities of different crushing morphologies under different lateral compression.
Agriculture 16 00208 g009
Figure 10. Compression process from 0 to 8.44 mm: (a) Limit compression process; (b) Axial stress conduction; (c) Stress variation in the axial section during compression.
Agriculture 16 00208 g010
Figure 11. Stress variation in the radial cross-section under pressure.
Agriculture 16 00208 g011
Figure 12. (a) Average stress variations across layers at the moment of compression; (b) Relationship between porosity ratio and compressive stress.
Agriculture 16 00208 g012
Figure 13. Damage during the compression process.
Agriculture 16 00208 g013
Figure 14. Particle contact and fragmentation process: (a) Particle 18; (b) Particle 9.
Agriculture 16 00208 g014
Figure 15. Stress Variation During Particle Compression and Crushing: Particle 18, Particle 9.
Agriculture 16 00208 g015
Figure 16. Process of particle-to-particle collision and contact changes during fragmentation.
Agriculture 16 00208 g016
Figure 17. (a) Extraction positions of different cross-sections for Particle 21 and contact points on the particle; (b) Evolution of stress contour plots at 45°, 90°, and 135° cross-sections along the longitudinal axis.
Agriculture 16 00208 g017
Table 1. Material parameters used in numerical simulations.
NameParametersValue
PlexiglassDensity (kg m−3)1.2 × 10³
Poisson’s ratio0.3
Young’s modulus (MPa)3.2 × 10³
RiceDensity (kg m−3)1.55 × 10³
Poisson’s ratio0.3
Young’s modulus (MPa)1.1 × 10³
Nominal stress (N)3.3
Cohesive stiffness (MPa)126.9
Disclaimer/Publisher’s Note: The statements, opinions and data contained in all publications are solely those of the individual author(s) and contributor(s) and not of MDPI and/or the editor(s). MDPI and/or the editor(s) disclaim responsibility for any injury to people or property resulting from any ideas, methods, instructions or products referred to in the content.