Article

Pumpkin Seedling Leaf Vein Extraction System Based on Deep Learning and Rule-Based Methods

1
College of Mechanical and Electrical Engineering, Hebei Agricultural University, Baoding 071000, China
2
Hebei Provincial Innovation Center for Intelligent Agricultural Equipment, Baoding 071000, China
3
School of Information and Artificial Intelligence, Hebei Finance University, Baoding 071000, China
4
College of Horticulture, Hebei Agricultural University, Baoding 071001, China
5
Collaborative Innovation Center of Vegetable Industry in Hebei, Baoding 071001, China
*
Author to whom correspondence should be addressed.
Agriculture 2026, 16(2), 194; https://doi.org/10.3390/agriculture16020194
Submission received: 11 December 2025 / Revised: 4 January 2026 / Accepted: 6 January 2026 / Published: 12 January 2026
(This article belongs to the Section Artificial Intelligence and Digital Agriculture)

Abstract

Pumpkin seedlings serve as rootstocks for watermelon grafting, and the partial leaf trimming operation performed approximately two days before grafting is crucial for the survival rate of grafted watermelon seedlings. Extracting the position of the main veins of the leaf is a prerequisite for achieving automated partial pruning. The existing methods have problems such as low segmentation accuracy and misclassification between primary and branch veins in the pumpkin seedling segmentation task. This study proposes a three-classification segmentation model Dynamic Region Enhancement Transformer (DRE-Former) of main vein, branch vein and background, as well as a post-processing system. The encoder of DRE-Former consists of two modules. The former is Dynamic Frequency Conv and Normalized Efficient Conv (DN Block), which can enhance the feature extraction ability for small targets. The latter is the Region Transformer Block, which enhances the ability to distinguish between the main vein and the branch vein. In addition, in the skip connection part of the model, a Skip Connection Fusion Block (SCF Block) has been added, which can reduce the dilution degree of detailed features. The post-processing section outputs the cutting position and cutting Angle through rule-based methods and geometric analysis. The experimental results show that the proposed model achieves mean Intersection-over-Union (mIoU) and Overall Accuracy (OA) of 90.80% and 95.88%, respectively, outperforming the comparative models. In stability and error testing, the average standard deviation is 0.60, and the average relative error is 11.90%. Compared with the primary mIoU data in the dataset, the average relative error differs by only 2.11%. The post-processing system enables the accurate determination of cutting positions and angles, but it has a strong dependence on the segmentation model. The research can provide reliable technical support for the subsequent automatic cutting equipment for pumpkin seedlings.

1. Introduction

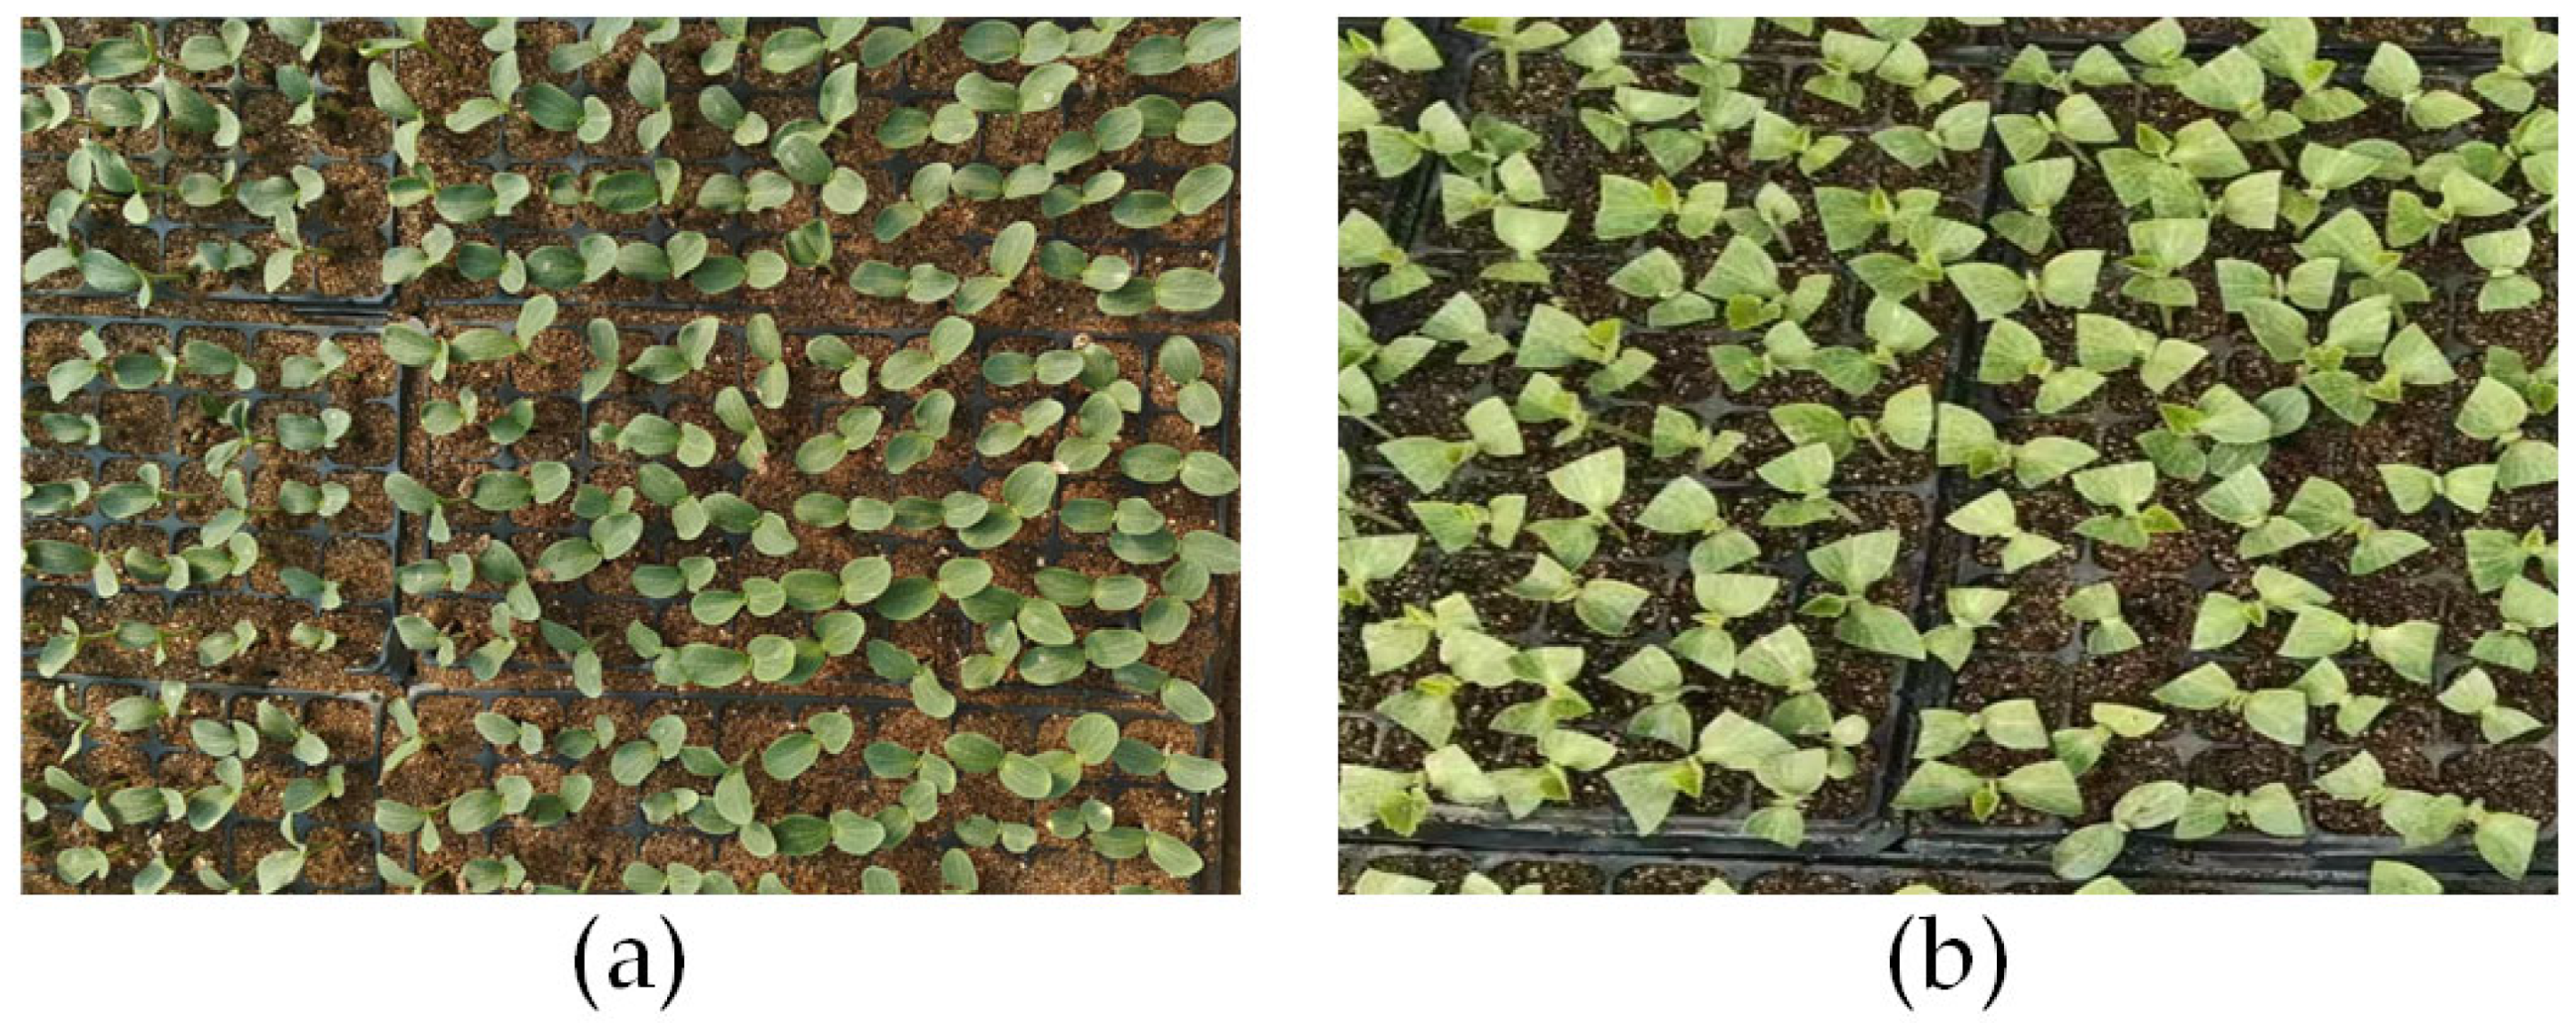
Grafting techniques are widely employed in watermelon cultivation, with pumpkin seedlings serving as one of the primary rootstocks for watermelon grafting [1,2,3]. The primary objectives of watermelon grafting include addressing Fusarium wilt and root-knot nematode infestations [4,5], enhancing nutrient use efficiency [6], improving tolerance to salinity [7], cold, and drought [8,9], as well as increasing yield [10]. The most prevalent commercial grafting methods for watermelon are hole-insertion grafting method and splice grafting method [11]. To improve the survival rate of grafted watermelon seedlings, approximately two days before grafting, the rootstock seedlings are trimmed by cutting away one-third to one-half of the cotyledon along the perpendicular to the main vein. This operation helps reserve more nutrients for graft union healing, thereby enhancing the survival rate of the scion. Experiments have shown that this practice can increase the survival rate of watermelon seedlings by 7.8% to 11% [12]. However, the entire trimming process is performed manually, leading to additional labor costs [13,14]. Moreover, manual operation is slow, labor-intensive, and results in inconsistent cut sizes, which significantly affects the quality of grafted seedlings. Therefore, automating the leaf-removal step for rootstock seedlings is crucial for improving grafting efficiency, reducing costs, and promoting sustainable industry development. Figure 1 shows the scenarios where the pumpkin rootstocks have not been cut and have been cut.
In the automation process, determining the cutting position is a prerequisite, which in turn depends on accurate vein localization. Thus, vein extraction becomes a key step. Current 2D leaf vein segmentation methods can be broadly categorized into non-learning and learning-based approaches. Early research on non-learning methods for vein processing includes the work of Zheng et al. [15], who proposed using morphological operations combined with threshold segmentation for vein extraction, established the foundation of the method. Lee et al. [16] introduced the Fourier Transform (FFT), providing a novel perspective for vein segmentation. Bühler et al. [17] developed a leaf vein extraction tool that demonstrated a semi-automated processing approach. Although these methods have been continuously optimized [18,19,20,21], they generally rely on handcrafted features and predefined rules, resulting in limited generalization capability and poor robustness.
In recent years, Convolutional Neural Networks (CNNs) have been successfully applied to various computer vision tasks [22,23,24]. Xu et al. [25] used a convolutional neural network (CNN)-based deep learning algorithm to automatically segment leaf vein networks. Yang et al. [26] developed the PCAMP method to identify anthocyanin biosynthesis genes in rice pericarp and successfully located the key functional genes. Li et al. [27] introduced a self-supervised strategy to enhance model robustness. Iwamasa and Noshita [28] utilized leaf vein network features to reconstruct latent phenotypic spaces. Cai et al. [29] proposed the Cudu-Net model to enhance detail preservation capability. Deepalakshmi et al. [30] distinguished between healthy and diseased leaves through CNN-based feature extraction. Beikmohammadi et al. [31] developed a multi-stage deep CNN (SWP-LeafNET) for leaf identification. Zifen et al. [32] designed an asymmetric mixed convolution module to improve segmentation accuracy. Lu et al. [33] implemented leaf segmentation and feature extraction in multi-view time-series images. Although semantic segmentation has been widely applied in crop recognition [34,35,36,37], existing methods still face challenges in pumpkin seedling segmentation tasks, including difficulties in capturing delicate vein features and misclassification between main and branch veins. These limitations underscore the necessity for developing specialized models for pumpkin seedling vein segmentation.
In conclusion, this study aims to develop a specialized model for segmenting the leaf veins of pumpkin seedlings to address issues such as low segmentation accuracy and confusion between main and branch veins. Building on the segmentation results, a post-processing system that integrates rule-based methods and geometric analysis is proposed to determine the cutting position and angle with high stability and accuracy.

2. Materials and Methods

2.1. Materials

2.1.1. Image Acquisition

In this study, a Hikvision MV-CSS016-10UC camera (Hikrobo (a subsidiary of Hikvision), Hangzhou, China) paired with an MVL-HF5024M-10MP lens (Hikrobo (a subsidiary of Hikvision), Hangzhou, China) was selected as the data acquisition equipment to ensure high-quality image data with optimal clarity and color fidelity. The images were captured in a pumpkin seedling greenhouse located in Qingyuan District, Baoding City, Hebei Province, China, providing an authentic representation of the actual growth environment of pumpkin seedlings.
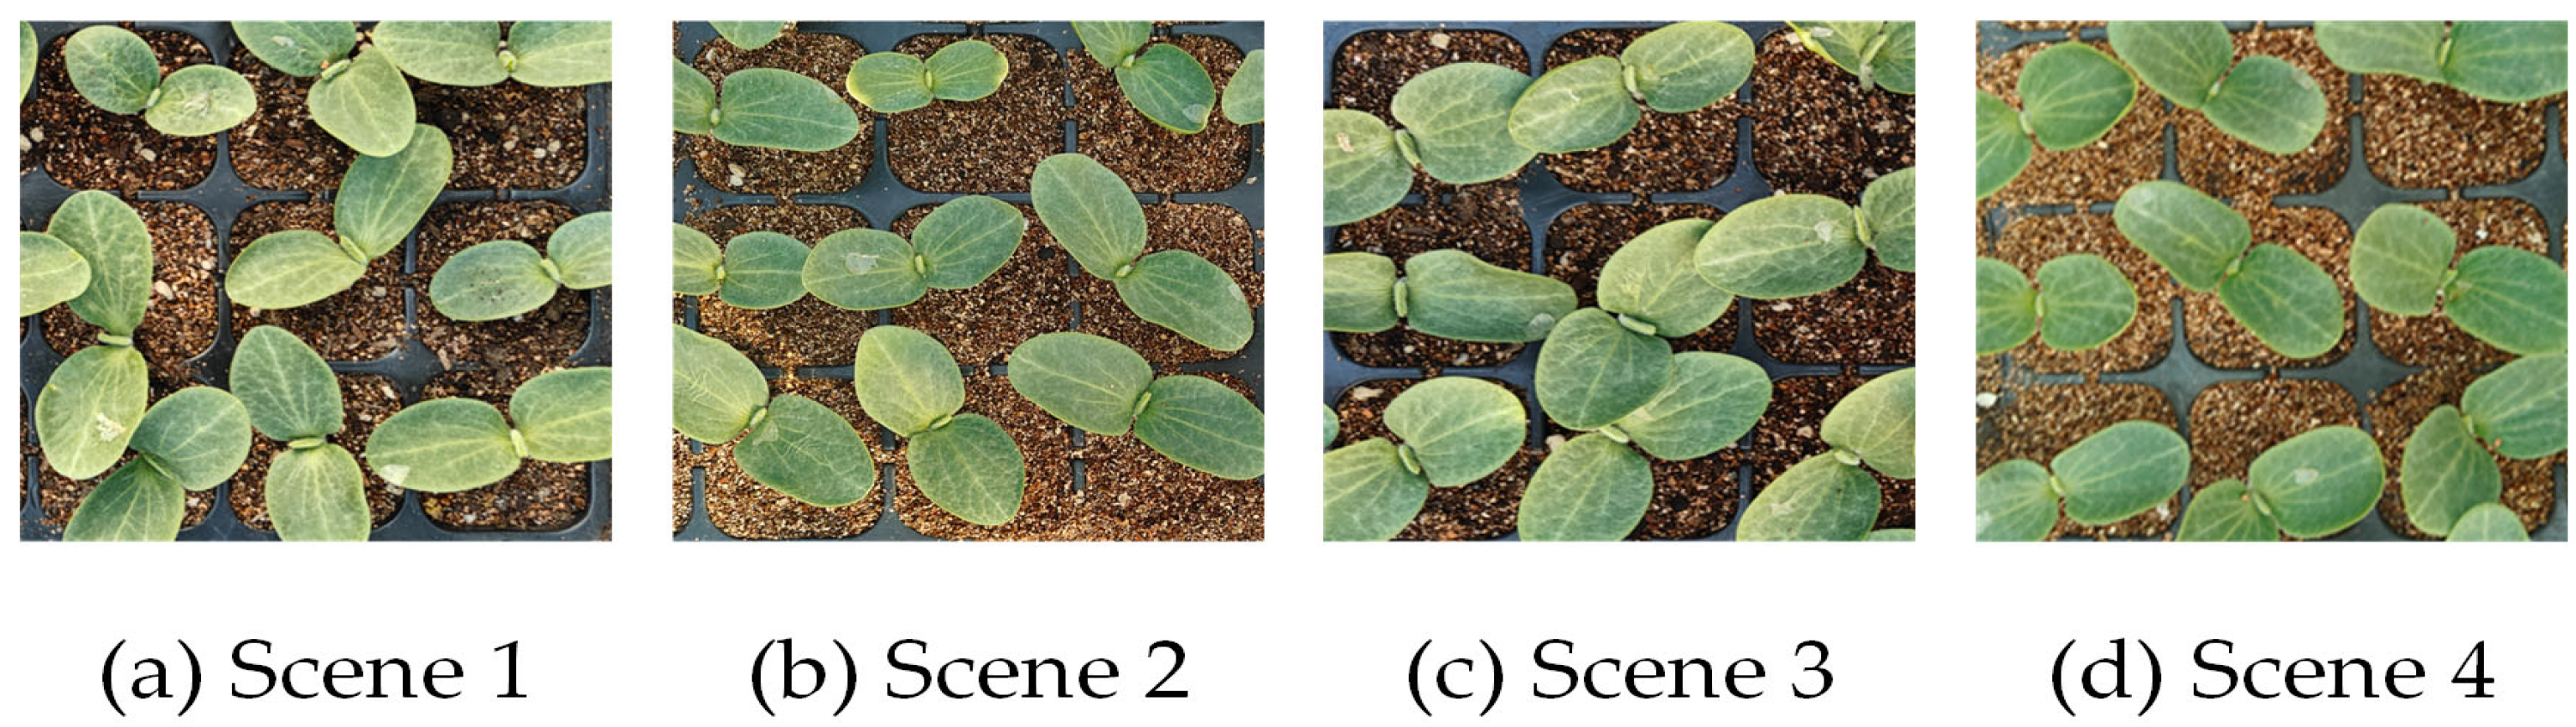
To mitigate excessive leaf inclination caused by phototropism, a nine-grid shooting method was adopted for dataset acquisition. A total of 800 pumpkin seedling images were collected under diverse greenhouse conditions, including different greenhouses, leaf occlusion, and the presence of disturbances on the leaves, thereby establishing a robust data foundation for subsequent research. Figure 2 illustrates representative samples from the dataset. The subgraphs (a)–(d) in Figure 2 clearly represent the pictures of pumpkin seedlings in four different greenhouse scenarios.

2.1.2. Dataset Processing

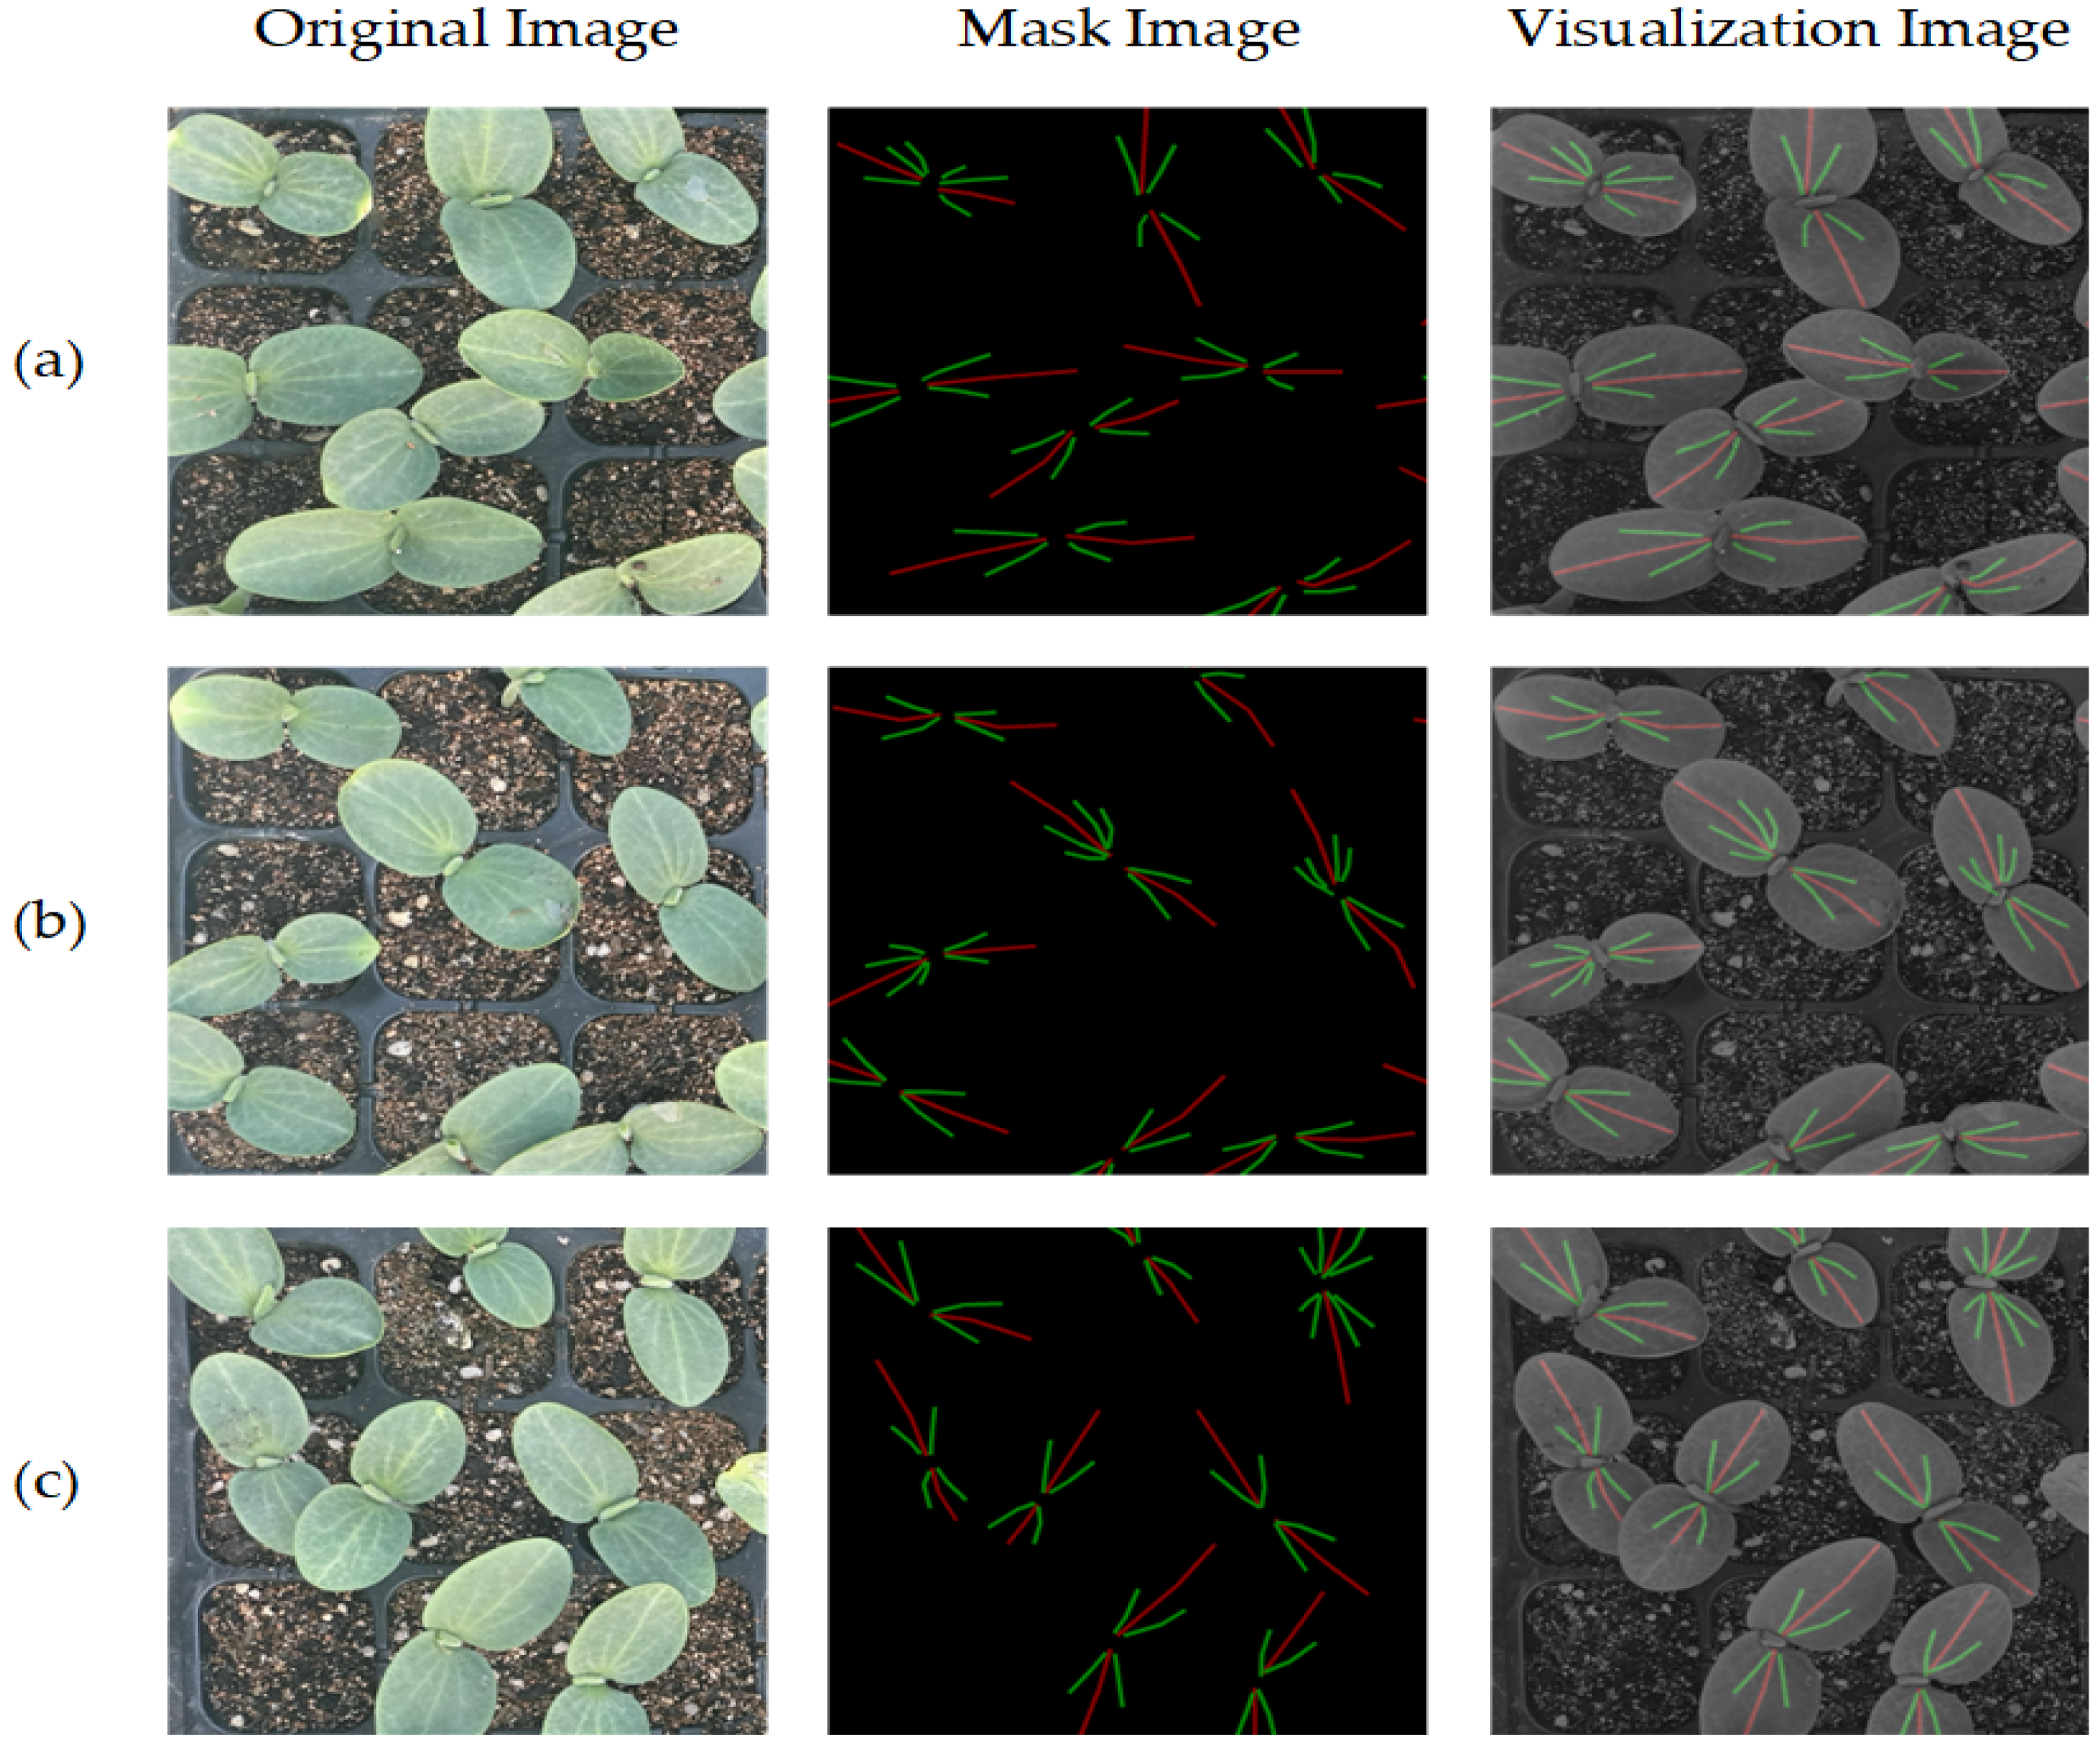
This study employs a deep learning-based semantic segmentation approach for vein extraction, for which high-quality annotated data are critical. Using the open-source annotation tool LabelMe, each pixel in the images was meticulously annotated into three categories: main vein, branch vein, and background. Figure 3 shows the specific annotation pictures.
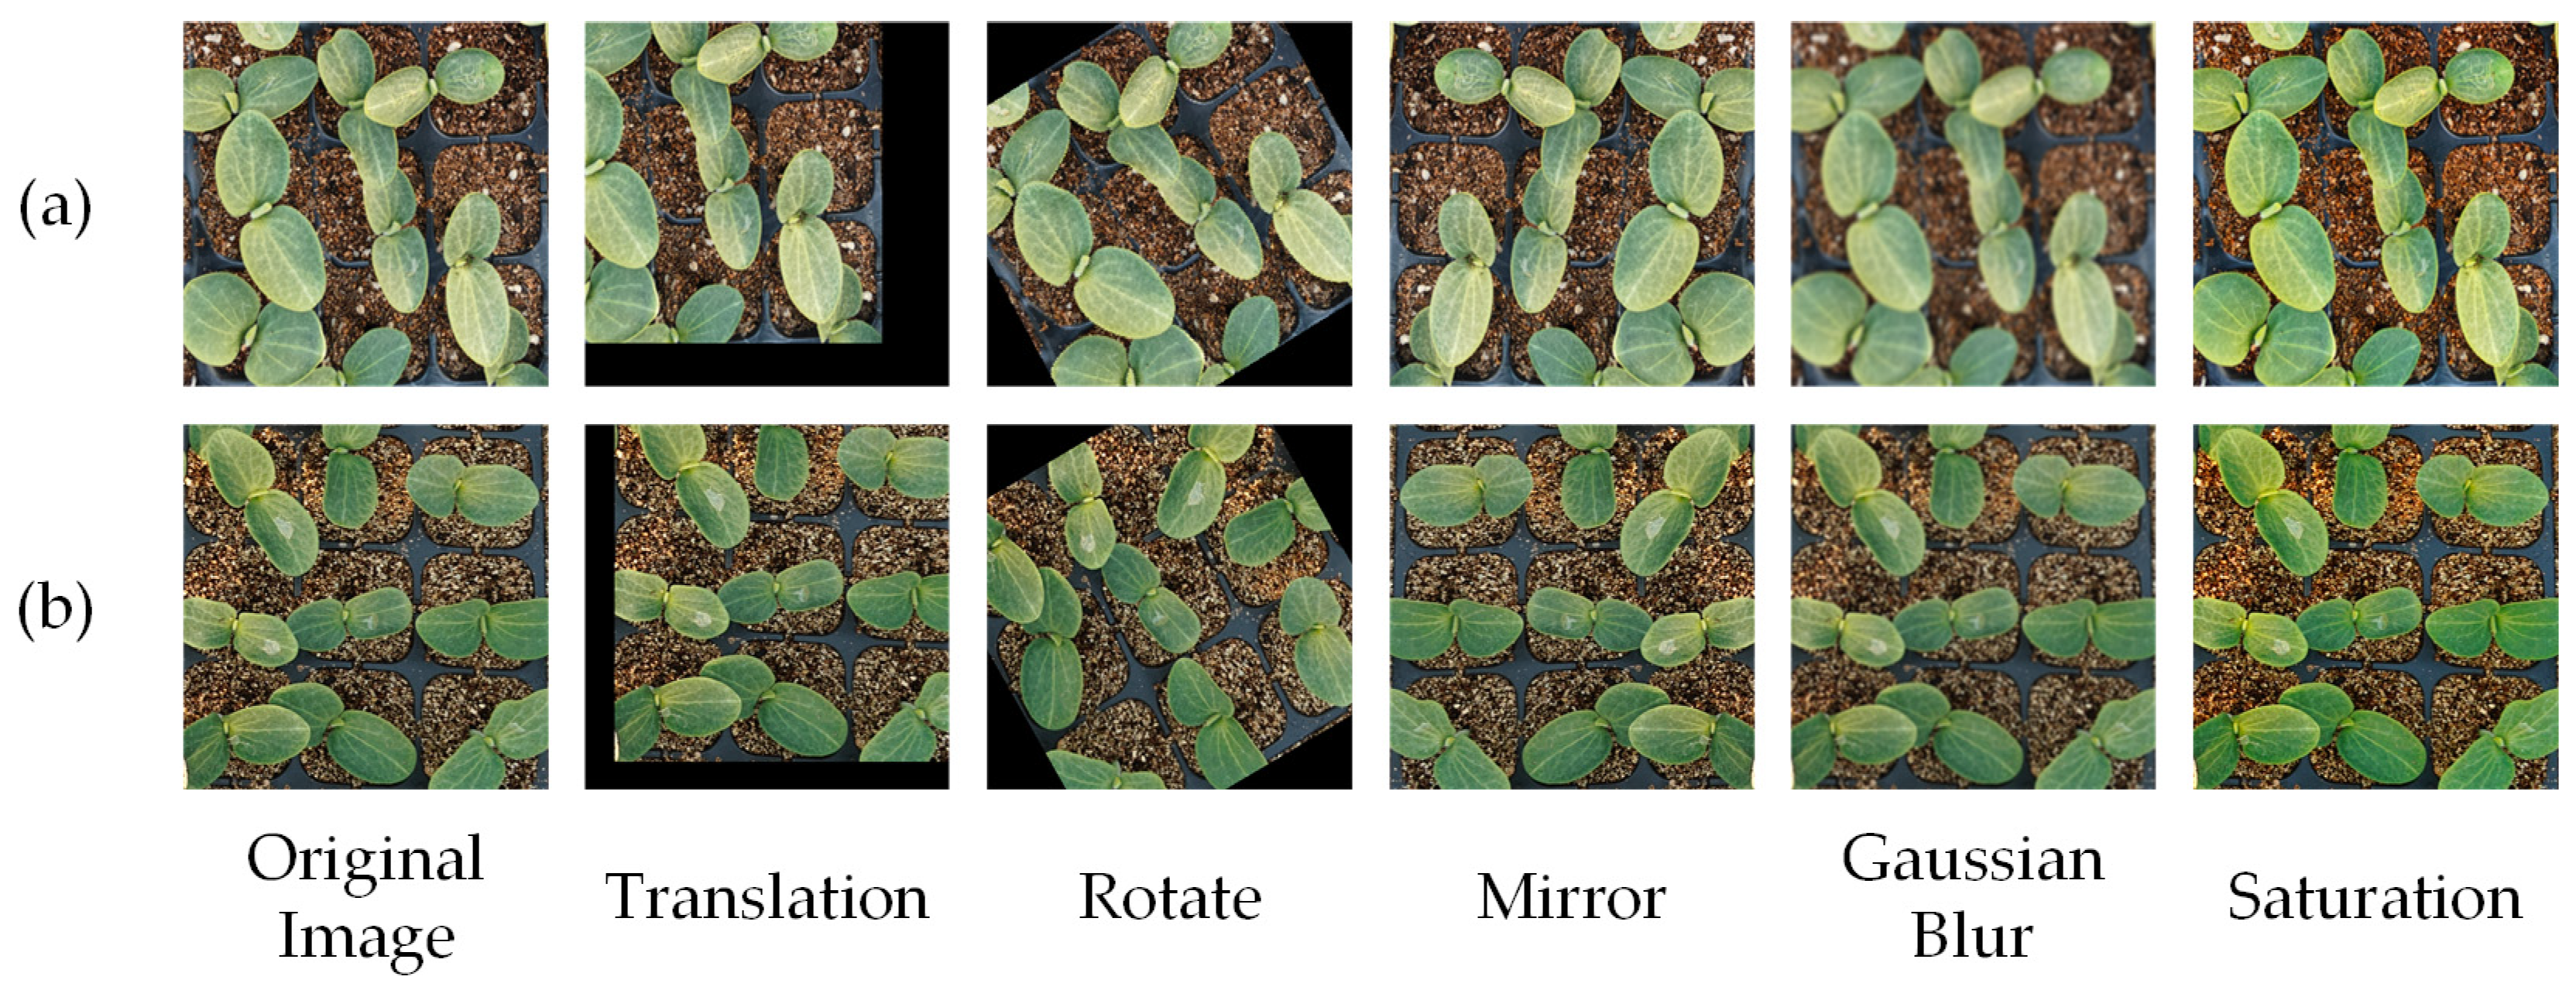
To enhance the model’s generalization capability, improve segmentation accuracy, and prevent overfitting, a series of data augmentation operations was applied to the original images, including translation, rotation, and mirroring. The enhanced quantity is 4763. The augmented dataset effectively expands data diversity and was randomly divided into training, validation, and test sets in an 8:1:1 ratio. Figure 4 demonstrates examples of augmented images. Where (a) and (b), respectively, represent the data augmentation of the first group and the second group, each group includes translation, rotation, mirroring, Gaussian blur and saturation adjustment.

2.2. Pumpkin Seedlings Vein Segmentation Model

There are many difficulties in the vein segmentation task of pumpkin seedlings, including insufficient feature extraction, irregular vein shapes, and similar features of the main and branch veins. This paper proposes a three-class vein segmentation model (DRE-Former), which can extract the main and branch veins well in the complex growth environment of pumpkin seedlings, thereby providing reliable input for the subsequent post-processing system.

2.2.1. Overall Architecture of DRE-Former

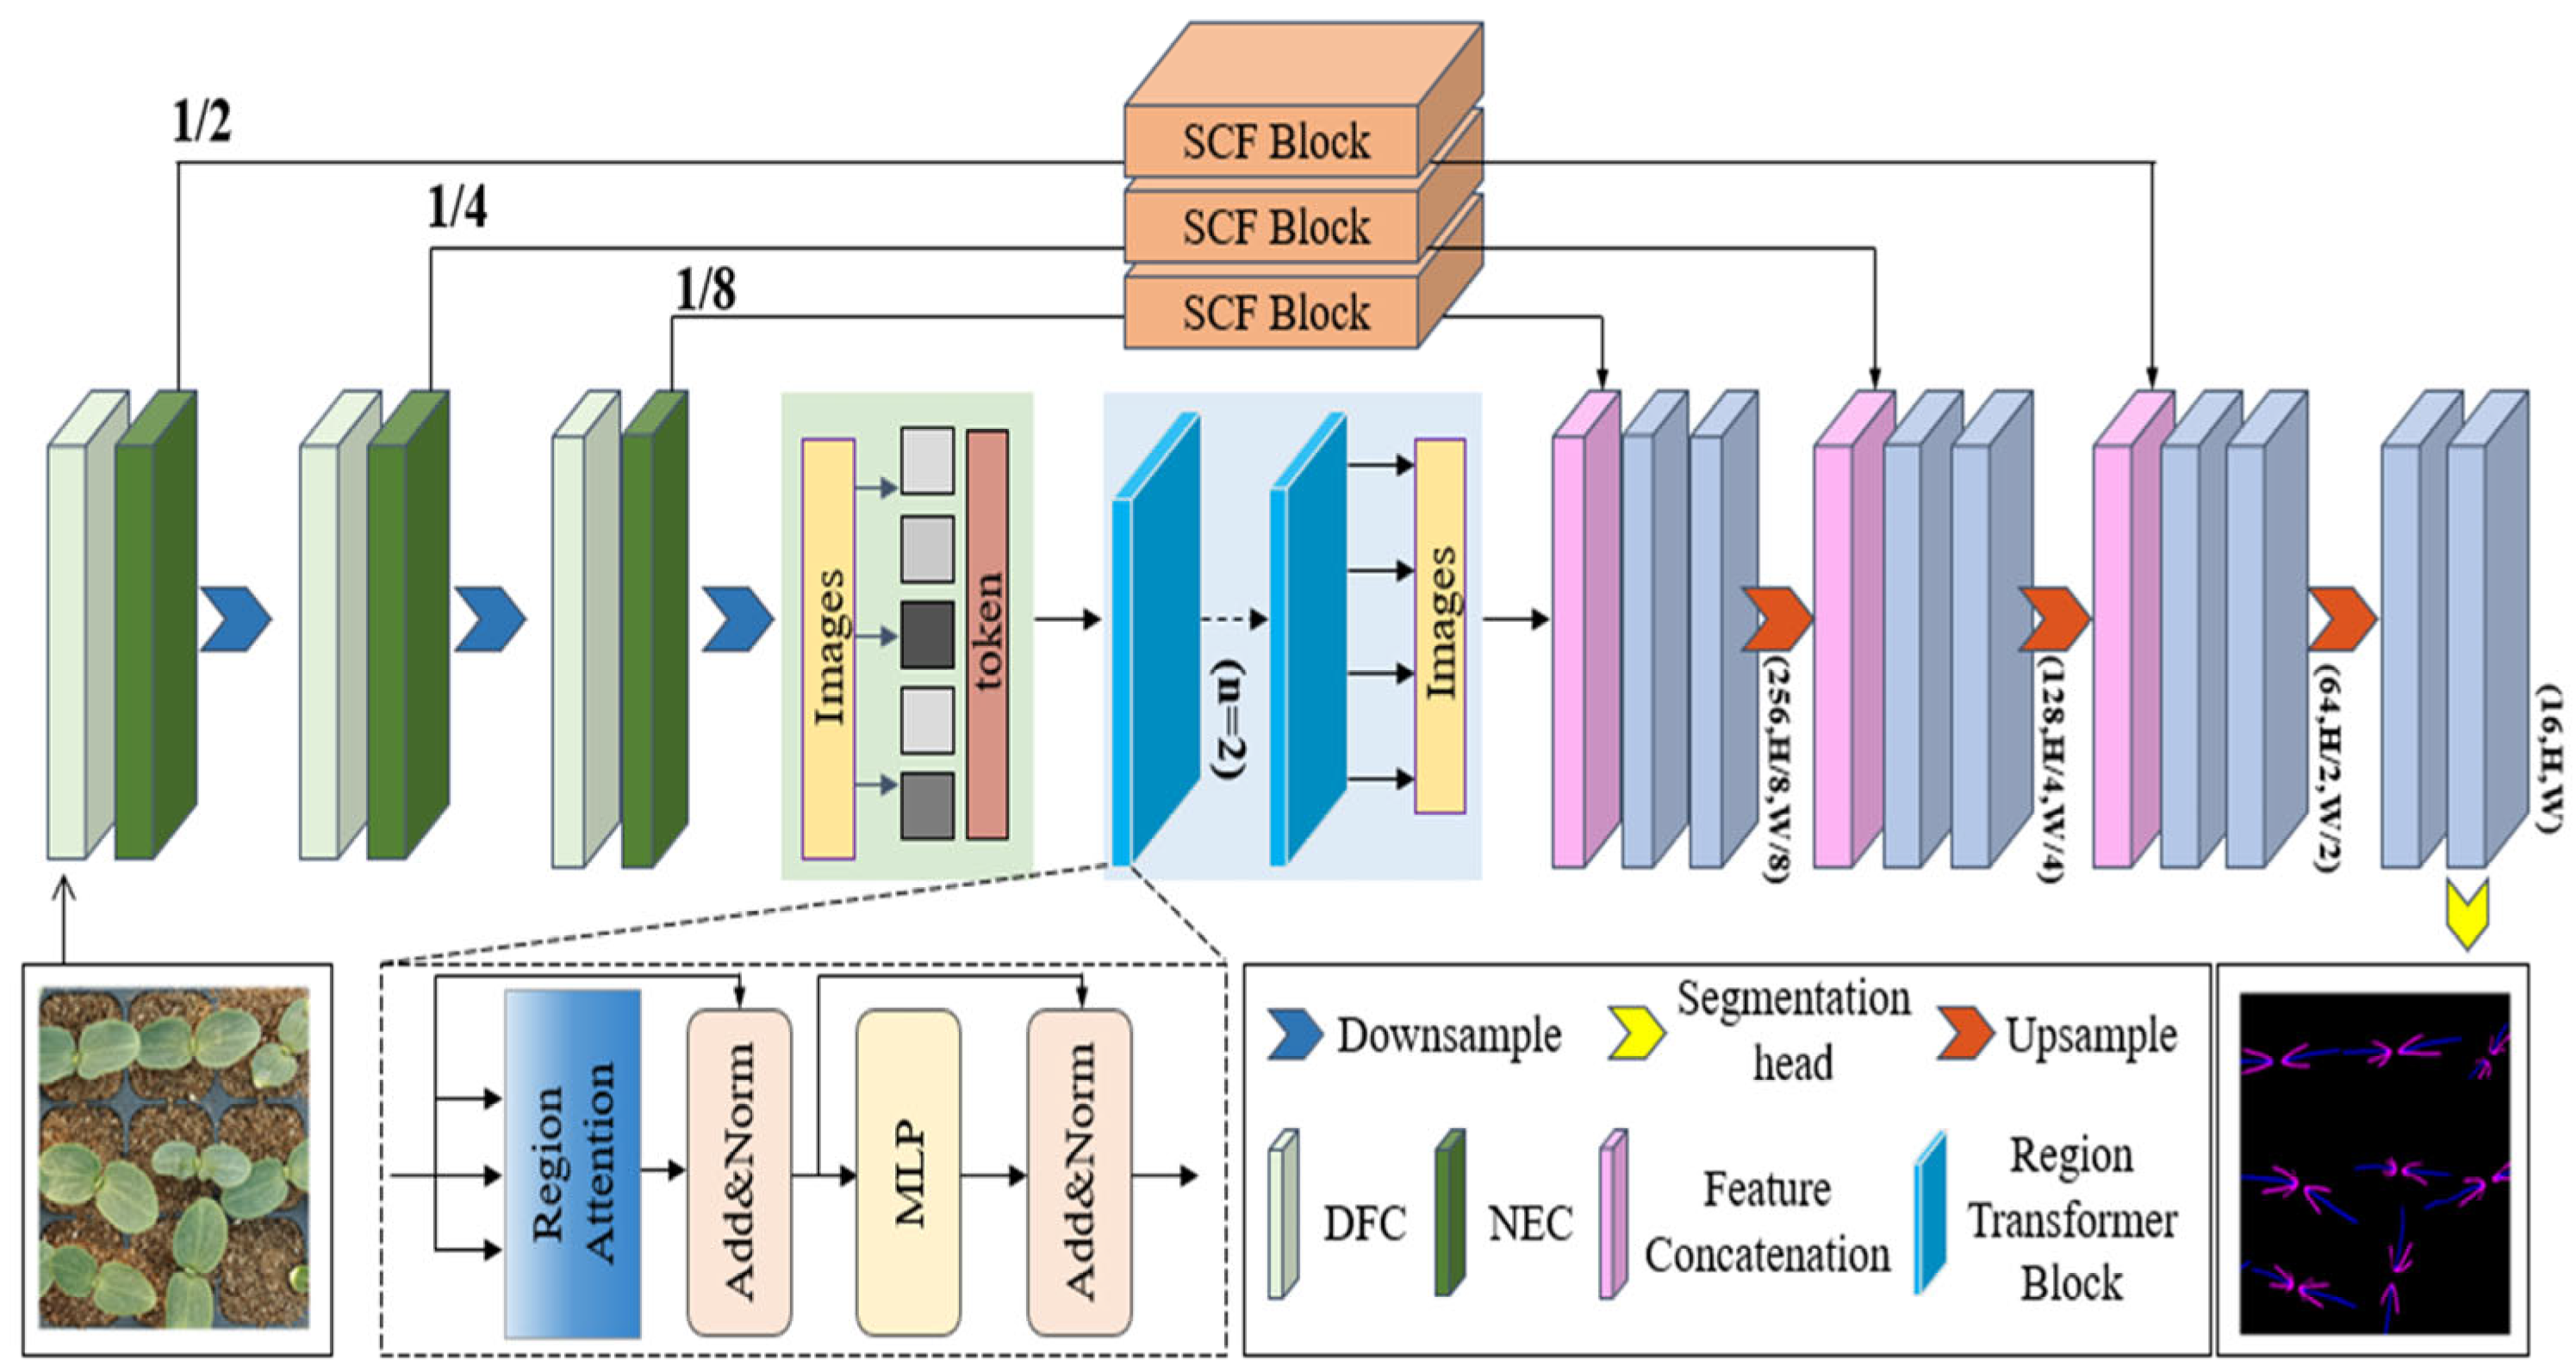
As shown in Figure 5, DRE-Former features a purposefully redesigned encoder–decoder architecture with enhanced skip connections. Unlike conventional hybrid CNN-Transformer models that primarily integrate modules in a sequential or parallel manner, DRE-Former introduces three core structural innovations tailored to the challenges of leaf vein segmentation namely, slender morphology, low contrast, and complex background texture.
The encoder synergistically combines DN Blocks and Region Transformer Blocks. First, the DN Block employs a dual-path mechanism (Dynamic Frequency Convolution and Normalized Efficient Convolution) to adaptively enhance discriminative vein features while suppressing irrelevant texture interference. Second, the Region Transformer Block replaces uniform patch division with semantic-aware region tokenization, allowing it to model long-range dependencies along continuous vein structures without fragmenting their topology. Third, these two blocks operate in a complementary refine and aggregate cascade, progressively reducing semantic gaps across scales through coordinated feature purification and structured aggregation.
In the decoder, the Skip Connection Fusion Block (SCF Block) performs bidirectional calibration between upsampled global features from the Transformer and local details from skip connections. This adaptive fusion mechanism preserves spatial precision across varying vein widths, overcoming the limitations of fixed-scale fusion strategies used in existing decoders.
Overall, this integrated design ensures robust feature extraction and superior topological preservation of vein networks under real greenhouse conditions, demonstrating that DRE-Former’s novelty lies not in mere module recombination, but in task-driven architectural synergy.

2.2.2. Dynamic Frequency Conv and Normalized Efficient Conv

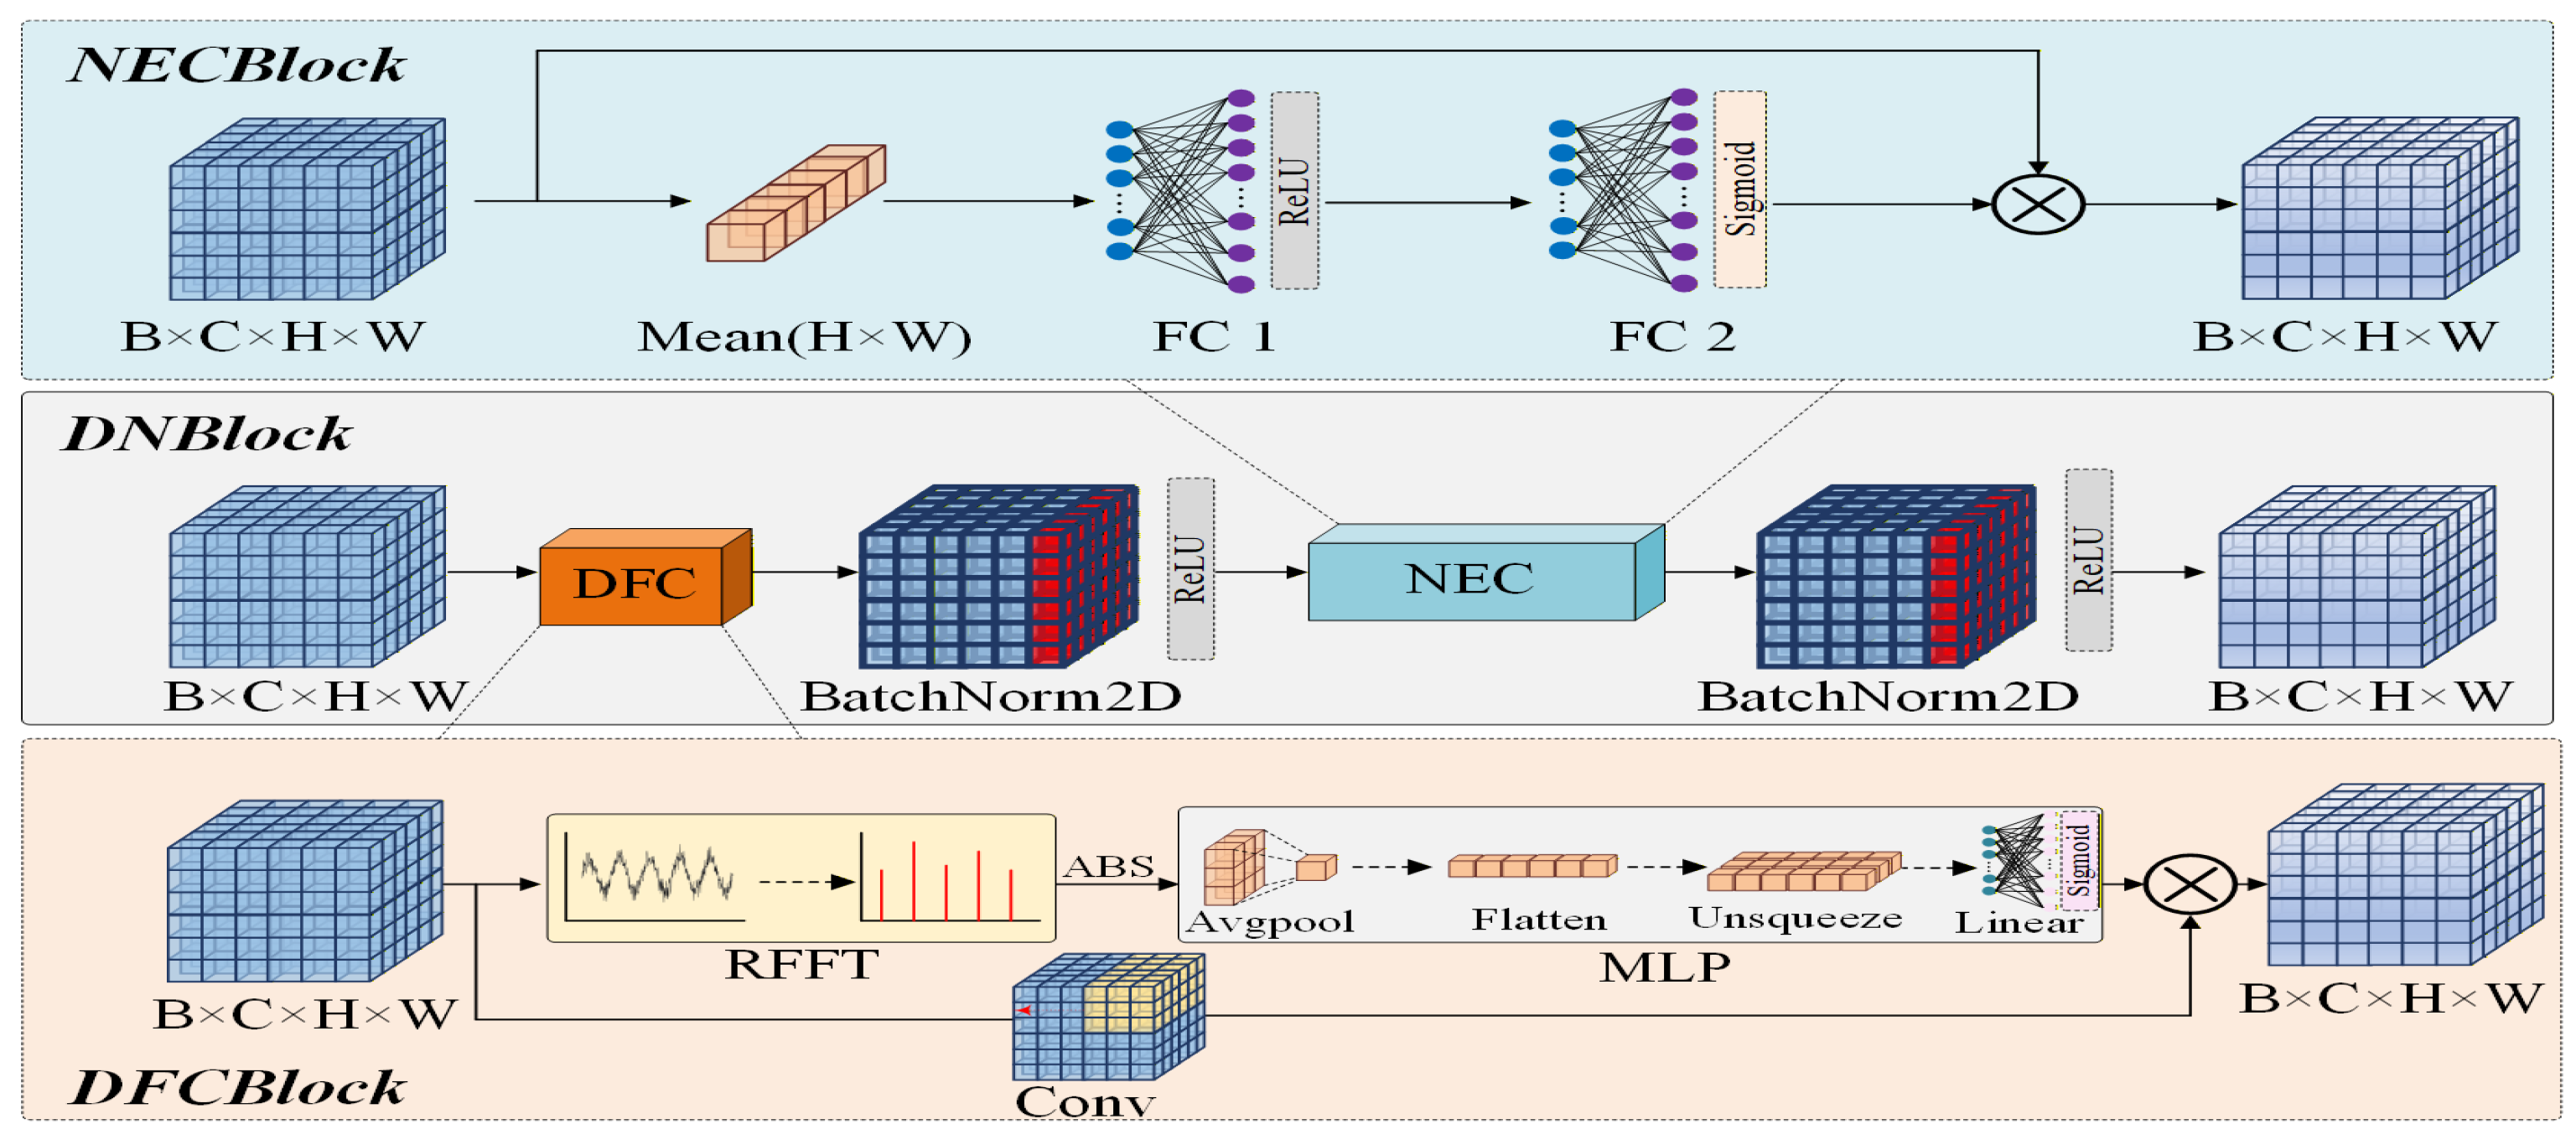
The existing feature extractors are mainly based on the traditional convolutional neural network CNN [38,39]. In the complex growth environment of pumpkin seedlings, it is difficult to fully extract the fine features of leaf veins, and the recognition ability for small targets is limited. For this problem, this study proposes a DN Block, which is mainly Dynamic Frequency Conv (DFC) and Normalized Efficient Conv (NEC). Through the dual optimization mechanism of space and channel, the fine structure of leaf veins can be captured more effectively, and the feature extraction performance of the model for the main and branch veins can be improved under complex background conditions. The detailed architecture of DN Block is shown in Figure 6.
  • Dynamic Frequency Convolution.
The DFC process is as follows: First, perform A fast Fourier transform (RFFT) on the input feature map and extract the amplitude spectrum A = | F F T ( X ) | . Then, generate the channel weight vector through adaptive pooling and multi-layer perceptron (MLP). Finally, dynamic feature enhancement is achieved via element-wise channel multiplication. For detailed formulations, refer to Equation (1).
Y freq = C base ( X ) σ ( M ( A v g P o o l ( A ) )
where X R C × H × W is input feature map, C base is the conventional convolution operation, M represents the weight generation MLP, σ is the Sigmoid activation function, and Y f r e q R C × H × W is output frequency-domain weighted feature.
2.
Normalized Efficient Conv.
The NEC process is using global average pooling to compress spatial dimensions to obtain statistical vector ( Z R C ), modeling channel dependencies through a bottleneck structure composed of two linear layers, and finally outputting reweighted features. For detailed formulations, refer to Equations (2) and (3).
M c = σ ( W 2 δ ( W 1 z ) )
Y n e c = X nec M c
where X nec R C × H × W is input feature map, W 1 R ( c r × c ) and W 2 R ( c × c r ) represent the linear transformation weights, r the compression ratio, σ denotes the Sigmoid activation function, δ indicates the ReLU activation function, and Y n e c R C × H × W is the output enhanced feature map.

2.2.3. Region Transformer Block

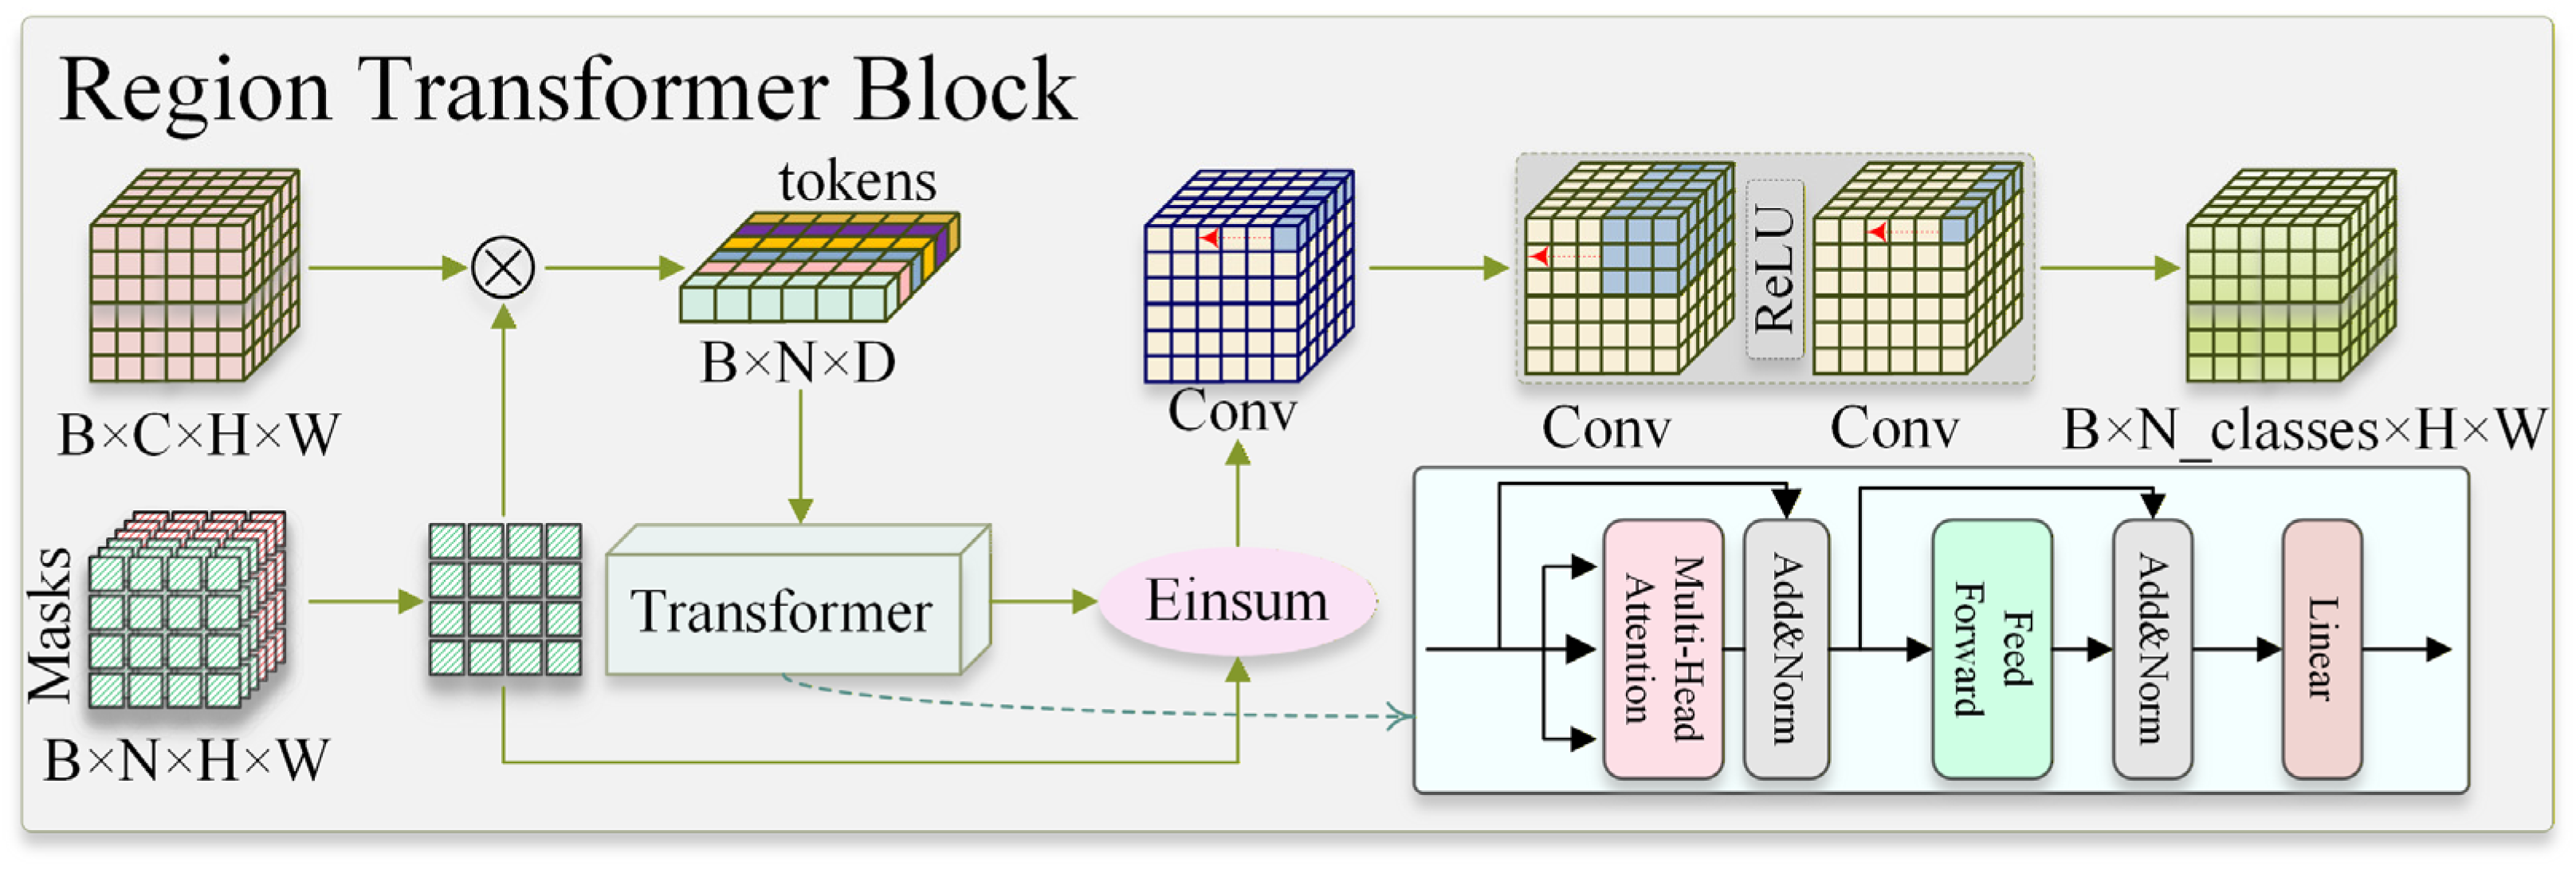
Mainstream tokenization approaches, such as Vision Transformer [40], typically partition images into uniform patches. This operation is suboptimal for segmenting irregular, elongated leaf vein structures, as uniform partitioning may lead to semantic fragmentation. Given the weak feature distinction between primary and branch veins in pumpkin seedlings, such uniform segmentation often causes confusion between these vein types. To address this issue, this study proposes a Region Transformer Block that employs regional token modeling and regional pixel reprojection to ensure segmentation results adhere to regional semantic logic while maintaining pixel-level accuracy. This module X R C × H × W is the input feature map, M R N × H × W is the regional mask (where N denotes the number of regions), Y R N classes × H × W is the output an enhanced feature map. Figure 7 illustrates the structure of the Region Transformer Block.
First, the input feature map is subjected to convolutional projection. Then, the features within each region are converted into regional tokens through mask-weighted average pooling, resulting in a regional token sequence ( T R N × D ). Subsequently, self-attention computation is performed in the regional space, followed by reprojecting the enhanced regional features back to the pixel space. Finally, a segmentation head is added to the enhanced features obtained from the reprojection to output the final segmentation result. For detailed formulations, refer to Equations (4)–(7).
F = C o n v ( X )
T i = h = 1 H w = 1 W F ( h , w ) M ( i , h , w ) h = 1 H w = 1 W M ( i , h , w ) + ε
where F R D × H × W represents the feature map after convolutional projection, and ε is a smoothing term to prevent division by zero.
A t t e n t i o n ( Q , K , V ) = S o f t m a x ( Q K T d k ) V
where Q = T W Q , K = T W K , V = T W V , and W Q , W K , W V R ( D × d k ) are projection weight matrices.
Y proj = i = 1 N T i M i
where Y proj R D × H × W represents the enhanced features resulting from the reprojection (output).

2.2.4. Skip Connection Fusion Block

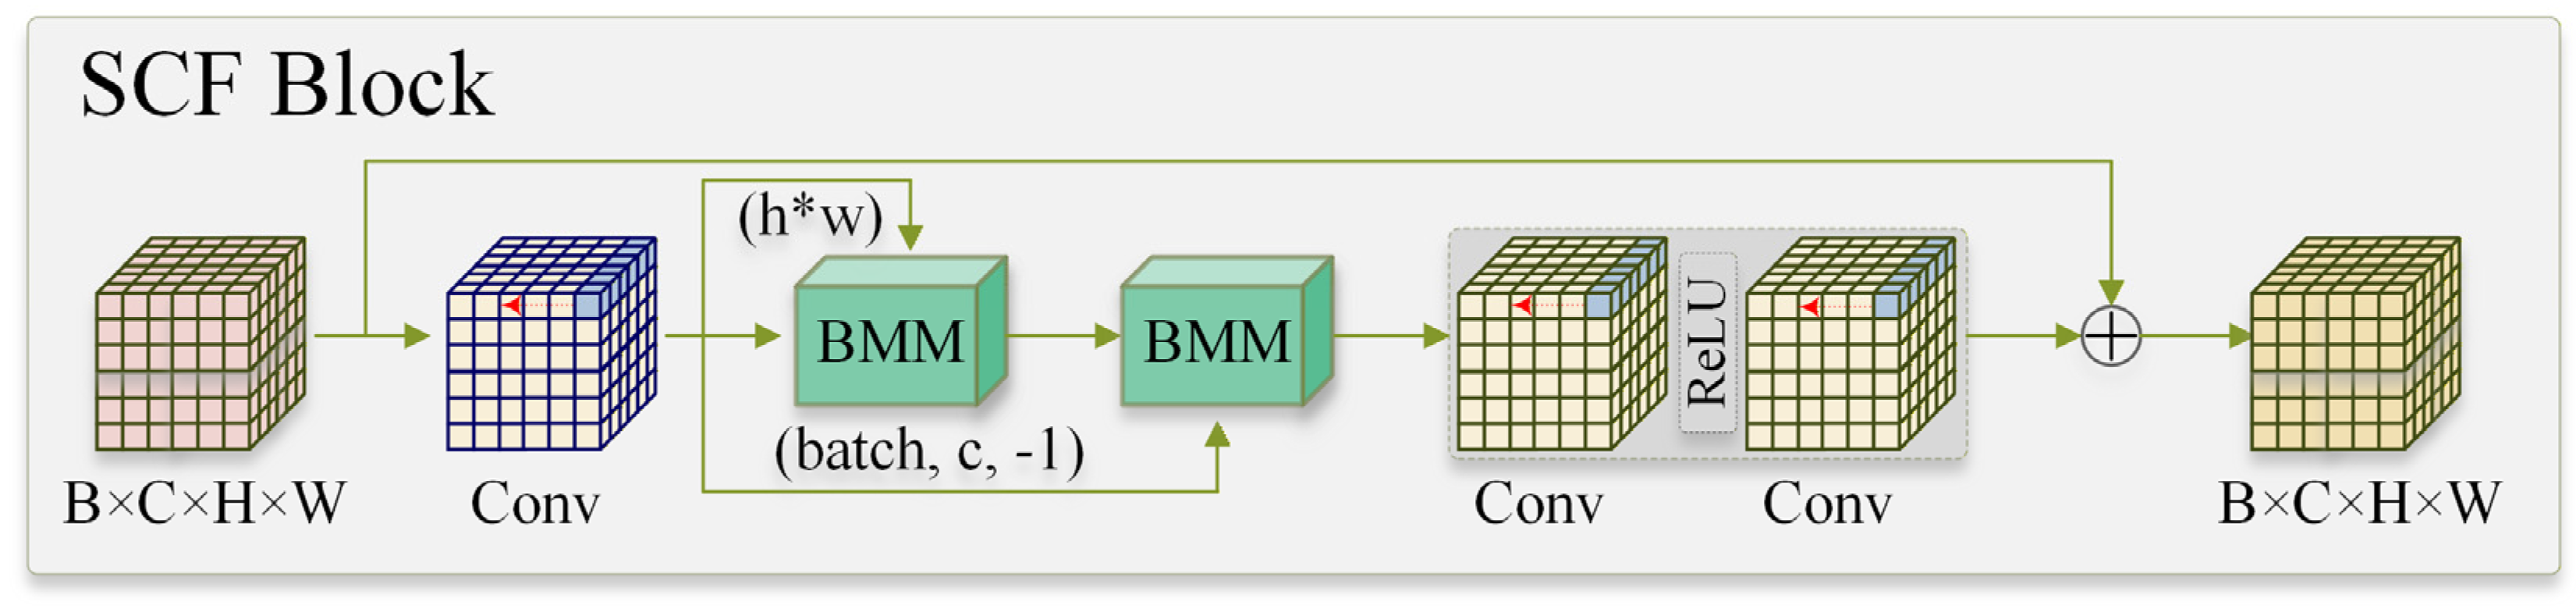
To mitigate the semantic gap between the encoder and decoder, skip connections are incorporated between them. However, these connections often lead to spatial detail loss. To address this limitation, we propose a Skip Connection Fusion Block (SCF Block) that enhances the model’s ability to integrate global contextual information by modeling inter-channel dependencies within feature maps, thereby ensuring effective preservation and enhancement of fine-grained structures in deep networks. This module X R C × H × W is the input feature map, Y R C × H × W is the output enhanced feature map. Figure 8 illustrates the structure of the SCF Block module.
The input features are first processed by a 1 × 1 convolution for cross-channel information fusion, yielding a feature map ( U R C × H × W ). This map is then reshaped into a matrix ( U ˜ R C × L ). Subsequently, global dependencies are established by computing the channel autocorrelation matrix. The resulting features are further enhanced through a non-local module ( N non - local ), which employs a bottleneck structure: a 1 × 1 convolution reduces the channel depth by half, followed by a ReLU activation and another 1 × 1 convolution to restore the original channel count. Finally, the enhanced features are output via a residual connection. For detailed formulations, refer to Equations (8)–(12).
U = C 1 × 1 ( X )
S = U ˜ U ˜ T L
X ˜ c = S × U ˜
where C 1 × 1 denotes the 1 × 1 convolution operation, L = H × W represents the total number of spatial positions, and S R C × C is the spatial autocorrelation matrix.
X c = r e s h a p e ( X ˜ c )
Y = N non - local ( X c ) + X
where X ˜ c R C × L denotes the matrix-form features enhanced by channel autocorrelation, and X c R C × H × W represents the reshaped feature map.

2.3. Post-Processing System

The rule-based methods adopted in this system focus on using a series of predefined, deterministic algorithms and logical criteria to process the segmentation masks, rather than relying on another learning model. These rules are derived from prior knowledge of the geometric structure of pumpkin seedling leaf veins, including the topological connectivity of the veins, the linear characteristics of the main vein, and the agronomic requirements for the cutting operation. The specific process includes image preprocessing, leaf root calibration, and calculation of cutting position and angle, each step implemented through traditional image processing techniques and geometric analysis.
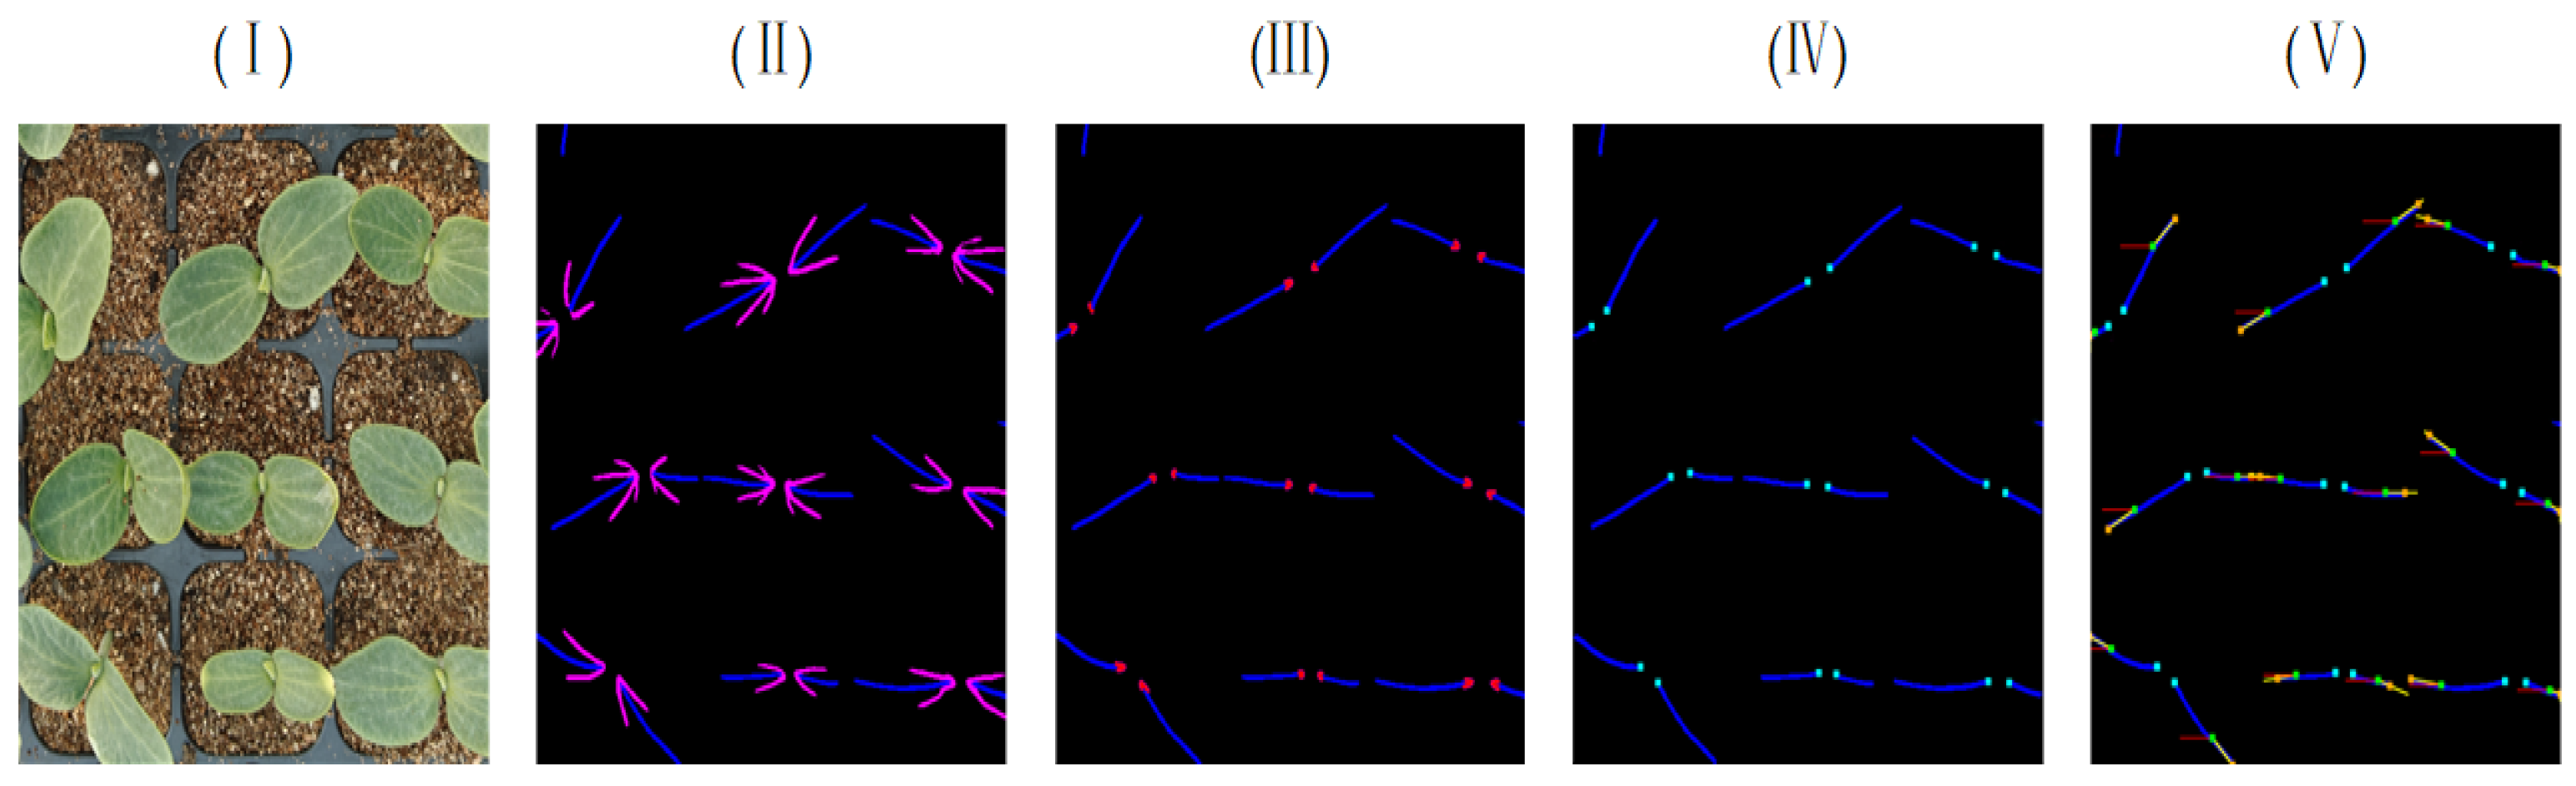
Figure 9 shows each stage of post-processing, where (I) is the original image, (II) is the DRE-Former segmentation image, (III) is the preprocessing result image, (IV) is the marking leaf root result image, and (V) is the cutting position and cutting angle result image.

2.3.1. Image Preprocessing

First, a color thresholding method is applied to process the input mask image, effectively separating veins from the background and generating corresponding binary masks. Connected component analysis is then performed to identify the merged binary masks and extract the topological structure of the veins. Finally, using neighborhood detection and skeletonization processing based on the topological structure, intersection points are identified, and the main vein centerline is extracted. This preprocessing provides the foundation for subsequent operations. The result is shown in Figure 9III.

2.3.2. Leaf Root Calibration

The leaf root position is calibrated using geometric analysis. Perpendiculars are drawn from all intersection points ( P c ) to the main vein centerline to obtain their corresponding foot points ( P foot ). The leaf root position ( P root ) is then defined as the centroid of all foot points, as expressed in Equation (13). The result is shown in Figure 9IV.
P r o o t = ( 1 n i = 1 n x i , 1 n i = 1 n y i )
where P root = ( X root , Y root ) represents the coordinates of the leaf root point, n denotes the total number of foot points, x i and y i are the horizontal and vertical coordinates of the i-th foot point, respectively.

2.3.3. Calculation of Cutting Position and Angle

First, a breadth-first search (BFS) graph traversal algorithm is employed. The BFS algorithm traverses outward from the leaf root layer by layer, recording the path distance from each point to the leaf root. Geometric analysis is then used to calculate the cutting point, leaf tip, and cutting angle. The process is as follows. The result is shown in Figure 9V.
  • Path Distance Recording.
Using a BFS algorithm, the path distances from the leaf root point ( P root ) to each main vein centerline skeleton point are systematically recorded. The main vein skeleton points are denoted as set S = S i | i = 1 , 2 , , n . Starting from the leaf root point, the path distance from each node to the root node is recorded as D ( P r o o t , S i ) .
2.
Cutting Point Localization.
Using the distance information recorded during BFS traversal, the skeleton point satisfying this distance condition is directly located as cutting point ( P c u t ). For detailed formulations, refer to Equations (14).
D ( P r o o t , P c u t ) = α × L t o t a l
where cutting ratio α = 1 2 [41], and L t o t a l as the total length of the main vein.
3.
Leaf Tip Localization.
The leaf tip ( P t i p ) is identified as the skeleton point with the maximum path distance in main vein centerline. For detailed formulations, refer to Equation (15).
P t i p = arg max s i S ( P r o o t , s i )
4.
Cutting Angle Calculation.
The cutting blade is initially perpendicular to the starting vector, which points horizontally left from the cutting point. For the cutting operation, the blade should be perpendicular to the stopping vector, which points from the cutting point to the leaf tip. The required cutting angle θ is therefore calculated as the angle between the starting vector and the stopping vector. For detailed formulations, refer to Equation (16).
θ = ( V b a s e , V stop ) = atan 2 ( Y t i p Y c u t , X t i p X c u t ) × 180 π
where V b a s e = ( 1 , 0 ) represents the starting vector, and V stop = ( P t i p P c u t ) denotes the stopping vector.

2.4. Parameter Settings and Experimental Platform

2.4.1. Evaluation Metrics

To systematically evaluate the performance of the DRE-Former model in the dataset, and fully consider that the task belongs to three types of pixel-level semantic segmentation problems including main vein, branch vein and background, three evaluation metrics widely recognized in the field of semantic segmentation are selected: F1 Score (the harmonic mean of precision and recall), mIoU (mean Intersection over Union), and OA (Overall Accuracy). These metrics collectively assess performance from the perspectives of regional consistency and classification accuracy, ensuring a scientific experimental design and reliable, valid results.
To verify the performance of the DRE-Former model in the real pumpkin seedling segmentation task, an image acquisition platform was built for the real pumpkin seedling leaf vein segmentation test. The stability of this model is evaluated by the mean standard deviation. The average relative error is compared with the IoU of the main veins in the dataset to evaluate whether the model in this paper meets expectations.
To evaluate the performance of the proposed post-processing system, the number of leaf veins identified by the system was manually counted, and the whole-group accuracy rate was adopted as the evaluation metric. This metric genuinely reflects the practical efficacy of the post-processing system.

2.4.2. Statistical Analysis

To provide a statistical rationale for model comparison, we estimated the uncertainty of performance metrics using 95% confidence intervals. Given that our evaluation is based on a single run with a fixed random seed, we adopted conservative estimates of the standard deviations for each metric based on reported values in the semantic segmentation literature. Specifically, for plant segmentation tasks, Minervini et al. [42] reported standard deviations of IoU ranging from 1.5% to 3.0% for leaf segmentation, and Ubbens [43] reported standard deviations of F1 scores around 2–4% for plant organ segmentation. Ward et al. [44] used bootstrapping to estimate confidence intervals for mIoU, with standard deviations around 2.5%. Based on these studies and considering the varying difficulty of different classes, we assumed the following standard deviations for per-image metric values: 0.8% for the Background class (relatively stable), 3.0% for the Main Vein class, and 4.0% for the challenging Branch Veins class. For the aggregated metrics mIoU and mF1, we assumed a standard deviation of 2.0%. These values are conservative, likely overestimating the true variability, thus making our statistical inferences more robust.
For IoU, F1, mIoU and mF1, the 95% confidence interval was calculated. For OA, which is a proportion, we computed the exact binomial confidence interval using the Wald formula. A performance difference between two models is considered statistically significant at the 0.05 level if their confidence intervals do not overlap. For detailed formulations, refer to Equations (17) and (18).
C I m e t r i c = m e t r i c ± 1.96 × S m e t r i c n
where m e t r i c is the reported mean value (in percentage), S m e t r i c is the assumed standard deviation for that specific metric (Background: 0.8%, Main Vein: 3.0%, Branch Veins: 4.0%, mIoU and mF1: 2.0%), and n = 4763 is the number of test images.
C I O A = O A ± 1.96 × O A × ( 100 O A ) n
where OA is expressed as a percentage (0–100).

2.4.3. Model Training Parameters and Experimental Setup

Model training and testing in this study were conducted under identical environments. Experiments were performed on a desktop computer running Windows 11 (Manufacturer: Microsoft Corporation; Redmond, WA, USA), equipped with an AMD Ryzen 9 7950 16-Core Processor (Manufacturer: Advanced Micro Devices, Inc.; Santa Clara, CA, USA), 64 GB RAM (Brand: Unknown), and an NVIDIA GeForce RTX 4060 Ti GPU (Manufacturer: NVIDIA Corporation; Santa Clara, CA, USA). The neural network was implemented using the PyTorch 2.4.1 deep learning framework within an Anaconda 3 virtual environment configured with Python 3.8, accelerated by CUDA 11.8 and cuDNN 9.0.1 for GPU parallel computing. OpenCV 4.5.4 was chosen as the development platform for implementing the post-processing system. During training, the batch size was set to 8, and the Adam optimizer with an initial learning rate of 6 × 10⁻³ was used, spanning 100 epochs. The random seed value is set to 42.
This study addresses a typical class-imbalanced segmentation task. To tackle this challenge, a composite loss function combining Cross-Entropy Loss [45] and Dice Loss [46] was adopted. Cross-Entropy Loss serves as the standard loss for pixel-level classification, yet its optimization process can be dominated by the majority background class. In contrast, Dice Loss directly optimizes the overlap between predicted and ground-truth regions, making it highly sensitive to the area of foreground targets. Even when the number of foreground pixels is very small, Dice Loss produces significant gradients due to low region overlap, thereby compelling the model to focus on improving predictions for foreground targets. The combination of CE + Dice is recognized as one of the effective strategies in semantic segmentation to mitigate class imbalance: CE loss ensures clear classification decision boundaries, while Dice loss directly promotes segmentation completeness for sparse target regions.
The image acquisition platform utilized the Intel D405 SDK to capture color (RGB) and depth (D) images. The setup included a computer, LED light strips, and the depth camera, all housed within a light-proof enclosure constructed with blackout cloth. The Intel D405 camera was configured in RGB mode with a resolution of 640 × 480 pixels; depth images were 16-bit grayscale. During image acquisition, the camera was fixed 0.3 m above the seedling platform, and the video stream frame rate was set to 30 fps.

3. Results

3.1. Experiment Comparing with Different Models

To validate the performance of the proposed DRE-Former model in the segmentation task, comparative experiments were conducted against DeepLabv3+ [47], UNet [48], GAM-Seg [49], SwinUNet [50], UNetA [51], and TransUNet [52] models. The results are presented in Table 1.
Compared with other models, the DRE-Former model demonstrates statistically significant superior performance across all key segmentation metrics. When Compared with the basic models DeepLabv3+, UNet, GAM-Seg, and UNetA, although DRE-Former has more parameters, it achieves statistically significant improvements, with mIoU increases by 7.78%, 6.82%, 5.04%, and 1.98%, respectively, mF1 increases by 7.02%, 6.4%, 4.48%, and 1.63%, respectively, and OA increases by 11.42%, 9.6%, 7.49%, and 7.31%, respectively. The complete separation of confidence intervals for DRE-Former and these baselines confirm that the improvements are not due to random variation. When compared with the more complex SwinUNet and TransUNet models under a comparable model size, DRE-Former again shows statistically significant gains: mIoU increases by 3.6% and 2.99%, mF1 by 3.57% and 1.43%, and OA by 8.26% and 6.05%, respectively. In all these pairwise comparisons, the confidence intervals of DRE-Former do not overlap with those of the competitors. These consistent and statistically significant improvements across all baseline models provide strong evidence that the segmentation performance and accuracy of the proposed DRE-Former have been substantially enhanced.
To thoroughly assess the model’s practicality for automated deployment, we supplement the standard accuracy metrics with an evaluation focused on thin-structure segmentation quality and computational efficiency. Specifically, we report the Boundary F1-Score (BF-Score) for vein edges, the number of parameters (Params), and the inference speed (Frames Per Second, FPS). The BF-Score is calculated with a tolerance of θ = 2 pixels to evaluate the alignment of predicted and ground-truth boundaries. The FPS is measured under a unified hardware setting. The results are summarized in Table 2.
As shown in Table 2, this study further evaluates the proposed model from two aspects: thin-structure segmentation quality and computational efficiency. In terms of thin-structure segmentation, DRE-Former achieves BF-Scores of 87.56% and 83.21% for the main vein and branch veins, respectively, both of which are significantly higher than those of the other compared models. This demonstrates that its module design can more effectively capture and restore the fine edge features of leaf veins. Regarding computational efficiency, the number of parameters of DRE-Former is 72.42 M, which is on the same order as that of TransUNet is 67.97 M, while its inference speed reaches 26 FPS, meeting the baseline requirement for real-time processing. It is worth noting that although UNet performs better in both the number of parameters is 24.89 M and inference speed is 42 FPS, its BF-Scores are relatively low, reflecting a certain trade-off between lightweight design and segmentation accuracy. In summary, while maintaining competitive inference efficiency, DRE-Former achieves a clear improvement in the segmentation quality of fine leaf veins, providing a solid foundation for further system optimization toward practical applications. In subsequent work, lightweight research will be carried out for this model scale to better adapt to edge deployment scenarios.
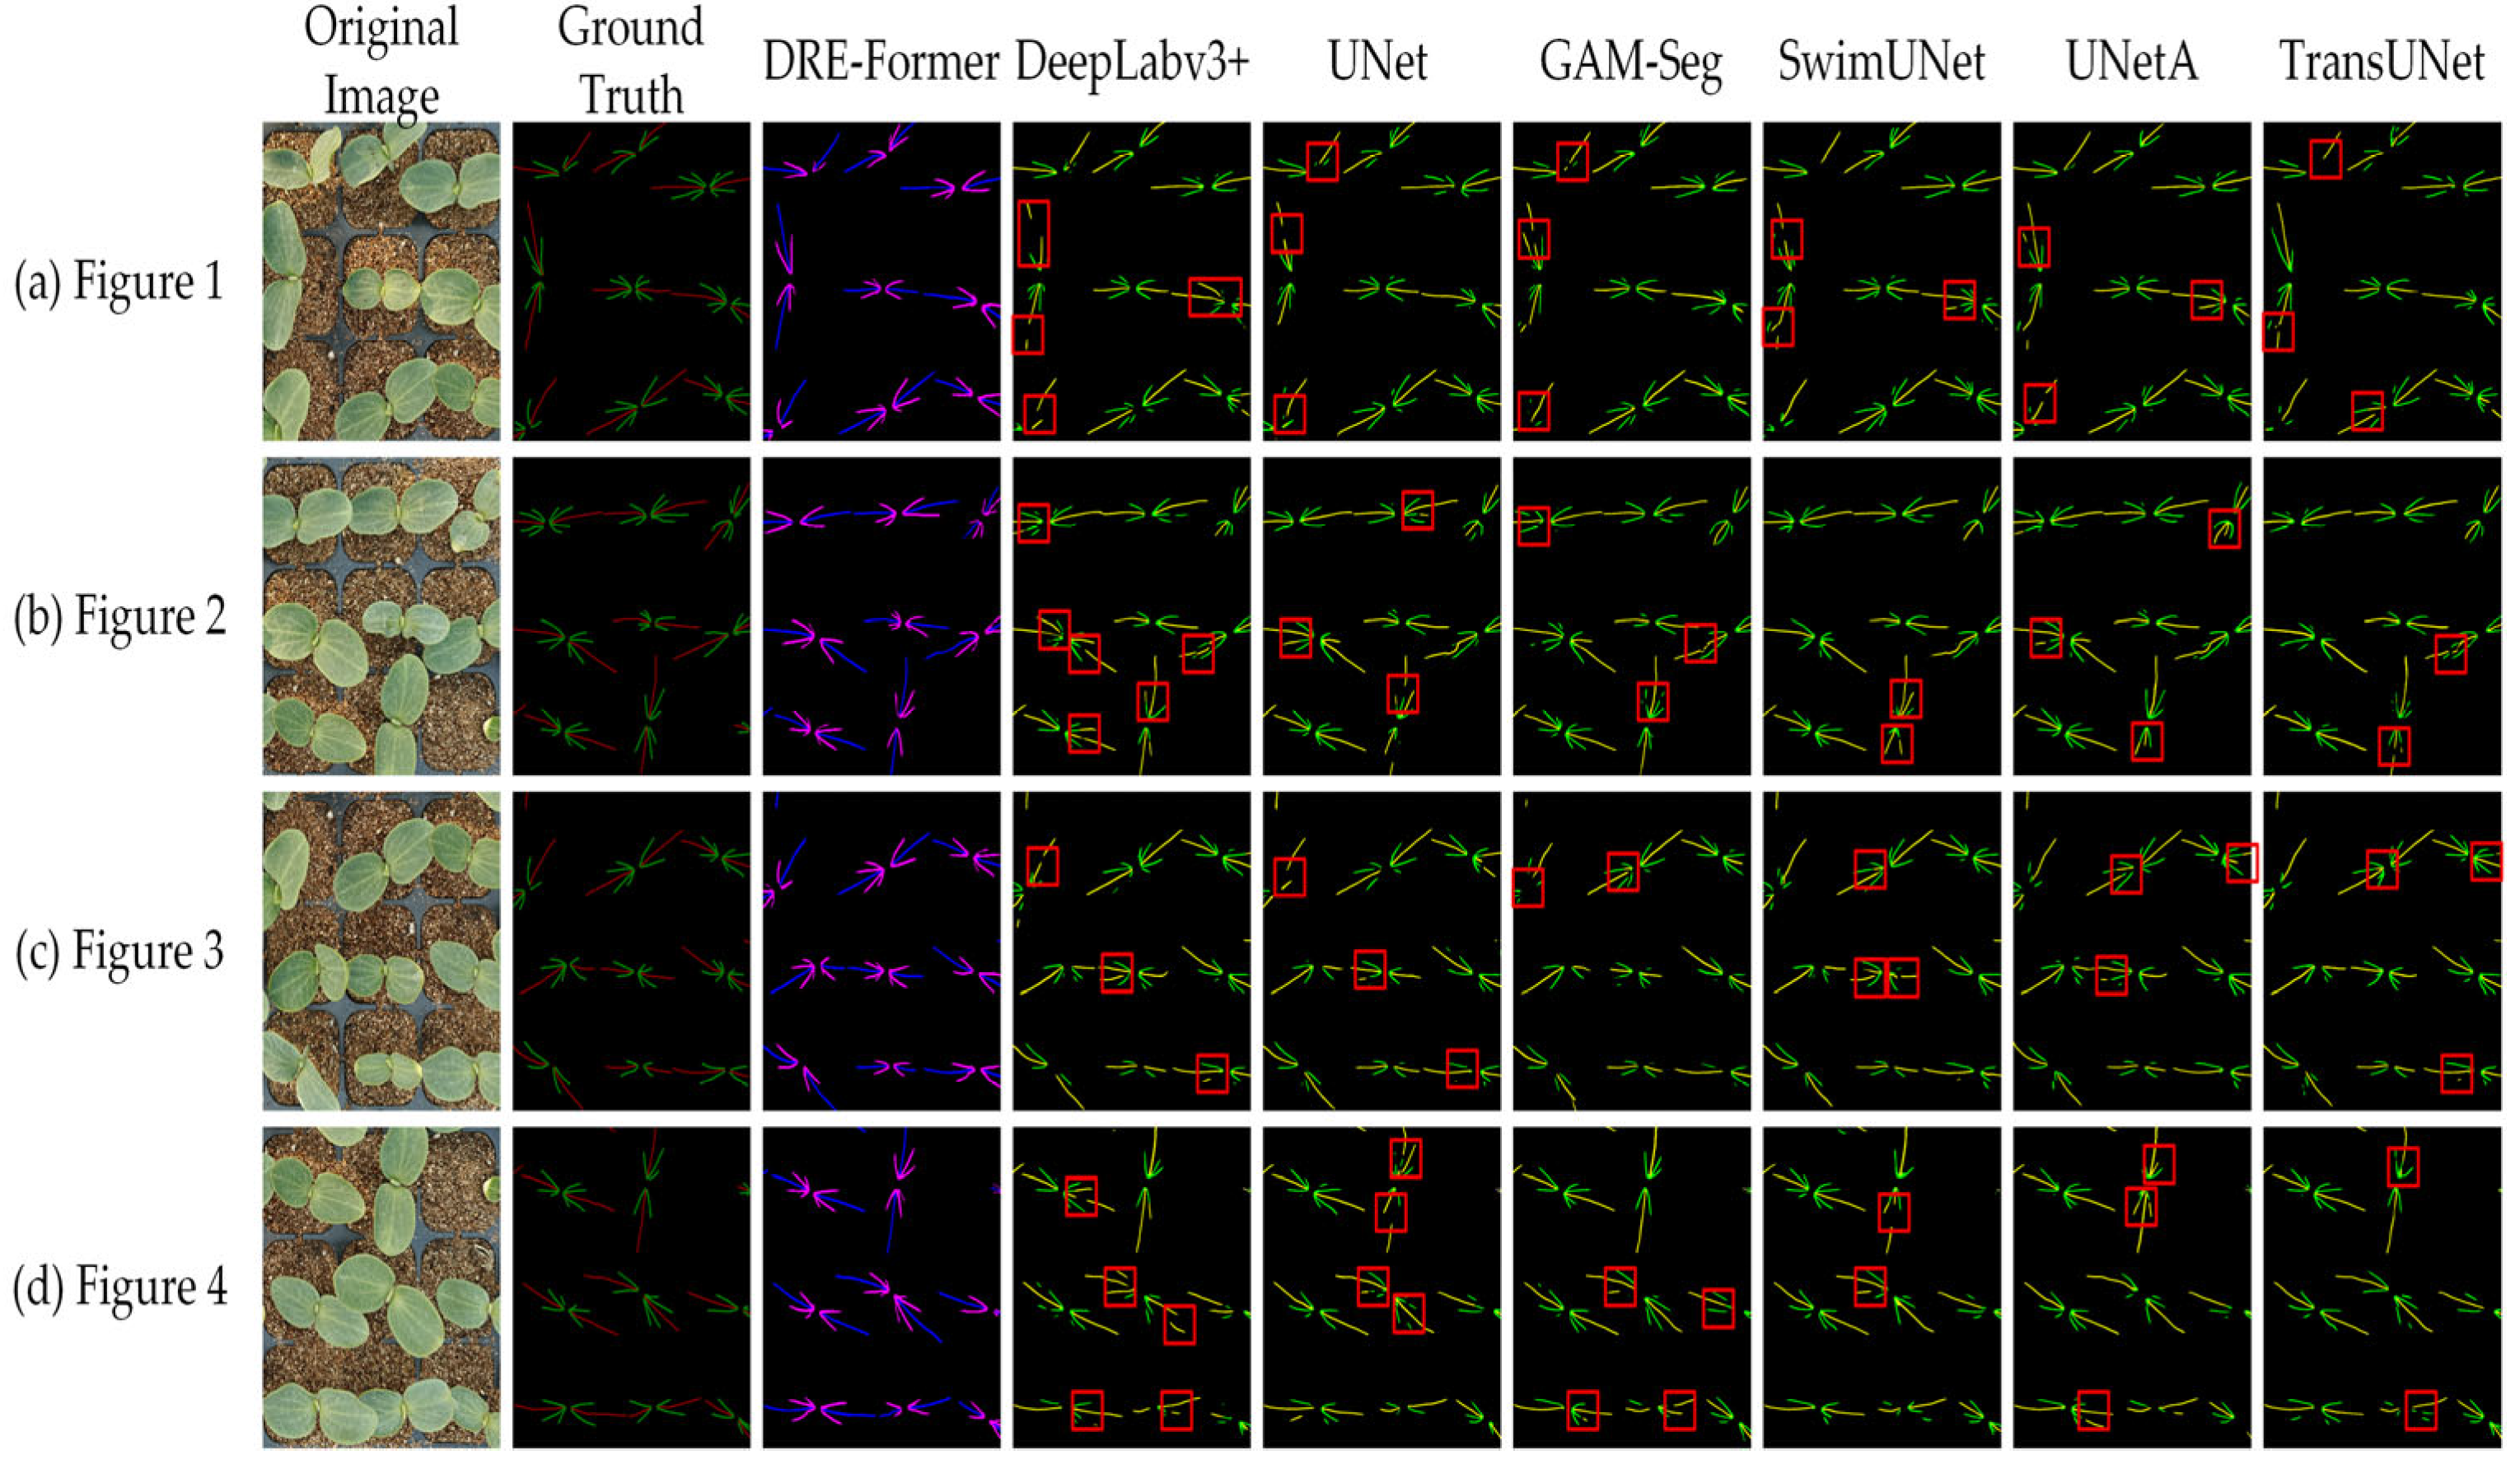
To further analyze the robustness of DRE-Former in the pumpkin seedling vein segmentation task, Figure 10 presents a comparative visualization of vein extraction results from different models.
Observation and analysis of Figure 10 indicate that DRE-Former can accurately distinguish between primary and branch veins. Not only does it surpass other models in terms of vein segmentation completeness and overall accuracy, but its segmentation boundaries are also closer to the actual contours of the pumpkin seedling veins, demonstrating DRE-Former’s excellent multi-scale feature extraction capability and its ability to maintain the complete topology of veins in complex environments. Other models exhibit significant limitations: basic models, constrained by weak feature extraction capability for small targets, tend to miss or confuse primary and branch veins, while more advanced models, despite enhanced feature extraction, still confuse features of primary and branch veins, leading to lower overall accuracy.

3.2. Effectiveness of the DFC Module

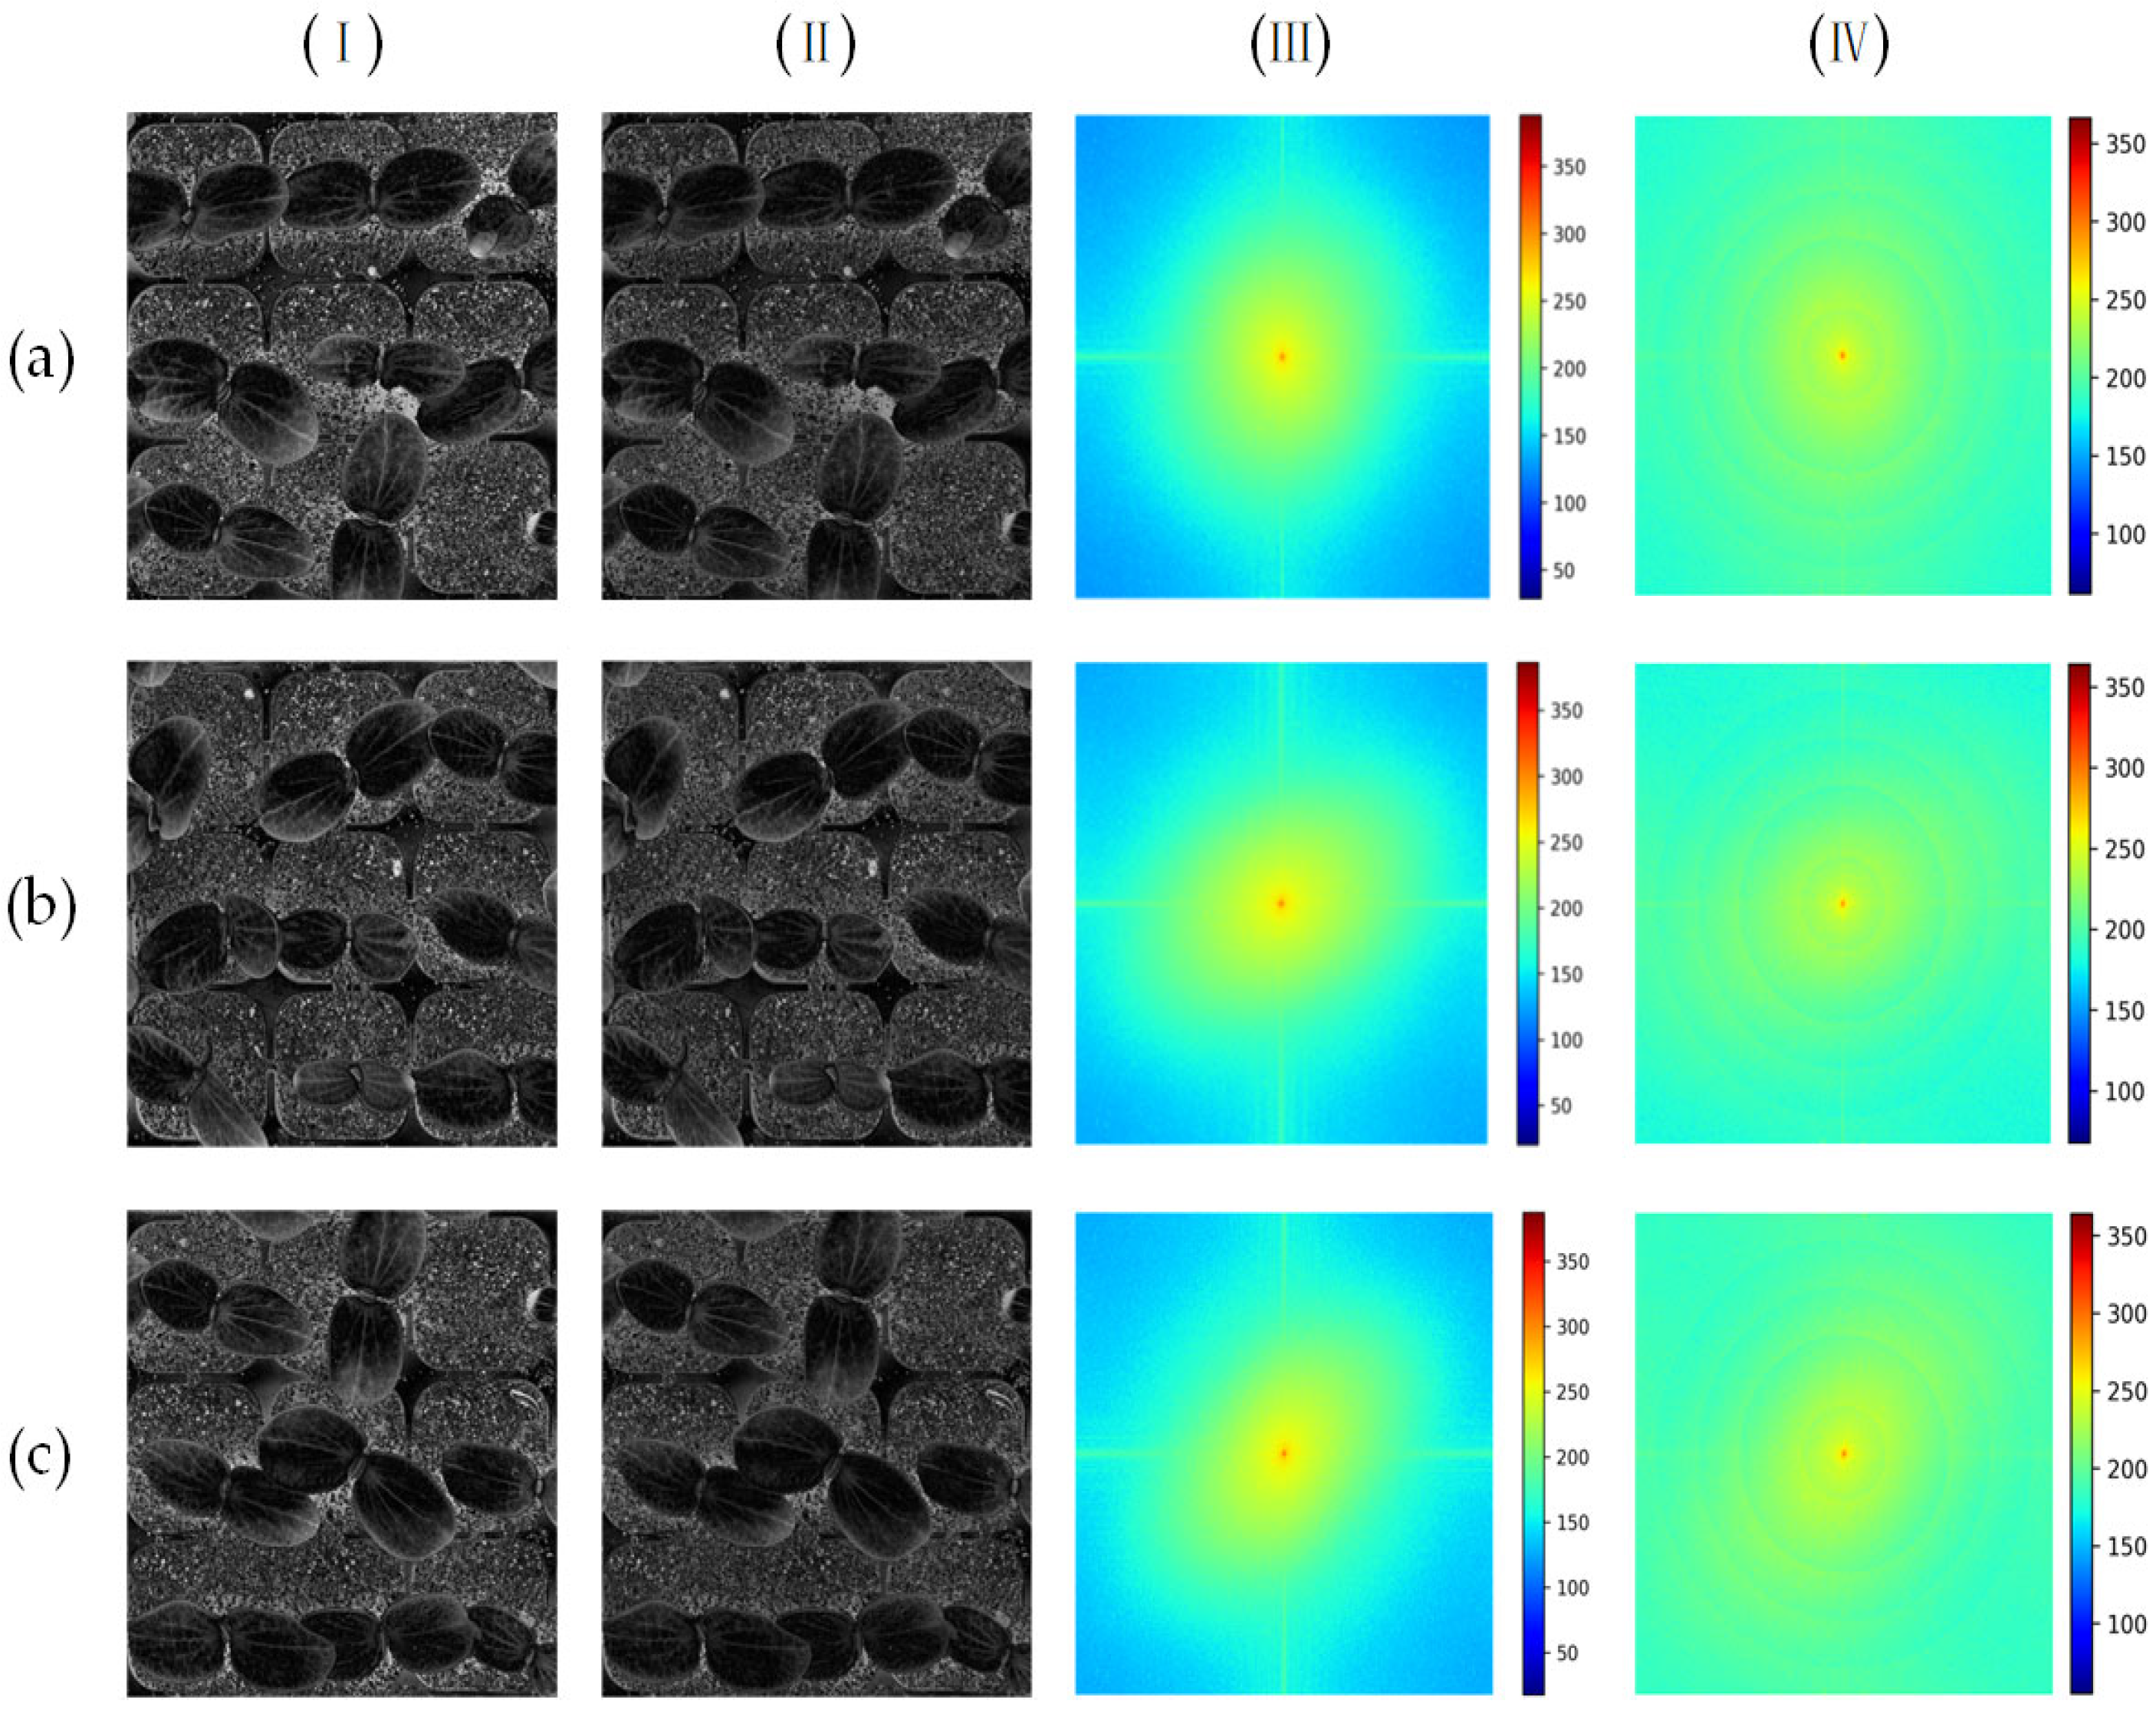
To validate the effectiveness of the proposed DFC module, this section first provides a theoretical basis for DFC’s frequency-domain enhancement strategy through spectral analysis of leaf vein images. Subsequently, the advantage of frequency-domain processing is demonstrated by comparing the feature extraction results of the frequency-domain method (FFT reconstruction) and the spatial-domain method (spatial convolution). Finally, by comparing the results of dynamic enhancement (DFC) with static frequency-domain filtering (FFT), the efficacy of DFC’s internal dynamic weighting mechanism is quantitatively verified.

3.2.1. Spectral Analysis

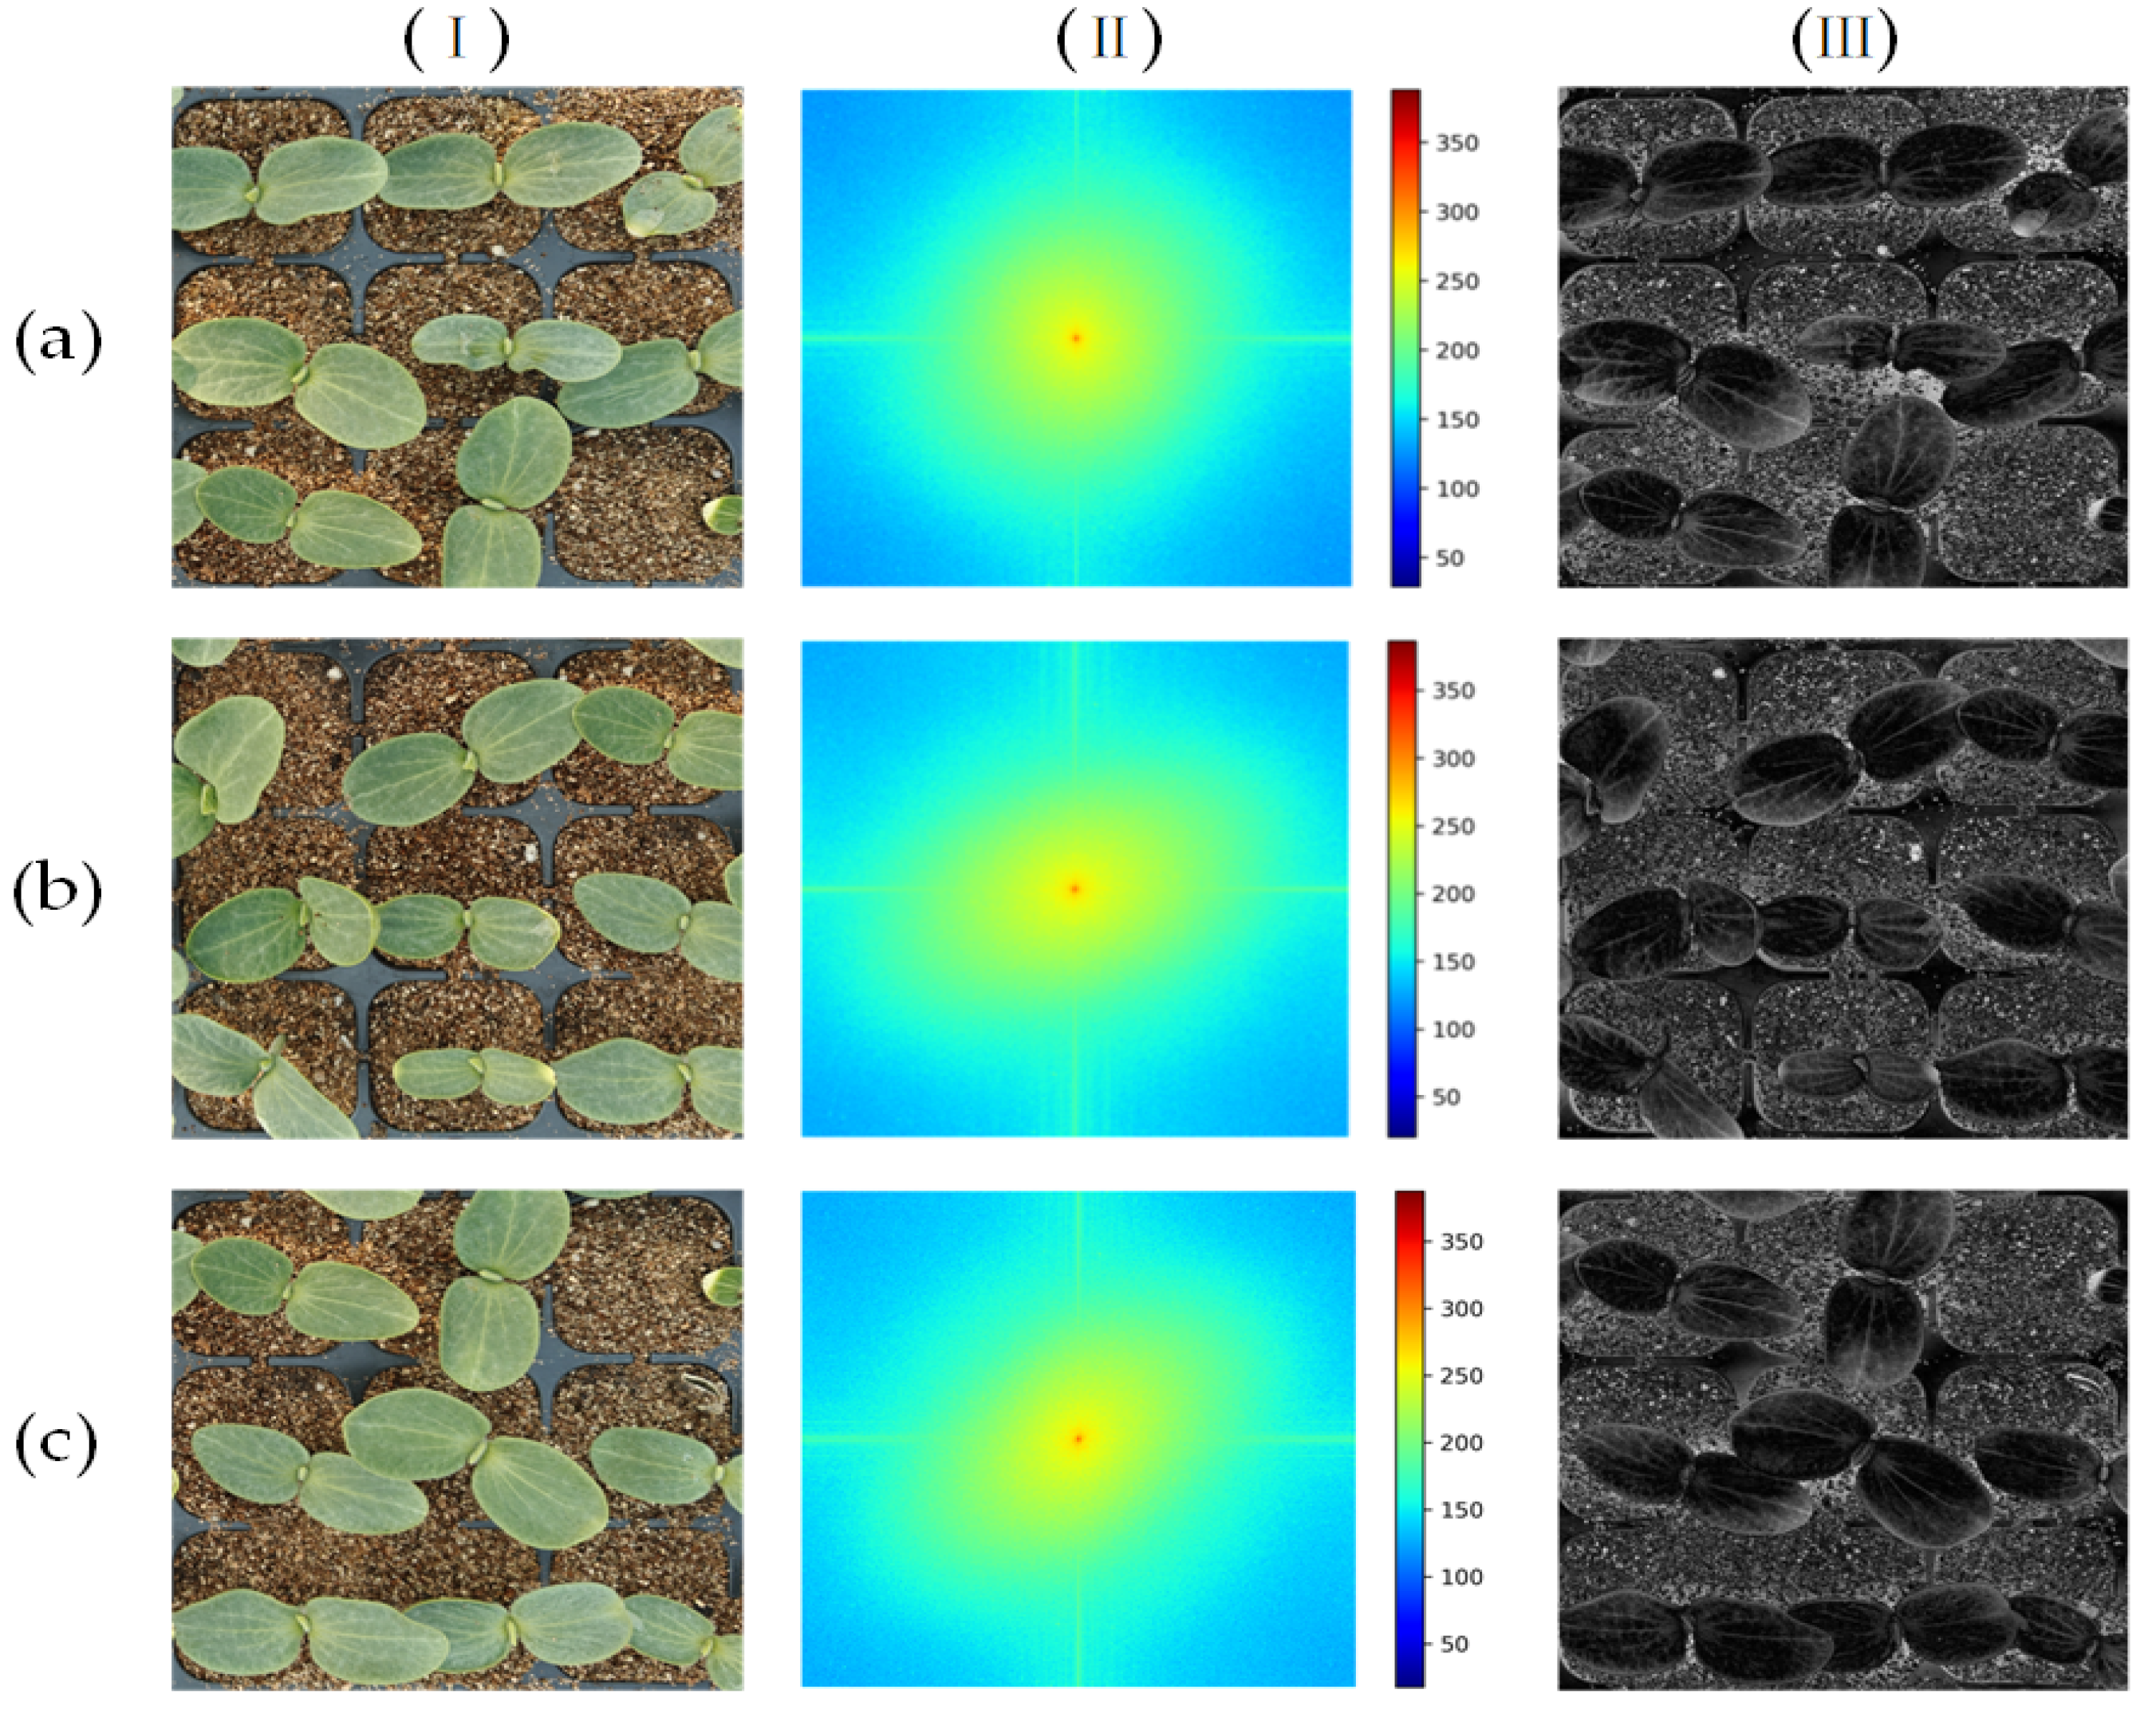
Fast Fourier Transform (FFT) analysis was performed on 30 pumpkin seedling leaf vein images. To determine the specific frequency band where leaf vein information is concentrated, inverse Fourier reconstruction was conducted. Analysis revealed that when approximately 12% of the highest-frequency energy was retained, the reconstructed images exhibited relatively complete leaf vein structures with minimal noise. This provides direct frequency-domain design basis for the subsequent development of the DFC module aimed at enhancing this specific frequency band. Figure 11 shows Fast Fourier Transform spectrograms and Fourier reconstruction images.

3.2.2. Comparative Analysis

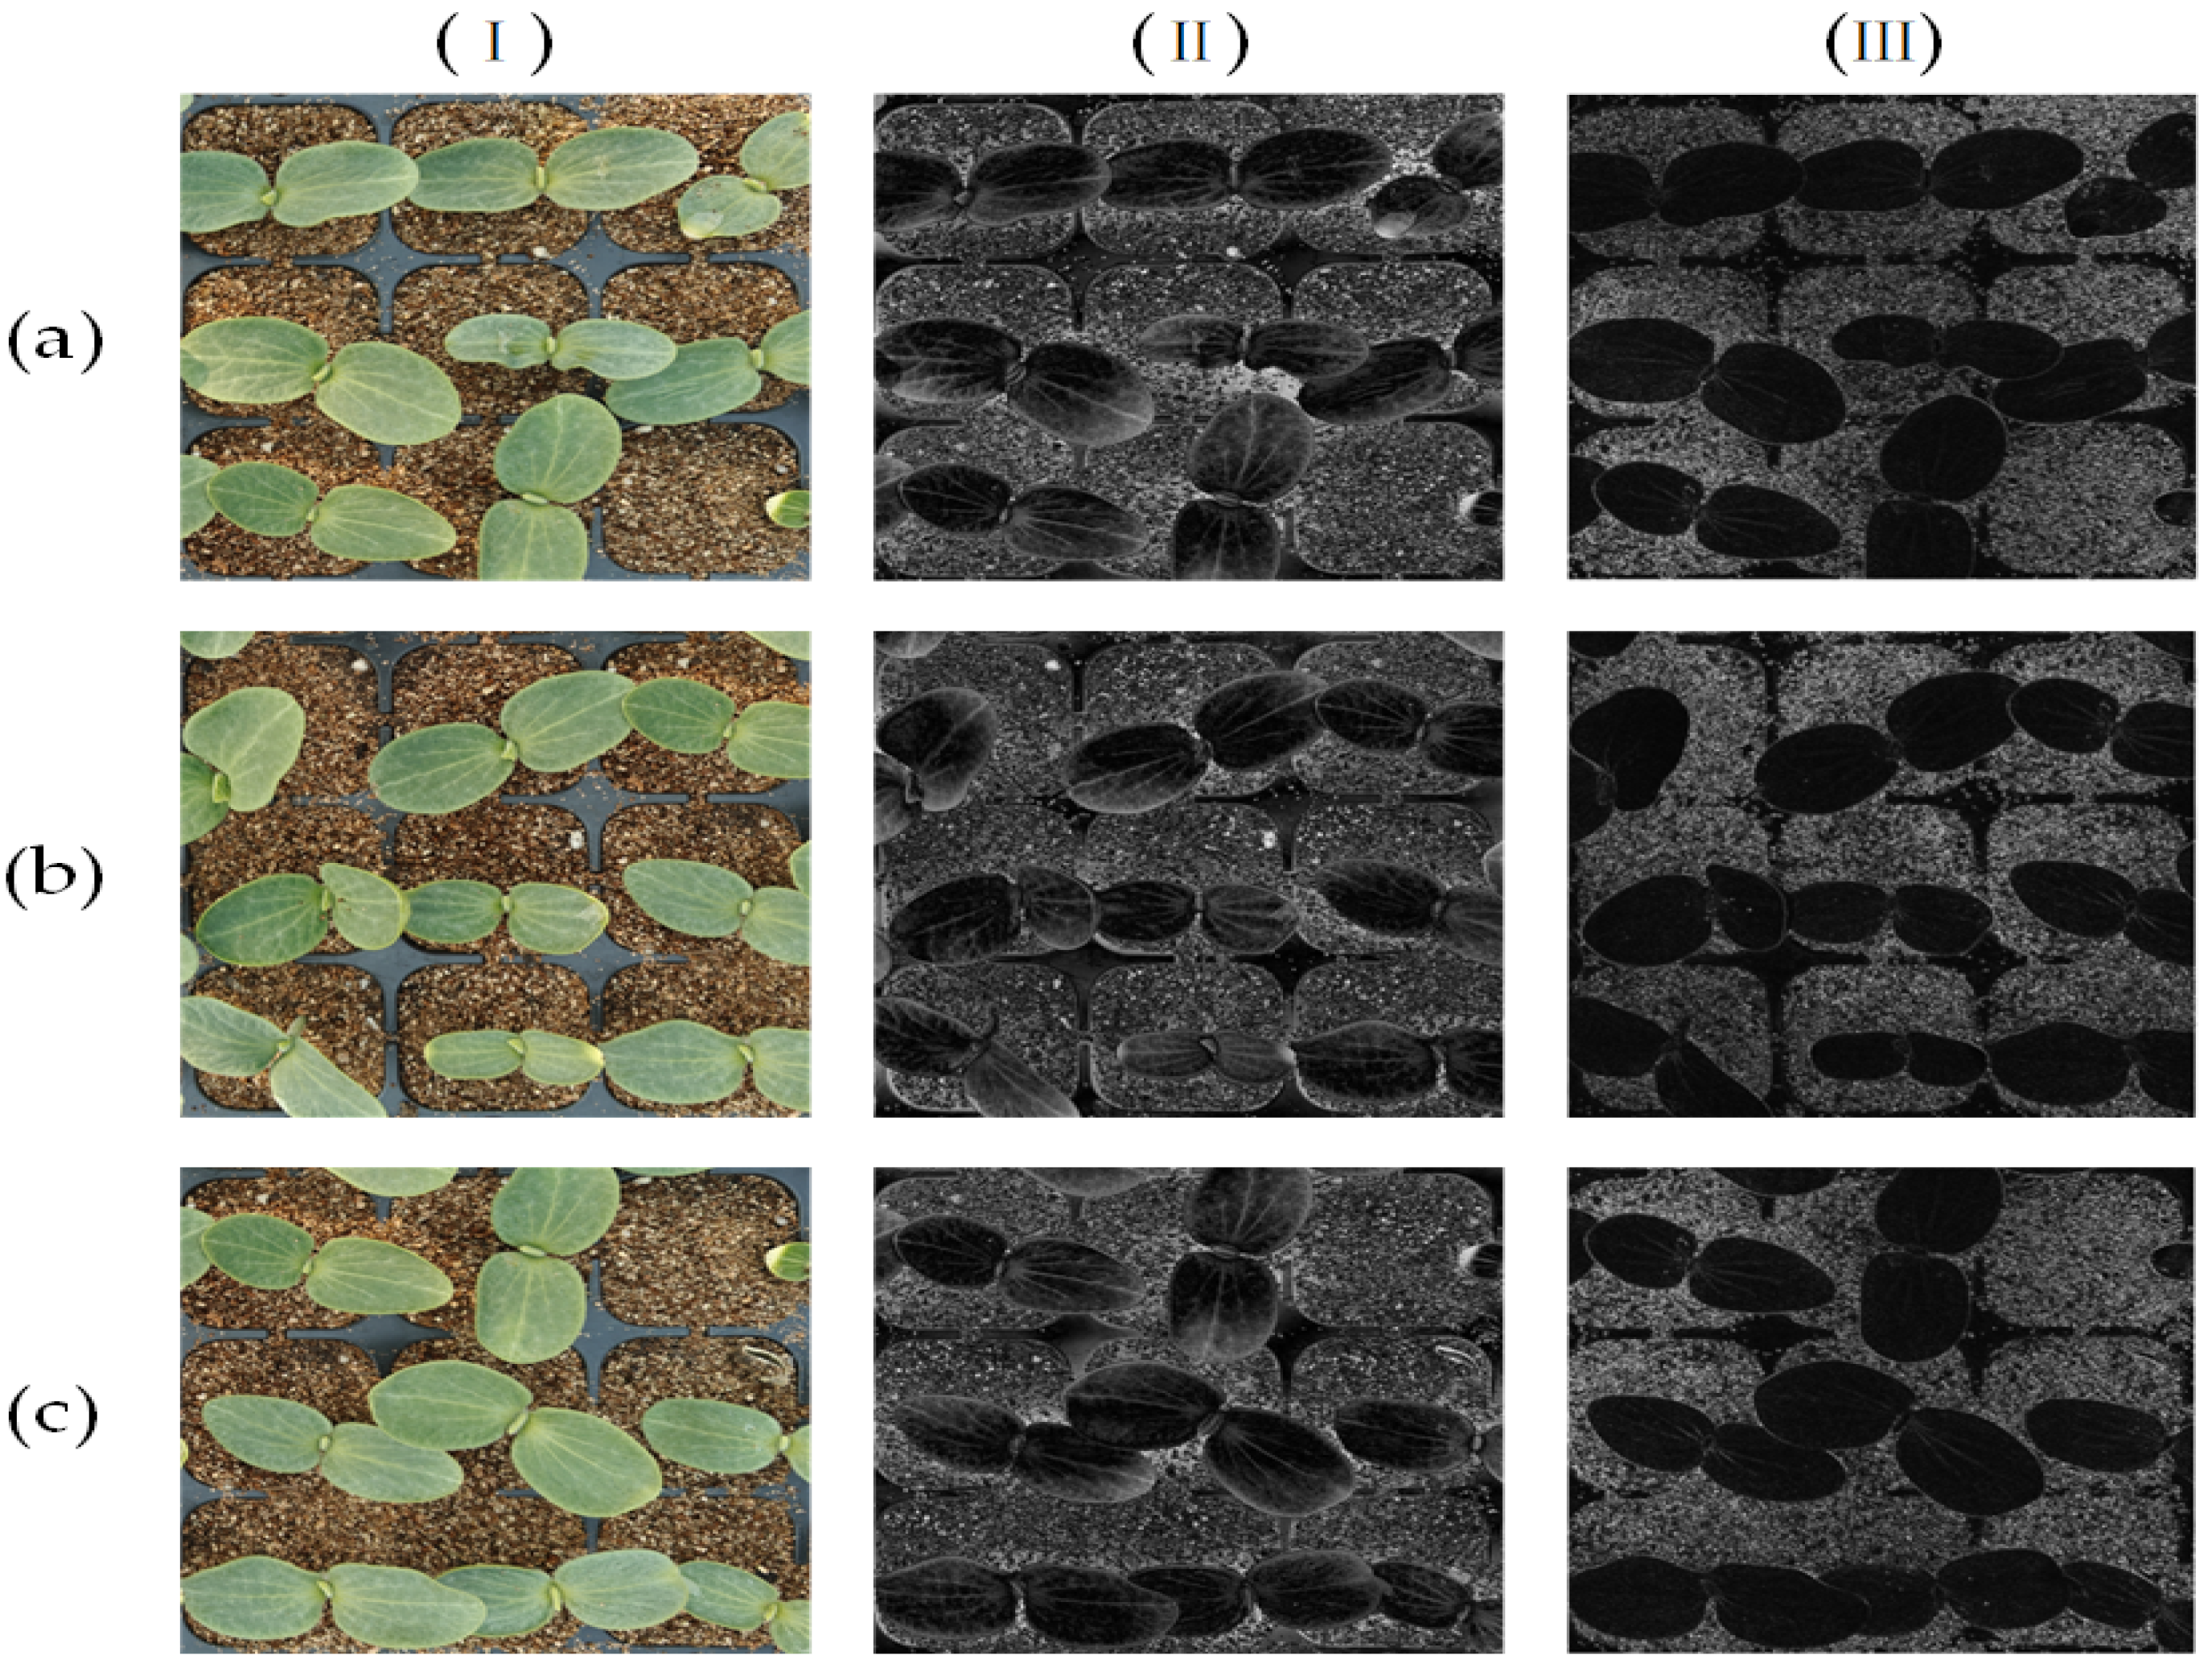
Based on the aforementioned spectral analysis, the FFT reconstruction retaining 12% of high-frequency energy was selected as the representative of the frequency-domain method. Concurrently, the classic 3 × 3 Laplacian convolution (Laplacian Conv) kernel was chosen as the representative of the spatial-domain method to extract features from the same images. Figure 12 shows the Fast Fourier Transform comparative images.
The visual comparison is shown in Figure 12. The FFT reconstruction results can clearly restore the network structure of the leaf veins. In contrast, the results from Laplacian convolution show clearer leaf blade edges but insufficient response to the vein texture, making it difficult to form a complete leaf vein structure. This comparison proves that for leaf vein structures, the frequency-domain method based on global frequency analysis is significantly superior to spatial-domain convolution in feature extraction.

3.2.3. Verification of the DFC Dynamic Enhancement Mechanism

The aforementioned FFT reconstruction employs a fixed global frequency cutoff threshold, which is a form of static filtering. To verify the effectiveness of the DFC module’s dynamic weight adjustment mechanism, it was compared with static FFT reconstruction. The core of DFC lies in adaptively generating an enhancement weight map based on the local frequency distribution of the input features. Figure 13 shows the pictures enhanced by DFC.
A comparison of Figure 13I,II reveals that DFC processing yields images with higher vein background contrast and sharper vein edges. Furthermore, the contrast between the frequency spectra in Figure 13III,IV demonstrates that DFC selectively enhances the specific high-frequency components associated with leaf vein information, building upon the baseline static FFT filtering. These prove that the DFC weighting mechanism is content-aware, enabling a spatially adaptive and targeted enhancement in the frequency domain, as opposed to a simple global boost.

3.3. Ablation Study

3.3.1. Ablation Experiments of DRE-Former

To further verify the effectiveness of the module in this paper, an ablation experiment was conducted. The experimental subjects are DN Block (Expert 1), Region Transformer Block (Expert 2) and SCF Block (Expert 3). mIoU and OA are adopted as evaluation indicators. Table 3 shows the quantitative results of the ablation experiment.
Analysis of the ablation study reveals that introducing the DN Block enhances the feature extraction capability for leaf veins, increasing the mIoU and OA by 0.87% and 0.53%, respectively. The subsequent incorporation of the Region Transformer Block further raises mIoU and OA by 1.59% and 4.61%, demonstrating that preserving the topological structure of leaf veins substantially improves performance. Finally, adding the SCF Block elevates mIoU and OA to 90.80% and 95.88%, respectively. These results indicate that the proposed modules collectively and effectively enhance the segmentation performance for pumpkin seedling leaf veins.

3.3.2. Ablation Experiments of NEC Block

To quantitatively evaluate the effectiveness of the NEC module proposed in this study, the overall architecture of the DRE-Former model and all other modules remained unchanged. Only the attention module was replaced in the DN Block, which was, respectively, replaced by the SE module, the ECA module and the CBAM module. Table 4 shows the quantitative results of the ablation experiment.
Table 4 shows the performance comparison of different attention modules on the test set. Analysis shows that the NEC module has achieved the best performance in all evaluation indicators. This is because the core of modules such as SE, ECA, and CBAM is to learn and recalibrate the important weights between channels. The NEC module stabilizes and enhances the channels sensitive to fine features through integrated normalization and efficient convolution operations, rather than merely redistributing weights. The abovementioned ablation experiments have demonstrated the effectiveness of the NEC module.

3.4. Stability and Error Analysis of Main Vein Length

To analyze the stability and error of DRE-Former in practical segmentation tasks, 12 pumpkin seedling leaves were randomly selected. Each leaf was continuously imaged 30 times under identical conditions in a repeated static capture manner, resulting in a total of 360 images used for the pumpkin seedling vein segmentation experiment. The statistical results are shown in Table 5.
Analysis of the data shows that the mean standard deviation is 0.60, the mean relative error is 11.899%, and the discrepancy between the mean relative error and the IoU of the main veins in the dataset is 2.11%. The variation in stability is primarily caused by thermal noise and shot noise fluctuations from the Intel D405 depth camera. Deep learning algorithms are sensitive to such noise, introducing a degree of variation in the prediction results; however, the overall mean standard deviation indicates that DRE-Former maintains fundamental stability in practical pumpkin seedling segmentation tasks. One reason for the discrepancy with the main vein IoU from the dataset is equipment-related random noise, and another is manual annotation error. Subjective differences in manual annotation lead to variations in the annotated samples.
The model exhibits an average relative error of 11.9% in segmenting the length of the main leaf vein. This length error can be further decomposed into two components: leaf tip localization error and leaf root localization error. In the current post-processing system, where the cutting point is determined by a fixed ratio, these two types of errors collectively influence the final position of the cut point. However, the design of our system incorporates inherent fault tolerance and compensation capabilities: the cutting ratio parameter α in the post-processing system is a key variable that can be calibrated based on actual physical cutting outcomes. By providing feedback from the cutting results of representative samples and fine-tuning the value of α, the actual cutting line executed by the robotic arm can be more consistently positioned within the theoretical central region of the leaf blade. Therefore, the current segmentation error of 11.9% is controllable at the system level and can be compensated for through parameter calibration. This provides a feasible technical pathway for achieving highly consistent graft cutting operations in subsequent practical automated equipment.

3.5. Analysis of Post-Processing Accuracy

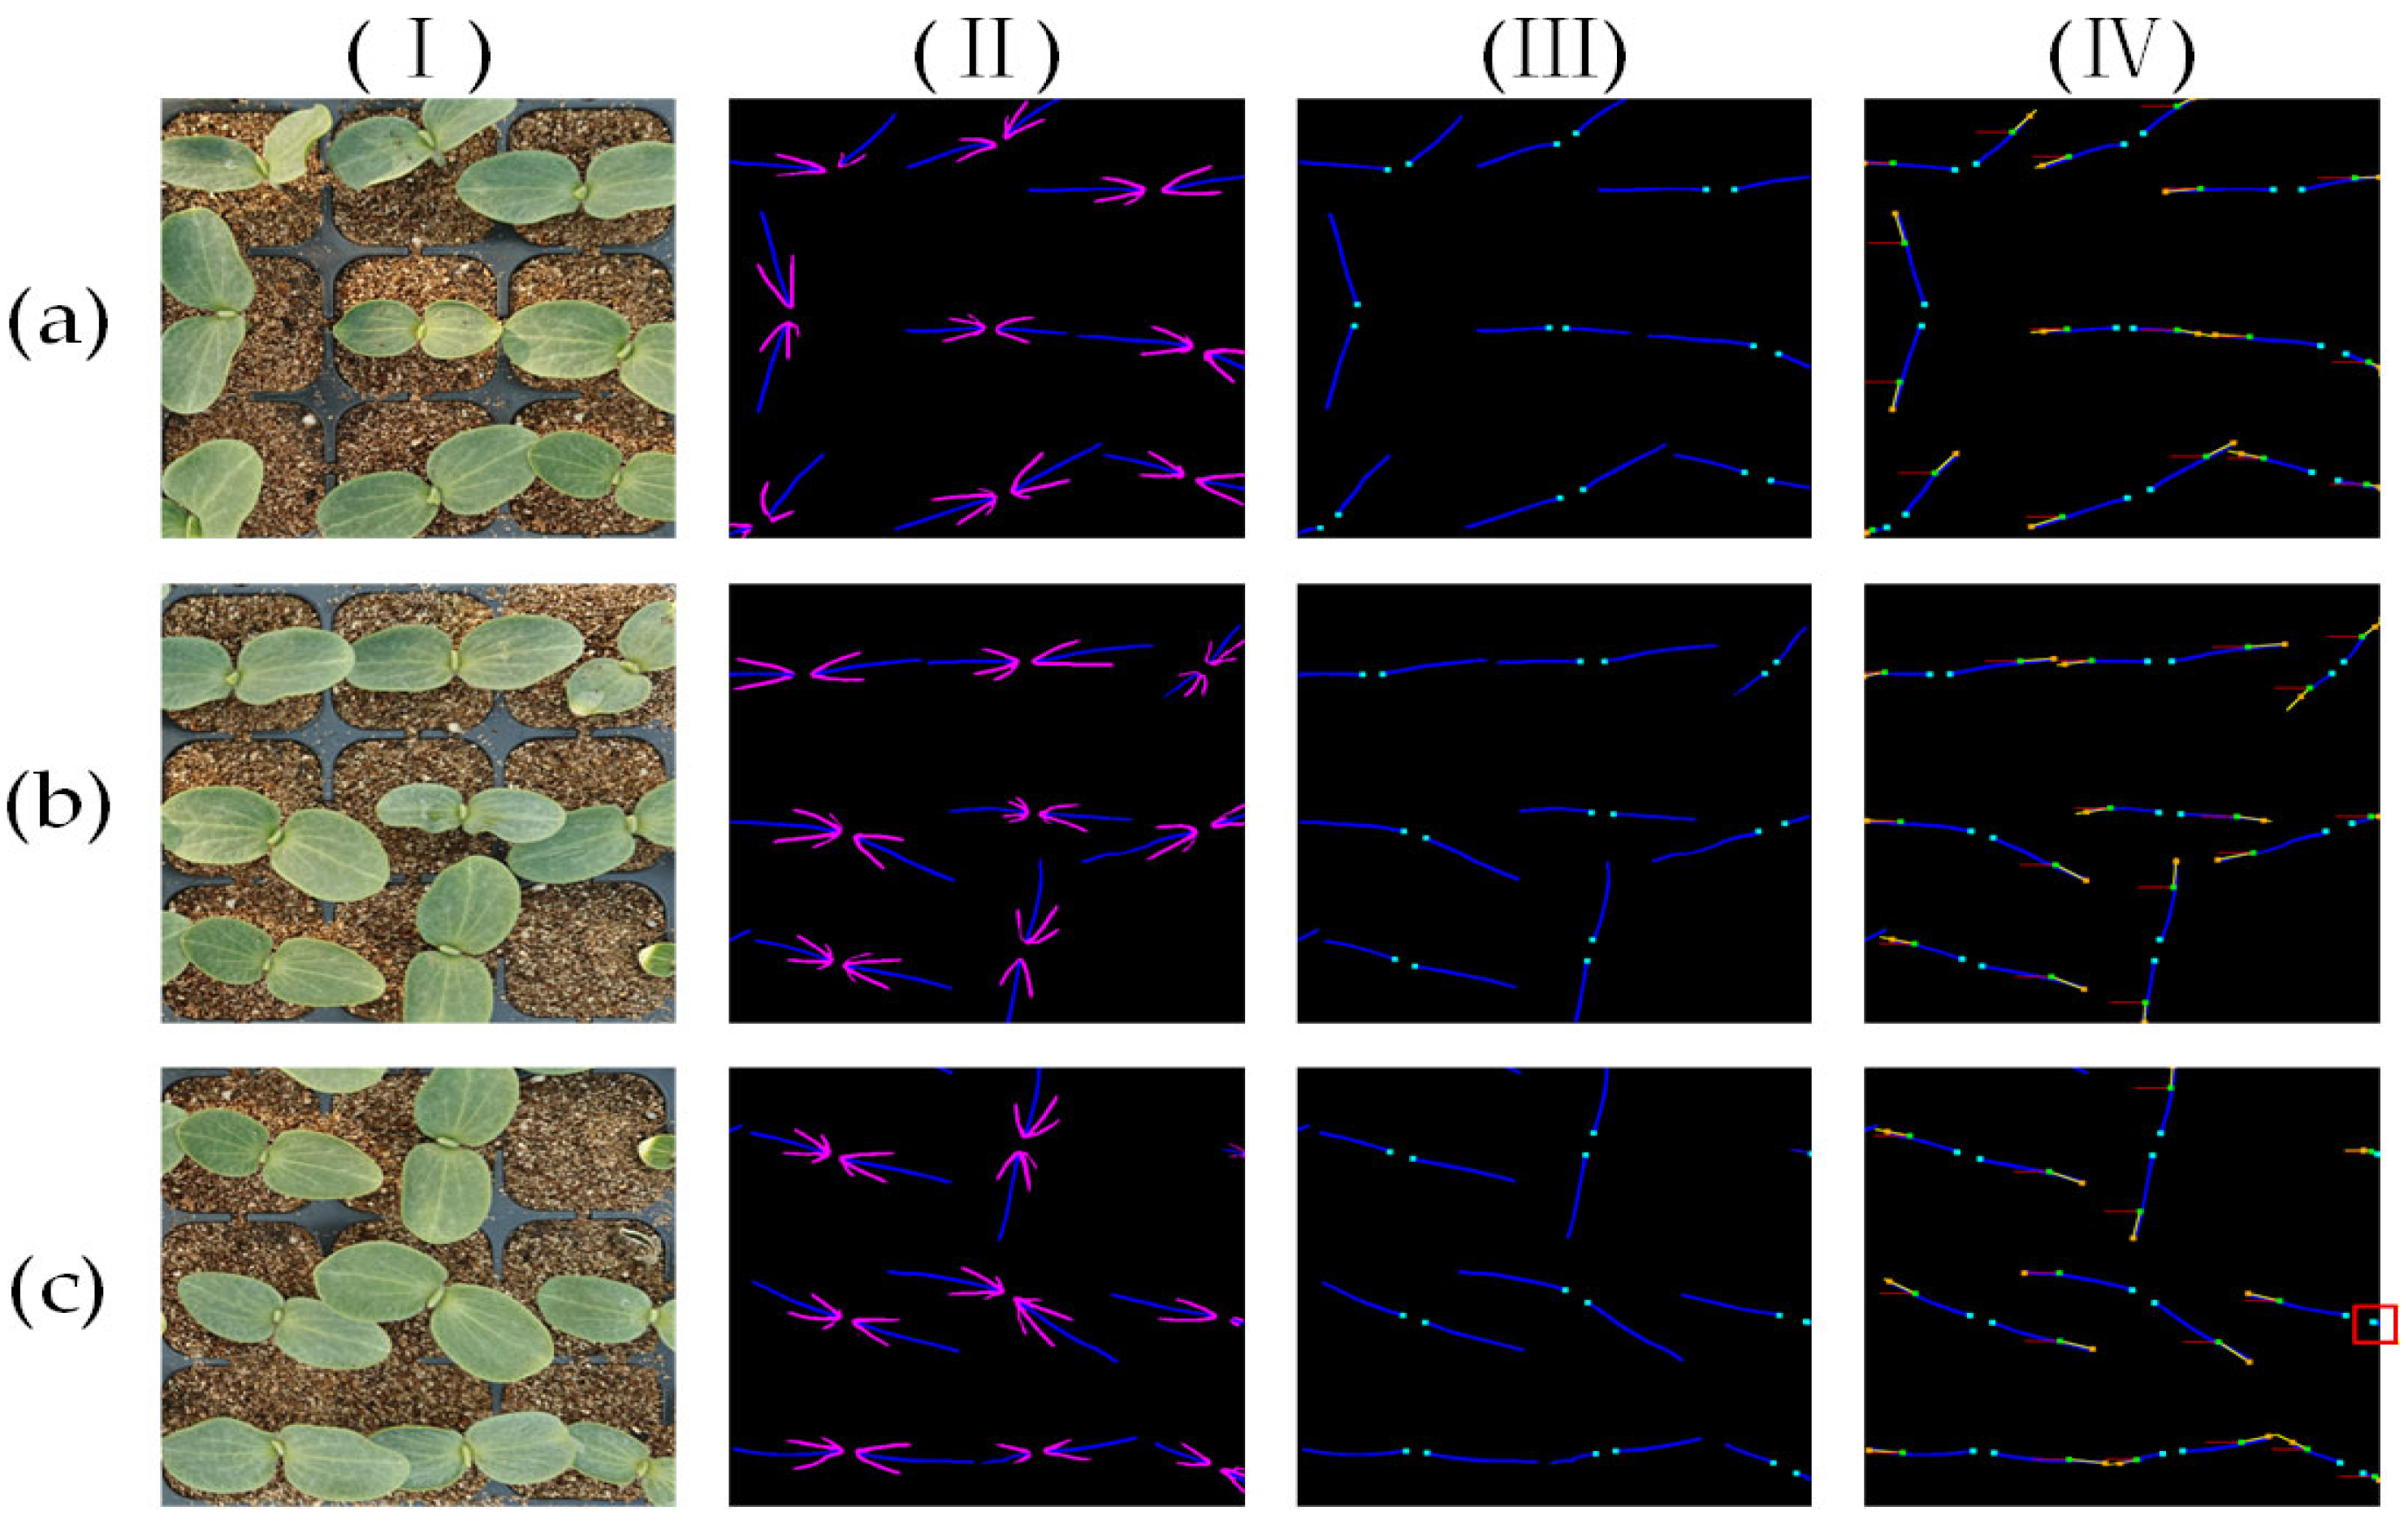
Fifty images were randomly selected to evaluate the proposed post-processing system. For ease of statistical analysis, all images were randomly divided into five groups. The leaf vein counting adhered to the following criteria: the theoretical number of veins was counted based on the presence of leaf root, while the correctly processed number was determined by the veins that were accurately identified by the system. The specific statistical results are presented in Table 6, and a visualization of the post-processing system is shown in Figure 14.
As shown in Table 6, the post-processing system achieved an average accuracy of 97.53%, demonstrating its ability to stably and accurately output cutting positions and angles. However, a small number of leaf veins were not correctly identified by the system. The primary reason for this is that parts of the marginal leaves extended beyond the current image, with only the leaf root remaining within it. Consequently, subsequent steps failed to extract complete main vein information, making it impossible to calculate correct cutting parameters. This case is illustrated by the red box in (IV) of Figure 14c. Furthermore, the performance of the post-processing system is dependent on the quality of the RGB segmentation mask generated by the DRE-Transformer.

4. Discussion

This study focuses on the challenges in pumpkin seedling leaf vein segmentation, such as insufficient feature extraction, irregular vein morphology, and the similarity between main and branch vein features. To address these, we propose the DRE-Former model with a targeted design. The Dynamic Frequency Convolution and Normalized Efficient Convolution module (DN Block) in the encoder enhances feature extraction of fine vein structures. The Region Transformer module replaces uniform patching with semantic-aware region modeling, better preserving the topological continuity of the vein network and reducing confusion between main and branch veins. The introduced Skip Connection Fusion Block (SCF Block) effectively mitigates the dilution of detailed features during decoding, improving edge clarity.
Experiments conducted on a pumpkin seedling dataset collected in February 2025 from Qingyuan District, Baoding City, Hebei Province, show that DRE-Former outperforms a series of benchmark models, including DeepLabv3+, UNet, and TransUNet, in key metrics such as mIoU and OA. In contrast, models such as SwinUNet and UNet exhibit limited ability to distinguish between main and branch vein features, resulting in lower overall accuracy. Through the synergistic design of its modules, DRE-Former achieves more accurate segmentation of main and branch veins in pumpkin seedlings. Experiments validating the effectiveness of the DFC module further indicate that its dynamic adaptive enhancement mechanism offers a clear advantage over static frequency filtering in extracting small target features. Ablation studies progressively verify the contribution of each module, and subsequent comparative experiments on the NEC module demonstrate that its channel stabilization enhancement strategy achieved through normalization and efficient convolution is more effective than the mere weight redistribution mechanisms of mainstream attention modules like SE, ECA, and CBAM.
Furthermore, stability tests conducted in a controlled environment show that DRE-Former exhibits good stability, with a small relative error compared to the main vein IoU in the dataset. The rule-based post-processing system developed in this study also demonstrates good practicality. Accuracy analysis confirms that the system can stably and accurately output cutting positions and angles.
Despite the promising performance of both the DRE-Former model and the post-processing system, this study has several limitations. First, the constructed dataset was collected from a single geographical location and a single pumpkin rootstock variety. While this controlled setting facilitates initial validation of the model architecture’s core performance, it may introduce seasonal bias and limit the model’s generalizability across different varieties and lighting conditions. Second, the parameter count and inference speed of DRE-Former are not yet ideal for lightweight deployment and require further optimization. The CE + Dice combined loss function used in this study was not systematically compared with other class imbalance handling strategies. And this study’s experimental comparisons primarily focused on mainstream deep learning segmentation models, lacking systematic comparisons with optimized traditional image processing methods or related hybrid baselines [53,54]. Third, the post-processing system lacks a robustness judgment mechanism for cases of incomplete vein segmentation, which could lead to system failure.
To address these issues, future research plans include: (1) Conducting data collection across multiple seasons, cultivars, and environments to construct a more representative and generalizable benchmark dataset. Additionally, setting up a dedicated imaging chamber with controllable light sources to enhance the model’s robustness to variations in operational lighting conditions and improve the system’s accuracy and stability in practical applications. (2) Performing lightweight and efficiency optimization on the model to adapt it to edge computing devices. A systematic comparison will be conducted to evaluate the effectiveness of traditional optimization methods, hybrid models, and various class imbalance handling strategies to explore better loss function designs and training strategies; (3) Introducing a segmentation quality assessment mechanism, such as one based on prediction confidence or structural integrity metrics, into the post-processing module, along with the design of alternative inference pathways, to improve the system’s robustness under abnormal conditions.

5. Conclusions

This study focuses on the precise segmentation of pumpkin seedling leaf veins and proposes a vein extraction and post-processing system that integrates deep learning with rule-based methods. The main contributions include the design of a three-class segmentation model, DRE-Former, targeting the main veins, branch veins, and background, as well as a post-processing system based on geometric analysis and rule-based reasoning for automatically determining the trimming position and angle.
Experimental results demonstrate that the DRE-Former model outperforms other mainstream segmentation models across multiple evaluation metrics, achieving a mean Intersection over Union (mIoU), mean F1-score, and overall accuracy of 90.80%, 93.97%, and 95.88%, respectively, which reflects its excellent classification and detail-preserving capabilities. In practical seedling vein segmentation tasks, the model exhibits good stability, with an average standard deviation of 0.60 and a difference in only 2.11% between the average relative error and the main vein IoU in the dataset.
The proposed post-processing system can rapidly and accurately output cutting points and angles based on the segmentation results, achieving an overall accuracy of 97.53% in testing. However, the system’s performance is highly dependent on the quality of the output from the front-end segmentation model.
In summary, the DRE-Former model and its post-processing system proposed in this study provide an effective technical solution for the automated leaf trimming of pumpkin seedlings and can offer reliable support for the development of subsequent grafting automation equipment.

Author Contributions

Conceptualization, H.J. and Y.X.; Methodology, Y.X. and H.J.; Software, Y.X., X.Q. and C.C.; Validation, H.J. and Y.X.; Formal analysis, Y.X. and C.C.; Investigation, G.L. and H.G.; Resources, H.J. and X.Q.; Data curation, Y.X., G.L. and H.G.; Writing—original draft preparation, Y.X. and C.C.; Writing—review and editing, Y.X., H.J. and X.Q.; Visualization, Y.X., X.Q., Y.W. and J.L.; Supervision, H.J.; Project administration, H.J.; Funding acquisition, H.J. All authors have read and agreed to the published version of the manuscript.

Funding

This research was funded by the Hebei Province Modern Agricultural Science and Technology Innovation Special Project (grant number 242N1901Z); Research on Robotic Technology for Panicle Tomato Cultivation (grant number 2Y2024001).

Institutional Review Board Statement

Not applicable.

Data Availability Statement

Data are available from the corresponding author upon reasonable request.

Acknowledgments

The authors gratefully acknowledge the editors and anonymous reviewers for their constructive comments on our manuscript.

Conflicts of Interest

The authors declare no conflicts of interest.

References

  1. Bantis, F.; Koukounaras, A.; Siomos, A.S.; Dangitsis, C. Impact of Scion and Rootstock Seedling Quality Selection on the Vigor of Watermelon–Interspecific Squash Grafted Seedlings. Agriculture 2020, 10, 326. [Google Scholar] [CrossRef] [Scilit]
  2. Ding, X.; Wang, B.; He, Z.; Shi, Y.; Li, K.; Cui, Y.; Yang, Q. Fast and precise DEM parameter calibration for Cucurbita ficifolia seeds. Biosyst. Eng. 2023, 236, 258–276. [Google Scholar] [CrossRef] [Scilit]
  3. Ding, X.; Chen, T.; Wei, Y.; He, Z.; Cui, Y.; Yang, Q. Design and Implementation of the Positioning and Directing Precision Seeder for Cucurbita Ficifolia Seeds. Appl. Eng. Agric. 2024, 40, 1–14. [Google Scholar] [CrossRef] [Scilit]
  4. Yetısir, H.; Sari, N.; Yucel, S. Rootstock resistance to Fusarium wilt and effect on watermelon fruit yield and quality. Phytoparasitica 2003, 31, 163–169. [Google Scholar] [CrossRef] [Scilit]
  5. Thies, J.A.; Ariss, J.J.; Kousik, C.S.; Hassell, R.L.; Levi, A. Resistance to southern root-knot nematode (Meloidogyne incognita) in wild watermelon (Citrullus lanatus var. citroides). J. Nematol. 2016, 48, 14–19. [Google Scholar] [CrossRef] [Scilit] [PubMed]
  6. Nawaz, M.A.; Wang, L.; Jiao, Y.; Chen, C.; Zhao, L.; Mei, M.; Yu, Y.; Bie, Z.; Huang, Y. Pumpkin rootstock improves nitrogen use efficiency of watermelon scion by enhancing nutrient uptake, cytokinin content, and expression of nitrate reductase genes. Plant Growth Regul. 2017, 82, 233–246. [Google Scholar] [CrossRef] [Scilit]
  7. Yang, Y.; Lu, X.; Yan, B.; Li, B.; Sun, J.; Guo, S.; Tezuka, T. Bottle gourd rootstock-grafting affects nitrogen metabolism in NaCl-stressed watermelon leaves and enhances short-term salt tolerance. J. Plant Physiol. 2013, 170, 653–661. [Google Scholar] [CrossRef] [Scilit]
  8. Shi, X.; Wang, X.; Cheng, F.; Cao, H.; Liang, H.; Lu, J.; Kong, Q.; Bie, Z. iTRAQ-based quantitative proteomics analysis of cold stress-induced mechanisms in grafted watermelon seedlings. J. Proteom. 2019, 192, 311–320. [Google Scholar] [CrossRef] [Scilit]
  9. Yavuz, D.; Seymen, M.; Suheri, S.; Yavuz, N.; Turkmen, O.; Kurtar, E.S. How do rootstocks of citron watermelon (Citrullus lanatus var. citroides) affect the yield and quality of watermelon under deficit irrigation? Agric. Water Manag. 2020, 241, 106351. [Google Scholar] [CrossRef] [Scilit]
  10. Huang, Y.; Zhao, L.; Kong, Q.; Cheng, F.; Niu, M.; Xie, J.; Nawaz, M.A.; Bie, Z. Comprehensive mineral nutrition analysis of watermelon grafted onto two different rootstocks. Hortic. Plant J. 2016, 2, 105–113. [Google Scholar] [CrossRef] [Scilit]
  11. Hassell, R.L.; Memmott, F.; Liere, D.G. Grafting methods for watermelon production. HortScience 2008, 43, 1677–1679. [Google Scholar] [CrossRef] [Scilit]
  12. Lin, Y. The Optimization for the Rootstock’s Varieties and Key Technology of the Watermelon Grafted Seedlings. Master’s Thesis, Shanghai Jiao Tong University, Shanghai, China, 2015. [Google Scholar]
  13. Memmott, F.D.; Hassell, R.L. Watermelon (Citrullus lanatus) grafting method to reduce labor cost by eliminating rootstock side shoots. Acta Hortic. 2010, 871, 389–394. [Google Scholar] [CrossRef] [Scilit]
  14. Devi, P.; Lukas, S.; Miles, C. Advances in watermelon grafting to increase efficiency and automation. Horticulturae 2020, 6, 88. [Google Scholar] [CrossRef] [Scilit]
  15. Zheng, X.; Wang, X. Leaf Vein Extraction Using a Combined Operation of Mathematical Morphology. In Proceedings of the 2010 2nd International Conference on Information Engineering and Computer Science, Wuhan, China, 25–26 December 2010. [Google Scholar]
  16. Lee, K.B.; Hong, K.S. An implementation of leaf recognition system using leaf vein and shape. Int. J. Biosci. Biotechnol. 2013, 5, 57–66. [Google Scholar]
  17. Bühler, J.; Rishmawi, L.; Pflugfelder, D.; Huber, G.; Scharr, H.; Hülskamp, M.; Koornneef, M.; Schurr, U.; Jahnke, S. phenoVein—A tool for leaf vein segmentation and analysis. Plant Physiol. 2015, 169, 2359–2370. [Google Scholar] [CrossRef] [Scilit]
  18. Li, Y.; Zhang, H.; Yang, T.; Ma, Z.; Li, S. Vein detection method based on fuzzy logic and multiple order morphology. Sci. Silvae Sin. 2018, 54, 70–77. [Google Scholar]
  19. Selda, J.D.S.; Ellera, R.M.R.; Cajayon, L.C.; Vicerra, R.R.P.; Bandala, A.A.; Dadios, E.P. Plant identification by image processing of leaf veins. In Proceedings of the International Conference on Imaging, Signal Processing and Communication, Kuala Lumpur, Malaysia, 26–28 July 2017; pp. 40–44. [Google Scholar]
  20. Samanta, G.; Chakrabarti, A.; Bhattacharya, B.B. Extraction of leaf-vein parameters and classification of plants using machine learning. Proceedings of International Conference on Frontiers in Computing and Systems, Shillong, India, 29 September–1 October 2021; Springer: Singapore, 2021; pp. 579–586. [Google Scholar]
  21. Zhu, J.; Yao, J.; Yu, Q.; Zhang, B.; Li, B. A fast and automatic method for leaf vein network extraction and vein density measurement based on object-oriented classification. Front. Plant Sci. 2020, 11, 499. [Google Scholar] [CrossRef] [Scilit]
  22. Westphal, E.; Seitz, H. A machine learning method for defect detection and visualization in selective laser sintering based on convolutional neural networks. Addit. Manuf. 2021, 41, 101965. [Google Scholar] [CrossRef] [Scilit]
  23. Ulku, I.; Akagunduz, E. A survey on deep learning-based architectures for semantic segmentation on 2d images. Appl. Artif. Intell. 2022, 36, 2032924. [Google Scholar] [CrossRef] [Scilit]
  24. Lu, W.; Chen, J.; Xue, F. Using computer vision to recognize composition of construction waste mixtures: A semantic segmentation approach. Resour. Conserv. Recycl. 2022, 178, 106022. [Google Scholar] [CrossRef] [Scilit]
  25. Xu, H.; Blonder, B.; Jodra, M.; Maldonado, M.; Enquist, B.J.; Kerkhoff, A.J.; Wang, Z.; Wang, S.; Wang, R.; Wang, X.; et al. Automated and accurate segmentation of leaf venation networks via deep learning. New Phytol. 2021, 229, 631–648. [Google Scholar] [CrossRef] [Scilit]
  26. Yang, X.; Xia, X.; Zhang, Z.; Nong, B.; Li, D. Identification of anthocyanin biosynthesis genes in rice pericarp using PCAMP. Plant Biotechnol. J. 2019, 17, 1700–1702. [Google Scholar] [CrossRef] [Scilit] [PubMed]
  27. Li, L.; Hu, W.; Lu, J.; Zhang, H.; Luo, Q.; Wu, X. Leaf vein segmentation with self-supervision. Comput. Electron. Agric. 2022, 203, 107352. [Google Scholar] [CrossRef] [Scilit]
  28. Iwamasa, K.; Noshita, K. Network feature-based phenotyping of leaf venation robustly reconstructs the latent space. PLoS Comput. Biol. 2023, 19, e1010581. [Google Scholar] [CrossRef] [Scilit] [PubMed]
  29. Cai, W.; Wang, B.; Zeng, F. CUDU-Net: Collaborative up-sampling decoder U-Net for leaf vein segmentation. Digit. Signal Process. 2024, 144, 104287. [Google Scholar] [CrossRef] [Scilit]
  30. Deepalakshmi, P.; Lavanya, K. Plant leaf disease detection using CNN algorithm. Int. J. Inf. Syst. Model. Des. 2021, 12, 1–21. [Google Scholar] [CrossRef] [Scilit]
  31. Beikmohammadi, A.; Faez, K.; Motallebi, A. SWP-LeafNET: A novel multistage approach for plant leaf identification based on deep CNN. Expert Syst. Appl. 2022, 202, 117470. [Google Scholar] [CrossRef] [Scilit]
  32. Zifen, H.; Junxuan, H.; Qiang, L.; Yinhui, Z. High Precision Identification of Apple Leaf Diseases Based on Asymmetric Shuffle Convolution. J. Agric. Mach. 2021, 52, 221–230. [Google Scholar]
  33. Lu, L.; Hui, L.; Ran, S. Segmentation of Plant Leaves and Features Extraction Based on Muti-view and Time-series Image. J. Agric. Mach. 2022, 53, 253–260. [Google Scholar]
  34. Barth, R.; Ijsselmuiden, J.; Hemming, J.; Henten, E.V. Data synthesis methods for semantic segmentation in agriculture: A Capsicum annuum dataset. Comput. Electron. Agric. 2018, 144, 284–296. [Google Scholar] [CrossRef] [Scilit]
  35. Miao, C.; Xu, Z.; Rodene, E.; Yang, J.; Schnable, J.C. Semantic segmentation of sorghum using hyperspectral data identifies genetic associations. Plant Phenomics 2020, 2020, 4216373. [Google Scholar] [CrossRef] [Scilit] [PubMed]
  36. Kolhar, S.; Jagtap, J. Convolutional neural network based encoder-decoder architectures for semantic segmentation of plants. Ecol. Inform. 2021, 64, 101373. [Google Scholar] [CrossRef] [Scilit]
  37. Masuda, T. Leaf area estimation by semantic segmentation of point cloud of tomato plants. In Proceedings of the IEEE/CVF International Conference on Computer Vision, Montreal, BC, Canada, 11–17 October 2021; pp. 1381–1389. [Google Scholar]
  38. Howard, A.G.; Zhu, M.; Chen, B.; Kalenichenko, D.; Wang, W.; Weyand, T.; Andreetto, M.; Adam, H. MobileNets: Efficient Convolutional Neural Networks for Mobile Vision Applications. arXiv 2017, arXiv:1704.04861. [Google Scholar] [CrossRef] [Scilit]
  39. Simonyan, K.; Zisserman, A. Very Deep Convolutional Networks for Large-Scale Image Recognition. arXiv 2015, arXiv:1409.1556. [Google Scholar] [CrossRef] [Scilit]
  40. Dosovitskiy, A.; Beyer, L.; Kolesnikov, A.; Weissenborn, D.; Zhai, X.; Unterthiner, T.; Dehghani, M.; Minderer, M.; Heigold, G.; Gelly, S.; et al. An Image is Worth 16x16 Words: Transformers for Image Recognition at Scale. arXiv 2021, arXiv:2010.11929. [Google Scholar] [CrossRef] [Scilit]
  41. Zhu, Q.; Gao, Y.; Li, J. Influence of Different Clipping Areas for Rootstock Cotyledon on the Growth of Grafted Cucumber. Guizhou Agric. Sci. 2014, 42, 92–97. [Google Scholar]
  42. Minervini, M.; Fischbach, A.; Scharr, H.; Tsaftaris, S.A. Finely-grained annotated datasets for image-based plant phenotyping. Pattern Recognit. Lett. 2016, 81, 80–89. [Google Scholar] [CrossRef] [Scilit]
  43. Ubbens, J.R.; Stavness, I. Deep plant phenomics: A deep learning platform for complex plant phenotyping tasks. Front. Plant Sci. 2017, 8, 1190. [Google Scholar] [CrossRef] [Scilit]
  44. Ward, D.; Moghadam, P.; Hudson, N. Deep leaf segmentation using synthetic data. In Proceedings of the British Machine Vision Conference (BMVC), Newcastle, UK, 3–6 September 2018. [Google Scholar]
  45. Kline, D.M.; Berardi, V.L. Revisiting squared-error and cross-entropy functions for training neural network classifiers. Neural Comput. Appl. 2005, 14, 310–318. [Google Scholar] [CrossRef] [Scilit]
  46. Milletari, F.; Navab, N.; Ahmadi, S.A. V-net: Fully convolutional neural networks for volumetric medical image segmentation. In Proceedings of the 2016 Fourth International Conference on 3D Vision (3DV), Stanford, CA, USA, 25–28 October 2016; pp. 565–571. [Google Scholar]
  47. Chen, L.C.; Zhu, Y.; Papandreou, G.; Schroff, F.; Adam, H. Encoder-decoder with atrous separable convolution for semantic image segmentation. In Computer Vision–ECCV 2018; Springer: Cham, Switzerland, 2018; pp. 801–818. [Google Scholar]
  48. Ronneberger, O.; Fischer, P.; Brox, T. U-Net: Convolutional Networks for Biomedical Image Segmentation. In Medical Image Computing and Computer-Assisted Intervention–MICCAI 2015; Springer: Cham, Switzerland, 2015; pp. 234–241. [Google Scholar]
  49. Zhong, C.; Hu, Z.; Li, M.; Wang, K.; Li, J. Real-time semantic segmentation model for crop disease leaves using group attention module. Trans. Chin. Soc. Agric. Eng. 2021, 37, 208–215. [Google Scholar]
  50. Cao, H.; Wang, Y.; Chen, J.; Jiang, D.; Zhang, X.; Tian, Q.; Wang, M. Swin-UNet: UNet-Like Pure Transformer for Medical Image Segmentation. In Computer Vision–ECCV 2022 Workshops; Springer: Cham, Switzerland, 2023; pp. 205–218. [Google Scholar]
  51. Chen, P.; Ma, Z.; Zhang, J.; Xia, Y.; Wang, B.; Liang, D. Semantic segmentation network based on attention mechanism for wheat FHB. J. Chin. Agric. Mech. 2023, 44, 145–152. [Google Scholar]
  52. Chen, J.; Lu, Y.; Yu, Q.; Luo, X.; Adeli, E.; Wang, Y.; Lu, L.; Yuille, A.L.; Zhou, Y. TransUNet: Transformers Make Strong Encoders for Medical Image Segmentation. arXiv 2021, arXiv:2102.04306. [Google Scholar] [CrossRef] [Scilit]
  53. Wang, N.; Wu, Q.; Gui, Y.; Hu, Q.; Li, W. Cross-Modal Segmentation Network for Winter Wheat Mapping in Com-plex Terrain Using Remote-Sensing Multi-Temporal Images and DEM Data. Remote Sens. 2024, 16, 1775. [Google Scholar] [CrossRef] [Scilit]
  54. Chen, J.; Sun, L.; Song, Y.; Geng, Y.; Xu, H.; Xu, W. 3D Surface Highlight Removal Method Based on Detection Mask. Arab. J. Sci. Eng. 2025, 1–13. [Google Scholar] [CrossRef] [Scilit]
Figure 1. The scene of cutting pumpkin rootstocks. Where (a) is the scenario where the pumpkin stock has not been cut. (b) The scene where the pumpkin rootstock has already been cut.
Agriculture 16 00194 g001
Figure 2. Images of pumpkin seedlings under various environmental conditions.
Agriculture 16 00194 g002
Figure 3. Vein marking images. Where the red ones are the main veins and the green ones are the branch veins, and (a), (b), (c), respectively, represent different picture annotations of groups 1, 2, and 3.
Agriculture 16 00194 g003
Figure 4. Example of data-augmented pumpkin seedling images. Where (a) and (b), respectively, represent the data augmentation of the first group and the second group, each group includes translation, rotation, mirroring, Gaussian blur and saturation adjustment.
Agriculture 16 00194 g004
Figure 5. Overall architecture of the DRE-Former model.
Agriculture 16 00194 g005
Figure 6. Structure of the Dynamic Frequency Conv and Normalized Efficient Conv (DN Block) module.
Agriculture 16 00194 g006
Figure 7. Structure of the Region Transformer Block module.
Agriculture 16 00194 g007
Figure 8. Structure of the Skip Connection Fusion Block (SCF Block) module.
Agriculture 16 00194 g008
Figure 9. The various stages of post-processing. Where (I) is the original image, (II) is the DRE-Former segmentation image, the blue part represents the main vein, and the pink part represents the main vein. (III) is the preprocessing result image, and the red part is at the intersection of the main and branch veins. (IV) is the marking leaf root result image, and the cyan dots are the leaf roots. (V) is the cutting position and cutting angle result image, the green dots are the cutting points, the red line is starting vector, the yellow line is stopping vector, and the angle between the starting vector and the stopping vector of the cutting angle.
Agriculture 16 00194 g009
Figure 10. Qualitative comparison of segmentation results between DRE-Former and other networks. The red dot box highlights the places where recognition errors occurred. In Ground Truth, red is the main vein and green is the branch vein. In DRE Former, blue is the main vein and pink is the branch vein. In the remaining different model images, yellow represents the main vein and green represents the branch vein.
Agriculture 16 00194 g010
Figure 11. Fast Fourier Transform spectrograms and Fourier reconstruction images. Where (I) is the original image, (II) is the frequency spectrum image, and (III) is the frequency reconstruction image, and (a), (b), (c), respectively, represent groups 1, 2, and 3 different pictures.
Agriculture 16 00194 g011
Figure 12. Fast Fourier Transform comparative images. Where columns (IIII) denote different image types: (I) is the original image, (II) represents the frequency reconstruction image, and (III) corresponds to the Laplacian Conv extraction image; rows (ac) correspond to three distinct sample groups, where (a), (b), and (c) stand for Group 1, Group 2, and Group 3, respectively.
Agriculture 16 00194 g012
Figure 13. DFC enhanced contrast image. Where (I) is the frequency reconstruction image, (II) is the enhanced frequency reconstruction image, (III) is the frequency spectrum image, and (IV) is the enhanced frequency spectrum image, and (a), (b), (c), respectively, represent groups 1, 2, and 3 different pictures.
Agriculture 16 00194 g013
Figure 14. Visualization of the post-processing stage. The red dot box highlights the veins of the leaves that were not correctly analyzed by the post-processing system. Where (I) is the original image, (II) is the DRE-Former segmentation image. (III) shows the identification of leaf root conditions. (IV) presents the calculation of the cutting position and cutting angle, and (a), (b), (c), respectively, represent groups 1, 2, and 3 different pictures.
Agriculture 16 00194 g014
Table 1. Validation results of different segmentation models on the pumpkin seedlings dataset (n = 4763 images).
ModelBackgroundsMain VeinBranch VeinsmIoU (%)mF1 (%)OA (%)
IOU (%)F1 (%)IOU (%)F1 (%)IOU (%)F1 (%)
Deeplabv3+95.13 ± 0.0297.51 ± 0.0278.37 ± 0.0982.97 ± 0.0975.56 ± 0.1180.37 ± 0.1183.02 ± 0.0686.95 ± 0.0684.46 ± 1.03
UNet95.27 ± 0.0297.32 ± 0.0280.11 ± 0.0984.49 ± 0.0976.58 ± 0.1180.92 ± 0.1183.98 ± 0.0687.57 ± 0.0686.28 ± 0.98
GAM-Seg95.56 ± 0.0297.62 ± 0.0283.45 ± 0.0987.19 ± 0.0978.27 ± 0.1183.68 ± 0.1185.76 ± 0.0689.49 ± 0.0688.39 ± 0.91
SwinUNet95.79 ± 0.0297.43 ± 0.0285.39 ± 0.0989.26 ± 0.0980.42 ± 0.1184.53 ± 0.1187.20 ± 0.0690.40 ± 0.0687.62 ± 0.94
UNetA96.05 ± 0.0297.84 ± 0.0287.64 ± 0.0991.44 ± 0.0982.79 ± 0.1187.74 ± 0.1188.82 ± 0.0692.34 ± 0.0688.57 ± 0.90
TransUNet95.83 ± 0.0297.13 ± 0.0286.45 ± 0.0992.21 ± 0.0981.16 ± 0.1188.28 ± 0.1187.81 ± 0.0692.54 ± 0.0689.83 ± 0.86
DRE-Former96.57 ± 0.0298.02 ± 0.0290.21 ± 0.0994.21 ± 0.0985.63 ± 0.1189.70 ± 0.1190.80 ± 0.0693.97 ± 0.0695.88 ± 0.56
Values are presented as mean ± half-width of the 95% confidence interval. The half-widths are calculated based on estimated standard deviations derived from the semantic segmentation literature [42,43,44]: 0.8% for Background, 3.0% for Main Vein, 4.0% for Branch Veins, and 2.0% for mIoU and mF1. For OA, the half-width is computed using the binomial proportion formula. In the table, IOU denotes Intersection over Union, F1 denotes the harmonic mean of precision and recall, and OA denotes Overall Accuracy. mF1 and mIOU represent their respective mean values.
Table 2. Comparison of boundary segmentation quality and computational efficiency. Bold values indicate the best performance for each metric.
ModelBF-Score (%)Params (M)FPS
Main VeinBranch Veins
Deeplabv3+72.1368.5154.6838
UNet75.8271.2524.8942
GAM-Seg78.9174.6646.5329
SwinUNet81.5477.3889.5321
UNetA83.7879.1237.4134
TransUNet84.2379.8467.9727
DRE-Former87.5683.2172.4226
In the table, BF-Score denotes the Boundary F1-Score, Params denotes the number of parameters, and FPS denotes Frames Per Second.
Table 3. Ablation experiments of DRE-Former, where √ denotes that the corresponding module is used and bold values indicate the best performance.
Expert 1Expert 2Expert 3IOU (%)mIoU (%)OA (%)
BackgroundsMain VeinBranch Veins
95.8386.4581.1687.8189.83
95.9687.2882.8188.6890.36
96.2789.6184.9490.2794.97
96.5790.2185.6390.8095.88
In the table, IOU denotes Intersection over Union, OA denotes Overall Accuracy, and mIOU represents their respective mean value.
Table 4. Performance comparison between NEC and different attention modules. Bold values indicate the best performance for each metric.
ModelIOU (%)mIoU
(%)
OA
(%)
BackgroundsMain VeinBranch Veins
SE95.8087.5082.0088.4394.00
ECA95.9687.2882.8188.6890.36
CBAM96.2789.6184.9490.2794.97
NEC96.5790.2185.6390.8095.88
In the table, IOU denotes Intersection over Union, OA denotes Overall Accuracy, and mIOU represents their respective mean value.
Table 5. The segmentation results of the main veins.
TargetTrue Length (mm)Pitch Angle (deg)Max Segmentation Length (mm)Min Segmentation Length (mm)Average Segmentation Ratio (%)Relative Error (%)Standard Deviation
14932.0544.5242.1588.7811.220.67
24628.5741.5840.0288.8411.160.44
34538.4840.9338.7787.8712.130.68
44434.6239.9537.7988.8311.170.54
54536.8740.9138.7388.1611.840.68
64231.5937.8635.9287.8912.110.63
75227.4947.0144.9187.2912.710.63
84621.6941.1339.2487.1412.860.47
94746.3442.6540.4888.4211.580.59
104541.8140.6638.7787.8912.110.57
115446.2448.7346.3688.1811.820.69
124337.2038.6736.7887.9312.080.60
Table 6. Statistical results of the post-processing analysis.
GroupTheoretical NumberAccurate NumberAccuracy (%)
117416997.12
218318098.36
317817497.75
418417896.73
517517197.71
Disclaimer/Publisher’s Note: The statements, opinions and data contained in all publications are solely those of the individual author(s) and contributor(s) and not of MDPI and/or the editor(s). MDPI and/or the editor(s) disclaim responsibility for any injury to people or property resulting from any ideas, methods, instructions or products referred to in the content.