Article

The Impact of Rural Population Aging on Food Prices: Empirical Evidence from China
1
College of Earth and Environmental Sciences, Lanzhou University, Lanzhou 730000, China
2
Key Laboratory of Western China’s Environmental Systems (Ministry of Education), Lanzhou University, Lanzhou 730000, China
3
Institute of Ecological Civilization Construction Research and Assessment, Lanzhou University, Lanzhou 730000, China
*
Author to whom correspondence should be addressed.
Agriculture 2026, 16(17), 1881; https://doi.org/10.3390/agriculture16171881 (registering DOI)
Submission received: 15 June 2026 / Revised: 23 August 2026 / Accepted: 25 August 2026 / Published: 30 August 2026
(This article belongs to the Section Agricultural Economics, Policies and Rural Management)

Abstract

Stabilizing food prices is essential for ensuring food security in an aging society. Using panel data from 30 Chinese provinces spanning 2005 to 2022, this study employs a nonlinear panel model and a Spatial Durbin Model (SDM) to analyze the impact of rural population aging on food prices and its spatial spillover effects. This study derives the following findings based on empirical research: (1) Rural population aging exhibits a significant inverted U-shaped relationship with food prices, with an inflection point at approximately 19.03%. Before reaching this point, rural population aging helps facilitate food prices. When the inflection point is passed, rural population aging adversely impacts food prices. This effect is significant in western regions but not in eastern and central regions. (2) Farmland transfer and agricultural technological progress significantly influence this relationship, causing the curve to reverse into a U-shaped pattern, which implies a gradual future increase in food prices. (3) Local rural population aging has a significant U-shaped spillover effect on food prices in neighboring provinces. These findings indicate that China’s rural population aging presents a complex dynamic for food price fluctuations. To address the current changes in the population and capital structure and ensure food security, the government will need to formulate forward-looking policies, further improve socialized agricultural services, and systematically optimize food production models.

1. Introduction

As an important part of the agricultural product market, stable food prices play a crucial role in ensuring people’s livelihoods, maintaining social stability, and safeguarding food security in a country or region [1,2]. Therefore, improving agricultural production efficiency and ensuring food quality and yield increases serve as the cornerstones for mitigating food price fluctuations and promoting stable social development. Traditional agricultural production involves three major factors: capital, land, and agricultural labor. Among these, agricultural labor, particularly young labor, plays a crucial role in farm output and productivity enhancement [3,4]. With declining fertility rates, the introduction of elderly welfare policies, and continuous improvements in healthcare, the proportion of the elderly population has been gradually increasing, making population aging an important phenomenon in contemporary social development. According to data from the Seventh National Population Census in 2020 in China, the total number of elderly people aged 60 and above reached 264 million, accounting for 18.70% of the total population, an increase of 5.44 percentage points compared with the 2010 census. The number of elderly people aged 65 and above reached 191 million, accounting for 13.50%. In rural areas, 23.81% of the population was aged 60 and over, and 17.72% was aged 65 and over. Based on World Health Organization classification standards, China’s population aging exhibits a significant and rapidly developing trend and has entered a stage of comprehensive aging [5]. Population aging has become a significant phenomenon in the demographic transition occurring amid today’s social development. The rural population has far-reaching and multidimensional impacts on the grain pricing system by reshaping the supply of rural human capital, consumption patterns, and the transmission mechanisms of macroeconomic policies.
Although farmers are the mainstay of grain production, access to grain is still influenced by numerous factors. Chinese society exhibits a distinct urban-rural dichotomy, and the food supply system in urban areas is characterized by a marked spatial separation between “production areas” and “consumption areas.” While its core sources rely heavily on agricultural production in rural areas, this dependence is not merely a matter of geographical displacement but is realized through complex cross-regional logistics networks, market integration mechanisms, and factor substitution processes [6,7]. With the acceleration of urbanization, the shift in the structure of residents’ food consumption demand presents mounting challenges to the urban food supply system [8]. The source structure of urban food supply is undergoing a profound evolution from “local self-sufficiency” to a coexistence of “centralized supply from major production areas” and “global supplementation.” Currently, rural production and supplies from major grain-producing regions still dominate. From the perspective of production factors, China has a vast rural population, and farmers remain a force in agricultural production that cannot be ignored. Clarifying the profound impact of the aging rural population on agricultural production is of great significance for ensuring food security.
At the macro level, food prices constitute a core component of the Consumer Price Index (CPI) and exert significant influence on inflation expectations, monetary policy formulation, and the burden of fiscal subsidies [9]. At the micro level, food prices directly affect farmers’ income and the Engel coefficient, particularly impacting the basic living costs and nutritional accessibility of low-income groups [10,11]. Currently, China has proposed the development strategy of a “Greater Food Approach”, which sets higher demands for food production and security. The impact of food prices, especially those of staple foods, on food security has become increasingly non-negligible. Moreover, food prices exhibit significant spatial linkage, as price fluctuations in neighboring provinces affect local prices through market flows. Therefore, the formation of reasonable food prices requires coordination between market mechanisms and policy regulation to balance farmers’ income, stabilize supply, and ensure national food security. In summary, under the context of intensifying rural population aging, examining changes in food prices can effectively help understand the impact of aging on food price fluctuations, thereby enabling the rational formulation of corresponding strategic measures for food security. Accordingly, the objectives of this paper are as follows: (1) Establishing appropriate econometric models based on existing research to explore the relationship between rural population aging and food prices. (2) Applying comprehensive geographic and econometric methods to analyze the spatial distribution characteristics of rural population aging and food prices, and further examine the spatial spillover effects. (3) Proposing corresponding policy recommendations for food security and sustainable development based on the empirical findings. The remainder of this paper is organized as follows: Section 2 presents a literature review and theoretical analysis of rural population aging and food prices. Section 3 introduces the model methods and data used in this study. Section 4 conducts empirical research and results analysis. Section 5 summarizes the research findings and provides a discussion. Section 6 proposes corresponding policy recommendations.

2. Literature Review and Theoretical Analysis

2.1. Literature Review

2.1.1. Rural Population Aging and Demographic Transition

The essence of rural population aging lies in changes to the rural population structure. Countries around the world are experiencing significant shifts in their population structures, particularly in nations or regions undergoing rapid urbanization and industrialization. However, there are notable differences in this transition between developed and developing countries. According to Min’s research [12], the average household size among farming households in South Korea decreased from 2.9 people in 2000 to 2.2 people in 2020, resulting in a severe labor shortage. In contrast, the demographic changes in rural Europe are characterized by the dual phenomena of “hollowing out” and “aging.” Some older adults are relocating from cities to rural areas with more livable environments to spend their retirement years, causing the rural population to age at a faster rate than the urban population [13]. By comparison, countries in Africa are in the early to mid-stages of demographic transition and have an abundant labor force [14].
As the world’s largest developing country, China has a massive population. According to the China Population and Development Research Center (CPDRC), China’s elderly population is projected to reach 440 million by 2037, which indicates that China is gradually entering an aging society. Labor is an essential resource factor in agricultural production and plays a crucial role in the utilization of agricultural resources and food production [15,16]. However, with the acceleration of China’s industrialization and urbanization, the rural labor force has been continuously shifting to urban industrial and non-agricultural sectors, leading to a persistent decline in the young and middle-aged rural labor force. As a result, agricultural production faces the dual pressures of a severe “labor shortage” and rising agricultural costs [17,18,19].

2.1.2. The Impact of Food Prices and Policy Implications

Food prices have long been a major topic of research both domestically and internationally. Hassen and Yimam [20] point out that food price volatility may have a significant negative impact on food consumption. For low-income households, an increase in average food prices by US$ 0.0085 could increase the probability of food insecurity by 94%. Valera et al. [21] argue that rice prices have an even greater impact on inflation than fuel prices, exerting a more substantial influence on both the economic market and social stability in the Philippines. Apergis and Rezitis [22] adopt a GARCH model and find that short-term deviations between food price volatility and macroeconomic factors exhibit a positive effect, thereby increasing uncertainty in the food market. However, when food prices impact socioeconomic conditions and food security, they can offer governments further insights. For instance, Lyu and Li [23] reveal the short-term fluctuation mechanisms of China’s food prices based on benchmark prices of monthly grains, wheat, corn, and other varieties, providing references and insights for the operation of China’s food price policies and the market-oriented reform of the food sector. Tan et al. [24] assess the impact of food price policies on the domestic market from a dynamic perspective and construct a spatial price index using wholesale market data of agricultural products, aiming to address policy support issues arising from regional food price disparities. Food prices cannot be analyzed solely through a single economic panel study, because food is subject to trade and distribution. Using a TVP-VAR model, Xue et al. [25] capture the time-varying volatility and interrelated nature of global grain price trends and found that food prices exhibit significant spatial spillover effects, providing a basis for policy-making by relevant authorities. Zhang et al. [26] examine the issue through cross-regional networks, revealing that local food supply surpluses or shortages can rapidly fill or exacerbate gaps in other regions through trade networks, thereby demonstrating that food prices exhibit spatial characteristics.

2.1.3. Synthesis and Research Contributions

Current domestic and international research on the impact of rural population aging on food prices has largely focused on the broader implications of rural population aging for agricultural development, including its effects on agricultural production efficiency, agricultural economic resilience, and food security. Some scholars argue that a deepening degree of rural population aging significantly inhibits the growth of agricultural total factor productivity, while others hold that rural population aging has a promoting effect on agricultural total factor productivity [27,28,29,30,31]. Another group of scholars suggests a U-shaped nonlinear relationship between rural population aging and green agricultural development, with an inhibiting effect in the early stage and a promoting effect in the later stage [32]. Lee et al. [33] incorporate artificial intelligence as a factor and suggest that, with the application of technology in agricultural production, rural population aging can enhance food production and promote food security. Therefore, the impact of rural population aging on food prices is a complex process that may involve intricate nonlinear relationships.
Although the above literature provides a detailed analysis of the impact on food prices and the nature of population aging, and identifies numerous agricultural issues arising from an aging population, it has some shortcomings. First, it does not address specific food price issues and lacks a clear framework covering the entire chain of “labor constraints–cost accumulation–market transmission.” Second, most empirical models are limited to linear assumptions, making it difficult to capture potential nonlinear dynamic relationships. Finally, they overlook the spatial linkages and nonlinear spillover effects determined by China’s interprovincial grain distribution network. Therefore, this paper constructs a systematic transmission pathway through which population aging affects grain prices, introducing nonlinear models and spatial econometric methods to test the inverted U-shaped relationship and identify the spatial transmission of food prices.

2.2. Theoretical Analysis and Hypotheses

2.2.1. Nonlinear Characteristics

The impact of the aging rural population on food prices is driven gradually through the chain of “labor shortages–supply cost push–demand mismatch–price fluctuations,” with changes in the structure of agricultural labor input permeating every stage from grain production to supply and on to the market. In modern agricultural economics research, agricultural production costs typically include direct material expenses, labor costs, land costs, and indirect service fees. With the market-oriented reform of factor prices, the relative weights and internal structure of these cost components are undergoing profound changes. First, as farmers’ physical abilities decline with age and young laborers migrate away from rural areas, the effective supply of agricultural labor has decreased, leading to a sustained decline in grain production capacity [34,35]. Elderly farmers, experiencing declining physical strength and difficulty in mastering complex technologies, tend to compensate for insufficient field management by increasing chemical inputs such as fertilizers and pesticides—that is, they adopt a “chemical substitution for labor” production approach [36]. This practice also incurs hidden environmental costs. According to the factor substitution theory, farmers with better economic conditions tend to increase the input of agricultural machinery to substitute for increasingly expensive labor costs [37]. However, this mechanical substitution pathway not only directly raises the share of fuel and power costs as well as machinery rental expenses in total grain production costs, but also faces geographical constraints in hilly and mountainous areas, where the marginal cost increment effect of machinery input becomes more pronounced. Secondly, the structural shortage of agricultural labor supply has driven up workers’ wages in agricultural production, leading to rising costs [38,39]. On the demand side, with the growth of residents’ income and the transformation of dietary structures, both the total volume and quality demand for grain consumption continue to exhibit rigid growth. The simultaneous escalation of production costs and expansion of consumer demand give rise to a structural supply–demand mismatch [40], and their combined effect exerts upward pressure on food prices.
As rural population aging intensifies, the abandonment of cultivated land is likely to become increasingly severe [41,42,43]. Ren et al. [44] found that a one-percentage-point increase in the rural population aging rate is associated with a 0.29% reduction in farm size. In 2019, rural population aging contributed to the abandonment of approximately 4 million hectares of cultivated land in China. To prevent labor shortages from constraining food production, the traditional smallholder farming model gradually transitions toward intensification, scaling, and specialization with policy support. As the proportion of food crops planted increases and abandoned farmland is transferred to cooperatives, agricultural enterprises, and large-scale grain growers for large-scale agricultural production and operation, which rapidly improves agricultural production efficiency and substantially increases food output, leading to a gradual decline in food prices [45]. Accordingly, hypothesis 1 is proposed:
H1. 
Rural population aging has an inverted U-shaped relationship with food prices.

2.2.2. The Scale Operation Effect of Farmland Transfer

Against the backdrop of rural population aging, labor input costs continue to rise, and food production faces both the loss of human factor inputs and structural changes in factor inputs, further reducing agricultural returns. As the physical functions of elderly farmers decline and the out-migration of young rural labor intensifies, aging farmers tend to operate small-scale farms, and the farmland is more likely to be abandoned or transferred to others. Accordingly, population aging is also promoting the continuous increase in farmland transfer [46]. Given the profit potential inherent in the large-scale abandonment of cultivated land, population aging is also facilitating the continuous expansion of farmland transfer. As an important means of optimizing the allocation of farmland resources, farmland transfer has strong intensification characteristics. Encouraging farmland transfer, especially to new types of agricultural business entities, can greatly promote food output. Therefore, farmland transfer can effectively moderate the relationship between rural population aging and food prices. With the rate of farmland transfer continuously increasing, abandoned farmland is brought back into use, farmland fragmentation gradually decreases, and the efficiency of intensive farmland utilization strengthens. These measures greatly promote large-scale food production and operation, effectively improve agricultural production efficiency, ensure sustainable development, increase food output, and thereby reduce and stabilize food prices [47,48]. However, when the degree of aging reaches a deep level, diminishing marginal returns, continuously rising production costs, an intensified tendency toward non-grain cultivation, and an increasing proportion of idle farmland collectively constitute a mechanism of food price rebound driven by supply contraction and cost push. Moreover, with the diversification of food consumption demand, China’s demand for food agricultural products continues to increase, leading to structural changes in food demand [40]. When the growth in consumption demand exceeds supply capacity, it may also trigger a rebound in food prices. Accordingly, hypothesis 2 is proposed:
H2. 
Farmland transfer can significantly moderate the inverted U-shaped relationship between rural population aging and food prices, causing it to reverse.

2.2.3. The Factor Substitution Effect of Agricultural Technological Progress

Technological progress is a primary driver of economic growth, and the optimal allocation of production factors depends on technological progress that facilitates effective substitution. Promoting technological progress through agricultural innovation and mechanization coverage can compensate for the shortage of agricultural labor, improve agricultural production efficiency, increase food output, and thereby contribute to food security [49,50]. Similar to the moderating role of farmland transfer, although rural population aging reduces the input of agricultural labor, according to the Induced Innovation Theory [51], the development of agricultural technology can not only replace costly human capital inputs but also improve agricultural production methods and enhance food output efficiency, thereby lowering food prices [30]. However, as aging continues to intensify, elderly farmers may experience a certain negative impact on their willingness and ability to adopt new agricultural technologies when faced with more complex agricultural techniques and large-scale equipment [31]. This, in turn, slows the growth rate of agricultural production efficiency and leads to a rebound in food prices. Accordingly, hypothesis 3 is proposed:
H3. 
Agricultural technological progress can significantly moderate the inverted U-shaped relationship between rural population aging and food prices, causing it to reverse.

3. Materials and Methods

3.1. Data Sources

The data used in this study cover 30 provinces, autonomous regions, and municipalities directly under the central government (excluding Taiwan, Xizang, Macao, and Hong Kong). The study period spans from 2005 to 2022. The data were obtained from the National Bureau of Statistics, official websites, the China Population and Employment Statistical Yearbook, the China Rural Statistical Yearbook, the China Statistical Yearbook on Science and Technology, and various provincial statistical yearbooks. Some missing data are filled by linear interpolation. The spatial weight matrices were constructed and processed using software such as GeoDa 1.20 and Stata 18.0.

3.2. Variable Selection

Before the empirical analysis, descriptive statistics of the main variables were presented in Table 1. To avoid the effect of extreme observations, continuous variables were winsorized at the 1% level, and interaction terms were centralized. In order to ensure the data series remained stationary and to minimize the risk of spurious regression, panel unit root tests were performed as an initial diagnostic. As shown in Table 2, all variables satisfy the stationarity requirement across the whole sample period. The variance inflation factor (VIF) results in Table 3 further indicate that, regardless of whether the independent variables are substituted, neither the dependent variable nor the control variables exhibit problematic multicollinearity, thereby satisfying the prerequisites for model estimation and inference.

3.2.1. Dependent Variable

From the perspective of price transmission mechanisms, cost shocks in food production exhibit significant downstream transmission characteristics, with consumer prices serving as the terminal point of cost changes along the supply chain and thus more directly reflecting actual market conditions. Moreover, from the standpoint of market integration and spatial linkages, consumer prices not only function as a core indicator for measuring intra-regional and inter-regional market interactions, but are also directly associated with household living costs and macroeconomic stability, rendering them a key metric for evaluating the socioeconomic consequences of population aging. To ensure a consistent research metric, the Consumer Food Price Index (LnPrice) is used as a proxy variable in this paper. The foods consumed here include rice, flour, coarse grains and their related products, which can effectively cover the main types of grain crops. Household expenditure on food effectively reflects food prices. A higher consumer price index generally indicates higher food prices. Following the same approach used for the GDP deflator [52], we adopt a fixed-base treatment to the consumer food price index, using 2004 as the base year.

3.2.2. Independent Variable

Adopting the approach used by Zeng et al. [53], the population aging rate is employed to measure the degree of aging. The indicator is defined as the proportion of individuals aged 65 and above to the total population of a given region. Since the primary focus of this study is on the aging level of the rural population, the rural population aging rate (RPA) is adopted to quantify the extent of aging in rural areas.

3.2.3. Control Variables

Referring to the related research [30,54,55,56,57,58], the control variables in this paper are primarily selected from the dimensions of grain production, agricultural output, agricultural policy support, and rural education level: (1) Grain planting structure (LnSA) is measured by the sown area of grain crops in each province. The sown area, to some extent, can reflect the efficiency of grain production. An expansion in the sown area is expected to increase grain output, thereby exerting a stabilizing effect on food prices. (2) Degree of agricultural mechanization (DAM) is calculated as the ratio of total agricultural machinery power to the total cultivated land area in each province. The level of agricultural mechanization can effectively improve grain production efficiency and has a significant impact on food prices. (3) Degree of Agricultural Damage (DIS) is measured as the ratio of the disaster-affected area to the total crop-planted area of crops. In general, a higher degree of disaster not only causes greater damage to the natural environment of local agricultural production and raises production costs, but also directly reduces grain output, thereby exerting an influence on food prices. (4) Agricultural fiscal support (AFS) is measured as the ratio of agricultural-related expenditure to the total fiscal budget expenditure. As agricultural development requires government support, the government’s financial capacity will have a significant impact on agricultural production in the region. (5) Level of agricultural economic development (AGDP) is represented by the ratio of the agricultural production value to the number of employees in the primary sector. Higher levels of agricultural economic development can influence agricultural production and policy decisions, thereby affecting grain production and food prices. (6) Rural human capital level (Edu) uses educational attainment among rural residents as a proxy variable. The average years of schooling per capita is calculated by weighting and averaging the duration of schooling based on educational background. Specifically, no schooling, elementary school, junior high school, senior high school, and college or above are assigned weights of 0 years, 6 years, 9 years, 12 years, and 16 years, respectively. Higher education levels in the rural labor force enhance knowledge acquisition and learning capacity, thereby improving production efficiency and reducing the negative effects of aging.

3.2.4. Moderating Variables

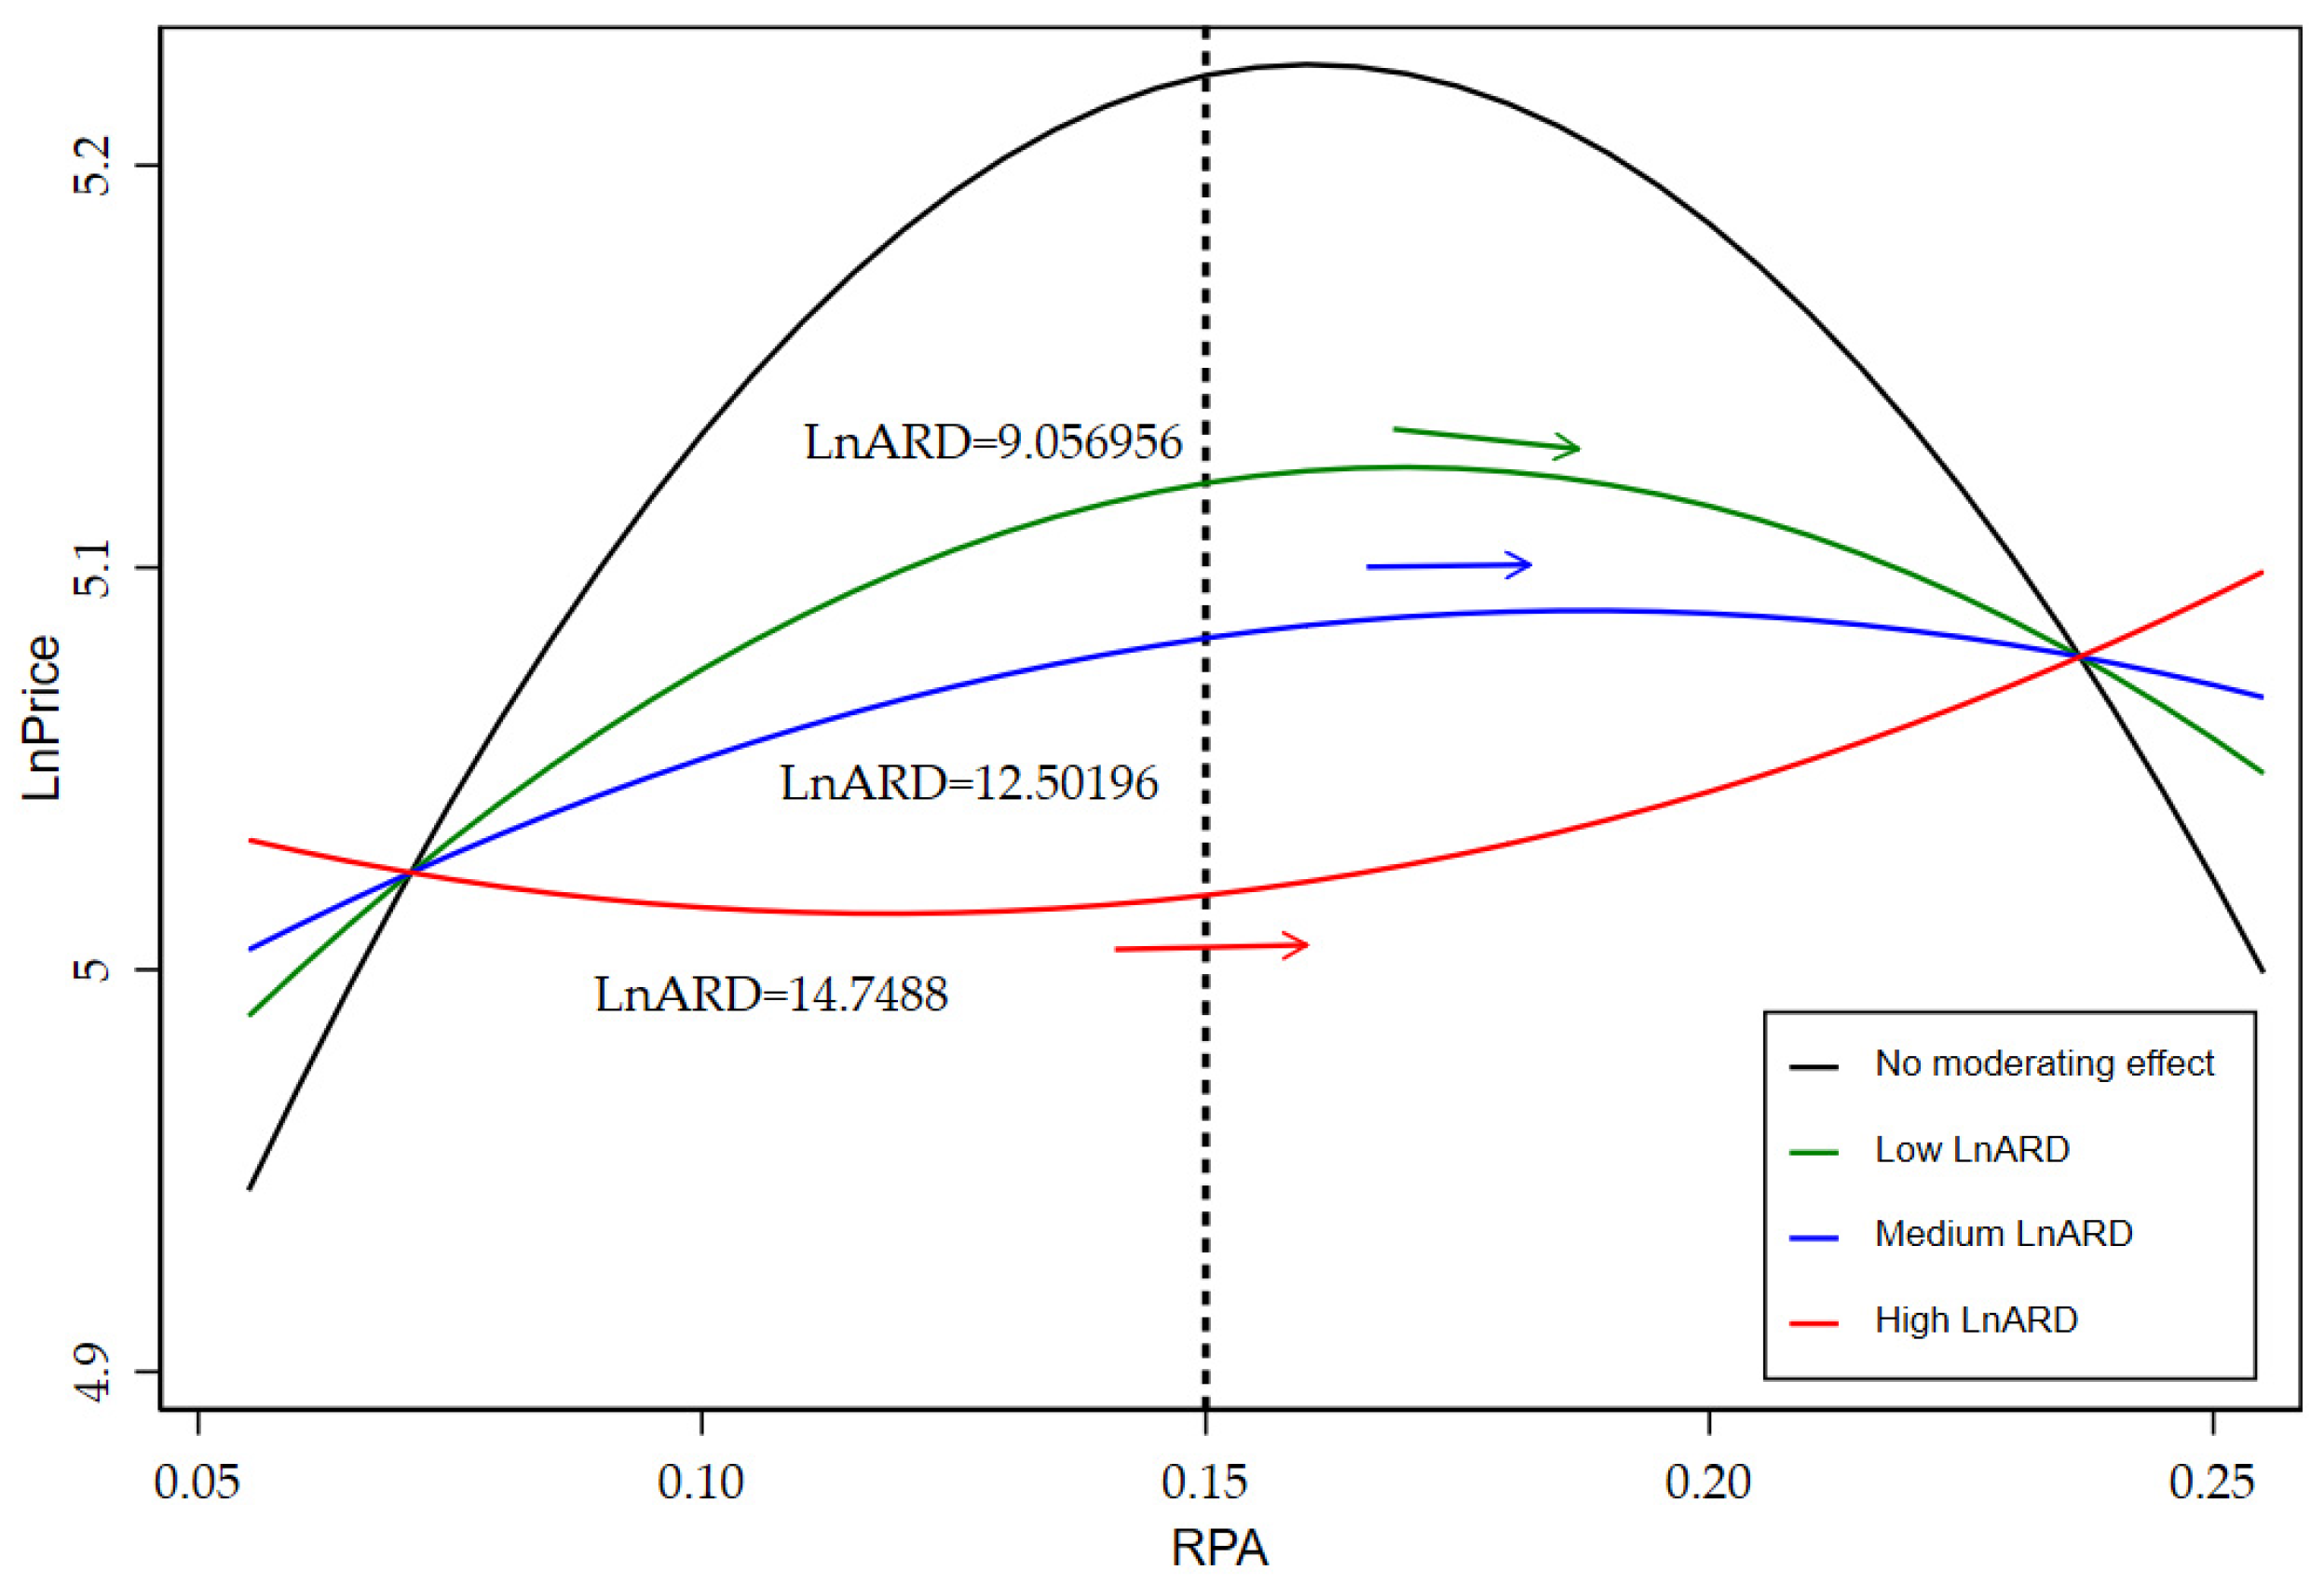
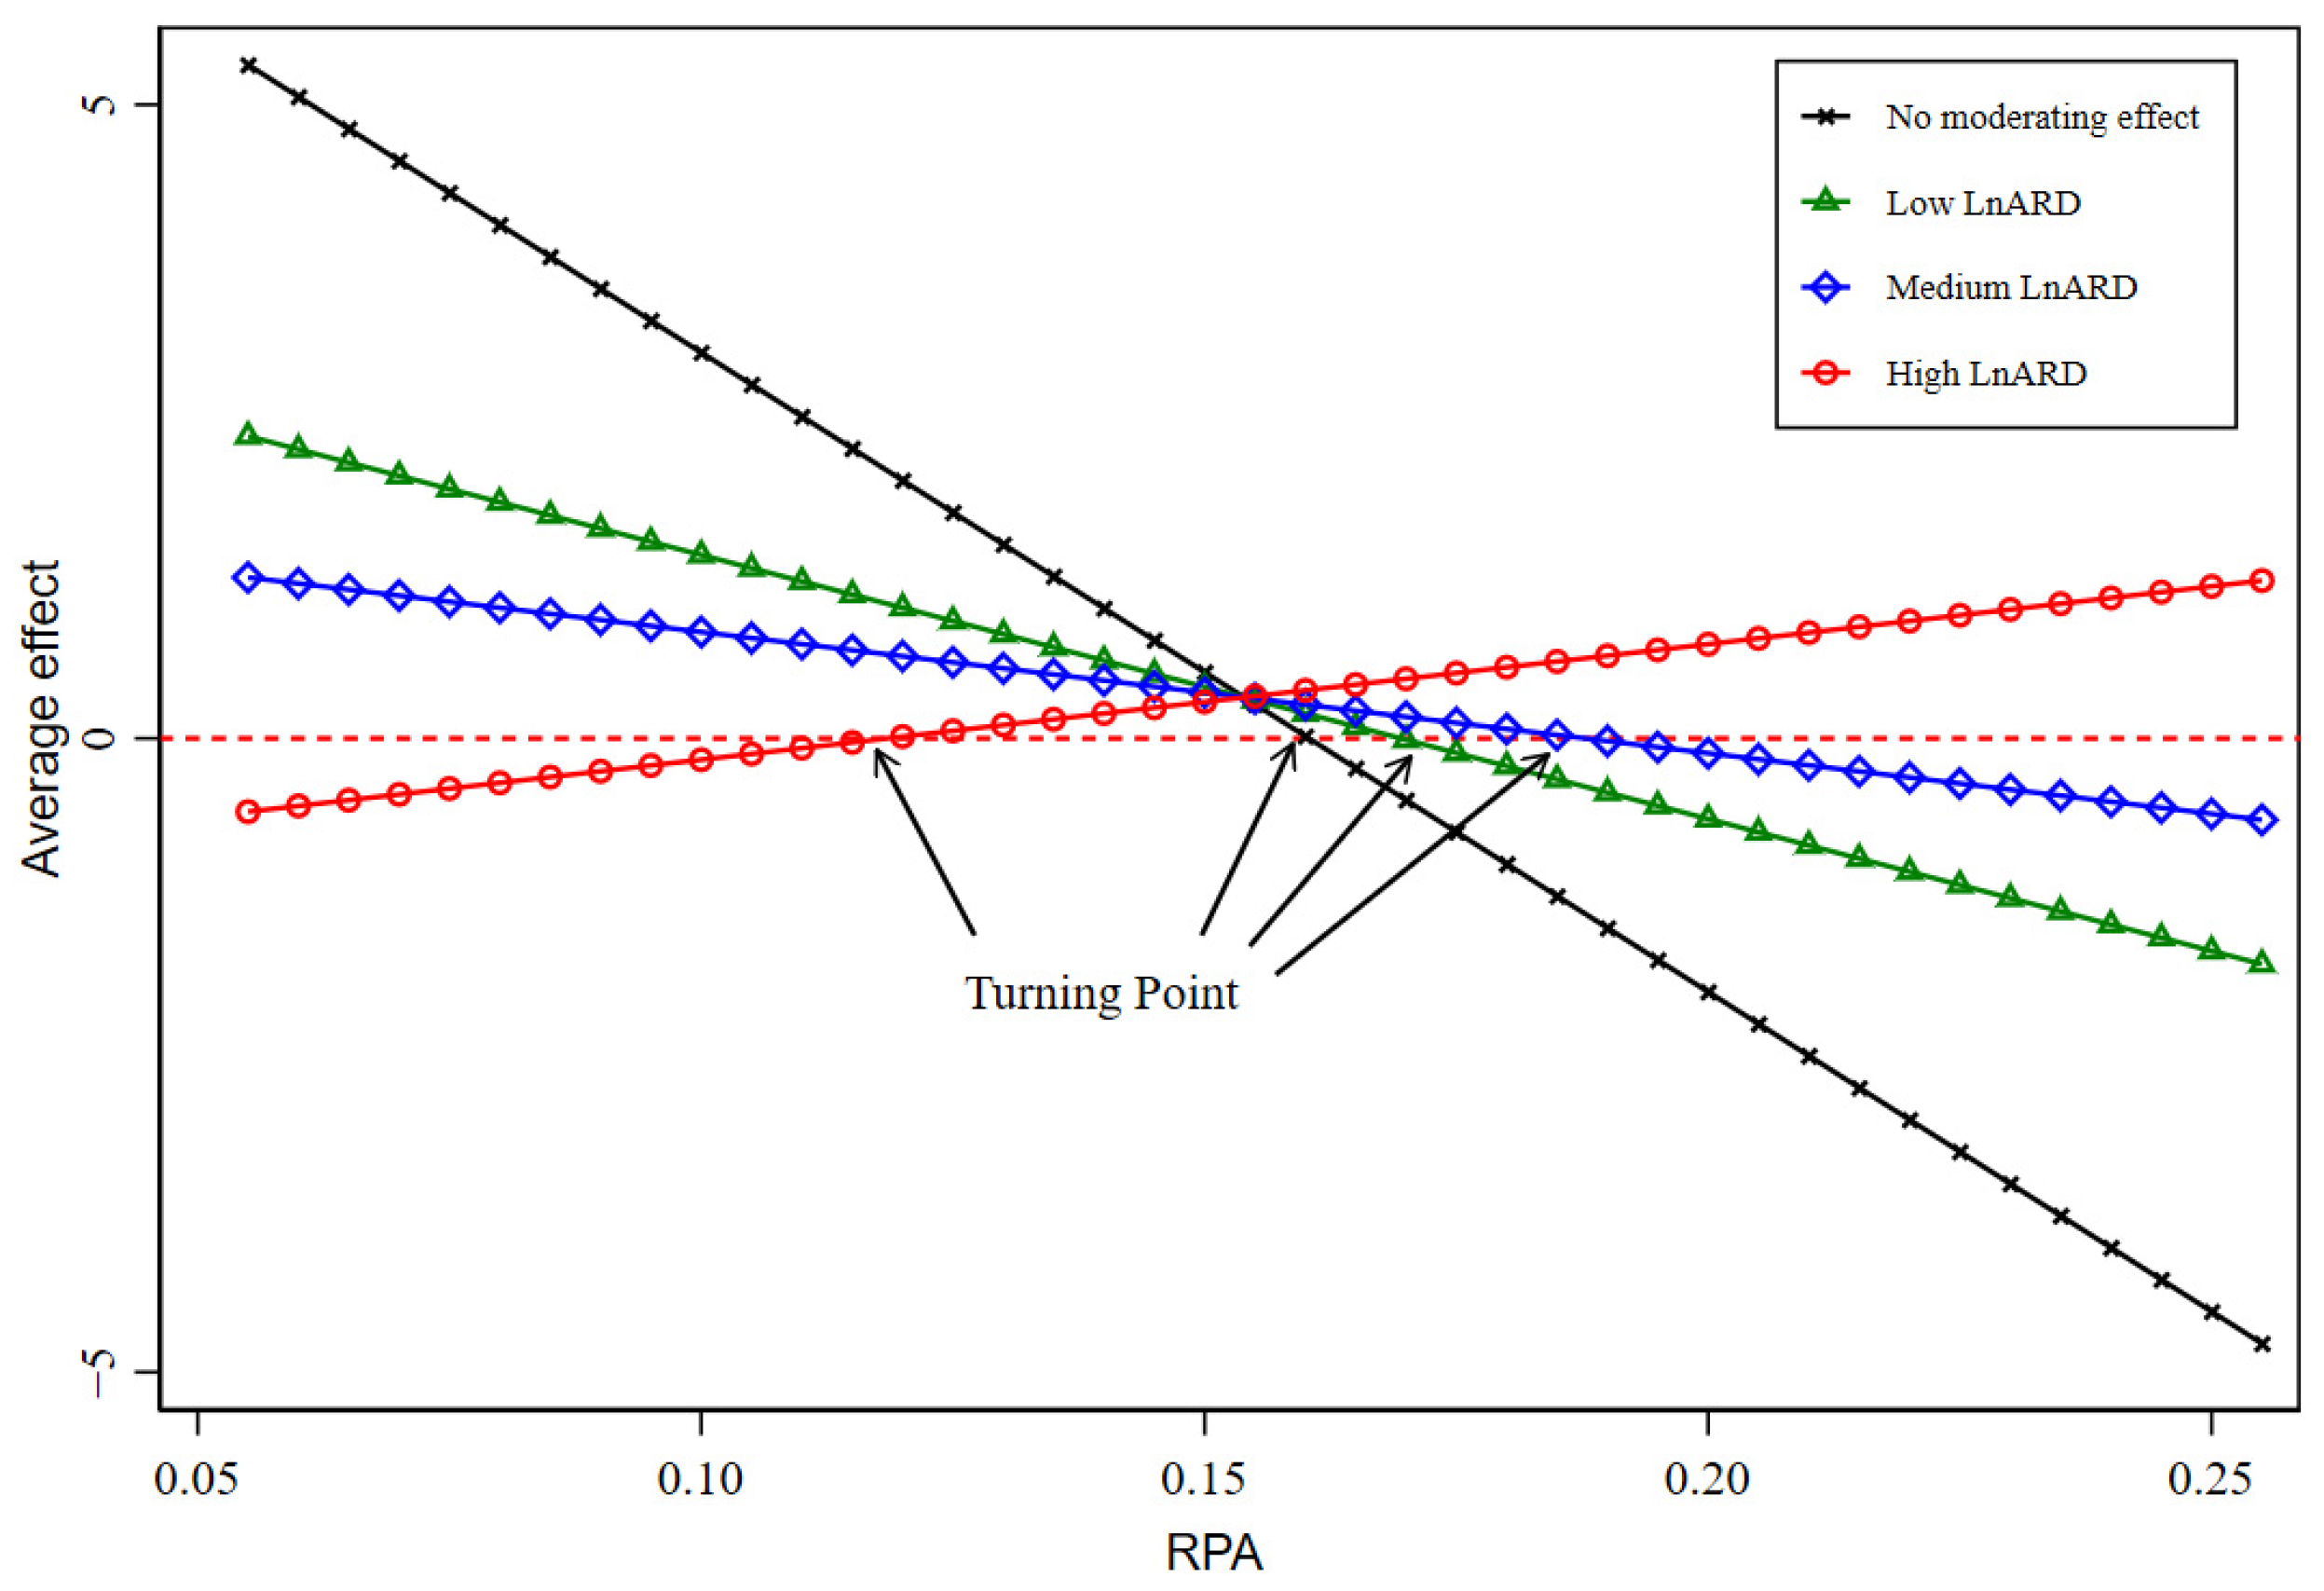
According to the theoretical analysis in this paper and insights from related research, farmland transfer rate (Land) and agricultural technological progress (ARD) are identified as important factors influencing the analysis. Accordingly, Land and ARD are incorporated as moderating variables to examine their underlying mechanisms of influence. Specifically, Land is measured as the ratio of the total area of contracted farmland transferred to the total area of contracted farmland operated by households. In contrast, ARD is measured by calculating the proportion of provincial science and technology activity expenditures allocated to agriculture (LnARD indicates that the variable has been log-transformed).

3.3. Research Models

3.3.1. Kernel Density Estimation

Kernel density analysis is a nonparametric method for studying the spatial clustering of variables within regions, enabling the examination of their spatial distribution and dynamic evolution. Its formula is as follows:
f ( x ) = 1 N h i = 1 N K X i x h K ( x ) = 1 2 Π e x p x 2 2
where K(·) represents the kernel function, N refers to the number of observations, and x is the mean of the observations; h is the bandwidth, whose selection affects estimation results because it determines the smoothness of the kernel density curve and the precision of the estimate. The curve becomes smoother, and estimation precision decreases as the bandwidth increases.

3.3.2. Benchmark Model

To investigate the nonlinear relationship between rural population aging and food prices, this study first employs the following benchmark model. Specifically, we employ a two-way fixed effects model, with the formula as follows:
L n P r i c e i t = α 0 + α 1 R P A i t + α 2 R P A i t 2 + α k k = 3 n C o n t r o l s i t + ω i + μ t + ε i t
where LnPrice is the dependent variable, representing the logarithmic value of food prices; RPA denotes the level of rural population aging, which is the independent variable, while RPA2 being its squared term; Controls signifies a series of control variables; α0, α1,…, αk are the estimated coefficients for each variable; ωi and μt indicate the parameter vectors estimating individual and time fixed effects, respectively. i and t represent province and year, respectively; εit means the error term.

3.3.3. Moderating Effect Model

To test the indirect effects of other factors in the process through which rural population aging affects food prices, this study constructs a moderating effect model to analyze the specific influence mechanisms. The moderating variables are land transfer (Land) and agricultural technological progress (ARD). If the interaction term between RPA2 and the moderating variable is significantly positive, it indicates that the moderating variable makes the initial U-shaped relationship steeper. Otherwise, it flattens the original U-shaped relationship or even causes it to reverse. The formula of the moderating effect model is as follows:
L n P r i c e i t = β 0 + β 1 R P A i t + β 2 R P A i t 2 + β 3 R P A i t × M i , t + β 4 R P A i t 2 × M i t + β k k = 5 n C o n t r o l s i t + ω i + μ t + ε i t
where M represents the moderating variable (M = Land and M = LnARD), β0, β1βk represent the estimated coefficients for each variable, and R P A i t × M i t and R P A i t 2 × M i t denote the interaction terms between different moderating variables and rural population aging, respectively.

3.3.4. Spatial Durbin Model

In examining the spatial spillover effects of rural population aging on food prices, we employ spatial econometric methods to investigate the relationship between rural population aging and food prices, as well as its spatial spillover effects on neighboring regions. Specifically, the Spatial Durbin Model (SDM) is utilized, incorporating a squared term of the rural population aging coefficient to explore its nonlinear relationship. The Spatial Durbin Model is a combination of the Spatial Autoregressive Model (SAR) and the Spatial Error Model (SEM). Its formula is as follows:
L n P r i c e i t = γ 0 + ρ j = 1 n W i j L n P r i c e j t + ϕ X i t + θ j = 1 n W i j X j t + ω i + μ t + ε i t
where γ0, φ, and θ are the parameters to be estimated. If ρ ≠ 0 and θ = 0, the SDM can be simplified to the SAR; otherwise, the SDM cannot be simplified to the SEM. Wij indicates the spatial weight matrix employed. In geographical research, the closer the distance, the stronger the correlation between phenomena. Therefore, this study utilizes both a spatial adjacency matrix and a geographic distance matrix to capture the local spillover effects in neighboring regions and the global spatial dependence characterized by distance decay, respectively. This approach enables a more comprehensive identification of the spatial structural features through which rural population aging affects food prices. First, the spatial contiguity matrix: W i j = 1 , j N k ( j ) 0 , j N k ( j ) , where Nk (j) indicates the number of neighboring points between provinces i and j. When k ≥ 1, the value is 1; otherwise, it is 0. Since Hainan is an isolated island, it is recorded here that Hainan Province is adjacent to Guangdong Province. Second, the geographic distance matrix: W i j = 1 / d i j 2 ( i j ) 0 , ( i = j ) , where dij means the distance between the centers of mass of provincial capitals i and j.

4. Analysis of Empirical Results

4.1. Benchmark Result

4.1.1. Benchmark Regression Analysis

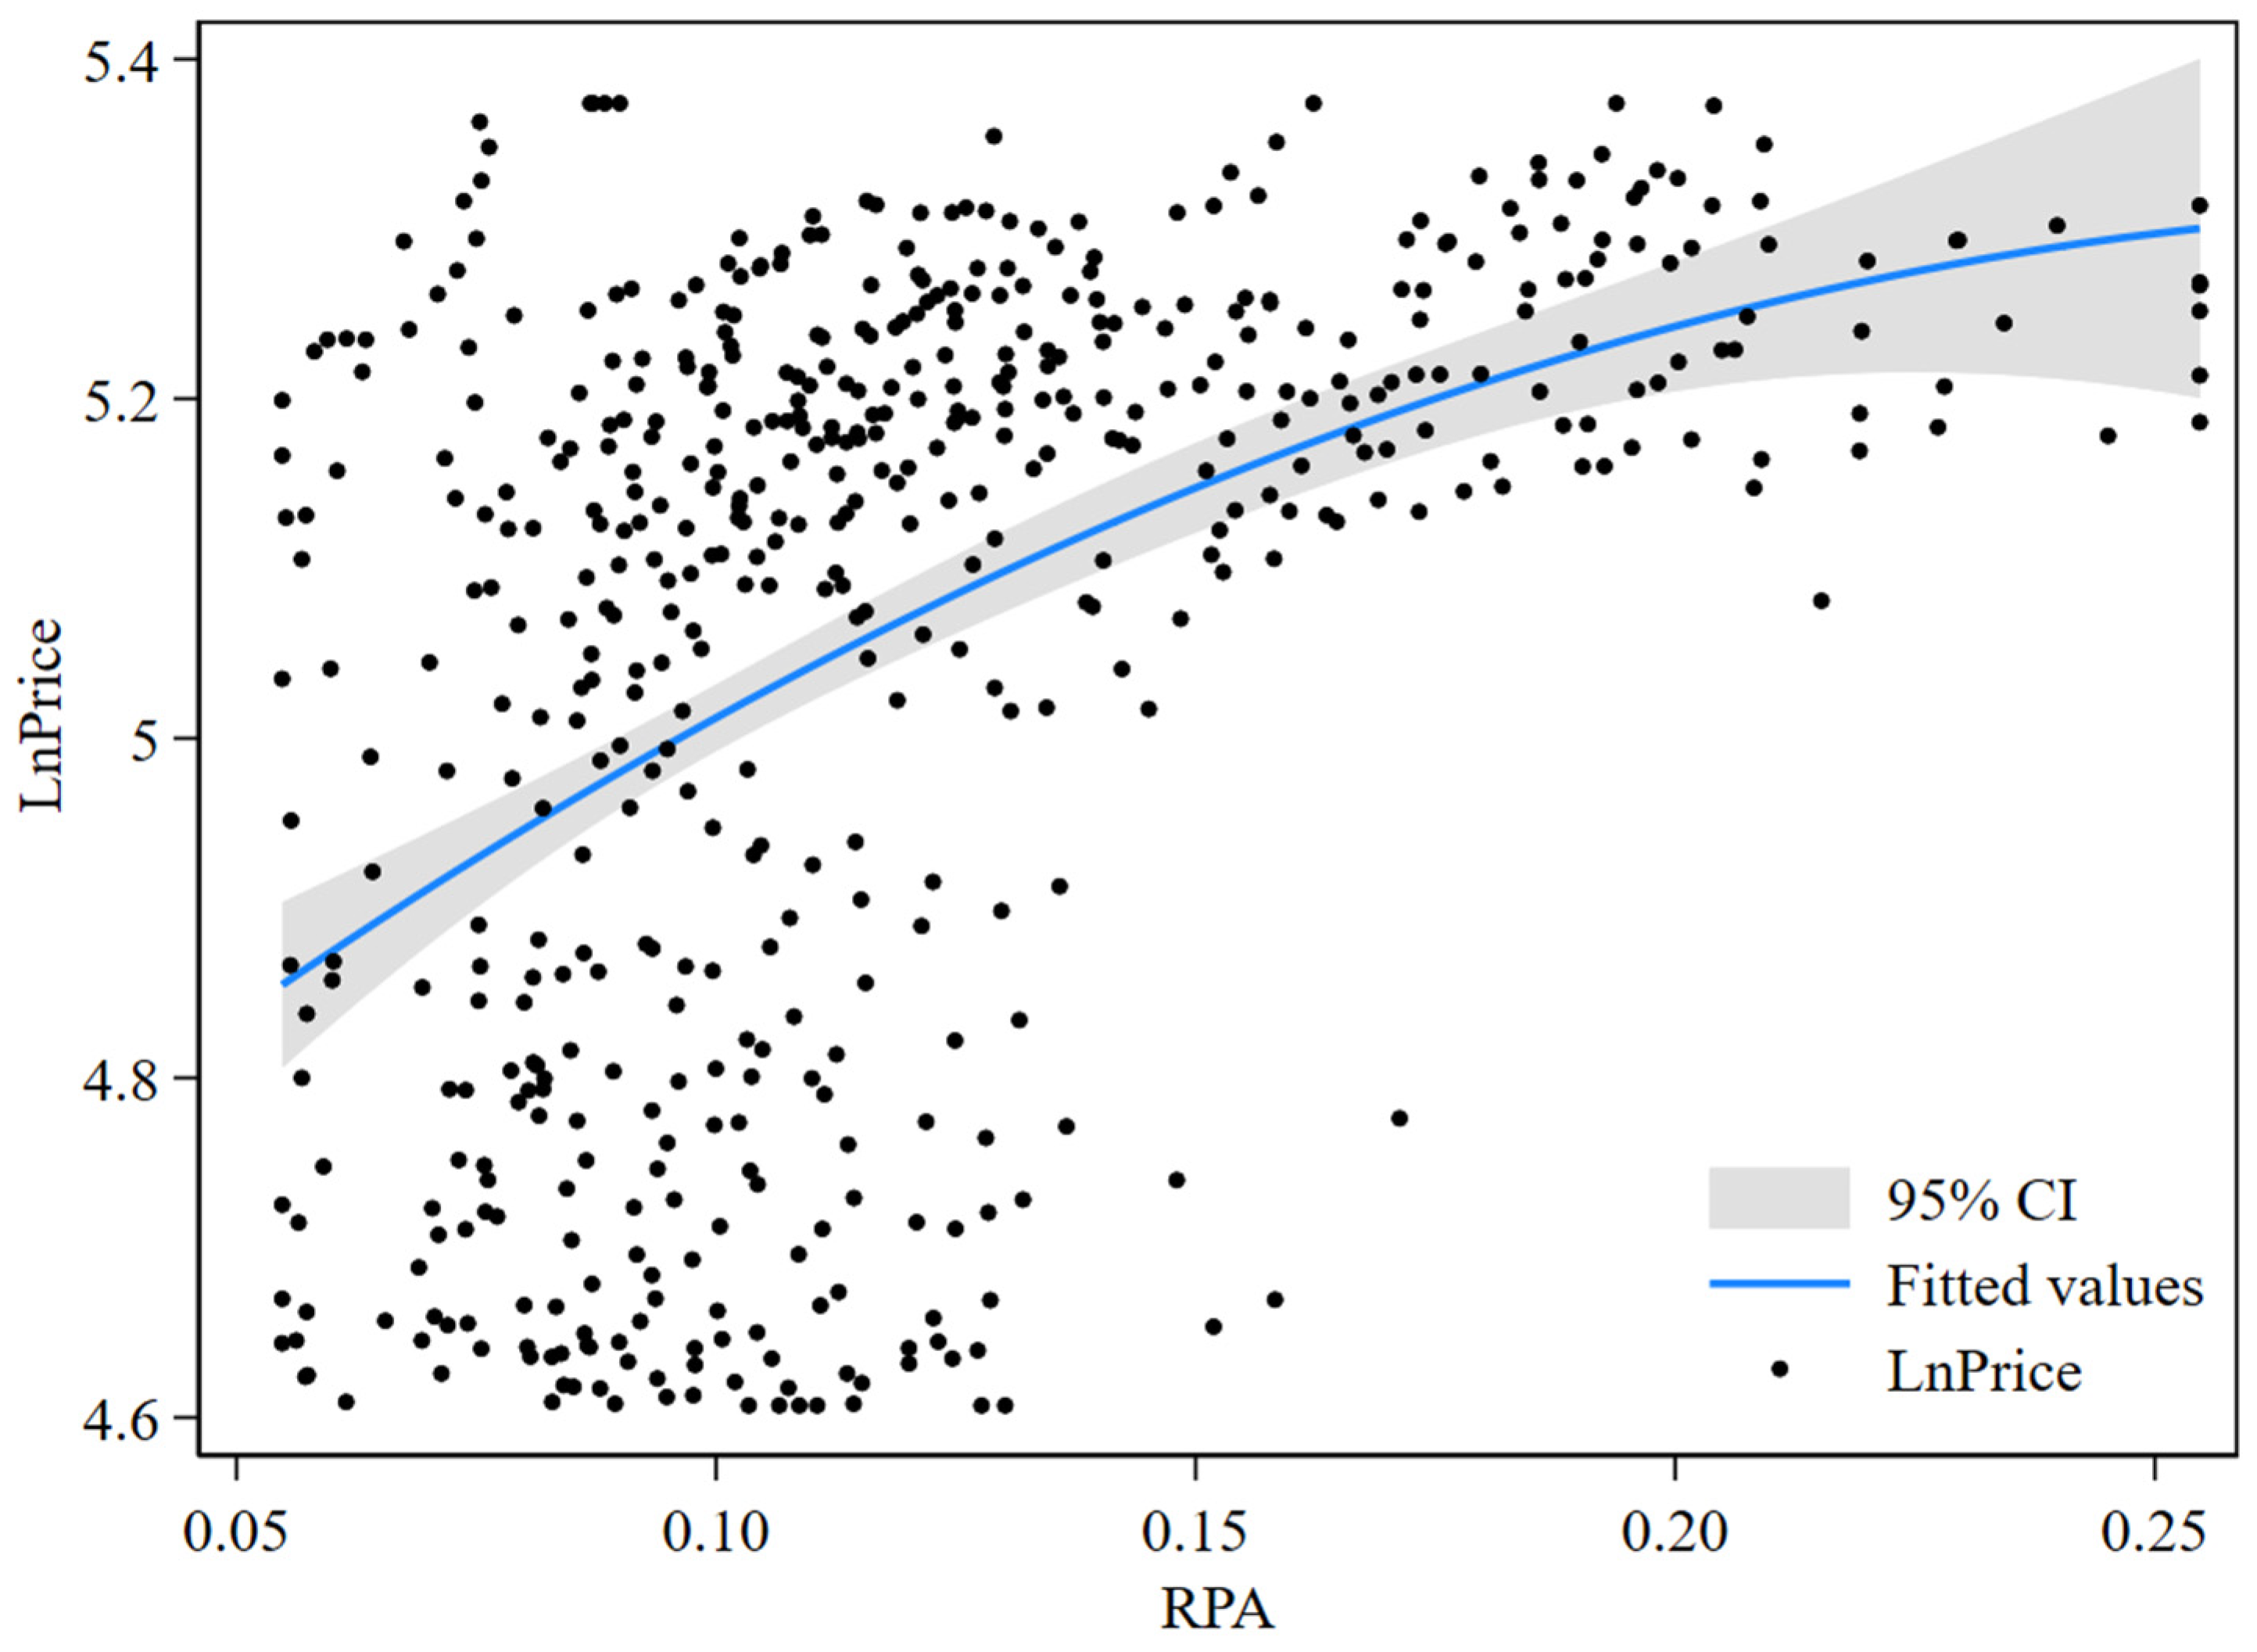
We first perform a scatter analysis of RPA and LnPrice to conduct a preliminary analysis of the relationship between rural population aging and food prices. As shown in Figure 1, RPA and LnPrice exhibit a nonlinear relationship, and this relationship is gradually evolving.
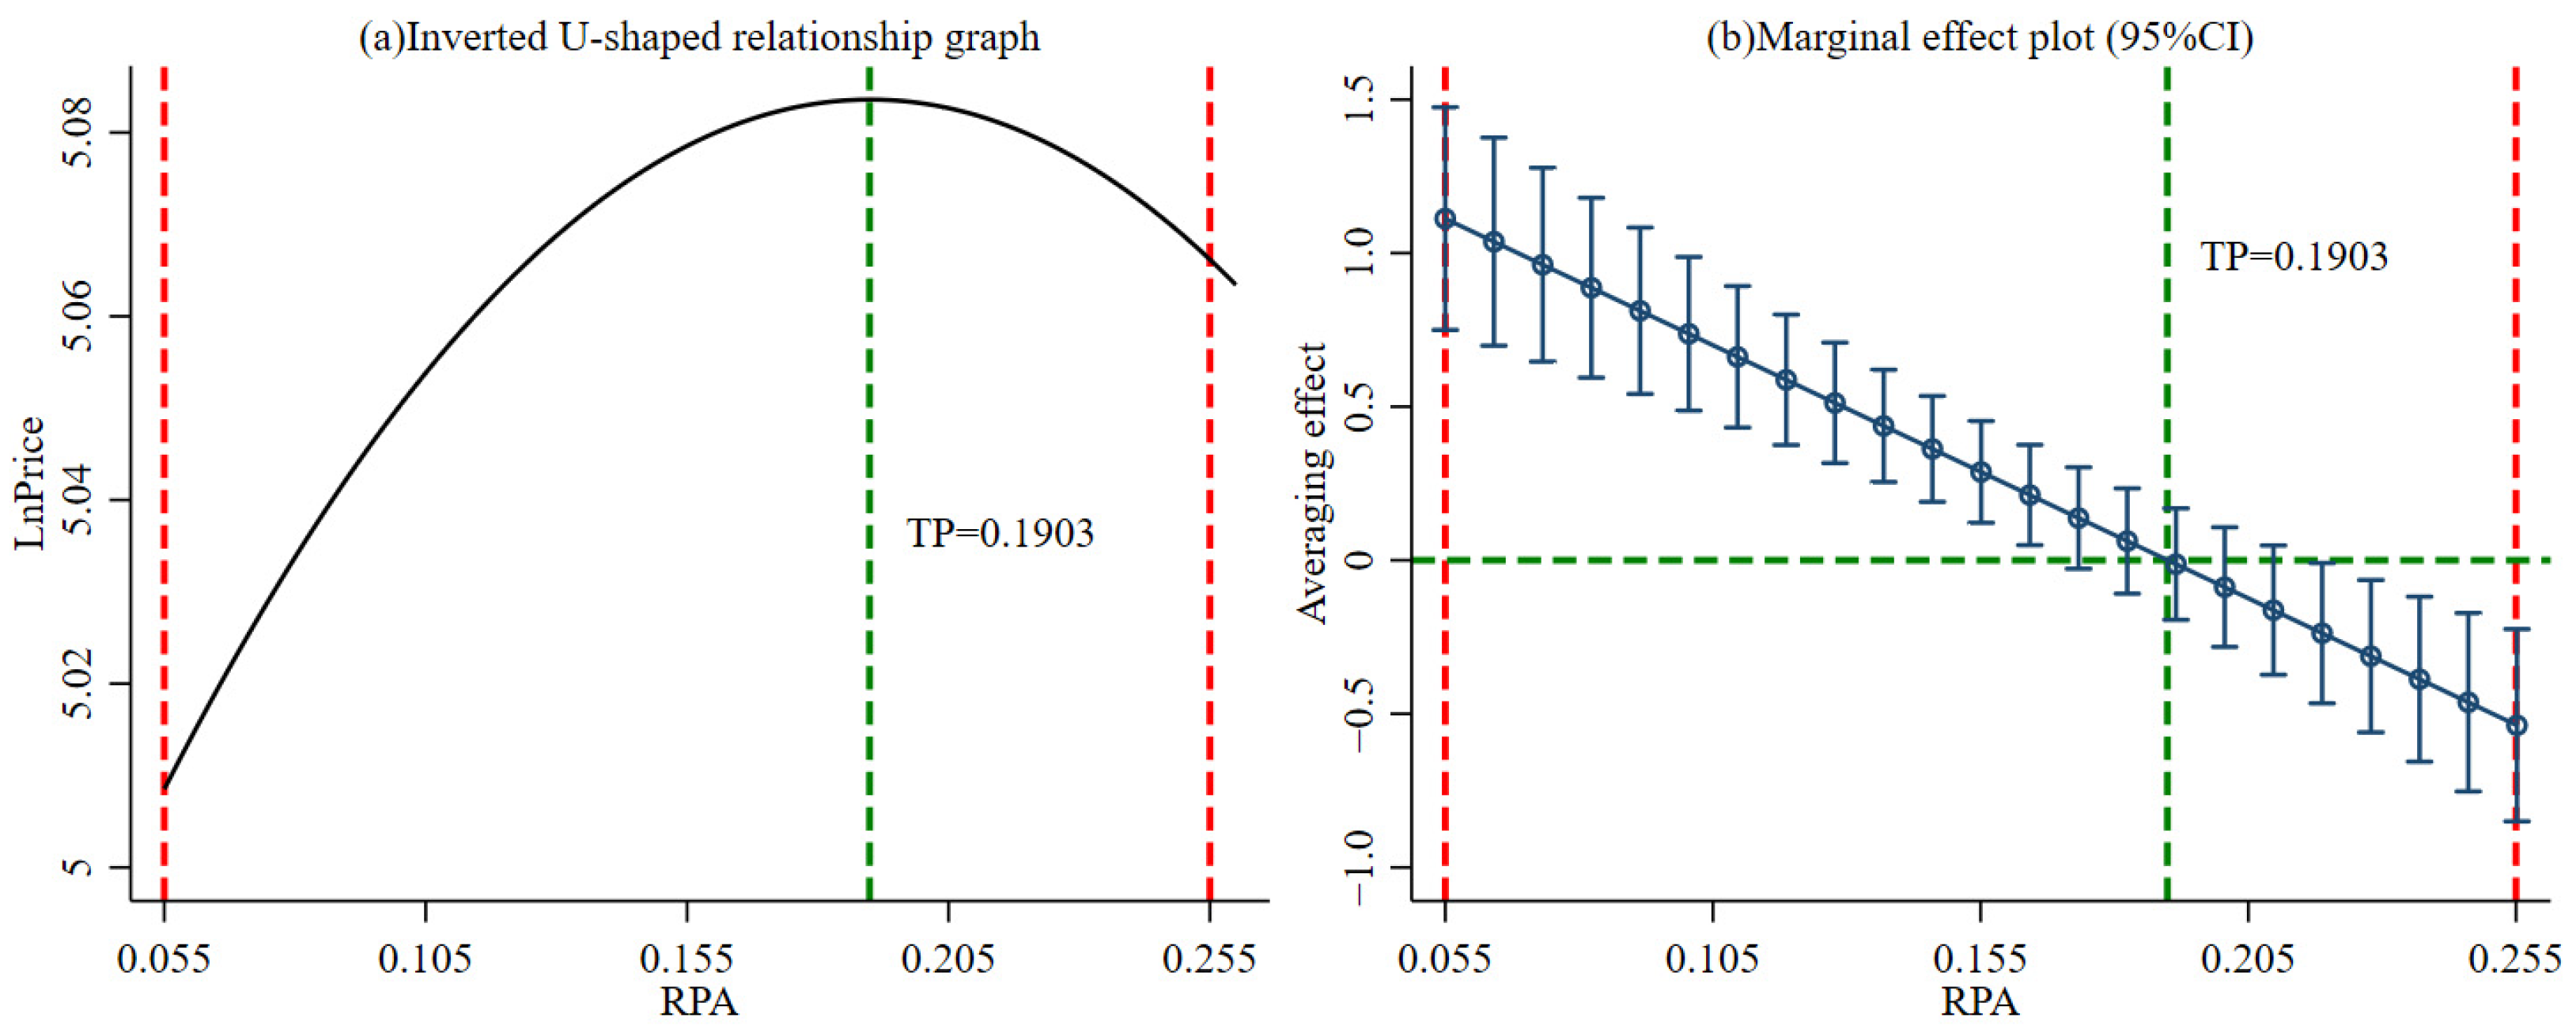
In further empirical analysis, the benchmark regression outcomes are listed in Table 4. Columns (1) and (2) show the outcomes from the mixed regression model, while columns (3) and (4) present the results under two-way fixed effects regressions. All columns illustrate that, regardless of whether control variables are included or the two-way fixed effects model is adopted, the impact of RPA on food prices exhibits an inverted U-shaped relationship. Based on the marginal effect calculated from column (4), the turning point is estimated at 19.03%. The direction and magnitude of RPA’s impact on food prices depend on its level. Specifically, when the RPA level is below the inflection point of 19.03%, it has a positive marginal effect on food prices; when the RPA level exceeds this point, the marginal effect turns negative, indicating that further increases in RPA will exert a suppressing effect on food prices. To precisely quantify this dynamic process, we selected three representative sample values to estimate the marginal effect; all estimates are statistically significant at the 95% confidence level. At the minimum sample value (RPA = 5.5%), a 1 percentage point increase in RPA leads to a significant rise in food prices of approximately 1.11%; at the sample mean (RPA = 12.0%), a 1 percentage point increase in RPA leads to a significant rise in food prices of approximately 0.58%; at the maximum sample value (RPA = 25.5%), a 1 percentage point increase in RPA leads to a significant decrease in food prices of approximately 0.53%. These results clearly illustrate the nonlinear evolution of the marginal effect under an inverted U-shaped relationship, where the effect shifts from positive to negative and its absolute value first decreases and then increases. Currently, the provinces with an RPA level below 19.03% are Beijing, Fujian, Jiangxi, Henan, Guangdong, Guangxi, Hainan, Guizhou, Yunnan, Gansu, Qinghai, Ningxia, and Xinjiang. The provinces with an RPA level above 19.03% include Tianjin, Hebei, Shanxi, Inner Mongolia, Liaoning, Jilin, Heilongjiang, Shanghai, Jiangsu, Zhejiang, Anhui, Shandong, Hubei, Hunan, Chongqing, Sichuan, and Shaanxi. Hypothesis 1 is thus supported.
To further corroborate the existence of an inverted U-shaped relationship, the U-shape test is used to assess the effect of RPA on LnPrice. The outcomes in Table 5 confirm a statistically significant positive slope at the lower bound of the RPA level and a significant negative slope at the upper bound. The estimated inflection point (0.1903) lies within the 95% confidence interval, indicating an inverted U-shaped relationship. By plotting this inverted U-shaped relationship graph (a) and its marginal effect plot (b) in Figure 2, it can be found that the nonlinear fitted curves can better explain the relationship between RPA and LnPrice, and the changes in marginal effect are consistent with the previous benchmark analysis.

4.1.2. Endogeneity and Robustness Tests

Considering the potential issues of omitted variable bias and endogeneity caused by reciprocal causality in the model, the estimation outcomes may be biased. Although the RPA directly impacts grain production and food security, fluctuations in food market prices can also influence grain output, potentially creating indirect effects on RPA [59]. To address potential endogeneity concerns, this study employs a two-stage instrumental variable regression approach to reassess the impact of RPA on LnPrice. Specifically, the first-order lag of RPA and its squared term are regarded as instrumental variables [28,60]. The lagged RPA satisfies the exogeneity condition, as it does not directly influence LnPrice, yet remains a relevant instrument due to the correlated relationship with the current RPA.
In robustness checks, three approaches were applied for testing: introducing the cubic term of RPA, replacing the independent variable with the rural elderly dependency ratio (Old), and additionally incorporating the impact of agricultural imports on domestic food prices. The IV-2SLS approach is utilized for the endogeneity test. As shown in Table 6, the outcomes of instrumental variable estimation are presented in column (1). The second-stage regression outcomes confirm the inverted U-shaped relationship between RPA and LnPrice at the 1% significance level. Diagnostic tests further indicate the absence of weak instruments and identification issues. Column (2) demonstrates that there is no evidence of N-shaped or other nonlinear relationships between RPA and LnPrice. The results in Column (3) hold at the 1% significance level, indicating that after altering the measurement of the variable, the findings remain consistent with the baseline regression results. In Column (4), total agricultural imports (Import) were used as the international food shock variable, and the results confirm that the inverted U-shaped relationship persists, thereby reinforcing the robustness of the findings.

4.1.3. Heterogeneity Analysis

There are notable disparities across regions in China in terms of economic development, industrial structure, and agricultural production conditions. The eastern coastal areas are economically developed, with industries dominated by manufacturing, commerce, and high-technology sectors, and are densely populated, serving as major food consumption regions. Meanwhile, these areas exhibit a relatively high level of agricultural modernization, characterized by intensive and refined development, with mechanization and large-scale operations leading the nation. In contrast, the western regions lag behind in economic development and have complex topographic conditions; agricultural production there still relies predominantly on traditional smallholder farming, and agriculture accounts for a substantial share of the local economy. Given the pronounced regional heterogeneity, this paper further conducts sub-regional heterogeneity analyses to examine potential differential effects across various areas. Specifically, we divide the research area into three dimensions: Eastern, Central, and Western. As evidenced by the results presented in Table 7, columns (1) and (2) report insignificant effects, indicating that the impact of RPA on LnPrice is not statistically significant in the eastern and central regions. This is because these regions have higher levels of agricultural technology and socialized services and are key areas for food trade and distribution; therefore, the impact of an aging population is not significant. In contrast, the western region exhibits an inverted U-shaped relationship, with coefficients of 3.007 and −7.904, both of which are significant at the 1% level. The reasons are related to the agricultural production characteristics, economic development levels, and labor out-migration patterns in western China. Western regions typically have a weak agricultural foundation, with relatively low levels of mechanization and technology, and a higher reliance on manual labor. Accordingly, the negative impacts of rural population aging and labor out-migration on food production may be more pronounced and direct in these areas.

4.2. Mechanism Analysis

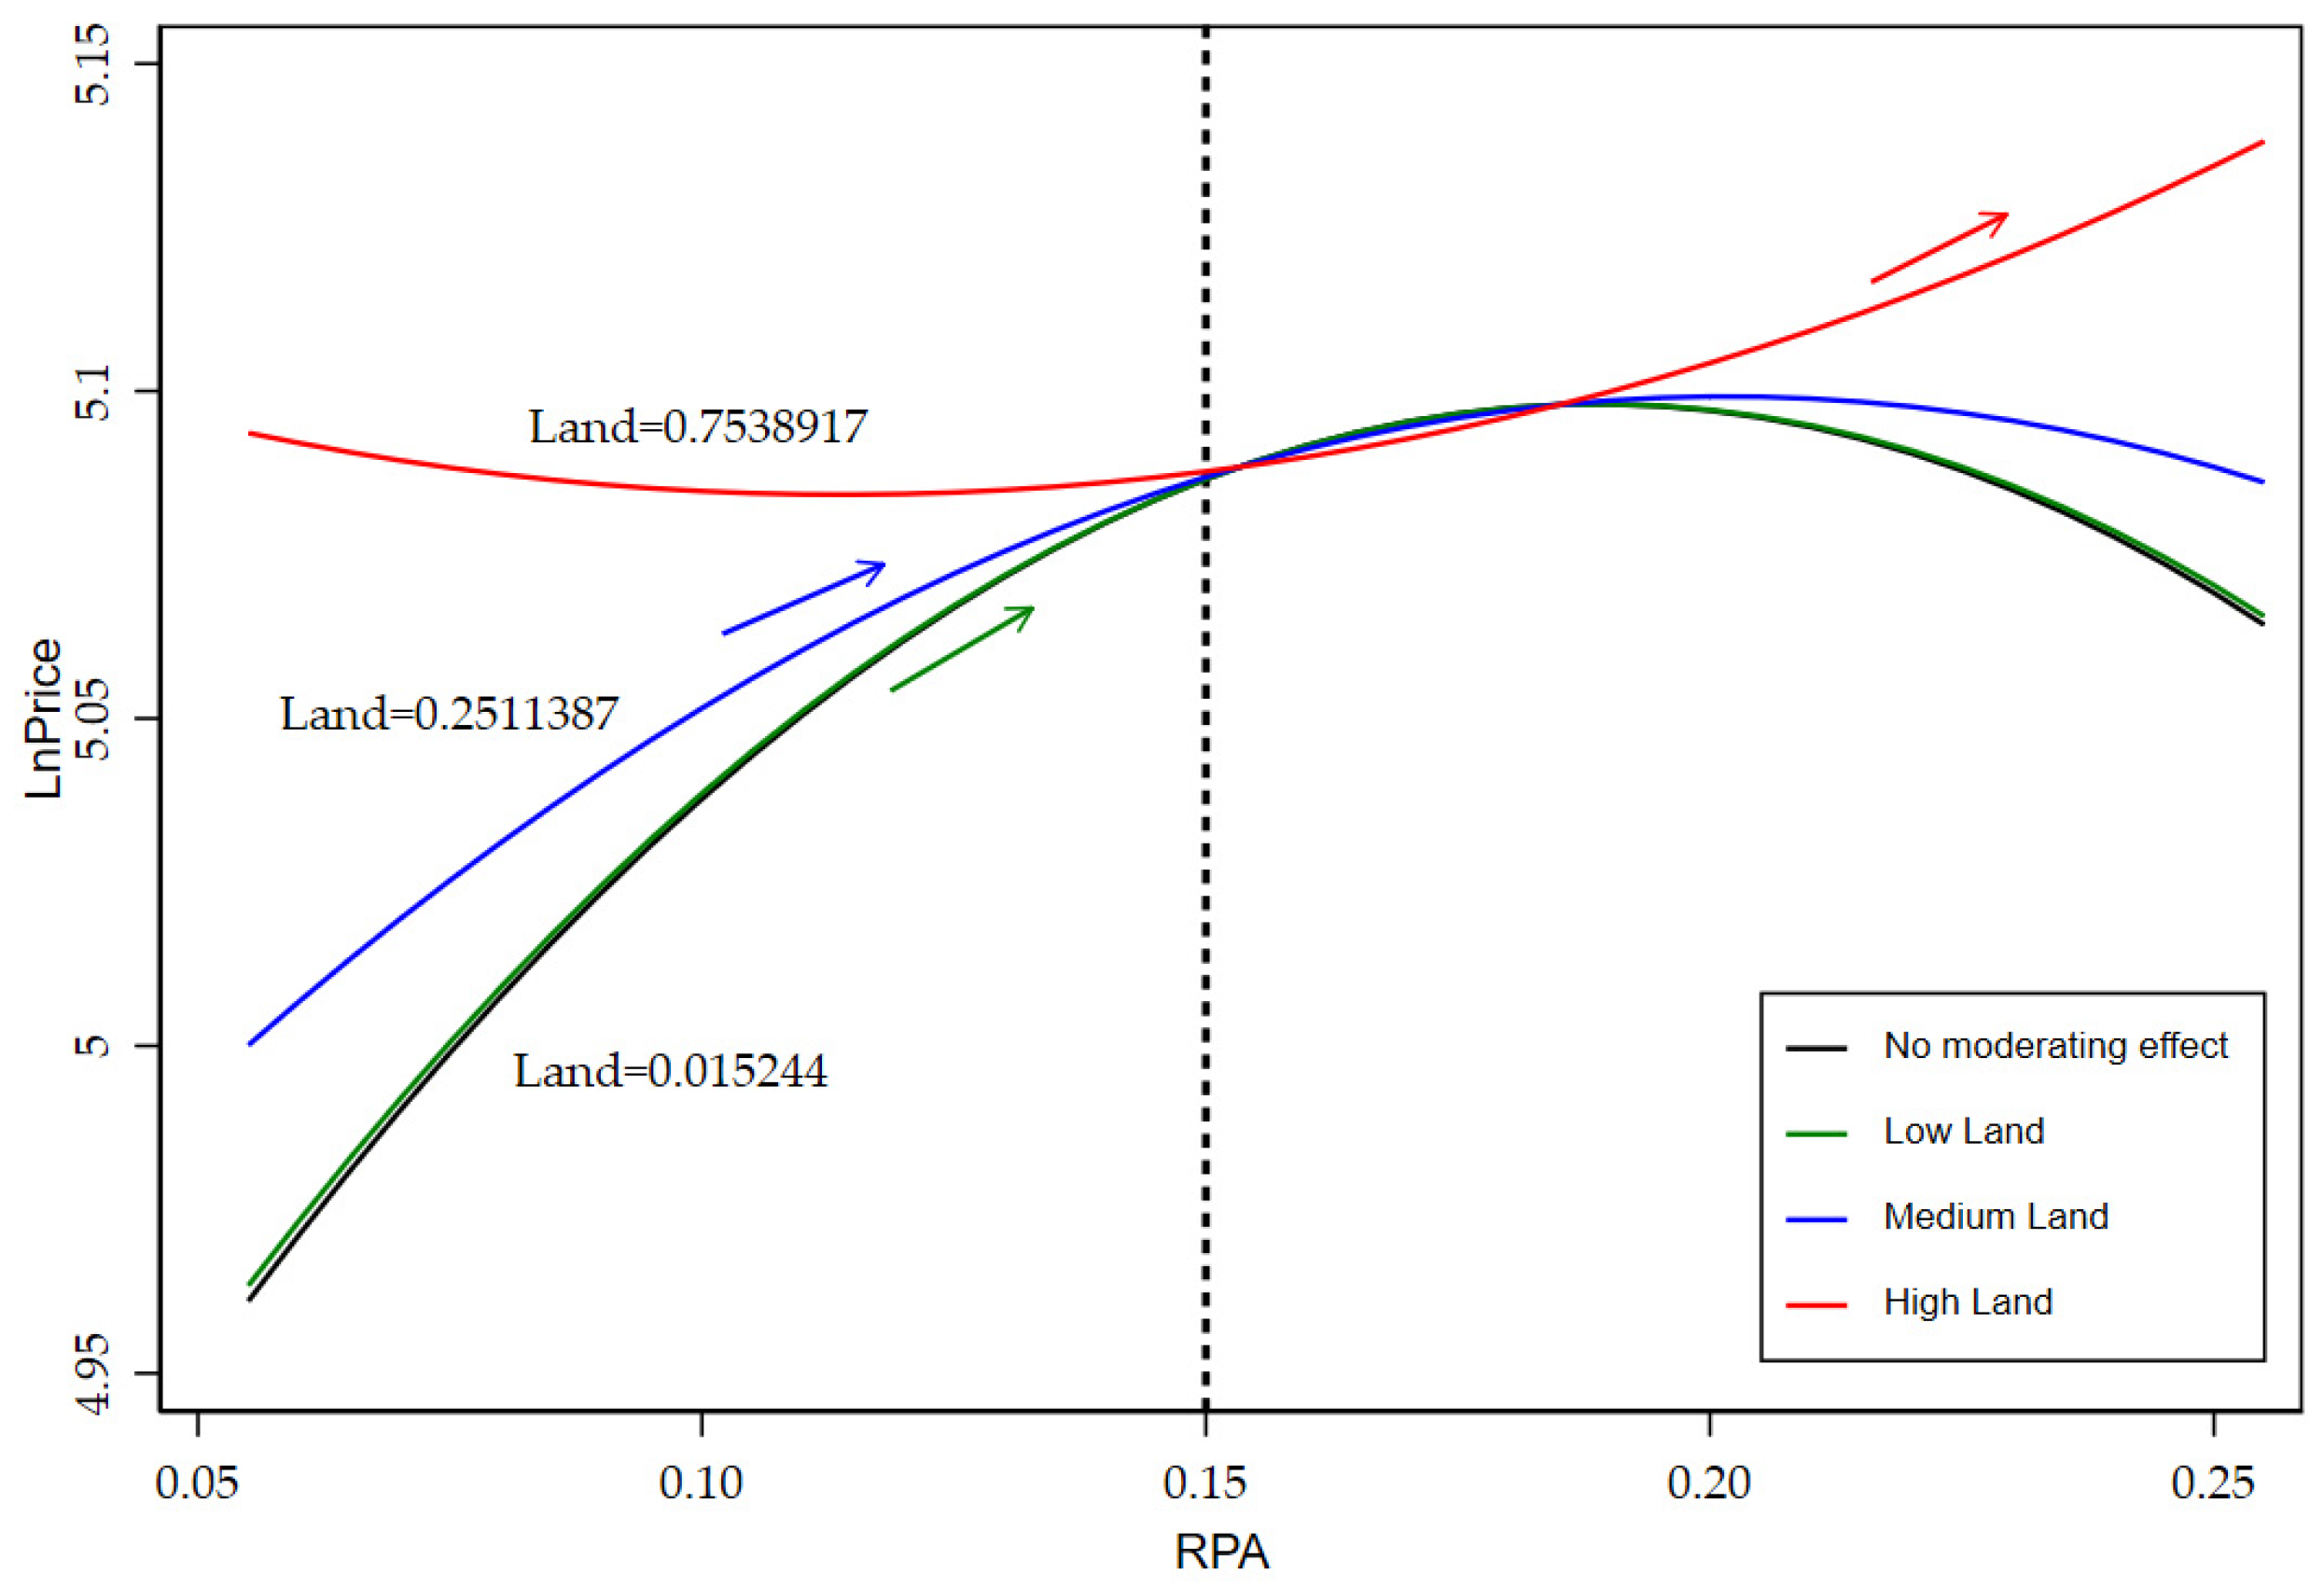
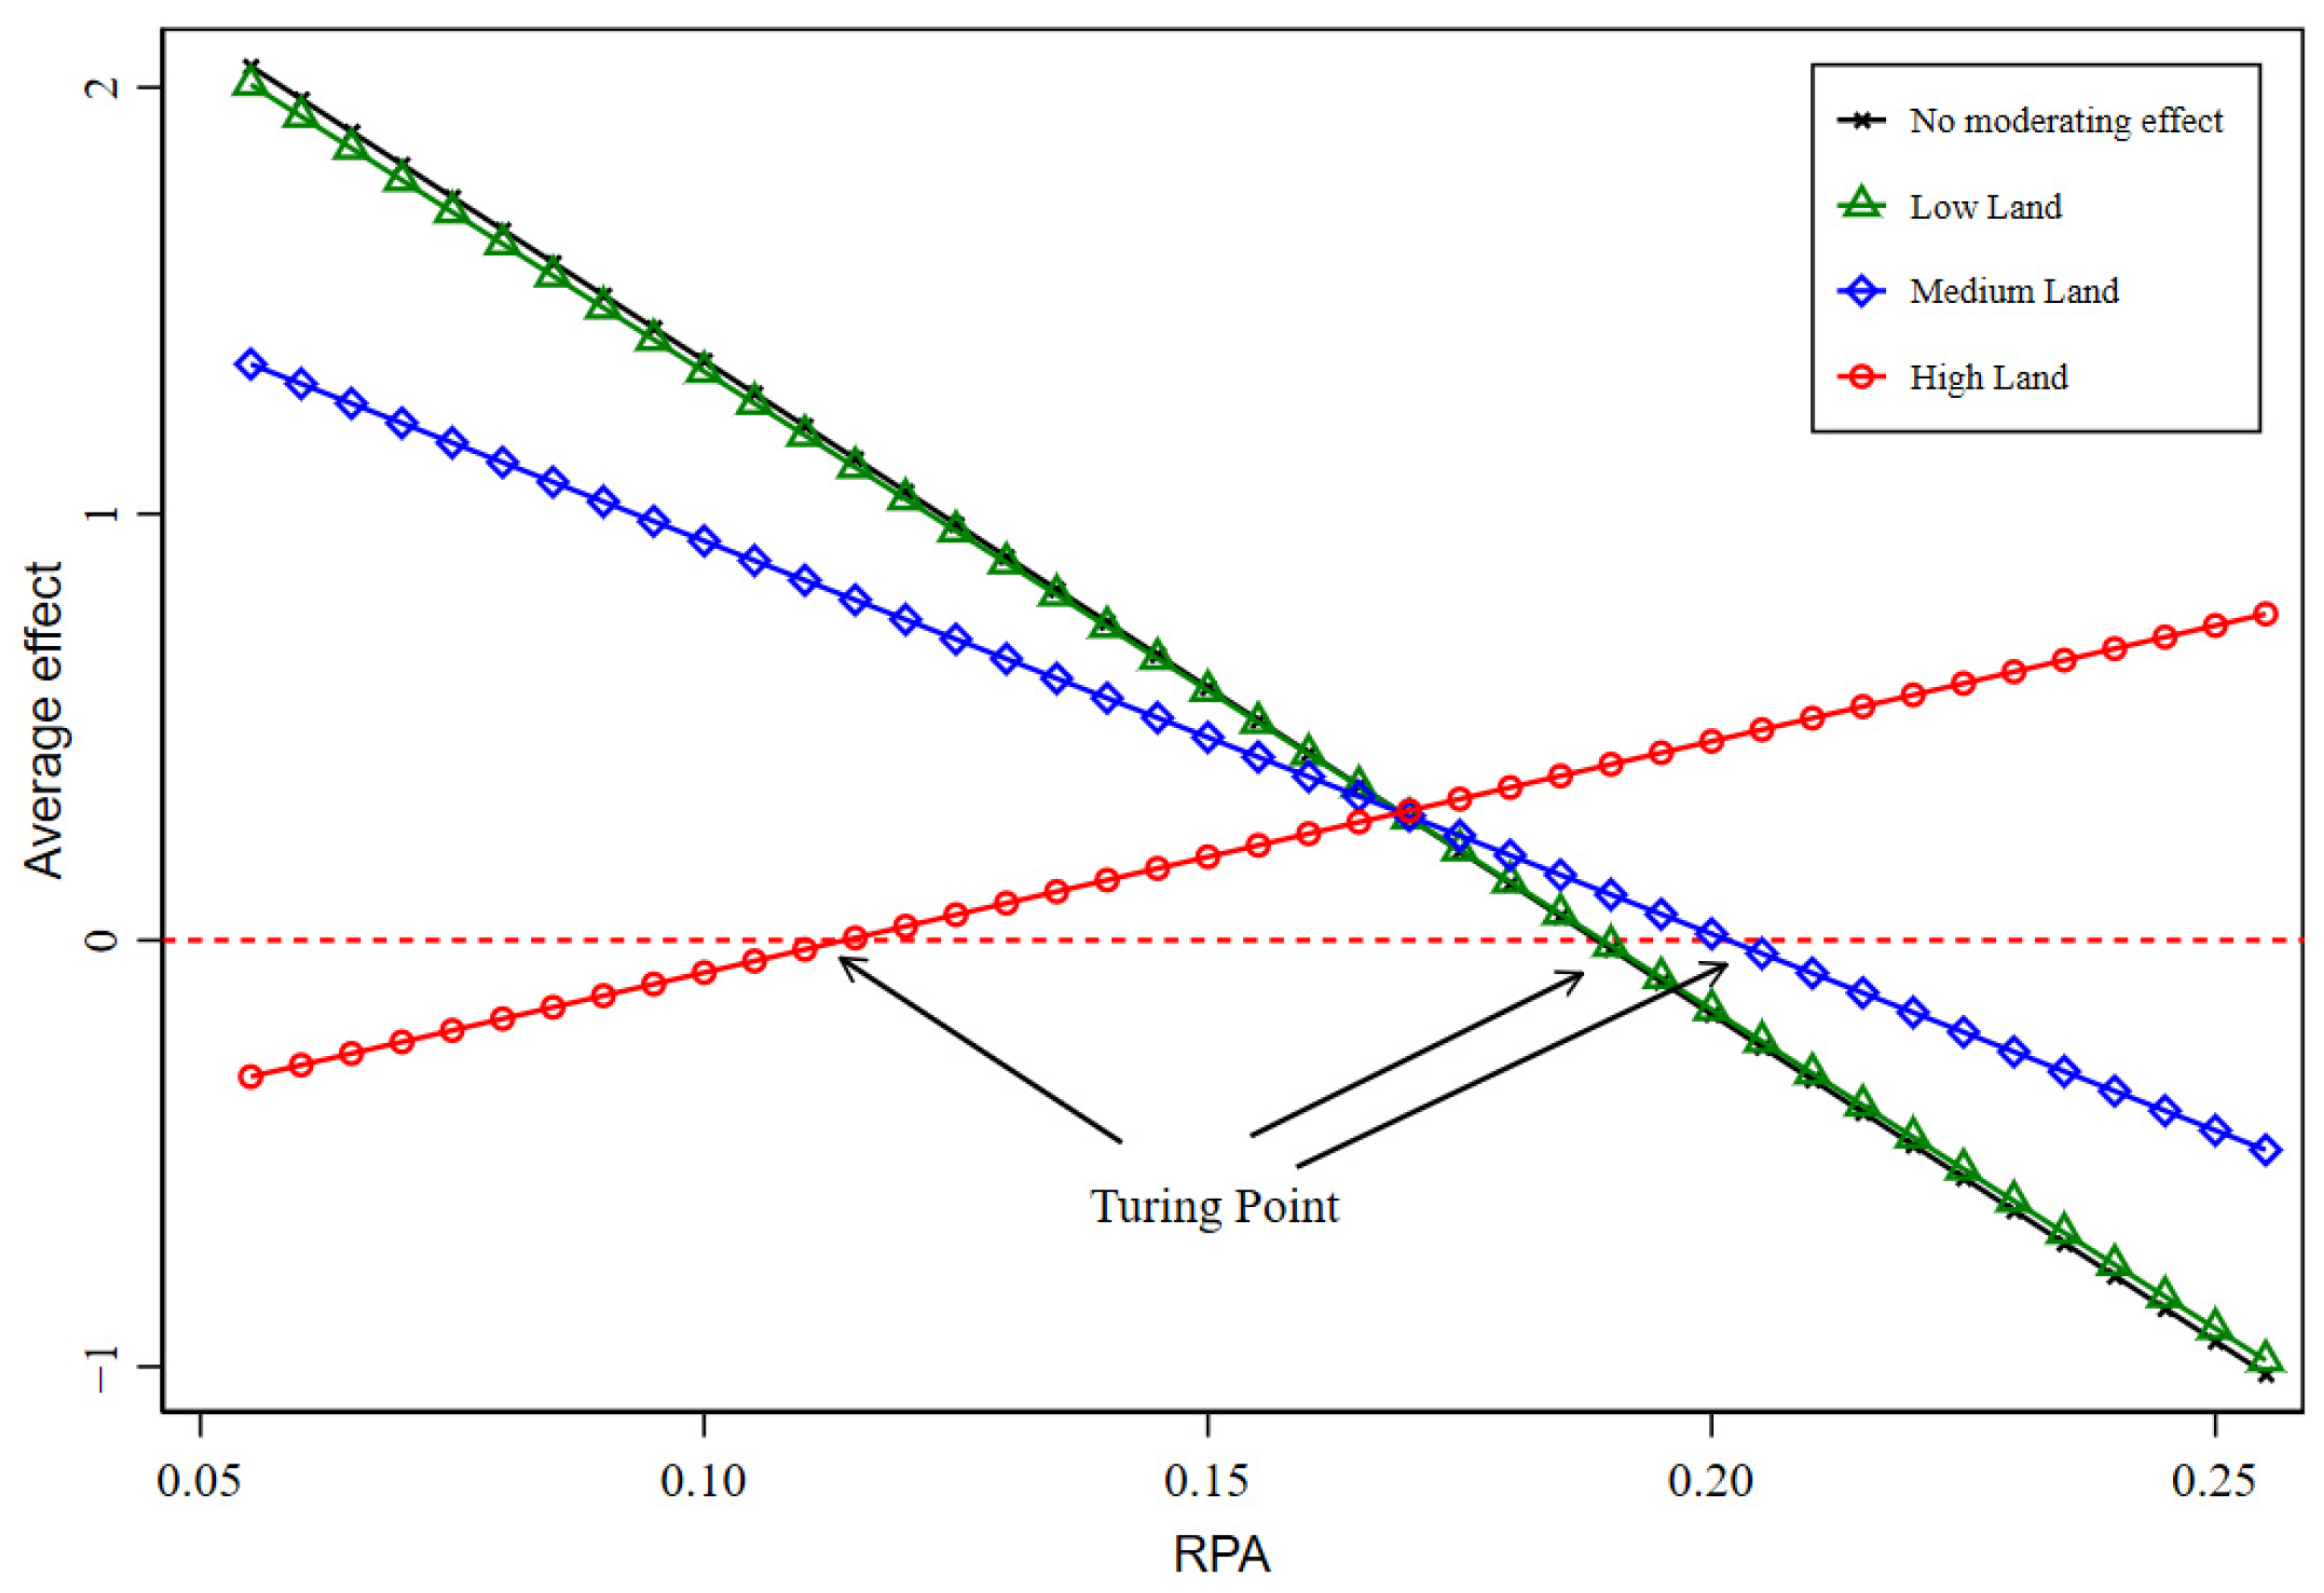
In this part, we examine the moderating effects of farmland transfer rate (Land) and agricultural technological progress (LnARD) on the relationship between RPA and LnPrice by incorporating interaction terms between RPA and these variables. Haans et al. [61] propose that a significantly negative coefficient for the quadratic interaction term (β4) intensifies the curvature of the inverted U-shaped relationship, whereas a significantly positive β4 flattens the curve or even reverses it into a U-shaped pattern. Based on the regression results displayed in Table 8, we can find that β4 equals 12.180 and 1.635 for Land and LnARD, respectively, both of which are significant at the 1% level. This outcome preliminarily indicates that, under the moderation of Land and LnARD, the previously observed inverted U-shaped relationship between RPA and LnPrice will flatten and eventually reverse, forming a U-shaped relationship effect.
Furthermore, by adopting the method of Lee et al. [62], we visualize the moderating effects and plot the moderating effect and average marginal effect graphs at different levels of the moderator variable to verify the reliability of the conclusions. Specifically, we use the minimum, mean, and maximum values as the criteria for dividing the different levels. According to Figure 3 and Figure 4, the continuous increase in the farmland transfer rate can indeed reverse the inverted U-shaped relationship between rural population aging and food prices. This phenomenon may be related to the rapid development of agricultural enterprises and new agricultural business entities. On the one hand, elderly farmers are leasing out their land due to their own circumstances; on the other hand, enterprises, large-scale farmers, and cooperatives, through acquiring farmland for large-scale operations, can rapidly improve production efficiency, thereby quickly achieving the reversal of this inverted U-shaped relationship. These findings provide empirical support for hypothesis 2.
According to Figure 5 and Figure 6, rural population aging has put pressure on traditional production models. Agricultural technological progress directly reduces labor demand by replacing manual labor with mechanization, and enhances land productivity and resource utilization efficiency through improved seed varieties and precision fertilization, thereby lowering production costs even with reduced labor input. Overall, technological advancement can effectively offset the cost increases caused by aging, promote agricultural production efficiency, and increase grain output. However, the rapid development of agricultural technology also raises the threshold for adoption, which may in turn lead to higher subsequent technology costs and impose additional pressure on grain production. Consequently, the inverted U-shaped relationship will gradually be reversed into a U-shaped one. These findings provide empirical support for hypothesis 3.

4.3. Spatial Spillover Effect Analysis

From the perspective of food transfer, as China accelerates the development of its diversified food supply system, food security is expanding from a traditional quantity-oriented concept to a quality-oriented one. The inter-provincial food transfer network has developed rapidly, and the transfer of grain profoundly affects the food supply in regional markets. Consequently, food prices exhibit significant spatial characteristics. From the perspective of rural population aging, the spatial mobility of rural labor across regions and between urban and rural areas exhibits strong spatial characteristics. Rural population aging leads to changes in regional agricultural production patterns, and the resulting issues, such as farmland abandonment and the weakening of agricultural comparative advantages, further exacerbate the imbalance in food supply and demand across regions. Therefore, the impact of the RPA on LnPrice is theoretically subject to spatial spillover effects. In order to analyze these spatial dynamics, this study employs the Spatial Durbin Model (SDM) for further analysis.

4.3.1. Spatiotemporal Evolution Analysis of RPA and LnPrice

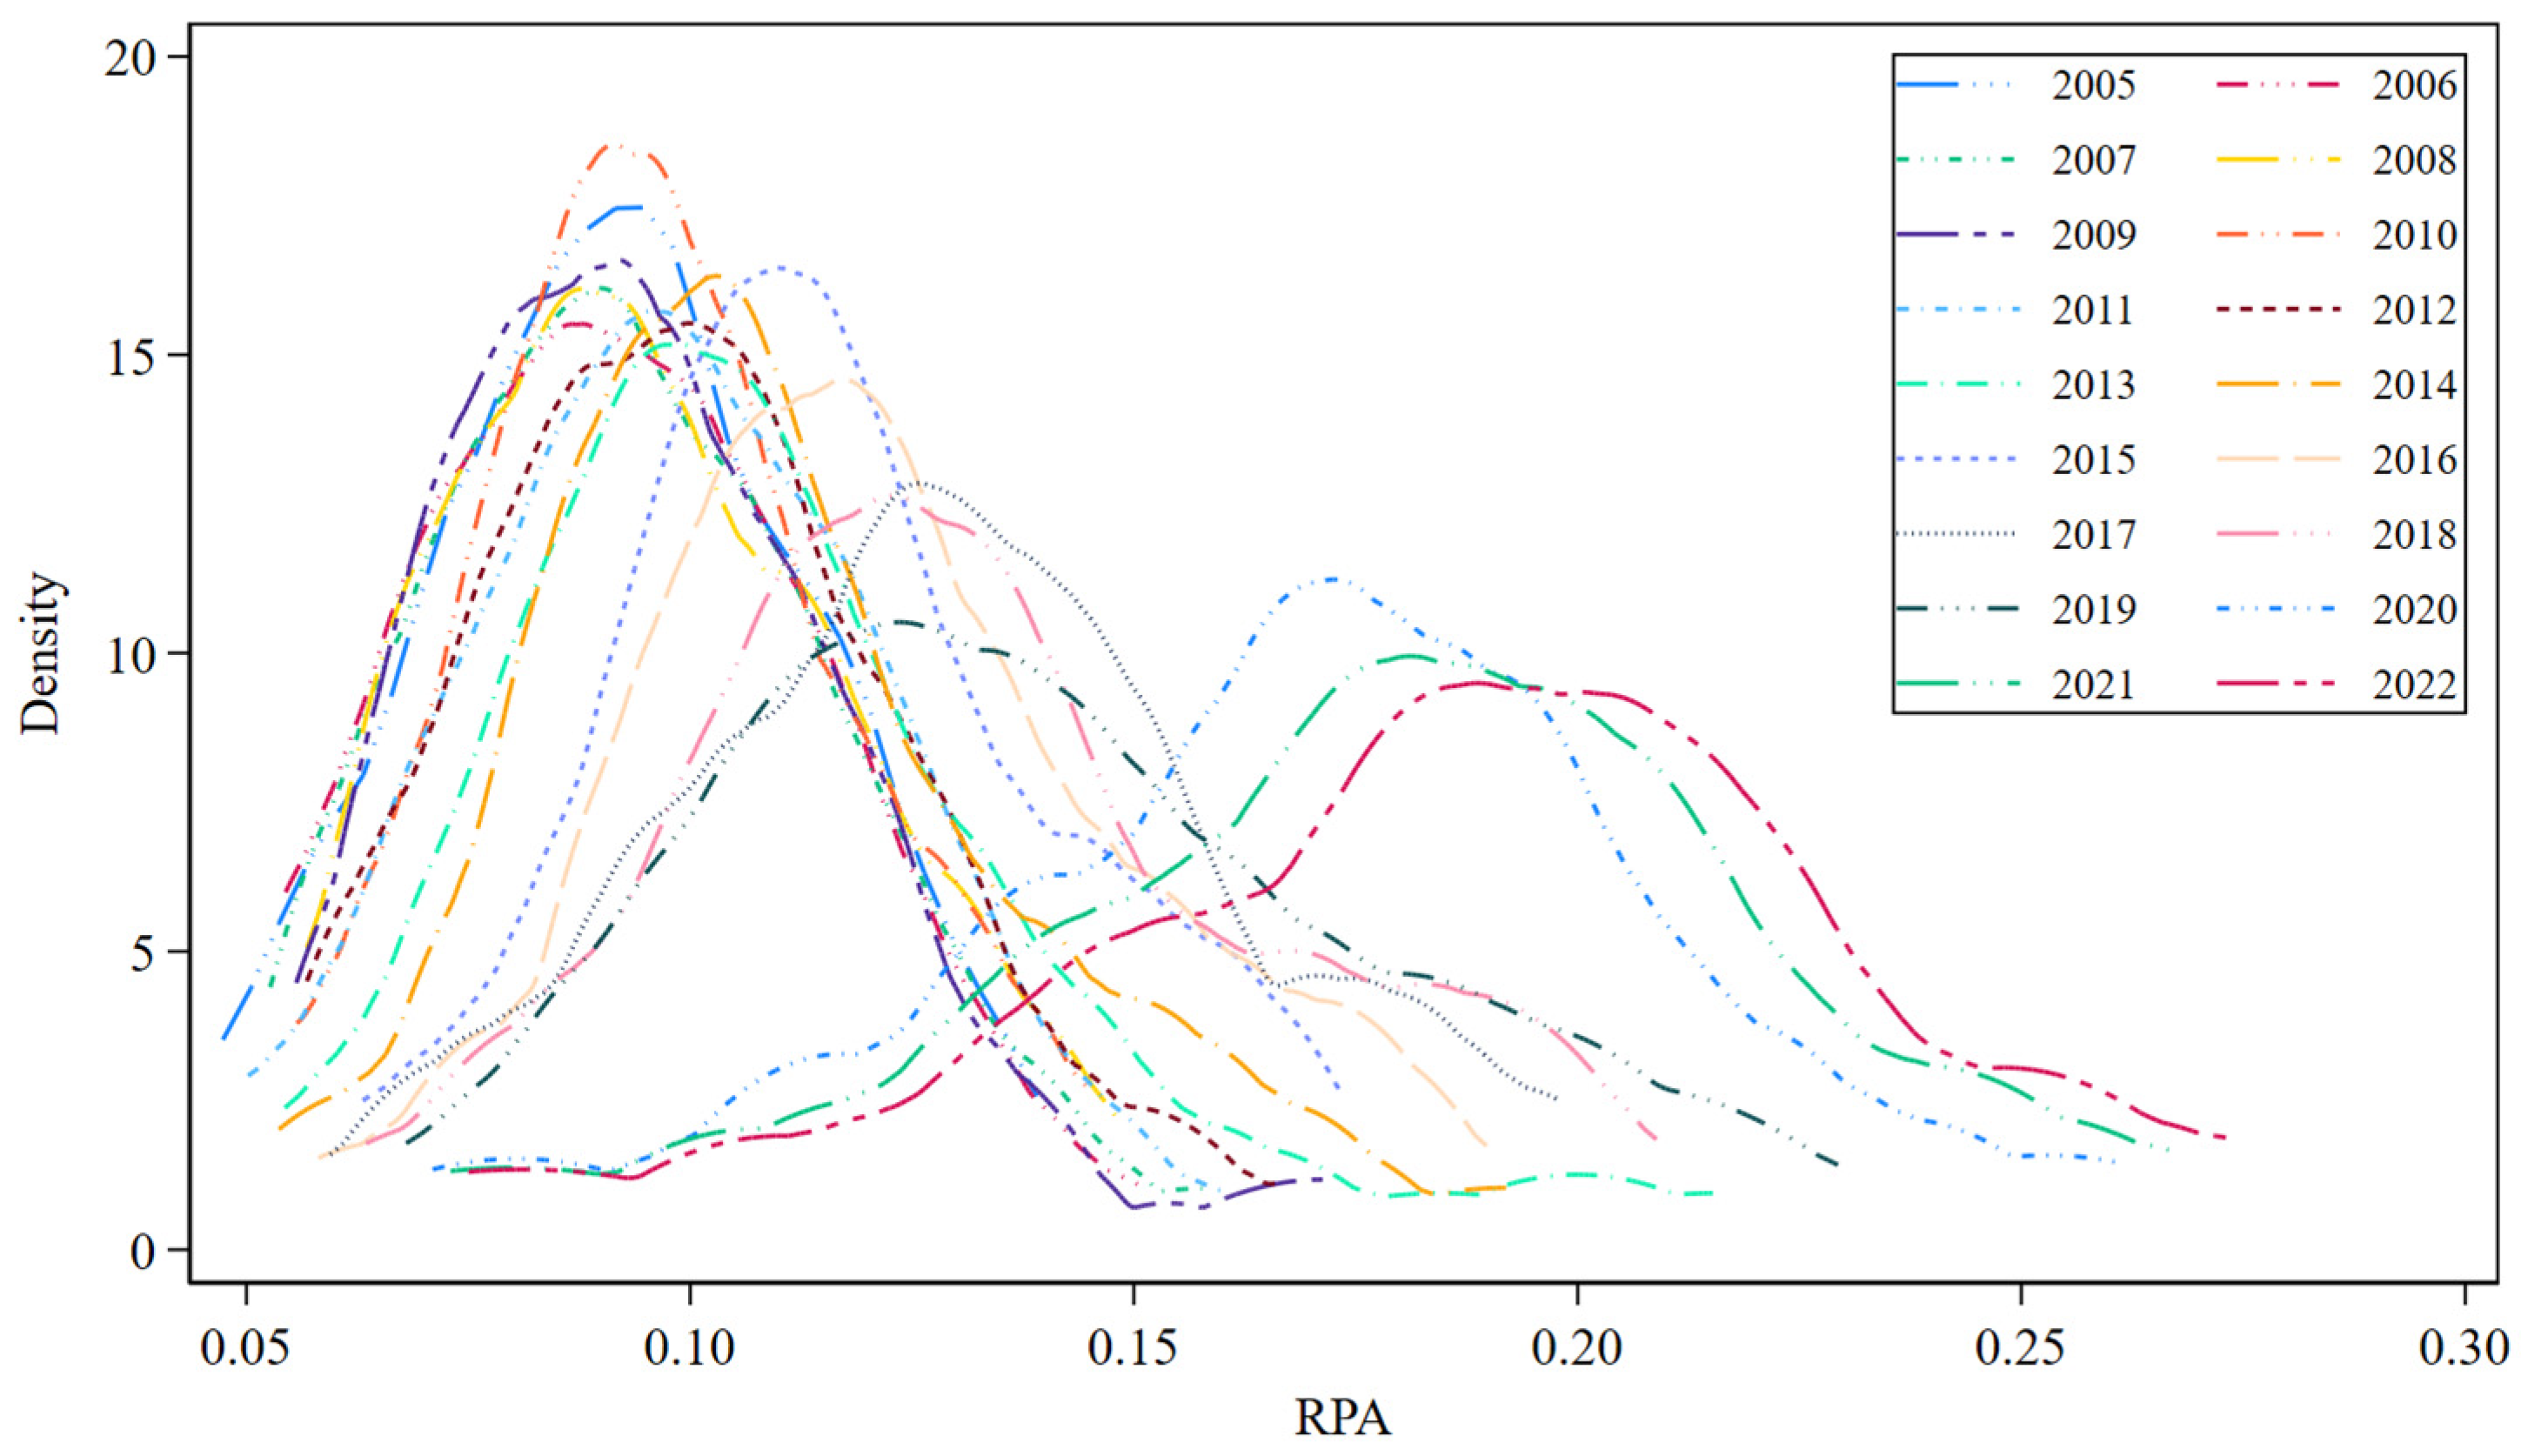
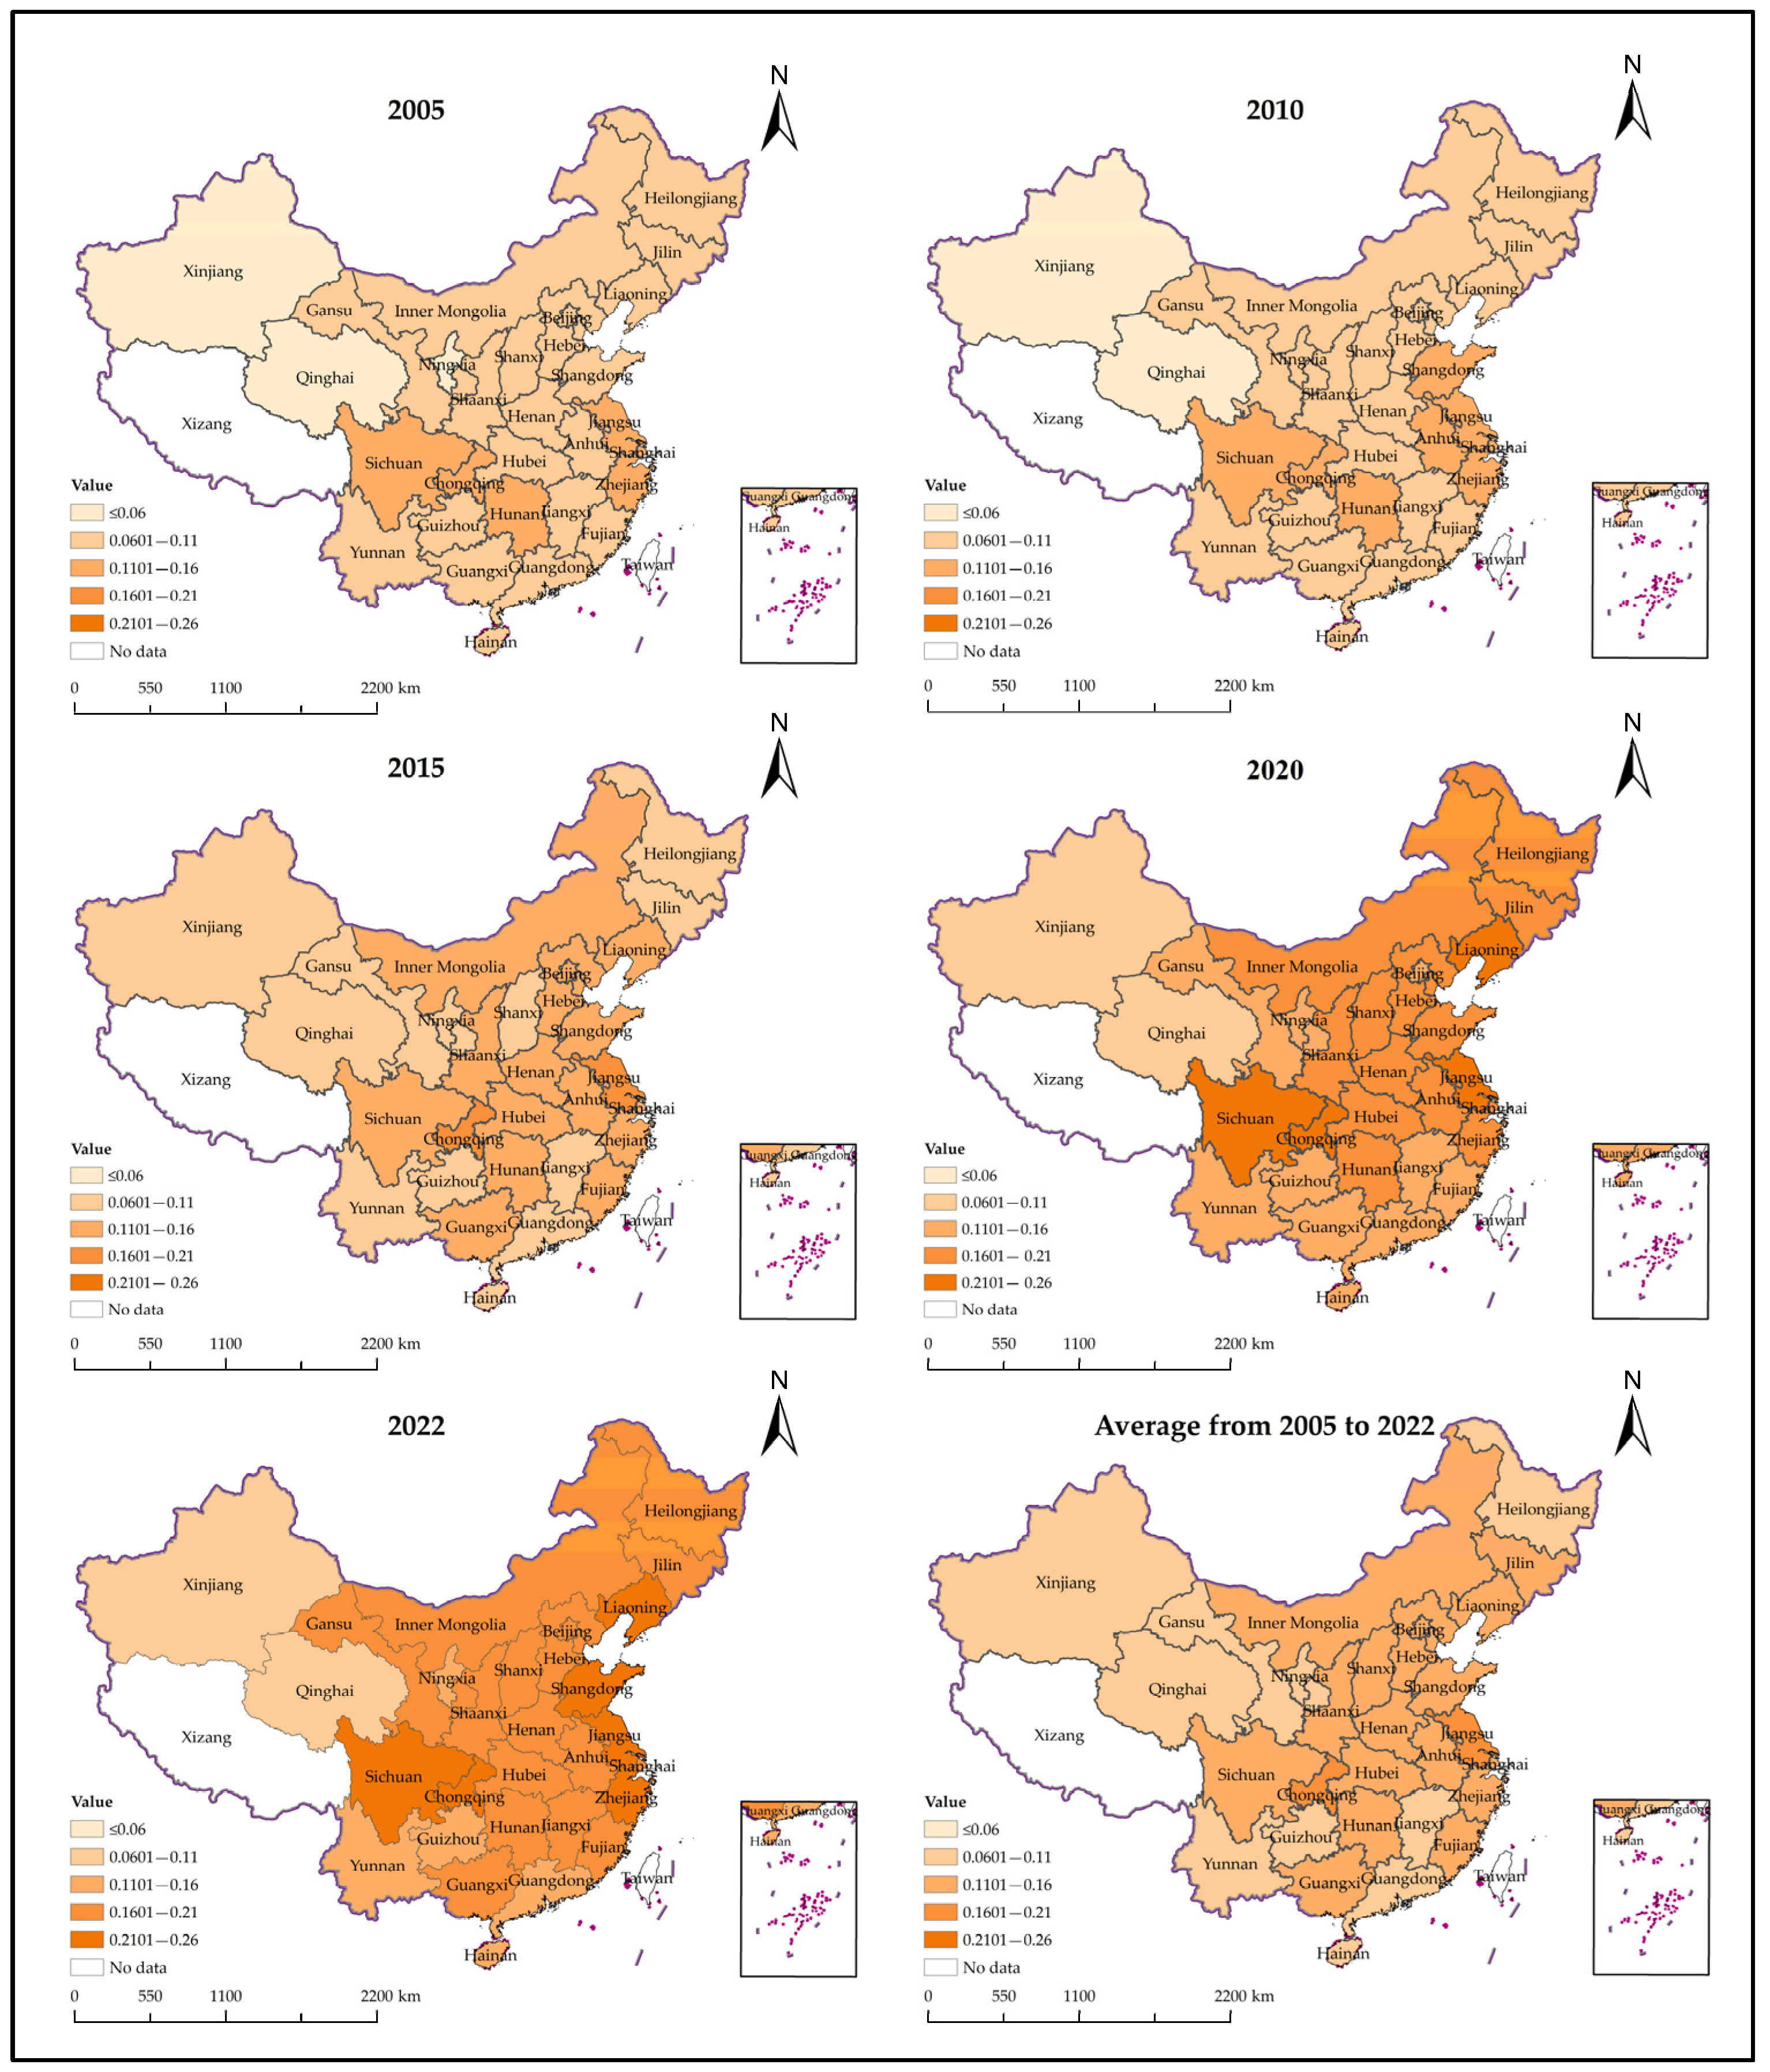
Prior to conducting the spatial spillover analysis, this study examines the spatiotemporal evolution of RPA and LnPrice. As shown in Figure 7, the distribution curve of RPA shifts rightward over time, indicating an overall upward trend. From 2005 to 2022, the peak of the curve declines significantly, while its width expands notably, suggesting that RPA has steadily increased over time. Additionally, the distribution changes from a unimodal to a multimodal pattern, reflecting a gradual diffusion of RPA along with faster and more diverse growth. Figure 8 illustrates the trends in population aging across Chinese provinces. Between 2005 and 2022, aging accelerated in most provinces. By 2022, RPA was most serious in Sichuan, Chongqing, Jiangsu, Zhejiang, and Shandong provinces.
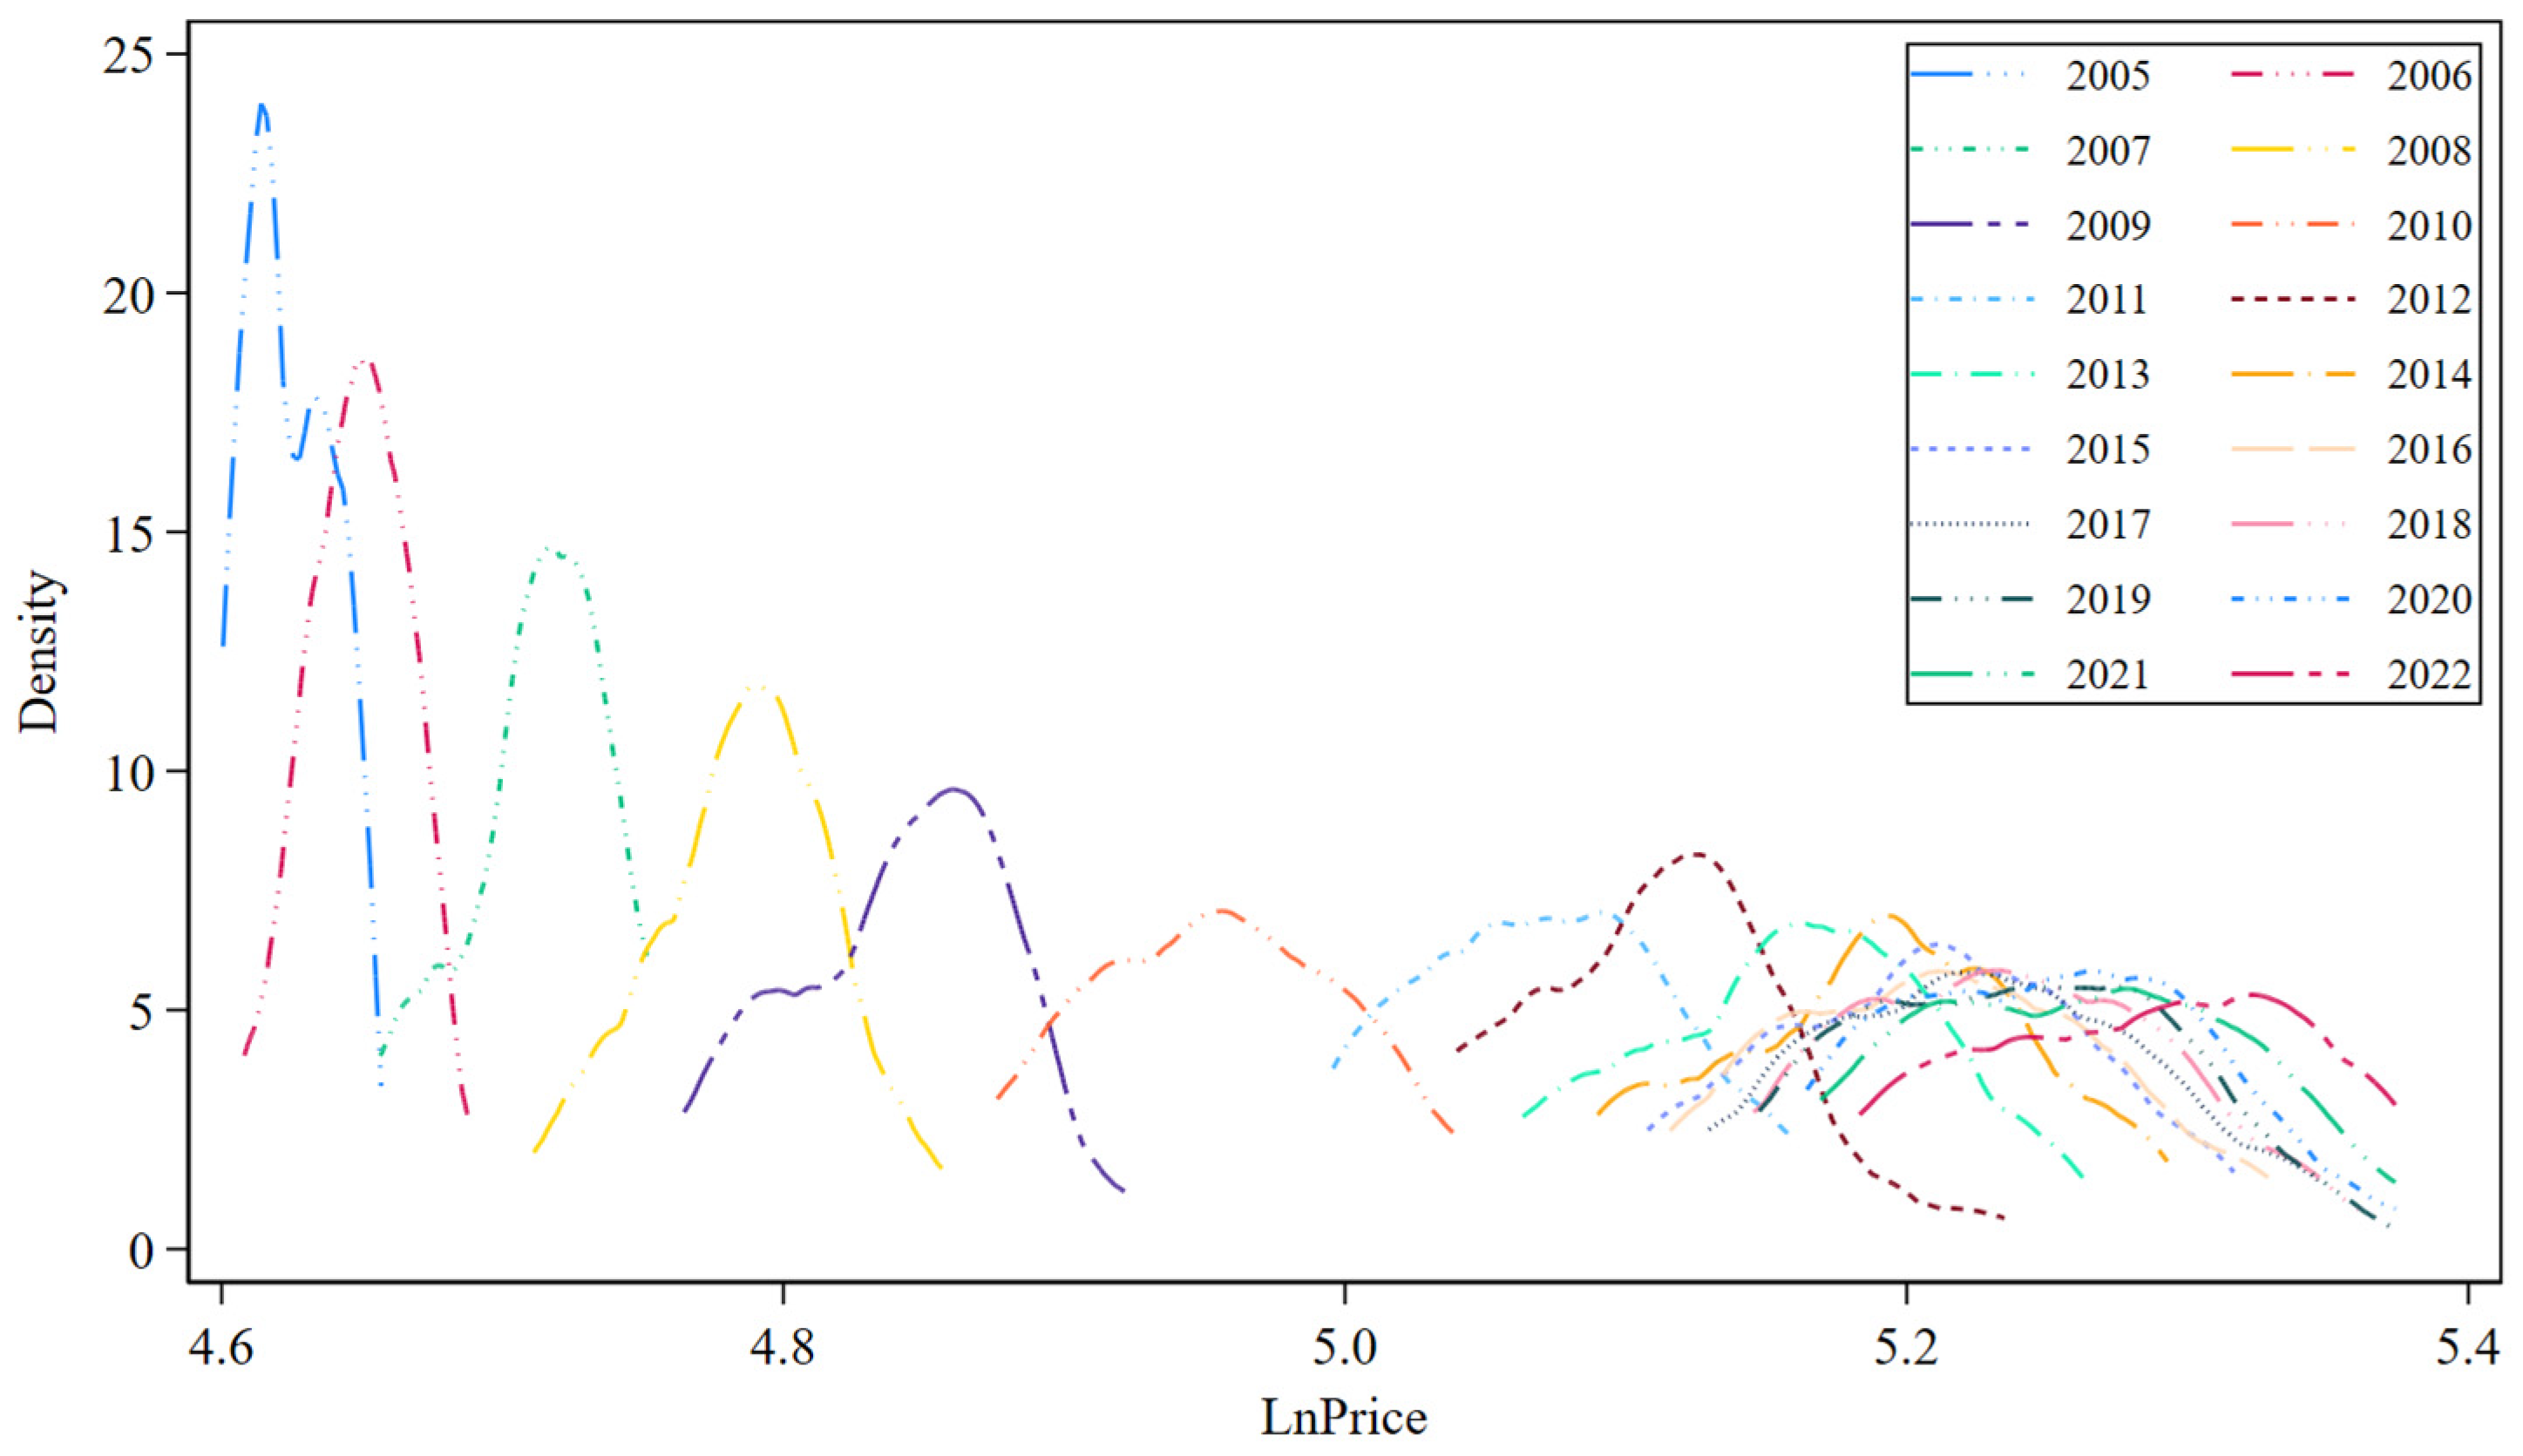
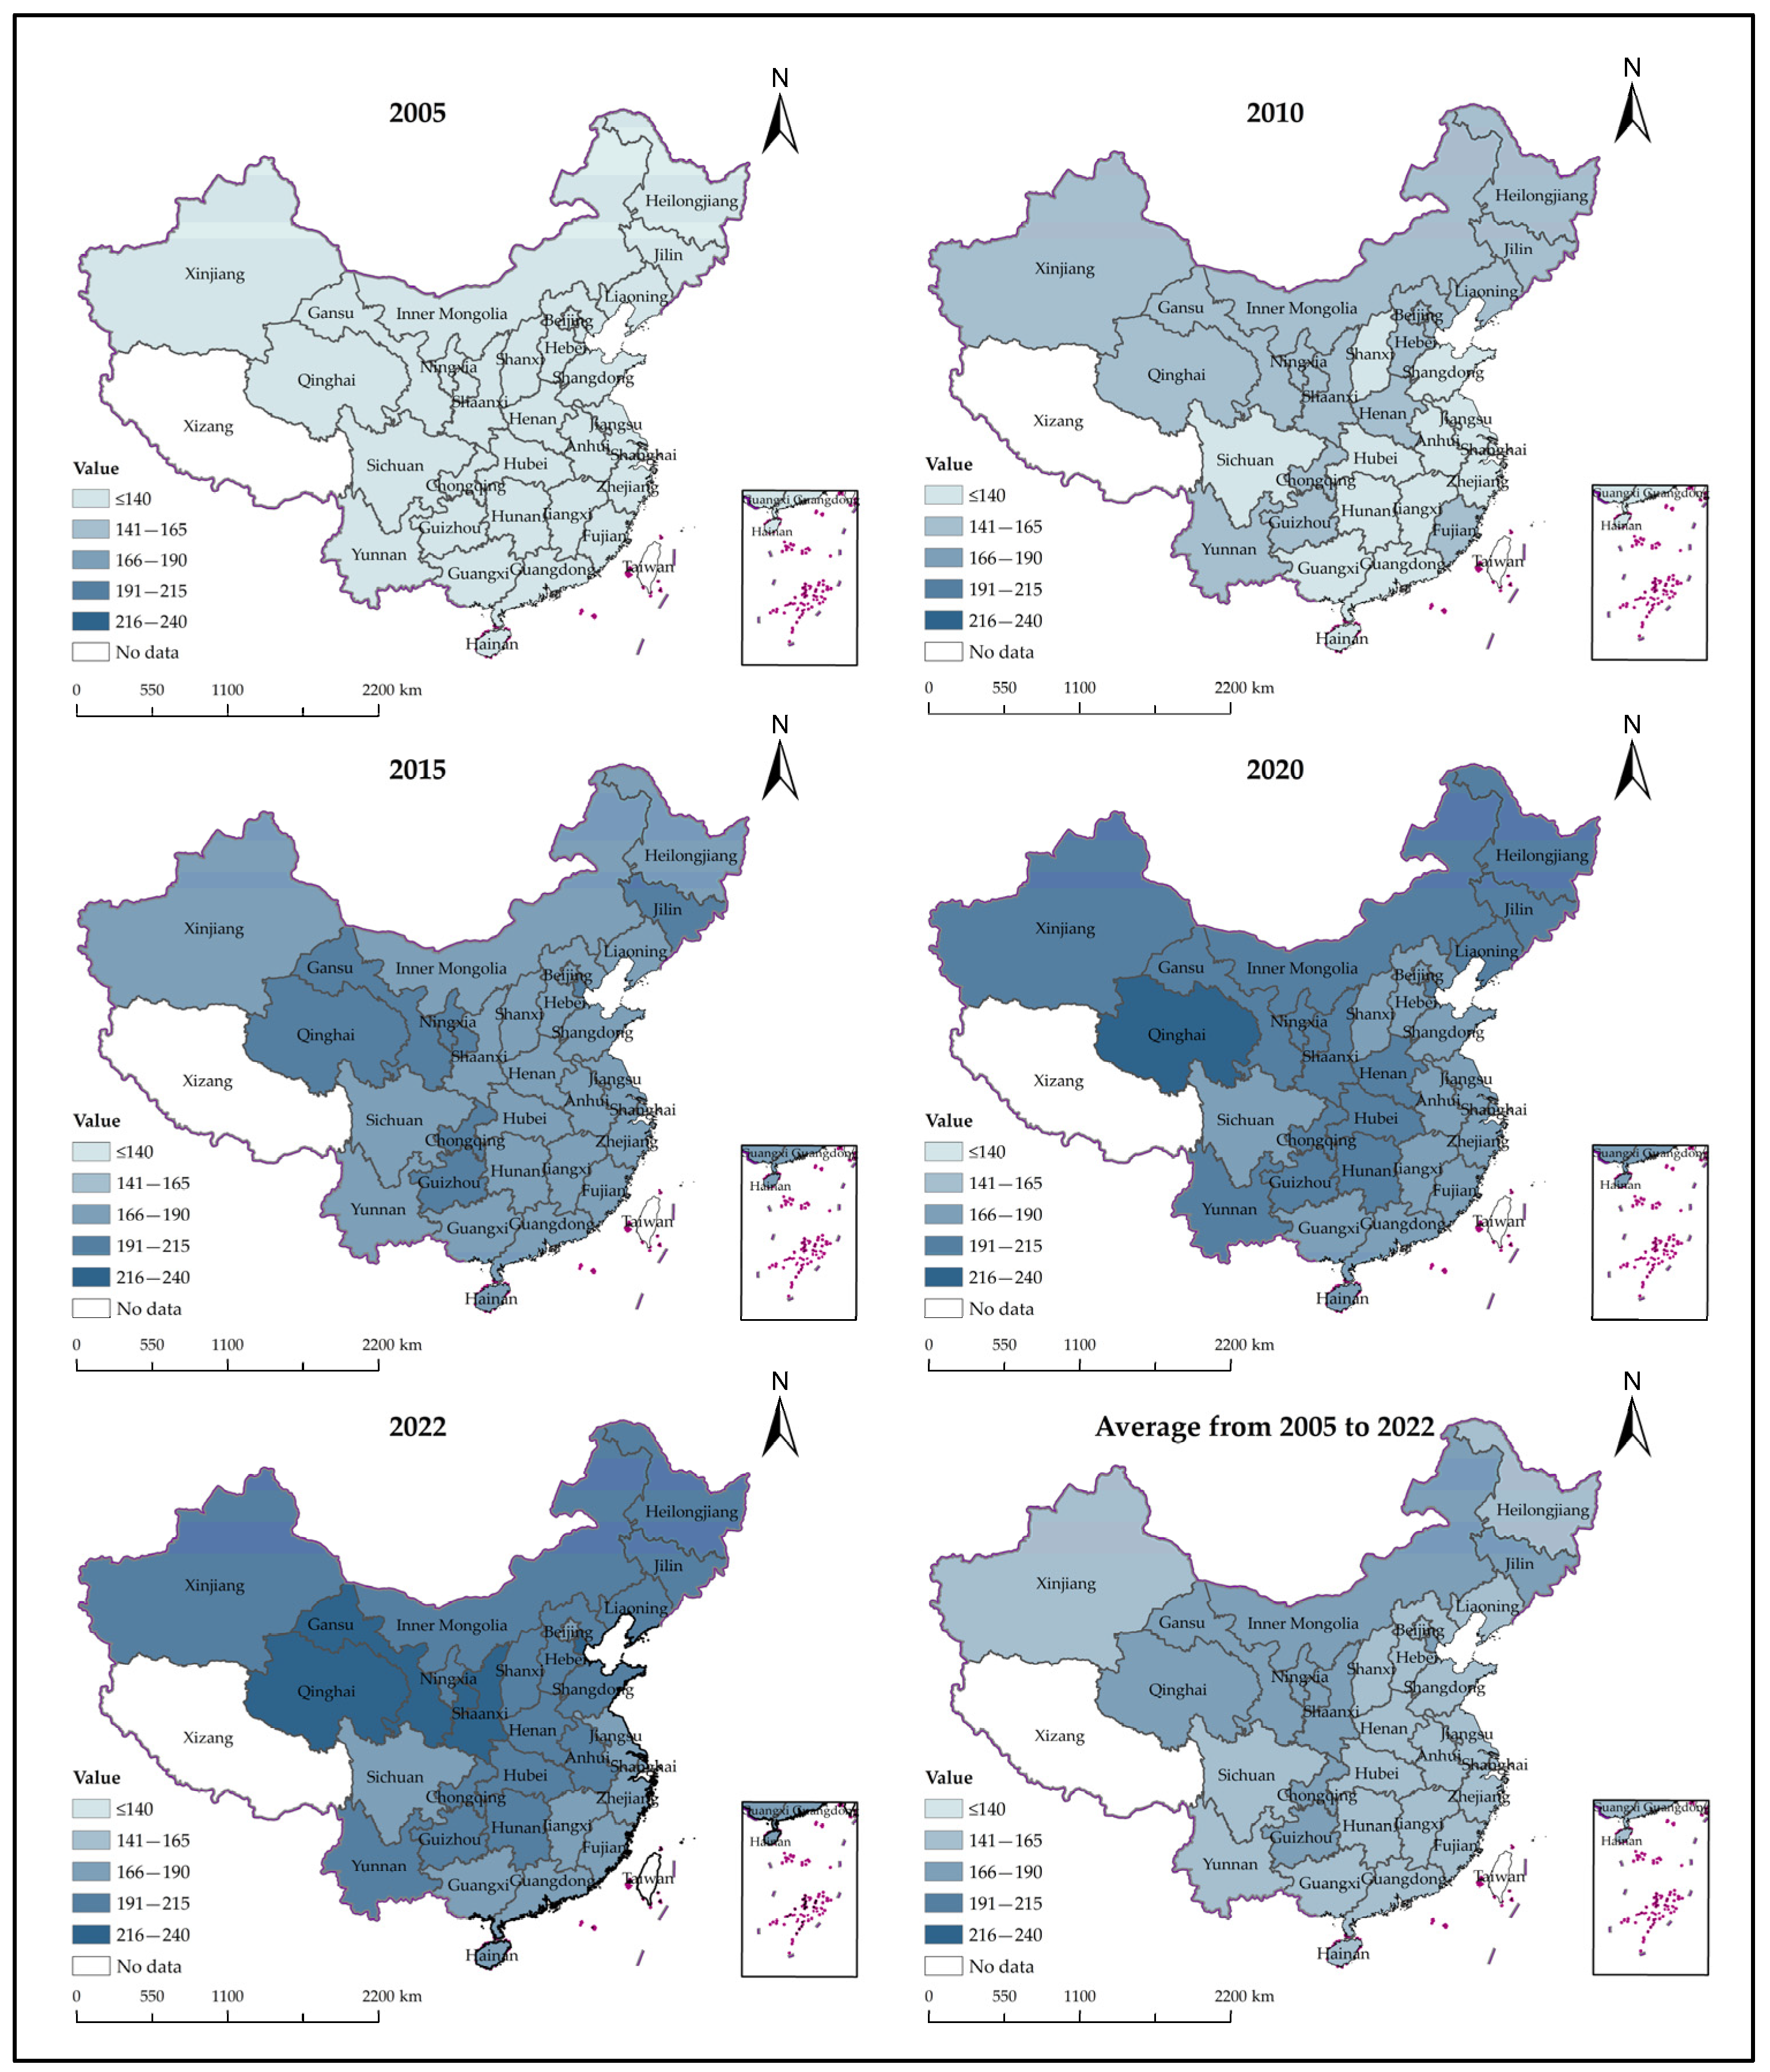
To better illustrate food price characteristics, the logarithmic form of food prices is used for charting, which does not affect the underlying trend. The outcome shown in Figure 9 reveals that the distribution curve of LnPrice shifts overall to the right, with notable variation across years, indicating a generally rapid upward trend in LnPrice. Over time, the curve shows an apparent decrease in peak height from 2005 to 2022. From 2011 to 2022, the curve’s width expands significantly, and the decline in peak height slows down. This pattern implies that the disparity in LnPrice among provinces has gradually increased, with the distribution changing from a unimodal to a multimodal shape, reflecting growing heterogeneity and increasing multipolar differentiation in LnPrice across provinces. As illustrated in Figure 10, LnPrice increased quickly across provinces from 2005 to 2015, surpassing 165 in most areas. By 2022, LnPrice levels exceeded 190 in many provinces. Overall, the average LnPrice in most provinces ranged between 140 and 165, with regions such as Guizhou, Chongqing, Inner Mongolia, and Gansu showing higher average levels between 165 and 190.

4.3.2. Spatial Autocorrelation Test

To further investigate the spatial spillover effects of the RPA on LnPrice and to minimize errors arising from weighting biases, we simultaneously employ both spatial contiguity matrices and geographic distance matrices for spatial regression. Table 9 presents the results of the global Moran’s I tests under both spatial weight matrices, indicating strong spatial autocorrelation for both the LnPrice and the RPA coefficient. These findings confirm that the data satisfy the necessary conditions for applying spatial econometric models.

4.3.3. Selection and Testing of Spatial Econometric Models

Table 10 presents the results of various diagnostic tests. The LM, LR, and Wald tests all reject the null hypotheses at the 1% significance level, indicating that the Spatial Durbin Model (SDM) is the appropriate choice and does not simplify to either the SEM or SAR. Furthermore, the Hausman test is significant at the 1% level, indicating a preference for the fixed effects model over the random effects model. Consequently, the fixed effects Spatial Durbin Model is selected for this study.

4.3.4. Analysis of SDM Results

Under both spatial weight matrices, the dual fixed effects model exhibits lower AIC and BIC values compared to models with only year or province fixed effects. Therefore, the dual fixed effects Spatial Durbin Model is selected for analyzing spatial spillover effects. According to columns (3) and (6) in Table 11, the coefficients of RPA and its squared term (RPA2) are 1.774 and −4.695 under the spatial contiguity matrix, and 1.565 and −4.059 under the geographic distance matrix, respectively. These results demonstrate a significant inverted U-shaped relationship between RPA and LnPrice at the 1% level, along with considerable spatial spillover effects. Moreover, the spatial spillover effect itself exhibits a significant U-shaped pattern.
Because of the spatial lag terms in the spatial Dubbin model, simple point estimates cannot fully explain the marginal effects on LnPrice and do not accurately depict the level of influence [63]. Consequently, following the partial differential decomposition approach [64,65], the estimated model results are decomposed into average direct and average indirect effects. The direct effect represents the average total impact of changes in the local RPA on LnPrice within the same region, while the indirect effect captures the average influence of the local RPA on LnPrice in spatially connected neighboring regions. Table 12 shows that the independent variables for both direct and indirect effects are statistically significant. In the indirect effects results, the coefficients of RPA are –2.076 and –1.605, while those of RPA2 are 5.735 and 4.604. This indicates that under both spatial weighting matrices, the average impact of local RPA changes on LnPrice fluctuations in neighboring provinces exhibits a U-shaped relationship. The possible reasons are: Since the reform and opening-up period, rural labor migration has transitioned from mainly government-planned movements to primarily market-driven voluntary migration. Variations in economic development and agricultural technology across provinces lead most rural workers to migrate to economically advanced neighboring provinces. These neighboring provinces, by attracting rural labor and utilizing their more advanced agricultural technologies, further boost local grain production, which helps lower LnPrice. However, when the negative impacts of RPA in neighboring provinces outweigh the benefits of labor inflow, LnPrice starts to rise. This creates a U-shaped spatial spillover effect on LnPrice.

5. Discussion

5.1. Reflections on Research

In this paper, we empirically investigate the relationship between RPA, farmland transfer, agricultural technological progress, and LnPrice within a comprehensive macroeconomic econometric framework. These results indicate that rural population aging nonlinearly influences LnPrice and exhibits spatial spillover effects. Additionally, the nonlinear influence on LnPrice can even reverse direction, mainly through channels like farmland transfer and agricultural technological progress. This finding is valuable for promoting high-quality agricultural development, increasing grain production, and ensuring food security amid a society facing significant aging.
Firstly, rural population aging profoundly impacts grain production efficiency and ensures food security. Population migration in China is a key driver of this aging trend. While elderly farmers mitigate labor loss through accumulated agricultural expertise, surging food consumption amid rapid socioeconomic development exerts pressure on production. Consequently, RPA greatly increases LnPrice because it hinders agricultural production efficiency—a finding consistent with Du’s conclusions [27]. However, as the negative impacts of aging deepen, the increasing rate of farmland transfers has driven down agricultural costs for grain cultivation, boosting productivity [66]. The advancement of agricultural technology has significantly improved farming efficiency, contributing to agricultural modernization and playing a crucial role in ensuring food security [67]. Consequently, RPA exerts a notable suppressing effect on LnPrice, meaning it actually promotes improvements in grain production efficiency.
Secondly, major grain-producing regions in China experience more pronounced rural population aging. Although farmland transfer rate and agricultural technology will continuously boost grain production efficiency, the average LnPrice is currently trending downward. However, in the long term, the long term, China’s per capita food consumption is anticipated to increase, potentially outpacing the efficiency of food production and supply. Furthermore, China’s rural restructuring is currently undergoing a period of accumulating “potential energies” driven by population aging [68], with issues related to food security and rural development gradually becoming more prominent. Therefore, developed eastern regions must actively seek innovative agricultural technologies and production methods while also encouraging agricultural growth in central and western regions. Provinces need to collaborate to build higher-quality food transfer networks to collectively protect food security during complex circumstances, ensuring that domestic production remains the main source of food security and reducing dependence on imported food.

5.2. Limitations and Prospects

Firstly, food production costs are constrained by multiple factors, and data on certain agricultural input price indices are incomplete. Therefore, this study primarily relies on existing literature for theoretical analysis in the production stage, lacking corresponding empirical results from grain production indices to validate our conclusions. Secondly, our attention to the complex context of international food trade remains insufficient, particularly regarding imports and exports. In this study, we only include agricultural imports as a control variable in the robustness tests, which fails to fully capture the comprehensive influence of global markets. Thirdly, food may still play an important role in informal markets, a factor that is difficult to incorporate into current research models. Finally, as technology continues to advance in the agricultural sector, agricultural robots have seen some application in labor substitution. However, due to data availability and completeness limitations, this factor could not be incorporated into our research model, which may affect the precision of our estimates.
In future research, we plan to incorporate factors such as international grain trade linkages and global energy prices, so as to deepen and refine our empirical analysis. In addition, we will develop more precise models and metrics for measuring social factors to eliminate the interference of other factors on the model’s estimates. When data conditions improve, we will further examine the impact on various stages of food production in the context of an aging population and verify whether the introduction of agricultural robots alters the current conclusions, with particular attention to whether western regions can break free from the inverted U-shaped relationship through this technology. Meanwhile, we will introduce more refined technology adoption indicators and combine them with micro-level survey data to further uncover the intrinsic mechanisms between technological progress and aging, thereby providing more targeted empirical support for policy formulation.

6. Conclusions and Policy Implications

6.1. Conclusions

This research originates from the problem related to agricultural development caused by the aging of China’s rural population. Derived from meticulous theoretical analysis and extensive empirical tests, we found that: (1) The impact of RPA on LnPrice shows a significant inverted U-shaped relationship, with the inflection point around 19.03%. Before this point, RPA significantly promotes the increase in LnPrice. When the point is passed, RPA has a negative effect on LnPrice. This relationship is significant in western regions, whereas it is not significant in eastern and central regions. (2) Farmland transfer and agricultural technological progress significantly influence the inverted U-shape between RPA and LnPrice. Higher levels of these factors gradually flatten the inverted U-shape, shifting it toward a U-shape, indicating that LnPrice will gradually increase in the future. (3) Spatial spillover analysis reveals that changes in regional RPA exhibit a significant U-shaped spillover effect on LnPrice in nearby provinces. Before the turning point, increases in RPA slow down food price growth in neighboring areas. After the turning point, they have a promoting effect. By adopting a long-term perspective and developing appropriate strategic measures and policies, food security will be effectively protected.

6.2. Policy Implications

The primary contribution of this study is identifying and analyzing the inverted U-shaped relationship between rural population aging and food prices. By thoroughly examining this relationship, we clearly explain the mechanism through which RPA influences LnPrice. The results carry significant policy implications.
Firstly, in regions where the aging population has not yet reached a turning point, the early implementation of land transfers and the promotion of agricultural technology can help to slow the rapid rise in food prices. In regions that have already passed this turning point, however, it is necessary to guard against the risk of production contraction caused by excessive downward pressure on food prices resulting from an aging population, and to safeguard farmers’ income from food production. As land transfers and agricultural technological progress can effectively reverse the inverted U-shaped relationship, efforts should be accelerated to establish standardised, market-oriented platforms for agricultural land transfers that encourage the concentration of farmland among new types of agricultural operators. At the same time, research and development efforts, as well as subsidies, for technologies such as smart agricultural machinery and precision agriculture, should be increased to compensate for the physical limitations and numerical shortage of the aging labor force. Furthermore, the significance of spatial spillover effects implies that local rural population aging can affect food prices in neighboring regions. Therefore, it is necessary to establish cross-regional food price early warning and coordinated regulation mechanisms, strengthen production-and-sales collaboration between major producing and consuming regions, and prevent localized aging shocks from amplifying food price volatility risks through spatial diffusion.
Secondly, the government should strengthen social security policies targeting the aging agricultural labor force, including improving healthcare, old-age support, and insurance systems to establish a more comprehensive social protection system for the elderly. Meanwhile, enhanced policy protection and financial support for young rural laborers are essential to encourage them to remain in rural areas and engage in innovative and entrepreneurial activities, as these measures are critical for achieving sustainable agricultural development, stabilizing grain prices, and ensuring food security. In terms of food production, it is necessary to increase investment in agricultural science and technology to promote technological progress; upgrading agricultural infrastructure, such as irrigation systems and water conservancy facilities, can enhance the resilience of food production to natural disasters and ensure stable and sustained output growth. Furthermore, promoting agricultural innovation through the dissemination of advanced cultivation techniques, high-quality crop varieties, and efficient production management practices will effectively improve both the yield and quality of food production. In addition, a well-established grain reserve system is crucial for ensuring a stable food supply and sustainable consumption, as such a system enables the timely release of reserve stocks in response to fluctuations in market supply and demand, thereby maintaining stability in food markets.

Author Contributions

Z.N.: methodology, writing—original draft, formal analysis, visualization, software. Z.L.: investigation, resources, data curation. W.L.: methodology, validation, visualization. Q.L.: resources, data curation, validation. J.P.: conceptualization, formal analysis, supervision, project administration, funding acquisition, writing—review and editing. All authors have read and agreed to the published version of the manuscript.

Funding

This research was funded by the Gansu Provincial Science and Technology Plan Project: Soft Science Specialised General Project (20CX4ZA034).

Institutional Review Board Statement

Not applicable.

Data Availability Statement

The data used in this study are publicly available; data sources are indicated in the text.

Conflicts of Interest

All authors declare that there are no conflicts of interest in this research.

Abbreviations

The following abbreviations are used in this manuscript:
LMLagrange Multiplier test
LRLikelihood-Ratio test
AICAkaike Information Criterion
BICBayesian Information Criterion

References

  1. Bellemare, M.F. Rising Food Prices, Food Price Volatility, and Social Unrest. Am. J. Agric. Econ. 2014, 97, 1–21. [Google Scholar] [CrossRef] [Scilit]
  2. Weinberg, J.; Bakker, R. Let them eat cake: Food prices, domestic policy and social unrest. Confl. Manag. Peace Sci. 2014, 32, 309–326. [Google Scholar] [CrossRef] [Scilit]
  3. Guo, G.; Wen, Q.; Zhu, J. The Impact of Aging Agricultural Labor Population on Farmland Output: From the Perspective of Farmer Preferences. Math. Probl. Eng. 2015, 2015, 730618. [Google Scholar] [CrossRef] [Scilit]
  4. Wang, L.; Luo, D.; Zhang, Y. Rural aging, land markets, and farm operations in China. Appl. Econ. Lett. 2024, 33, 177–184. [Google Scholar] [CrossRef] [Scilit]
  5. Jiang, N. The influence of population aging on Chinese economy. In Proceedings of the 2018 8th International Conference on Management, Education and Information (MEICI 2018), Shenyang, China, 21–23 September 2018; pp. 1025–1030. [Google Scholar] [CrossRef] [Scilit]
  6. Zhang, Z.; Jin, J.; Li, S.; Han, Z.; Wu, Z.; Xu, X.; Li, Y.; Peng, T. Research Review and Development Trend Analysis of Grain Multimodal Transport with a Special Emphasis Upon China. Agriculture 2026, 16, 592. [Google Scholar] [CrossRef] [Scilit]
  7. Tang, Y.; Lu, X.; Yi, J.; Wang, H.; Zhang, X.; Zheng, W. Evaluating the spatial spillover effect of farmland use transition on grain production—An empirical study in Hubei Province, China. Ecol. Indic. 2021, 125, 107478. [Google Scholar] [CrossRef] [Scilit]
  8. Han, X.; Xue, P.; Zhu, W.; Wang, X.; Li, G. Shrinking Working-Age Population and Food Demand: Evidence from Rural China. Int. J. Environ. Res. Public Health 2022, 19, 14578. [Google Scholar] [CrossRef] [Scilit]
  9. Mhonyera, G.; Masunda, S.; Meyer, D.F. Measuring the pass-through effect of global food price volatility and South Africa’s CPI on the headline inflation of Zimbabwe. Cogent Food Agric. 2023, 9, 2212458. [Google Scholar] [CrossRef] [Scilit]
  10. Dorward, A. Getting Real About Food Prices. Dev. Policy Rev. 2011, 29, 647–664. [Google Scholar] [CrossRef] [Scilit]
  11. Gupta, E.; Ramaswami, B.; Somanathan, E. The distributional impact of climate change: Why food prices matter. Econ. Disasters Clim. Change 2021, 5, 249–275. [Google Scholar] [CrossRef] [Scilit]
  12. Min, S. Demographic Change and Inequality in the Korean Farm Income. Agriculture 2023, 13, 1832. [Google Scholar] [CrossRef] [Scilit]
  13. Kashnitsky, I.; De Beer, J.; Van Wissen, L. Unequally ageing regions of Europe: Exploring the role of urbanization. Popul. Stud. 2020, 75, 221–237. [Google Scholar] [CrossRef] [Scilit]
  14. Ramachandran, V. Convergence, Development, and Energy-Intensive Infrastructure in Africa: A Review of the Evidence. Sustainability 2021, 13, 10572. [Google Scholar] [CrossRef] [Scilit]
  15. Bloom, D.E.; Chatterji, S.; Kowal, P.; Lloyd-Sherlock, P.; Mckee, M.; Rechel, B.; Rosenberg, L.; Smith, J.P. Macroeconomic implications of population ageing and selected policy responses. Lancet 2015, 385, 649–657. [Google Scholar] [CrossRef] [Scilit]
  16. Rigg, J.; Phongsiri, M.; Promphakping, B.; Salamanca, A.; Sripun, M. Who will tend the farm? Interrogating the ageing Asian farmer. J. Peasant. Stud. 2020, 47, 306–325. [Google Scholar] [CrossRef] [Scilit]
  17. Zhang, X.; Yang, J.; Wang, S. China has reached the Lewis turning point. China Econ. Rev. 2011, 22, 542–554. [Google Scholar] [CrossRef] [Scilit]
  18. Liu, G.; Wang, H.; Cheng, Y.; Zheng, B.; Lu, Z. The impact of rural out-migration on arable land use intensity: Evidence from mountain areas in Guangdong, China. Land Use Policy 2016, 59, 569–579. [Google Scholar] [CrossRef] [Scilit]
  19. Cao, Z.; Zheng, X.; Liu, Y.; Li, Y.; Chen, Y. Exploring the changing patterns of China’s migration and its determinants using census data of 2000 and 2010. Habitat Int. 2018, 82, 72–82. [Google Scholar] [CrossRef] [Scilit]
  20. Hassen, A.A.; Yimam, Z.G. Effects of food price volatility on food security in rural Ethiopia: A panel data analysis. Dev. Pract. 2025, 35, 538–548. [Google Scholar] [CrossRef] [Scilit]
  21. Valera, H.G.; Balié, J.; Magrini, E. Is rice price a major source of inflation in the Philippines? A panel data analysis. Appl. Econ. Lett. 2021, 29, 1528–1532. [Google Scholar] [CrossRef] [Scilit]
  22. Apergis, N.; Rezitis, A. Food Price Volatility and Macroeconomic Factors: Evidence from GARCH and GARCH-X Estimates. J. Agric. Appl. Econ. 2011, 43, 95–110. [Google Scholar] [CrossRef] [Scilit]
  23. Lyu, J.; Li, X. Effectiveness and Sustainability of Grain Price Support Policies in China. Sustainability 2019, 11, 2478. [Google Scholar] [CrossRef] [Scilit]
  24. Tan, Y.; Yue, R.; Chen, L.; Li, C.; Chen, K.Z. Grain price support policy and the distortion of market price. China Agric. Econ. Rev. 2024, 16, 507–526. [Google Scholar] [CrossRef] [Scilit]
  25. Xue, H.; Du, Y.; Gao, Y.; Su, W.-H. Spatial Price Transmission and Dynamic Volatility Spillovers in the Global Grain Markets: A TVP-VAR-Connectedness Approach. Foods 2024, 13, 3317. [Google Scholar] [CrossRef] [Scilit]
  26. Zhang, Q.; Zhang, F.; Wu, G.; Mai, Q. Spatial spillover effects of grain production efficiency in China: Measurement and scope. J. Clean. Prod. 2021, 278, 121062. [Google Scholar] [CrossRef] [Scilit]
  27. Du, J.; Li, B.; Yang, H. Impact of agricultural human capital on agricultural green total factor productivity under population aging. Chin. Popul. Resour. Environ. 2023, 33, 215–228. (In Chinese) [Google Scholar]
  28. Jiang, J.; Wu, H.; Li, S.; Liu, Q. Impact of Rural Population Aging on the Resilience of the Agricultural Economy: Analysis Based on the Perspective of Production Factors. East China Econ. Manag. 2024, 38, 94–105. (In Chinese) [Google Scholar] [CrossRef]
  29. Song, M.; Wu, Q.; Zhu, H. Could the Aging of the Rural Population Boost Green Agricultural Total Factor Productivity? Evidence from China. Sustainability 2024, 16, 6117. [Google Scholar] [CrossRef] [Scilit]
  30. Su, G.; Chen, Z.; Li, W.; Xia, X. Study on the Impact of the Rural Population Aging on Agricultural Total Factor Productivity in China. Agriculture 2024, 14, 2175. [Google Scholar] [CrossRef] [Scilit]
  31. Tong, T.; Ye, F.; Zhang, Q.; Liao, W.; Ding, Y.; Liu, Y.; Li, G. The impact of labor force aging on agricultural total factor productivity of farmers in China: Implications for food sustainability. Front. Sustain. Food Syst. 2024, 8, 1434604. [Google Scholar] [CrossRef] [Scilit]
  32. Yu, Y.; Chi, Z.; Huang, H.; Peng, L. Rural population aging and agricultural green development: Promote or inhibit? Chin. J. Eco-Agric. 2024, 32, 1968–1980. (In Chinese) [Google Scholar] [CrossRef]
  33. Lee, C.-C.; Yan, J.; Wang, F. Impact of population aging on food security in the context of artificial intelligence: Evidence from China. Technol. Forecast. Soc. Change 2024, 199, 123062. [Google Scholar] [CrossRef] [Scilit]
  34. Das, P.; Saha, J.; Chouhan, P. Effects of labor out-migration on socio-economic set-up at the place of origin: Evidence from rural India. Child. Youth Serv. Rev. 2020, 119, 105512. [Google Scholar] [CrossRef] [Scilit]
  35. Liu, Y.; Li, X.; Guo, Y. Exploring land system reform for demographic transition in rural China. Land Use Policy 2024, 147, 107355. [Google Scholar] [CrossRef] [Scilit]
  36. Hu, Y.; Yang, X.; Zhang, L. The Dual Impacts of Agricultural Labor Aging on Grain Production Efficiency and Eco-Efficiency in China: An Analysis of the Mitigation Mechanism of Dual-Level Social Networks. Agriculture 2026, 16, 1010. [Google Scholar] [CrossRef] [Scilit]
  37. Gu, T.; Liu, X.; Cao, Z.; Lu, W. Effects of Rising Rural Labor Prices on Land Use Pattern: Evidence from Grain Production in China. Land 2025, 14, 112. [Google Scholar] [CrossRef] [Scilit]
  38. Headey, D.; Bachewe, F.N.; Marshall, Q.; Raghunathan, K.; Mahrt, K. Food prices and the wages of the poor: A cost-effective addition to high-frequency food security monitoring. Food Policy 2024, 125, 102630. [Google Scholar] [CrossRef] [Scilit]
  39. Guo, L.; Li, H.; Cao, A.; Gong, X. The effect of rising wages of agricultural labor on pesticide application in China. Environ. Impact Assess. Rev. 2022, 95, 106809. [Google Scholar] [CrossRef] [Scilit]
  40. Zhao, H.; Chang, J.; Havlik, P.; van Dijk, M.; Valin, H.; Janssens, C.; Ma, L.; Bai, Z.; Herrero, M.; Smith, P.; et al. China’s future food demand and its implications for trade and environment. Nat. Sustain. 2021, 4, 1042–1051. [Google Scholar] [CrossRef] [Scilit]
  41. Liu, Y.; Fang, F.; Li, Y. Key issues of land use in China and implications for policy making. Land Use Policy 2014, 40, 6–12. [Google Scholar] [CrossRef] [Scilit]
  42. Long, H.; Liu, Y.; Li, X.; Chen, Y. Building new countryside in China: A geographical perspective. Land Use Policy 2010, 27, 457–470. [Google Scholar] [CrossRef] [Scilit]
  43. Xu, D.; Deng, X.; Guo, S.; Liu, S. Labor migration and farmland abandonment in rural China: Empirical results and policy implications. J. Environ. Manag. 2019, 232, 738–750. [Google Scholar] [CrossRef] [Scilit]
  44. Ren, C.; Zhou, X.; Wang, C.; Guo, Y.; Diao, Y.; Shen, S.; Reis, S.; Li, W.; Xu, J.; Gu, B. Ageing threatens sustainability of smallholder farming in China. Nature 2023, 616, 96–103. [Google Scholar] [CrossRef] [Scilit]
  45. Li, T.; Lu, H.; Luo, Q.; Li, G.; Gao, M. The Impact of Rural Population Aging on Agricultural Cropping Structure: Evidence from China’s Provinces. Agriculture 2024, 14, 586. [Google Scholar] [CrossRef] [Scilit]
  46. Li, C.; Li, X.; Wang, J.; Feng, T. Impacts of Aging Agricultural Labor Force on Land Transfer: An Empirical Analysis Based on the China Family Panel Studies. Land 2023, 12, 295. [Google Scholar] [CrossRef] [Scilit]
  47. Liu, J.; Du, S.; Fu, Z. The Impact of Rural Population Aging on Farmers’ Cleaner Production Behavior: Evidence from five Provinces of the North China Plain. Sustainability 2021, 13, 12199. [Google Scholar] [CrossRef] [Scilit]
  48. Yu, Y.; Zhang, J.; Zhang, K.; Xu, D.; Qi, Y.; Deng, X. The impacts of farmer ageing on farmland ecological restoration technology adoption: Empirical evidence from rural China. J. Clean. Prod. 2023, 430, 139648. [Google Scholar] [CrossRef] [Scilit]
  49. Li, C.; Luo, C.; Jia, H.; Yue, M.; Wu, L. Advancing agricultural economic growth through technology innovation and structural transformation: A multilevel analysis. J. Innov. Knowl. 2025, 10, 100743. [Google Scholar] [CrossRef] [Scilit]
  50. Ma, X.; Zhou, W. Can Technological Advances Effectively Contribute to the Twin Goals of Food Security and Farmers’ Incomes?—The Empirical Evidence from the Provincial Panel Data. Rural Fin. Res. 2024, 7, 3–15. (In Chinese) [Google Scholar] [CrossRef]
  51. Johnson, D.G. Hayami, Yujiro, and Vernon W. Ruttan. Agricultural Development: An International Perspective. Baltimore MD: Johns Hopkins University Press, 1971, xiv + 367 pp. Am. J. Agric. Econ. 1989, 71, 1062–1063. [Google Scholar] [CrossRef] [Scilit]
  52. Zhang, X.; Hu, L.; Yu, X. Farmland Leasing, misallocation Reduction, and agricultural total factor Productivity: Insights from rice production in China. Food Policy 2023, 119, 102518. [Google Scholar] [CrossRef] [Scilit]
  53. Zeng, S.; Zhang, X.; Wang, X.; Zeng, G. Population Aging, Household Savings and Asset Prices: A Study Based on Urban Commercial Housing Prices. Sustainability 2019, 11, 3194. [Google Scholar] [CrossRef] [Scilit]
  54. Chen, S.; Wang, X.; Yao, S. National water-saving city and its impact on agricultural total factor productivity: A case study of nine provinces along the Yellow River, China. J. Clean. Prod. 2023, 417, 138019. [Google Scholar] [CrossRef] [Scilit]
  55. Li, Y.; Zhao, T.; Shu, T.; Wei, Y. Impact of development level of digital economy on agricultural production efficiency under carbon emission constraint. Chin. J. Eco-Agric. 2024, 32, 1829–1842. [Google Scholar] [CrossRef]
  56. Wu, Y.; Wu, B.; Liu, X.; Zhang, S. Digital finance and agricultural total factor productivity–From the perspective of capital deepening and factor structure. Financ. Res. Lett. 2025, 74, 106449. [Google Scholar] [CrossRef] [Scilit]
  57. Yun, D.; Jia, Z. An investigation into the connection between green total factor productivity in agriculture and high-quality agricultural progress: Based on the mechanism of regional financial development. Financ. Res. Lett. 2025, 81, 107324. [Google Scholar] [CrossRef] [Scilit]
  58. Zhao, L.; Kang, X.; Shi, J.; Zhu, T. Agricultural production trusteeship and grain total factor productivity growth: The moderating role of financial credit. Financ. Res. Lett. 2025, 73, 106605. [Google Scholar] [CrossRef] [Scilit]
  59. Xie, H.; Wang, B. An Empirical Analysis of the Impact of Agricultural Product Price Fluctuations on China’s Grain Yield. Sustainability 2017, 9, 906. [Google Scholar] [CrossRef] [Scilit]
  60. Nie, R.; Liu, W. Population Aging, Artificial Intelligence and Industrial Consumption “Double Upgrade”. East China Econ. Manag. 2023, 37, 58–68. (In Chinese) [Google Scholar] [CrossRef]
  61. Haans, R.F.J.; Pieters, C.; He, Z.-L. Thinking about U: Theorizing and testing U- and inverted U-shaped relationships in strategy research. Strateg. Manag. J. 2016, 37, 1177–1195. [Google Scholar] [CrossRef] [Scilit]
  62. Lee, C.-C.; Yan, J. Will artificial intelligence make energy cleaner? Evidence of nonlinearity. Appl. Energy 2024, 363, 123081. [Google Scholar] [CrossRef] [Scilit]
  63. Huang, S.; Luo, C.; Zhu, Z. The spatial spillover effect of China’s outgoing audit of natural resource assets on industrial pollution: Evidence from a spatial difference-in-differences method. Sustain. Futur. 2025, 9, 100598. [Google Scholar] [CrossRef] [Scilit]
  64. LeSage, J.; Pace, R.K. Introduction to Spatial Econometrics; Chapman and Hall/CRC: New York, NY, USA, 2009. [Google Scholar] [CrossRef] [Scilit]
  65. Shao, S.; Fan, M.; Yang, L. Economic Restructuring, Green Technical Progress, and Low-Carbon Transition Development in China: An Empirical Investigation Based on the Overall Technology Frontier and Spatial Spillover Effect. Manag. World 2022, 38, 46–69+4. (In Chinese) [Google Scholar] [CrossRef]
  66. Lu, H.; Xie, H.; Yao, G. Impact of land fragmentation on marginal productivity of agricultural labor and non-agricultural labor supply: A case study of Jiangsu, China. Habitat Int. 2019, 83, 65–72. [Google Scholar] [CrossRef] [Scilit]
  67. Fang, D.; Chen, J.; Wang, S.; Chen, B. Can agricultural mechanization enhance the climate resilience of food production? Evidence from China. Appl. Energy 2024, 373, 123928. [Google Scholar] [CrossRef] [Scilit]
  68. Liu, J.; Fang, Y.; Qiao, J.; Rosenberg, M.W.; Wang, R.; Liu, X.; Yu, S. Rural transformation and the future of China’s “granary”: A perspective on livelihood trajectories. J. Rural Stud. 2025, 114, 103524. [Google Scholar] [CrossRef] [Scilit]
Figure 1. The Scatter Plot of RPA and LnPrice.
Agriculture 16 01881 g001
Figure 2. The Inverted U-shaped relationship and Marginal effect.
Agriculture 16 01881 g002
Figure 3. Plot of the moderating effect of Land.
Agriculture 16 01881 g003
Figure 4. Average marginal effect of Land.
Agriculture 16 01881 g004
Figure 5. Plot of the moderating effect of LnARD.
Agriculture 16 01881 g005
Figure 6. Average marginal effect of LnARD.
Agriculture 16 01881 g006
Figure 7. Kernel density map of RPA in China.
Agriculture 16 01881 g007
Figure 8. Spatiotemporal distribution of RPA in China.
Agriculture 16 01881 g008
Figure 9. Kernel density map of LnPrice in China.
Agriculture 16 01881 g009
Figure 10. Spatiotemporal distribution of LnPrice in China.
Agriculture 16 01881 g010
Table 1. Descriptive statistics of variables.
Variable TypeVariableObsMeanStd. Dev.MinMax
Dependent variableLnPrice5405.0560.2304.6075.374
Independent variableRPA5400.1200.0430.0550.255
Old5400.1750.0700.0780.399
Moderating variablesLand5400.2510.1810.0150.754
LnARD54012.5021.2329.05714.749
Control variablesLnSA5407.7361.2214.3409.562
DAM5408.2463.8272.55117.544
DIS5400.1880.1440.0100.643
AFS5400.1070.0330.0330.183
AGDP5404.6723.2110.62615.801
Edu5407.6040.6915.7169.563
Table 2. Panel unit root test.
VariableLLC Test IPS Test Fisher Test
Adjusted t *p-ValueZ-t-Tilde-Bar Statistic p-ValueInverse Chi-Squared p-Value
LnPrice−9.788 ***0.000−3.867 ***0.000237.915 ***0.000
RPA−4.184 ***0.000−4.708 ***0.00075.095 *0.091
Old−3.756 ***0.000−4.449 ***0.00067.3860.239
Land−6.393 ***0.000−1.2020.115103.729 ***0.000
LnARD−4.796 ***0.000−2.334 ***0.01052.0390.758
LnSA−0.3800.352−3.675 ***0.000108.351 ***0.000
DAM−4.209 ***0.000−5.259 ***0.00048.8780.847
DIS−7.451 ***0.000−11.706 ***0.000175.608 ***0.000
AFS−6.500 ***0.000−4.228 ***0.000106.213 ***0.000
AGDP−2.056 **0.0200.7020.75956.5780.602
Edu−5.819 ***0.000−7.601 ***0.000111.281 ***0.000
Note: The table reports the results of the panel unit root tests for each variable. ***, **, and * indicate statistical significance at the 1%, 5%, and 10% levels, respectively.
Table 3. The variance inflation factor (VIF) test.
VariableVIF1/VIFVariableVIF1/VIF
RPA2.530.3956Old2.340.4266
Land2.650.3771Land2.570.3886
LnARD5.370.1863LnARD5.270.1898
LnSA3.840.2602LnSA3.860.2589
DAM1.560.6401DAM1.560.6418
DIS1.570.6359DIS1.580.6334
AFS1.490.6728AFS1.470.6814
AGDP3.250.3076AGDP3.320.3016
Edu1.780.5622Edu1.840.5427
Mean VIF2.67Mean VIF2.65
Note: This table presents the variance inflation factor (VIF) tests for variables, including the dependent variable, independent variables, control variables, and moderating variables.
Table 4. Benchmark regression.
VariableLnPrice
(1)(2)(3)(4)
RPA4.729 ***
(1.080)
3.160 ***
(0.773)
1.786 ***
(0.228)
1.567 ***
(0.261)
RPA2−8.080 **
(3.793)
−6.077 **
(2.652)
−4.594 ***
(0.654)
−4.115 ***
(0.754)
LnSA −0.020 ***
(0.006)
0.053 ***
(0.008)
DAM −0.001
(0.002)
0.001 **
(0.001)
DIS −0.315 ***
(0.050)
−0.000
(0.011)
AFS 3.871 ***
(0.213)
0.094
(0.087)
AGDP 0.018 ***
(0.003)
−0.003 ***
(0.001)
Edu 0.061 ***
(0.011)
0.011 *
(0.006)
Cons4.620 ***
(0.071)
4.035 ***
(0.099)
4.916 ***
(0.018)
4.436 ***
(0.083)
Year FENONOYESYES
Province FENONOYESYES
N540540540540
R20.2180.6430.9890.990
Notes: The values in parentheses are the standard errors. ***, **, and * indicate statistical significance at the 1%, 5%, and 10% levels, respectively.
Table 5. The result of U-shape test.
Lower BoundUpper Bound
Interval0.0550.255
Slope1.116−0.530
t-Value6.028−3.305
p > |t|0.0000.001
Inflection point0.1903[0.170, 0.218]
Confidence Interval 95%
Table 6. Robust test regression.
Variable(1)(2)(3)(4)
First StageSecond Stage
RPARPA2LnPriceLnPriceLnPriceLnPrice
IV_RPA0.202 *
(0.107)
−0.198 ***
(0.033)
IV_RPA21.456 ***
(0.313)
1.376 ***
(0.095)
RPA 2.154 ***
(0.358)
2.736 ***
(0.778)
1.504 ***
(0.255)
RPA2 −5.293 ***
(0.850)
−11.967 **
(5.198)
−3.874 ***
(0.730)
RPA3 16.804
(11.396)
Old 0.780 ***
(0.145)
Old2 −1.286 ***
(0.263)
Import 0.007 *
(0.004)
Cons0.301 ***
(0.036)
0.077 ***
(0.011)
4.623 ***
(0.097)
4.402 ***
(0.085)
4.445 ***
(0.085)
4.426 ***
(0.083)
ControlsYESYESYESYESYESYES
Year FEYESYESYESYESYESYES
Province FEYESYESYESYESYESYES
Anderson-LM164.059 ***
CD-F108.127 (10% maximal IV size 7.03)
Sargan statistic0.000
N510 540540540
R20.193 0.9920.9900.991
Notes: The values in parentheses are the standard errors. ***, **, and * indicate statistical significance at the 1%, 5%, and 10% levels, respectively. IV means the instrumental variable constructed in this paper.
Table 7. Results of heterogeneity analysis.
Variable(1)(2)(3)
EastenCentralWestern
RPA0.342
(0.281)
−0.027
(0.589)
3.007 ***
(0.445)
RPA2−0.885
(0.737)
0.312
(1.804)
−7.904 ***
(1.192)
Cons4.479 ***
(0.101)
4.147 ***
(0.309)
4.879 ***
(0.218)
ControlsYESYESYES
Year FEYESYESYES
Province FEYESYESYES
N198144198
R20.9930.9940.988
Notes: The values in parentheses are the standard errors. *** indicates statistical significance at the 1% levels.
Table 8. Results of moderating analysis.
Variable(1)(2)
M = LandM = LnARD
RPA1.858 ***
(0.279)
1.796 ***
(0.353)
RPA2−4.607 ***
(0.896)
−4.782 ***
(1.170)
RPA × M−1.203 ***
(0.271)
−0.112 ***
(0.037)
RPA2 × M12.180 ***
(2.763)
1.635 ***
(0.435)
M0.027
(0.019)
−0.009
(0.006)
cons4.527 ***
(0.083)
4.550 ***
(0.096)
Year FEYESYES
Province FEYESYES
N540540
R20.9910.991
Notes: The values in parentheses are the standard errors. *** indicates statistical significance at the 1% levels.
Table 9. Global Moran’s I test of RPA and LnPrice.
Spatial Contiguity MatrixGeographic Distance Matrix
YearRPALnPriceYearRPALnPriceYearRPALnPriceYearRPALnPrice
20050.481 ***0.383 ***20140.305 ***0.435 ***20050.268 ***0.256 ***20140.137 **0.235 ***
20060.439 ***0.482 ***20150.357 ***0.421 ***20060.229 ***0.329 ***20150.146 **0.217 ***
20070.439 ***0.618 ***20160.301 ***0.417 ***20070.252 ***0.410 ***20160.105 **0.210 ***
20080.420 ***0.509 ***20170.362 ***0.376 ***20080.235 ***0.310 ***20170.147 **0.199 ***
20090.409 ***0.556 ***20180.338 ***0.372 ***20090.240 ***0.335 ***20180.137 **0.210 ***
20100.397 ***0.451 ***20190.345 ***0.374 ***20100.189 ***0.306 ***20190.141 **0.213 ***
20110.311 ***0.215 **20200.345 ***0.399 ***20110.108 **0.127 **20200.126 **0.232 ***
20120.185 *0.327 ***20210.357 ***0.427 ***20120.0430.159 ***20210.139 **0.247 ***
20130.331 ***0.408 ***20220.354 ***0.486 ***20130.152 ***0.209 ***20220.138 **0.278 ***
Notes: ***, **, and * indicate statistical significance at the 1%, 5%, and 10% levels, respectively.
Table 10. Identification test of the spatial econometrics model.
TestSpatial Contiguity MatrixGeographic Distance Matrix
LM Lag463.436 ***693.499 ***
LM Error195.623 ***396.183 ***
Robust-LM Lag277.519 ***303.083 ***
Robust-LM Error9.706 ***5.766 **
Hausman test137.03 ***235.51 ***
LR (SDM or SAR)49.76 ***35.66 ***
LR (SDM or SEM)46.78 ***30.76 ***
Wald (SDM or SAR)52.10 ***36.90 ***
Wald (SDM or SEM)48.23 ***31.96 ***
Notes: ***and ** indicate statistical significance at the 1% and 5% levels.
Table 11. Estimation results of SDM.
VariableSpatial Contiguity MatrixGeographic Distance Matrix
(1)(2)(3)(4)(5)(6)
RPA0.610 ***
(0.223)
2.093 ***
(0.251)
1.774 ***
(0.225)
0.811 ***
(0.221)
1.721 ***
(0.222)
1.565 ***
(0.218)
RPA2−2.091 ***
(0.751)
−5.154 ***
(0.683)
−4.695 ***
(0.612)
−1.991 ***
(0.748)
−4.202 ***
(0.616)
−4.059 ***
(0.602)
W × RPA−2.170 ***
(0.427)
−2.101 ***
(0.419)
−2.119 ***
(0.486)
−2.812 ***
(0.616)
−1.046 **
(0.468)
−1.685 **
(0.670)
W × RPA28.084 ***
(1.477)
4.959 ***
(1.248)
5.799 ***
(1.340)
8.098 ***
(2.232)
1.900
(1.496)
4.682 **
(1.981)
Spatial rho0.249 ***
(0.052)
0.929 ***
(0.011)
0.145 **
(0.058)
0.188 ***
(0.069)
0.933 ***
(0.011)
0.291 ***
(0.074)
AIC−2124.738−2317.378−2647.987−2092.137−2483.794−2641.405
BIC−2047.489−2240.13−2570.738−2014.888−2406.546−2564.157
ControlsYESYESYESYESYESYES
Year FEYESNOYESYESNOYES
Province FENOYESYESNOYESYES
N540540540540540540
R20.0560.8420.2270.0260.8160.290
Notes: The values in parentheses are the standard errors. *** and ** indicate statistical significance at the 1% and 5% levels.
Table 12. Estimation results of direct and indirect effects.
EffectVariableSpatial Contiguity MatrixGeographic Distance Matrix
DirectRPA1.715 ***
(0.227)
1.517 ***
(0.225)
RPA2−4.539 ***
(0.622)
−3.927 ***
(0.623)
IndirectRPA−2.076 ***
(0.535)
−1.605 *
(0.900)
RPA25.735 ***
(1.489)
4.604 *
(2.674)
Notes: The values in parentheses are the standard errors. ***, and * indicate statistical significance at the 1% and 10% levels.
Disclaimer/Publisher’s Note: The statements, opinions and data contained in all publications are solely those of the individual author(s) and contributor(s) and not of MDPI and/or the editor(s). MDPI and/or the editor(s) disclaim responsibility for any injury to people or property resulting from any ideas, methods, instructions or products referred to in the content.