Article

Standardised Livestock Manure Valorisation Potential

1
Estação Zootécnica Nacional, Instituto Nacional de Investigação Agrária e Veterinária, Quinta da Fonte Boa, 2005-424 Vale de Santarém, Portugal
2
Centre for Research and Development in Agrifood Systems and Sustainability, Polytechnic University of Viana do Castelo, Rua da Escola Industrial e Comercial Nun’Alvares 34, 4900-347 Viana do Castelo, Portugal
3
Centro de Ciência Animal e Veterinária, Universidade de Trás-os-Montes e Alto Douro, 5000-801 Vila Real, Portugal
4
Centro de Investigação em Montanha, Polytechnic University of Viana do Castelo, 4990-706 Ponte de Lima, Portugal
*
Author to whom correspondence should be addressed.
Agriculture 2026, 16(17), 1872; https://doi.org/10.3390/agriculture16171872 (registering DOI)
Submission received: 12 August 2026 / Revised: 26 August 2026 / Accepted: 27 August 2026 / Published: 29 August 2026
(This article belongs to the Section Ecosystem, Environment and Climate Change in Agriculture)

Abstract

Livestock manure is both an environmental burden and potential feedstock for the circular bioeconomy and sustainable biorefinery systems. This study estimated the theoretical potential of livestock manure valorisation using a balanced 50-country panel from 2000 to 2023, with illustrative scenario projections to 2050. Livestock stock data and population data were combined with species-specific coefficients to estimate manure production, standardised theoretical resource CH4 potential, standardised theoretical resource gross methane energy potential, standardised theoretical resource nitrogen and phosphorus potential, and the recoverable-CH4 CO2e value. Country rankings, species contribution analysis, k-means clustering, principal component analysis and ARIMA-based scenario analysis were used to compare manure-resource indicators. Between 2000 and 2023, total estimated manure production increased from 29.25 to 33.18 Gt, while standardised theoretical resource gross methane energy potential increased from 3396.6 to 3977.8 TWh. Standardised theoretical resource nitrogen, standardised theoretical resource phosphorus and recoverable-CH4 CO2e value also increased, whereas mean standardised theoretical resource gross methane energy potential per capita declined. In 2023, India, Brazil, China, the USA and Pakistan had the greatest total standardised theoretical resource gross methane energy potential, while Uruguay, New Zealand, Paraguay, Ireland and Argentina had the highest per capita gross methane energy potential. Cattle dominated the estimated manure resource, contributing 76.1% of total manure production. The 2050 scenario values were derived from an exploratory ARIMA trajectory based on 24 annual observations and should be interpreted as model-dependent sensitivity outputs, not as strong long-term forecasts. Under low, medium and high illustrative adoption assumptions, scenario-adjusted 2050 values were 8.04, 5.81, and 2.28 Gt CO2e, respectively. The study provides standardised theoretical manure-resource indicators for comparative screening, rather than country-specific feasibility estimates or implementation forecasts.

1. Introduction

Livestock production is central to global food security, rural economies and the transformation of non-edible biomass into high-value animal-source foods [1,2]. Livestock can use grasslands, crop residues, by-products and other low-opportunity-cost biomass that are unsuitable for direct human consumption, thereby contributing to nutrient upcycling and circular food-system functions [1,3]. However, livestock systems also generate large quantities of manure, which can become an environmental burden when it is poorly collected, stored, treated or applied to land [4,5]. Manure contains organic matter, nitrogen (N), phosphorus (P) and other recoverable resources, but it is also a source of methane (CH4), nitrous oxide (N2O), ammonia and nutrient losses when manure-management conditions favour anaerobic decomposition, nitrogen transformation, volatilisation, leaching or runoff [5,6,7]. Therefore, livestock manure represents both an environmental challenge and a potentially valuable feedstock for circular bioeconomy and biorefinery systems, particularly through anaerobic digestion, renewable energy production, nutrient recovery and integrated manure-management strategies [1,4].
In conventional waste-management approaches, manure is often treated primarily as a disposal or pollution-control problem, particularly because poorly managed livestock manure can contribute to greenhouse-gas emissions, ammonia losses, nutrient runoff and water-quality degradation [4,6]. In contrast, circular bioeconomy approaches interpret manure as a biological resource that can be converted into renewable energy, recycled nutrients and organic fertiliser products [1,8]. This perspective is increasingly important because livestock systems can contribute to circularity by recycling nutrients, transforming biomass that is unsuitable for direct human consumption, and supporting bio-based value chains [1]. Within this framework, manure-based biorefineries can integrate anaerobic digestion, biogas or biomethane production, nutrient recovery and digestate management [4,9]. These processes can reduce uncontrolled CH4 losses from manure while producing renewable energy and recovering nutrients that may partly substitute mineral fertilisers [10,11].
Anaerobic digestion is one of the most established technologies for manure valorisation because it enables simultaneous organic-waste treatment, biogas production, and partial stabilisation of livestock manure [4,12]. During anaerobic digestion, organic matter is degraded under oxygen-free conditions, producing biogas that is mainly composed of CH4 and carbon dioxide (CO2), with smaller amounts of water vapour, hydrogen sulphide, ammonia, and other trace gases [13,14]. The CH4 fraction can be used for heat and electricity generation, while upgraded biogas can be converted into biomethane by removing CO2 and other contaminants, allowing use as a higher-quality renewable gas [13,15]. In addition to energy production, anaerobic digestion can support nutrient recycling through digestate management and through further recovery of nitrogen (N) and phosphorus (P) from liquid and solid digestate fractions [11,16]. However, the magnitude of biogas and biomethane potential varies strongly among regions because it depends on feedstock availability, manure composition, production systems, collection feasibility, digestion performance, and infrastructure [4,9,17].
The climate relevance of manure management is linked mainly to CH4 emissions produced during the anaerobic decomposition of organic matter, while N2O emissions are associated with nitrogen transformation processes during manure storage, treatment and land application [5,7,18]. Manure-management emissions vary according to animal species, manure composition, diet, storage conditions, oxygen availability, moisture, temperature and management system, which explains why manure-related CH4 and N2O emissions differ substantially among livestock systems and regions [5,6,7]. The Intergovernmental Panel on Climate Change provides methodological guidance for estimating CH4 and N2O emissions from livestock manure-management systems, recognising that emissions depend on animal species, manure characteristics, management practices and environmental conditions [19]. In this context, estimating recoverable manure CH4 potential is useful because it provides an indication of the quantity of manure-derived CH4 that could theoretically be targeted through capture, anaerobic digestion and valorisation [4,20]. However, such estimates should be interpreted as theoretical methane recovery potential under standardised assumptions, not as directly preventable CH4 emissions or IPCC-comparable manure-management emissions.
Large cross-country assessments of manure valorisation potential remain challenging because livestock populations, production structures, species composition, manure characteristics and human population denominators differ substantially among countries and regions [4,13,21]. Spatial assessments have shown that manure generation, biogas potential and nutrient loads can vary markedly within the same country, depending on livestock density, animal categories, manure availability and regional production systems [21,22,23]. Large countries with extensive livestock populations may have the greatest absolute potential for manure-based energy and nutrient recovery, whereas smaller livestock-intensive countries may show greater potential when indicators are expressed per capita or relative to resource demand [13,23]. Both perspectives are important. Absolute indicators help identify countries where large-scale manure-biorefinery infrastructure could deliver the greatest total resource recovery, whereas per capita indicators help identify countries where manure valorisation may be particularly relevant to national circular-bioeconomy strategies and decentralised resource-management planning [4,21,23].
Open international databases make it possible to develop reproducible worldwide analytical datasets for estimating manure valorisation potential. FAOSTAT provides country–year livestock stock data across long time periods, allowing livestock populations to be harmonised by country, year, and species [24]. World Bank population data allow national indicators to be standardised per inhabitant using the total population indicator SP.POP.TOTL, which reports annual midyear population estimates [25]. Similar database-based approaches have been used to consolidate residue and organic-matter data by combining production statistics with conversion coefficients and nutrient-composition assumptions [26]. When combined with transparent species-specific coefficients for manure excretion, volatile solids, biochemical methane potential, and nutrient content, these data can be used to estimate comparable indicators of manure production, standardised theoretical resource (STR) CH4, STR energy potential, STR N and P, and recoverable-CH4 CO2e value [4,27]. Such derived datasets are especially useful when the objective is not to measure farm-level emissions directly, but to compare theoretical resource potential across countries and over time using a reproducible and auditable calculation framework [4,26].
A further gap concerns the integration of resource potential estimation with multivariate classification and future scenario analysis. Most assessments of manure valorisation focus either on livestock manure biorefinery technologies or process performance [4,28], national or subnational case studies of manure-derived biogas potential [23,29], or future prediction of biogas potential and manure-related CH4 emissions in specific countries [21,30]. Fewer studies combine long-term global panel data, cross-country rankings, per capita comparisons, livestock-species contribution analysis, clustering of national manure-resource profiles, and time-series forecasting of future mitigation scenarios within a single framework. This integrated approach can help identify not only where manure-based biorefineries may have the greatest potential, but also how different levels of adoption could influence future manure-related CH4-equivalent trajectories.
This study’s main contribution is integrating several analytical components into a single reproducible framework. Specifically, it combines a balanced 50-country country–year panel, total and per capita manure-resource indicators, livestock-species contribution analysis, exploratory clustering and PCA, coefficient-uncertainty sensitivity analysis and scenario-based forecasting of recoverable-CH4 CO2e value. This integrated approach provides a standardised comparative framework for screening theoretical livestock manure-resource potential across countries and over time, rather than estimating country-specific feasibility, observed emissions or operational deployment capacity.
Therefore, this study aimed to estimate and compare the standardised theoretical livestock manure-resource potential across a balanced 50-country panel from 2000 to 2023. The specific objectives were (i) to estimate annual manure production, STR CH4, gross methane energy, STR N and P, and recoverable-CH4 CO2e value; (ii) to compare countries according to total and per capita indicators; (iii) to assess livestock-species contributions to the estimated manure resource; (iv) to describe exploratory manure-resource profiles using clustering and PCA; and (v) to examine illustrative scenario-adjusted recoverable-CH4 CO2e trajectories to 2050. The objective was not to estimate country-specific technical feasibility, economic viability or deployment capacity.

2. Materials and Methods

2.1. Study Design

This study used a country–year panel design to estimate the theoretical potential of livestock manure valorisation for the development of sustainable biorefineries. The analysis focused on manure-derived biogas, STR gross methane energy potential, STR N and P, and the CO2-equivalent value of standardised theoretical resource CH4. The unit of analysis was the country–year, and the main analytical period was 2000–2023. The most recent year, 2023, was used for cross-sectional country comparisons, rankings, and multivariate clustering. A time-series forecasting approach was then used to project the recoverable-CH4 CO2e value to 2050.

2.2. Data Sources and Dataset Construction

The dataset was designed as an original derived analytical dataset rather than as a direct reuse of a previously published academic dataset. The raw livestock stock data were structured to be obtained from FAOSTAT Crops and Livestock Products [24], using live-animal stock records by country, year, and livestock species. FAOSTAT provides free access to food and agriculture data for more than 245 countries and territories, covering FAO regional groupings from 1961 to the most recent year available. The balanced-panel design ensured consistent calculation of derived indicators for the same countries, species and years. Countries were included only when annual livestock-stock data for cattle, buffaloes, pigs, sheep, goats and poultry, and corresponding population data, were available throughout 2000–2023. Records were excluded for missing species series, incomplete population data, inconsistent country-year coverage or harmonisation problems. Thus, the dataset is a 50-country panel rather than a complete global census. The 50-country balanced-panel design was chosen to ensure that all derived indicators were calculated for the same countries, livestock species and years. Countries or territories were excluded when one or more of the required livestock-stock series was missing or incomplete for 2000–2023, when population data were unavailable or incomplete, when FAOSTAT and World Bank territorial definitions could not be harmonised reliably, or when records represented very small or non-sovereign territories with unstable reporting. The purpose of this design was comparability over time, not complete global coverage. Therefore, results should be interpreted as standardised comparisons among data-complete livestock-producing countries. The year 2023 was used as the endpoint because it was the most recent year for which all required livestock-stock and population variables had been harmonised and verified for the balanced analytical panel at the time of dataset construction. More recent FAOSTAT data may be available for some domains, countries or production variables, but these were not used unless complete and consistent coverage across all required live-animal stock, species and population variables could be confirmed.
The livestock species included in the dataset were cattle, buffalo, pigs, sheep, goats, and poultry. These groups were selected because they represent the main livestock sources of manure suitable for anaerobic digestion, nutrient recovery, or other waste-valorisation pathways. Population data were included to allow per capita comparison across countries. The population denominator was sourced from the World Bank’s total population indicator, SP.POP.TOTL [25], which reports the total population and provides a country-year population series. The World Bank metadata describes population values as midyear estimates.
The dataset was built in two stages. First, raw animal stock and population variables were arranged by country and year. Second, species-specific coefficients were applied to convert livestock populations into estimated manure production, volatile solids, theoretical CH4 potential, recoverable CH4, energy potential, STR N, STR P, and recoverable-CH4 CO2e value. The final dataset [31] included both absolute national indicators and population-standardised indicators.
A country-selection audit documented the construction of the balanced analytical panel. For each FAOSTAT country or territory screened, availability of cattle, buffalo, pig, sheep, goat, poultry and population data was assessed for 2000–2023. Representativeness was assessed by comparing 2023 panel livestock heads with FAOSTAT world totals by species, and by estimating panel shares of manure production and recoverable-CH4 CO2e value. Regional and income-group coverage were examined for potential selection bias.

2.3. Estimation of Derived Variables

All derived variables were generated from explicit equations and species-specific coefficients. This approach ensured that the dataset could be audited, reproduced, and updated if improved coefficients, country-specific manure-management data, or more recent livestock and population statistics become available. The calculation framework converted livestock population data into annual manure production, volatile solids, theoretical CH4 recovery potential, STR CH4, STR gross methane energy potential, STR nitrogen (N), STR phosphorus (P), and recoverable-CH4 CO2e value.

2.3.1. Annual Manure Production

Annual manure production was estimated separately for each livestock group using species-specific manure excretion coefficients. For each country, year, and species, annual manure production was calculated as:
M a s ( t / y r ) = P s × M d s × 365 1000
where Mas is the annual manure production for species ‘s’, expressed as tonnes/year; Ps is the livestock population of species ‘s’, expressed as number of animals; and Mds is the daily manure excretion coefficient for the species, expressed as kg/head/day. The factor 365 converts daily manure output to annual manure output, and division by 1000 converts kg to tonnes.
Total national manure production was obtained by summing species-specific manure estimates across cattle, buffalo, pigs, sheep, goats, and poultry:
M T ( t / y r ) = M s
Species-specific manure shares were then calculated by dividing each species’ manure production by total national manure production:
M s s h ( t / y r ) = M s M T × 100
These shares were used to interpret the livestock structure underlying national biorefinery potential. The species-specific coefficients used in the calculations are presented in Table 1.

2.3.2. Methane and Energy Potential

The theoretical CH4 recovery potential of manure was estimated from volatile solids. First, annual manure production was multiplied by a species-specific volatile-solids fraction:
V S s ( t / y r ) = M s × V S F s
where VSs is volatile solids from species ‘s’, expressed as tonnes/year, and VSFs is the volatile-solids fraction of manure for the species.
Theoretical CH4 production was calculated by multiplying volatile solids by a species-specific biochemical methane potential coefficient:
C H 4 _ t s ( m 3 / y r ) = V S s × B M P s
where CH4_ts is theoretical CH4 production, expressed as m3 CH4/year, and BMPs is the biochemical methane potential, expressed as m3 CH4/t of volatile solids. Theoretical CH4 production was interpreted as theoretical methane recovery potential from volatile solids and biochemical methane potential coefficients. It was not interpreted as directly preventable CH4 emissions. IPCC-compatible manure-emission estimates would require animal category, manure-management system, climate and methane-conversion factors.
STR CH4 was calculated using a species-level CH4 adjustment fraction. This fraction was used to generate a standardised theoretical resource CH4 indicator for cross-country comparison. Conceptually, it represents a simplified combined adjustment for manure collectability, realised bioconversion relative to theoretical BMP and gas capture/recovery. However, these components were not estimated separately and the fraction should not be interpreted as an observed collectability rate, digester efficiency, gas-capture rate or empirical country-specific technical recovery coefficient. The calculation was:
C H 4 , S T R , s ( m 3 / y r ) = C H 4 , t , s × A F C H 4 , s
where CH4,STR,s is the STR CH4 share for species ‘s’, expressed as m3 CH4/year; CH4,t,s is the theoretical CH4 recovery potential from species ‘s’, expressed as m3 CH4/year; and AFCH4,s is the CH4 adjustment fraction for species ‘s’. Conceptually, AFCH4,s represents the combined effect of manure collectability, realised bioconversion relative to theoretical BMP and gas capture/recovery efficiency. It was implemented as a standardised species-level fraction, not as an observed country-specific recoverability estimate. These factors represented the proportion of manure assumed to be technically collectable and available for anaerobic digestion or equivalent biorefinery processes. Recovery fractions were treated as standardised technical assumptions, not country-specific recoverability estimates. They exclude housing, grazing, manure handling, farm scale, logistics, infrastructure and adoption conditions; therefore, CH4 and energy estimates represent fixed species-level STR potential.
Total national volume CH4 was obtained by summing species-specific STR CH4 estimates:
C H 4 _ r T ( m 3 / y r ) = C H 4 _ r s
STR CH4 was then converted into STR gross methane energy potential using the gross chemical energy content of CH4:
E S T R , T   ( G W h ) = C H 4 , r T × 9.97 1,000,000
where ESTR,T is the national STR gross methane energy potential, expressed as GWh/year, and 9.97 kWh/m3 CH4 is the assumed gross chemical energy content of methane. Division by 1,000,000 converts kWh to GWh.
Per capita STR gross methane energy was calculated as:
E S T R , p e r c a p i t a   ( k W h / c a p i t a ) = E n e r g y   ( G W h ) × 1,000,000 P o p u l a t i o n
where population is the corresponding country–year population.
STR gross methane energy potential was calculated as the gross chemical energy content of STR CH4 using the assumed methane energy content of 9.97 kWh m−3 CH4. It does not represent net usable electricity, heat or biomethane. Estimating usable energy would require assumptions on conversion efficiency, parasitic plant energy consumption, methane leakage, gas cleaning, upgrading, compression, transport, storage and plant availability.

2.3.3. Nutrient Recovery Potential

Standardised theoretical resource N and P were estimated from species-specific manure nutrient concentrations and standardised nutrient adjustment fractions. For each livestock group, manure production was multiplied by the corresponding N and P content coefficients and then by the assumed nutrient-recovery fraction. The N and P adjustment fractions were author-defined standardised assumptions, not observed country rates or empirical recovery efficiencies; STR N and STR P therefore represent theoretical resource indicators, not achieved nutrient recovery or fertiliser substitution.
Standardised theoretical resource N was calculated as:
N R s ( k g N / y r ) = M s × N s × R N s
where NRs is recoverable N from species ‘s’, expressed as kg N/year; Ns is the N content of the manure, expressed as kg N/t manure; and RNs is the STR N fraction for the species.
Recoverable P was calculated as:
P R s ( k g P / y r ) = M s × P s × R P s
where PSTR,s is STR P from species ‘s’, expressed as kg P/year; Pm,s is the P content of manure, expressed as kg P/tonne manure; and RP,s is the STR P fraction for species ‘s’.
Total national STR N and STR P were obtained by summing species-specific kg/year estimates and dividing by 1000 to express national totals in tonnes/year:
N S T R , T = N S T R , s 1000
P S T R , T = P S T R , s 1000
where NSTR,s and PSTR,s are species-specific STR N and STR P in kg/year, and NSTR,T and PSTR,T are total national STR N and STR P in tonnes/year. For cross-country comparison, nutrient recovery indicators were also expressed per capita:
N S T R , c a p ( k g / c a p i t a ) = N S T R , T × 1000 P o p u l a t i o n
P S T R , c a p ( k g / c a p i t a ) = P S T R , T × 1000 P o p u l a t i o n
where NSTR,cap and PSTR,cap are expressed as kg/capita/year. The multiplication by 1000 converts national totals from tonnes/year back to kg/year before division by population.
These variables were used to evaluate the nutrient-recycling potential of manure biorefineries, particularly in livestock-intensive countries. Per capita indicators were used as demographic-normalised measures of manure-resource intensity. They were not intended to represent policy priority, technical feasibility or implementation potential. More policy-specific denominators would require additional country-level data on energy demand, fertiliser consumption, agricultural land, livestock emissions, biogas capacity and livestock output.
Recoverable N and P were interpreted as standardised nutrient-resource indicators, not as direct measures of fertiliser substitution or net agronomic benefit. Actual value would depend on crop nutrient demand, nutrient balances, agricultural land availability, transport feasibility, digestate processing and regulatory application limits.

2.3.4. CO2-Equivalent Value of Standardised Theoretical Resource CH4

The recoverable-CH4 CO2e value was calculated by converting STR CH4 volume into CH4 mass, multiplying by the CH4 GWP100, and dividing by 1000 to express kg CO2e as tonnes CO2e:
C H 4 e k g C O 2 e ( k g C O 2 e / y r ) = C H 4 _ R T × 0.716 × 27.2
where 0.716 kg/m3 is the assumed density of CH4 and 27.2 is the 100-year global-warming potential of CH4.
The value was then converted into tonnes CO2e and Gt CO2e:
C O 2 e , S T R , t C O 2 e , S T R , k g 1000
where CO2e,STR,kg is the recoverable-CH4 CO2e value in kg CO2e/year, and CO2e,STR,t is the recoverable-CH4 CO2e value in tonnes CO2e/year.
C O 2 e , S T R , G t = C O 2 e , S T R , t 10 9
where CO2e,STR,Gt is expressed as Gt CO2e/year.
The recoverable-CH4 CO2e value was also expressed per capita:
C H 4 e t C O 2 e ( k g C O 2 e / y r / c a p i t a ) = C H 4 e k g C O 2 e P o p u l a t i o n
This indicator represents the CO2-equivalent value of STR CH4, not observed emissions, avoided emissions or net mitigation. It excludes baseline emissions, leakage, digestate storage, energy inputs, N2O, ammonia volatilisation and nutrient-runoff effects, and remains comparative.
The general conversion factors used to estimate STR energy and recoverable-CH4 CO2e value are presented in Table 2.

2.3.5. Interpretation of Individual Manure-Resource Indicators

The analysis was based on individual manure-resource indicators rather than on a composite opportunity index. This approach was used because the indicators represent different but related dimensions of theoretical manure valorisation potential. STR gross methane energy potential and the recoverable-CH4 CO2e value are both derived from standardised theoretical resource CH4, whereas N and P recovery indicators are derived from manure nutrient-content assumptions. Combining these variables into a single equally weighted index could therefore double-count related information and impose unsupported weighting assumptions. For this reason, country comparisons were interpreted using the separate component indicators, including total and per capita STR gross methane energy potential, standardised theoretical resource N and P, the recoverable-CH4 CO2e value, species contribution, exploratory clustering and scenario analysis.
Because STR gross methane energy potential and recoverable-CH4 CO2e value are both derived from the same STR CH4 quantity, these variables were not combined into a composite index and were not entered jointly into the clustering model. The recoverable-CH4 CO2e value was retained for descriptive and scenario analysis, whereas STR gross methane energy potential was retained as the methane-derived clustering variable. This avoided giving additional weight to the same underlying methane-recovery estimate.
The STR indicators should therefore be interpreted as standardised theoretical resource indicators. The CH4, N and P adjustment fractions are modelling assumptions used to make countries comparable under a common calculation framework. They do not represent measured technical recoverability, country-specific collection feasibility, observed digester performance or empirically verified nutrient-recovery efficiency.

2.4. Statistical Approach

2.4.1. Descriptive and Temporal Trend Analysis

Descriptive statistics were calculated for total manure production, STR CH4, STR gross methane energy potential, STR N, STR P, recoverable-CH4 CO2e value, and per capita indicators. Temporal trends from 2000 to 2023 were assessed using annual aggregated values across all included countries.
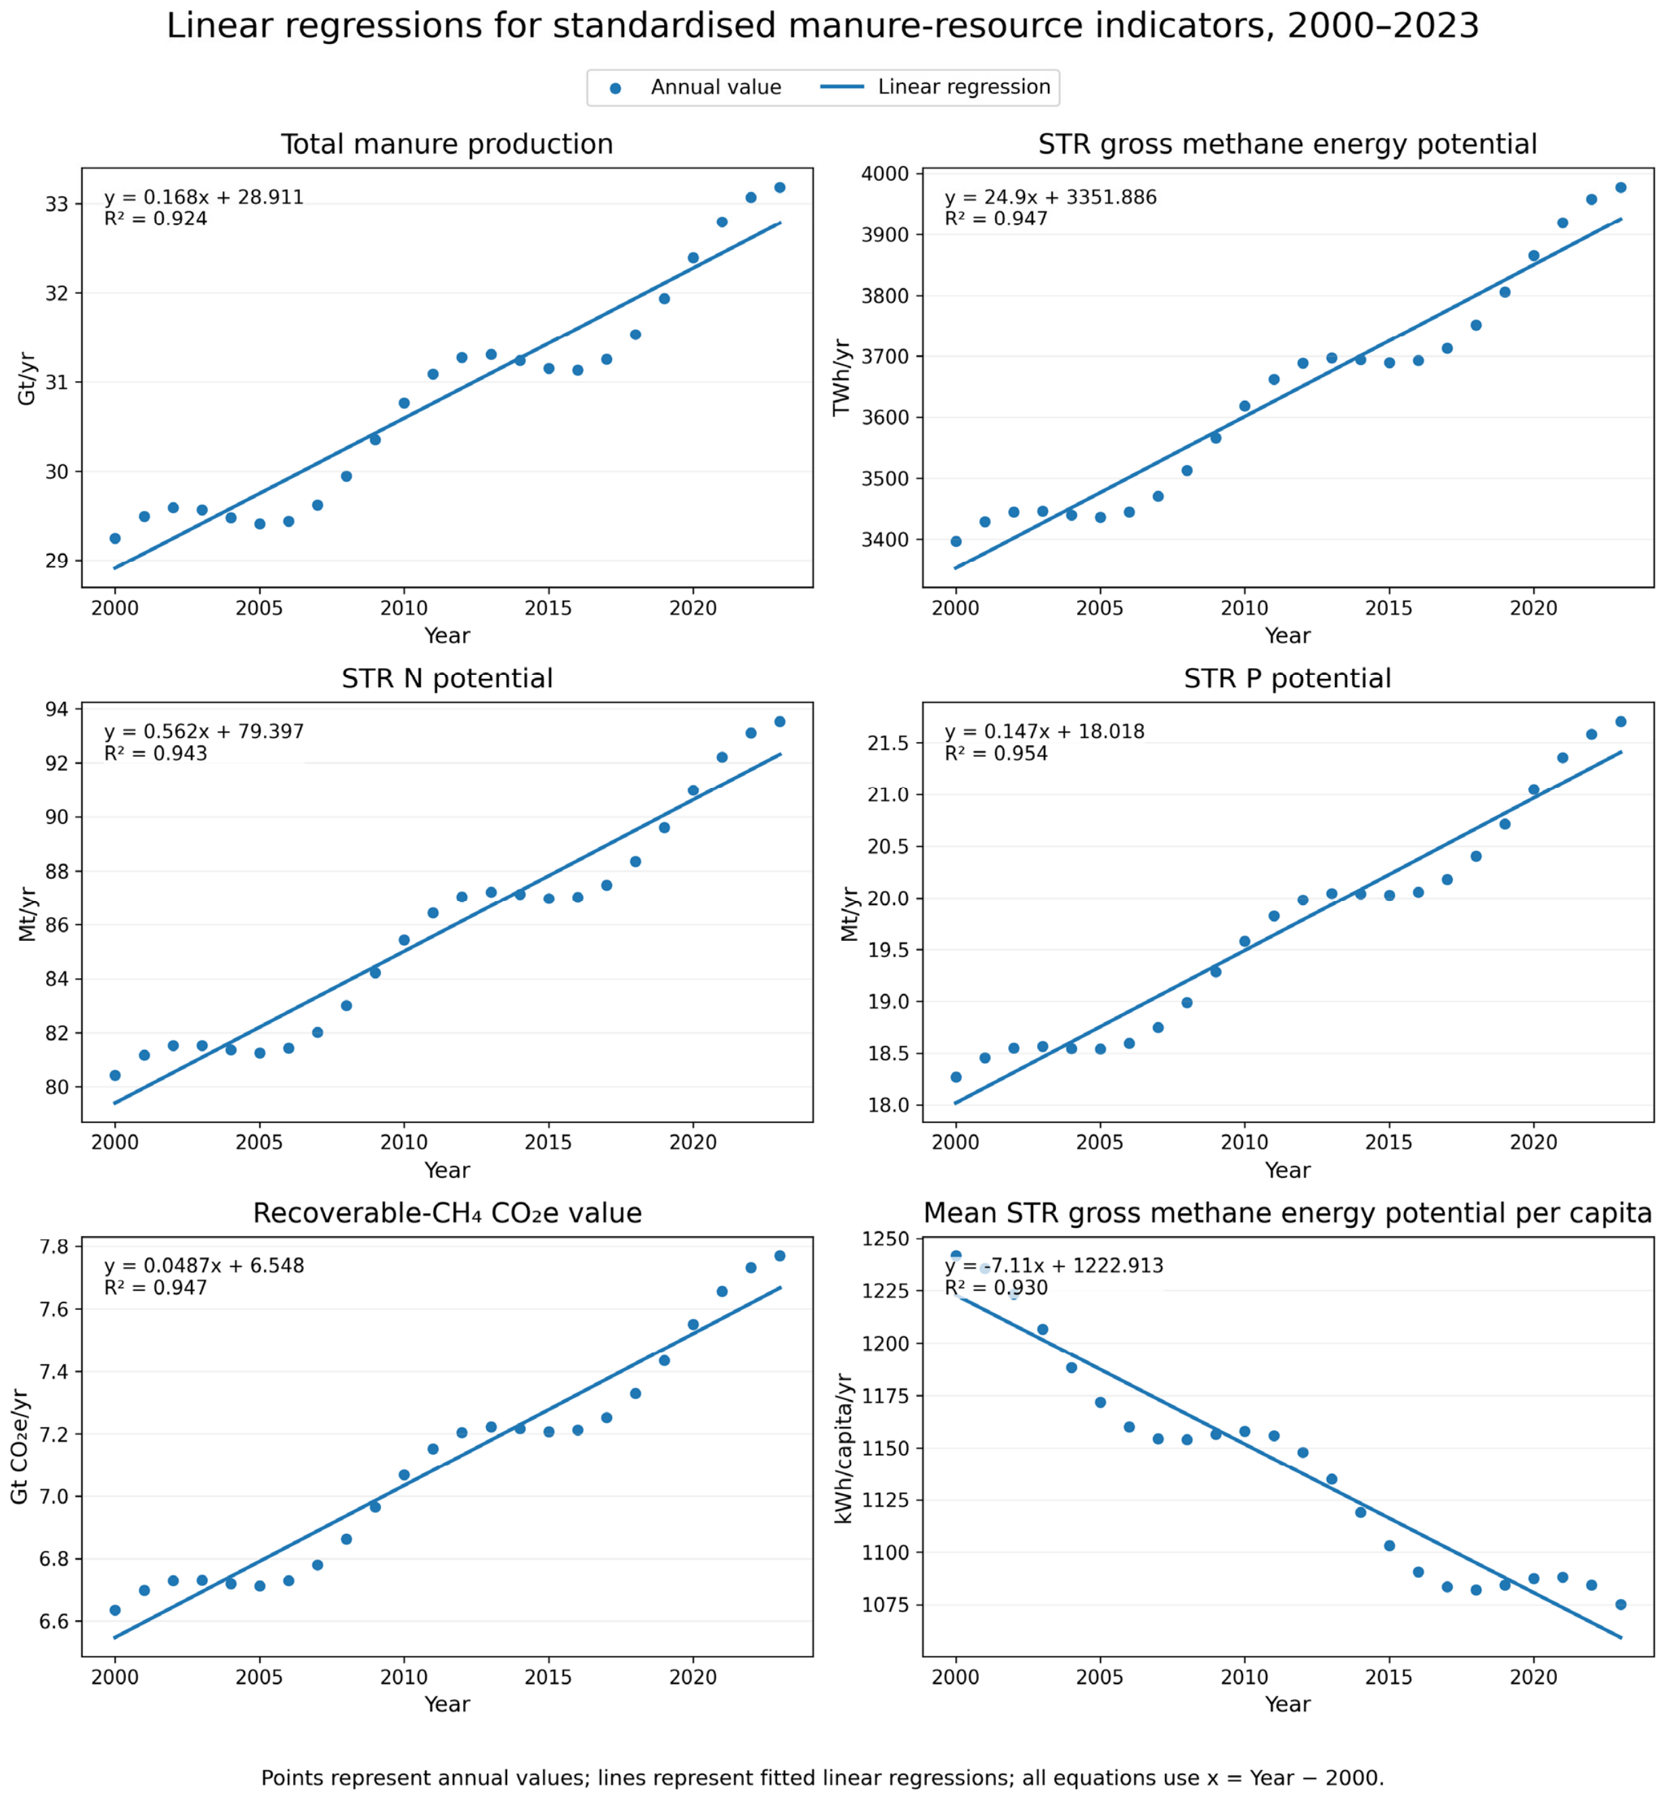
Linear regressions were fitted to six annual indicators: total manure production, STR gross methane energy potential, STR N, STR P, recoverable-CH4 CO2e value, and mean energy potential per capita. These regressions were used to summarise the direction and strength of temporal change. The independent variable was year, expressed as year minus 2000 to make regression intercepts easier to interpret. Model fit was summarised using the coefficient of determination.

2.4.2. Country Ranking and Species Contribution Analysis

Country rankings were produced for 2023. Separate rankings were generated for total STR gross methane energy potential and per capita STR gross methane energy potential. The total ranking was used to identify countries where national-scale manure biorefinery infrastructure could have the greatest absolute potential. The per capita ranking was used to identify countries where livestock manure valorisation may be relatively more important for circular bioeconomy development.
Species contribution analysis was performed by calculating the percentage contribution of cattle, buffaloes, pigs, sheep, goats, and poultry to total estimated manure production. This analysis was conducted in all 50 countries and by country. The purpose was to determine whether national manure biorefinery potential was cattle-dominated, pig-dominated, poultry-influenced, small ruminant-influenced, or mixed.

2.4.3. Correlation Sensitivity Analysis

A correlation sensitivity analysis assessed whether derived indicators mainly reflected livestock-stock data. Using 2023 country-level data, Pearson correlations measured linear associations between livestock stocks and absolute indicators, while Spearman correlations compared rankings. Indicators included manure production, theoretical CH4, STR CH4, STR gross methane energy potential, STR N, STR P and recoverable-CH4 CO2e value. Correlations with total livestock heads and cattle heads were examined because cattle dominated estimated manure production national resource potential estimates.

2.4.4. Coefficient-Uncertainty Sensitivity Analysis

A coefficient-uncertainty sensitivity analysis evaluated how biological and technical parameters affected indicators. Coefficients from Table 1 and Table 2 were used deterministically, but may vary by breed, weight, diet, productivity, climate, housing, manure composition and technology.
Monte Carlo simulation assessed coefficient uncertainty. For manure excretion, volatile-solids fraction, biochemical methane potential, CH4 adjustment, N and P contents, and N and P adjustment fractions, triangular distributions used the central value as the mode and ±20% bounds. Methane energy content and density used ±5% bounds, while CH4 global-warming potential was fixed. Each iteration repeated the 2023 country-level calculations for manure, STR CH4, STR energy, STR N and P, and recoverable-CH4 CO2e value. Medians, 2.5th–97.5th percentiles and rank stability summarised uncertainty; intervals are sensitivity, not prediction, intervals.
This sensitivity analysis was particularly relevant for cattle because dairy cattle, beef cattle and young animals differ in body weight, diet, productivity and manure production.
To make coefficient sensitivity more transparent in the Results, a deterministic low–central–high coefficient scenario was also calculated. In the low scenario, manure excretion, volatile-solids fraction, biochemical methane potential, composite STR CH4 fraction, nutrient contents and nutrient-recovery fractions were set to 80% of their central values. Methane energy content and methane density were set to 95% of their central values, while CH4 GWP100 was kept fixed. In the high scenario, the corresponding biological and technical coefficients were set to 120% of their central values, and methane energy content and methane density were set to 105% of their central values. These scenarios were used as deterministic sensitivity envelopes, not as probabilistic predictions or country-specific estimates.
This sensitivity analysis was not used as a substitute for coefficient justification. Rather, it was used to evaluate how strongly the results depended on the selected standardised adjustment fractions.

2.4.5. Exploratory Clustering, Compositional Sensitivity and PCA Visualisation

K-means clustering was used as a descriptive tool to summarise 2023 manure-resource profiles. The final input variables were total STR gross methane energy potential, STR gross methane energy potential per capita, STR N per capita, STR P per capita and species-specific manure shares for cattle, buffaloes, pigs, sheep, goats and poultry. Recoverable-CH4 CO2e value and recoverable-CH4 CO2e per capita were excluded because they are direct transformations of the same STR CH4 quantity used to calculate STR gross methane energy potential. This avoided reweighting the methane-derived component of the analysis. The same final input matrix was used for K-means clustering and PCA visualisation. All variables were standardised before analysis. Candidate k-means solutions from two to six clusters were compared using silhouette values. Cluster stability was assessed using 500 repeated k-means initialisations and 500 bootstrap resamples. For each bootstrap sample, k-means was refitted and assignments were predicted for all countries. Agreement with the reference solution was summarised by the adjusted Rand index and same-cluster assignment after label matching. PCA was used only for visualisation.

2.4.6. Time-Series Forecasting and Illustrative Adoption-Scenario Design

A time-series forecasting approach was used to project the recoverable-CH4 CO2e value from 2024 to 2050. The historical annual series from 2000 to 2023 was used as the training dataset. Because the historical series contained only 24 annual observations, forecasting was treated as exploratory. The ARIMA(2,1,2) with deterministic trend was retained as a reference trajectory after inspection of candidate non-seasonal ARIMA specifications and simple trend-based benchmarks. These checks were used only to assess whether the selected trajectory was broadly plausible; they were not used to make inferential claims about long-term predictive accuracy. The variable modelled was the annual recoverable-CH4 CO2e value, expressed as Gt CO2e.
Because the historical series contained only 24 annual observations, forecasting was treated as exploratory rather than predictive. Forecast validation was performed using rolling-origin one-step-ahead time-series cross-validation. An initial training window was used to fit each candidate model, and the next annual value was forecast. The window was then expanded by one year, and the procedure was repeated until 2023. Forecast accuracy was compared using root mean square error (RMSE), mean absolute error (MAE) and mean absolute percentage error (MAPE). The selected ARIMA trajectory was compared with simpler benchmarks, including naïve forecasting, random walk with drift, linear trend and exponential smoothing. This validation was used to assess short-horizon predictive behaviour only; it does not remove the uncertainty associated with extrapolating to 2050. ARIMA(2,1,2) with deterministic trend was retained as a reference trajectory after inspection of candidate non-seasonal ARIMA specifications and simple trend-based benchmarks. These checks were used only to assess whether the selected trajectory was broadly plausible; they were not used to make inferential claims about long-term predictive accuracy.
The ARIMA model was first used to generate an unadjusted recoverable-CH4 CO2e reference trajectory from 2024 to 2050. This trajectory represented the expected future development of the recoverable-CH4 CO2e value if the historical temporal structure continued without additional scenario adjustments. It was not interpreted as observed emissions, remaining emissions or an emission-reduction baseline.
Three illustrative adoption scenarios were then applied to the ARIMA recoverable-CH4 CO2e trajectory. These scenarios were defined a priori as sensitivity assumptions rather than empirically estimated adoption pathways. The low-adoption scenario assumed a 10% adoption adjustment by 2050 and no additional technical-intensity improvement. The medium-adoption scenario assumed a 35% adoption adjustment by 2050 and no additional technical-intensity improvement. The high-adoption scenario assumed a 70% adoption adjustment by 2050, together with an additional 15% technical-intensity improvement. These ratios were used to span conservative, intermediate and high adjustment assumptions; they should not be interpreted as sourced adoption forecasts, feasible deployment rates or country-specific policy targets.
For each scenario, adoption adjustment and technical-intensity adjustment were assumed to increase linearly from 2023 to 2050. The scenario-adjusted recoverable-CH4 CO2e value was calculated by multiplying the ARIMA trajectory by the scenario-adjustment factor. The ARIMA forecast intervals were retained to show time-series uncertainty, while coefficient uncertainty was evaluated separately through the sensitivity analysis. The scenarios are defined in Table 3. They were used to examine sensitivity to alternative adoption and technical-intensity assumptions, not to predict implementation.

2.5. Software for Statistical Analysis

All analyses were performed using the software R-CRAN for Windows, version 4.6.1. Figures were produced using the package ‘ggplot2’ (version 3.3.2). K-means clustering and principal components analysis were conducted using the base ‘stats’ package (version 3.6.2). Cluster quality was assessed using functions from the ‘cluster’ package (version 2.8.1.2). Cluster visualisation was performed using the package ‘factoextra’ (1.0.3). Time-series modelling was conducted using the ‘forecast’ package (version 9.0).
All derived variables were generated from transparent equations and species-specific coefficients. The workflow was structured so that raw FAOSTAT livestock values and World Bank population values could be updated without changing the calculation pipeline.

3. Results

3.1. Country Coverage and Representativeness

The final dataset comprised a balanced panel of 50 countries observed from 2000 to 2023, including major livestock-producing systems across Africa, the Americas, Asia, Europe and Oceania, but not all FAOSTAT countries or territories. Results should therefore be interpreted as standardised comparisons of data-complete livestock-producing countries, not as complete global estimates. Uneven regional and data-completeness coverage should be considered when interpreting rankings, per capita comparisons and scenario trajectories.
The 50-country panel should therefore be interpreted as a data-complete livestock-country sample rather than a complete global dataset. Representativeness was assessed by comparing 2023 livestock heads in the analytical panel with FAOSTAT world livestock-head totals by species. This comparison was used to quantify the proportion of the global animal population represented by the panel and to identify species for which coverage was stronger or weaker.

3.2. Overall Temporal Trends

The estimated manure-based biorefinery resource increased between 2000 and 2023. Total manure production increased from 29.25 to 33.18 billion tonnes, corresponding to a 13.4% increase. STR gross methane energy potential increased from 3396.6 to 3977.8 TWh, equivalent to a 17.1% increase. These values represent gross chemical methane energy potential and should not be interpreted as usable electricity, heat or biomethane output. Standardised theoretical resource N increased by 16.3%, STR P by 18.8%, and the manure recoverable-CH4 CO2e value increased by 17.1% (Table 4). In contrast, mean STR gross methane energy potential per capita decreased by 13.4%, indicating that total technical potential increased while per capita potential declined over the same period. STR values are comparative theoretical indicators under fixed species-level assumptions, not observed or operationally achievable country-specific energy or nutrient recovery. The fitted regressions for all six temporal indicators are shown in Figure 1. Total manure production, STR gross methane energy potential, STR N, STR P, and recoverable-CH4 CO2e value all increased over time, whereas mean energy potential per capita declined, indicating that absolute manure-biorefineries potential increased despite a reduction in the average per capita indicator.
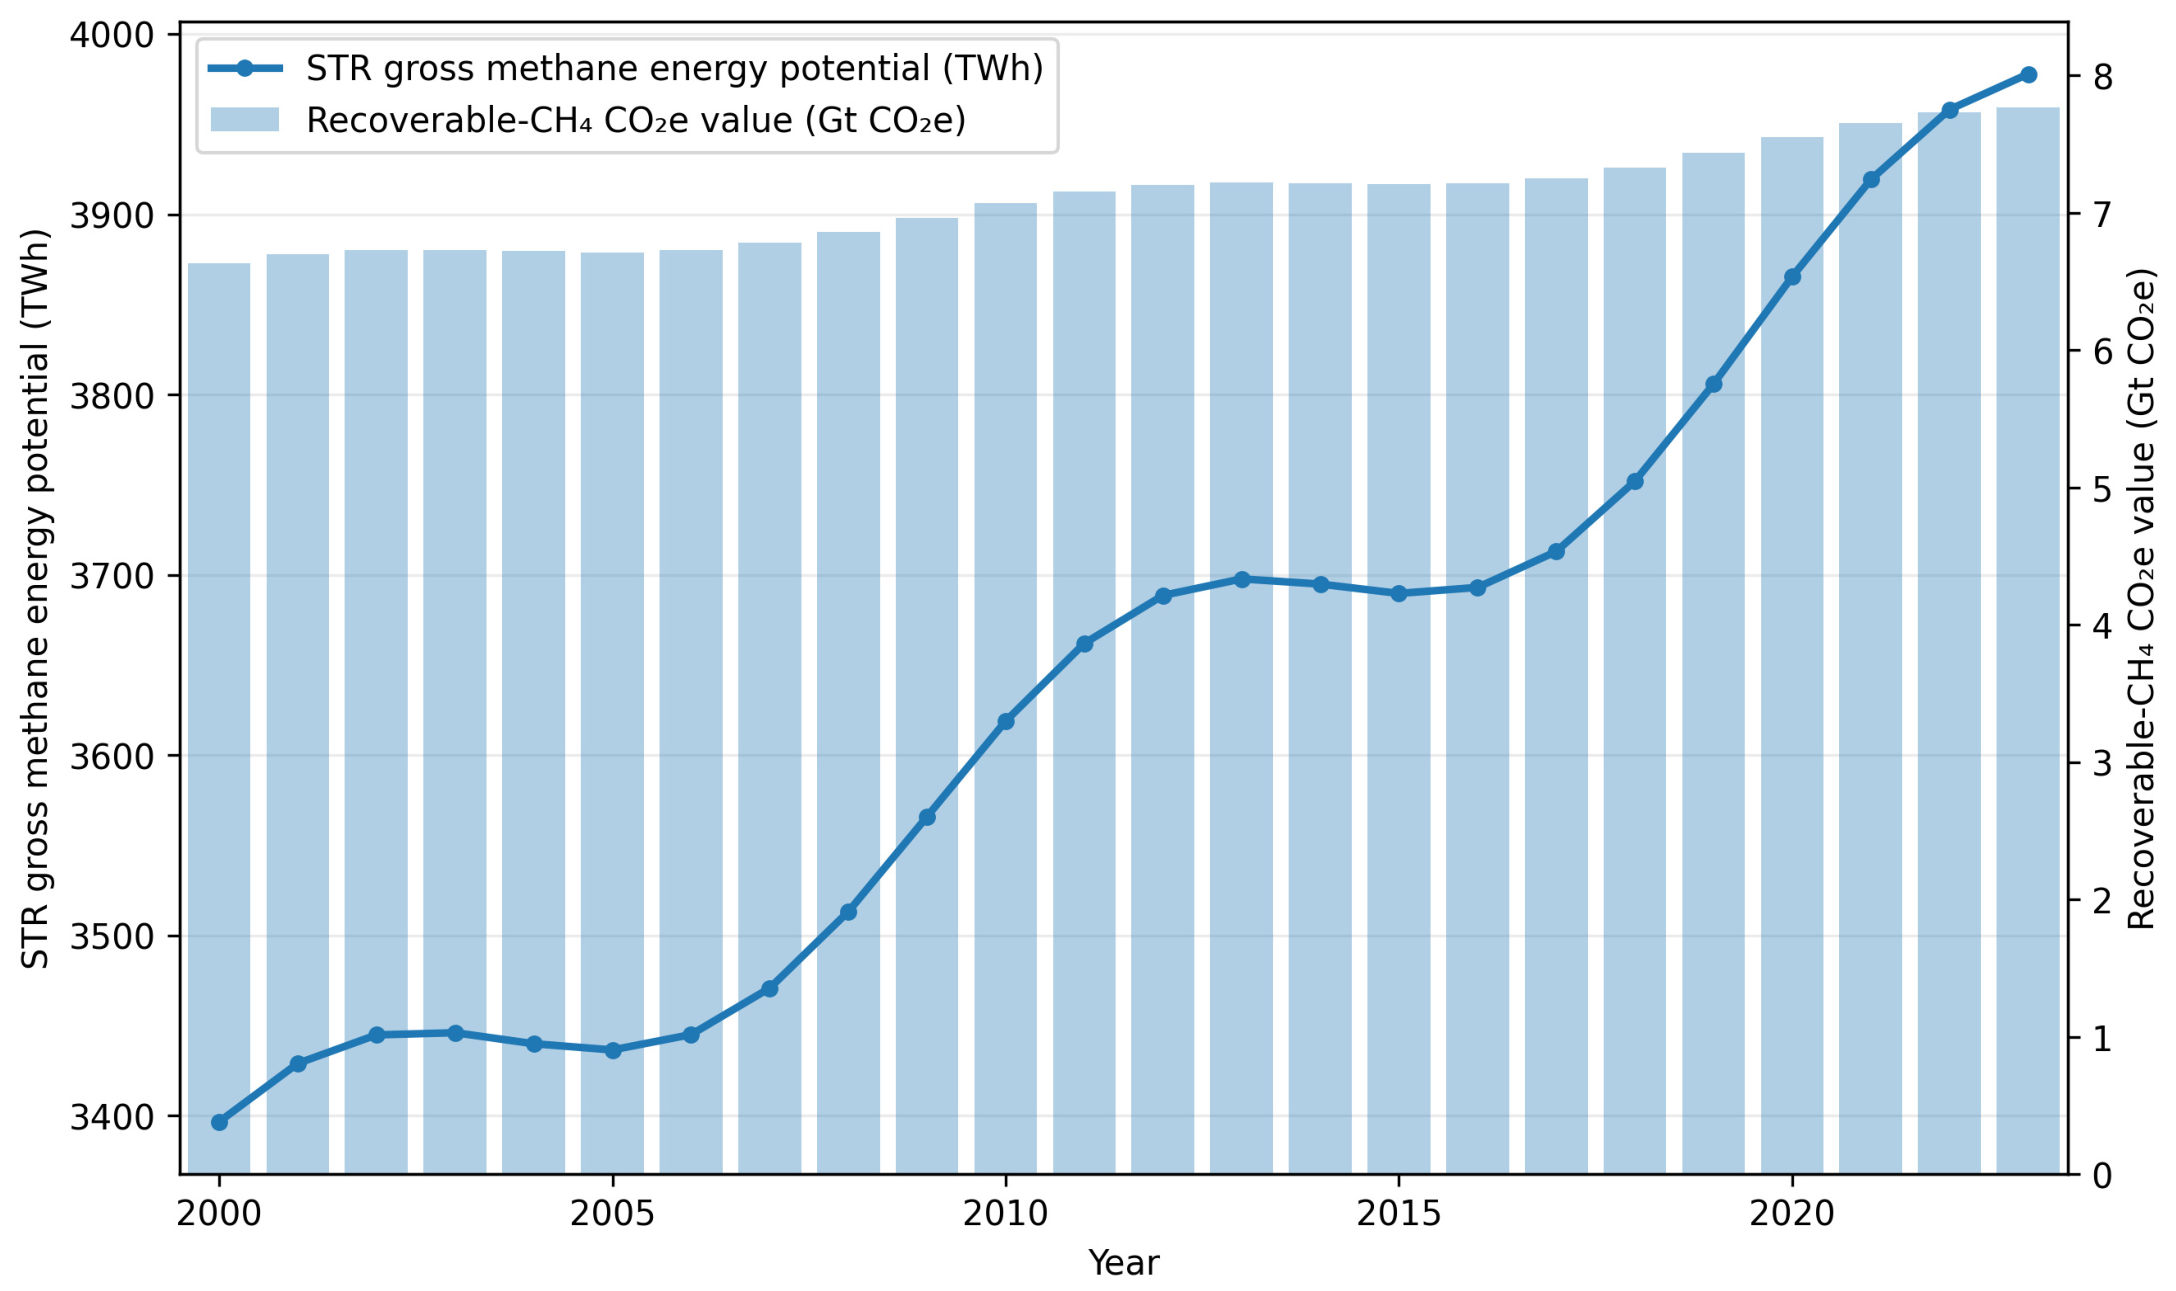
The annual trend confirmed a steady increase in both recoverable energy potential and manure recoverable-CH4 CO2e value (Figure 2). The corrected figure shows recoverable energy as a line and the recoverable-CH4 CO2e value as bars, allowing both temporal patterns to be distinguished clearly. The positive trajectory suggests that the theoretical resource base for manure-based biorefineries increased over time, mainly reflecting the expansion of livestock-derived manure availability.
Higher recoverable N and P values indicate larger theoretical nutrient quantities. They should not be interpreted automatically as greater opportunity, because livestock-intensive regions may also face nutrient surpluses, transport constraints or land-application limits.

3.3. Country Rankings by Total Energy Potential

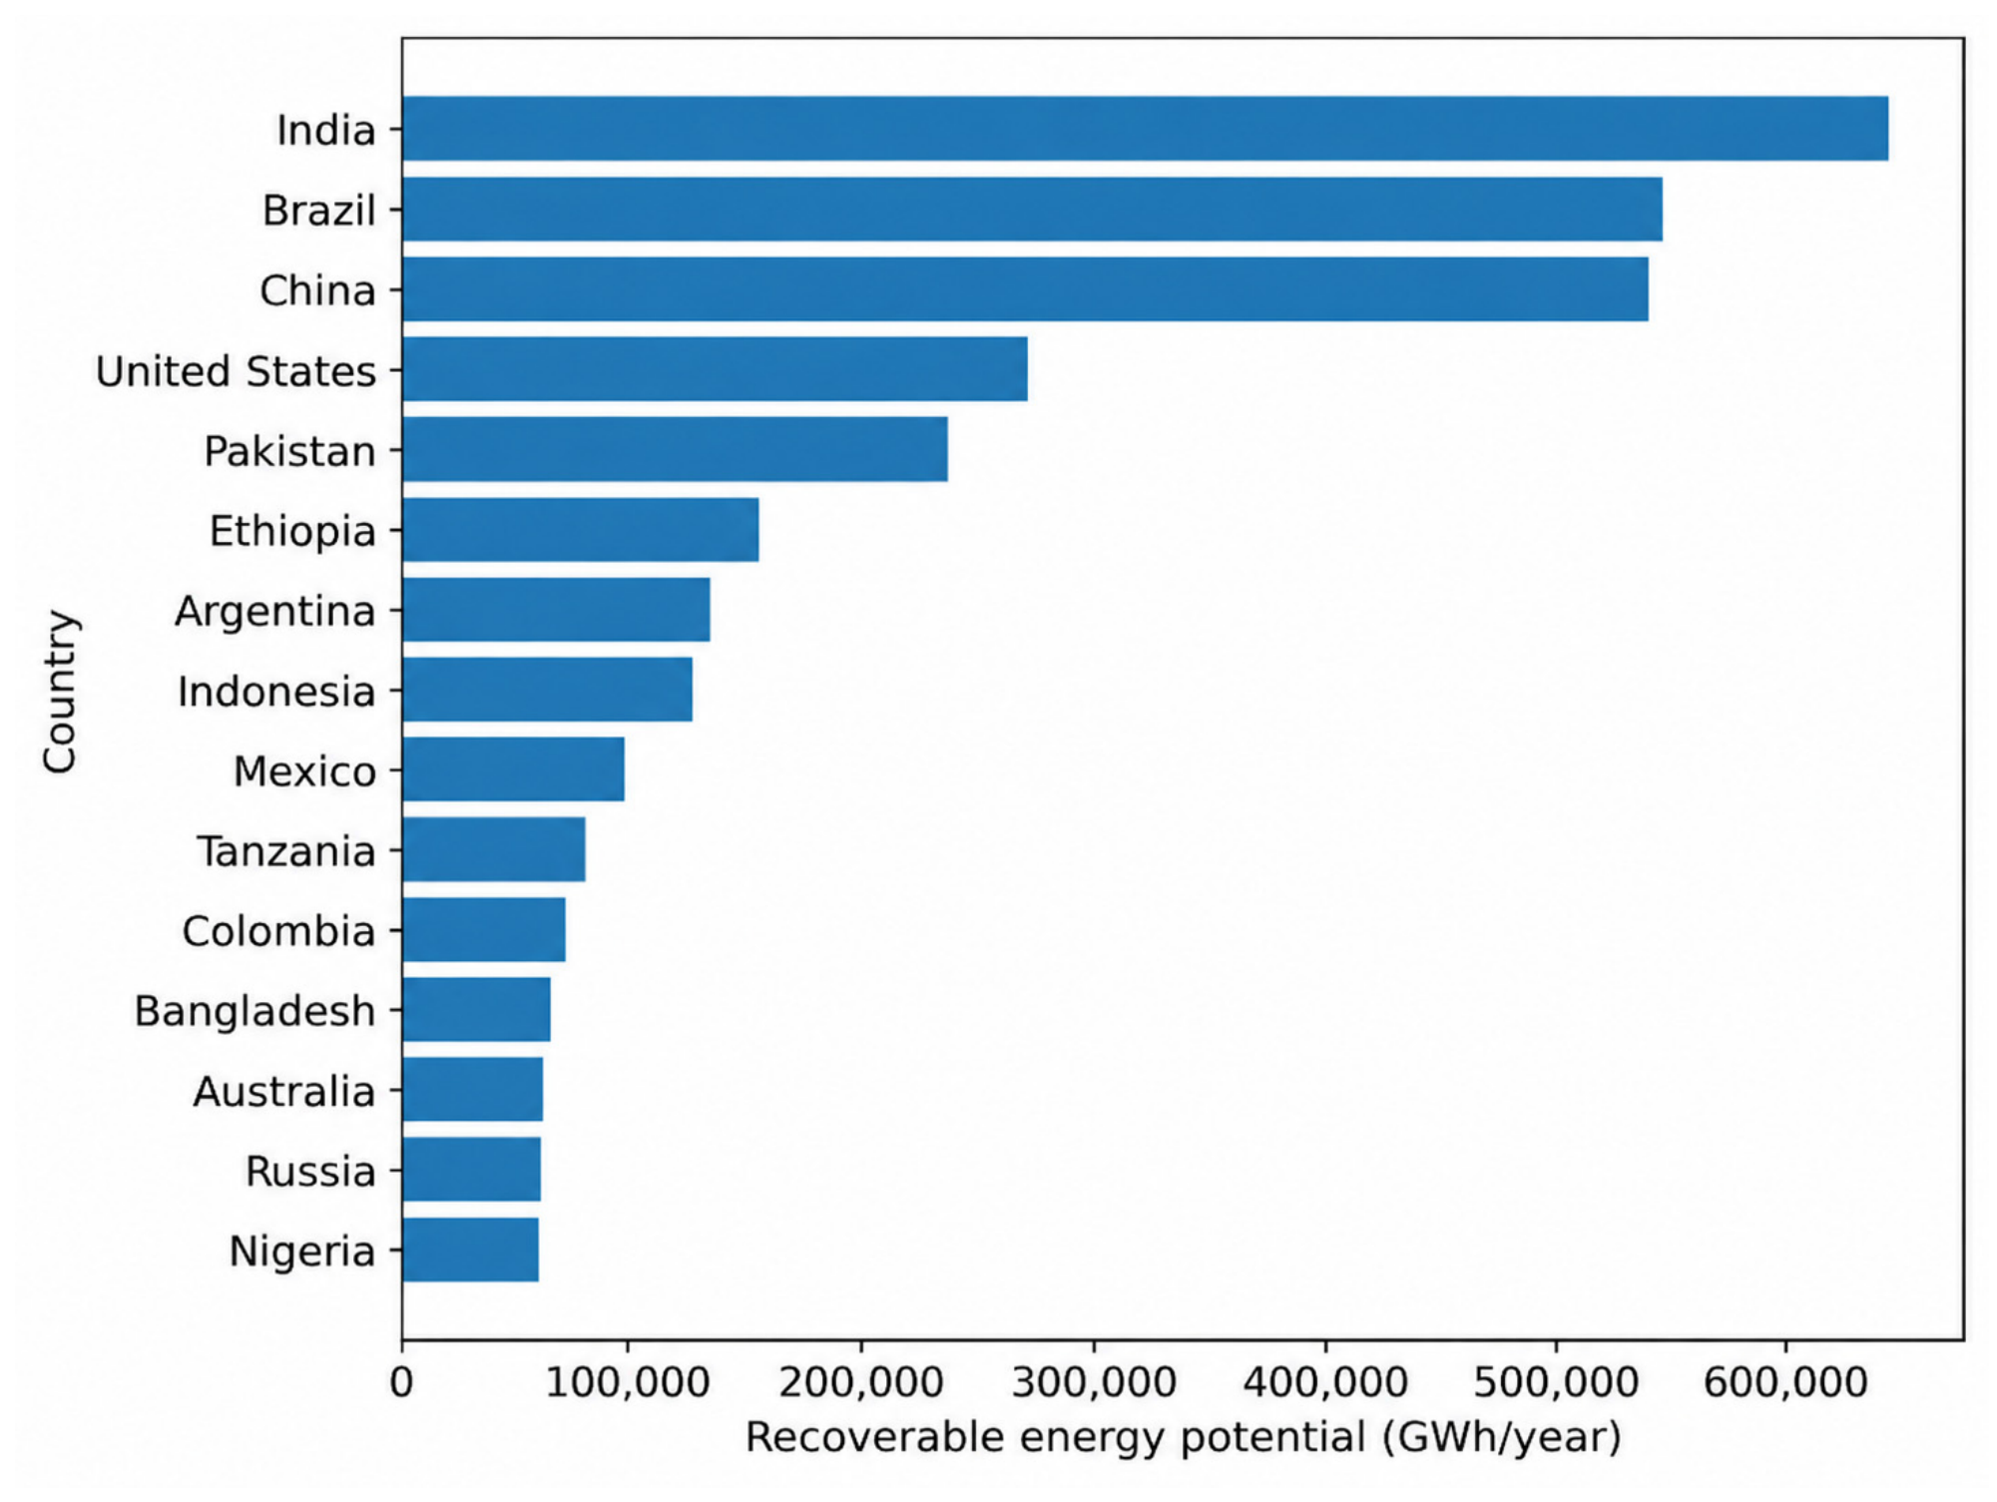
Country rankings based on total STR energy potential showed that a small number of large livestock-producing countries accounted for a substantial share of the estimated large cross-country manure-resource potential. In 2023, India had the highest total STR energy potential, followed by Brazil, China, the USA, and Pakistan (Table 5). These countries ranked highly because of their large livestock populations and, therefore, large total manure resource base.
The graphical comparison of the leading countries illustrates the dominance of India, Brazil, and China in absolute energy potential (Figure 3). These identify countries with the largest standardised theoretical STR gross methane energy potential. They should be interpreted as comparative screening indicators of resource magnitude, not as evidence of country-specific collectability, economic feasibility, infrastructure suitability or implementation priority.
Rankings are intended for comparative screening only and do not account for manure collectability, farm distribution, infrastructure, costs, policy incentives or operational feasibility.
These values refer to gross methane energy content under standardised assumptions. They should not be interpreted as net usable energy supplied to electricity, heat or biomethane systems.

3.4. Per Capita Country Comparison

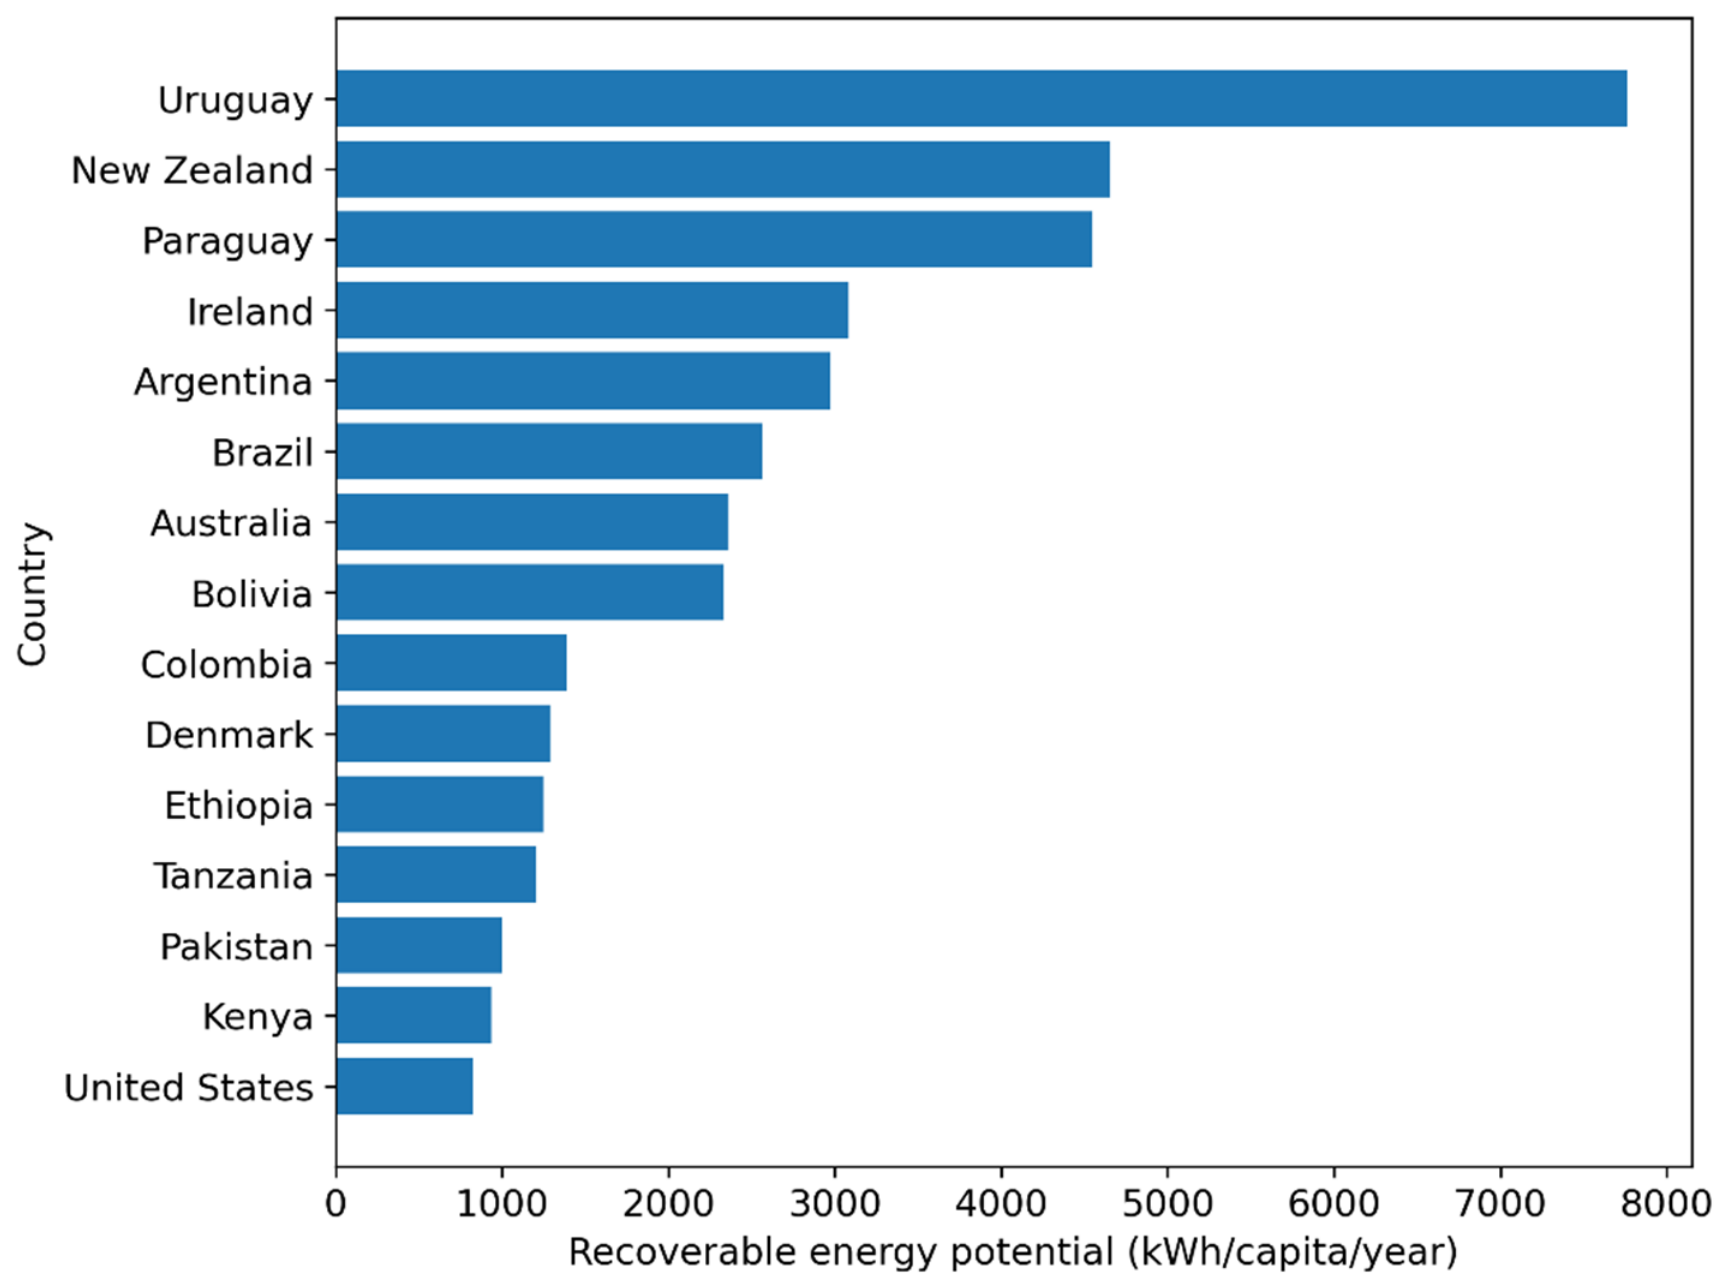
The per capita ranking produced a different interpretation from the total-potential ranking. Uruguay had the highest estimated energy potential per capita, followed by New Zealand, Paraguay, Ireland, and Argentina (Table 6). These countries did not necessarily have the largest total manure resources, but their livestock resource base was high relative to population size.
The contrast between total and per capita rankings is shown in Figure 4. Countries such as Uruguay, New Zealand, and Paraguay became more prominent when energy potential was expressed per inhabitant. These results suggest that per capita indicators are useful for identifying countries where manure-resource potential is high relative to population size, even if their total national potential is smaller than that of larger countries.
The per capita rankings identify countries where estimated manure-resource potential is high relative to human population size. They should not be interpreted as direct policy-priority rankings, because other denominators could produce different country orderings.

3.5. Species Contribution to Manure Biorefinery Potential

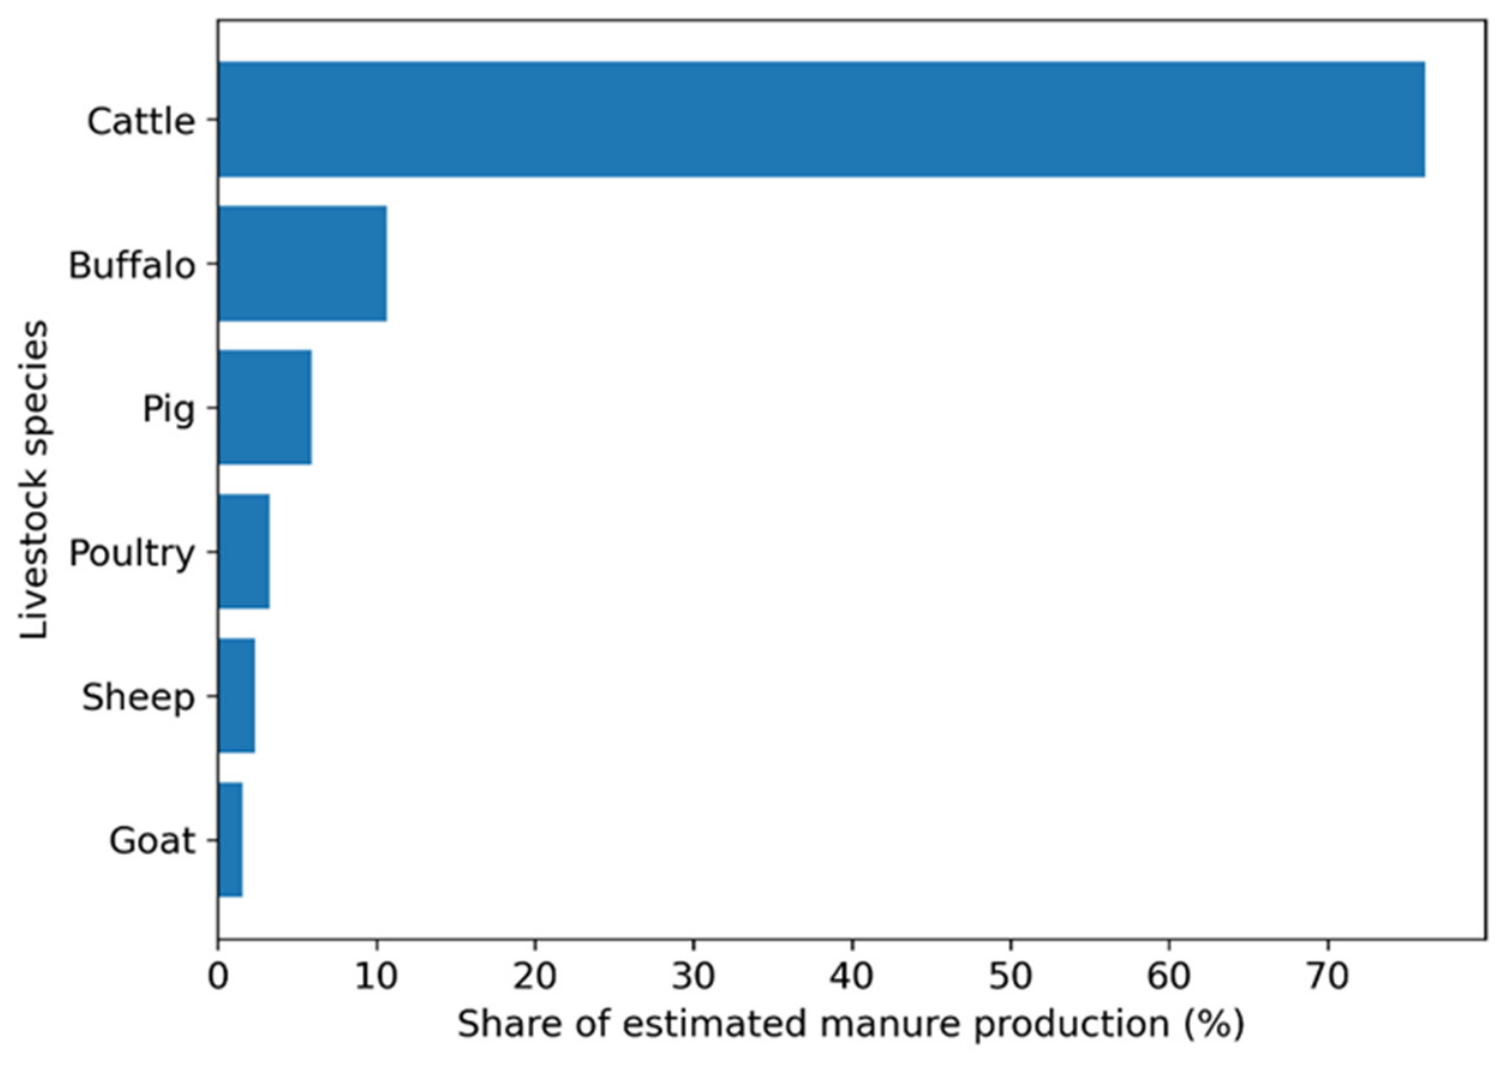
The species contribution analysis showed that cattle were the dominant source of estimated manure production in 2023, contributing 76.2% of total manure. Buffaloes contributed 10.7%, pigs 5.9%, poultry 3.3%, sheep 2.4%, and goats 1.6% (Table 7). This indicates that the estimated manure-based biorefinery potential was primarily cattle-driven.
The relative contribution of each livestock group is illustrated in Figure 5. Although cattle dominate the large cross-country manure resource, pigs, poultry, and small ruminants may still be important in specific national or regional contexts. This is relevant because different manure streams may require different collection, storage, pretreatment, and anaerobic digestion strategies.
The correlation sensitivity analysis showed that absolute derived indicators were strongly associated with livestock stocks (Table 8). Correlations with total livestock heads were moderate to strong (Pearson r = 0.613–0.772; Spearman ρ = 0.662–0.769), while correlations with cattle heads were stronger (Pearson r = 0.919–0.965; Spearman ρ = 0.949–0.987). Thus, absolute rankings were largely influenced by livestock abundance, especially cattle. Their value lies in translating stock data into comparable estimates of manure, CH4, energy, nutrient recovery and recoverable-CH4 CO2e, alongside per capita and species-based analyses, clustering and scenario analysis comparisons.
The coefficient-uncertainty analysis showed wider plausible ranges for derived indicators (Table 9). In 2023, STR energy potential for the 50-country panel was 3977.8 TWh, with a 95% sensitivity interval of 3157.5–5011.0 TWh. The recoverable-CH4 CO2e value was 7.77 Gt, with an interval of 6.14–9.75 Gt. National estimates should therefore be interpreted as central values under standardised assumptions, not precise measurements.
The deterministic low–central–high coefficient scenarios confirmed that derived indicators were sensitive to coefficient assumptions, particularly those based on multiplicative methane-recovery pathways. Under joint low-coefficient assumptions, STR gross methane energy potential decreased from the central estimate of 3977.8 TWh/yr to 1547.9 TWh/yr, whereas the joint high-coefficient scenario increased it to 8660.8 TWh/yr. The recoverable-CH4 CO2e value showed the same pattern, ranging from 3.02 to 16.92 Gt CO2e/yr around a central value of 7.77 Gt CO2e/yr. Nutrient indicators were also sensitive to manure-excretion, nutrient-content and nutrient-recovery assumptions. These results confirm that the central estimates should be interpreted as standardised comparative values rather than precise country-specific measurements.
The leading-country rankings were broadly stable under coefficient uncertainty. India remained first for total STR energy, Brazil and China alternated between second and third, and the USA and Pakistan stayed in the top five. For per capita STR energy, Uruguay remained first, while New Zealand and Paraguay alternated between second and third. Small rank differences should not be overinterpreted.

3.6. K-Means Clustering and PCA Biplot Interpretation

Clustering diagnostics supported a four-cluster exploratory solution after removing the redundant recoverable-CH4 CO2e variable from the clustering input set. Mean silhouette values for candidate solutions from k = 2 to k = 6 were 0.360, 0.373, 0.392, 0.267 and 0.278, respectively (Table 10). The four-cluster solution had the highest mean silhouette value, but stability was moderate rather than strong, with mean random-start ARI = 0.624 and mean bootstrap ARI = 0.615. Therefore, the four clusters were retained only as exploratory descriptive manure-resource profiles.
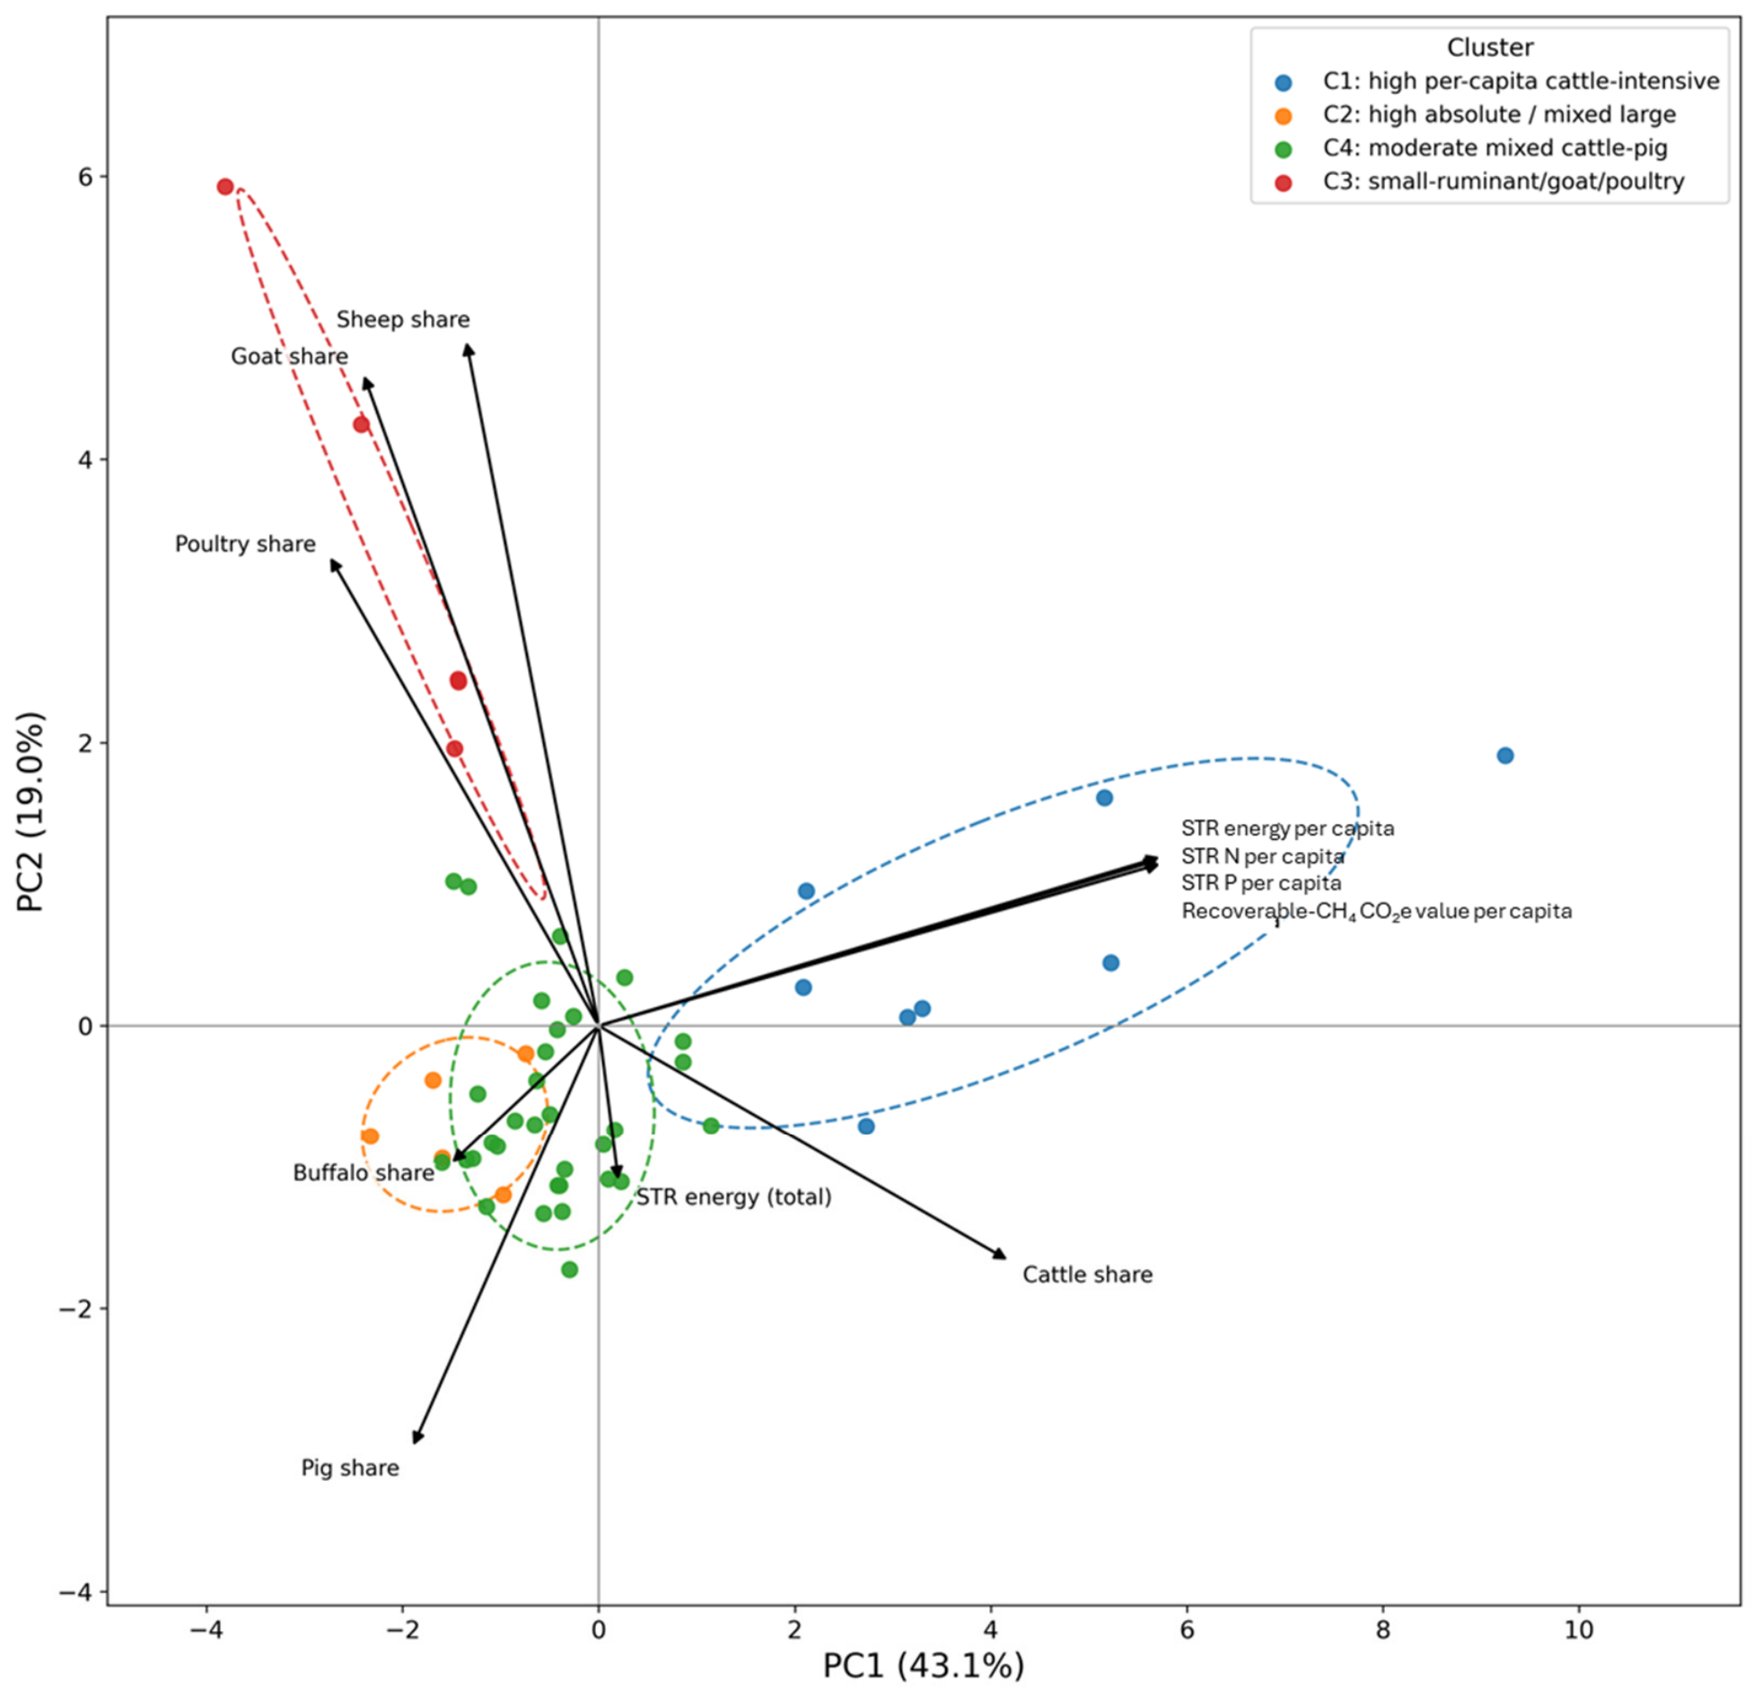
The silhouette analysis showed that the four-cluster solution had the highest mean silhouette value among the candidate solutions tested. The four-cluster solution was therefore retained, but only as an exploratory descriptive solution because stability was moderate rather than strong. The first two principal components explained 62.1% of the total variance. PC1 explained 43.1% of the variance and was mainly associated with per capita intensity variables, including energy per capita, STR N per capita, STR P per capita, and recoverable-CH4 CO2e value per capita. PC2 explained 19.0% of the variance and separated countries mainly according to livestock composition, especially sheep, goat, and pig manure shares.
The k-means clusters are summarised in Table 11. Cluster C1 represented high per capita, cattle-intensive biorefinery potential and included Argentina, Australia, Bolivia, Brazil, Ireland, New Zealand, Paraguay, and Uruguay. Cluster C2 included high absolute-potential mixed large systems, such as China, Egypt, India, Pakistan, and the Philippines. Cluster C3 grouped countries with stronger small-ruminant, goat, and poultry influence, including Greece, Iran, Morocco, Nigeria, and Saudi Arabia. Cluster C4 was the largest cluster and represented moderate mixed cattle-pig systems across Europe, the Americas, Asia, and Africa.
The PCA biplot provided a visual summary of the exploratory clustering structure rather than independent validation of the clusters. (Figure 6). Countries in Cluster C1 were positioned in the direction of the per capita STR gross methane energy, STR N, STR P, and recoverable-CH4 CO2e vectors, indicating high relative manure-resource intensity. Cluster C2 was more strongly associated with total energy potential and buffalo manure share. Cluster C3 was positioned closer to the sheep, goat, and poultry vectors, reflecting the species-share variables included in the analysis. Cluster C4 occupied an intermediate position and included countries with mixed manure profiles and moderate values across the selected manure-resource indicators. Because the PCA used the same standardised variables as the clustering, the biplot should be interpreted as a descriptive visualisation of the input-variable structure. The exploratory cluster profiles, main contributing variables and country membership are summarised in Table 11. These clusters should be interpreted as descriptive manure-resource profiles generated from the selected input variables, not as definitive country typologies or policy-ready classifications.
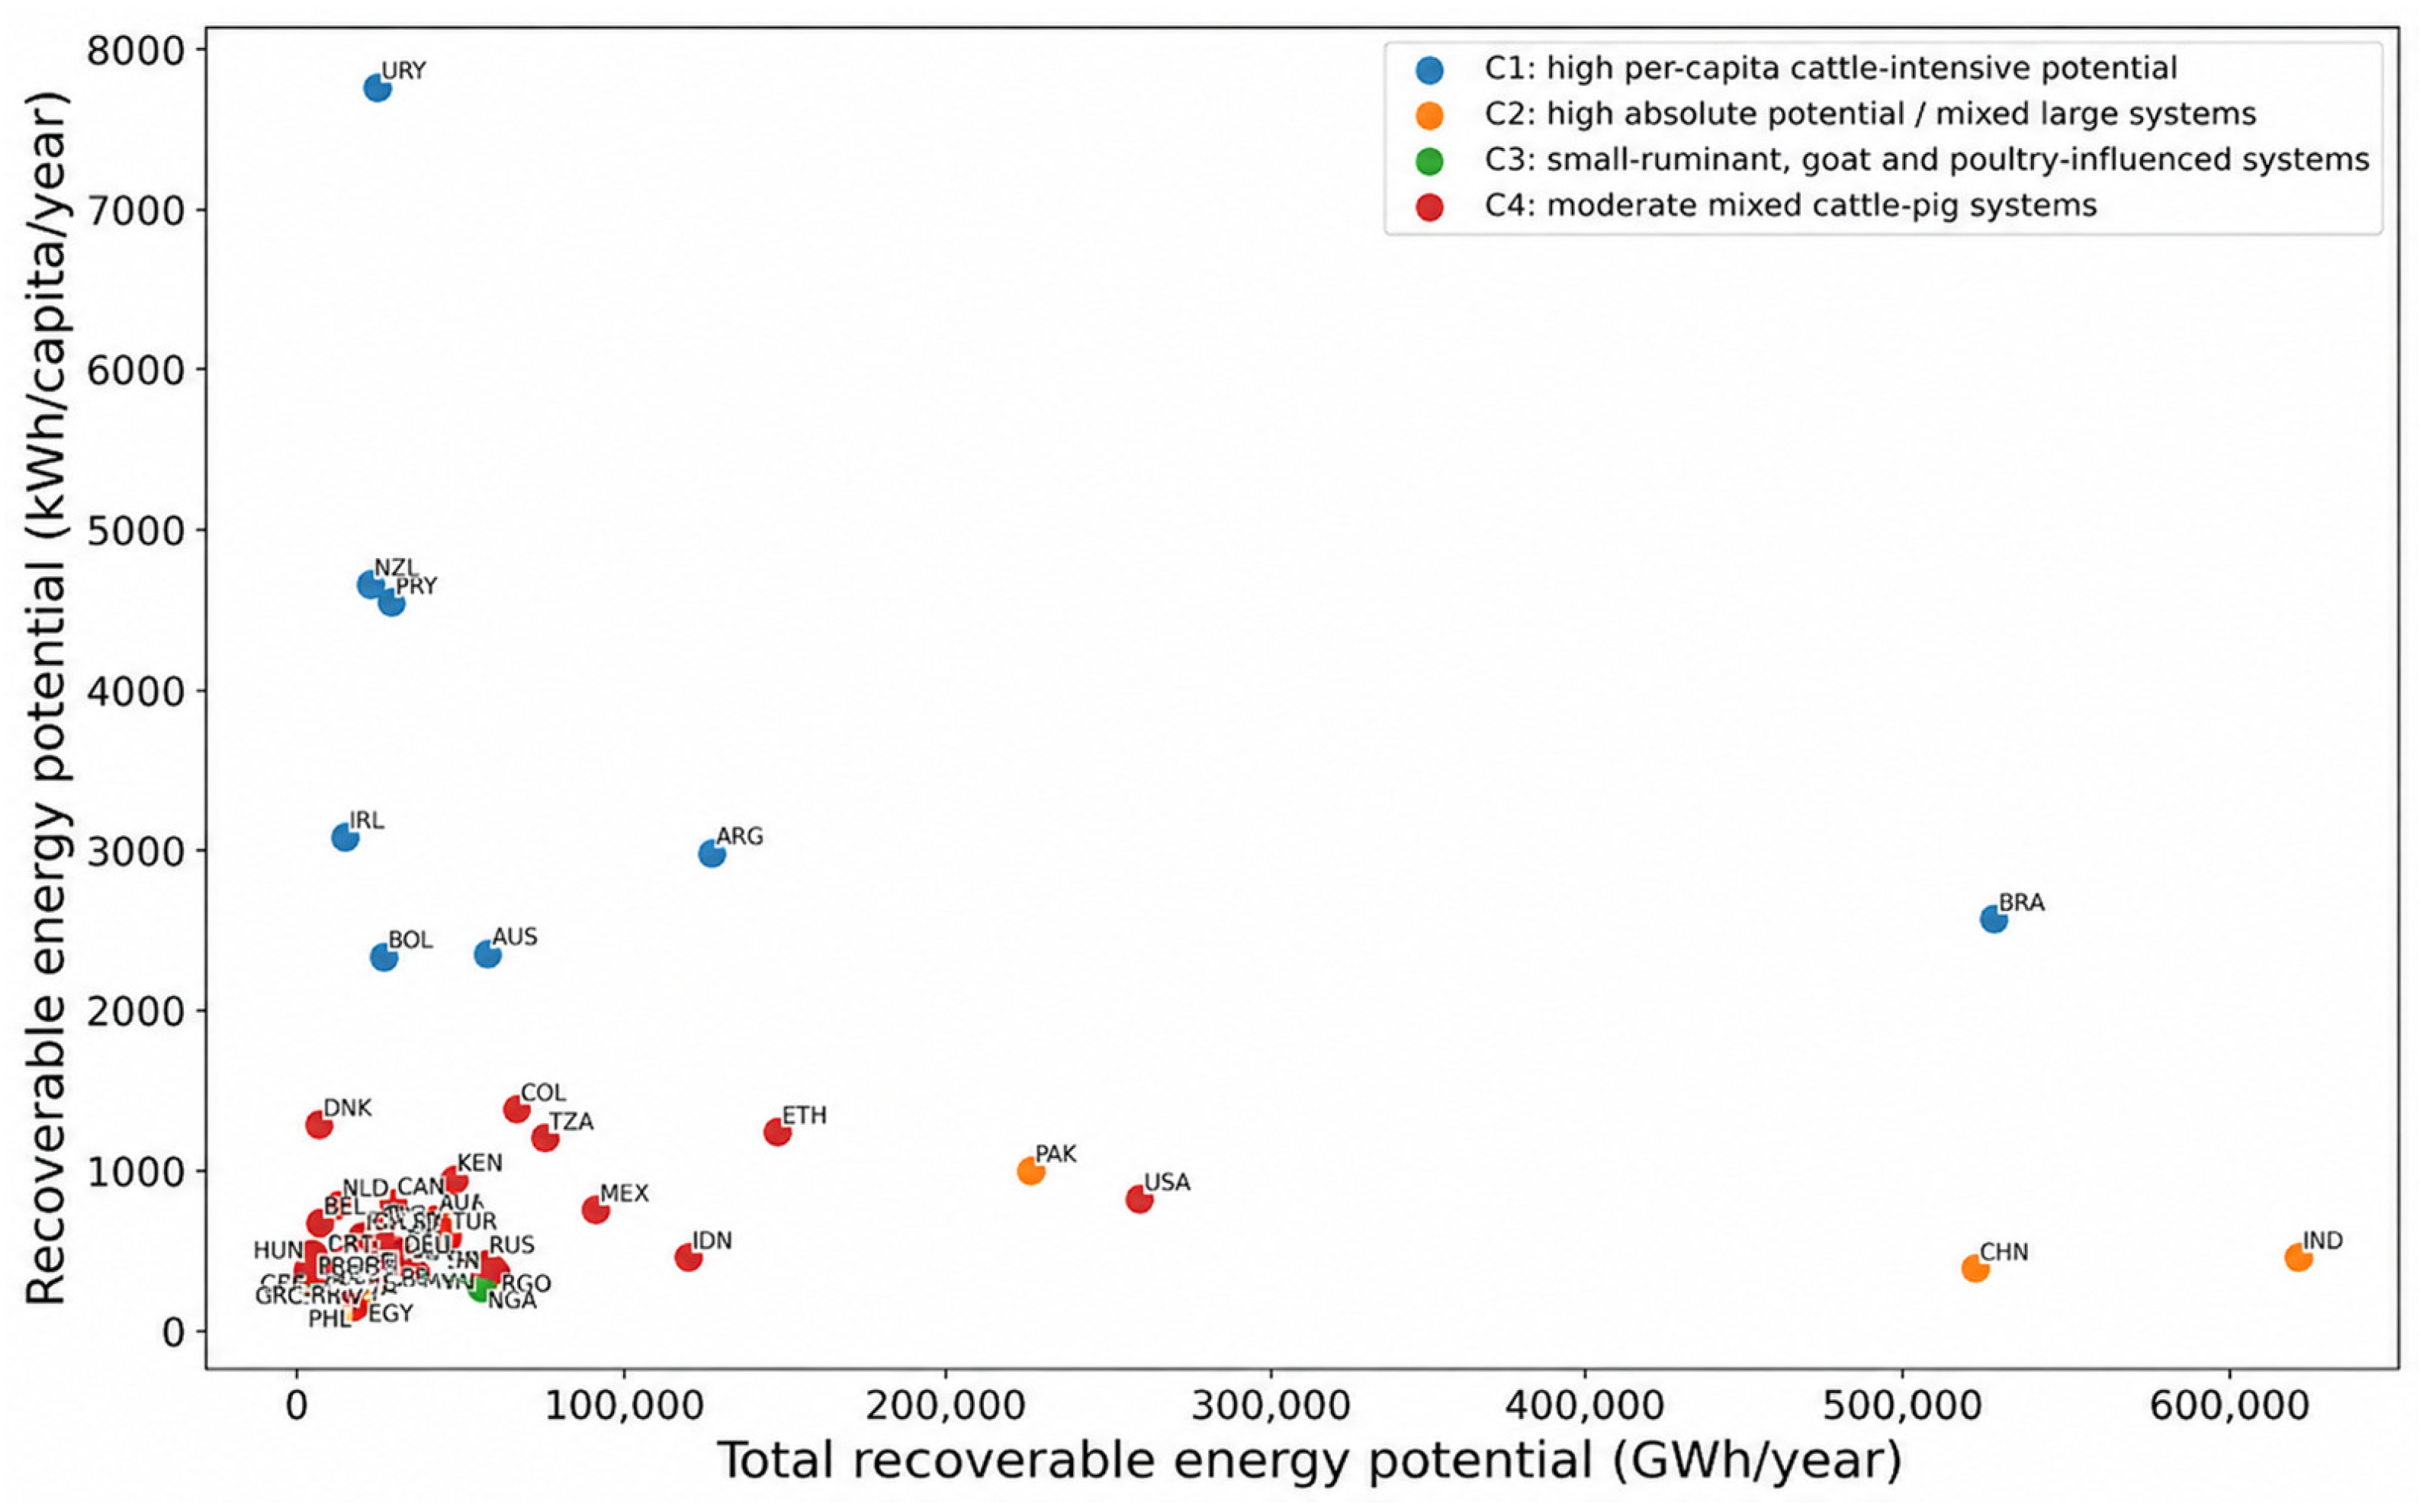
The relationship between total STR gross methane energy potential and per capita STR gross methane energy potential further demonstrates the importance of using both metrics (Figure 7). Large countries such as India and China had high total potential but lower per capita values, whereas countries such as Uruguay, New Zealand, Paraguay, and Ireland had high per capita potential despite lower total potential. Therefore, total and per capita indicators identify different types of biorefinery opportunities.

3.7. Time-Series Forecast of the Recoverable-CH4 CO2e Value to 2050

The time-series analysis was treated as an exploratory extrapolation because the historical series contained only 24 annual observations and the projection horizon extended to 2050. ARIMA(2,1,2) model with a deterministic trend was retained as the reference trajectory, but 2050 values were considered model-dependent. The model had an AIC of −232.020 and a BIC of −225.207, and residual diagnostics did not indicate any relevant remaining autocorrelation. However, the forecast should be interpreted as an exploratory benchmark rather than a definitive long-term prediction.
The selected reference model and diagnostic statistics are presented in Table 12. Rolling-origin one-step-ahead forecast validation against simpler benchmark models is reported in Table 13. Scenario-adjusted values for 2030, 2040 and 2050 are then reported in Table 14.
Rolling-origin validation indicated that the selected ARIMA(2,1,2) trajectory had lower short-horizon forecast error than the simpler benchmark models (Table 13). However, this validation assesses one-step-ahead performance within the 2000–2023 series and does not remove the uncertainty associated with projecting to 2050. The ARIMA trajectory was therefore retained as an exploratory reference for scenario adjustment, not as a definitive long-term forecast.
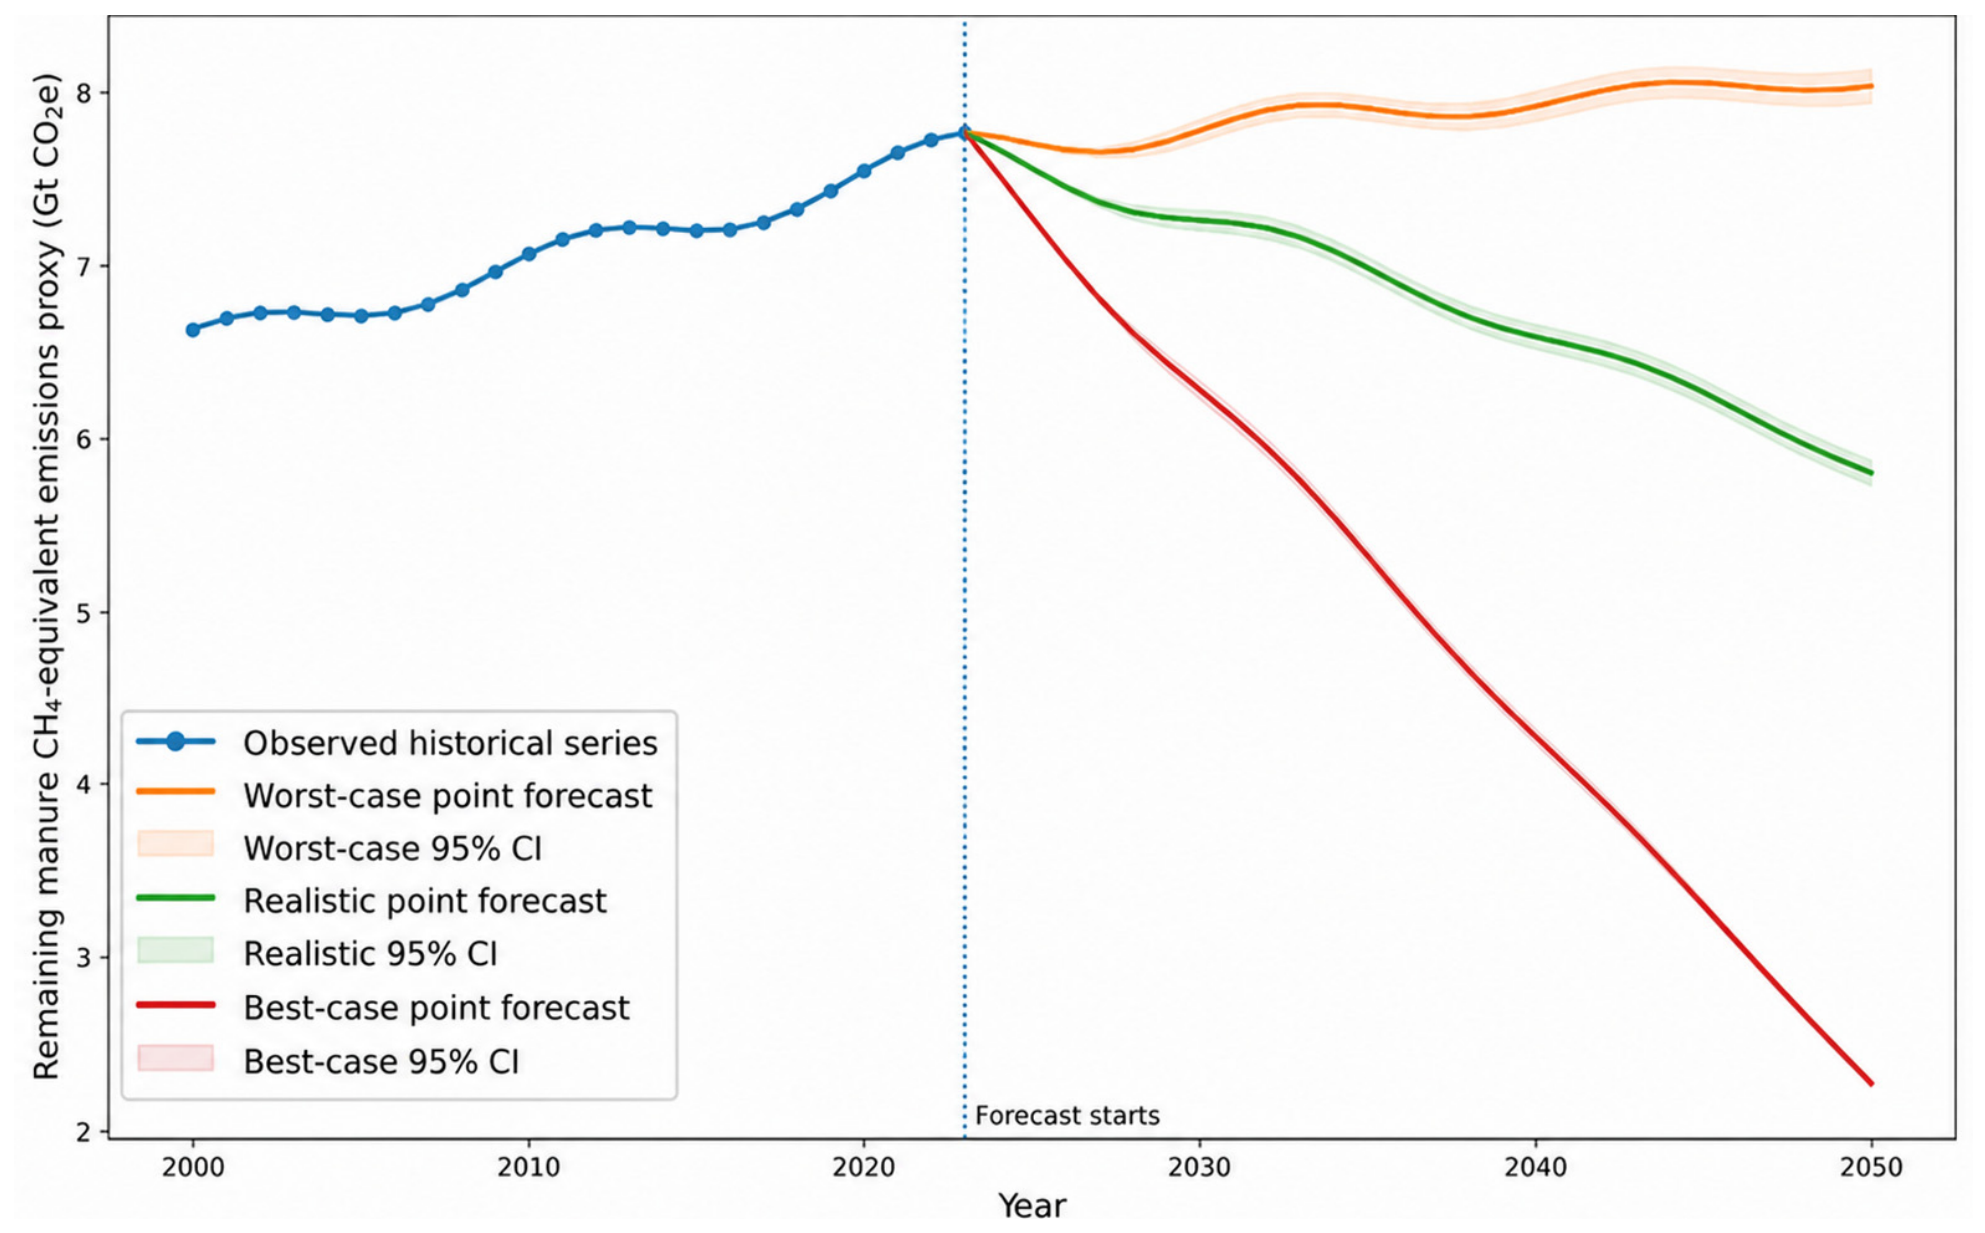
The three illustrative adoption scenarios produced different scenario-adjusted recoverable-CH4 CO2e trajectories (Figure 8).
Under low adoption, the value increased from 7.77 Gt CO2e in 2023 to 8.04 Gt CO2e by 2050, with a 95% interval of 7.94–8.14 Gt CO2e. Under medium adoption, the value declined to 7.26 Gt CO2e by 2030, 6.59 Gt CO2e by 2040 and 5.81 Gt CO2e by 2050, with a 2050 interval of 5.73–5.88 Gt CO2e. Under high adoption, the value declined to 6.29 Gt CO2e by 2030, 4.28 Gt CO2e by 2040 and 2.28 Gt CO2e by 2050, with a 2050 interval of 2.25–2.31 Gt CO2e. These differences follow from the adoption and technical-intensity assumptions applied to the ARIMA trajectory and should be interpreted as sensitivity results rather than evidence of feasible deployment pathways.
ARIMA intervals reflect time-series uncertainty, while the Monte Carlo analysis reflects coefficient uncertainty. Therefore, the scenario trajectories are indicative model outputs under standardised assumptions, not precise 50-country panel predictions. Forecast sensitivity showed that 2050 values were model-dependent; the ARIMA(2,1,2) trajectory was retained only as an exploratory reference, not as a definitive long-term prediction.

4. Discussion

This study estimated standardised theoretical livestock manure-resource potential using a balanced 50-country country–year panel. Between 2000 and 2023, total manure production, STR gross methane energy potential, STR N, STR P and recoverable-CH4 CO2e value increased, indicating an expanding theoretical resource base under fixed species-level assumptions. This interpretation is consistent with circular-bioeconomy perspectives that recognise livestock manure as a potential resource for nutrient recycling, renewable energy and bio-based value chains [1,4,8]. It also aligns with the literature on biomethane production and livestock biorefinery development, which highlights the role of manure-derived biogas within broader resource-recovery systems [13,23]. However, these estimates should not be interpreted as observed energy production, achieved nutrient recovery, avoided emissions or feasible deployment capacity.
The balanced 50-country panel improves comparability but limits inference. It includes major livestock systems, not all FAOSTAT territories, and may underrepresent incomplete records. Results are large cross-country comparisons, not complete global estimates for all territories. The correlation sensitivity analysis qualifies absolute rankings, which were strongly associated with livestock stocks, especially cattle heads. This reflects their calculation from livestock numbers using fixed species-specific coefficients. Total-potential rankings therefore indicate standardised theoretical manure-resource magnitude, not patterns independent of livestock abundance. The framework adds value by converting stock data into comparable biorefinery indicators and by contrasting absolute, per capita, species-composition, clustering and scenario-based interpretations across countries, scenarios and time.
Coefficient-uncertainty analysis qualifies derived indicators: central estimates are reproducible standardised comparisons, not precise national measurements. Manure excretion, volatile solids, methane potential, nutrient contents and recovery efficiencies vary by animal, system and technology. Multiplicative coefficients accumulate uncertainty, so broad country-group differences are more reliable than small between-country contrasts with similar values.
The increase in total manure production and STR energy potential reflects the continued expansion and intensification of livestock systems in many regions, which increases both manure-management pressure and the size of the recoverable biomass resource [1,8]. From a biorefinery perspective, this is important because manure is not only a waste-management challenge but also a recoverable biological resource that can be converted into energy, nutrients, and bio-based products [4,28]. The estimated increase in STR energy potential suggests that livestock manure could contribute to renewable energy generation through anaerobic digestion, biogas production, and biomethane upgrading [4,12]. At the same time, the parallel increases in STR N and P indicate that manure biorefineries should not be interpreted only as energy technologies. Their broader value lies in the integrated recovery of energy and nutrients, contributing simultaneously to renewable energy production, nutrient recycling, and reduced dependence on mineral fertilisers [10,11]. Recoverable N and P represent both potential circular-economy resources and possible nutrient-management burdens. Their practical value depends on whether recovered nutrients can replace mineral fertilisers or be redistributed to nutrient-deficient areas. In livestock-dense regions, high N and P quantities may instead indicate surplus pressure, requiring digestate treatment, transport, nutrient planning and regulatory control.
The decline in mean energy potential per capita provides an important qualification to the overall positive trend. Although the large cross-country manure-derived energy potential increased in absolute terms, the per capita indicator decreased, suggesting that livestock manure valorisation alone cannot compensate for demographic growth or rising energy demand. This finding supports the interpretation that manure biorefineries should be viewed as one component of a broader circular-bioeconomy and renewable-energy portfolio, rather than as a stand-alone solution. Their main value may be greatest where they are integrated into regional livestock systems, fertiliser-replacement strategies, waste-management policy, and decentralised energy production. These results should be interpreted as theoretical resource indicators. They show how livestock stocks translate into comparable estimates of manure mass, STR CH4, gross methane energy, recoverable nutrients and recoverable-CH4 CO2e value under fixed assumptions. They do not measure feasible collection, operational recovery, economic viability or policy-ready implementation potential.
The energy results should be interpreted as gross methane energy content, not operational energy supply. Usable energy would depend on digester heating, pumping, mixing, methane leakage, gas cleaning, upgrading, compression, generator efficiency, plant availability, transport and storage. Therefore, the estimates are best viewed as comparative resource potential indicators.
The country rankings further demonstrate the importance of distinguishing between total and per capita potential. India, Brazil, China, the USA, and Pakistan showed the highest total STR energy potential in 2023. These countries ranked highly because of their large livestock populations and large total manure resource bases, a pattern consistent with previous manure-biogas assessments showing that total biogas potential is strongly driven by livestock numbers and manure availability [13,23]. From an infrastructure-planning perspective, these countries may offer the greatest absolute manure-resource potential for large-scale manure biorefineries, regional anaerobic digestion networks, biomethane production and nutrient-recovery systems, because spatial concentration and feedstock volume are key factors for the siting and economic performance of manure-based anaerobic digestion facilities [4,29,35]. However, a large total potential does not necessarily mean that manure valorisation is equally important relative to population size, land area, or national energy demand. Therefore, total potential should be interpreted alongside population-standardised and spatial indicators when identifying where manure biorefineries may contribute most strongly to national circular-bioeconomy and renewable-energy strategies [4,23].
The per capita ranking produced a different pattern. Uruguay, New Zealand, Paraguay, Ireland, and Argentina showed the highest STR energy potential per inhabitant. These countries are characterised by relatively high livestock density in relation to population size, indicating that manure valorisation may have particular strategic relevance in livestock-intensive economies, even when their total national potential is smaller than that of larger countries. This interpretation is consistent with manure-resource assessments showing that biogas potential depends not only on total livestock numbers, but also on livestock density, manure availability, spatial distribution, and the scale at which the indicator is expressed [13,23,35]. In such contexts, manure biorefineries may contribute not only to renewable energy generation but also to nutrient circularity, agricultural sustainability and improved manure management [1,4,8]. Therefore, total and per capita indicators identify different but complementary interpretations of manure-resource potential: large absolute resource magnitude in major livestock-producing countries, and high population-standardised resource intensity in livestock-intensive countries with smaller populations.
Per capita indicators provide useful contrast with absolute national totals, but they are not the only relevant normalisation. They mainly identify countries with large livestock resources relative to population size, such as Uruguay, New Zealand, Paraguay and Ireland. For policy design, alternative denominators may be more informative, including energy demand, fertiliser consumption, agricultural land, livestock-sector emissions, existing biogas capacity or livestock output. A composite opportunity index was not retained because min–max scaling is sensitive to extreme country values and can compress differences among countries with intermediate values. Interpreting the component indicators separately avoids this scaling problem and makes the meaning of each result clearer.
The species contribution analysis showed that cattle were the dominant source of estimated manure production, accounting for more than three-quarters of the total manure resource. This finding indicates that the cross-country manure biorefinery potential estimated in this study is primarily cattle-driven. This is consistent with the large body size, high daily manure output, and cross-country distribution of cattle production systems, which make cattle manure a major substrate in manure management and biogas assessments [4,12,23,35,36]. Buffaloes represented the second-largest contribution, reflecting their importance in several Asian livestock systems. Pigs, poultry, sheep, and goats contributed smaller cross-country shares, but they may still be important at the national or regional scale because manure-resource potential depends on livestock species composition and regional production structure [13,23,35]. This is relevant because manure streams differ in dry matter, volatile-solids content, nutrient concentration, collection feasibility, and suitability for anaerobic digestion [8,12]. Consequently, manure-biorefinery strategies should be species-specific rather than based only on total manure volume.
The dominance of cattle manure has practical implications. Cattle systems often generate large volumes of manure with relatively low nutrient concentration compared with poultry manure, which may favour centralised or farm-scale anaerobic digestion where collection and transport are feasible [4,35]. Poultry manure, although contributing a smaller cross-country manure mass, has a higher nutrient concentration and organic matter content and may therefore be more relevant for nutrient recovery, biofertilizer production, and partial substitution of mineral fertilisers [8,11,37]. Pig manure can be suitable for anaerobic digestion because of its slurry characteristics and methane potential, particularly in intensive production regions where collection is easier and manure streams are more concentrated [12,13]. Small ruminant manure may be locally relevant in dryland or pastoral systems, but collection may be more difficult where animals are extensively managed, and manure is dispersed across grazing areas [4,23]. Therefore, the technical potential estimated in this study should be interpreted alongside manure-management systems, housing patterns, collection logistics, and regional production structures.
The k-means clustering and PCA biplot provided an exploratory multivariate summary of the country-level manure-resource indicators. However, diagnostics indicate that clusters require cautious interpretation. Per capita variables were nearly redundant, species shares were compositional, and centred-log-ratio sensitivity showed low agreement with the original solution. Thus, clusters are not independent typologies or policy-ready classifications. Their value is descriptive screening of resource scale, per capita intensity and species composition; operational recommendations require collectability, housing, infrastructure, cost and policy data conditions.
This type of multivariate approach is useful because manure-resource potential is influenced simultaneously by total feedstock availability, species composition, spatial concentration, nutrient content, methane potential, and collection feasibility, rather than by a single variable alone [4,29,35]. The retained four-cluster solution showed that countries can be grouped into exploratory manure-resource profiles according to total STR gross methane energy potential, per capita STR gross methane energy potential, per capita STR N and STR P, and species composition. Recoverable-CH4 CO2e variables were excluded from clustering and PCA because they duplicate the same STR CH4 base represented through STR gross methane energy potential. Previous manure-biogas and manure-management studies have similarly used spatial grouping, clustering, prediction models, or multivariate assessment to identify areas or systems with different biogas potential, manure availability, or methane-emission profiles [21,23,29]. The first cluster represented high per capita cattle-intensive potential and included countries such as Uruguay, New Zealand, Paraguay, Ireland, Argentina, Australia, Brazil, and Bolivia. These countries may be particularly suitable for manure valorisation strategies linked to ruminant production, pasture-based or mixed livestock systems, and national circular-bioeconomy planning, because livestock can contribute to circular bioeconomy systems by converting non-edible biomass into food while returning manure as a resource for bioenergy and nutrient recycling [1,8].
The second cluster represented high absolute-potential mixed large systems, including China, Egypt, India, Pakistan, and the Philippines. These countries may require different policy and infrastructure approaches because the total resource base is large, but the livestock structure is more diverse and may include substantial buffalo, pig, poultry or small-ruminant contributions. Previous manure-biogas assessments have shown that resource potential differs strongly by animal category, manure quantity, manure characteristics and regional distribution, meaning that large national totals often require subnational targeting rather than uniform national implementation [21,23,29]. In these systems, manure valorisation may depend on regional targeting, feedstock mapping and site selection for centralised or decentralised anaerobic digestion infrastructure [23,29]. The third cluster grouped countries with stronger small-ruminant, goat, and poultry influence, suggesting that manure-biorefinery strategies in these contexts should consider different manure types, drier production systems, and potentially more dispersed resource availability, since manure collection feasibility and digestion performance vary by livestock species and production system [4,12]. The fourth and largest cluster represented moderate mixed cattle-pig systems, indicating a broad group of countries where manure valorisation opportunities exist but may require more selective, region-specific implementation. This supports the interpretation that manure-biorefineries planning should combine national potential estimates with regional manure availability, species composition, transport distance, and infrastructure suitability [23,29,35].
The PCA biplot confirmed that per capita intensity variables were important in separating high relative-potential countries from other systems, while species-composition vectors helped distinguish small-ruminant-, poultry-, buffalo-, and cattle-influenced profiles. This is useful because biorefinery planning depends not only on the quantity of manure available but also on the structure of the livestock sector, manure characteristics, spatial distribution, collection feasibility, and site suitability [4,29,35]. Countries with similar total energy potential may require different technological pathways if their manure resource is derived mainly from cattle, pigs, poultry, buffaloes, or small ruminants, because manure type affects methane yield, nutrient content, digestion performance, and the suitability of centralised or decentralised anaerobic digestion systems [12,21]. The clustering approach should therefore be used only as descriptive screening. It identifies broad manure-resource profiles, but operational recommendations require country- or region-specific data on manure collectability, livestock housing, grazing, farm concentration, infrastructure, costs and policy conditions. The clustering analysis was also revised to avoid double weighting methane-derived information. Because STR gross methane energy potential and recoverable-CH4 CO2e value are direct transformations of the same STR CH4 quantity, recoverable-CH4 CO2e value was removed from the clustering input set. Even after this correction, the moderate stability diagnostics indicate that the clusters should be used only for descriptive screening [23,29].
The time-series forecast showed that future manure-related CH4-equivalent trajectories are strongly dependent on the scale of manure-biorefinery adoption and additional emission-intensity reduction. This interpretation is consistent with studies showing that manure-management choices, anaerobic digestion deployment, and biogas recovery can substantially alter the greenhouse-gas profile of livestock manure systems [4,20]. The scenario analysis should be interpreted as an assumption-based sensitivity exercise applied to the recoverable-CH4 CO2e indicator, not as an empirical emissions or mitigation model. The reduction in scenario-adjusted recoverable-CH4 CO2e value under higher adoption assumptions follows directly from the scenario-adjustment equation. Therefore, the scenarios do not estimate actual emission reductions, remaining emissions, avoided emissions or feasible deployment pathways. Their purpose is to illustrate how sensitive the recoverable-CH4 CO2e trajectory is to author-defined adoption and technical-intensity assumptions. This indicates that high adoption of manure biorefineries, combined with further improvements in emission intensity, could substantially reduce the theoretical manure CH4e burden, particularly when anaerobic digestion, methane capture, digestate management, and nutrient recovery are integrated within manure-management systems [4,20].
The forecast should be interpreted cautiously because the projection horizon to 2050 exceeds the 24-year historical series. Although rolling-origin validation compared short-horizon performance with simpler benchmark models, this does not establish reliable long-term predictive accuracy. Moreover, the forecasted variable is a deterministic transformation of livestock stocks under fixed coefficients. Therefore, the ARIMA results are useful only as transparent exploratory trajectories, not as structural predictions of future livestock systems. These forecast scenarios should not be interpreted as predictions of observed future emissions, but as model-based trajectories under alternative assumptions. The 2050 scenario values show how the recoverable-CH4 CO2e trajectory responds to alternative adoption and technical-intensity assumptions; they should not be interpreted as forecasts in a strong predictive sense. Their value lies in showing the sensitivity of long-term outcomes to adoption rates and technological improvement, as scenario-based modelling is useful for evaluating how different manure-management and mitigation pathways may alter future livestock-system emissions [21,38,39]. The widening separation between the scenarios after 2030 suggests that policy and investment decisions made in the next decade could strongly influence the long-term mitigation potential of manure valorisation. In particular, the best-case pathway implies that manure biorefineries are most effective when combined with broader technical improvements, such as better manure collection, covered storage, optimised anaerobic digestion, biomethane upgrading, improved digestate handling and nutrient-recovery technologies [4,11,13,20].
The scenario analysis should be interpreted as an assumption-based sensitivity exercise rather than as an empirical adoption model. The reduction in scenario-adjusted recoverable-CH4 CO2e value under higher adoption assumptions follows directly from the adjustment equation. Therefore, the scenarios do not show that 10%, 35% or 70% adoption is feasible, nor do they estimate country-specific implementation pathways. Their purpose is to illustrate how strongly the projected recoverable-CH4 CO2e value responds to different adoption and technical-intensity assumptions. Implementation modelling would require data on manure collectability, housing, grazing, infrastructure, costs, prices, incentives and institutional capacity.
The results also highlight that manure valorisation should be considered as part of integrated livestock-system transformation. The low-, medium- and high-adoption rates were author-defined illustrative assumptions used to span conservative, intermediate and high adjustment levels. They were not derived from observed deployment data and should not be interpreted as predicted adoption rates, feasible implementation pathways or country-specific policy targets. The reduction in scenario-adjusted recoverable-CH4 CO2e value under higher adoption assumptions follows directly from the adjustment equation. Their purpose is therefore to illustrate how strongly the projected recoverable-CH4 CO2e value responds to different adoption and technical-intensity assumptions. Implementation modelling would require data on manure collectability, housing, grazing, infrastructure, costs, prices, incentives, policy support and institutional capacity.
Anaerobic digestion can reduce uncontrolled CH4 losses from manure while producing renewable energy, but its effectiveness depends on collection efficiency, the manure-management baseline, digestion performance, leakage control, digestate storage, and final nutrient use [4,17]. If digestate is poorly managed, part of the environmental benefit may be lost through ammonia volatilisation, N2O emissions, or nutrient runoff, particularly when digestate treatment, storage, utilisation, and final disposal are not fully considered [11,17]. Therefore, manure biorefineries should be designed as integrated resource-recovery systems rather than only as biogas facilities. Energy recovery, nutrient recycling, emissions mitigation, and agronomic use of digestate need to be considered together to maximise environmental benefits and avoid burden shifting between climate, air-quality, and nutrient-loss impacts [4,11,40].
Several limitations should be acknowledged. The study estimated theoretical potential using livestock stock data and standardised species-specific coefficients, which improved transparency and comparability but did not capture country-specific variation in breed, body weight, diet, housing, productivity, manure dry matter, manure management systems or collection feasibility. The 50-country balanced panel is an important limitation. Requiring complete livestock and population data improved comparability but excluded countries and territories with incomplete or inconsistent records, so estimates are not a full global census. Regional or income-group bias may remain if data completeness relates to livestock structure, manure management, infrastructure or technology adoption. Future work should use unbalanced panels, imputation or data-quality weighting. Absolute indicators structurally depend on livestock stocks.
“Standardised theoretical-resource potential” therefore denotes a theoretical fraction under fixed species-level assumptions, not observed recovery. Actual recoverability varies with housing, grazing, manure handling, farm structure, infrastructure, logistics, policy support and technology availability across countries. The study did not assess regional nutrient balances, crop nutrient demand, fertiliser substitution, digestate transport, soil application limits or agricultural land availability. Therefore, recoverable N and P should be interpreted as theoretical nutrient-resource quantities, not as direct evidence of net fertiliser benefit or environmental improvement.
The composite STR CH4 fraction did not separately estimate manure collectability, realised digester bioconversion or gas capture efficiency. These processes differ technically and operationally, and future work should model them separately where country- and system-specific data are available.
The recoverability factors also represent simplified technical assumptions, since the proportion of manure that can be collected and treated depends on whether animals are housed, grazed, intensively managed, or kept in extensive systems. The recoverable-CH4 CO2e value should therefore be interpreted as the CO2-equivalent value of STR CH4 under fixed assumptions, not as observed national manure emissions, avoided emissions or net mitigation.
The study did not normalise manure-resource indicators by electricity demand, natural-gas demand, fertiliser consumption, agricultural land, livestock-sector emissions, existing biogas capacity or livestock output. These denominators could generate different policy interpretations and should be incorporated in future work where harmonised country-level data are available. The study did not estimate net usable energy. The energy indicator excludes parasitic energy use, methane leakage, conversion efficiency, gas upgrading, compression, transport, storage and plant availability. Future work should convert gross CH4 energy into net electricity, heat or biomethane using country- and technology-specific performance assumptions.
Clustering and coefficient uncertainty remain limitations. Some clustering inputs were correlated transformations of livestock stocks, combining total and per capita indicators with compositional species shares. The centred-log-ratio sensitivity analysis changed the four-cluster solution, so clusters should be viewed as exploratory manure-resource profiles, not definitive or causal classifications. Coefficient-uncertainty intervals used standardised proportional bounds, not country-, breed- or system-specific distributions, and capture only partial uncertainty. More detailed estimates require data on live weight, diet, housing, grazing, manure management, climate and technology performance. The omitted factors are central to feasibility. Breed, body weight, diet, housing, grazing, manure management, collection logistics, farm concentration, infrastructure, costs, regulation and technology adoption determine whether theoretical manure resources can be valorised in practice. Therefore, the results represent standardised theoretical potential, not realistic country-specific opportunities.
The CH4, N and P adjustment fractions were author-defined standardised assumptions rather than empirical technical recovery coefficients. They were used to construct comparable theoretical resource indicators across the 50-country panel, but they do not represent country-specific manure collectability, digester performance, gas capture, nutrient-recovery technology or realised operational efficiency.
The analysis also did not include economic feasibility, infrastructure availability, policy incentives, energy and fertiliser prices, transport distance, farm size or regulatory constraints, all of which influence the conversion of theoretical potential into operational biorefinery capacity. Finally, the forecast scenarios assumed linear adoption to 2050, whereas real-world adoption is likely to depend on technology costs, policy support, carbon markets, grid access, farmer participation and institutional capacity. Moreover, this study assumes constant CH4, N, and P recovery efficiencies over the 2000–2023 period. As recovery technologies have likely improved over time, this assumption may underestimate temporal changes in the recoverable resource potential. Therefore, the results should be interpreted as comparative technical scenarios rather than implementation forecasts. A structural scenario model would be more informative for long-term planning. Such a model would require future livestock populations, species composition, productivity, dietary demand, manure-management systems, technology adoption, infrastructure, costs and policy assumptions. These data were unavailable; therefore, the present forecast remains a univariate exploratory sensitivity analysis.
Despite these limitations, the study provides a transparent and reproducible framework for comparing manure-based biorefinery potential across countries and over time. The combination of total indicators, per capita indicators, species contribution analysis, clustering, and time-series forecasting provides a more complete interpretation than any single metric alone. The approach identifies where absolute potential is greatest, where manure valorisation may be most important relative to population size, which livestock species dominate the resource base, which countries share similar manure-biorefineries profiles, and how future emissions trajectories may differ under alternative adoption scenarios.
Future research should improve the framework by incorporating country-specific manure-management systems, livestock productivity data, animal live weight, housing duration, grazing intensity, manure collection rates, and existing biogas infrastructure. Further work should also link technical potential with techno-economic analysis, life-cycle assessment, nutrient-balance modelling, and policy scenarios. At finer spatial scales, regional or subnational datasets would allow a more realistic assessment of manure availability, transport logistics, plant siting, digestate use, and connection to energy grids or biomethane networks. Finally, future studies should evaluate how manure biorefineries interact with broader livestock sustainability strategies, including dietary mitigation, improved herd productivity, manure storage technologies, nutrient management planning, and circular fertiliser markets.
Altogether, the findings show that livestock manure represents a substantial and increasing theoretical resource within the 50-country panel analysed. es. Large livestock-producing countries showed the greatest total standardised theoretical resource energy potential, livestock-intensive countries showed the highest per capita energy potential, and cattle dominated the cross-country manure resource base. These findings should be interpreted as evidence from a large balanced cross-country panel, not as complete global estimates for all countries and territories. The scenario analysis further illustrates that the recoverable-CH4 CO2e trajectory is highly sensitive to the assumed adoption and technical-intensity adjustments. These results should be interpreted as assumption-based sensitivity outputs rather than evidence that particular levels of manure-biorefinery deployment will be achieved by 2050. These results support the inclusion of manure valorisation within the circular bioeconomy, renewable energy, nutrient recovery, and livestock-climate mitigation strategies.


5. Conclusions

The study provides a standardised 50-country comparison of theoretical livestock manure-resource potential. It identifies broad differences in manure mass, STR CH4, gross methane energy, nutrient quantities and recoverable-CH4 CO2e value under fixed species-level assumptions. These estimates should be interpreted as screening indicators, not as evidence of feasible country-specific biorefinery deployment. Between 2000 and 2023, total estimated manure production increased from 29.25 to 33.18 Gt, while STR N, STR P and recoverable-CH4e value also increased. Mean STR gross methane energy potential per capita declined, indicating that absolute theoretical resource growth did not keep pace with population growth. India, Brazil, China, USA, and Pakistan had the greatest absolute STR energy potential, suggesting stronger suitability for large-scale infrastructure planning. In contrast, Uruguay, New Zealand, Paraguay, Ireland, and Argentina had the highest per capita values. These rankings reflect different interpretations of manure-resource magnitude and population-standardised intensity. They should not be interpreted as direct policy-priority rankings, because alternative denominators such as energy demand, fertiliser consumption, agricultural land, livestock emissions, biogas capacity or livestock output could generate different country orderings.
Cattle accounted for more than three-quarters of the total manure production, indicating that the 50-country manure-resource base was mainly cattle-driven. The exploratory clustering analysis summarised broad manure-resource profiles, but the clusters should not be interpreted as definitive country typologies or policy-ready classifications. The illustrative adoption scenarios showed that scenario-adjusted recoverable-CH4 CO2e values are sensitive to adoption and technical-intensity assumptions. Because these 2050 values were derived from an exploratory ARIMA trajectory based on only 24 annual observations, they should be interpreted as model-dependent sensitivity outputs, not as strong long-term forecasts or implementation predictions. These adoption rates were illustrative assumptions rather than empirically derived deployment estimates, so the 2050 values should be interpreted only as model-dependent sensitivity outputs. Altogether, the study provides a reproducible theoretical framework for comparing livestock manure-resource indicators across countries and over time.

Author Contributions

Conceptualisation, F.M.; methodology, F.M. and J.A.; investigation, F.M., J.A., J.C., G.P. and J.S.; writing—original draft preparation, F.M., J.A., J.C., G.P., P.V., M.J. and J.S.; writing—review and editing, F.M., J.A., J.C., G.P., P.V., M.J. and J.S.; supervision, F.M. All authors have read and agreed to the published version of the manuscript.

Funding

To the Foundation for Science and Technology (FCT, Portugal) for financial support to CISAS UID/05937/2025.

Institutional Review Board Statement

Not applicable.

Informed Consent Statement

Not applicable.

Data Availability Statement

The full dataset can be accessed at ResearchGate: http://doi.org/10.13140/RG.2.2.19343.55204 [31].

Conflicts of Interest

The authors declare no conflicts of interest.

Appendix A

Table A1. Standardised theoretical resource energy potential in 2023. Data for the 50 countries analysed.
RankCountryRegionSTR Energy (GWh/year)Manure Production (Mt/year)STR N (kt/year)STR P (kt/year)
1IndiaAsia655,314620215,5183240
2BrazilAmericas555,677497812,9842862
3ChinaAsia549,683398212,9293358
4USAAmericas275,910217963291532
5PakistanAsia240,484210056431245
6EthiopiaAfrica157,60815043828798
7ArgentinaAmericas136,08111583166720
8IndonesiaAsia128,4095952781835
9MexicoAmericas98,2048142285533
10TanzaniaAfrica81,2607611944412
11ColombiaAmericas72,1326231675379
12BangladeshAsia65,6635561545350
13AustraliaOceania62,7375911584332
14RussiaEurope/Asia61,5004701437356
15NigeriaAfrica60,9355591584339
16KenyaAfrica51,6384891271266
17TürkiyeEurope/Asia49,6824171218276
18IranAsia46,8982811113297
19FranceEurope46,5613911088253
20VietnamAsia38,681254870236
21GermanyEurope34,624280804196
22South AfricaAfrica32,042277776174
23CanadaAmericas31,880263739176
24ParaguayAmericas31,192290732157
25SpainEurope30,195231724186
26BoliviaAmericas28,887231675160
27UKEurope28,602241703161
28UruguayAmericas26,569251632133
29New ZealandOceania24,319228605127
30EgyptAfrica22,353188521118
31ThailandAsia21,725143486131
32PolandEurope21,672159493126
33ItalyEurope20,712161484119
34PhilippinesAsia18,976138432110
35PeruAmericas18,459144436105
36JapanAsia18,219111404113
37IrelandEurope16,22015038683
38South KoreaAsia15,23510334493
39NetherlandsEurope13,91910532282
40MoroccoAfrica13,78810134884
41Saudi ArabiaAsia13,4014229395
42UkraineEurope11,4946925672
43ChileAmericas87096920449
44RomaniaEurope79605919749
45BelgiumEurope78516218245
46DenmarkEurope76475817948
47PortugalEurope51103912030
48CzechiaEurope4052339422
49HungaryEurope3810278823
50GreeceEurope3155258620
Note: STR, “Standardised theoretical-resource” refers to theoretical potential estimated using fixed species-specific recovery assumptions. It should not be interpreted as observed or operationally achievable country-specific recovery.
Table A2. Per capita (cap) standardised theoretical resource energy potential in 2023. Data for the 50 countries analysed.
RankCountryRegionSTR Energy (kWh/cap/yr)Manure (t/cap/yr)STR N (kg/cap/yr)STR P (kg/cap/yr)
1UruguayAmericas7761.773.24184.7238.95
2New ZealandOceania4656.143.73115.8824.40
3ParaguayAmericas4545.942.24106.7022.87
4IrelandEurope3082.428.5873.3615.77
5ArgentinaAmericas2972.925.3069.1715.73
6BrazilAmericas2567.623.0059.9913.22
7AustraliaOceania2355.122.1959.4612.48
8BoliviaAmericas2331.718.6854.4712.91
9ColombiaAmericas1384.911.9632.157.28
10DenmarkEurope1285.89.7930.108.02
11EthiopiaAfrica1245.611.8930.256.31
12TanzaniaAfrica1205.011.2928.836.10
13PakistanAsia1000.08.7323.475.18
14KenyaAfrica937.28.8823.064.83
15USAAmericas823.86.5118.904.57
16CanadaAmericas795.16.5618.444.40
17NetherlandsEurope781.55.8818.054.63
18MexicoAmericas756.96.2817.614.11
19FranceEurope683.05.7315.963.71
20BelgiumEurope670.35.2715.513.87
21SpainEurope624.24.7814.973.84
22PolandEurope590.74.3413.443.42
23TürkiyeEurope/Asia582.34.8814.273.23
24PeruAmericas537.34.1812.703.06
25South AfricaAfrica530.44.5812.842.87
26IranAsia525.93.1512.483.33
27PortugalEurope485.53.7511.442.81
28IndonesiaAsia462.72.1410.023.01
29IndiaAsia458.74.3410.862.27
30ChileAmericas443.73.5410.412.51
31RussiaEurope/Asia427.63.279.992.48
32UKEurope418.53.5310.292.35
33RomaniaEurope417.53.1010.332.56
34GermanyEurope409.83.319.512.32
35HungaryEurope396.72.799.152.40
36VietnamAsia391.32.578.802.39
37ChinaAsia389.72.829.162.38
38BangladeshAsia379.73.218.942.03
39CzechiaEurope372.63.048.622.06
40MoroccoAfrica364.42.679.192.22
41Saudi ArabiaAsia362.71.137.932.58
42ItalyEurope351.82.738.232.02
43UkraineEurope312.81.876.971.95
44GreeceEurope304.52.418.341.93
45ThailandAsia302.61.996.771.82
46South KoreaAsia294.62.006.661.80
47NigeriaAfrica272.32.507.081.52
48EgyptAfrica198.31.674.621.05
49PhilippinesAsia161.71.183.680.94
50JapanAsia146.30.893.250.91
Note: STR, “standardised theoretical-resource” refers to theoretical potential estimated using fixed species-specific recovery assumptions. It should not be interpreted as observed or operationally achievable country-specific recovery.

References

  1. McAllister, T.A.; Becquet, P.; Amon, B.R.; LEAP, T.A.G.; Lee, M.R.F. Role of Livestock in Circular Bioeconomy Systems. Anim. Front. 2025, 15, 7–15. [Google Scholar] [CrossRef] [Scilit] [PubMed]
  2. Van Eenennaam, A.L. Addressing the 2050 Demand for Terrestrial Animal Source Food. Proc. Natl. Acad. Sci. USA 2024, 121, e2319001121. [Google Scholar] [CrossRef] [Scilit] [PubMed]
  3. Vorndran, A.M.; Steinhoff-Wagner, J.; Windisch, W. 421 Inherent Livestock Feed Production: Abundance of Non-Edible Biomass in the Agricultural and Processing Sector in Germany. J. Anim. Sci. 2023, 101, 155–156. [Google Scholar] [CrossRef] [Scilit]
  4. Khoshnevisan, B.; Duan, N.; Tsapekos, P.; Awasthi, M.K.; Liu, Z.; Mohammadi, A.; Angelidaki, I.; Tsang, D.C.W.; Zhang, Z.; Pan, J.; et al. A Critical Review on Livestock Manure Biorefinery Technologies: Sustainability, Challenges, and Future Perspectives. Renew. Sustain. Energy Rev. 2021, 135, 110033. [Google Scholar] [CrossRef] [Scilit]
  5. Zhang, X.; Wu, Z.; Wang, J.; Sha, Q. Emission Characteristics, Co-Drivers, and Mitigation Implications of NH3, N2O, and CH4 from Livestock Manure in China from 2013 to 2023. Toxics 2025, 13, 933. [Google Scholar] [CrossRef] [Scilit] [PubMed]
  6. Liu, Y.; Tang, R.; Li, L.; Zheng, G.; Wang, J.; Wang, G.; Bao, Z.; Yin, Z.; Li, G.; Yuan, J. A Global Meta-Analysis of Greenhouse Gas Emissions and Carbon and Nitrogen Losses during Livestock Manure Composting: Influencing Factors and Mitigation Strategies. Sci. Total Environ. 2023, 885, 163900. [Google Scholar] [CrossRef] [Scilit] [PubMed]
  7. Rivera, J.E.; Chará, J. CH4 and N2O Emissions from Cattle Excreta: A Review of Main Drivers and Mitigation Strategies in Grazing Systems. Front. Sustain. Food Syst. 2021, 5, 657936. [Google Scholar] [CrossRef] [Scilit]
  8. Arsic, M.; Abdalla, A.L.; Dong, H.; Loyon, L.; Packer, A.P.C.; Saha, C.K.; Si, B.; Meo Zilio, D.; Amon, B.R. Circular Bioeconomy Approaches for Livestock Manure and Post-Consumer Wastes: Opportunities for Biofertilizers and Bioenergy. Anim. Front. 2025, 15, 54–64. [Google Scholar] [CrossRef] [Scilit] [PubMed]
  9. Alengebawy, A.; Ran, Y.; Osman, A.I.; Jin, K.; Samer, M.; Ai, P. Anaerobic Digestion of Agricultural Waste for Biogas Production and Sustainable Bioenergy Recovery: A Review. Environ. Chem. Lett. 2024, 22, 2641–2668. [Google Scholar] [CrossRef] [Scilit]
  10. Abbà, A.; Domini, M.; Baldi, M.; Pedrazzani, R.; Bertanza, G. Ammonia Recovery from Livestock Manure Digestate through an Air-Bubble Stripping Reactor: Evaluation of Performance and Energy Balance. Energies 2023, 16, 1643. [Google Scholar] [CrossRef] [Scilit]
  11. Martín-Sanz-Garrido, C.; Revuelta-Aramburu, M.; Santos-Montes, A.M.; Morales-Polo, C. A Review on Anaerobic Digestate as a Biofertilizer: Characteristics, Production, and Environmental Impacts from a Life Cycle Assessment Perspective. Appl. Sci. 2025, 15, 8635. [Google Scholar] [CrossRef] [Scilit]
  12. Kadam, R.; Jo, S.; Lee, J.; Khanthong, K.; Jang, H.; Park, J. A Review on the Anaerobic Co-Digestion of Livestock Manures in the Context of Sustainable Waste Management. Energies 2024, 17, 546. [Google Scholar] [CrossRef] [Scilit]
  13. Khan, M.U.; Lee, J.T.E.; Bashir, M.A.; Dissanayake, P.D.; Ok, Y.S.; Tong, Y.W.; Shariati, M.A.; Wu, S.; Ahring, B.K. Current Status of Biogas Upgrading for Direct Biomethane Use: A Review. Renew. Sustain. Energy Rev. 2021, 149, 111343. [Google Scholar] [CrossRef] [Scilit]
  14. Iglesias, R.; Muñoz, R.; Polanco, M.; Díaz, I.; Susmozas, A.; Moreno, A.D.; Guirado, M.; Carreras, N.; Ballesteros, M. Biogas from Anaerobic Digestion as an Energy Vector: Current Upgrading Development. Energies 2021, 14, 2742. [Google Scholar] [CrossRef] [Scilit]
  15. Francisco López, A.; Lago Rodríguez, T.; Faraji Abdolmaleki, S.; Galera Martínez, M.; Bello Bugallo, P.M. From Biogas to Biomethane: An In-Depth Review of Upgrading Technologies That Enhance Sustainability and Reduce Greenhouse Gas Emissions. Appl. Sci. 2024, 14, 2342. [Google Scholar] [CrossRef] [Scilit]
  16. Tawfik, A.; Eraky, M.; Alhajeri, N.S.; Osman, A.I.; Rooney, D.W. Cultivation of Microalgae on Liquid Anaerobic Digestate for Depollution, Biofuels and Cosmetics: A Review. Environ. Chem. Lett. 2022, 20, 3631–3656. [Google Scholar] [CrossRef] [Scilit]
  17. Wang, X.; Wang, J.; Duan, C.; Wang, X.; Liang, D. Systematic Review on the Life Cycle Assessment of Manure-Based Anaerobic Digestion System. Sustainability 2025, 17, 8926. [Google Scholar] [CrossRef] [Scilit]
  18. Nugrahaeningtyas, E.; Lee, J.-S.; Park, K.-H. Greenhouse Gas Emissions from Livestock: Sources, Estimation, and Mitigation. J. Anim. Sci. Technol. 2024, 66, 1083–1098. [Google Scholar] [CrossRef] [Scilit] [PubMed]
  19. Dong, H.; MacDonald, J.; Ogle, S.; Sanchez, M.; Rocha, M. Chapter 10: Emissions from Livestock and Manure Management. In 2006 IPCC Guidelines for National Greenhouse Gas Inventories; Agriculture, Forestry and Other Land Use, Prepared by the National Greenhouse Gas Inventories Programme; Buendia, E., Tanabe, K., Kranjc, A., Jamsranjav, B., Fukuda, M.S., Ngarize, S., Osako, A., Pyrozhenko, Y., Shermanau, P., Federici, S., Eds.; Intergovernmental Panel on Climate Change (IPCC): Geneva, Switzerland, 2006; Volume 4. [Google Scholar]
  20. Symeon, G.K.; Akamati, K.; Dotas, V.; Karatosidi, D.; Bizelis, I.; Laliotis, G.P. Manure Management as a Potential Mitigation Tool to Eliminate Greenhouse Gas Emissions in Livestock Systems. Sustainability 2025, 17, 586. [Google Scholar] [CrossRef] [Scilit]
  21. Pence, I.; Kumaş, K.; Cesmeli, M.S.; Akyüz, A. Future Prediction of Biogas Potential and CH4 Emission with Boosting Algorithms: The Case of Cattle, Small Ruminant, and Poultry Manure from Turkey. Environ. Sci. Pollut. Res. 2024, 31, 24461–24479. [Google Scholar] [CrossRef] [Scilit] [PubMed]
  22. Ye, X.; Shen, C.; Zhang, J. Regional Characteristics of Livestock and Poultry Manure Production and Sustainable Resource Utilisation Technologies in China—A Review. Sustainability 2026, 18, 1844. [Google Scholar] [CrossRef] [Scilit]
  23. Mahal, Z.; Yabar, H. Spatial Estimation of Biogas and Compost Potential for Sustainable Livestock Manure Management in Bangladesh. Appl. Sci. 2025, 15, 6753. [Google Scholar] [CrossRef] [Scilit]
  24. Food and Agriculture Organization of the United Nations. FAOSTAT: Crops and Livestock Products 2025; Food and Agriculture Organization of the United Nations: Rome, Italy, 2025. [Google Scholar]
  25. World Bank. World Bank Population, Total (SP.POP.TOTL). In World Development Indicators; World Bank: Washington, DC, USA, 2025. [Google Scholar]
  26. Weldesemayat Sileshi, G.; Barrios, E.; Lehmann, J.; Tubiello, F.N. An Organic Matter Database (OMD): Consolidating Global Residue Data from Agriculture, Fisheries, Forestry and Related Industries. Earth Syst. Sci. Data 2025, 17, 369–391. [Google Scholar] [CrossRef] [Scilit]
  27. Hilgert, J.E.; Herrmann, C.; Petersen, S.O.; Dragoni, F.; Amon, T.; Belik, V.; Ammon, C.; Amon, B. Assessment of the Biochemical Methane Potential of In-House and Outdoor Stored Pig and Dairy Cow Manure by Evaluating Chemical Composition and Storage Conditions. Waste Manag. 2023, 168, 14–24. [Google Scholar] [CrossRef] [Scilit] [PubMed]
  28. Ferrari, G.; Provolo, G.; Pindozzi, S.; Marinello, F.; Pezzuolo, A. Biorefinery Development in Livestock Production Systems: Applications, Challenges, and Future Research Directions. J. Clean. Prod. 2024, 440, 140858. [Google Scholar] [CrossRef] [Scilit]
  29. Díaz-Vázquez, D.; Alvarado-Cummings, S.C.; Meza-Rodríguez, D.; Senés-Guerrero, C.; de Anda, J.; Gradilla-Hernández, M.S. Evaluation of Biogas Potential from Livestock Manures and Multicriteria Site Selection for Centralized Anaerobic Digester Systems: The Case of Jalisco, México. Sustainability 2020, 12, 3527. [Google Scholar] [CrossRef] [Scilit]
  30. Şenol, H.; Çolak, E.; Oda, V. Forecasting of Biogas Potential Using Artificial Neural Networks and Time Series Models for Türkiye to 2035. Energy 2024, 302, 131949. [Google Scholar] [CrossRef] [Scilit]
  31. Mata, F.; Santos, J.; Jesus, M. Manure Biorefinary. 2026. Available online: https://www.researchgate.net/publication/408308940_Manure_Biorefinery?channel=doi&linkId=6a45234337be4e7a63c20304&showFulltext=true (accessed on 25 August 2026).
  32. ASAE/ASABE D384.2; ASAE Manure Production Characteristics. American Society of Agricultural and Biological Engineers: St. Joseph, MI, USA, 2005.
  33. Lorimor, J.; Powers, W.; Sutton, A. Manure Characteristics: MWPS-18; Manure Management Systems Series; MWPS: Ames, IA, USA, 2000. [Google Scholar]
  34. Cu, T.T.T.; Nguyen, T.X.; Triolo, J.M.; Pedersen, L.; Le, V.D.; Le, P.D.; Sommer, S.G. Biogas Production from Vietnamese Animal Manure, Plant Residues and Organic Waste: Influence of Biomass Composition on Methane Yield. Asian-Australas. J. Anim. Sci. 2014, 28, 280–289. [Google Scholar] [CrossRef] [Scilit] [PubMed]
  35. Scarlat, N.; Dallemand, J.-F.; Fahl, F. Biogas: Developments and Perspectives in Europe. Renew. Energy 2018, 129, 457–472. [Google Scholar] [CrossRef] [Scilit]
  36. Khan, S.; Jamal, M.A.; Khan, I.M.; Ullah, I.; Jabbar, A.; Khan, N.M.; Liu, Y. Factors Affecting Superovulation Induction in Goats (Capra hericus): An Analysis of Various Approaches. Front. Vet. Sci. 2023, 10, 1152103. [Google Scholar] [CrossRef] [Scilit] [PubMed]
  37. Song, Y.; Qiao, W.; Westerholm, M.; Huang, G.; Taherzadeh, M.J.; Dong, R. Microbiological and Technological Insights on Anaerobic Digestion of Animal Manure: A Review. Fermentation 2023, 9, 436. [Google Scholar] [CrossRef] [Scilit]
  38. Rotz, C.A.; Briggs, K.; Hristov, A.N.; Leytem, A.; Young, E.; Hagevoort, R.; Mullinax, D. Strategies for Mitigating Greenhouse Gas Emissions from US Dairy Farms toward a Net Zero Goal. J. Dairy Sci. 2025, 108, 9755–9777. [Google Scholar] [CrossRef] [Scilit] [PubMed]
  39. Rencricca, G.; Froldi, F.; Moschini, M.; Trevisan, M.; Lamastra, L. Mitigation Actions Scenarios Applied to the Dairy Farm Management Systems. Foods 2023, 12, 1860. [Google Scholar] [CrossRef] [Scilit] [PubMed]
  40. Dincă, M.-N.; Ferdeș, M.; Zăbavă, B.-Ș.; Ionescu, M.; Moiceanu, G.; Paraschiv, G. Effective Valorization of Anaerobic Digestate—A Sustainable Approach to Circular Economy. Appl. Sci. 2025, 15, 8939. [Google Scholar] [CrossRef] [Scilit]
Figure 1. Linear regressions for six manure-based biorefinery indicators from 2000 to 2023: total manure production, STR gross methane energy potential, standardised theoretical resource (STR) N, STR P, recoverable-CH4 CO2e value, and mean STR gross methane energy potential per capita. Points represent annual values and lines represent fitted linear regressions. Equations are displayed within each panel, with x = Year − 2000.
Agriculture 16 01872 g001
Figure 2. Annual trend in STR gross methane energy potential and recoverable-CH4 CO2e value, 2000–2023.
Agriculture 16 01872 g002
Figure 3. Top countries by total standardised theoretical resource gross methane energy potential in 2023.
Agriculture 16 01872 g003
Figure 4. Top countries by per capita STR gross methane energy potential in 2023.
Agriculture 16 01872 g004
Figure 5. Species contribution to total estimated manure production in 2023.
Agriculture 16 01872 g005
Figure 6. Exploratory K-means clustering visualised using PCA. Points represent countries, ellipses represent exploratory cluster grouping, and vectors represent standardised manure-resource indicators used in the clustering analysis. The biplot is descriptive and should not be interpreted as independent validation of the clusters. Recoverable-CH4 CO2e variables were excluded because they are direct transformations of STR CH4 already represented through STR gross methane energy potential.
Agriculture 16 01872 g006
Figure 7. Relationship between total STR gross methane energy potential and per capita STR gross methane energy potential by cluster. Country names: ISO 3166-1 alpha-3. Countries belonging to the different clusters can be consulted in Table 11 to avoid overlap confusion.
Agriculture 16 01872 g007
Figure 8. Time-series forecast of scenario-adjusted recoverable-CH4 CO2e value to 2050 under three illustrative adoption scenarios. Historical values are shown for 2000–2023. Forecasts from 2024 to 2050 were generated using an ARIMA model and then adjusted using scenario-specific assumptions for manure-biorefinery adoption and technical-intensity improvement. Shaded bands represent 95% confidence intervals. Values represent illustrative sensitivity outputs based on author-defined adoption assumptions and should not be interpreted as empirically derived adoption forecasts, observed emissions, avoided emissions, net greenhouse-gas mitigation or feasible deployment pathways.
Agriculture 16 01872 g008
Table 1. Species-specific coefficients and standardised adjustment fractions used to estimate theoretical manure-resource indicators.
SpeciesM Excretion (kg/head/d)VS
Fraction
BMP (m3CH4/tVS)N Cont (kgN/tM)P Cont (kg P/tM)CH4 Adjustment FractionN Adjustment FractionP Adjustment Fraction
Cattle55.000.082204.50.80.600.550.65
Buffalo50.000.082104.20.70.600.550.65
Pigs6.000.073005.81.50.700.600.70
Sheep2.500.092007.01.00.450.500.60
Goats2.000.092007.01.00.450.500.60
Poultry0.120.2532016.05.00.650.650.75
Notes: Manure excretion and nutrient-content values were harmonised from ASAE/ASABE D384.2 [32] and MWPS manure characteristics guidance [33]; volatile-solids and methane-estimation logic followed IPCC manure-management guidance [19]; biochemical methane-potential values were selected from Cu et al. [34]. The CH4, N and P adjustment fractions are author-defined standardised assumptions used to generate comparable theoretical resource indicators across countries and years. They are not empirical country-specific recoverability rates, observed technology efficiencies or direct literature-derived technical recovery coefficients. The central values were assigned using an ordinal species-level rationale: pigs and poultry were given higher CH4 or nutrient adjustment fractions because their manure is more commonly associated with housed or more concentrated systems; cattle and buffaloes were assigned intermediate values; sheep and goats were assigned lower values because manure collection is often less complete in extensive or grazing systems. These fractions were evaluated through coefficient-sensitivity analysis and should be interpreted as transparent modelling assumptions rather than measured recovery performance. Abbreviations: VS, volatile solids; BMP, biochemical methane potential; STR, standardised theoretical resource.
Table 2. General conversion factors used in the estimate STR gross methane energy potential and the CO2-equivalent value of standardised theoretical resource CH4.
ParameterValueUnitUse in Calculation
Ch4 energy content9.97kWh/m3 CH4Converts recoverable CH4 volume into STR gross methane energy potential
Methane density0.716kg/m3 CH4Converts CH4 volume into CH4 mass
CH4 GWP10027.2kg CO2e/kg CH4Converts STR CH4 mass into CO2-equivalent value
Table 3. Illustrative adoption-scenario definitions used for the time-series forecast of the recoverable-CH4 CO2e value to 2050.
ScenarioAdoption Adjustment by 2050Technical-Intensity Adjustment by 2050Implementation in the ForecastInterpretation
Low-adoption scenario10%0%ARIMA gross forecast multiplied by a scenario-adjustment factor declining to 0.90 by 2050Low adoption of manure biorefineries and limited technical progress
Medium-adoption scenario35%0%ARIMA gross forecast multiplied by a scenario-adjustment factor declining to 0.65 by 2050Moderate adoption of manure biorefineries
high-adoption scenario70%15%ARIMA gross forecast multiplied by a scenario-adjustment factor declining to 0.255 by 2050High adoption of manure biorefineries combined with additional technical-intensity adjustment
Note: Scenario values are illustrative sensitivity assumptions and should not be interpreted as predicted or empirically estimated adoption rates. The scenarios adjust the recoverable-CH4 CO2e reference trajectory; they do not estimate observed emissions, remaining emissions, avoided emissions, net greenhouse-gas mitigation, country-specific feasibility, investment cost, energy prices, carbon pricing, policy incentives, grid access, farm structure, transport distance, farmer participation or institutional capacity.
Table 4. Temporal change in manure-based biorefinery indicators, 2000–2023.
Indicator20002023Change% ChangeSlopeR2
Manure (Gt)29.2533.183.9313.440.1680.924
STR gross methane energy potential (TWh)3396.553977.83581.2817.1124.920.947
STR N potential (Mt)80.4393.5413.1116.300.5620.943
STR P potential (Mt)18.2721.713.4418.810.1470.954
Recoverable-CH4 CO2e value (Gt CO2e)6.637.771.1417.110.0490.947
Mean STR gross methane energy potentgial (kWh/capita)1241.651075.19−166.46−13.41−7.110.930
Note: STR, standardised theoretical resource.
Table 5. Top 10 countries by total standardised theoretical resource (STR) gross methane energy potential in 2023. Table A1 in Appendix A provides data for the 50 countries analysed.
RankCountryRegionSTR Gross Methane Energy Potential (GWh/yr)Manure (Mt/yr)STR N (kt/yr)STR P (kt/yr)
1IndiaAsia655,314620215,5183240
2BrazilAmericas555,677497812,9842862
3ChinaAsia549,683398212,9293358
4USAAmericas275,910217963291532
5PakistanAsia240,484210056431245
6EthiopiaAfrica157,60815043828798
7ArgentinaAmericas136,08111583166720
8IndonesiaAsia128,4095952781835
9MexicoAmericas98,2048142285533
10TanzaniaAfrica81,2607611944412
Note: “Standardised theoretical resource” refers to theoretical potential estimated using fixed species-specific recovery assumptions. It should not be interpreted as observed or operationally achievable country-specific recovery. Rankings are based on central estimates generated using the standardised coefficients in Table 1 and Table 2. Small differences between countries should be interpreted cautiously because coefficient uncertainty may affect precise rank order.
Table 6. Top 10 countries by per capita (cap) standardised theoretical resource (Rec.) gross methane energy potential in 2023.
RankCountryRegionSTR Gross Methane Energy
Potential (kWh/cap/yr)
Manure (t/cap)Rec. N (kg/cap)Rec. P (kg/cap)
1UruguayAmericas7761.773.24184.7238.95
2New ZealandOceania4656.143.73115.8824.40
3ParaguayAmericas4545.942.24106.7022.87
4IrelandEurope3082.428.5873.3615.77
5ArgentinaAmericas2972.925.3069.1715.73
6BrazilAmericas2567.623.0059.9913.22
7AustraliaOceania2355.122.1959.4612.48
8BoliviaAmericas2331.718.6854.4712.91
9ColombiaAmericas1384.911.9632.157.28
10DenmarkEurope1285.89.7930.108.02
Note: “Standardised theoretical-resource” refers to theoretical potential estimated using fixed species-specific recovery assumptions. It should not be interpreted as observed or operationally achievable country-specific recovery. Rankings are based on central estimates generated using the standardised coefficients in Table 1 and Table 2. Small differences between countries should be interpreted cautiously because coefficient uncertainty may affect precise rank order.
Table 7. Species contribution to estimated manure production in 2023.
SpeciesManure (Mt/yr)Share (%)
Cattle25,26876.15
Buffalo354510.68
Pig19625.91
Poultry10943.30
Sheep7882.37
Goat5241.58
Table 8. Correlation sensitivity analysis between livestock-stock variables and main absolute derived indicators in 2023.
Derived IndicatorPearson r with Total Livestock HeadsSpearman ρ with Total Livestock HeadsPearson r with Cattle HeadsSpearman ρ with Cattle Heads
Total manure production0.6130.6620.9650.987
Theoretical CH4 recovery potential0.6950.7260.9500.969
STR CH4 potential0.7090.7270.9460.967
STR gross methane energy potential0.7090.7270.9460.967
STR N potential0.7030.7270.9460.968
STR P potential0.7720.7690.9190.949
Recoverable-CH4 CO2e value0.7090.7270.9460.967
Notes: STR, standardised theoretical resource. Values were calculated using 2023 country-level data for the 50 countries analysed. Pearson r indicates linear correlation; Spearman ρ indicates rank correlation. All correlations were positive and statistically significant at p < 0.001. Total livestock heads are the unweighted sum of cattle, buffaloes, pigs, sheep, goats and poultry heads; cattle heads are shown separately because cattle contributed more than three-quarters of estimated manure production.
Table 9. Coefficient-uncertainty and deterministic low–central–high sensitivity analysis for 2023 manure-resource indicators in the 50-country panel.
IndicatorLow Coefficient ScenarioCentral EstimateHigh Coefficient ScenarioMonte Carlo 95% Sensitivity IntervalInterpretation
Total manure production, Gt/yr26.5433.1839.8229.24–37.18Mainly affected by manure-excretion coefficients
STR gross methane energy potential, TWh/yr1547.93977.88660.83157.5–5011.0Highly sensitive because manure, VS, BMP, CH4 fraction and energy content contribute multiplicatively
STR N potential, Mt/yr47.8993.54161.6477.21–112.59Affected by manure excretion, N content and STR N assumptions
STR P potential, Mt/yr11.1221.7137.5118.15–25.73Affected by manure excretion, P content and STR P assumptions
Recoverable-CH4 CO2e value, Gt CO2e/yr3.027.7716.926.14–9.75Follows the same multiplicative sensitivity pattern as STR gross methane energy potential
Note: STR, standardised theoretical resource; VS, volatile solids; BMP, biochemical methane potential. The low and high coefficient scenarios vary biological and technical coefficients jointly and should be interpreted as deterministic sensitivity envelopes. The Monte Carlo interval was generated using triangular coefficient distributions. These values are sensitivity results, not predictive intervals or country-specific uncertainty estimates.
Table 10. Diagnostic assessment of exploratory k-means clustering and compositional sensitivity.
Candidate SolutionMean SilhouetteRandom-Start ARI, MeanBootstrap ARI, MeanInterpretation
k = 20.360Simpler broad separation
k = 30.373Intermediate separation
k = 40.3920.6240.615Highest silhouette; retained as exploratory descriptive solution
k = 50.267Weaker separation
k = 60.278Weaker separation
Note: The four-cluster solution had the highest mean silhouette value among the candidate solutions tested, but stability was moderate rather than strong. The first two principal components explained 62.1% of the total variance. PC1 explained 43.1% of the variance and was mainly associated with per capita intensity variables, including STR gross methane energy potential per capita, STR N per capita and STR P per capita. PC2 explained 19.0% of the variance and separated countries mainly according to livestock composition, especially sheep, goat and pig manure shares.
Table 11. K-means cluster profiles, main influences, and countries included.
ClusternMain InfluencesCountries
C1: high per capita cattle-intensive potential8STR P per capita; STR N per capita; gross methane energy potential per capita; recoverable-CH4 CO2e value per capitaArgentina, Australia, Bolivia, Brazil, Ireland, New Zealand, Paraguay, Uruguay
C2: high absolute potential/mixed large systems5Buffalo manure share; total energy; goat manure share; pig manure shareChina, Egypt, India, Pakistan, Philippines
C3: small-ruminant, goat and poultry-influenced systems5Goat manure share; sheep manure share; poultry manure share; buffalo manure shareGreece, Iran, Morocco, Nigeria, Saudi Arabia
C4: moderate mixed cattle-pig systems32Pig manure share; cattle manure share; poultry manure share; total STR gross methane energy potentialBangladesh, Belgium, Canada, Chile, Colombia, Czechia, Denmark, Ethiopia, France, Germany, Hungary, Indonesia, Italy, Japan, Kenya, Mexico, Netherlands, Peru, Poland, Portugal, Romania, Russia, South Africa, South Korea, Spain, Tanzania, Thailand, Türkiye, Ukraine, United Kingdom, United States, Vietnam
Note: STR, standardised theoretical resource.
Table 12. Diagnostic summary of the selected ARIMA model.
ModelAICBICRMSE
(Gt CO2e)
MAE
(Gt CO2e)
Ljung–Box
p-Value (Lag 6)
ARIMA(2,1,2) with deterministic trend−232.020−225.2071.3440.2771.000
Table 13. Rolling-origin one-step-ahead forecast validation of the selected ARIMA model and simpler benchmark models.
ModelRMSE (Gt CO2e)MAE (Gt CO2e)MAPE (%)
Naïve forecast0.06670.05400.722
Random walk with drift0.04390.03750.506
Linear trend0.09740.08511.139
Exponential smoothing0.02720.02490.337
ARIMA(2,1,2) with deterministic trend0.00570.00470.064
Note: RMSE, root mean square error; MAE, mean absolute error; MAPE, mean absolute percentage error. Validation was based on rolling-origin one-step-ahead forecasts and was used only to compare short-horizon performance. It does not imply reliable long-horizon prediction to 2050.
Table 14. Scenario-adjusted recoverable-CH4 CO2e value under three illustrative adoption scenarios.
ScenarioYearAATIAScenario-Adjusted Value (Gt CO2e)Lower 95% CI
(Gt CO2e)
Upper 95% CI (Gt CO2e)
low-adoption20302.6%0.0%7.787.727.85
low-adoption20406.3%0.0%7.927.848.00
low-adoption205010.0%0.0%8.047.948.14
medium-adoption20309.1%0.0%7.267.217.32
medium-adoption204022.0%0.0%6.596.526.66
medium-adoption205035.0%0.0%5.815.735.88
High-adoption203018.1%3.9%6.296.236.34
High-adoption204044.1%9.4%4.284.244.33
High-adoption205070.0%15.0%2.282.252.31
Note: AA, adoption adjustment; TIA, technical-intensity adjustment. Values are illustrative sensitivity assumptions applied to the ARIMA reference trajectory. They should not be interpreted as feasible adoption rates, avoided emissions or net greenhouse-gas mitigation.
Disclaimer/Publisher’s Note: The statements, opinions and data contained in all publications are solely those of the individual author(s) and contributor(s) and not of MDPI and/or the editor(s). MDPI and/or the editor(s) disclaim responsibility for any injury to people or property resulting from any ideas, methods, instructions or products referred to in the content.