Article

Zinc-Based Nano-Priming Enhances Physiological and Functional Responses of Maize Seedlings

by
Eddaliz García-Reyes
1,
Guillermo Niño-Medina
1,*,
Josué I. García-López
2,*,
Sonia N. Ramírez-Barrón
3,
Emilio Olivares-Sáenz
1,
Vania Urías-Orona
4,
Adriana Morfin-Gutiérrez
2 and
Patricia A. de León-Martínez
5
1
Universidad Autónoma de Nuevo León, Facultad de Agronomía, Laboratorio de Química y Bioquímica, Francisco Villa S/N, Col. Ex-Hacienda El Canadá, General Escobedo C.P. 66050, Nuevo León, Mexico
2
Departamento de Fitomejoramiento, Universidad Autónoma Agraria Antonio Narro, Calz. Antonio Narro 1923, Buenavista, Saltillo C.P. 25315, Coahuila, Mexico
3
Departamento de Ciencias Básicas, Universidad Autónoma Agraria Antonio Narro, Calz. Antonio Narro 1923, Buenavista, Saltillo C.P. 25315, Coahuila, Mexico
4
Universidad Autónoma de Nuevo León, Facultad de Salud Pública y Nutrición, Laboratorio de Fitoterapia, Av. Dr. Eduardo Aguirre Pequeño y Yuriria, Col. Mitras Centro, Monterrey C.P. 64460, Nuevo León, Mexico
5
Departamento de Agrometeorología, Universidad Autónoma Agraria Antonio Narro, Calz. Antonio Narro 1923, Buenavista, Saltillo C.P. 25315, Coahuila, Mexico
*
Authors to whom correspondence should be addressed.
Agriculture 2026, 16(17), 1833; https://doi.org/10.3390/agriculture16171833
Submission received: 8 May 2026 / Revised: 17 July 2026 / Accepted: 17 August 2026 / Published: 26 August 2026
(This article belongs to the Section Seed Science and Technology)

Abstract

The physiological and functional responses of maize seedlings imbibed with zinc sulfate, commercial zinc oxide nanoparticles, and nanoparticles synthesized with Moringa oleífera, at 0, 5, 10, 15, 20, and 25 ppm, were evaluated. Vigor percentage, germination, abnormal seedlings, ungerminated seeds, plumule length and radicle length, dry plumule weight, and dry radicle weight were determined. In addition, phenolic concentration, antioxidant activity, and enzymatic activity were determined. ZnO NPs showed the highest %V and %G values (68.23% and 77.34%). ZnSO4 limited plumule (19.30%) and radicle (23.95%) development as concentrations increased. The highest dry weight of plumule was obtained using ZnO M-NPs (42.99 mg), ZnSO4 (48.92 mg), and ZnO NPs (51.89 mg) at 5 ppm, compared to the control (38.43 mg). ZnO M-NPs increased the content of free phenolics (9.26%) in the plumule, and ZnO NPs induced the highest accumulation of phenolics in the radicle (17.77%). Both NPs showed higher antioxidant capacity by the FRAP and ABTS methods in relation to control. ZnO M-NPs showed lower CAT activity in the plumule and radicle (1.06 and 1.39 U/g of FW at 5 and 25 ppm, respectively). ZnO NPs showed higher CAT activity in the plumule (3.85 U/g of FW at 5 ppm) and higher Apx activity in the radicle (6.15 U/g of FW at 20 ppm). The physiological and functional responses of maize seedlings depended on both the Zn source and concentration.

1. Introduction

Maize (Zea mays L.) is the third most important crop worldwide after wheat and rice, and the most important agricultural crop in Mexico from food, industrial, political, economic, and social perspectives [1]. Maize is the primary source of nutrients for most of the Mexican population with an average annual per capita consumption of 331.9 kg. This high per capita consumption is because maize is the raw material for producing a broad range of maize-based food products, with the tortilla being the main one [2]. There are 234 maize races worldwide, and Mexico has 59 native races, with different characteristics such as ear shape, grain type, size, and pigmentation; therefore, it is considered the center of origin of this crop [1].
In agriculture, seeds are an essential input in determining crop yield and productivity [3]. For this reason, germination is a critical process in the plant life cycle, largely determining the success of seedling establishment and, consequently, agricultural productivity. The quality and efficiency of germination in maize seeds can be influenced by various factors, including the availability of essential micronutrients such as zinc (Zn) [4]. Zn accumulation in seeds is particularly high during the early stages of seed development; it is concentrated in the embryo and the aleurone layer (Zn storage sites), followed by a retranslocation of Zn from these storage sites to the newly developed roots and coleoptiles [5]. Seeds with low Zn content exhibit poor seedling vigor and establishment [5]. Possibly, the high accumulation of Zn during early seed development is related to its vital importance in plant biochemical processes; it is the only metal that can be part of the structure of the six classes of enzymes: hydrolases, transferases, oxidoreductases, isomerases, ligases, and lyases. In addition, it improves fertilization, fertilization success, and biomass production; it participates in protein synthesis (RNA and DNA), enhances the concentration of tryptophan (α-amino acid), which in turn acts as a precursor of the auxin IAA (indole-3-acetic acid), and is an important agent in cell division and elongation. As a result, there is greater photosynthetic activity, translocation of photoassimilates, and absorption of N, P, K, and Zn in the grain [6,7].
In this context, the use of different Zn sources, including ZnSO4, ZnO NPs, and nanoparticles of organic origin, particularly those derived from plants, represents a novel strategy to improve germination and early seedling growth. ZnO NPs, for example, have been shown to improve germination and seedling vigor by increasing Zn availability in roots and promoting greater uptake of this micronutrient [8]. On the other hand, several research studies have reported both positive and negative effects of ZnO NPs on plants; for example, in pigmented native maize seeds the application of ZnO NPs improved seedling vigor, as indicated by shoot length, shoot diameter, root length, and number of secondary roots and improved sanitary quality [9]. They also improve germination in chili peppers, tomatoes, and other crops [10]. The application of ZnO NPs did not increase plumule development in Capsicum annuum L. and limited root development as the concentration increased, associated with high concentrations of this element, which can be toxic to the plant [11].
Unlike ZnSO4, ZnO NPs exhibit a high surface-to-volume ratio, which facilitates their interaction with plant tissues and enables controlled Zn release, potentially reducing toxic effects and improving absorption efficiency [12]. Additionally, organic nanoparticles derived from plant extracts, such as those from Moringa oleifera, have attracted research interest due to their bioactive and biocompatible properties, which could enhance germination without the risks associated with chemically synthesized products [13]. Moringa oleifera contains compounds such as flavonoids (quercetin, kaempferol, myricetin) and phenolic acids (ellagic acid, gallic acid, chlorogenic acid, caffeic acid), which are important in the reduction process for synthesizing ZnO NPs [14]. Organic NPs replace chemical agents used as stabilizers and coating agents (ascorbic acid, alcohol, sodium borohydride, sodium citrate, and hydrazine) with natural plant extracts rich in alkaloids, anthocyanins, phenolic acids, proteins, flavones, flavonols, flavanones, phenols, and polyphenolic compounds, which are effective in the synthesis of ZnO NPs from microorganisms (bacteria and algae), with great utility due to their ease, efficiency, non-toxicity, and ability to reduce metal ions [15]. Likewise, plants treated with green-synthesized ZnO NPs improve Zn nutritional efficiency under normal and stress conditions, showing increases in root length, leaf area, dry weight, yield, and photosynthetic rate [7,16]. The objective of this study was to evaluate the physiological and functional responses of maize seedlings imbibed with zinc sulfate (ZnSO4), commercial zinc oxide nanoparticles (ZnO NPs), and zinc nanoparticles synthesized with Moringa oleífera (ZnO M-NPs).

2. Materials and Methods

2.1. Chemicals and Plant Material

Commercial zinc oxide nanoparticles (ZnO NPs) and zinc sulfate (ZnSO4·7H2O) were acquired from Sigma-Aldrich (Sigma-Aldrich, Inc., St. Louis, MO, USA) in October 2024. Moringa oleifera leaves were collected at the Faculty of Agronomy of Universidad Autónoma de Nuevo León, in General Escobedo, Nuevo León, Mexico, at coordinates 100°18′58″ west longitude and 25°46′49″ north latitude, at an altitude of 495 m above sea level in November 2024. Subsequently, they were used for the green synthesis of ZnO nanoparticles (ZnO M-NPs) in the Basic Sciences Laboratory of Universidad Autónoma Agraria Antonio Narro (UAAAN), Saltillo, Coahuila, Mexico.

2.2. Preparation of Moringa Oleifera Extract

The preparation of Moringa oleifera extract was conducted in December 2024. The collected leaves of Moringa oleifera were washed with distilled water, dried at room temperature, and ground in a Pulverisette 6 planetary mill (Idar-Oberstein, Rhineland-Palatinate, DE). Subsequently, the powder was sieved to 250 µm using Tyler No. 60 sieves (W.S. Tyler., Guadalajara, Jalisco, Mexico), and 6 g were weighed and mixed with 600 mL of ethanol. The mixture was placed in a three-neck flask equipped with a condenser and refluxed for 2 h at 70 °C. Finally, the extract was filtered twice under vacuum using Whatman 3MM Chr filter paper (Cytiva, Maidstone, UK) and stored under refrigeration at 5 °C for later use [17].

2.2.1. Green Synthesis of Zinc Oxide Nanoparticles (ZnO M-NPs)

The synthesis of ZnO M-NPs was carried out in December 2024. Samples were placed in a three-neck round-bottom flask, where 13.7 g of Zn(AcO)2 and 600 mL of the extract obtained in the previous stage were placed. This solution was stirred continuously at 75 °C under reflux for 2 h. Then, a 0.2 M aqueous NaOH solution was added dropwise to adjust the pH to 8, and the mixture was stirred continuously for 24 h. Subsequently, the obtained NPs in suspension were centrifuged at 15,000 rpm for 5 min to recover them. The precipitate was washed twice with ethanol and dried in an oven at 60 °C for 24 h. Next, the NPs were calcined in a muffle furnace at 600 °C for 2 h and finally ground in a mortar to obtain a fine powder [17].

2.2.2. Characterization of ZnO Nanomaterials

The crystal structure identification of ZnO NPs and ZnO M-NPs was carried out by X-Ray Diffraction (XRD). The ZnO nanoparticles were gently ground in an agate mortar to avoid clumping and obtain a fine, homogeneous powder. They were then placed in a sample holder and lightly compacted with a glass slide to obtain a flat, uniform surface, free of cracks or unevenness. The determination of the crystalline structure of the studied samples was carried out using a Rigaku Ultima-IV X-ray diffractometer (Rigaku Holdings Corporation, Tokio, Japan) with a Cu Kα radiation source (40 kV, 44 mA) over a 2θ range of 10–80°, with a scan speed of 0.02 °/s. In the case of samples prepared for transmission electron microscopy, an aqueous suspension was initially prepared with a representative sample of nanoparticles. These were then dispersed in a sonicator for 10 min to avoid excessive agglomeration. Subsequently, a drop of the suspension was taken with a micropipette and deposited onto a copper grid coated with a carbon film. Finally, this grid was dried at room temperature for later analysis.
The morphology and average size of the nanoparticles were examined using Transmission Electron Microscopy (TEM). The morphology and particle size were studied using an FEI Titan transmission electron microscope (Fisher Scientific, Hillsboro, OR, USA) at 300 kV. The particle size distribution was calculated from digital image analysis using ImageJ software version 1.54 d. First, calibration was performed using the scale bar of each image, and then, using the program’s particle analysis tool, the diameters of randomly selected particles were measured. With the data obtained from at least 150 particles, it was possible to generate particle size distribution histograms. Additionally, the elemental composition of the nanoparticles was analyzed using X-ray energy-dispersive spectroscopy (EDX), as evidenced by the high-resolution micrograph. The characterization of ZnO nanomaterials was carried out in January 2025.

2.3. Imbibition Curve of Seeds

The seed imbibition curve was determined by weighing three replicates of 25 seeds, which were placed in Petri dishes (95 × 15 mm) containing 25 mL of distilled water, recording the initial weight and the weight after water gain at 1 h intervals using an analytical balance model CELSAB FA1204E (Changzhou Xingyun Electronic Equipment Co., Ltd., Changzhou, China), until weight stability was achieved; the results were expressed in mg. This curve enables the determination of the seed treatment time, allowing the seeds to imbibe NPs through the seed pericarp.
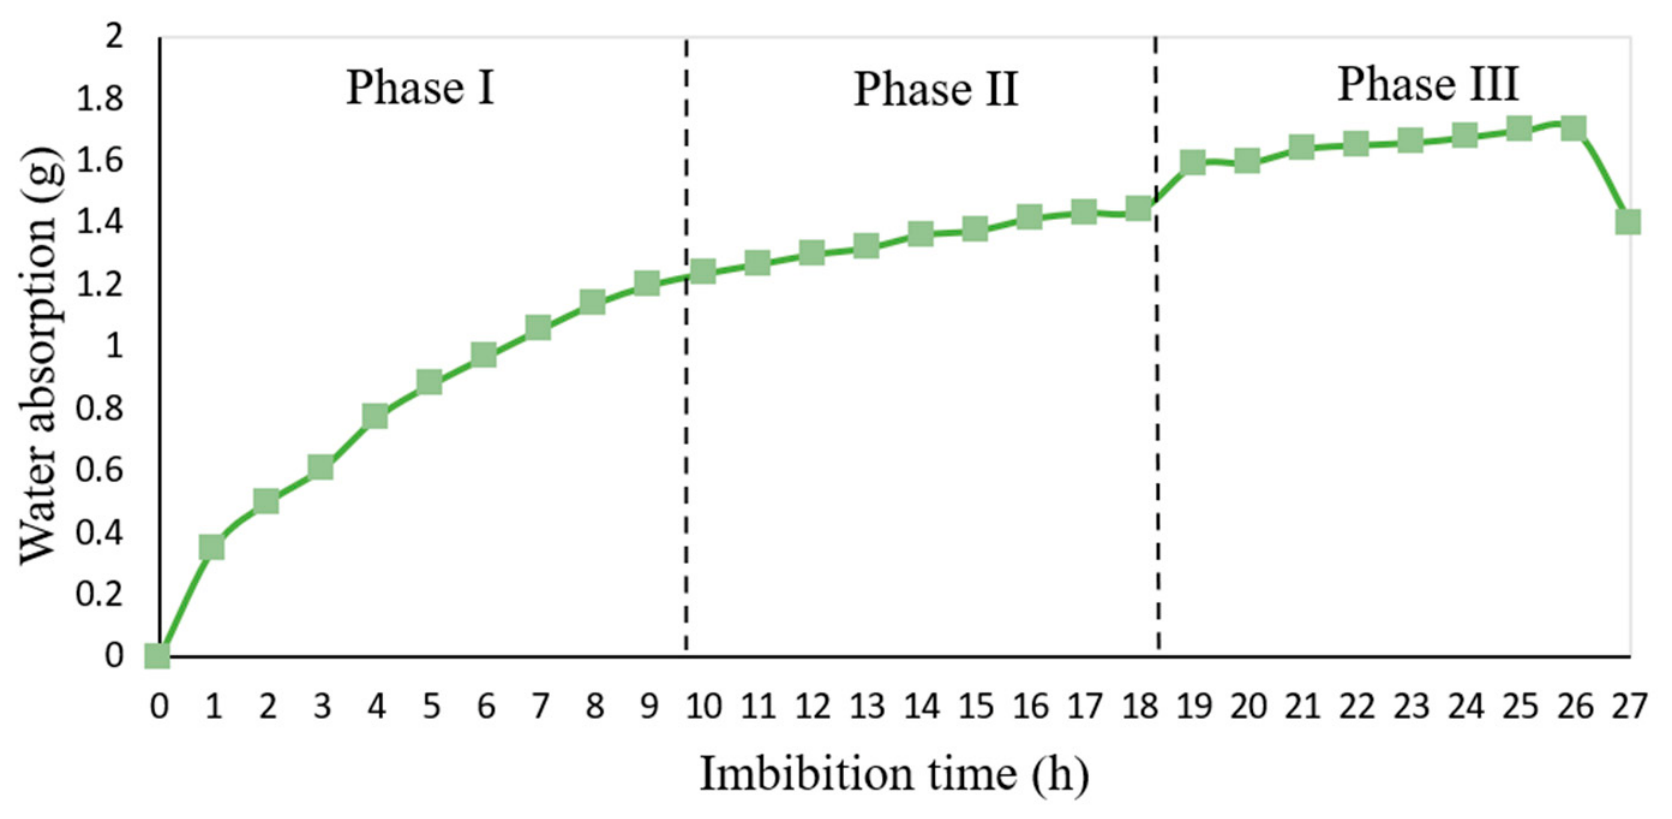
During imbibition, a curve was obtained in which an increase in water absorption was observed over 26 consecutive hours, with a decrease in weight observed at 27 h (Figure 1).
The pattern of water uptake is divided into three phases according to the rate of imbibition. The first is a rapid absorption phase (phase I), followed by a plateau phase of variable duration (phase II), and it ends with the resumption of water uptake associated with embryo growth (phase III) [18]. In our study, the durations for phases I, II, and III were 9, 9, and 8 h, respectively. The rapid initial water uptake during phase I is mainly a physical process, but physiological activities such as respiration, protein synthesis, and DNA repair are activated well before all tissues are fully hydrated. During phase II of imbibition, the rate of water uptake slows down, and the seed water content remains relatively constant or increases only slowly. Metabolic activities shift from those of a developing seed to those associated with germination. Some stored mRNAs are translated, but most are degraded as new genes are transcribed [19].
The imbibition phase begins with the entry of water into the seed. This water is distributed through cracks, fissures, and defects in the seed coat and is absorbed by seed tissues. Measurements of water uptake rates during this phase have shown that these rates: (1) depend on temperature; and (2) are accompanied by an increase in respiration rate and light sensitivity in some seed species. These observations suggest that water uptake during imbibition is not a “passive” process, as often assumed, but rather becomes active at an early stage of this phase. The end of this phase is characterized by an asymptotic approach to the final water gain, or hydration level, which depends on the soil’s environmental water potential, soil water conductivity, seed–soil contact, and seed composition [18].

2.4. Experimental Setup

The present study was conducted in the Seed Physiology Laboratory of the Seed Technology Training and Development Center (CCDTS) in the Department of Plant Breeding, Universidad Autónoma Agraria Antonio Narro (UAAAN), Saltillo, Coahuila. For the bioassay, hybrid maize seeds of AN 447 UAAAN were used. The experiment consisted of three treatments (ZnSO4, ZnO NPs, ZnO M-NPs) and six concentrations (0 (control), 5, 10, 15, 20 and 25 ppm). Concentrations were expressed as elemental Zn equivalents, and the concentration of elemental Zn was calculated from the molecular weight of each Zn compound using stoichiometric mass relationships according to the molecular formula of the compound of Commission on Isotopic Abundances and Atomic Weights (CIAAW-IUPAC):
% Z n =   A t o m i c   w e i g h t   o f   Z n M o l e c u l a r   w e i g h t   o f   c o m p o u n d
Subsequently, a stock solution was prepared for each source of Zn used, and then a dilution was made from the stock solution using the law of conservation of mass for concentrations:
I n i t i a l   C o n c e n t r a t i o n   I n i t i a l   V o l u m e   =   F i n a l   C o n c e n t r a t i o n   F i n a l   V o l u m e
In each treatment, 25 maize seeds were placed in Petri dishes and subjected to imbibition in Zn solutions for 26 h. After this period, sowing was carried out on germination paper (brand Anchor, Anchor Paper Company, St. Paul, MN, USA) on a flat surface according to the rules of the International Seed Testing Association (ISTA) [20]. Once sowing was completed, another anchor paper moistened with distilled water was placed on top and rolled; subsequently, they were placed by treatment in transparent polyethylene bags within a container, which was transferred to a Controlled Environment Chamber, brand Hoffman (Manufacturing Inc., Corvallis, OR, USA) at 25 °C, with a photoperiod of 16 h light and 8 h darkness, at a relative humidity of 75%, in order to subsequently estimate the variables evaluated in the bioassay.

2.5. Variables Evaluated in Germinated Seeds

2.5.1. Vigor (%V) and Germination (%G)

Vigor percentage (%V) was determined by counting normal seedlings that emerged four days after sowing. The percentage was calculated by dividing the number of normal seedlings at 4 days by the total number of seeds sown (25), then multiplying by 100. The result was expressed as a percentage.
Germination percentage (%G): The count was performed on day 7, according to the proportion of germinated seeds relative to the total number of incubated seeds.
All seeds were considered for germination percentage in accordance with ISTA standards [20]. The percentage was calculated by dividing the number of normal seedlings at 7 days by the total number of seeds sown (25), then multiplying by 100. The results were expressed as percentages.

2.5.2. Percentage of Abnormal Seedlings (%AS) and Percentage of Ungerminated Seeds (%US)

The percentage of abnormal seedlings (%AS) was determined by taking into account seedlings that showed growth deformities in any of their structures, plumule or radicle (e.g., the seedling is deformed, fractured, consists of fused twin seedlings, bears an endosperm collar, is yellow or white, is spindly, etc., or the primary root es stunted, stubby, retarded, deeply cracked or broken, decayed, etc.).
The percentage of ungerminated seeds (%US) was evaluated by taking into account seeds that were dead or hard and did not show germination capacity and were counted.
All seeds were considered for abnormal seedlings and ungerminated seeds, in accordance with ISTA standards [20]. The percentage was calculated by dividing the number of AS or US at 7 days by the total number of seeds sown (25), then multiplying by 100. The results were expressed as percentages.

2.5.3. Plumule Length (PL) and Radicle Length (RL)

These were measured in all normal seedlings per replicate, from the intersection of the radicle with the hypocotyl to the base of the cotyledon. Radicle length was determined from the base of the hypocotyl to the radicle apex, and the result was expressed in cm.

2.5.4. Dry Plumule Weight (DPW) and Dry Radicle Weight (DRW)

These variables were obtained after determining all the previous variables. They were measured after drying normal seedlings and roots for 44 h in an oven model FELISA 291A (Fabricantes Feligneo, S.A. de C.V., Zapopan, Jalisco, Mexico) at 50 °C. After this period, they were removed, placed in a desiccator, and weighed on an analytical balance model CELSAB FA1204E (Guadalajara, Jalisco, Mexico). The results were expressed as mg/plumule and mg/radicle.
Imbibition curve, germination experiment and evaluation of physiological variables were carried out in January 2025.

2.6. Enzymatic Activity

Enzymatic activity was conducted in January 2025. Maize plumule and radicle samples were collected at 7 days after germination, and they were ground into a fine powder with dry ice, chilled extraction buffer, and 0.1 M Sodium phosphate buffer at pH 7. The homogenate was centrifuged at 6000 rpm for 20 min at 4 °C, and the supernatant was used for enzyme activity determinations. Catalase activity (EC: 1.11.1.6) was determined following the procedure described by Ruíz-Torres et al. [21], with minor modifications. The H2O2 decrease due to H2O2 breakdown was determined by measuring the absorbance at 240 nm and using the molar extinction coefficient (36 M−1 cm−1). Ascorbate peroxidase (EC 1.11.1.1) activity was assayed according to Ruíz-Torres et al. [21]. The oxidation of ascorbate was determined by measuring absorbance at 290 nm and using the molar extinction coefficient (2.8 mM−1 cm−1).

2.7. Free and Bound Phenolic Compound Extracts

The extraction of free and bound phenolic compounds was carried out as described by [2]. For extraction, 200 mg of the sample was weighed, suspended in 3 mL of 80% methanol, purged with nitrogen for 30 s, and shaken for 2 h at 200 rpm in the dark. Afterward, the samples were centrifuged at 5000 rpm for 5 min; the supernatant was recovered and stored at −20 °C until analysis. Bound phenolic compounds were obtained from the solid residue of the soluble phenolic compounds by treating the sample with 5 mL of 2 M NaOH for 2 h under agitation. Subsequently, the pH of the sample was adjusted to 2.5 with 1 mL of concentrated HCl, and phenolics were extracted twice with 5 mL of diethyl ether. The diethyl ether extracts were combined and evaporated to dryness in a rotavapor Yamato Scientific Co., Ltd. RE200 (Harumi, Chuo-ku, Tokyo), with a YAMATO BM200 water bath, and finally, the samples were dissolved in 80% methanol.

2.8. Determination of Total Phenolics

The determination of total phenolic content was carried out using the Folin–Ciocalteu reagent. A 0.2 mL volume of phenolic extract was added to 2.6 mL of a 7% Na2CO3 solution. The reaction was allowed to proceed for 90 min, and the absorbance of the samples was measured at 750 nm using a DLAB SP-UV1100 spectrophotometer (DLAB Scientific Co., Ltd., Beijing, China). Gallic acid was used as a standard for the calibration curve (0, 40, 80, 120, 160, and 200 mg/L), and the results were expressed as milligrams of gallic acid equivalents per 100 g of sample (mg GAE/100 g) [2].

2.9. Determination of Antioxidant Capacity

Antioxidant capacity assays for ABTS (2,2′-azino-bis (3-ethylbenzothiazoline-6-sulfonic acid)), DPPH (2,2-diphenyl-1-picrylhydrazyl), and FRAP (Ferric Reducing Antioxidant Power) were performed according to [22]. The results were reported as micromoles of Trolox equivalents (6-hydroxy-2,5,7,8-tetramethylchroman-2-carboxylic acid) per one hundred grams of sample (µmol TE/100 g), using the Trolox calibration curve (0 to 500 µmol/L) as a reference.

2.9.1. DPPH (2,2-Diphenyl-1-picrylhydrazyl)

The DPPH assay was performed using a 60 µM working solution, with absorbance adjusted to 0.7 at 517 nm. The assay was carried out by mixing 0.2 mL of phenolic extract with 3 mL of the DPPH working solution; the reaction was allowed to proceed for 30 min in the dark, and the reduction in DPPH was determined.

2.9.2. ABTS (2,2′-Azino-bis (3-ethylbenzothiazoline-6-sulfonic Acid) Diammonium Salt)

The ABTS working solution was prepared by mixing 1 mL of 7.4 mM ABTS and 1 mL of 2.6 mM K2S2O8, and allowing them to react for 12 h in the dark. After this time, the absorbance of the working solution was adjusted to 0.7 at 734 nm by dilution with methanol. The ABTS assay was carried out by mixing 100 µL of phenolic extract with 3 mL of the ABTS working solution; the reaction was allowed to proceed for 30 min in the dark, and the reduction in ABTS was measured.

2.9.3. FRAP (Ferric Reducing Antioxidant Power)

The FRAP assay was determined using a working solution prepared by mixing 300 mM C2H3NaO2·3H2O (pH 3.6), 10 mM TPTZ (2,4,6-tripyridyl-s-triazine, in 40 mM HCl), and 20 mM FeCl3·6H2O in a 10:1:1 ratio. The FRAP assay was carried out by mixing 100 µL of phenolic extract with 3 mL of the FRAP working solution; the reaction was allowed to proceed for 30 min in the dark at 37 °C, and the absorbance of the samples was measured at 593 nm.
Extraction and evaluation of phenolics and antioxidant capacity were carried out from February to July 2025. Phenolic extracts were stored at −20°C during the sampling period.

2.10. Experimental Design and Statistical Analysis

The experiment was organized using a completely randomized factorial design of 3 × 5 plus a control with three replicates. The general linear model was Yij = µ + αi + βj + (αβ)ij + eij, where Yij = response variable; µ = overall mean; αi = effect of treatments; βj = effect of concentrations; (αβ)ij = interaction between treatments and concentrations; and eij = experimental error. The experimental unit was a single roll (folded Anchor paper) containing 25 seeds. Before the analysis of variance, the variables reported in percentages (vigor, germination, abnormal seeds, and ungerminated seeds) were normalized by applying the arcsine and square root transformations. The statistical difference between samples was evaluated using an analysis of variance (ANOVA) and the means were compared using Tukey’s test (p ≤ 0.05), employing the statistical package IBM SPSS Statistics V27.0.1 (IBM Corp., Armonk, NY, USA).

3. Results and Discussion

3.1. X-Ray Diffraction (XRD)

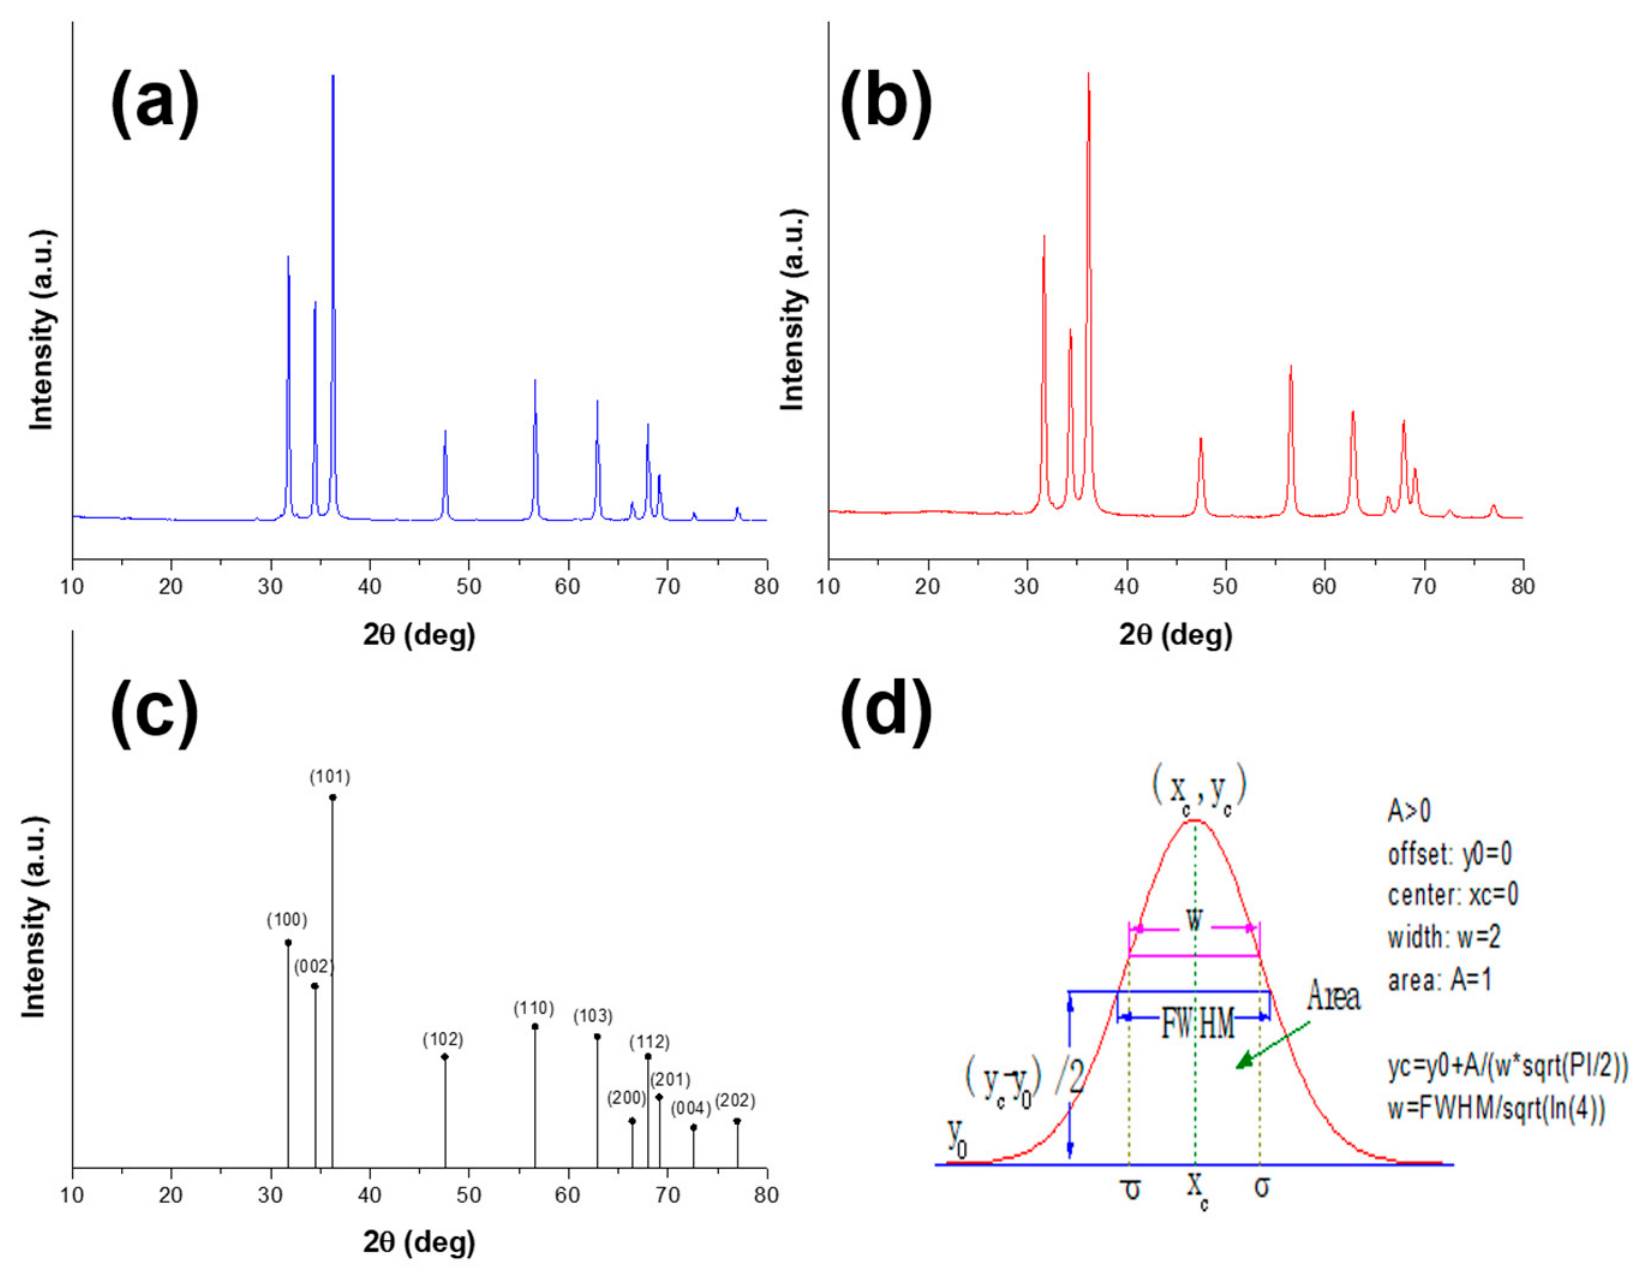
The diffractograms shown in Figure 2 confirm the presence of a hexagonal structure in both samples. Notably, eleven distinct diffraction peaks were observed at 31.76°, 34.42°, 36.25°, 47.53°, 56.60°, 62.86°, 66.37°, 67.96°, 69.09°, 72.56°, and 76.95°, corresponding to the crystallographic planes (100), (002), (101), (102), (110), (103), (200), (112), (201), (004), and (202) of ZnO, as documented in JCPDS card number 36-1451 (Figure 2c). The crystallite size, designated as “d”, was calculated using the Scherrer equation, using the average width of each peak of the diffractogram (Figure 2d).
d = k λ b   c o s θ
where λ is the wavelength of the X-ray; b (FWHM, full width at half maximum) is the width of the diffraction peak; θ is the angle of diffraction; and k is a constant. From the Debye–Scherrer equation, an approximate average crystallite sizes of 31 and 19 nm for ZnO NPs and ZnO M-NPs, respectively, were determined.
The analysis did not reveal any additional peaks or phases, indicating that the synthesis of ZnO M-NPs from extracts did not result in structural alterations. This stability in the crystal structure is crucial to preserving the desired properties of the nanoparticles throughout the synthesis process.

3.2. Transmission Electron Microscopy (TEM)

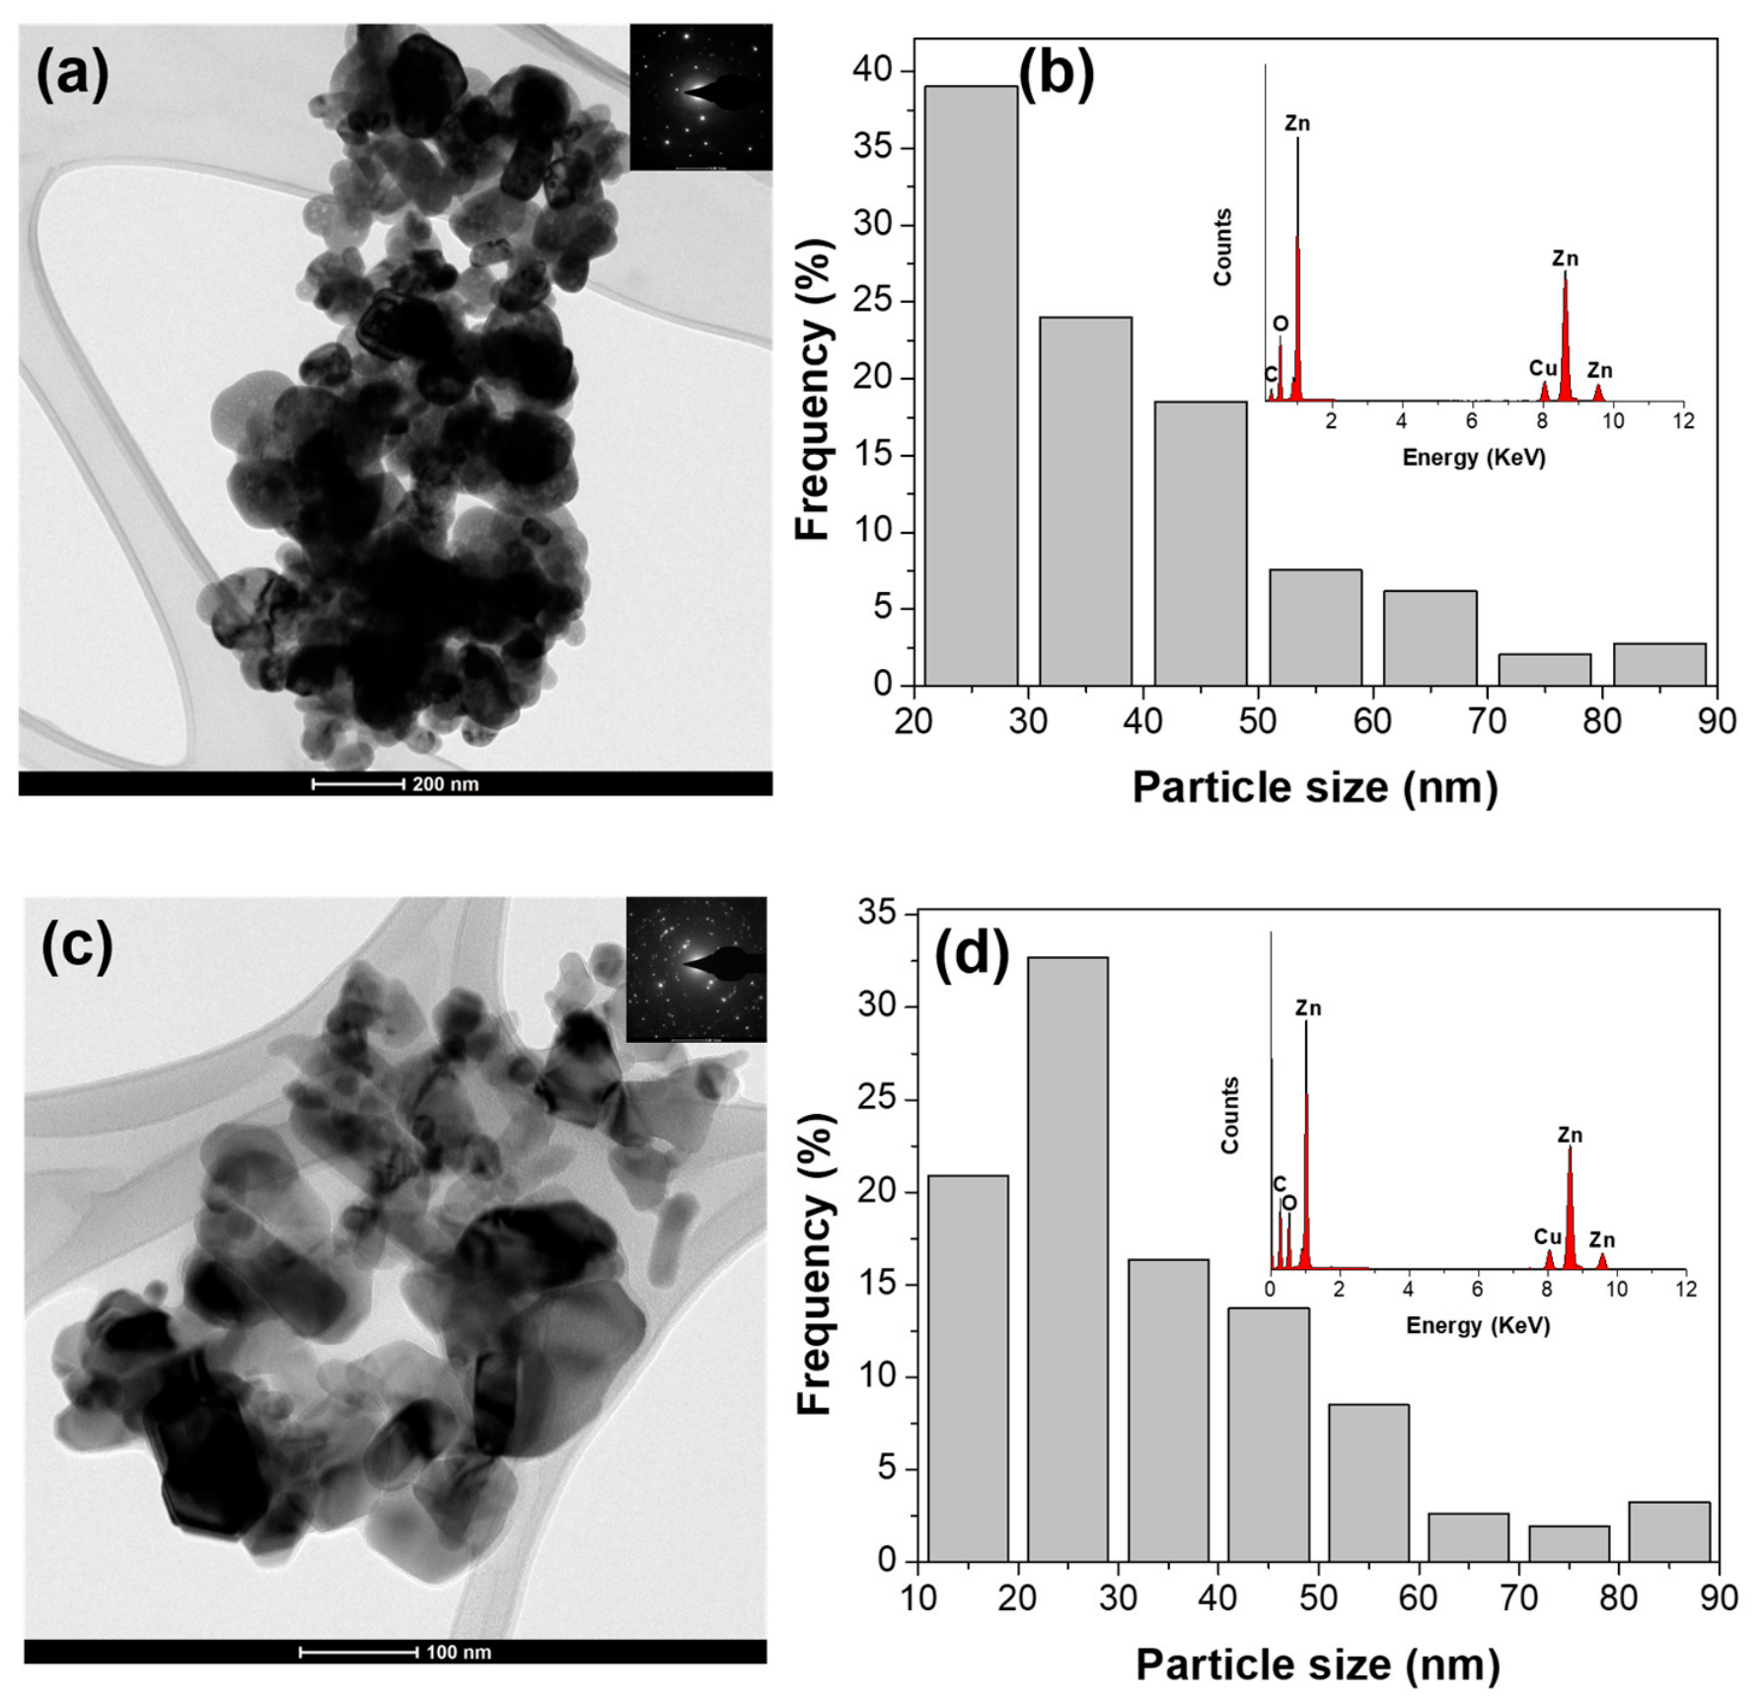
ZnO M-NPs (Figure 3a) showed a spherical morphology, with particle sizes in a range of 25–85 nm, where approximately 39% of the nanoparticles are found around 25 nm (Figure 3b). Meanwhile, the ZnO NPs (Figure 3c) showed heterogeneous morphology, with spherical particles and rods standing out, and particle sizes ranging from 15 to 85 nm; approximately 32% of the nanoparticles were around 25 nm (Figure 3d).
Figure 3 displays prominent peaks corresponding to zinc and oxygen from the nanoparticles, alongside peaks for copper and carbon originating from the measurement grid. The mass percentages for ZnO M-NPs were determined to be Zn at 79.93% and O at 20.06%, as indicated in Figure 3b.
In the case of ZnO NPs, the mass percentages were Zn at 82.8% and O at 17.2%, also shown in the inset Figure 3d. The expected theoretical percentages based on the molecular weights of zinc and oxygen are 80.3% Zn and 19.7% O. These findings further confirm the high purity of both types of nanomaterials.

3.3. Vigor (%V) and Germination (%G)

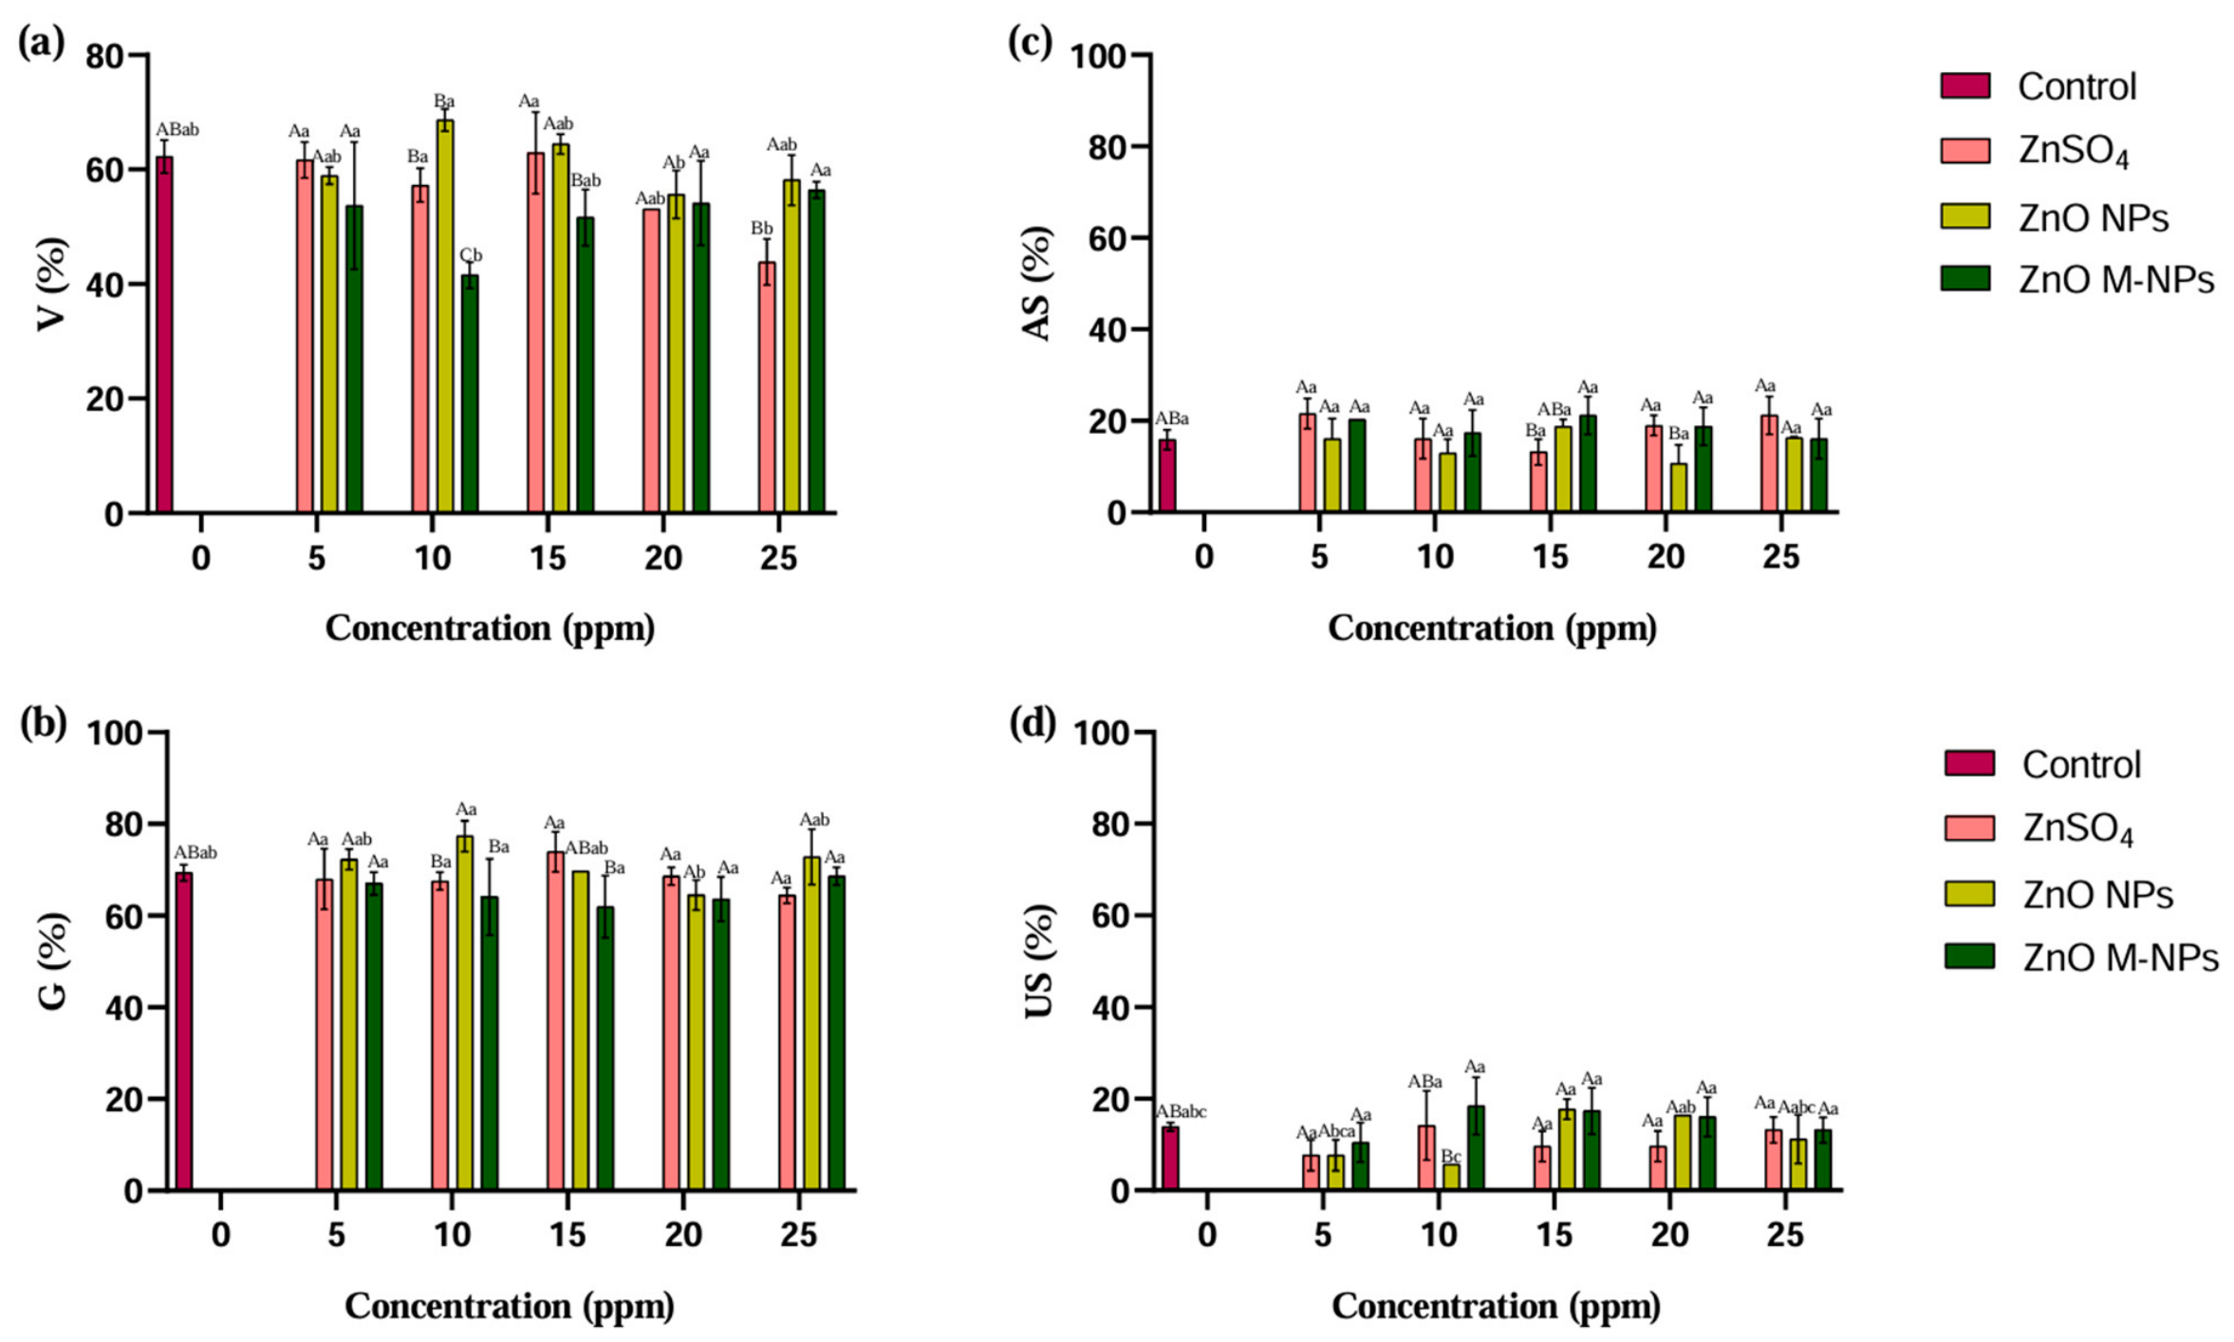
Analysis of variance (ANOVA, p ≤ 0.05) showed statistically significant differences in the Zn sources x concentrations interaction for both seed vigor (p < 0.001) and germination (p = 0.018) (Figure 4a,b). At 5 ppm, no significant differences were detected among Zn sources for %V. ZnO NPs promoted vigor up to 68.63% at 10 ppm, whereas ZnO M-NPs showed greater variability and a decrease in vigor of up to −20.70% at 10 ppm, compared to the control (62.25%). At 15 ppm, ZnSO4 and ZnO NPs showed statistically similar values (62.90 and 64.43%), both higher than ZnO M-NPs (51.61%). At 20 ppm, no significant differences were detected among Zn treatments, whereas at 25 ppm, ZnO M-NPs showed statistically similar values to the control (56.38%). Within ZnSO4 treatments, the %V decreased significantly as Zn concentration increased from 5 to 25 ppm. ZnO M-NPs showed the lowest vigor at 10 ppm but gradually increased with increasing concentration.
At 5 ppm, no significant differences were detected among Zn sources for %G. ZnO NPs showed the highest %G at 10 ppm with 77.34%, exceeding the control (69.38%), ZnSO4 (67.52%) and ZnO M-NPs (64.09%). At 15 ppm, ZnSO4 showed the greatest increase in %G with 73.92%, while ZnO M-NPs showed the lowest %G (61.94%) (Figure 4b). At 20 and 25 ppm, no significant differences were detected among Zn sources for %G. ZnO M-NPs showed the highest increase at 5 and 25 ppm (67.02 and 68.63%), lower than that of the control. With the application of ZnO M-NPs and ZnO NPs at 15 and 20 ppm, %G was negatively affected (61.94 and 64.50%). Both NPs showed the same trend: at 5 ppm, %G increased relative to the control; it decreased at 15 and 20 ppm, then increased again at 25 ppm, reaching the same level as at 5 ppm. Similar to %V, the application of ZnSO4 decreased %G as concentrations increased.
Itroutwar et al. [3] reported that soaking maize seeds with ZnO NPs biosynthesized using marine algae (Turbineria ornata) as a nano-priming agent, compared to Zn acetate, increased germination percentage to 70% at 10 ppm and 87% at 100 ppm, whereas Zn acetate only increased it to 60%. Maize seeds imbibed in ZnSO4 solutions at 0, 200, and 400 ppm, and in green-synthesized ZnO NPs using Eucalyptus lanceolatus leaf extract, significantly promoted germination percentage (20.50%) and vigor index (52.50%) at 200 ppm, and 10.20% at 400 ppm of ZnSO4 [23]. The application of ZnO NPs synthesized with Larrea tridentata extract increased germination up to 90% in Jalapeño pepper seeds (Capsicum annuum) at 200 ppm, compared to the control (50%), while in Saladette tomato (Solanum lycopersicum), germination percentage increased to 72% at 100 ppm [10].
Seed vigor is the potential for rapid and uniform emergence and development under various conditions [10]. Although several of the cited studies report improvements in seed vigor and germination in different crops, the variation in vigor and germination percentages at different concentrations reported in this study could be a typical acclimation response of the plant when subjected to a different physiological range that contributes to a degree of stress. Acclimation is related to plant adjustment to modified environmental conditions such as physiological factors including temperature, light, soil moisture, and macro- and micronutrients [24]. It has been reported that Zn at low concentrations stimulates seed germination and seedling development, whereas at high concentrations it is toxic and reduces seed germination [25].

3.4. Abnormal Seedlings (%AS) and Ungerminated Seeds (%US)

Analysis of variance showed significant effects of Zn source (p = 0.010) and Zn concentration (p = 0.036) on %AS, whereas the Zn source × concentration interaction was not significant (p = 0.082). The ANOVA (p ≤ 0.05) showed statistically significant differences in the Zn sources x concentrations interaction for %US (p = 0.023) (Figure 4c,d).
At all concentrations, ZnSO4 and ZnO M-NPs tended to produce higher %AS than the control and ZnO NPs treatments. Furthermore, the percentage of abnormal seedlings varied with Zn concentration, ranging from 10.69 to 21.58%. The application of ZnSO4 and ZnO M-NPs reduced %US by 6.22 and 3.41% at 5 ppm, while at 10 ppm ZnO M-NPs %US increased up to 4.57%, and decreased with ZnO NPs by 8.15% (Figure 4d). Both NPs increased %US at 15 and 20 ppm and decreased at 25 ppm, an effect reflected in the decreases and increases in %G at the same concentrations. In contrast, treatment with ZnSO4 decreased %V, %G and increased %AS, %US as concentration increased.
The application of chemically synthesized nanoparticles to tomato seeds resulted in a considerable decrease in germination, reaching 38% and 46% at 300 and 400 ppm, respectively [10]. %AS and %US are linked to %G and %V; therefore, the size and dissolution rate of nanoparticles influence seed germination by penetrating the seed coat and increasing its permeability [26].
The germination process consists of three phases: (i) water imbibition; (ii) activation of metabolism, protein and carbohydrate synthesis, and reserve degradation; and (iii) embryo development and rupture of the testa, through which radicle emergence and subsequently the plumule or stem are observed [19]. Failure of seeds to germinate or the emergence of abnormal seedlings may result from poor seed quality, mechanical damage during harvest, storage issues, or problems in seed maturation and development, considering that germinable seeds increase during maturation, reaching a maximum around the time seeds achieve their maximum dry weight [27].

3.5. Plumule Length (PL) and Radicle Length (RL)

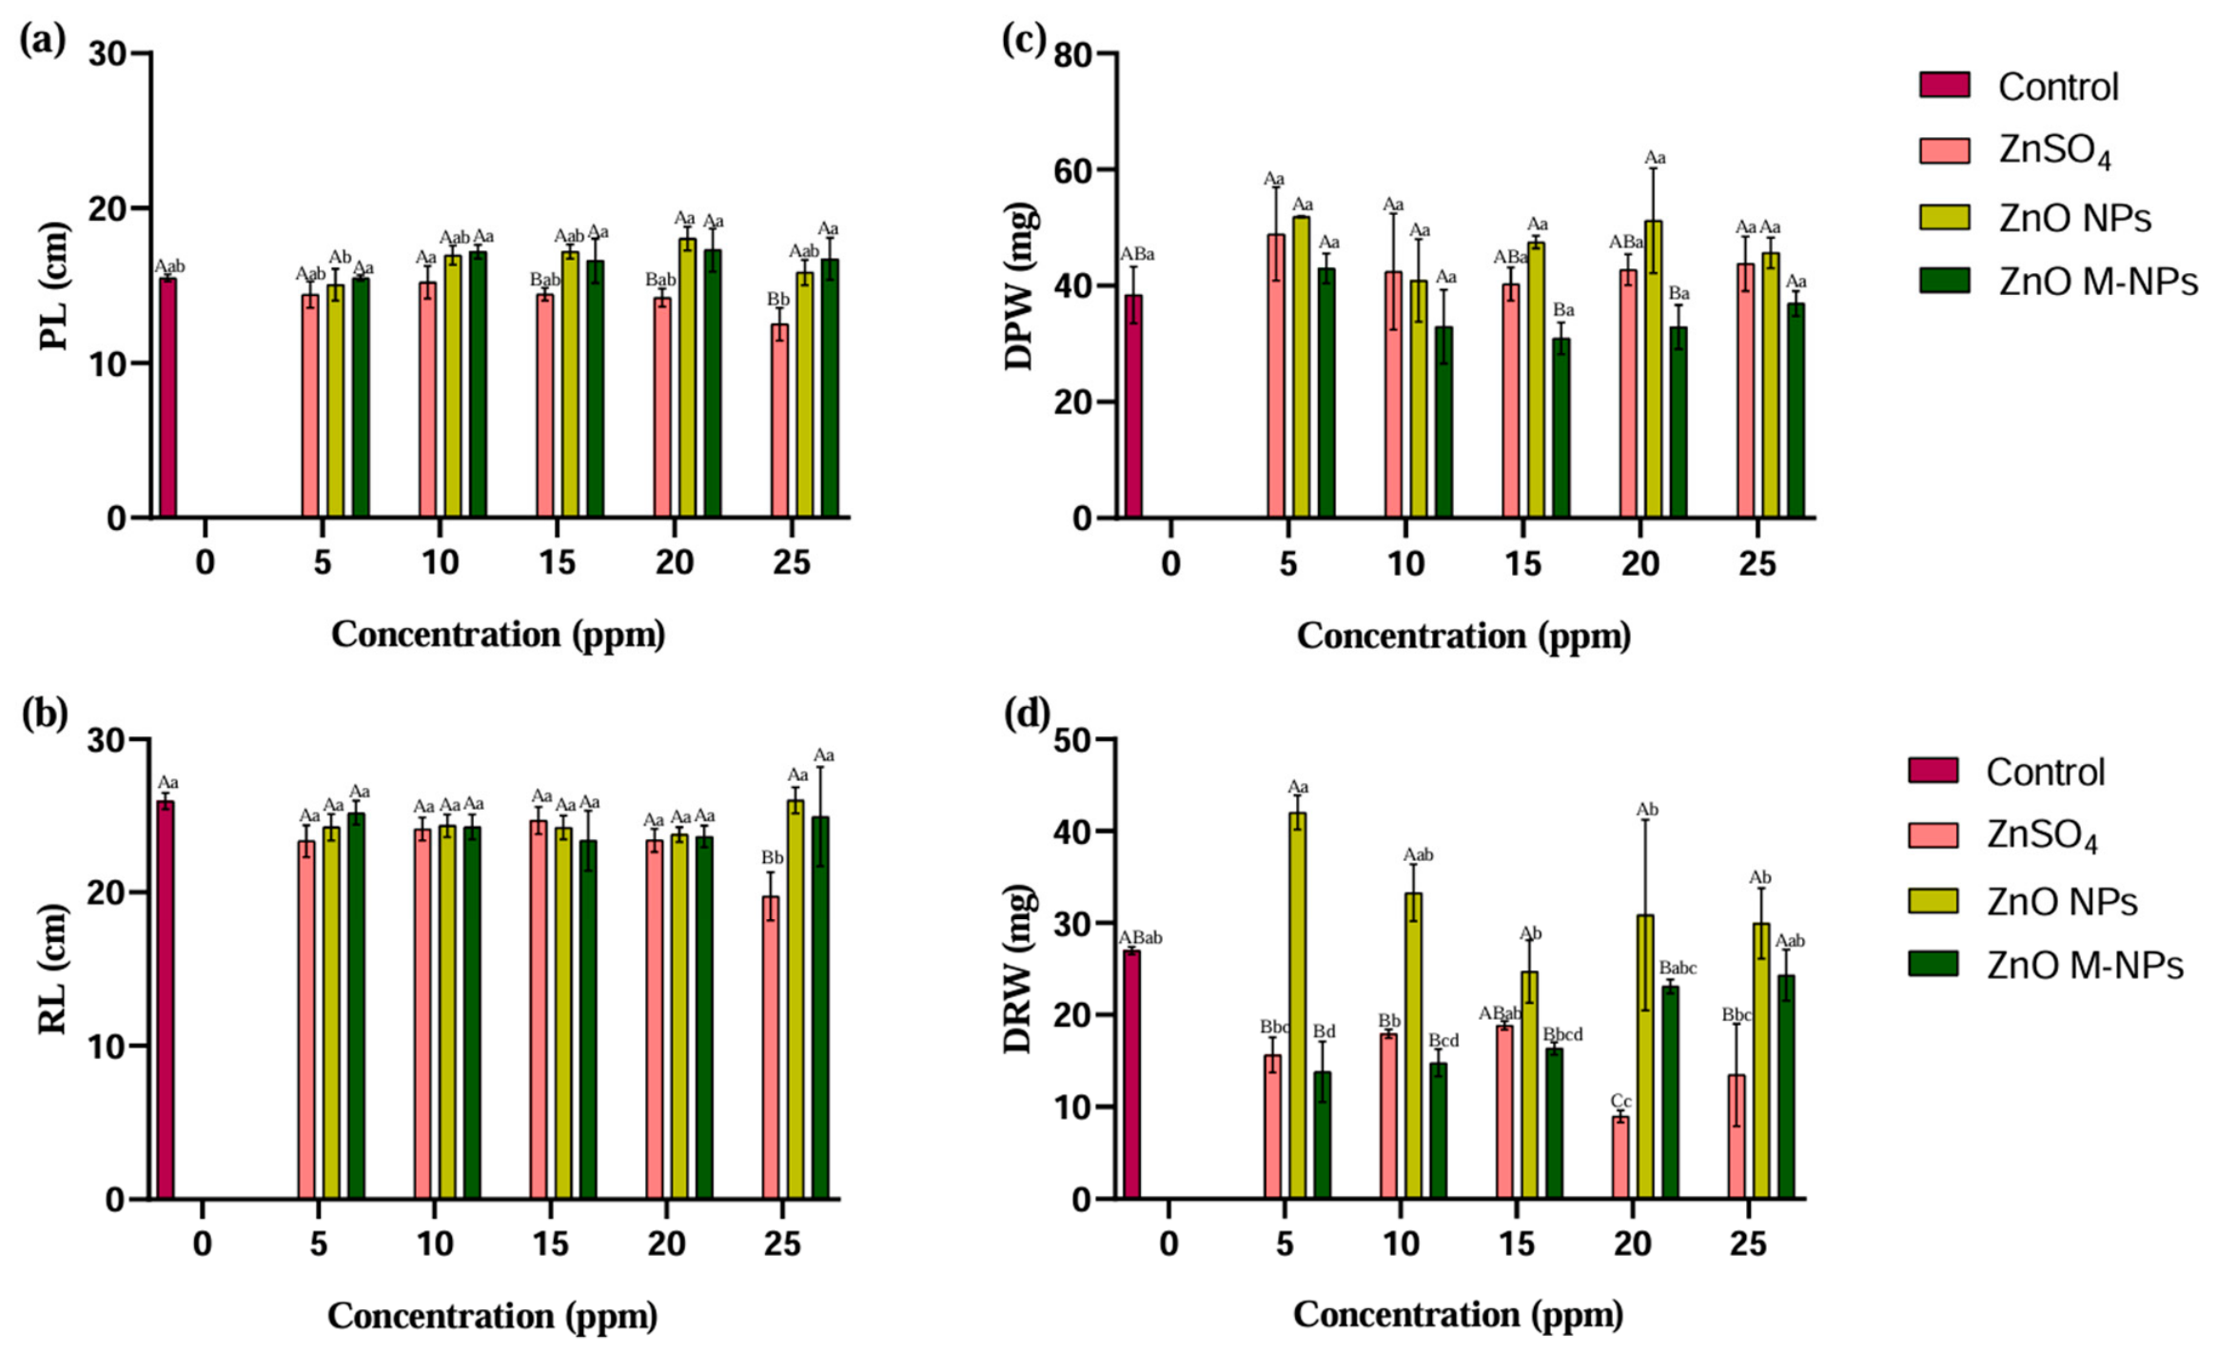
Analysis of variance (ANOVA, p ≤ 0.05) revealed statistically significant differences among the Zn sources x concentrations interaction for the PL (p = 0.050) and RL (p < 0.001) variables. Therefore, the effects of Zn sources were compared within each concentration (uppercase letters), and concentrations were compared within each Zn source (lowercase letters) (Figure 5a,b). At 5 and 10 ppm, no significant differences were detected among Zn sources for PL, while at 15 ppm, the ZnO NPs exhibited the strongest PL growth (18.04 cm) compared to the control (15.49 cm) and the other Zn sources. Both NPs stimulated plumule growth at 20 ppm, 18.04 (ZnO NPs) and 17.31 cm (ZnO M-NPs), 14.10% on average. In contrast, ZnSO4 showed a progressive reduction in PL as concentration increased to 25 ppm, a reduction of −2.99 cm in plumule length (12.50 cm) and −6.22 cm in radicle length (19.74 cm), compared to the control (15.49 y 25.96 cm, respectively). The comparison of means showed no difference among the zinc sources in the RL at 5, 10, 15, and 20 ppm; a difference was observed at 25 ppm, where ZnO NPs exhibited the strongest root development (26.02 cm) (Figure 5b).
The application of green-synthesized ZnO NPs has shown positive effects on seedling and radicle development in maize, increasing plumule length by up to 38.29% (13.00 cm) and root length by 3.62% (20.70 cm) compared to the control (9.40 and 15.20 cm, respectively) at 100 ppm [3]. Likewise, Sharma et al. [23] reported increases of 13.30% in seedling development and 11.30% in radicle length in maize seeds imbibed at 200 ppm of ZnO NPs from E. lanceolatus. However, the results obtained in this study with the application of ZnO M-NPs only increased plumule development while limiting radicle development. The application of ZnO NPs did not increase plumule development in Capsicum annuum L. and limited root development as the concentration increased from 100 to 500 ppm, by around 50% [11].
Another study on maize germination using chemically synthesized ZnO NPs at 500 ppm showed increases of 27.20% and 27.75% in root and plumule development, respectively, whereas ZnSO4 increased them by 22.22% and 10.07%, respectively [28]. The positive effects reported in various studies indicate that green-synthesized NPs are more effective due to their biological coating, which facilitates Zn penetration and prevents aggregation; therefore, the concentration effect is distributed more uniformly [3,10,23]. These phytochemicals enhance the stability and biocompatibility of the NPs by containing secondary metabolites and antioxidant substances that reduce ions to form nanoparticles, thereby replacing toxic reagents [14], making their application more homogeneous and with better affinity toward plant cell walls [10]. Nevertheless, based on our results, it is important to continue investigating whether the plant used to synthesize nanoparticles affects Zn absorption.
Wang et al. [29] reported that the improvement in plant growth due to the application of ZnO NPs is predominantly associated with plant hormonal signal transduction and phenylpropanoid biosynthesis. In addition, it increases the levels of indole-3-acetic acid (IAA), cytokinin (CTK), gibberellic acid (GA), endogenous brassinolide (BRs), and jasmonic acid (JA) in maize seedlings through the upregulation of relevant genes.

3.6. Dry Plumule Weight (DPW) and Dry Radicle Weight (DRW)

Analysis of variance (ANOVA; p ≤ 0.05) showed significant effects of Zn source (p < 0.001) and Zn concentration (p = 0.008) on DPW, whereas the Zn source × concentration interaction was not significant (p = 0.608). The ANOVA (p ≤ 0.05) showed statistically significant differences in the Zn sources x concentrations interaction for DRW (p < 0.001) (Figure 5c,d).
The three Zn sources applied (ZnO M-NPs, ZnSO4, ZnO NPs) showed higher plumule dry weight at 5 ppm (42.99, 48.92, and 51.89 mg) as shown in Figure 5c, with respect to the control (38.43 mg/plumule). ZnO NPs stimulated shoot biomass accumulation by 35.02% and increased root biomass by up to 55.71% at 5 ppm (42.01 mg/radicle). Meanwhile, with the ZnSO4 and ZnO M-NPs, root biomass decreased at all concentrations compared to the control (28.98 mg/radicle), and only ZnO NPs showed higher radicle dry weight (42.01 mg/radicle) at 5 ppm (Figure 5d). Applications of Zn at low concentrations showed seedling development statistically similar to the control; however, the differences lie in increased shoot biomass with the three Zn sources used and greater root development with ZnO NPs. This could be of great importance for sectors such as livestock, where plant biomass is used as a dietary supplement.
Similar increases in dry matter to those obtained in this study with ZnO M-NPs (11.86%) have been reported at low concentrations. For example, Itroutwar et al. [3] reported a 12.19% increase in dry matter (4.68 to 5.33 g) in maize seeds imbibed with biosynthesized ZnO NPs. Maize seedling biomass increased by 15% at 200 ppm and 12% at 400 ppm of ZnO NPs biosynthesized with E. lanceolatus [23]. Likewise, conventional ZnO NPs increased wheat biomass: at 100 ppm, shoot, root, spike, and grain dry weights increased by 53%, 46%, 69%, and 74%, respectively [30]. ZnO nanoparticles at low concentrations have the potential to improve crop growth and yield, even in species such as Juniperus procera in vitro [31]. Although Zn is an essential mineral, at higher concentrations it becomes toxic; therefore, nanoparticles indicate a certain degree of phytotoxicity at high concentrations [31], as observed in this study, especially in DRW with ZnO NPs treatment (Figure 5d).
The increase in dry matter resulting from Zn treatment is attributed to this nutrient’s role in metabolic processes that promote plant growth, thereby increasing the photosynthetically active area [32]. ZnSO4 at low concentrations stimulates seed germination and stem and root growth in peas; however, Zn can also reduce germination rate and inhibit stem and root elongation in different plant species [25]. This is because Zn is an important microelement in the synthesis of indole-3-acetic acid (IAA), the main growth regulator of the auxin class involved in plant growth [32].
The patterns observed in the physiological germination variables evaluated in this study may result from acclimation and hormesis associated with the applied Zn sources. According to the model described by Siemieniuk et al. [24], acclimation to a stress factor is initially characterized by an alarm phase where growth decreases, followed by a resistance phase in which the plant partially restores its growth rate; however, final biomass is usually lower than that of the control. In contrast, hormesis implies that very low doses of a potentially toxic agent do not cause significant initial inhibition but rather a temporary beneficial effect at low concentrations or doses on plant growth response and fitness.
In the case of DPW (Figure 5c), ZnO NPs show a consistent trend toward higher values than the control at most concentrations, particularly at 20 ppm, where the maximum increase is observed.
This behavior is consistent with a hormetic response, as no clear reduction associated with an alarm phase is observed; instead, shoot biomass increases, suggesting that nanostructured Zn acts as a sublethal stimulus that activates favorable metabolic processes, possibly related to improved photosynthetic efficiency or antioxidant activity. On the other hand, ZnSO4 treatment exhibits more moderate variations and, at some concentrations, values close to or below the control, suggesting a response more aligned with a stress and acclimation process. In this scenario, the ionic form of Zn may generate a transient imbalance (e.g., osmotic or redox), triggering repair and physiological adjustment mechanisms without necessarily leading to greater biomass accumulation [25].
The response is even more evident in DRW (Figure 5d), where ZnO NPs induce marked increases in root dry weight at all evaluated concentrations. This stimulatory effect, well above the control, is characteristic of hormesis and suggests a reprogramming of root growth. Increased root biomass can be interpreted as a favorable adaptive strategy, as greater root mass enhances the capacity for water and nutrient uptake. In contrast, ZnSO4 produces substantial reductions in DRW, particularly at 5 and 20 ppm, which is consistent with a typical alarm phase of stress acclimation. Although the plant may activate Zn homeostasis and defense mechanisms, the final biomass remains reduced, consistent with Siemieniuk et al. [24].
The application of ZnO M-NPs shows intermediate behavior. In DPW, values tend to be lower than those of conventional ZnO NPs, and in DRW, they show gradual increases with concentration, suggesting that their bioavailability or interaction with plant tissues may differ. This pattern may reflect a combination of effects: a mild initial stress phase followed by physiological adjustment processes, without reaching the magnitude of the hormetic stimulation observed with ZnO NPs. This highlights the importance of considering not only dose but also the physicochemical nature of the nutrient/stressor when interpreting physiological responses and biomass accumulation in young maize plants.

3.7. Enzymatic Activity

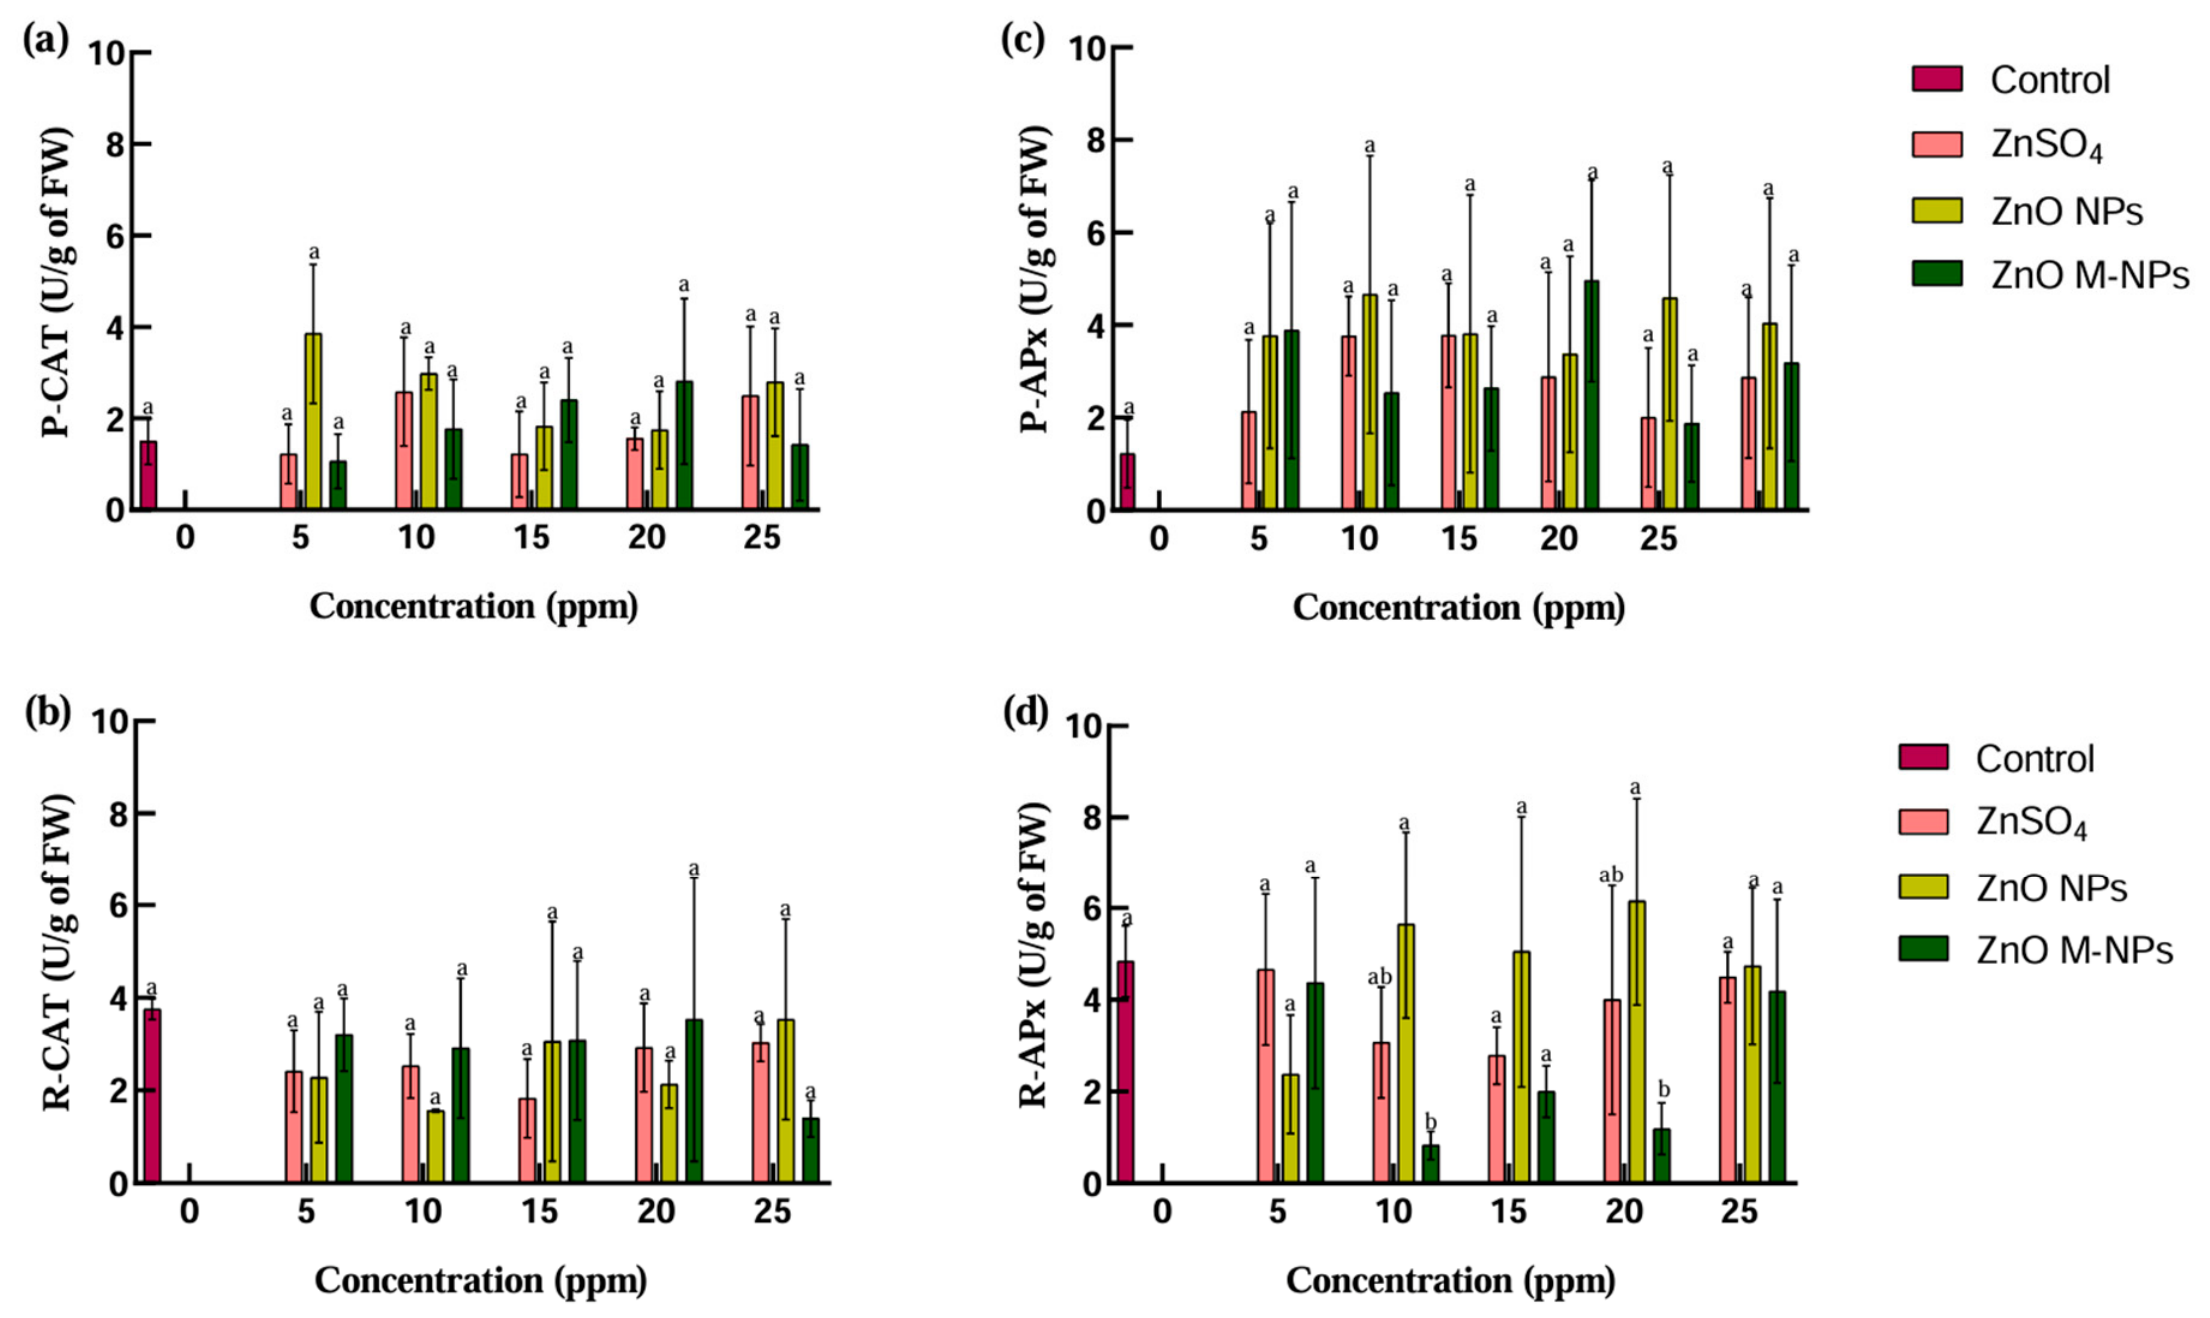
The results of the study did not show differences among treatments x concentrations interaction in catalase (CAT) activity in the plumule and radicle (ANOVA, p ≤ 0.05). In the plumule, CAT activity increased from 16.73% (1.74 U/g of FW) to 99.63% (2.98 U/g of FW) with ZnO NPs, 88.11% (2.81 U/g of FW) at 20 ppm with ZnO M-NPs, and 72.86% (2.58 U/g of FW) at 10 ppm with ZnSO4, compared to the control (1.49 U/g of FW). At 5 ppm, ZnSO4 showed a decrease of −18.21% and ZnO M-NPs −28.99% in CAT activity. In the radicle, all treatments showed a decrease in CAT activity compared to the control. Seedlings treated with ZnSO4 decreased from −51.21 to −19.24% (1.83–3.03 U/g of FW), with ZnO NPs from −58.43 to −5.92% (1.56–3.53 U/g of FW), and with ZnO M-NPs from −62.87 to −5.91% (1.39–3.53 U/g of FW) (Figure 6a,b).
ANOVA (p ≤ 0.05) did not show differences among treatments x concentrations interaction in the plumule but did in the radicle for ascorbate peroxidase (APx) enzymatic activity. The evaluated treatments showed increases in the plumule, from 63.64 to 209.10% (2–3.78 U/g of FW) with ZnSO4, from 175.98 to 281.17% (3.37–4.66 U/g of FW) with ZnO NPs, and from 53.24 to 305.85% (1.87–4.96 U/g of FW) with ZnO M-NPs, compared to the control (1.22 U/g of FW). In the radicle, ZnO NPs showed increases in APx activity of up to 27.05% (6.15 U/g of FW) at 20 ppm and a decrease of up to −50.82% (2.38 U/g of FW) at 5 ppm. ZnSO4 and ZnO M-NPs did not show increases, only decreases ranging from −42.49% to −3.77% (2.78–4.66 U/g of FW) and from −82.95% to −9.67% (0.82–4.37 U/g of FW), respectively (Figure 6c,d).
The application of biogenic ZnO NPs synthesized with Larrea tridentata extract in jalapeño pepper seeds (Capsicum annuum) increased CAT activity concentration by 100.90% at a dose of 100 ppm (6.67 Units of CAT mg−1 of protein) and by 70.46% at 200 ppm (7.79 Units of CAT mg−1 of protein) in Saladette tomato (Solanum lycopersicum). In general, as the concentration of biogenic ZnO NPs increased in seedlings of Capsicum annuum and Solanum lycopersicum, CAT enzymatic activity decreased [10]. Biogenic ZnO NPs in Capsicum annuum increased peroxidase (POD) enzymatic activity up to 19.64% (400 ppm) and polyphenol oxidase (PPO) activity by 62.50% (100 and 200 ppm), similar to commercial ZnO NPs at 300 ppm. In Solanum lycopersicum, POD activity increased by 26.18% (100 ppm) and PPO activity by 66.67% (400 ppm).
Our results show the same trend as those reported by Sánchez-Pérez et al. [10], with no progressive increase and therefore variability at each concentration, which is related to the stress and acclimation process proposed by Siemieniuk et al. [24]. Catalase efficiently decomposes high concentrations of H2O2 and reduces damage caused by OH; therefore, hydrogen peroxide levels are regulated by CAT in plant cells [33].
An increase in antioxidant enzyme activity is due to the adaptive defense mechanism of plants against the harmful effects of ZnO NPs [34]. Consequently, decreases in APx enzymatic activity with the application of ZnO M-NPs may be due to these NPs exhibiting higher antioxidant activity as shown in the antioxidant capacity results later in the manuscript. Non-enzymatic antioxidants and phenolic compounds work in coordination with antioxidant enzymes to reduce the negative effects of oxidative stress [35].
H2O2 can induce synthesis or activate transcription factors related to the induction of various antioxidant enzymes, while APx activity appears to play a secondary role in H2O2 removal compared to CAT, due to its lower rate of H2O2 scavenging, according to the study conducted by Gondim et al. [36], which may be related to the developmental stage of the plant. ZnO NPs obtained through green synthesis are more effective in generating bioactive compounds and activating the enzymatic defense system due to their greater biocompatibility [10].

3.8. Phenols (Free, Bound, and Totals)

Analysis of variance (ANOVA; p ≤ 0.05) revealed a significant interaction between Zn source and concentration for both free phenols (p < 0.001) and bound phenols (p < 0.001) in the plumule. In the radicle, the interaction between the Zn source and concentration was not significant for free phenols (p = 0.085), but it was significant for bound phenols (p = 0.008).

3.8.1. Plumule

ZnO M-NPs increased the content of free phenolics by 9.26%, followed by ZnSO4 with 8.28% and ZnO NPs with 7.50% at 10, 25, and 15 ppm, respectively (Table 1). Both NPs showed the lowest free phenolic contents at 20 ppm. The content of bound phenolics increased by 150.65% with ZnO NPs, 142.73% with ZnO M-NPs, and 116.53% with ZnSO4 at 20, 5, and 25 ppm, respectively. ZnSO4 and ZnO NPs showed the lowest total phenolic contents at 5 ppm, whereas ZnO M-NPs showed the lowest at 25 ppm.
The highest total phenolic content increased by 25.54% with ZnO NPs at 25 ppm, 25.07% with ZnSO4 at 25 ppm, and 21.11% with ZnO M-NPs at 10 ppm. ZnO M-NPs promoted phenolic content in the plumule at low concentrations (10 ppm and 5 ppm), and showed lower phenolic content at high concentrations (20 and 25 ppm). ZnSO4 and ZnO NPs showed higher total phenolic content at 25 ppm and lower at 5 ppm. ZnSO4 exhibited a concentration-dependent response: as concentration increased, the content of free, bound, and total phenolics increased, and conversely, at lower concentrations, phenolic content decreased.

3.8.2. Radicle

ZnO NPs induced the highest accumulation of free, bound, and total phenolics (17.77, 41.92, and 26.54%) at 15 ppm in the radicle. ZnO M-NPs and ZnSO4 showed higher phenolic content at 25 ppm (8.36 and 10.47%) and a decrease of up to −12.03% at low concentrations. Bound phenolic content increased by 35.60% with ZnO M-NPs and 32.61% with ZnSO4 at 10 and 25 ppm, while ZnO NPs decreased by 0.69% at 5 ppm.
The highest accumulation of total phenolics was observed at 15 and 25 ppm, whereas the greatest decrease occurred at 20 ppm with ZnSO4 (1.79). ZnSO4 showed lower phenolic content than the control at 10 and 20 ppm. In general, the three Zn treatments stimulated greater accumulation of bound phenolics in both the plumule and the radicle (Table 1).
Awan et al. [37] observed that the application of ZnO NPs synthesized with black seed extract (Nigella sativa L.) to broccoli seeds (Brassica oleracea var.) significantly increased phenolic content by 67.4% compared to macro-sized ZnSO4 solutions, attributing this to greater penetration and metabolic stimulation induced by particles at the cellular level. Suspensions of 100, 200, and 500 ppm of ZnO NPs inhibited radicle growth in chili seedlings (Capsicum annuum L.) and promoted phenolic compound accumulation by 148.5%, 249.9%, and 282%, with a phytotoxic effect on roots [11]. During stress caused by heavy metals, phenolic compounds act as metal chelators and accumulate. Therefore, the increase in antioxidant activity in plants exposed to NPs is mainly due to increased levels of phenolic compounds, which act as ROS scavengers [31].
Green synthesis of ZnO NPs uses plant phenolic compounds as reducing and stabilizing agents, which may influence their effectiveness in generating bioactive compounds and activating the enzymatic defense system due to their higher biocompatibility [38].
This behavior could explain the increase in phenolics in seedlings and radicles with ZnO M-NPs at low concentrations (5 ppm) and may be associated with the modulation of secondary metabolic pathways such as phenylpropanoids, as observed in studies on nanotoxicity and phytostimulation in maize under ZnO NPs [29]. Therefore, these nanomaterials have great potential as new abiotic promoters effective in inducing the biosynthesis of secondary metabolites at low concentrations with green-synthesized NPs or at high concentrations with conventionally synthesized NPs [10].

3.9. Antioxidant Capacity

Analysis of variance (ANOVA; p ≤ 0.05) revealed a significant interaction between the Zn source and concentration for free and bound DPPH (p < 0.001) in the plumule and radicle. Regarding FRAP, the interaction between the Zn source and concentration was significant for free FRAP (p = 0.049) and bound FRAP (p < 0.001) in the plumule and in the radicle (p < 0.001). The interaction between the Zn source and concentration was not significant for free ABTS in the plumule (p = 0.132) and radicle (p = 0.623), whereas for bound ABTS the ANOVA revealed a statistically significant difference (p < 0.001).

3.9.1. DPPH (Free, Bound, and Totals)

Plumule
The highest accumulation of free antioxidant capacity by DPPH in the plumule was observed with ZnO M-NPs at 15 ppm, exceeding the control by up to 16.49%, followed by ZnO NPs at 20 ppm with an accumulation of 13.93%, and 10.36% at 15 ppm with ZnSO4 (Table 2). On the other hand, the lowest antioxidant capacity was observed at 25 ppm with ZnO NPs (−32.85%), −26.27% with ZnO M-NPs, and −2.52% with ZnSO4 at 10 ppm, compared to the control. The antioxidant capacity in bound form did not decrease and increased from 29.53% with ZnO M-NPs (10 ppm) up to 79.47% with ZnO NPs (20 ppm). ZnSO4 showed the highest increase at 25 ppm (77.58%), while ZnO M-NPs showed a similar increase at 5 ppm (76.63%) (Table 2). Total DPPH antioxidant capacity increased more at 15 and 20 ppm with NPs, reaching 20.01% with ZnO M-NPs and 21.72% with ZnO NPs. The greatest decrease in DPPH was observed with commercial Zn sources (ZnSO4 and ZnO NPs), ranging from −20.08 to −21.48% at higher concentrations.
Radicle
In the radical, free DPPH antioxidant capacity increased the most at 20 ppm (47.60%) with ZnO M-NPs and at 5 ppm with ZnO NPs (37.82%). ZnSO4 showed the lowest free antioxidant capacity, ranging from −59.70% to 8.16% at 25 and 15 ppm, while in the bound fraction, it ranged from −11.60% to 24.55%, showing the greatest decrease at 25 ppm and higher antioxidant capacity at 15 ppm than NPs. ZnO NPs showed changes from −5.56% to 4.77% at 5 and 15 ppm (similar to 25 ppm). ZnO M-NPs showed a decrease of −6.06% at 15 ppm and an increase of 11.25% at 10 ppm. ZnO M-NPs showed the highest total antioxidant capacity at 20 ppm, 34.58% higher than the control, followed by ZnO NPs at 5 ppm (25.98%). Meanwhile, ZnSO4 showed the lowest values at 25 and 15 ppm (−46.57 to 12.64%).
The application of ZnO NPs at 500 ppm increased antioxidant capacity in chili radicles, exceeding the control by 129.1% using the DPPH method, whereas in the plumule, no differences were observed compared to the control [11]. Likewise, the application of ZnO NPs to Brassica nigra seeds resulted in reduced root growth and a 79% increase in DPPH radical-scavenging activity [39]. Pearl millet extracts treated with ZnO NPs at 150 ppm exhibited DPPH radical inhibition of 78.11%, representing an 8.74% increase compared to the control (71.83%) [40]. Biogenic NPs showed the most significant increase in DPPH antioxidant capacity in Capsicum annuum seeds treated at 400 ppm and 300 ppm for Solanum lycopersicum [10].
Compared with these studies, the results in this study show stimulation of plumule development and a slight reduction in radicle development (8.67%) with the application of both green-synthesized and conventional ZnO NPs (Figure 5a,b). Application of NPs at low concentrations (5 to 25 ppm) can stimulate plant development and increase antioxidant capacity without contaminating the environment, unlike high-dose ZnO NP applications (100 to 2000 ppm), while also reducing production costs.
The DPPH method is a free-radical scavenging assay based primarily on electron or hydrogen atom transfer to neutralize a stable organic nitrogen radical. It is soluble only in organic (lipophilic) media such as methanol or ethanol, which limits its ability to measure highly hydrophilic (water-soluble) antioxidants [41].

3.9.2. ABTS (Free, Bound, and Totals)

Plumule
The content of antioxidant capacity in free form increased from 0.99% (20 ppm, ZnO M-NPs) to 27.35% (10 ppm, ZnO M-NPs). ZnO NPs showed a 24.82% increase at 5 ppm, while ZnSO4 at 15 ppm showed the highest increase (15.74%). Antioxidant capacity in bound form increased from 28.54% to 74.31%. ZnO M-NPs showed the highest antioxidant capacity (74.31%) at 5 ppm, followed by ZnO NPs (64.93%) at 10 ppm (similar to 25 ppm), and ZnSO4 (59.83%) at 20 ppm. Total antioxidant capacity increased from 13.85 to 37.77%, with ZnSO4 at 5 ppm and ZnO M-NPs at 10 ppm. By this method, the greatest increases in antioxidant capacity were observed in the bound form (Table 3).
Radicle
Antioxidant capacity in the radical in free form ranged from −19.27 to 27.97%. ZnSO4 and ZnO NPs showed the greatest increases in antioxidant capacity at 25 ppm (19.99 and 27.97%) and the greatest reductions at 5 ppm (−4.20 and −19.27%), whereas with ZnO M-NPs, increases ranged from 3.74 to 12.01% (Table 3). In bound form, increases with ZnSO4 ranged from 20.74 to 45.48% (15 and 25 ppm), with ZnO NPs from 27.99 to 52.32% (5 and 25 ppm), and with ZnO M-NPs from 42.74 to 56.18% (25 and 10 ppm). The highest total antioxidant capacity was 29.10% (10 ppm with ZnO M-NPs), followed by 30.69% and 38.19% at 25 ppm (ZnSO4 and ZnO NPs).
It is important to measure antioxidant capacity using techniques that quantify free radical reduction, as the DPPH method does not fully capture it. The ABTS technique is based on the inhibition of the ABTS•+ radical scavenging, allowing evaluation of antioxidant capacity in both aqueous (hydrophilic) and lipophilic media in a single assay [42].
The results obtained with ZnO M-NPs at low concentrations (5 ppm), in both free and bound forms, are consistent with studies suggesting that green-synthesized nanoparticles, due to their phytoconstituent corona from the plant used in their synthesis, exhibit greater biocompatibility and can act as more effective elicitors of secondary metabolism [10,43]. In this study, maize at low doses appears to fall within the eustress (beneficial stress) range, allowing structural strengthening without compromising biomass, unlike higher doses (100–500 ppm), which, in other studies, have been shown to inhibit radicle growth [24].
The application of conventional salts such as ZnO to pea seeds (Pisum sativum L.) did not improve total flavonoid content, although it did increase total phenolic content and significantly enhanced total antioxidant activity by ABTS, albeit not consistently (a trend similar to that obtained in this study (Table 3)), showing a positive correlation between Zn concentration and ABTS [44].
An extensive review of studies on cereals at the germination stage was conducted to compare our results on phenolics and antioxidant capacity using DPPH, ABTS, and FRAP methods. However, most studies evaluating the application of ZnO NPs and conventional salts at early stages only determine physiological variables, and others only assess antioxidant capacity using DPPH, even in other crops. This study presents some of the first data evaluating the responses of conventional ZnO NPs, green-synthesized ZnO NPs, and ZnSO4 to total phenolics and antioxidant capacity in both lipophilic (DPPH and ABTS) and hydrophilic (ABTS) media, as well as ferric reducing power (FRAP), during maize germination.

3.9.3. FRAP (Free, Bound, and Totals)

Plumule
Antioxidant capacity in the plumule, by the FRAP method, showed that ZnO M-NPs had the greatest increase at 25 ppm and the lowest decrease at 15 ppm (−10.10 to 11.95%), as shown in Table 4. ZnSO4 decreased antioxidant capacity at all concentrations, ranging from −6.74 to −21.78%. In the bound fraction, all treatments increased antioxidant capacity, with ZnO M-NPs showing the highest values at all used concentrations (93.44 to 125.17%), followed by ZnO NPs (58.76 to 114.34%), while ZnSO4 increases ranged from 14.81 to 78.19%. In total antioxidant capacity, NPs showed the greatest increases by the FRAP method. ZnO M-NPs increased by 30.47% at 5 ppm, ZnO NPs increased up to 23.25% at 25 ppm, and ZnSO4 increased by 5.28% at 15 ppm.
Radicle
ZnO NPs showed the highest antioxidant capacity in the radicle, 36.93% (25 ppm), and the lowest decrease, −1.07% (5 ppm), followed by ZnO M-NPs with 21.20% (10 ppm) and −8.00% (20 ppm) (Table 4). ZnSO4 showed decreases of −32.83% at 10 ppm and increases of 16.13% at 25 ppm. ZnO M-NPs showed the greatest increases in bound antioxidant capacity in the radicle, from 43.53% (25 ppm) to 84.32% (10 ppm), followed by ZnSO4 with 34.61% (20 ppm) to 79.00% (15 ppm), while ZnO NPs showed the lowest increases by this method (5.45% at 5 ppm and 50.72% at 20 ppm). In total antioxidant capacity, ZnO M-NPs showed the greatest increase at 10 ppm (43.82%), ZnO NPs at 25 ppm (38.68%), and ZnSO4 at 25 ppm (20.16%). The lowest values were −14.28 with ZnSO4 (5 ppm), 1.27% with ZnO NPs (5 ppm), and 17.21% with ZnO M-NPs (20 ppm).
The FRAP (Ferric Reducing Antioxidant Power) assay is highly sensitive to total phenolic concentration and does not involve a free radical. It measures the reducing power of a sample, specifically its ability to donate electrons and reduce ferric (Fe3+) to ferrous (Fe2+) in an acidic medium [45].
ZnO NPs during the seed germination stage primarily act by modulating the balance between reactive oxygen species (ROS) and the plant antioxidant system. Proper management of the antioxidant system is crucial for plant health, as it prevents potential damage to cellular molecules by maintaining ROS homeostasis [46]. This has direct effects on antioxidant capacity and, therefore, on the quality of the germination process (Figure 4 and Figure 5) [47]. On the other hand, the decrease in antioxidant capacity with ZnO NPs may be related to excessive production of free radicals, which, in turn, suppresses plant growth [10]. Likewise, ZnO NPs may induce some phytochemical compounds while inhibiting others [31]. ZnO NPs obtained through both green and conventional synthesis are more effective in generating bioactive compounds (chlorophyll a, total phenolics, flavonoid content, and total protein) and in activating the enzymatic defense system [10,31].
It has been reported that Zn application is associated with increased activity of enzymes involved in plant secondary metabolite pathways, such as shikimate dehydrogenase and phenylalanine ammonia-lyase [44]. Additionally, ZnSO4 significantly affects the expression of genes involved in the biosynthetic pathways of phenolic compounds (especially flavonols and anthocyanins) (VvPAL, VvSTS29, VvCHS, VvCHI, VvF3H, VvFLS4, VvDFR, VvLDOX, and VvMYBF1) throughout berry development in Vitis vinifera [48]. Meanwhile, Wang et al. [29] reported that the decrease in total phenolic content in maize seedlings due to the addition of ZnO NPs is associated with the downregulation of genes such as CCR, HCT, CAD, 4CL, and C4H. This is an important finding, as total phenolics are associated with total antioxidant activity (ABTS and FRAP), according to Malka et al. [44].

4. Conclusions

The response of maize seedlings depended on both the Zn source and concentration. ZnSO4 showed a concentration-dependent inhibitory effect and reduced seedling development, whereas ZnO NPs increased biomass. Of the treatments evaluated, ZnO nanoparticles synthesized with Moringa (ZnO M-NPs) were particularly effective at low concentrations, improving physiological performance and antioxidant capacity. ZnO M-NPs increased the accumulation of free phenols in the plumule and stimulated antioxidant activity as measured by DPPH, ABTS, and FRAP assays, while also promoting APx activity in the plumule. Conventional ZnO nanoparticles were more effective at increasing seedling biomass, bound phenolic compounds, and antioxidant responses in the radicle. In general, the green-synthesized nanoparticles proved to be more effective than ZnSO4 at improving seedling quality and activating antioxidant defense mechanisms. These findings highlight the potential of green-synthesized ZnO nanoparticles as a sustainable agronomic strategy to improve early maize establishment, increase vigor, and enhance physiological resilience during critical stages of crop development.

Author Contributions

Conceptualization, E.G.-R., G.N.-M. and J.I.G.-L.; methodology, E.G.-R., G.N.-M., J.I.G.-L., A.M.-G. and P.A.d.L.-M.; validation, E.G.-R., G.N.-M. and J.I.G.-L.; formal analysis, E.G.-R., G.N.-M., J.I.G.-L., E.O.-S. and V.U.-O.; investigation, E.G.-R., G.N.-M., J.I.G.-L., A.M.-G. and P.A.d.L.-M.; resources, G.N.-M., J.I.G.-L., S.N.R.-B. and V.U.-O.; data curation, E.G.-R., G.N.-M., J.I.G.-L. and E.O.-S.; writing—original draft preparation, E.G.-R., G.N.-M. and J.I.G.-L.; writing—review and editing, E.G.-R., G.N.-M. and J.I.G.-L.; visualization, G.N.-M. and J.I.G.-L.; supervision, G.N.-M., J.I.G.-L. and S.N.R.-B.; project administration, G.N.-M. and J.I.G.-L. All authors have read and agreed to the published version of the manuscript.

Funding

This research received no external funding.

Data Availability Statement

The original contributions presented in this study are included in the article. Further inquiries can be directed to the corresponding author.

Acknowledgments

The authors would like to thank Secretaría de Ciencia, Humanidades, Tecnología e Innovación (SECIHTI) for the scholarship awarded to Eddaliz García-Reyes (CVU: 1108488).

Conflicts of Interest

The authors declare no conflicts of interest.

Abbreviations

The following abbreviations are used in this manuscript:
ZnSO4Zinc sulfate
ZnO NPsCommercial zinc oxide nanoparticles
ZnO M-NPsNanoparticles synthesized with Moringa oleífera
%VVigor percentage
%GGermination percentage
%ASAbnormal seedlings percentage
%USUngerminated percentage
PLPlumule length
RLRadicle length
DPWDry plumule weight
DRWDry radicle weight
DPPH2,2-diphenyl-1-picrylhydrazyl
ABTS2,2′-azino-bis (3-ethylbenzothiazoline-6-sulfonic acid)
FRAPFerric reducing antioxidant power
CATCatalase
APxAscorbate peroxidase

References

  1. García Reyes, E.; Flores Naveda, A.; Ruiz Torres, N.; Camposeco Montejo, N.; Ramírez Barrón, S.N.; García López, J.I. Compuestos Fenólicos y Capacidad Antioxidante de Genotipos de Maíz Pigmentado (Azul/Morado). Temas Cienc. Tecnol. 2022, 26, 13–19. [Google Scholar]
  2. Rodriguez-Salinas, P.A.; Zavala-Garcia, F.; Urias-Orona, V.; Muy-Rangel, D.; Heredia, J.B.; Nino-Medina, G. Chromatic, Nutritional and Nutraceutical Properties of Pigmented Native Maize (Zea mays L.) Genotypes from the Northeast of Mexico. Arab. J. Sci. Eng. 2020, 45, 95–112. [Google Scholar] [CrossRef] [Scilit]
  3. Itroutwar, P.D.; Kasivelu, G.; Raguraman, V.; Malaichamy, K.; Sevathapandian, S.K. Effects of Biogenic Zinc Oxide Nanoparticles on Seed Germination and Seedling Vigor of Maize (Zea mays). Biocatal. Agric. Biotechnol. 2020, 29, 101778. [Google Scholar] [CrossRef] [Scilit]
  4. Alloway, B.J. Zinc in Soils and Crop Nutrition, 2nd ed.; International Zinc Association Brussels: Brussels, Belgium, 2008. [Google Scholar]
  5. Ozturk, L.; Yazici, M.A.; Yucel, C.; Torun, A.; Cekic, C.; Bagci, A.; Ozkan, H.; Braun, H.-J.; Sayers, Z.; Cakmak, I. Concentration and Localization of Zinc during Seed Development and Germination in Wheat. Physiol. Plant. 2006, 128, 144–152. [Google Scholar] [CrossRef] [Scilit]
  6. Dimkpa, C.O.; White, J.C.; Elmer, W.H.; Gardea-Torresdey, J. Nanoparticle and Ionic Zn Promote Nutrient Loading of Sorghum Grain under Low NPK Fertilization. J. Agric. Food Chem. 2017, 65, 8552–8559. [Google Scholar] [CrossRef] [Scilit]
  7. Elshayb, O.M.; Farroh, K.Y.; Amin, H.E.; Atta, A.M. Green Synthesis of Zinc Oxide Nanoparticles: Fortification for Rice Grain Yield and Nutrients Uptake Enhancement. Molecules 2021, 26, 584. [Google Scholar] [CrossRef] [Scilit]
  8. Raliya, R.; Nair, R.; Chavalmane, S.; Wang, W.-N.; Biswas, P. Mechanistic Evaluation of Translocation and Physiological Impact of Titanium Dioxide and Zinc Oxide Nanoparticles on the Tomato (Solanum lycopersicum L.) Plant. Metallomics 2015, 7, 1584–1594. [Google Scholar] [CrossRef] [Scilit]
  9. Estrada-Urbina, J.; Cruz-Alonso, A.; Santander-González, M.; Méndez-Albores, A.; Vázquez-Durán, A. Nanoscale Zinc Oxide Particles for Improving the Physiological and Sanitary Quality of a Mexican Landrace of Red Maize. Nanomaterials 2018, 8, 247. [Google Scholar] [CrossRef] [Scilit]
  10. Sánchez-Pérez, D.M.; Márquez-Guerrero, S.Y.; Ramírez-Moreno, A.; Rodríguez-Sifuentes, L.; Galindo-Guzmán, M.; Flores-Loyola, E.; Marszalek, J.E. Impact of Biologically and Chemically Synthesized Zinc Oxide Nanoparticles on Seed Germination and Seedlings’ Growth. Horticulturae 2023, 9, 1201. [Google Scholar] [CrossRef] [Scilit]
  11. García-López, J.; Zavala-García, F.; Olivares-Sáenz, E.; Lira-Saldívar, R.; Díaz Barriga-Castro, E.; Ruiz-Torres, N.; Ramos-Cortez, E.; Vázquez-Alvarado, R.; Niño-Medina, G. Zinc Oxide Nanoparticles Boosts Phenolic Compounds and Antioxidant Activity of Capsicum annuum L. during Germination. Agronomy 2018, 8, 215. [Google Scholar] [CrossRef] [Scilit]
  12. Hamada, A.M.; Radi, A.A.; Al-Kahtany, F.A.; Farghaly, F.A. A Review: Zinc Oxide Nanoparticles: Advantages and Disadvantages. J. Plant Nutr. 2024, 47, 656–679. [Google Scholar] [CrossRef] [Scilit]
  13. Pal, S.; Mondal, S.; Maity, J.; Mukherjee, R. Synthesis and Characterization of ZnO Nanoparticles Using Moringa oleifera Leaf Extract: Investigation of Photocatalytic and Antibacterial Activity. Int. J. Nanosci. Nanotechnol. 2018, 14, 111–119. [Google Scholar]
  14. González-Fernández, J.V.; Pinzón-Moreno, D.D.; Neciosup-Puican, A.A.; Carranza-Oropeza, M.V. Green Method, Optical and Structural Characterization of ZnO Nanoparticles Synthesized Using Leaves Extract of M. oleifera. J. Renew. Mater. 2022, 10, 833–847. [Google Scholar] [CrossRef] [Scilit]
  15. Rivera-Rangel, R.D.; González-Muñoz, M.P.; Avila-Rodriguez, M.; Razo-Lazcano, T.A.; Solans, C. Green Synthesis of Silver Nanoparticles in Oil-in-Water Microemulsion and Nano-Emulsion Using Geranium Leaf Aqueous Extract as a Reducing Agent. Colloids Surf. Physicochem. Eng. Asp. 2018, 536, 60–67. [Google Scholar] [CrossRef] [Scilit]
  16. Ahmed, S.; Qasim, S.; Ansari, M.; Shah, A.A.; Rehman, H.U.; Shah, M.N.; Ghafoor, U.; Naqvi, S.A.H.; Hassan, M.Z.; Ur Rehman, S. Green Synthesis of Zinc Nanoparticles and Their Effects on Growth and Yield of Pisum Sativum. J. King Saud Univ.-Sci. 2022, 34, 102132. [Google Scholar] [CrossRef] [Scilit]
  17. García-Reyes, E.; García-López, J.I.; Ramírez-Barrón, S.N.; Flores-Naveda, A.; Álvarez-Vázquez, P.; Hernández-Juárez, A.; Barriga-Castro, E.D. Calcareous Soil Modified with Metallic and Organic ZnO Nanoparticles Limits Photosynthetic Pigment Accumulation and Macronutrient Uptake in Swiss Chard (Beta vulgaris Var. Cicla). Plant Nano Biol. 2024, 10, 100108. [Google Scholar] [CrossRef] [Scilit]
  18. Mayer, A.M.; Poljakoff-Mayber, A. The Germination of Seeds; Elsevier: Amsterdam, The Netherlands, 2014. [Google Scholar]
  19. Sun, L.; Yuan, Z. Seed Morphology of Soybean. In Advances in Botanical Research; Academic Press: London, UK, 2022; Volume 102, pp. 349–375. [Google Scholar]
  20. ISTA (International Seed Testing Association). International Rules for Seed Testing; International Seed Testing Association: Zurich, Switzerland, 2017; 56p. [Google Scholar] [CrossRef] [Scilit]
  21. Ruiz-Torres, N.; Flores-Naveda, A.; Barriga-Castro, E.D.; Camposeco-Montejo, N.; Ramírez-Barrón, S.; Borrego-Escalante, F.; Niño-Medina, G.; Hernández-Juárez, A.; Garza-Alonso, C.; Rodríguez-Salinas, P.; et al. Zinc Oxide Nanoparticles and Zinc Sulfate Impact Physiological Parameters and Boosts Lipid Peroxidation in Soil Grown Coriander Plants (Coriandrum sativum). Molecules 2021, 26, 1998. [Google Scholar] [CrossRef] [Scilit]
  22. García-López, J.I.; García-Reyes, E.; Ramírez-Barrón, S.N.; Álvarez-Vázquez, P.; Flores-Naveda, A.; Camposeco-Montejo, N. Nutritional and Nutraceutical Changes in Blue Corn (Zea mays) Stored at Different Temperatures. Cogent Food Agric. 2023, 9, 2218630. [Google Scholar] [CrossRef] [Scilit]
  23. Sharma, P.; Urfan, M.; Anand, R.; Sangral, M.; Hakla, H.R.; Sharma, S.; Das, R.; Pal, S.; Bhagat, M. Green Synthesis of Zinc Oxide Nanoparticles Using Eucalyptus Lanceolata Leaf Litter: Characterization, Antimicrobial and Agricultural Efficacy in Maize. Physiol. Mol. Biol. Plants 2022, 28, 363–381. [Google Scholar] [CrossRef] [Scilit]
  24. Siemieniuk, A.; Rudnicka, M.; Jemioła, G.; Małkowski, E. Hormesis as a Particular Type of Plant Stress Response. Plants 2025, 14, 3815. [Google Scholar] [CrossRef] [Scilit]
  25. Kamberi, N.; Rizani, H.; Dimovska, D.B.; Vllasaku, I.; Tasholli, E. The Effect of Zinc Sulfate on Stem Growth, Root and Seed Germination at Different Concentrations in Peas. J. Hyg. Eng. Des. 2023, 43, 280–285. [Google Scholar]
  26. Thunugunta, T.; Channa Reddy, A.; Kodthalu Seetharamaiah, S.; Ramanna Hunashikatti, L.; Gowdra Chandrappa, S.; Cherukatu Kalathil, N.; Dhoranapalli Chinnappa Reddy, L.R. Impact of Zinc Oxide Nanoparticles on Eggplant (S. melongena): Studies on Growth and the Accumulation of Nanoparticles. IET Nanobiotechnol 2018, 12, 706–713. [Google Scholar] [CrossRef] [Scilit]
  27. Bareke, T. Biology of Seed Development and Germination Physiology. Adv. Plants Agric. Res. 2018, 8, 336–346. [Google Scholar] [CrossRef] [Scilit]
  28. Tiwari, P.K. Effect of Zinc Oxide Nanoparticles on Germination, Growth and Yield of Maize (Zea mays L.). Master’s Thesis, Anand Agricultural University, Anand, India, 2017. [Google Scholar]
  29. Wang, Z.; Tang, C.; Mi, X.; Yao, D.; Chen, Z.; Guo, C.; Zhao, Y.; Xue, X.; Chang, W.; Li, Y. Zinc Oxide Nanoparticles Alleviated Vanadium-Induced Inhibition by Regulating Plant Hormone Signal Transduction and Phenylpropanoid Biosynthesis in Maize Seedlings (Zea mays L.). Environ. Technol. Innov. 2024, 35, 103696. [Google Scholar] [CrossRef] [Scilit]
  30. Rizwan, M.; Ali, S.; Ali, B.; Adrees, M.; Arshad, M.; Hussain, A.; Zia Ur Rehman, M.; Waris, A.A. Zinc and Iron Oxide Nanoparticles Improved the Plant Growth and Reduced the Oxidative Stress and Cadmium Concentration in Wheat. Chemosphere 2019, 214, 269–277. [Google Scholar] [CrossRef] [Scilit]
  31. Salih, A.M.; Al-Qurainy, F.; Khan, S.; Tarroum, M.; Nadeem, M.; Shaikhaldein, H.O.; Gaafar, A.-R.Z.; Alfarraj, N.S. Biosynthesis of Zinc Oxide Nanoparticles Using Phoenix Dactylifera and Their Effect on Biomass and Phytochemical Compounds in Juniperus procera. Sci. Rep. 2021, 11, 19136. [Google Scholar] [CrossRef] [Scilit]
  32. Migliorini, P.; Soares, V.N.; Cavalcante, J.A.; Noguez Martins, A.B.; dos Santos Sune, A.; da Silva, R.N.O.; de Tunes, L.V.M.; da Silva Almeida, A.; Rodrigues, D.B.; Eduardo Rocha Eberhardt, P. Efficiency of Zinc Sulfate (ZnSO4) Absorption, Transport and Use in Zn-Coated Seed of Wheat (Triticum aestivum). Aust. J. Crop Sci. 2018, 12, 217–220. [Google Scholar] [CrossRef] [Scilit]
  33. Yang, Z.; Chen, J.; Dou, R.; Gao, X.; Mao, C.; Wang, L. Assessment of the Phytotoxicity of Metal Oxide Nanoparticles on Two Crop Plants, Maize (Zea mays L.) and Rice (Oryza sativa L.). Int. J. Environ. Res. Public. Health 2015, 12, 15100–15109. [Google Scholar] [CrossRef] [Scilit]
  34. Alhujaily, M.; Albukhaty, S.; Yusuf, M.; Mohammed, M.K.A.; Sulaiman, G.M.; Al-Karagoly, H.; Alyamani, A.A.; Albaqami, J.; AlMalki, F.A. Recent Advances in Plant-Mediated Zinc Oxide Nanoparticles with Their Significant Biomedical Properties. Bioengineering 2022, 9, 541. [Google Scholar] [CrossRef] [Scilit]
  35. El-Zohri, M.; Al-Wadaani, N.A.; Bafeel, S.O. Foliar Sprayed Green Zinc Oxide Nanoparticles Mitigate Drought-Induced Oxidative Stress in Tomato. Plants 2021, 10, 2400. [Google Scholar] [CrossRef] [Scilit]
  36. Gondim, F.A.; Gomes-Filho, E.; Costa, J.H.; Mendes Alencar, N.L.; Prisco, J.T. Catalase Plays a Key Role in Salt Stress Acclimation Induced by Hydrogen Peroxide Pretreatment in Maize. Plant Physiol. Biochem. 2012, 56, 62–71. [Google Scholar] [CrossRef] [Scilit]
  37. Awan, S.; Shahzadi, K.; Javad, S.; Tariq, A.; Ahmad, A.; Ilyas, S. A Preliminary Study of Influence of Zinc Oxide Nanoparticles on Growth Parameters of Brassica oleracea Var Italic. J. Saudi Soc. Agric. Sci. 2021, 20, 18–24. [Google Scholar] [CrossRef] [Scilit]
  38. Swain, M.; Mishra, D.; Sahoo, G. A Review on Green Synthesis of ZnO Nanoparticles. Discov. Appl. Sci. 2025, 7, 997. [Google Scholar] [CrossRef] [Scilit]
  39. Zafar, H.; Ali, A.; Ali, J.S.; Haq, I.U.; Zia, M. Effect of ZnO Nanoparticles on Brassica Nigra Seedlings and Stem Explants: Growth Dynamics and Antioxidative Response. Front. Plant Sci. 2016, 7, 535. [Google Scholar] [CrossRef] [Scilit]
  40. Yadav, A.; Singh, S. Effect of Exogenous Phytohormone Treatment on Antioxidant Activity, Enzyme Activity and Phenolic Content in Wheat Sprouts and Identification of Metabolites of Control and Treated Samples by UHPLC-MS Analysis. Food Res. Int. 2023, 169, 112811. [Google Scholar] [CrossRef] [Scilit]
  41. Sirivibulkovit, K.; Nouanthavong, S.; Sameenoi, Y. Paper-Based DPPH Assay for Antioxidant Activity Analysis. Anal. Sci. 2018, 34, 795–800. [Google Scholar] [CrossRef] [Scilit]
  42. Zhang, S.; Ji, J.; Zhang, S.; Xiao, W.; Guan, C.; Wang, G.; Wang, Y. Changes in the Phenolic Compound Content and Antioxidant Activity in Developmental Maize Kernels and Expression Profiles of Phenolic Biosynthesis-Related Genes. J. Cereal Sci. 2020, 96, 103113. [Google Scholar] [CrossRef] [Scilit]
  43. Matinise, N.; Fuku, X.G.; Kaviyarasu, K.; Mayedwa, N.; Maaza, M. ZnO Nanoparticles via Moringa oleifera Green Synthesis: Physical Properties & Mechanism of Formation. Appl. Surf. Sci. 2017, 406, 339–347. [Google Scholar] [CrossRef] [Scilit]
  44. Malka, M.; Du Laing, G.; Kurešová, G.; Hegedüsová, A.; Bohn, T. Enhanced Accumulation of Phenolics in Pea (Pisum sativum L.) Seeds upon Foliar Application of Selenate or Zinc Oxide. Front. Nutr. 2023, 10, 1083253. [Google Scholar] [CrossRef] [Scilit]
  45. Benzie, I.F.F.; Devaki, M. The Ferric Reducing/Antioxidant Power (FRAP) Assay for Non-Enzymatic Antioxidant Capacity: Concepts, Procedures, Limitations and Applications. In Measurement of Antioxidant Activity & Capacity; Apak, R., Capanoglu, E., Shahidi, F., Eds.; John Wiley & Sons, Ltd.: Chichester, UK, 2017; pp. 77–106. ISBN 978-1-119-13538-8. [Google Scholar]
  46. Dietz, K.-J.; Mittler, R.; Noctor, G. Recent Progress in Understanding the Role of Reactive Oxygen Species in Plant Cell Signaling. Plant Physiol. 2016, 171, 1535–1539. [Google Scholar] [CrossRef] [Scilit]
  47. Donia, D.T.; Carbone, M. Seed Priming with Zinc Oxide Nanoparticles to Enhance Crop Tolerance to Environmental Stresses. Int. J. Mol. Sci. 2023, 24, 17612. [Google Scholar] [CrossRef] [Scilit]
  48. Song, C.-Z.; Liu, M.-Y.; Meng, J.-F.; Chi, M.; Xi, Z.-M.; Zhang, Z.-W. Promoting Effect of Foliage Sprayed Zinc Sulfate on Accumulation of Sugar and Phenolics in Berries of Vitis vinifera Cv. Merlot Growing on Zinc Deficient Soil. Molecules 2015, 20, 2536–2554. [Google Scholar] [CrossRef] [Scilit]
Figure 1. Imbibition curve of maize seeds.
Agriculture 16 01833 g001
Figure 2. X-ray diffraction patterns of (a) ZnO NPs, and (b) ZnO M-NPs, (c) the reference pattern and (d) the Gaussian curves for fitting the main diffraction peaks.
Agriculture 16 01833 g002
Figure 3. TEM images for ZnO M-NPs (a) and ZnO NPs (c), their particle size distributions (b,d), and EDX analysis.
Agriculture 16 01833 g003
Figure 4. (a) V (%) = Vigor seeds; (b) G (%) = Germinated seeds; (c) AS (%) = Abnormal seedlings; (d) US (%) = Ungerminated seeds, treated with ZnSO4, ZnO NPs, and ZnO M-NPs at different concentrations (ppm). Different uppercase letters on each bar indicate significant differences among Zn sources within each concentration according to Tukey’s test (p ≤ 0.05). Different lowercase letters on each bar indicate significant differences among concentrations within each Zn source (Tukey, p ≤ 0.05). The values are the average of three repetitions.
Agriculture 16 01833 g004
Figure 5. (a) PL (cm) = Plumule length; (b) RL (cm) = Radicle length; (c) DPW (mg) = Dry plumule weight; (d) DRW (mg) = Dry radicle weight of maize seeds treated with ZnSO4, ZnO NPs, and ZnO M-NPs at different concentrations. Different uppercase letters on each bar indicate significant differences among Zn sources within each concentration according to Tukey’s test (p ≤ 0.05). Different lowercase letters on each bar indicate significant differences among concentrations within each Zn source (Tukey, p ≤ 0.05). The values are the average of three repetitions.
Agriculture 16 01833 g005
Figure 6. (a) P-CAT (U/g of FW) = Catalase in plumule; (b) R-CAT (U/g of FW) = Catalase in radicle; (c) P-APx (U/g of FW) = Ascorbate peroxidase in plumule; (d) P-APx (U/g of FW) = Ascorbate peroxidase in radicle of maize seeds treated with ZnSO4, ZnO NPs, and ZnO NPs-M at different concentrations. Different letters on each bar indicate that the treatments differed significantly (Tukey, p ≤ 0.05).
Agriculture 16 01833 g006
Table 1. Total phenol content in the germination of white maize with different sources of Zn.
Phenols
(mg GAE/Kg)
Concentration
(ppm)
Treatments
ZnSO4ZnO NPsZnO M-NPs
PlumuleRadiclePlumuleRadiclePlumuleRadicle
Free030,246.49 ± 674.79 Aab18,203.55 ± 1480.56 Aab30,246.49 ± 674.79 Aab18,203.55 ± 1480.56 Ab30,246.49 ± 674.79 Aab18,203.55 ± 1480.56 Aa
529,386.63 ± 801.80 Ab17,685.19 ± 1841.82 Aab30,249.52 ± 1056.22 Aab20,399.58 ± 507.65 Aab30,704.09 ± 654.24 Aab18,048.71 ± 976.33 Aa
1029,124.46 ± 645.16 Bb16,013.86 ± 1105.35 Bb29,616.91 ± 1225.75 Bab20,134.51 ± 1098.31 Aab33,048.94 ± 929.17 Aa18,560.57 ± 1993.39 ABa
1529,920.55 ± 438.03 ABab18,117.37 ± 1649.23 Bab32,515.16 ± 1442.63 Aa21,438.55 ± 297.88 Aa27,700.10 ± 2041.04 Bbc19,504.58 ± 1084.74 ABa
2031,574.81 ± 1177.45 Aab17,372.90 ± 753.43 Aab29,398.48 ± 1887.92 Ab19,558.68 ± 1733.58 Aab24,835.63 ± 847.78 Bc19,230.87 ± 1238.56 ABa
2532,750.34 ± 2189.40 Aa20,108.99 ± 1329.53 Aa32,168.81 ± 750.99 Aab19,354.33 ± 901.35 Aab30,281.52 ± 1332.36 Aab19,725.56 ± 504.30 Aa
Bound05552.88 ± 393.78 Ac10,380.81 ± 1165.35 Ac5552.88 ± 393.78 Ad10,380.81 ± 1165.35 Ab5552.88 ± 393.78 Ac10,380.81 ± 1165.35 Ab
58706.98 ± 765.15 Bb10,962.96 ± 1039.92 Bbc10,279.77 ± 1095.94 Bc10,309.09 ± 401.27 Bb13,478.80 ± 177.56 Aa13,580.61 ± 467.35 Aa
109495.87 ± 311.48 Bb12,274.05 ± 1512.36 Aabc13,322.28 ± 2523.56 Aa13,671.17 ± 429.23 Aa11,383.44 ± 919.94 Bab14,076.85 ± 237.98 Aa
1510,697.74 ± 285.68 Aab13,534.12 ± 2002.69 Aab10,853.76 ± 31.38 Abc14,733.07 ± 717.18 Aa11,094.27 ± 1275.49 Ab13,327.66 ± 1374.33 Aa
209189.18 ± 997.47 Cb10,699.49 ± 998.81 Bc13,918.22 ± 542.28 Aa13,152.46 ± 771.27 Aa11,379.07 ± 704.02 Bab12,718.86 ± 481.57 ABab
2512,023.73 ± 979.76 Aa13,765.64 ± 1569.77 Aa12,775.84 ± 569.10 Aab14,437.41 ± 840.92 Aa10,772.85 ± 525.77 Ab13,147.54 ± 816.08 Aa
Total035,799.37 ± 828.11 Ac28,584.37 ± 2112.02 Ab35,799.37 ± 828.11 Ac28,584.37 ± 2112.02 Ac35,799.37 ± 828.11 Ac28,584.37 ± 2112.02 Ab
538,093.61 ± 1469.00 Bbc28,648.16 ± 2820.79 Ab40,529.29 ± 1923.23 Bb30,708.69 ± 299.92 Abc44,182.89 ± 580.66 Aa31,629.32 ± 1060.95 Aab
1038,620.33 ± 333.72 Bbc28,287.92 ± 2427.26 Bb42,939.18 ± 1377.03 Aab33,805.68 ± 1276.86 Aab44,432.38 ± 1846.13 Aa32,637.42 ± 2066.04 Aab
1540,618.29 ± 664.86 ABb31,651.49 ± 1354.74 Bab43,368.92 ± 1451.49 Aab36,171.62 ± 419.37 Aa38,794.37 ± 3302.83 Bbc32,832.25 ± 2432.18 Aba
2040,763.99 ± 2043.59 ABab28,072.40 ± 1748.38 Bb43,316.70 ± 1632.17 Aab32,711.14 ± 966.49 Aabc36,214.70 ± 160.76 Bc31,949.73 ± 1019.81 Aab
2544,774.07 ± 2855.03 Aa33,874.63 ± 2758.44 Aa44,944.65 ± 329.16 Aa33,791.75 ± 146.69 Aab41,054.37 ± 1144.95 Bab32,873.09 ± 487.71 Aa
The values are the average of three repetitions. Means (n = 3) ± standard deviation. Different uppercase letters within each column indicate that the treatments were statistically different according to Tukey’s test (p ≤ 0.05). Different lowercase letters within each row indicate that the concentrations were statistically different according to Tukey’s test (p ≤ 0.05).
Table 2. Antioxidant capacity DPPH (free, bound and totals) in the germination of white maize with different sources of Zn.
DPPH
(µmol TE/kg)
Concentration
(ppm)
Treatments
ZnSO4ZnO NPsZnO M-NPs
PlumuleRadiclePlumuleRadiclePlumuleRadicle
Free0111,809.40 ± 3666.65 Aa69,258.39 ± 5470.93 Aa111,809.40 ± 3666.65 Aa69,258.39 ± 5470.93 Aa111,809.40 ± 3666.65 Aab69,258.39 ± 5470.93 Ac
5114,434.77 ± 7289.09 ABa64,151.58 ± 3714.55 Ba125,848.99 ± 11,529.85 Aa95,455.18 ± 2946.35 Aa96,982.54 ± 13,078.01 Bbc85,932.98 ± 9424.69 Ab
10108,988.59 ± 3644.05 Aa67,758.45 ± 2062.45 Aa118,807.78 ± 5412.48 Aa80,798.23 ± 3335.41 Aab82,430.56 ± 12,162.80 Bc78,768.41 ± 8796.24 Abc
15123,393.28 ± 3061.78 Aa74,912.44 ± 3031.76 ABa124,474.98 ± 1439.65 Aa87,801.02 ± 6470.54 Aa130,242.89 ± 17,824.23 Aa68,631.89 ± 3158.26 Bc
20118,471.68 ± 4371.59 ABa60,064.49 ± 4682.95 Ca127,380.16 ± 1767.91 Aa84,591.19 ± 2730.35 Bab102,930.67 ± 5305.23 Bb102,225.87 ± 2103.13 Aa
2574,616.33 ± 10272.98 Bb27,908.69 ± 8665.08 Cb75,077.02 ± 4885.10 Bb92,603.63 ± 13295.55 Aa114,409.32 ± 3793.81 Aab87,471.38 ± 7610.97 Aab
Bound015,097.81 ± 1232.56 Ac25,999.93 ± 1477.27 Abc15,097.81 ± 1232.56 Ab25,999.93 ± 1477.27 Aa15,097.81 ± 1232.56 Ad25,999.93 ± 1477.27 Aab
522,039.93 ± 328.59 Bb27,497.17 ± 2833.89 Ab24,138.98 ± 1437.79 ABa24,554.68 ± 345.99 Ba26,668.05 ± 838.34 Aa24,993.09 ± 880.01 ABb
1024,279.46 ± 1092.98 Aab27,443.63 ± 2030.48 ABb26,778.30 ± 1385.11 Aa25,084.77 ± 1380.09 Ba19,556.26 ± 1167.62 Bc28,926.13 ± 455.62 Aa
1524,250.77 ± 1318.64 ABab32,383.83 ± 1464.96 Aa25,508.94 ± 295.32 Aa27,239.28 ± 882.16 Ba22,064.94 ± 693.17 Bbc24,424.43 ± 751.80 Cb
2023,813.63 ± 2537.67 Bab24,127.74 ± 1758.82 Ac27,096.71 ± 783.77 Aa25,813.85 ± 219.47 Aa25,717.25 ± 1708.62 ABa25,970.47 ± 386.73 Aab
2526,810.89 ± 1558.15 Aa22,984.68 ± 735.59 Bc24,572.85 ± 1679.04 Aa24,595.94 ± 898.89 ABa23,910.89 ± 1278.34 Aab26,792.48 ± 549.31 Aab
Total0126,907.21 ± 2582.79 Ab95,258.31 ± 5783.45 Aab126,907.21 ± 2582.79 Ab95,258.31 ± 5783.45 Ab126,907.21 ± 2582.79 Ab95,258.31 ± 5783.45 Acd
5136,474.70 ± 7285.26 ABab91,648.75 ± 895.22 Bab149,987.98 ± 11,963.81 Aa120,009.85 ± 3265.47 Aa123,650.60 ± 12,939.18 Bb110,926.08 ± 10,114.94 Abc
10133,268.05 ± 3915.46 ABab95,202.07 ± 1762.73 Aab145,586.09 ± 6661.61 Aab105,882.99 ± 3903.59 Aab101,986.82 ± 12,751.82 Cc107,694.54 ± 9243.22 Abcd
15147,644.06 ± 4130.85 Aa107,296.27 ± 1567.76 ABa149,983.93 ± 1150.59 Aa115,040.30 ± 5623.74 Aa152,307.84 ± 17,146.06 Aa93,056.32 ± 3488.21 Bd
20142,285.32 ± 5381.62 ABab84,192.24 ± 5876.27 Cb154,476.87 ± 1009.16 Aa110,405.05 ± 2713.75 Bab128,647.92 ± 5693.75 Bb128,196.35 ± 1730.68 Aa
25101,427.22 ± 9517.32 Bc50,893.37 ± 9254.05 Cc99,649.87 ± 3852.10 Bc117,199.58 ± 13565.79 Aa138,320.22 ± 4930.77 Aab114,263.87 ± 8109.13 Aab
The values are the average of three repetitions. Means (n = 3) ± standard deviation. Different uppercase letters within each column indicate that the treatments were statistically different according to Tukey’s test (p ≤ 0.05). Different lowercase letters within each row indicate that the concentrations were statistically different according to Tukey’s test (p ≤ 0.05). Radicle.
Table 3. Antioxidant capacity ABTS (free, bound and totals) in the germination of white maize with different sources of Zn.
ABTS
(µmol TE/kg)
Concentration
(ppm)
Treatments
ZnSO4ZnO NPsZnO M-NPs
PlumuleRadiclePlumuleRadiclePlumuleRadicle
Free0100,218.62 ± 5127.14 Aa70,276.23 ± 4064.89 Aa100,218.62 ± 5127.14 Aa70,276.23 ± 4064.89 Aab100,218.62 ± 5127.14 Ab70,276.23 ± 4064.89 Aa
5106,421.22 ± 9043.23 Aa67,293.64 ± 5774.39 Aa125,090.46 ± 27,236.33 Aa56,736.72 ± 49,126.47 Ab120,369.08 ± 5063.76 Aab76,030.09 ± 7232.92 Aa
10115,156.02 ± 2002.84 Aa74,371.24 ± 530.76 Aa111,098.29 ± 19,617.72 Aa81,271.09 ± 593.88 Aab127,633.82 ± 1434.14 Aa76,963.16 ± 5054.82 Aa
15115,992.93 ± 2360.37 Aa75,582.90 ± 1551.05 Aa119,768.61 ± 4601.25 Aa85,660.08 ± 2788.46 Aab109,955.77 ± 3859.94 Aab78,720.03 ± 424.78 Aa
20113,614.25 ± 5607.09 Aa73,274.77 ± 4708.70 Aa113,677.22 ± 4609.30 Aa79,888.56 ± 2544.27 Aab101,210.71 ± 10,587.77 Ab72,904.48 ± 980.93 Aa
25113,125.13 ± 10,489.89 Aa84,329.04 ± 6637.08 Aa122,380.61 ± 5763.94 Aa89,934.14 ± 9286.48 Aa111,636.22 ± 5810.77 Aab76,157.84 ± 4174.88 Aa
Bound043,031.15 ± 2354.15 Ac50,826.63 ± 3099.40 Ad43,031.15 ± 2354.15 Ab50,826.63 ± 3099.40 Ac43,031.15 ± 2354.15 Ac50,826.63 ± 3099.40 Ab
556,675.80 ± 2885.12 Bb65,878.56 ± 2105.59 ABbc69,533.58 ± 4872.39 Aa65,057.49 ± 2335.40 Bb75,007.37 ± 2621.65 Aa72,924.55 ± 1423.93 Aa
1055,313.07 ± 1060.84 Bb71,513.96 ± 8025.14 Bab70,972.37 ± 2862.44 Aa74,983.50 ± 3917.09 ABa69,726.67 ± 4083.30 Aab79,382.80 ± 1257.93 Aa
1561,553.85 ± 2908.62 Bb61,370.02 ± 464.42 Bc68,173.12 ± 1263.58 Aa76,114.43 ± 1681.67 Aa65,597.49 ± 790.90 ABb73,710.57 ± 4153.15 Aa
2068,778.18 ± 5120.08 Aa64,320.66 ± 3916.39 Bbc69,562.80 ± 3578.27 Aa75,547.03 ± 4323.84 Aa73,993.75 ± 3028.42 Aa73,790.36 ± 2061.88 Aa
2555,327.28 ± 1594.60 Bb73,942.94 ± 2248.11 Aa70,298.91 ± 1310.13 Aa77,421.43 ± 1093.10 Aa70,473.98 ± 1072.57 Aab72,551.86 ± 1213.81 Aa
Total0143,249.77 ± 2838.73 Ab121,102.85 ± 5355.84 Ab143,249.77 ± 2838.73 Ab121,102.85 ± 5355.84 Ab143,249.77 ± 2838.73 Ab121,102.85 ± 5355.84 Ab
5163,097.03 ± 11,921.26 Bab133,172.19 ± 3704.58 Aab194,624.04 ± 30,810.56 Aa121,794.20 ± 49,354.99 Ab195,376.45 ± 3678.46 Aa148,954.65 ± 7721.62 Aab
10170,469.09 ± 3018.37 Ba145,885.20 ± 8331.08 Aab182,070.67 ± 17,217.86 ABa156,254.59 ± 3371.49 Aa197,360.49 ± 5403.89 Aa156,345.97 ± 4000.36 Aa
15177,546.78 ± 1167.01 Aa136,952.93 ± 1087.17 Aab187,941.73 ± 3338.29 Aa161,774.51 ± 1156.69 Aa175,553.27 ± 4637.62 Aa152,430.61 ± 4417.75 Aab
20182,392.42 ± 4315.36 Aa137,595.44 ± 8000.28 Aab183,240.02 ± 4776.54 Aa155,435.59 ± 5152.76 Aa175,204.46 ± 13,596.89 Aa146,694.84 ± 2626.93 Aab
25168,452.41 ± 9113.32 Bab158,271.99 ± 7419.44 Aa192,679.52 ± 7016.37 Aa167,355.57 ± 8312.83 Aa182,110.21 ± 6868.09 ABa148,709.70 ± 3532.32 Aab
The values are the average of three repetitions. Means (n = 3) ± standard deviation. Different uppercase letters within each column indicate that the treatments were statistically different according to Tukey’s test (p ≤ 0.05). Different lowercase letters within each row indicate that the concentrations were statistically different according to Tukey’s test (p ≤ 0.05).
Table 4. Antioxidant capacity FRAP (free, bound and totals) in the germination of white maize with different sources of Zn.
FRAP
(µmol TE/kg)
Concentration
(ppm)
Treatments
ZnSO4ZnO NPsZnO M-NPs
PlumuleRadiclePlumuleRadiclePlumuleRadicle
Free0126,933.76 ± 11,717.33 Aa63,242.77 ± 10,616.90 Aa126,933.76 ± 11,717.33 Aa63,242.77 ± 10,616.90 Ab126,933.76 ± 11,717.33 Aab63,242.77 ± 10,616.90 Aab
5111,962.52 ± 3369.65 Bab45,739.93 ± 3795.35 Bb110,109.16 ± 12,332.64 Ba62,568.19 ± 13,334.06 Ab140,309.23 ± 2111.32 Aab67,027.23 ± 6296.36 Aab
10107,286.45 ± 6315.34 Bab42,479.88 ± 477.89 Bb116,063.98 ± 7904.54 ABa73,651.94 ± 6747.47 Aab137,521.11 ± 16,964.76 Aab76,653.52 ± 7746.79 Aa
15118,381.12 ± 364.47 Aab57,848.11 ± 1764.96 Bab116,615.85 ± 11,961.24 Aa80,792.88 ± 946.98 Aa114,118.42 ± 11,119.56 Ab72,292.73 ± 5547.75 Aab
2099,292.44 ± 14,330.11 Ab58,304.12 ± 5194.69 Bab118,237.09 ± 10,771.32 Aa74,619.40 ± 4719.25 Aab116,138.11 ± 4572.65 Aab58,178.96 ± 1033.38 Bb
25111,320.16 ± 19,467.36 Bab73,443.84 ± 7563.05 ABa132,227.38 ± 6079.73 ABa86,599.04 ± 2653.80 Aa142,105.78 ± 14,939.71 Aa69,451.88 ± 7983.52 Bab
Bound026,713.94 ± 1716.72 Ac35,327.94 ± 1779.67 Ac26,713.94 ± 1716.72 Ad35,327.94 ± 1779.67 Ab26,713.94 ± 1716.72 Ac35,327.94 ± 1779.67 Ac
535,620.91 ± 2329.23 Cb38,757.48 ± 4284.71 Babc52,257.22 ± 1468.35 Bb37,251.96 ± 5363.84 Bb60,153.19 ± 2011.80 Aa62,487.56 ± 3433.06 Aa
1038,756.19 ± 1271.76 Bb44,247.08 ± 3402.53 Babc42,648.56 ± 3361.89 Bc44,303.21 ± 3338.43 Bab51,675.05 ± 557.23 Ab65,116.12 ± 1368.15 Aa
1543,381.45 ± 1783.12 Ba47,819.04 ± 8141.35 Ba42,412.38 ± 1839.14 Bc47,245.65 ± 3919.57 Ba54,078.59 ± 847.79 Ab57,865.11 ± 2254.83 Aab
2030,671.23 ± 428.67 Bc35,959.22 ± 2921.19 Bbc57,259.49 ± 481.41 Aa53,245.02 ± 1611.66 Aa59,348.05 ± 611.44 Aa57,353.13 ± 1559.83 Aab
2547,601.28 ± 1661.88 Ba44,998.94 ± 5707.49 Aab57,141.52 ± 1658.52 Aa50,099.95 ± 1380.39 Aa56,056.22 ± 3748.59 Aab50,706.20 ± 461.72 Ab
Total0153,647.71 ± 12,437.01 Aab98,570.71 ± 9986.88 Aabc153,647.71 ± 12,437.01 Ab98,570.71 ± 9986.88 Ab153,647.71 ± 12,437.01 Ac98,570.71 ± 9986.88 Ac
5147,583.44 ± 4963.35 Bab84,497.42 ± 2358.73 Bc162,366.39 ± 12,171.36 Bab99,820.15 ± 15,989.80 Bb200,462.41 ± 3815.81 Aa129,514.79 ± 7742.89 Aab
10146,042.64 ± 6722.55 Bab86,726.97 ± 3485.91 Cbc158,712.54 ± 9910.76 Bb117,955.15 ± 8958.21 ABab189,196.16 ± 16,707.27 Aab141,769.65 ± 7077.78 Aa
15161,762.57 ± 1624.49 Aa105,667.15 ± 9614.67 Bab159,028.24 ± 13,761.56 Ab128,038.54 ± 3053.38 Aa168,197.01 ± 10,293.80 Abc130,157.84 ± 7671.16 Aab
20129,963.68 ± 14,677.97 Bb94,263.34 ± 7798.23 Bbc175,496.58 ± 11,179.21 Aab127,864.43 ± 3474.63 Aa175,486.16 ± 4889.39 Aabc115,532.10 ± 2459.68 Abc
25158,921.44 ± 21,128.69 Bab118,442.78 ± 12,469.45 Ba189,368.91 ± 7161.58 Aa136,698.99 ± 3991.46 Aa198,161.99 ± 17,200.48 Aa120,158.08 ± 8049.22 ABb
The values are the average of three repetitions. Means (n = 3) ± standard deviation. Different uppercase letters within each column indicate that the treatments were statistically different according to Tukey’s test (p ≤ 0.05). Different lowercase letters within each row indicate that the concentrations were statistically different according to Tukey’s test (p ≤ 0.05).
Disclaimer/Publisher’s Note: The statements, opinions and data contained in all publications are solely those of the individual author(s) and contributor(s) and not of MDPI and/or the editor(s). MDPI and/or the editor(s) disclaim responsibility for any injury to people or property resulting from any ideas, methods, instructions or products referred to in the content.