1. Introduction
Soil carbon (C) and nitrogen (N) concentrations are standing pools rather than direct measures of biogeochemical activity. Their sizes reflect the cumulative balance among organic inputs, microbial transformation, physicochemical stabilization, plant uptake, and hydrological or gaseous losses [
1,
2]. A large soil organic C (SOC) or total N pool may therefore coexist with slow short-term turnover when a substantial proportion of the retained material is physically protected, mineral-associated, chemically resistant, or otherwise inaccessible to microorganisms [
3]. Conversely, relatively small organic pools may support substantial microbial processing when environmental conditions increase substrate accessibility or favor rapid nutrient transformation [
4]. Distinguishing the amount of resource retained from the microbial capacity to process that resource is consequently essential for understanding how land-use change affects soil functioning. Conversion of tropical forests to managed agricultural systems can alter both components of this relationship. Removal of forest vegetation modifies litter inputs, root turnover, and rhizosphere processes, whereas subsequent cultivation changes soil disturbance, aeration, hydrology, acidity, nutrient inputs, and the physical protection of organic matter [
5,
6]. Forest conversion frequently reduces SOC and total N, but its effects on nutrient availability, microbial biomass, extracellular enzyme activity, and N-transformation pathways vary among management systems and with time since conversion [
6,
7]. The functional consequences of a given change in SOC or total N therefore depend on the environmental filters established by the subsequent land use and on how these filters regulate microbial access to the resources that remain [
8]. Forest conversion should thus be examined not only in terms of changes in individual soil pools, but also in terms of how the resulting land-use legacy reorganizes the relationship between resource status and microbial functional potential.
This distinction is particularly relevant when a common forest type is converted to agricultural systems with contrasting vegetation, organic inputs, hydrological regimes, and management histories [
9,
10]. Agroforestry can maintain perennial vegetation and pathways of litter, root, and manure input, potentially preserving some features of forest nutrient cycling [
11,
12]. However, these effects are not inherent to all agroforestry systems and depend on system design, vegetation composition, animal integration, management intensity, and time since establishment [
13,
14]. Paddy cultivation establishes a markedly different soil environment through puddling, fertilization, residue management, and repeated transitions between flooded and drained conditions [
9]. These practices modify redox dynamics, soil structure, nutrient availability, microbial habitats, and the relative importance of aerobic and anaerobic transformations [
15]. Agroforestry and paddy cultivation may therefore produce distinct soil biogeochemical configurations even when both originate from the same forest type. Their comparison can reveal contrasting land-use legacies; however, land-use type, management regime, and time since conversion vary simultaneously, and their individual effects therefore cannot be separated.
Total N provides limited information about the chemical organization and potential accessibility of soil organic N [
16]. Soil organic N comprises compounds that differ in their biological origin, molecular structure, association with minerals, and susceptibility to microbial depolymerization [
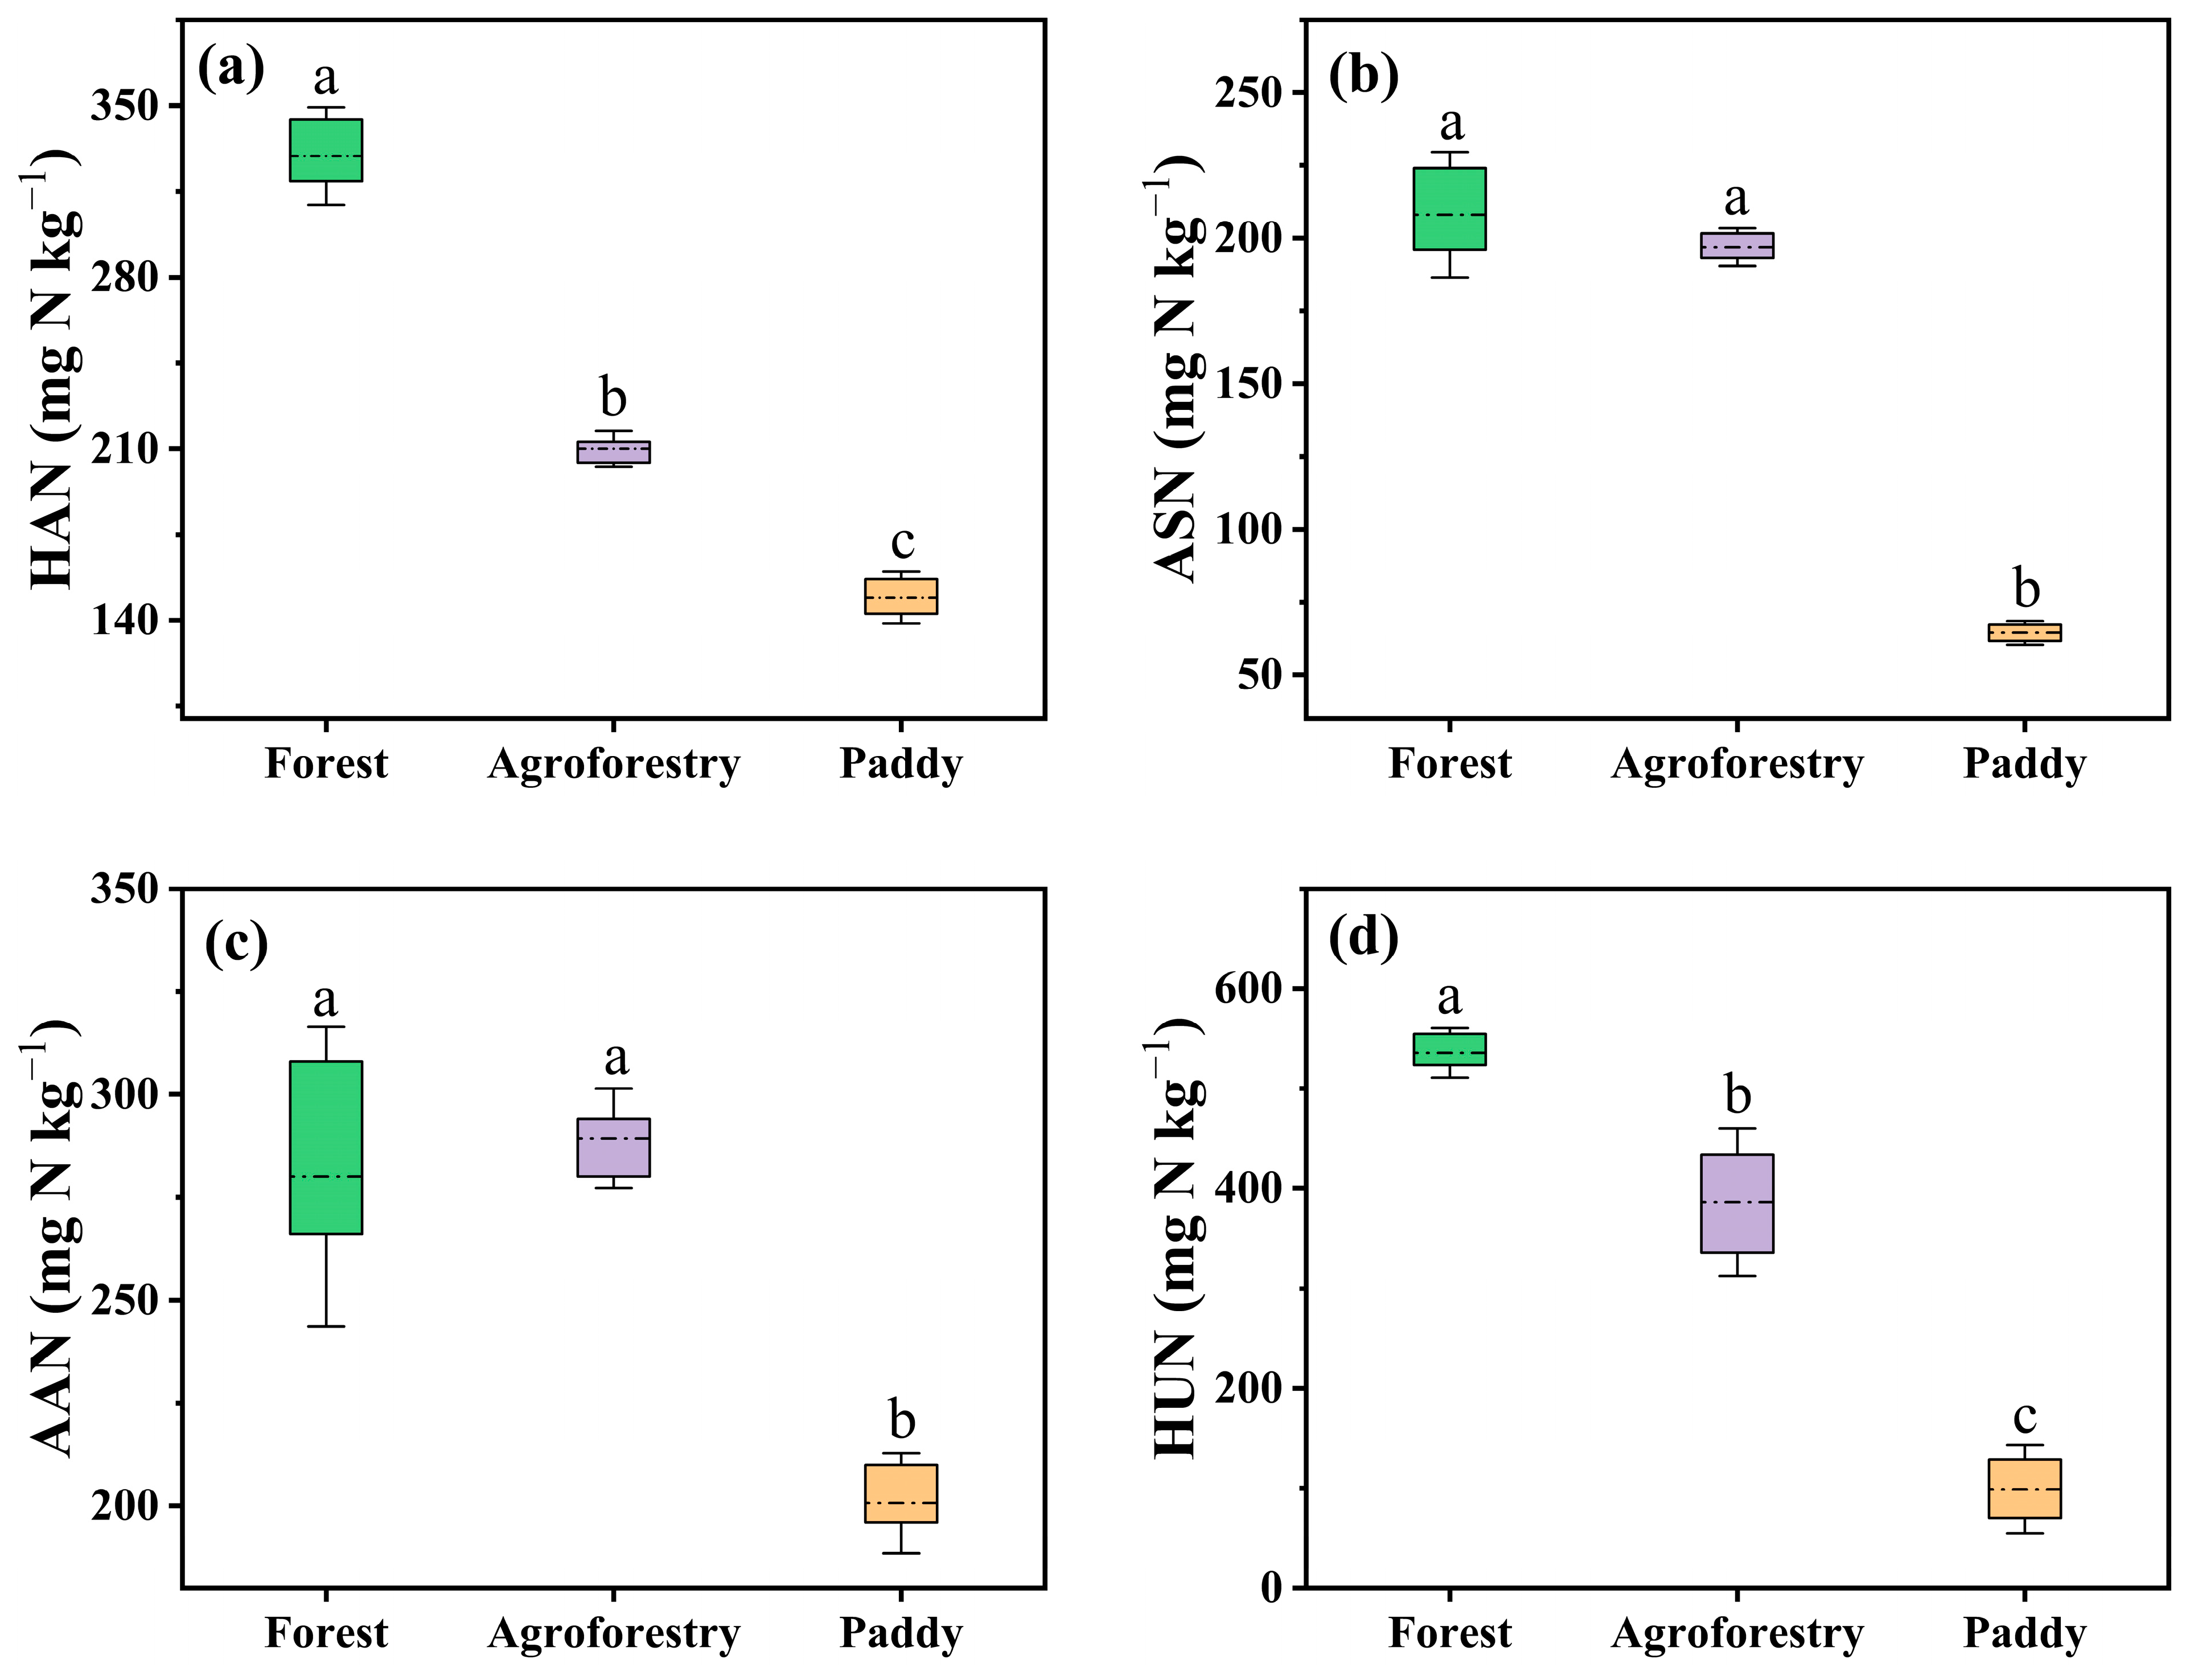
17]. Acid hydrolysis operationally separates part of this pool into hydrolyzable ammonium N (HAN), amino sugar N (ASN), amino acid N (AAN), and hydrolyzable unidentified N (HUN) [
18,
19]. These fractions are not direct measurements of immediately available N; instead, they characterize differences in the composition of the hydrolyzable organic N pool and its potential contribution to longer-term N supply [
20]. Their measurement can therefore indicate whether contrasting land-use legacies are associated with broad changes in organic N status or with disproportionate responses among fractions linked to amino compounds, microbial residues, and unidentified hydrolyzable materials [
21]. The functional significance of these organic pools depends partly on microbial access to them. Decomposition of complex organic substrates requires extracellular depolymerization before their products can be assimilated by microbial cells [
17]. β-1,4-glucosidase contributes to microbial C acquisition, β-1,4-N-acetylglucosaminidase and leucine aminopeptidase contribute to organic N acquisition, and acid phosphatase contributes to organic phosphorus (P) acquisition [
22,
23]. Their potential activities reflect microbial investment in resource acquisition, but they are also influenced by microbial biomass and physiological state, nutrient demand, enzyme stabilization, substrate accessibility, and assay conditions [
24]. They should therefore be interpreted as indicators of potential resource-acquisition capacity rather than direct measurements of in situ decomposition. Importantly, enzyme activity need not vary proportionally with the size of the corresponding organic-resource pool. High activity may accompany abundant accessible substrates, but it may also reflect intensified microbial investment in acquiring resources that have become scarce or difficult to access [
25]. Conversely, soils containing large organic pools may exhibit comparatively low potential activity when those resources are physically protected, chemically resistant, or insufficient to induce enzyme production [
26]. Land-use conversion may therefore alter not only organic-resource status and enzyme activities individually but also the degree of correspondence between them. Evaluating both dimensions is necessary to test whether contrasting land-use legacies preserve resource–function alignment or generate a mismatch between retained organic resources and microbial resource-acquisition potential.
The balance between retained organic resources and microbial functional potential may be particularly consequential for soil N
2O emissions. Forest conversion can reduce SOC and organic N pools while simultaneously altering pH, aeration, redox dynamics, mineral N availability, and nutrient inputs—all of which regulate the microbial transformation of the resources that remain [
27]. Consequently, soils with depleted organic-resource pools may not exhibit proportionally lower N-cycling activity. Instead, management legacies may increase substrate turnover, microbial resource-acquisition investment, or the abundance of N-transforming functional groups, thereby sustaining or enhancing N
2O production potential despite lower SOC and organic N concentrations [
28]. This possibility is especially relevant to paddy soils, where long-term fertilization and repeated flooding–drainage cycles can create alternating conditions favorable to nitrification, denitrification, and the coupling of their products [
9]. Net N
2O release then emerges from the interaction between available substrates, microbial acquisition capacity, the size and relative organization of nitrifying and denitrifying guilds, and the environmental regulation of N
2O production and reduction [
29,
30]. Measurements of AOA-
amoA, AOB-
amoA,
nirK,
nirS, and
nosZ, together with their abundance ratios, can characterize relevant components of this functional organization [
31,
32], while potential enzyme activities indicate microbial investment in accessing C, N, and P resources. CO
2 release provides a complementary expression of overall microbial C processing under the same conditions [
33]. Integrating these measurements therefore makes it possible to test whether differences in potential N
2O emissions primarily coincide with the amount of organic resources retained in soil or with a broader functional configuration that remains highly active relative to those resources.
Despite substantial progress in documenting land-use effects on soil organic matter, microbial biomass, extracellular enzymes, N-cycling communities, and greenhouse gas emissions [
7,
27], it remains unclear whether these responses remain functionally aligned after forest conversion. These measurements occupy different positions along a resource pool functional capacity–process response continuum: organic C and N fractions characterize retained-resource status, extracellular enzymes represent potential resource-acquisition capacity, functional-gene abundances describe selected components of microbial metabolic potential, and gas emissions integrate the net expression of production and consumption processes under the measurement conditions. Changes at one level cannot therefore be assumed to propagate proportionally to the next [
34]. Nevertheless, these dimensions are commonly interpreted separately or related through pairwise correlations and ordination, approaches that reveal differences and covariation but do not directly quantify whether microbial functional potential is high or low relative to the organic resources retained in soil [
35]. The central unresolved issue is therefore whether contrasting land-use legacies preserve correspondence between organic-resource status and microbial functional potential or shift these dimensions disproportionately, and whether such shifts are reflected in potential gaseous emissions.
To examine this issue, we used a domain-based framework that represented organic-resource status and microbial functional potential independently before comparing their relative configuration. SOC, total N, microbial biomass C (MBC), and hydrolyzable organic N fractions were integrated into a study-specific organic resource retention index (ORRI), whereas extracellular enzyme activities and N-cycling functional-gene abundances were integrated into a microbial functional activation index (MFAI). Their difference was expressed as an organic resource–microbial activation imbalance index (ORMAI), with positive values indicating greater functional potential relative to organic-resource status and negative values indicating the converse. These indices were designed as complementary summaries of the measured domains, not as universal measures of soil quality or substitutes for their constituent variables. Importantly, N2O and CO2 emissions were excluded from index construction, allowing their associations with the resulting resource–function configuration to be evaluated without mathematical circularity.
We applied this framework to soils under reference natural secondary forest, six-year poultry-integrated agroforestry, and approximately 60-year paddy cultivation. Both managed systems originated from the same regional forest type but differed in vegetation, management, hydrological regime, and conversion history. This comparison is particularly relevant to Hainan Province, where warm and humid tropical conditions favor rapid organic-matter turnover and nutrient transformation, potentially increasing the sensitivity of soil C and N cycling to land-use change [
36,
37]. In the present study, forest conversion in Wenchang was represented by two contrasting land-use systems: poultry-integrated agroforestry and long-established paddy cultivation, which differed markedly in vegetation, organic inputs, disturbance, fertilization, and hydrological regimes. Establishing whether these pathways preserve soil organic-resource status or generate microbial functional and N
2O-production potentials that are disproportionate to the remaining resource base is important for evaluating the regional biogeochemical consequences of forest conversion. Such evidence can also help distinguish land-management trajectories that better reconcile agricultural use with the conservation of soil resources and the limitation of potential gaseous N losses in tropical agricultural landscapes. We characterized soil physicochemical properties, microbial biomass, hydrolyzable organic N fractions, potential extracellular enzyme activities, and N-cycling functional-gene abundances and evaluated potential N
2O and CO
2 production under common incubation conditions. AOA-
amoA/AOB-
amoA and (
nirK +
nirS)/
nosZ abundance balances were additionally calculated to characterize the relative organization of ammonia-oxidizing and denitrification-related groups. This design enabled us to determine whether contrasting land-use legacies were associated only with changes in individual properties or with a coordinated reorganization of organic-resource status, microbial functional potential, and potential gaseous responses.
We addressed three questions: (1) how do the three land-use systems differ in organic-resource status and microbial functional potential; (2) do the relative abundance balances of ammonia-oxidizing and denitrification-related groups differ among the systems; and (3) are potential N2O and CO2 emissions associated more closely with individual resource pools or with the relative balance between organic-resource status and microbial functional potential? We hypothesized that (H1) both managed systems would have lower organic-resource status than the reference forest, with the largest reduction under long-term paddy cultivation; (H2) the management and hydrological legacy of paddy cultivation would be associated with greater potential enzyme activities, larger N-cycling functional groups, an increased N2O production-to-reduction gene-abundance balance, and greater potential N2O and CO2 production; and (H3) potential N2O production would be associated more strongly with microbial functional potential and a positive resource–function imbalance than with SOC, total N, or individual hydrolyzable organic N fractions alone. By testing these hypotheses, we evaluated whether forest conversion changes not only the quantities of retained resources and microbial functional attributes but also the proportional relationship between them.
2. Materials and Methods
2.1. Study Area and Land-Use History
The study was conducted in Wenchang City, Hainan Province, southern China. Based on the available field records, the sampling sites were located within an approximate geographical range of 19°39′–19°45′ N, 110°40′–110°44′ E. The region has a tropical monsoon climate, with a mean annual temperature of approximately 25.0 °C, mean annual precipitation of approximately 1500 mm, and mean annual evaporation of approximately 500 mm. The study sites were selected within the same regional climatic and soil-forming environment to minimize variation unrelated to land use. The three land-use systems shared a comparable regional soil-forming background. All sampling sites occurred within the same soil mapping unit (SMU 11774), classified as Ferralic Cambisol with a loam surface texture according to the Harmonized World Soil Database v2.0. The study area was also associated with Quaternary unconsolidated sedimentary parent material according to the regional soil environmental background classification (DB46/T 687–2025) [
38]. Thus, the selected sites were comparable in mapped soil type, texture, and parent-material setting.
Three land-use systems were selected in September 2025: natural secondary forest, poultry-integrated agroforestry, and paddy field. The natural secondary forest represented the prevailing reference forest condition in the study region and was used as the reference land-use system. It was dominated by native tropical broad-leaved tree species and had experienced relatively limited recent management disturbance. Both the agroforestry and paddy systems were established through conversion of the same regional natural secondary forest type represented by the reference sites. The poultry-integrated agroforestry system had been established approximately 6 years before sampling through conversion of the same natural forest type. It consisted primarily of perennial cash crops, including areca nut, citrus, and coconut, integrated with free-ranging poultry such as chickens, ducks, and geese. The system received organic inputs from litter deposition, root turnover, crop residues, and poultry excreta. The paddy fields had also been established through conversion of the same natural forest type and had been cultivated for 60 years. They represented a long-term, intensively managed agricultural system characterized by rice cultivation, fertilization, and periodic flooding and drainage. Soil sampling was conducted approximately two weeks after rice harvest. The paddy fields had remained without managed surface flooding for approximately four to five weeks before sampling, including the pre-harvest drainage period. At sampling, the fields contained neither a standing crop nor surface water, although the soil remained moist under the prevailing humid tropical conditions.
Within each land-use system, the three replicate sites had comparable land-use histories, vegetation or cropping characteristics, and management durations. The selected systems therefore represented two contrasting forest-conversion pathways: relatively recent conversion to poultry-integrated agroforestry and long-term conversion to paddy cultivation. Because land-use type, management regime, and time since conversion varied concurrently, the comparison was designed to evaluate the integrated soil legacies associated with the two conversion pathways rather than to isolate the effect of conversion duration alone.
2.2. Soil Sampling and Sample Preparation
Each land-use system was represented by three spatially independent replicate sites, giving a total of nine independent field replicates. Replicate sites were separated by more than 3 km to ensure spatial independence. All samples were collected on the same day and using an identical sampling procedure. At each replicate site, the surface litter layer and loose aboveground residues were carefully removed before sampling. Five soil cores, each 5 cm in diameter, were collected from the 0–20 cm mineral soil layer using a five-point sampling method across an approximately 20 m × 20 m area, with one point near the center and four points toward the surrounding corners. The five cores collected within each site were thoroughly homogenized to form one composite sample representing that independent field replicate. The exact minimum distance between individual soil cores was not recorded, but the five-point layout ensured that cores were spatially distributed across the replicate site to reduce microsite bias. Composite samples from different replicate sites were retained and processed separately throughout the study. Thus, each land-use system comprised three independent field-level composite samples (n = 3). The nine composite samples were placed individually in sterile polyethylene bags and transported to the laboratory under cooled conditions. Visible roots, stones, and recognizable plant and animal residues were removed, after which the samples were gently homogenized and passed through a 2 mm sieve.
Each field replicate was then divided into three portions. One portion was air-dried for the determination of soil particle-size distribution, basic physicochemical properties, and organic N fractions. A second portion was maintained fresh at 4 °C for the determination of inorganic N, microbial biomass, extracellular enzyme activities, and laboratory incubation. The third portion was stored at −80 °C until DNA extraction and quantitative PCR analysis. Samples from the nine independent field replicates were kept separate throughout sample preparation, laboratory measurements, incubation, and statistical analysis.
2.3. Determination of Soil Physicochemical Properties
The soil pH was determined by the potentiometric method with a soil-to-water ratio of 1:2.5. Soil NH
4+-N and NO
3−-N were extracted with 2 M KCl solution at a ratio of 1:5 (soil:water) and determined by spectrophotometer (Shanghai Metash Instruments Co., Ltd., Shanghai, China). Soil organic carbon (SOC) was determined by the potassium dichromate-sulfuric acid oxidation method, and total N was determined using the semi-micro Kjeldahl method. Total P was measured by the molybdenum-antimony colorimetric method after digestion. Soil MBC, microbial biomass N (MBN), and microbial biomass P (MBP) were measured using the chloroform fumigation-extraction method and calculated using the corresponding conversion factors. Soil acid-hydrolyzable N fractions, including AHN, HAN, ASN, and AAN, were determined following established organic N fractionation procedures [
20]. HUN was calculated as the difference between AHN and the sum of HAN, ASN, and AAN.
2.4. Determination of N2O and CO2 Emissions
A 32-day laboratory incubation experiment was conducted to evaluate potential N
2O and CO
2 emissions from soils under different land-use types. For each land-use type, three incubation replicates were prepared from the corresponding homogenized composite soil sample, and blank controls were established to exclude system errors. Three treatment groups were established: natural secondary forest soil, poultry-integrated agroforestry soil, and paddy soil. For each incubation replicate, a fresh-soil subsample equivalent to 20 g of oven-dry soil was placed into each bottle, and distilled water was added to adjust soil moisture to 40% water-holding capacity. All serum bottles were covered with perforated plastic wrap to maintain aerobic conditions and pre-incubated in the dark at 25 °C for 7 days to restore and stabilize soil microbial activity. After pre-incubation, urea solution was added to each bottle to achieve an exogenous N addition rate of 150 mg N kg
−1 dry soil, and soil moisture was adjusted again to 60% water-holding capacity. Urea was added at 150 mg N kg
−1 dry soil to provide a common N-substrate challenge across the three land-use systems, following [
39]. This standardized addition was intended to reduce variation arising from differences in initial mineral-N supply and to permit comparison of the potential N
2O response associated with the properties retained under each land-use legacy. The dose was not intended to reproduce a specific field fertilizer application rate; therefore, the resulting emissions were interpreted as comparative potentials under the imposed incubation conditions rather than as estimates of field-scale fertilizer-induced emissions. The serum bottles were then incubated at 25 °C. During incubation, the bottles were weighed regularly, and deionized water was added to maintain relatively stable soil moisture.
Gas samples were collected on incubation days 1, 2, 4, 7, 11, 15, 23, and 32. Cumulative N
2O and CO
2 emissions over the 32-day incubation period were calculated separately for each replicate using trapezoidal integration, with the Day 1 flux used to represent the Day 0–1 interval; the detailed equation is provided in the note to
Table S3. Before each gas collection, the bottles were sealed for a fixed enclosure period to allow headspace gas accumulation, after which sterilized 25 mL glass syringes were used for gas sampling. Before sampling, residual gas in the syringe was expelled, the serum bottle septum was disinfected, and the needle was inserted vertically through the septum. A 15 mL gas sample was withdrawn from the bottle, and the syringe plunger was pushed and pulled 5–6 times to ensure thorough mixing of the headspace gas. After gas collection, the bottle cap was opened, and the bottle was again covered with perforated plastic wrap to maintain gas exchange during incubation. N
2O concentrations were measured using a Shimadzu GC-2014 gas chromatograph. The detection conditions were as follows: a mixed gas of 95% argon and 5% methane was used as the carrier gas, high-purity N
2 was used as the backflush gas, the gas flow rate was 25 mL min
−1, the column temperature was 50 °C, and the detector temperature was 300 °C. CO
2 concentrations were measured simultaneously from the same gas samples and used to calculate CO
2 emission dynamics during incubation. Gas emission rates were calculated from the increase in headspace gas concentration during the enclosure period and standardized by dry soil mass. Cumulative emissions were estimated by linear interpolation between adjacent sampling dates and summing emissions across the 32-day incubation. Thus, the reported gas data represent incubation-derived potential emissions rather than direct field fluxes.
2.5. Measurement of Soil Extracellular Enzyme Activities
Soil extracellular enzyme activities were measured using a microplate fluorometric method following established fluorometric enzyme assay procedures [
40], including β-glucosidase, N-acetyl-β-D-glucosaminidase, leucine aminopeptidase, and acid phosphatase. Fresh soil (1.0000 g) was placed into a 250 mL conical flask, mixed with 125 mL acetate buffer (pH 5.0), and magnetically stirred for 5 min to prepare a soil suspension. Then, 200 μL of the soil suspension was added to a 96-well microplate, followed by 50 μL of the corresponding fluorogenic substrate solution. The substrates for acid phosphatase, β-glucosidase, N-acetyl-β-D-glucosaminidase, and leucine aminopeptidase were 4-MUB-phosphate, 4-MUB-β-D-glucopyranoside, 4-MUB-N-acetyl-β-D-glucosaminide, and L-leucine-7-amido-4-methylcoumarin, respectively. After incubation in the dark at 25 °C for 4 h, 10 μL of 1 mol L
−1 NaOH was added to terminate the reaction, and fluorescence intensity was measured at an excitation wavelength of 365 nm and an emission wavelength of 450 nm. A standard curve was constructed using 4-MUB standard solution to calculate acid phosphatase, β-glucosidase, and N-acetyl-β-D-glucosaminidase activities; leucine aminopeptidase activity was converted based on the corresponding AMC fluorescent product. Enzyme activities were expressed as nmol g
−1 h
−1.
2.6. DNA Extraction and Quantitative PCR Analysis
Total DNA was extracted from 0.5 g soil samples using the Soil Rapid DNA
® Spin Kit (MP Biomedicals, Solon, OH, USA) according to the manufacturer’s instructions. The extracted DNA was stored at −20 °C until qPCR analysis. DNA concentration and purity were determined using a NanoDrop 2000 spectrophotometer (Thermo Fisher Scientific, Wilmington, DE, USA). Absolute quantitative PCR was performed using the SYBR Green method on an ABI 7500 real-time PCR system (Applied Biosystems, Foster City, CA, USA) to quantify the abundances of the archaeal ammonia monooxygenase gene (AOA-
amoA), bacterial ammonia monooxygenase gene (AOB-
amoA), nitrite reductase genes (
nirK and
nirS), and nitrous oxide reductase gene (
nosZ). These genes were used as functional markers for ammonia oxidation, nitrite reduction, and N
2O reduction [
41]. Primer sequences and amplicon sizes for each target gene are provided in
Table S1.
The qPCR reaction mixture had a total volume of 25 μL, containing 12.5 μL Bestar SybrGreen qPCR MasterMix (DBI Bioscience, Shanghai, China), 0.25 μL forward primer (10 μM), 0.25 μL reverse primer (10 μM), 1 μL DNA template, and 11 μL sterile ddH2O. The qPCR amplification program was as follows: initial denaturation at 95 °C for 2 min, followed by 45 cycles of 95 °C for 10 s and 60 °C for 1 min, followed by melting curve analysis. Plasmid DNA containing representative cloned fragments of the target genes was used as the qPCR standard, and standard templates were serially diluted by 10-fold gradients across seven orders of magnitude to generate standard curves. Product specificity was verified by melting curve analysis, and no-template controls were included by replacing DNA templates with sterile water. Gene copy numbers in the qPCR template were converted to copies g−1 dry soil using the template copy concentration, dilution factor, DNA elution volume, and dry soil mass used for DNA extraction. Functional gene abundances were log10-transformed before statistical analysis.
2.7. Derived Functional-Gene Balance and Resource–Activation Indices
To characterize relative functional balances within the soil N-cycling community, two gene-abundance indices were calculated separately for each field replicate using the original, untransformed gene-copy abundances. The ammonia-oxidizer balance was expressed as [
42]:
Higher values indicate greater relative dominance of archaeal over bacterial ammonia oxidizers. A genetic N
2O production-to-reduction balance was calculated as [
43]:
where the original
nirK and
nirS copy abundances were summed before division by the original
nosZ abundance and subsequent log
10 transformation. Higher values indicate a greater relative abundance of genes associated with nitrite reduction, a potential N
2O-producing step, relative to the gene associated with N
2O reduction. These indices represent relative gene-abundance balances and not direct measurements of nitrification, denitrification, or net N
2O production rates.
To quantify the balance between soil organic-resource retention and microbial functional activation, three study-specific composite indices were subsequently constructed using replicate-level data [
44,
45]. Cumulative N
2O and CO
2 emissions were excluded from index construction and retained as independent response variables. Before index calculation, each constituent variable was standardized across the nine samples as [
45]:
where
is the value of variable
in sample
, and
and
are the overall mean and sample standard deviation of variable
, respectively. Functional gene abundances were log
10-transformed before standardization. The organic resource retention index (ORRI) incorporated two equally weighted domains [
45]. The bulk organic-resource domain was calculated as:
where TN is total N.
The organic N-resource domain was calculated as:
ORRI was then calculated as:
Higher ORRI values therefore indicate greater retention of bulk soil organic resources and hydrolyzable organic N fractions. The microbial functional activation index (MFAI) was also constructed from two equally weighted domains [
45]. The extracellular-enzyme domain was calculated as:
AP, BG, NAG, and LAP are acid phosphatase, β-glucosidase, N-acetyl-β-D-glucosaminidase, and leucine aminopeptidase, respectively. The N-cycling functional-gene domain was calculated as:
Higher MFAI values indicate greater combined potential extracellular enzyme activity and abundance of N-cycling functional groups. Finally, the organic resource–microbial activation imbalance index (ORMAI) was calculated as:
Positive ORMAI values indicate that microbial functional activation was high relative to organic-resource retention, whereas negative values indicate comparatively stronger organic-resource retention than functional activation. Equal weighting of the constituent domains prevented groups represented by a larger number of variables from disproportionately influencing the composite indices [
45].
2.8. Statistical Analysis
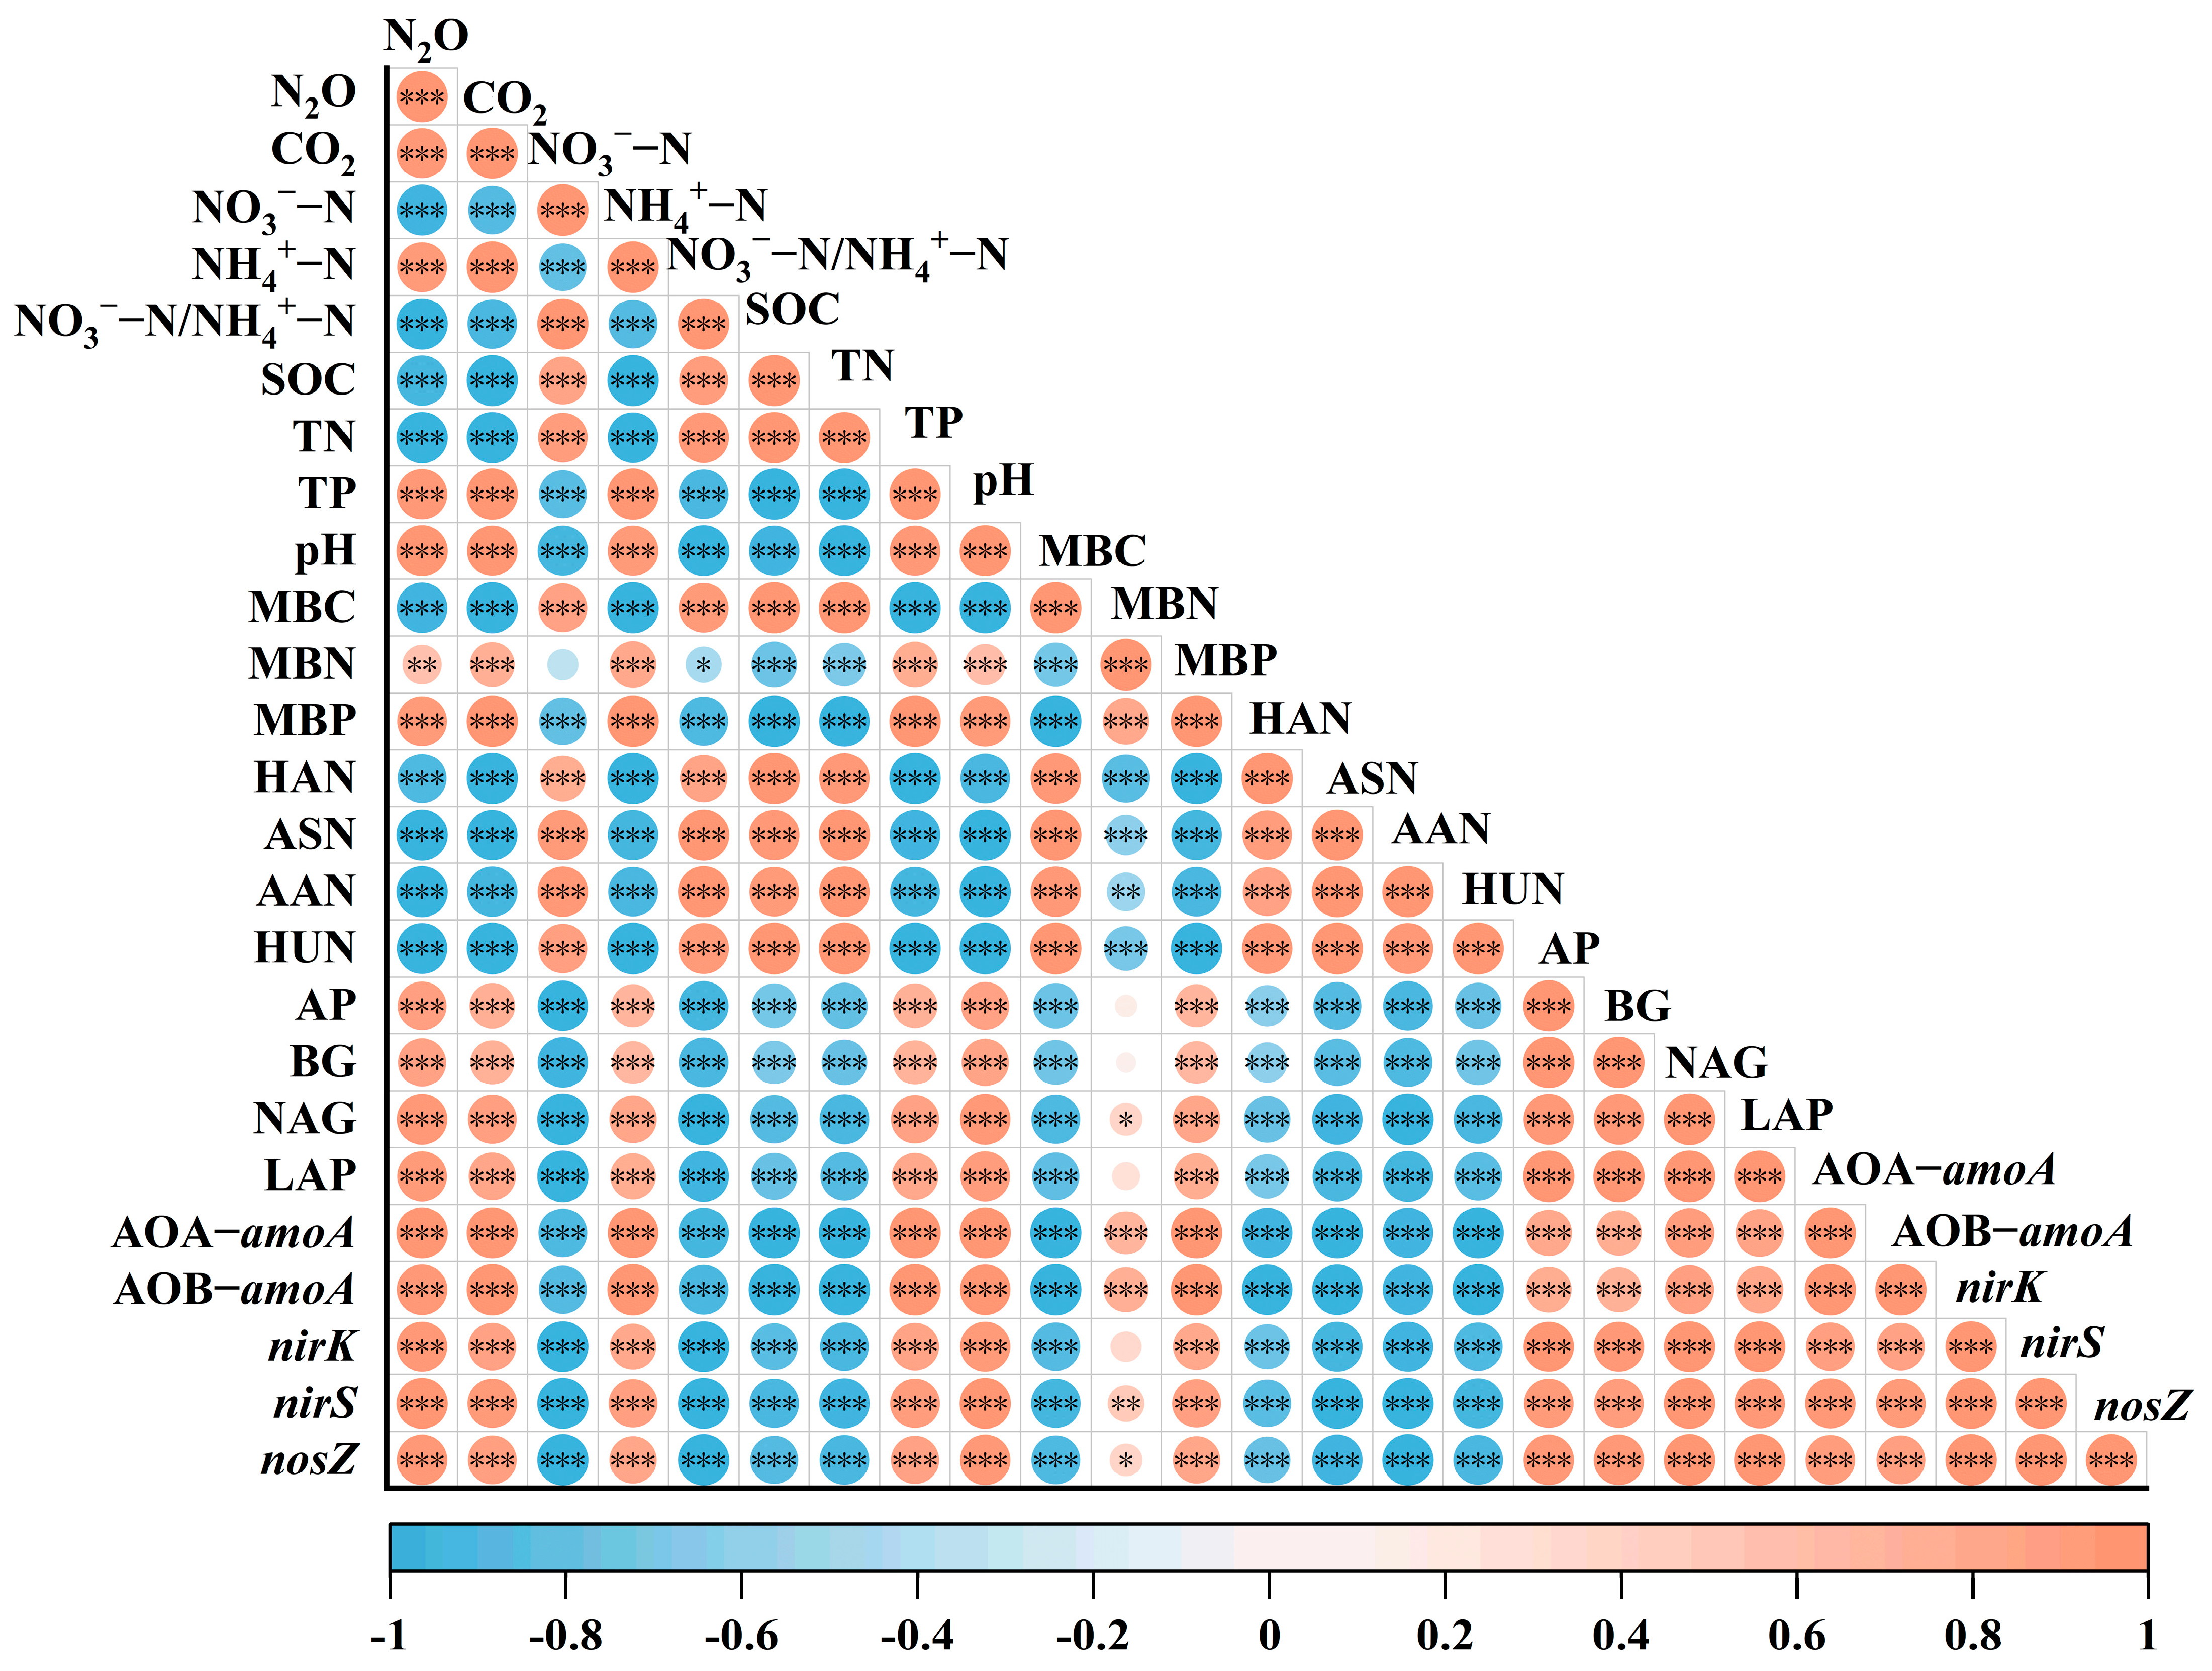
Experimental data were organized using Excel 2019. Analysis of variance (ANOVA) combined with Tukey’s HSD test was used to analyze intergroup differences in soil physicochemical properties, mineral N, organic N fractions, microbial biomass, extracellular enzyme activities, N-cycling functional gene abundances, and cumulative N2O and CO2 emissions among land-use types (p < 0.05). The temporal dynamics of N2O and CO2 emissions were analyzed using repeated-measures ANOVA. Pearson’s correlation analysis was employed to assess the associations between greenhouse gas emissions and soil biochemical properties, extracellular enzyme activities, and N-cycling functional genes (p < 0.05). Differences in the gene-abundance balance indices, ORRI, MFAI, and ORMAI among land-use systems were assessed using one-way ANOVA followed by Tukey’s HSD test. Pearson correlations were used to evaluate their associations with cumulative N2O and CO2 emissions. The robustness of ORMAI was evaluated by sequentially excluding each constituent variable and recalculating the index. An alternative calculation in which all individual variables received equal weight was also performed to assess sensitivity to the domain-weighting procedure. PERMANOVA based on Euclidean distances was used to evaluate differences in the z-score-standardized soil-resource and microbial functional profiles among land-use systems, and PERMDISP was used to test homogeneity of multivariate dispersion. Except for PERMANOVA and PERMDISP, statistical analyses and correlation analyses were performed using IBM SPSS Version 24, and corresponding charts were drawn using Origin 2021. PERMANOVA and PERMDISP were performed using R 4.4.1 with the vegan package (version 2.7-5).
4. Discussion
Contrasting land-use legacies reorganized the relationship between soil organic-resource status and microbial functional potential rather than shifting these dimensions proportionally. The clearest expression of this reorganization occurred in the paddy soil, where substantial depletion of SOC, total N, and hydrolyzable organic N fractions coincided with high potential enzyme activities, greater abundances of N-cycling functional groups, and the largest potential N2O and CO2 emissions. Agroforestry represented a different configuration: it retained more organic resources than the paddy soil but exhibited the lowest microbial functional activation and potential N2O production. These contrasting configurations indicate that neither the size of organic-resource pools nor conversion to managed land alone was sufficient to predict microbial functional or emission potential. Rather, the potential N2O response was most clearly expressed when resource status and microbial functional attributes were considered together. The observed patterns were therefore consistent with our hypotheses that managed soils, particularly long-term paddy soil, would have lower organic-resource status than the reference forest, and that high potential N2O production would coincide with greater microbial functional potential relative to retained resources. These conclusions describe associations among contrasting land-use legacies under standardized incubation conditions; they neither isolate the effects of conversion age nor quantify process rates or annual field emissions.
4.1. Contrasting Land-Use Legacies Reorganized Organic-Resource Status and Microbial Nutrient Allocation
The progressive decline in ORRI from the reference forest to agroforestry and paddy soil observed in our study indicates that the managed systems differed markedly in their relative organic-resource status. This pattern supports the first hypothesis, which predicted that both managed systems would have lower organic-resource status than the reference forest, with the largest reduction under long-term paddy cultivation. Here, ORRI represents an integrated index of measured resource concentrations rather than a direct estimate of areal C or N stocks or in situ retention rates. The greater SOC, total N, MBC, and hydrolyzable organic N concentrations in the reference forest are consistent with sustained litter and root inputs, limited soil disturbance, and the physical and chemical stabilization of organic matter under forest vegetation [
7,
10,
46]. Reductions in SOC and total N following conversion of tropical forests to agricultural land have been reported widely; however, their magnitude varies with climate, soil properties, management, and conversion duration [
6,
47]. In the present study, the approximately 30% decline in SOC under agroforestry and 61% decline under paddy cultivation were accompanied by corresponding reductions in total N. Their parallel responses suggest that the change was not restricted to a particular N fraction but occurred within a broader reorganization of the soil organic-matter pool.
The organic N fractions refined this interpretation. HAN and HUN decreased progressively across the forest–agroforestry–paddy comparison, whereas ASN and AAN were maintained at similar concentrations in the forest and agroforestry soils but declined sharply in the paddy soil. This contrast indicates that the agroforestry soil did not simply retain a fixed proportion of every forest-associated N fraction. Instead, some components of the hydrolyzable N pool were more strongly preserved than others [
20]. Amino sugars are commonly associated with microbial residues, whereas amino acid N includes proteinaceous and peptide-derived compounds with diverse stabilization and turnover characteristics [
17,
48]. Their relative maintenance under agroforestry may be compatible with continued perennial-root inputs, organic returns, and microbial residue formation; however, the present measurements cannot distinguish among these sources or determine turnover rates [
48,
49]. Conversely, the consistently low HAN, ASN, AAN, and HUN concentrations in paddy soil indicate broad depletion or redistribution of the measured hydrolyzable organic N pool rather than loss of only one chemical category.
Several mechanisms could contribute to this paddy-associated pattern. Long-term cultivation can alter organic inputs, aggregate protection, mineral–organic associations, and the balance between C stabilization and mineralization [
50]. Periodic drainage may expose previously reduced soil microsites to oxygen, potentially stimulating decomposition of susceptible organic matter, whereas puddling and repeated cultivation can modify soil structure and substrate accessibility [
51,
52]. However, these mechanisms were not measured directly, and long-term paddy management does not invariably reduce SOC or organic N; its effects depend strongly on residue return, fertilization, water regime, and initial soil conditions [
53,
54]. The present results therefore establish a low organic-resource configuration in the sampled paddy soils but do not identify the individual process responsible for its development.
The inorganic and microbial nutrient pools showed that lower organic-resource status did not correspond uniformly to lower nutrient availability. Agroforestry soil contained the highest NO
3−-N concentration and NO
3−-N/NH
4+-N ratio, together with the highest MBN, whereas paddy soil combined a low NO
3−-N/NH
4+-N ratio with high NH
4+-N, total P, MBP, and MBN. These pools are net outcomes of simultaneous production, immobilization, uptake, and loss and cannot be interpreted as direct measures of the underlying transformation rates [
1]. Nevertheless, they demonstrate contrasting nutrient-allocation patterns: agroforestry was associated with relatively oxidized mineral N and strong microbial N accumulation, whereas paddy soil was associated with a greater relative contribution of NH
4+-N and strong microbial P accumulation. The fourfold increase in MBN and MBP under agroforestry relative to the forest, despite lower SOC and total N, further indicates that microbial nutrient pools responded differently from bulk organic-resource concentrations. Thus, the managed systems did not follow a single continuum of generalized soil degradation; they developed distinct distributions of organic, mineral, and microbial nutrients.
4.2. Microbial Functional Potential Did Not Vary in Parallel with Organic-Resource Status
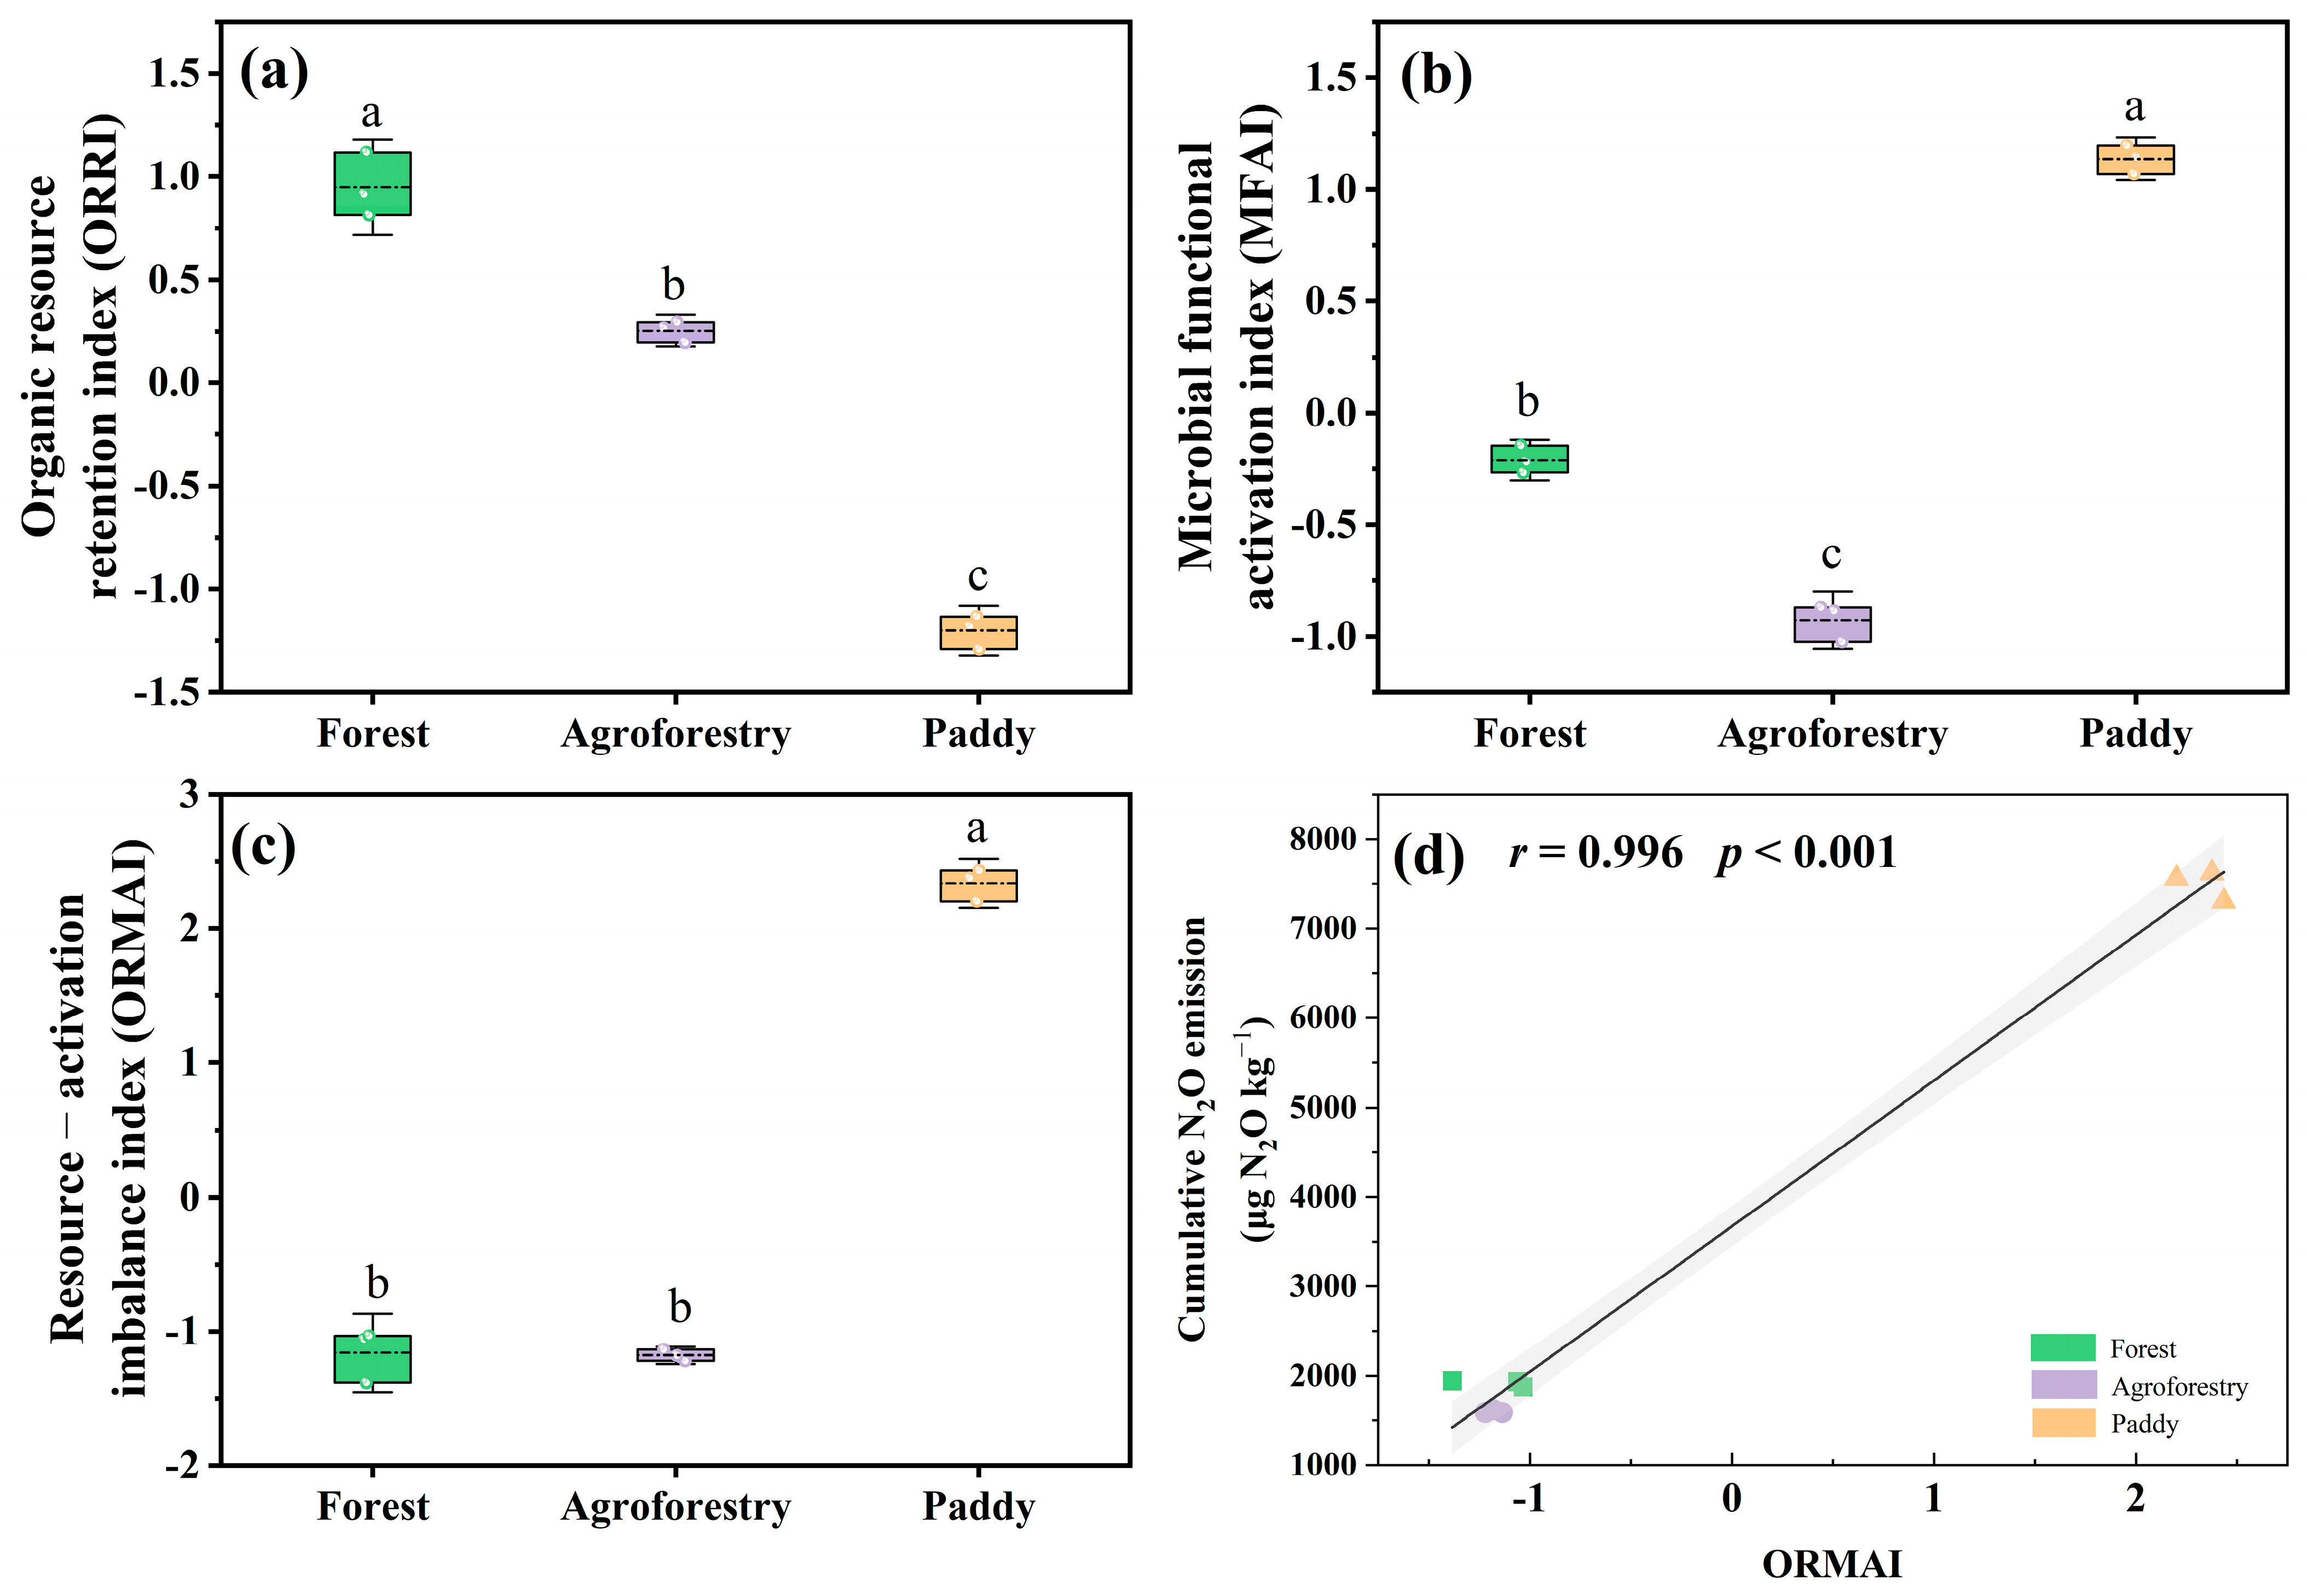
The opposing responses of ORRI and MFAI provide the clearest evidence that organic-resource status and microbial functional potential did not vary in parallel. Paddy soil had the lowest ORRI but the highest MFAI, whereas agroforestry retained an intermediate ORRI while exhibiting the lowest MFAI. This divergence is important because it shows why SOC, total N, or individual organic N fractions cannot be used alone to infer potential microbial functioning.
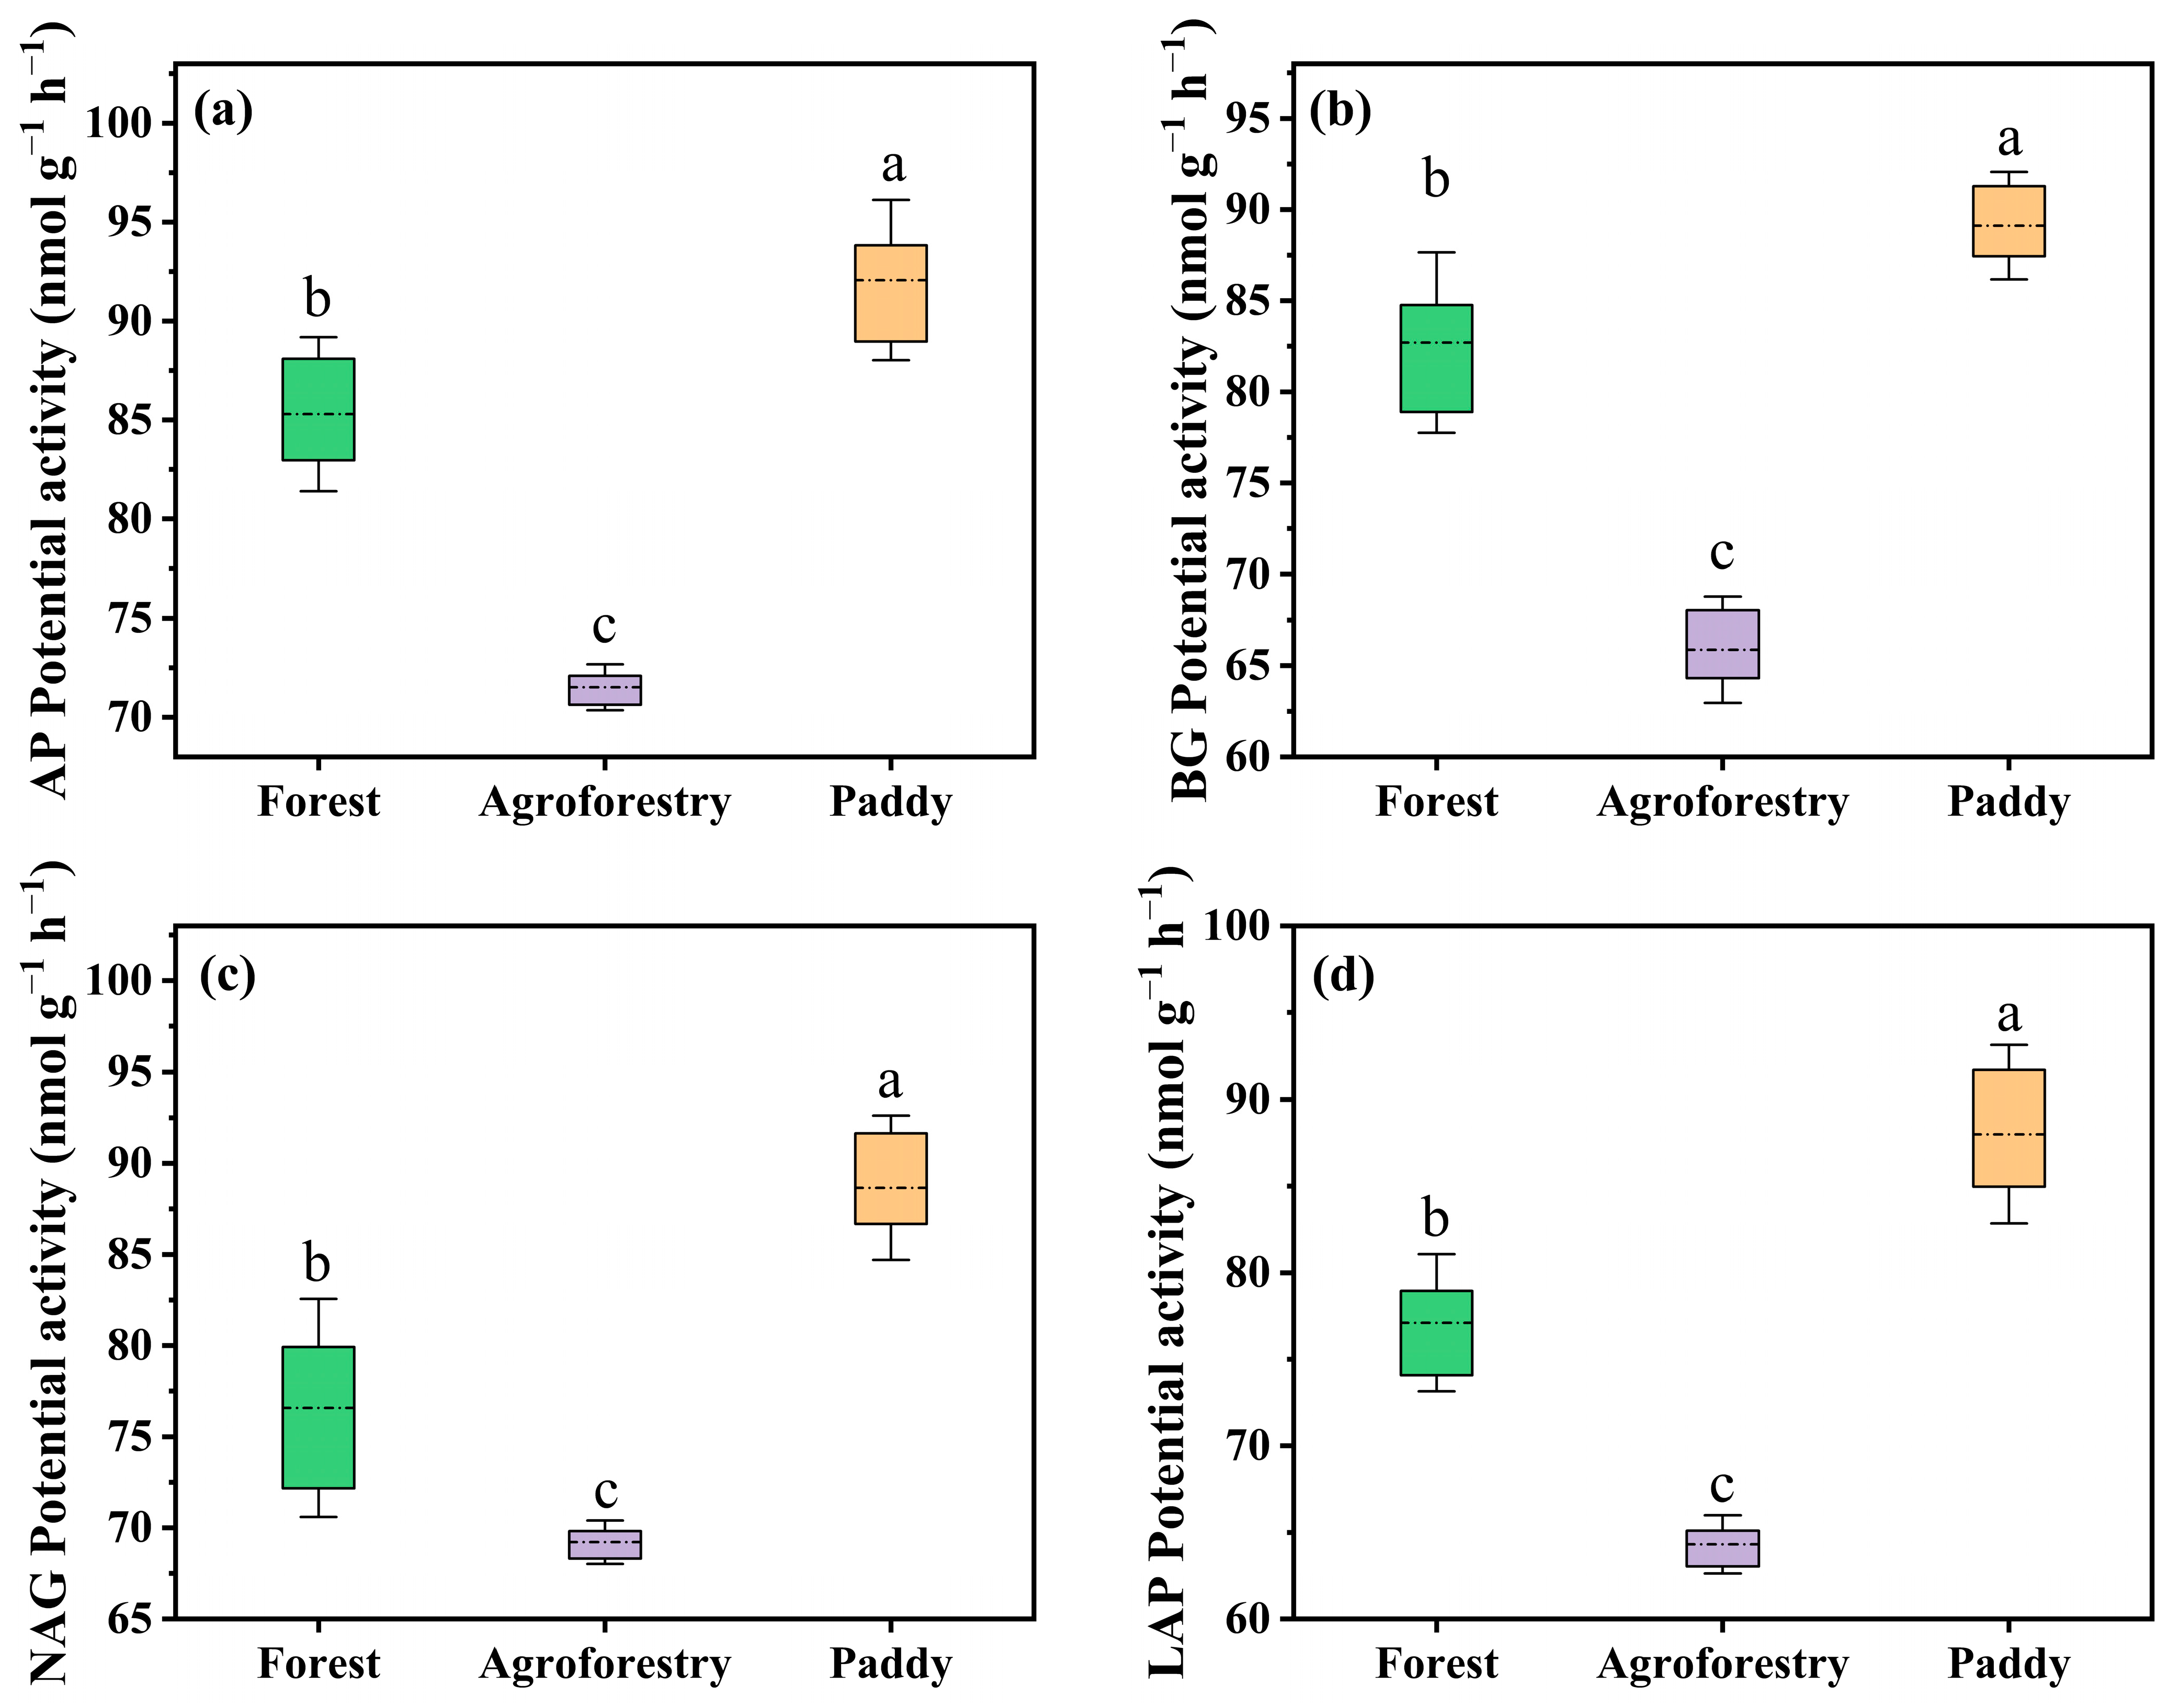
All four extracellular enzymes showed the same land-use ordering—paddy > forest > agroforestry—despite representing microbial acquisition of different resources. The coordinated increase in acid phosphatase, β-glucosidase, N-acetyl-β-D-glucosaminidase, and leucine aminopeptidase under paddy cultivation is therefore more consistent with a broad difference in potential resource-acquisition capacity than with a response confined to a single nutrient cycle. Extracellular enzyme production can be influenced by microbial biomass, community composition, substrate accessibility, nutrient demand, and stabilization of enzymes on soil minerals [
55]. Higher activity does not necessarily indicate that the corresponding resource was more abundant or that its in situ decomposition rate was greater. It indicates that, under the assay conditions, the paddy soil possessed a greater potential capacity to catalyze the measured reactions.
The paddy-associated increase in potential enzyme activity despite lower SOC and organic N concentrations can be interpreted in at least two non-exclusive ways. First, reduced resource availability may increase microbial allocation toward extracellular acquisition when organisms must invest more strongly to obtain limiting substrates [
56]. Second, the long-term paddy environment may have selected a microbial community with greater enzyme-production capacity or may have altered enzyme stabilization in the soil matrix [
57,
58]. The higher pH of the paddy soil may also have reduced the strong acidity constraint experienced by the forest and agroforestry communities and contributed to differences in microbial community composition and functional potential [
59]. Because the enzymes were measured under standardized assay conditions, however, their activities cannot be attributed directly to the field pH at the moment of measurement. Soil pH is better interpreted as a long-term environmental filter associated with community structure and enzyme production than as the immediate cause of the measured activity [
60].
The simultaneous elevation of acid phosphatase, total P, and MBP in paddy soil also requires cautious interpretation. Acid phosphatase activity is often discussed as an indicator of microbial or plant P demand, but its activity can persist when total P is high because total P does not represent immediately available phosphate and because extracellular enzymes can remain stabilized outside living cells [
61,
62]. Consequently, the high acid phosphatase activity does not by itself demonstrate P limitation. Together with the high MBP, it instead indicates that P acquisition and microbial P immobilization were prominent components of the paddy soil’s functional configuration.
The agroforestry soil presents an equally important result. Its lower enzyme activities cannot be explained simply by depletion of all measured resources because SOC, total N, ASN, AAN, and ORRI remained substantially higher than in paddy soil. The high MBN and NO
3−-N concentrations also show that the agroforestry soil was not uniformly nutrient poor. One possibility is that recent organic inputs and microbial immobilization supported nutrient retention without requiring a correspondingly large investment in the measured extracellular enzymes [
63]. Alternatively, the acidic conditions, vegetation composition, or management history may have favored a community with lower potential enzyme production [
64]. These mechanisms were not measured directly. The defensible conclusion is therefore that six-year poultry-integrated agroforestry established an intermediate-resource but comparatively low-activation configuration, rather than functioning simply as an intermediate stage between forest and paddy soil.
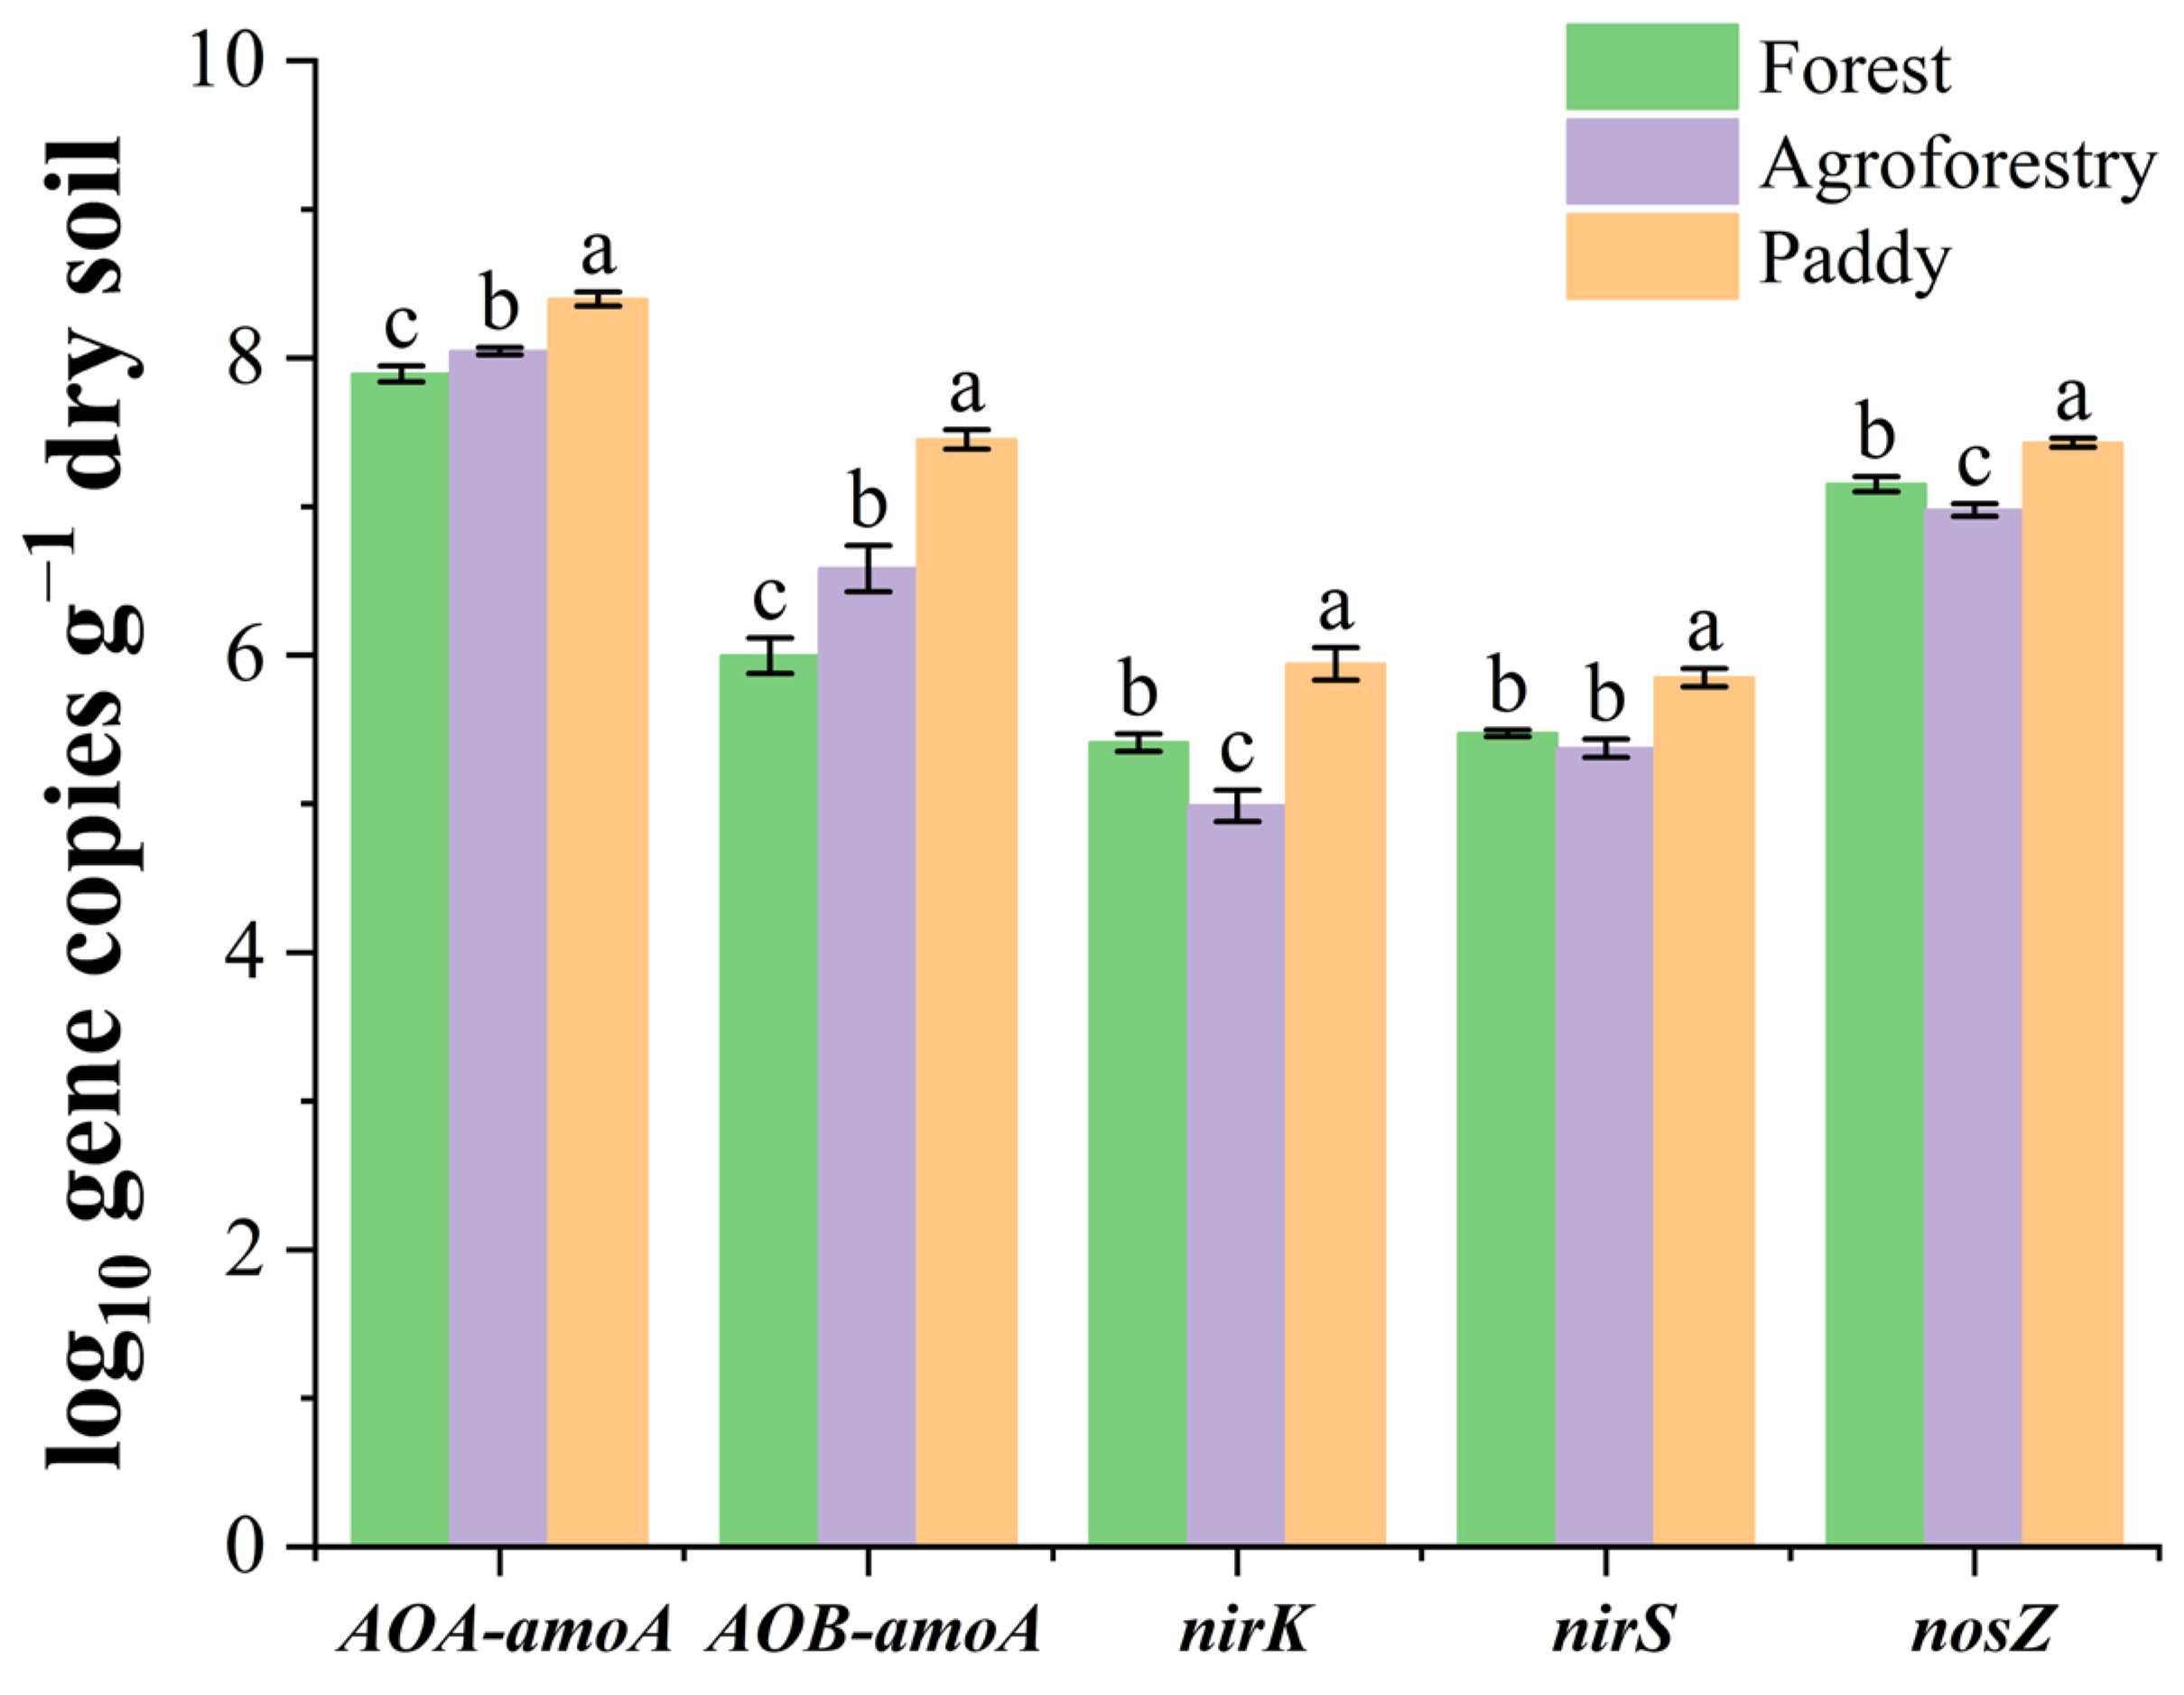
The functional-gene data independently supported this separation between resource status and microbial functional potential. Paddy soil contained the greatest abundances of all measured nitrification- and denitrification-related genes despite having the smallest SOC, total N, and hydrolyzable organic N concentrations. Gene abundances indicate the sizes of populations possessing the targeted functions, not their gene expression or realized transformation rates [
34,
65]. Nevertheless, the consistent enrichment of AOA-
amoA, AOB-
amoA,
nirK,
nirS, and
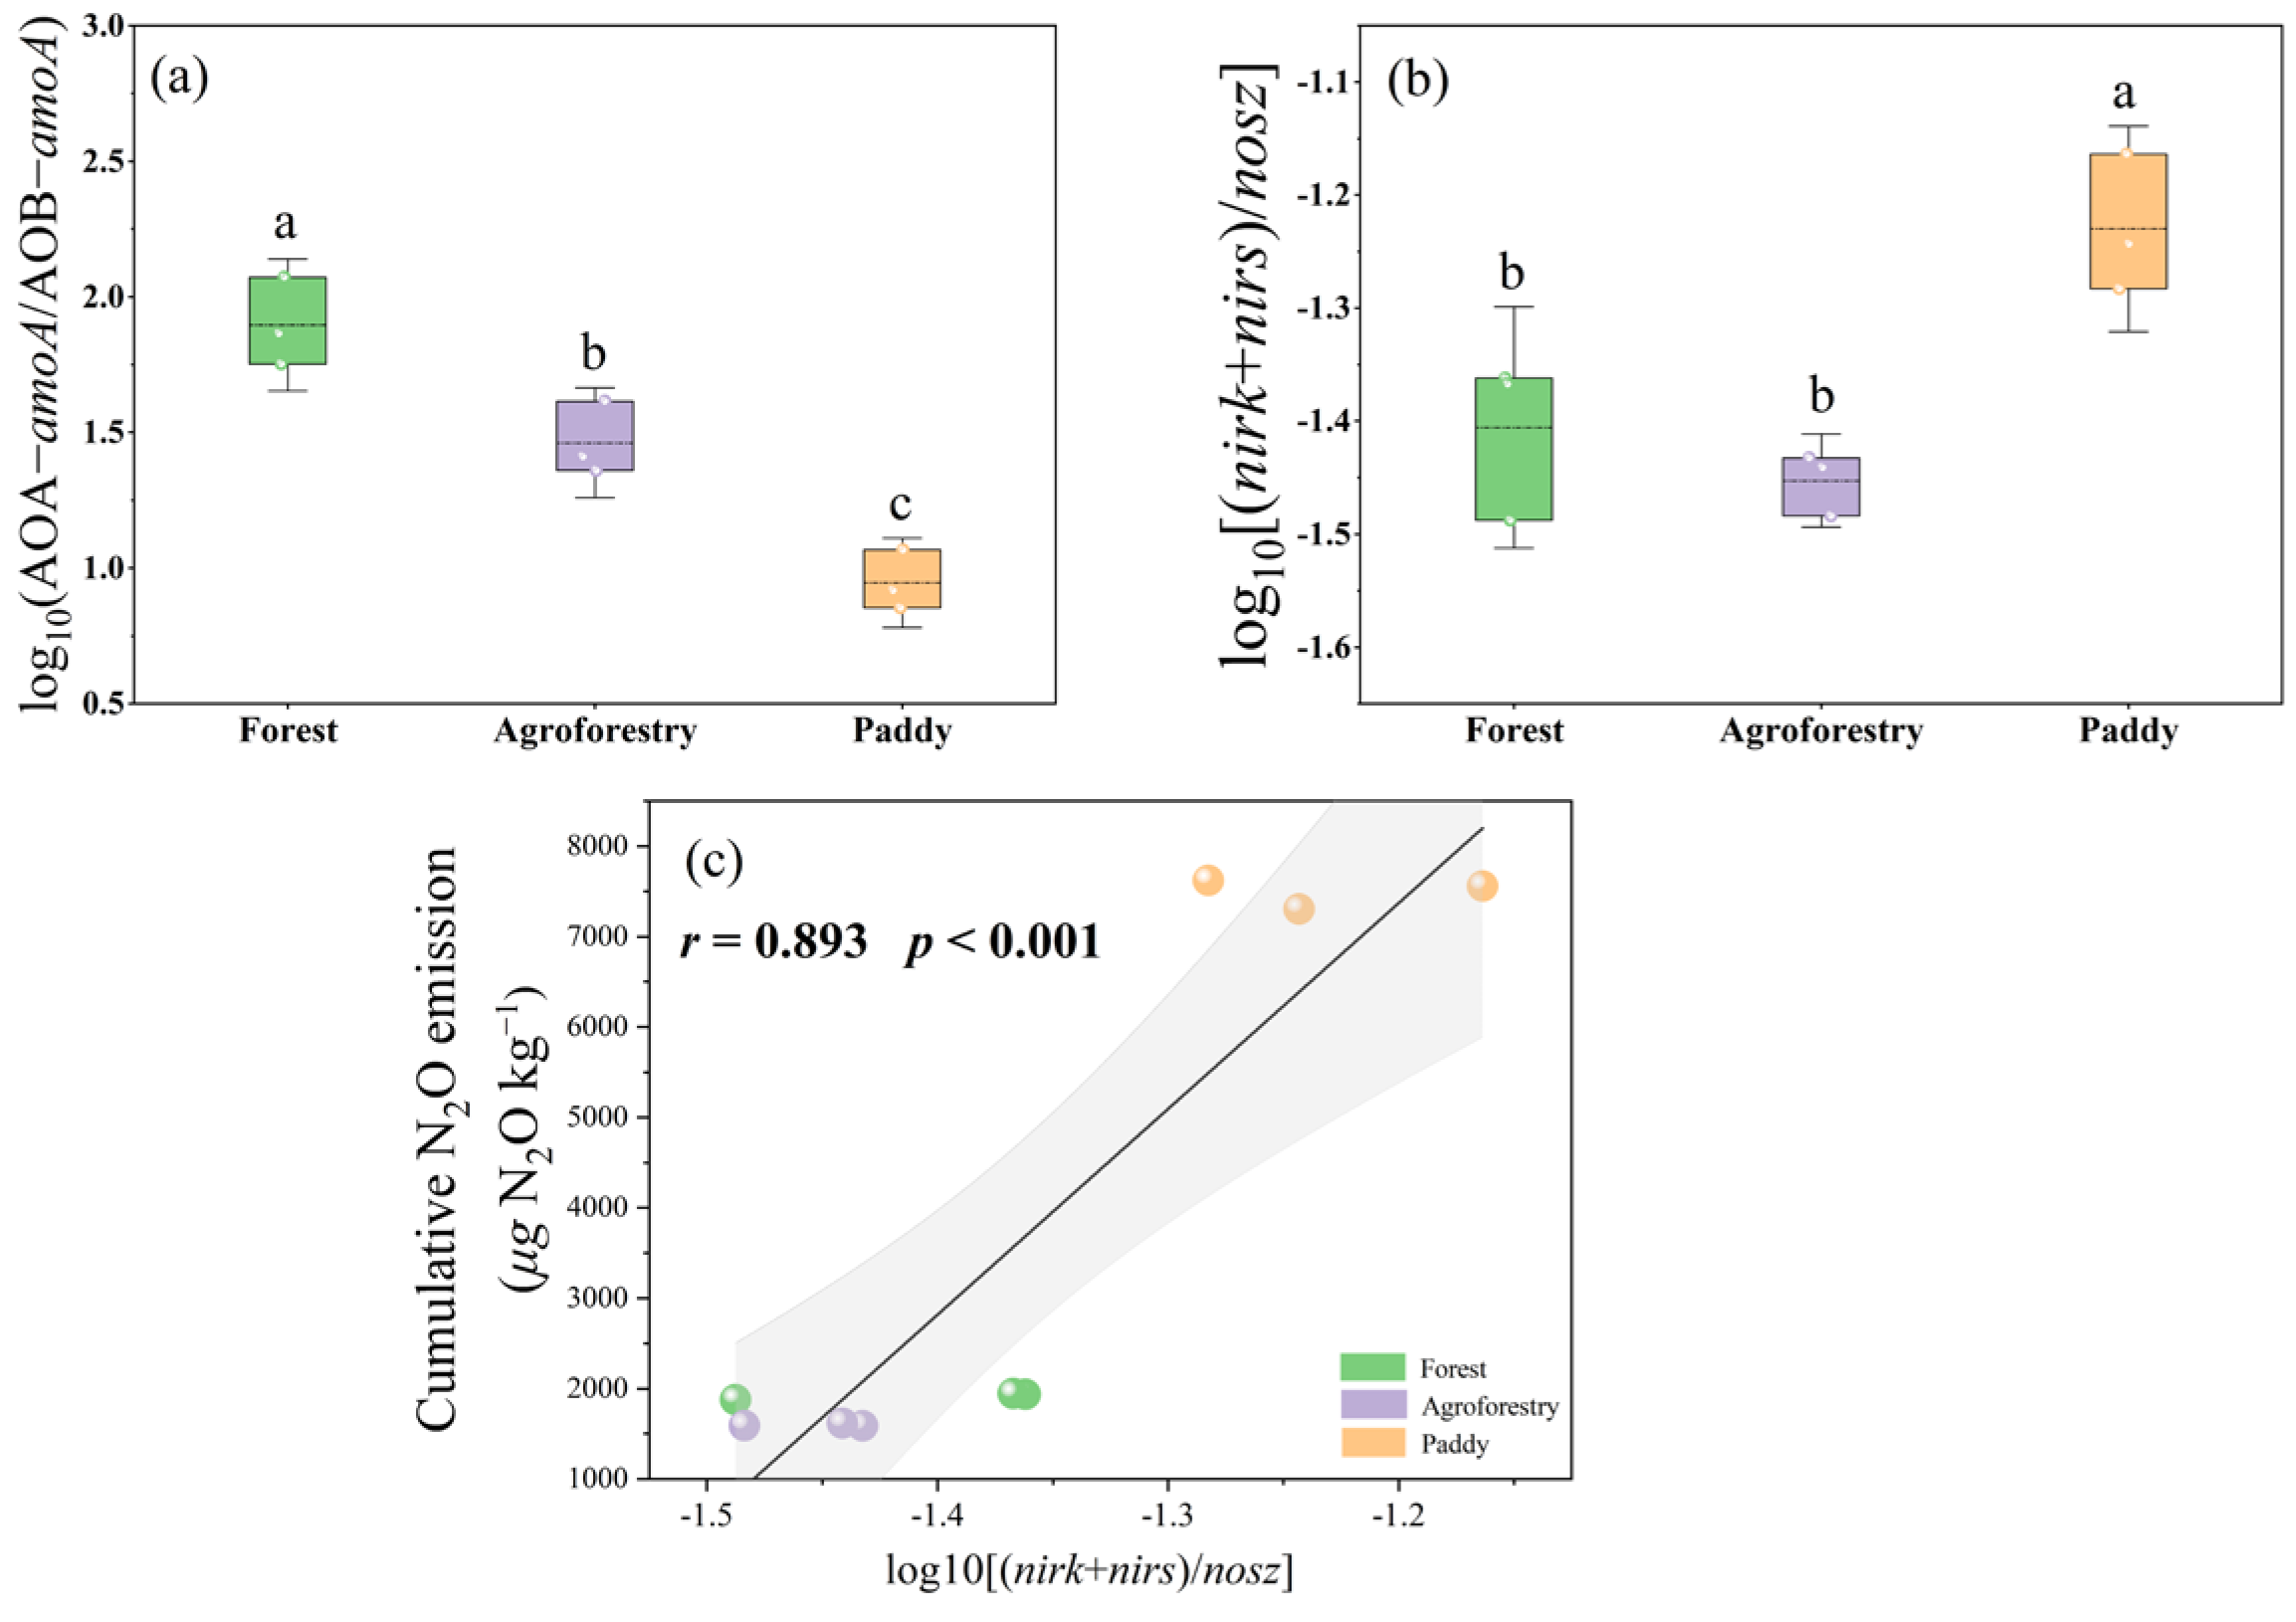
nosZ indicates that the paddy-associated shift was not limited to one functional group. The ammonia-oxidizer balance provides more information than the absolute gene abundances alone [
66]. AOA-
amoA remained more abundant than AOB-
amoA in all three systems, but log
10(AOA/AOB) declined progressively from the forest to agroforestry and paddy soils. Thus, the land-use pattern reflected a disproportionately larger increase in AOB rather than a general replacement of AOA by AOB [
66]. AOA and AOB occupy overlapping but differentiated niches, with AOA often favored under acidic or low-N conditions and AOB responding more strongly to higher NH
4+ supply and less acidic agricultural soils [
67,
68]. The higher pH, greater NH
4+-N availability, and long management history of the paddy soil are consistent with the observed relative expansion of AOB [
69]; however, nitrification rates were not measured and cannot be inferred quantitatively from the ratio.
The denitrification-related genes require similar restraint. The concurrent enrichment of
nirK,
nirS, and
nosZ indicates expansion of populations possessing genetic capacities for both nitrite reduction and N
2O reduction [
70,
71]. Therefore, the higher
nosZ abundance in paddy soil occurred within a broader expansion of the denitrifier functional community and provided no evidence of lower net N
2O emissions. The higher log
10((
nirK +
nirS)/
nosZ) value in paddy soil indicates that nitrite-reduction genes increased more strongly relative to
nosZ than in the other systems. Because this index remained negative, it does not mean that the summed abundance of
nirK and
nirS exceeded
nosZ. It represents a relative shift in gene-abundance balance, not a direct production-to-consumption rate ratio. Its positive association with cumulative N
2O is therefore consistent with, but does not prove, a shift toward greater net N
2O production potential. Overall, these enzyme and gene patterns support the second hypothesis, which suggested that the management and hydrological legacy of paddy cultivation would be associated with greater potential enzyme activities, larger N-cycling functional groups, an increased N
2O production-to-reduction gene-abundance balance, and greater potential N
2O and CO
2 production.
4.3. Potential Gas Emissions Reflected an Integrated Resource–Function Configuration
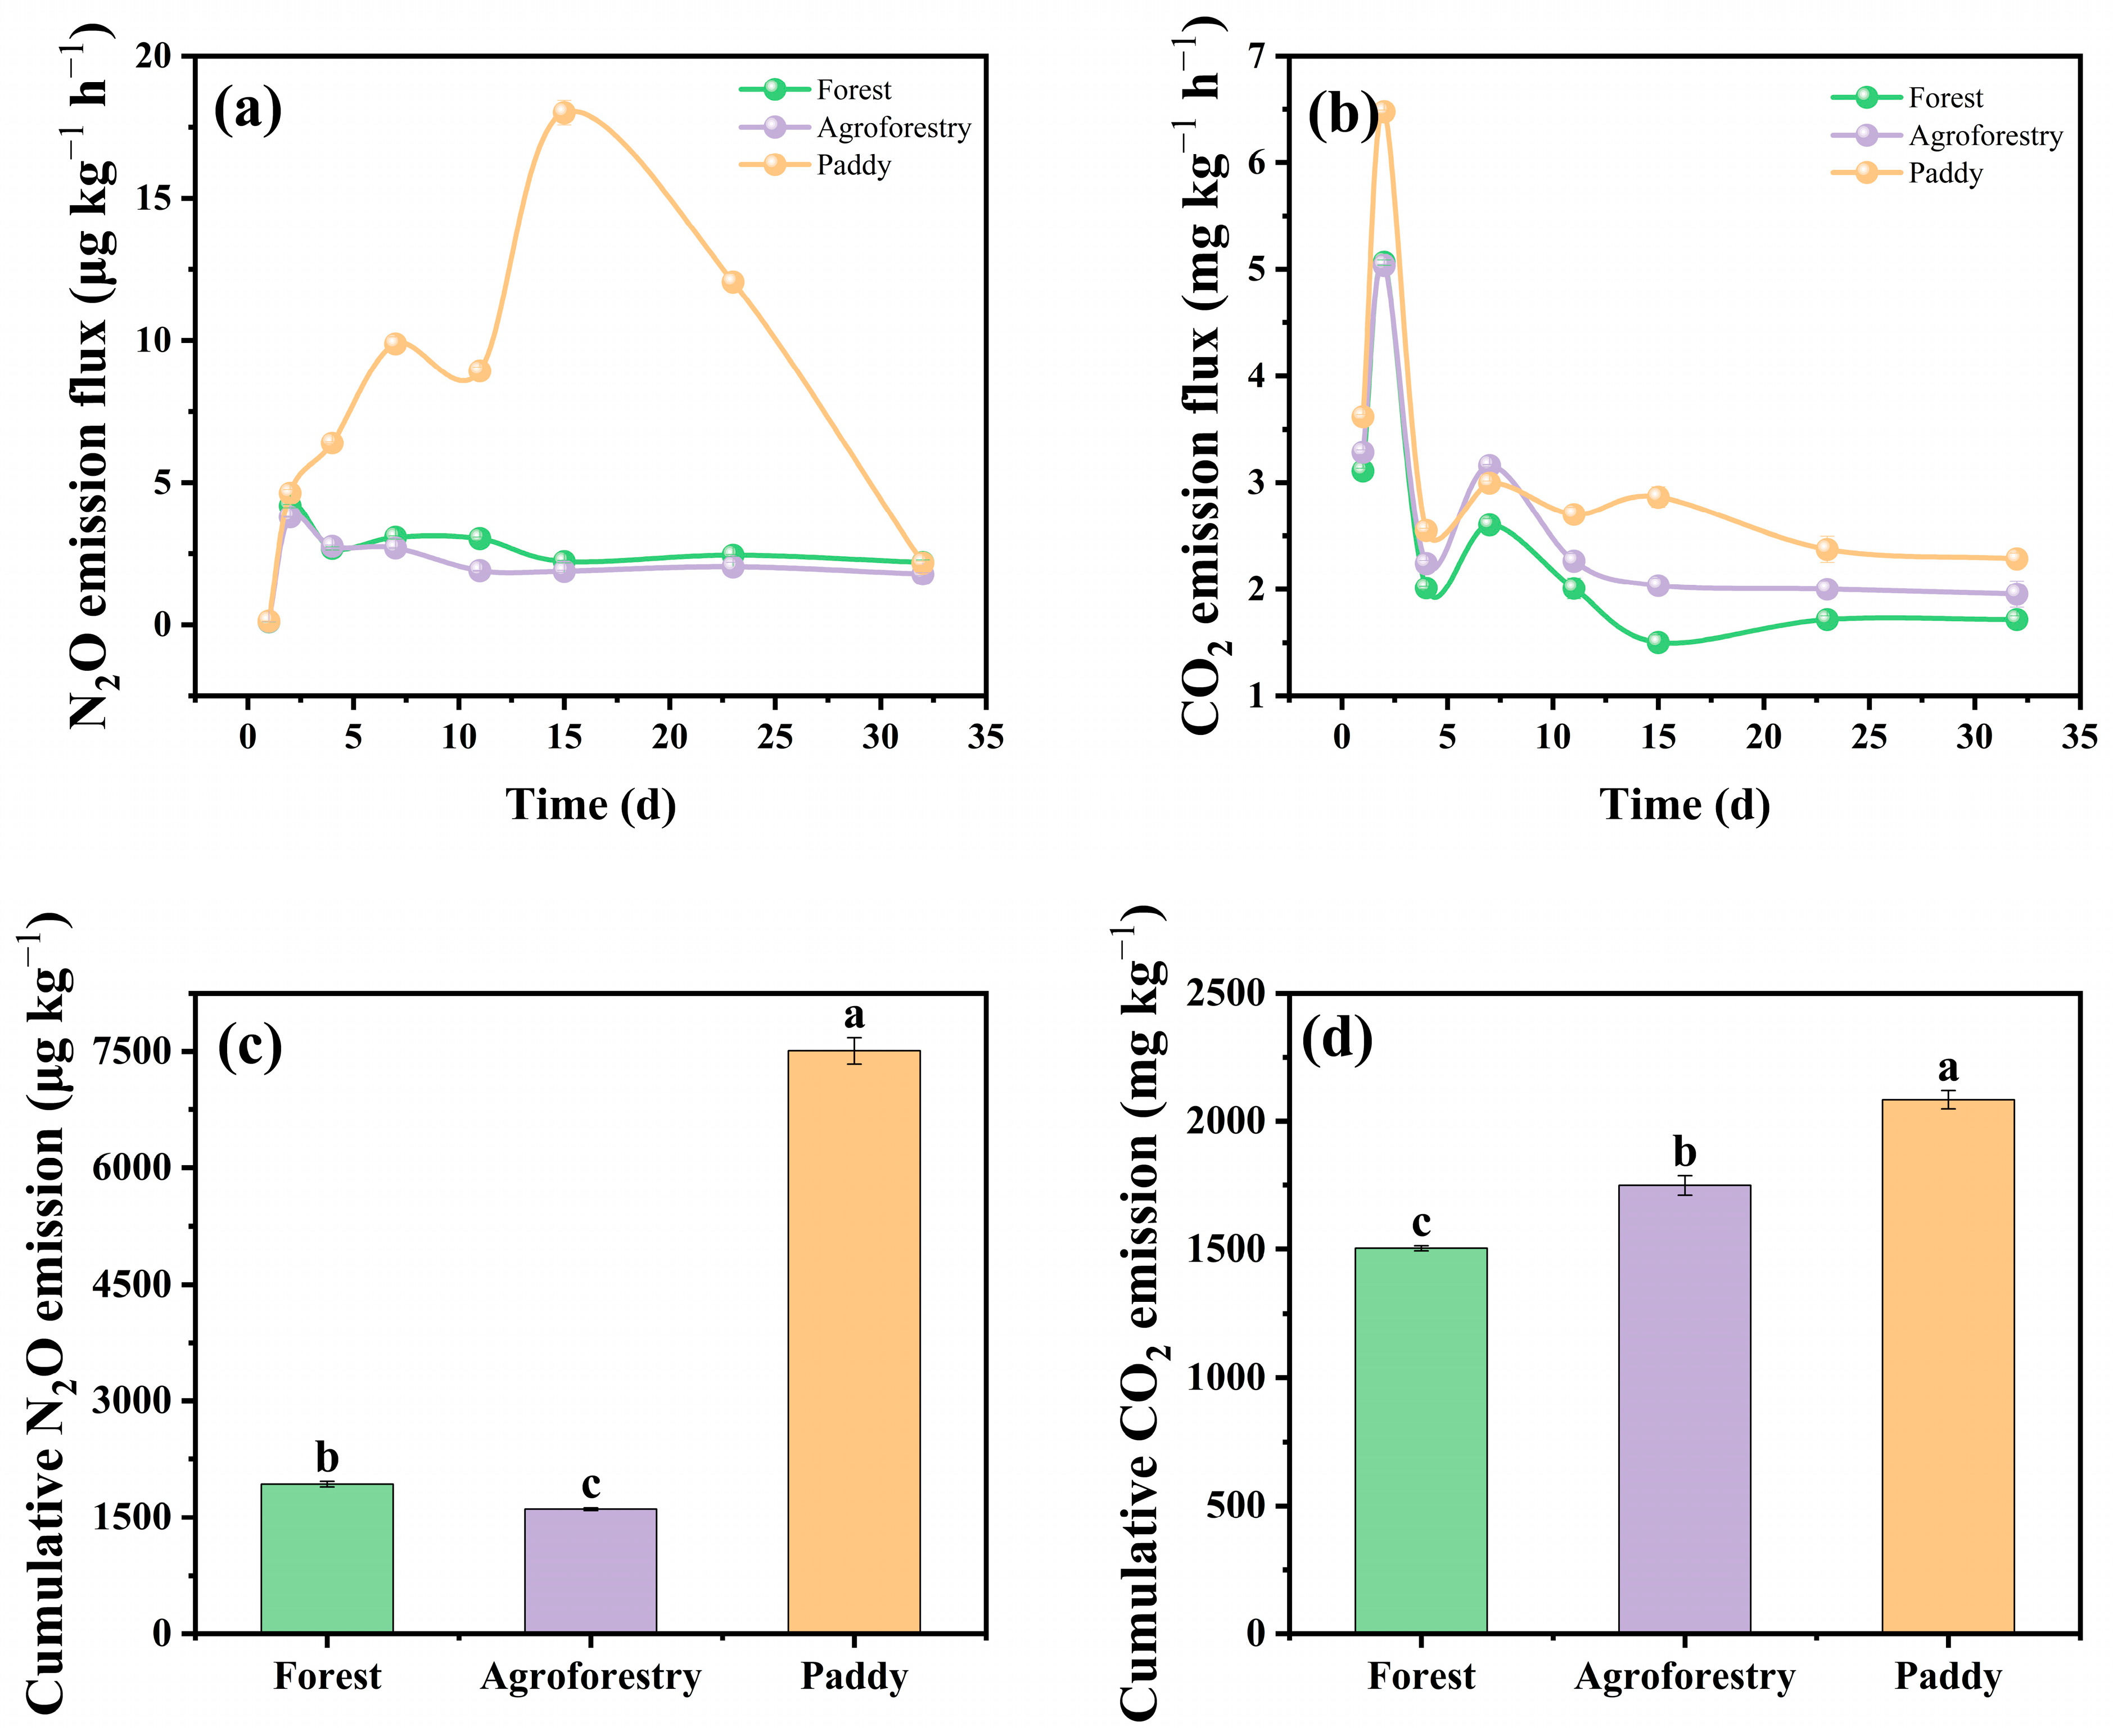
The standardized incubation provided a common test of how the three soils responded to the same temperature, moisture regime, and urea addition. The resulting fluxes represent potential responses under the specified experimental conditions rather than in situ or annual field-scale emissions. Within this scope, the substantially greater cumulative N
2O and CO
2 emissions from paddy soil show that its low organic-resource status did not translate into low short-term gaseous-emission potential. Quantitative data from comparable tropical forest–paddy land-use systems remain scarce. In a tropical peatland land-use comparison in South Kalimantan, Indonesia, mean N
2O fluxes were approximately 46.0 μg N m
−2 h
−1 in secondary forest and 154 μg N m
−2 h
−1 in paddy fields, representing a 3.3-fold numerical difference; however, the two land uses did not differ significantly [
72]. This contrast is similar in direction to the 3.91-fold higher cumulative potential N
2O emission from paddy than forest soil observed here. However, the absolute values are not directly comparable because the earlier study measured area-based field fluxes in tropical peat soil, whereas our study measured mass-based cumulative emissions during a standardized urea-amended incubation.
The temporal response of N
2O provides additional context. Forest and agroforestry soils maintained relatively low emission rates, whereas paddy soil developed a pronounced peak around day 15 before declining. This delayed peak is compatible with progressive changes in urea hydrolysis, mineral N availability, microbial growth, and the balance between N
2O production and consumption during incubation [
73]. However, the experiment did not measure urea hydrolysis, gross nitrification, denitrification, oxygen distributions, or N
2O reduction rates over time. The peak should therefore be interpreted as evidence of a stronger dynamic response by the paddy soil, not as evidence for a particular N
2O-producing pathway.
Several measured features could have contributed to this response. Paddy soil combined higher NH
4+-N, less acidic conditions, larger ammonia-oxidizer and denitrifier populations, and greater potential N-acquiring enzyme activities. These attributes provide a plausible functional context for rapid transformation of the added urea N and subsequent N
2O formation [
74]. Nevertheless, none of them individually establishes process control. Accordingly, the negative relationships of N
2O to NO
3−-N and NO
3−-N/NH
4+-N ratio are insufficient to infer that low NO
3− availability caused greater N
2O production. A small measured NO
3− pool can result from limited production, rapid microbial or plant immobilization, denitrification, or other consumption pathways [
75]. Pool size alone cannot resolve these alternatives.
The CO
2 response indicates that the paddy-associated emission pattern was embedded within a broader change in microbial processing. Cumulative CO
2 was 38% greater in paddy than forest soil, while agroforestry showed an intermediate response. This pattern is compatible with greater utilization of available C during incubation, but it does not demonstrate greater decomposition of the total SOC pool. The amount of SOC was smallest in paddy soil, and cumulative CO
2 reflects the mineralization of accessible substrates rather than the total quantity of C stored in the soil [
76]. Moreover, CO
2 did not reproduce the complete correlation pattern observed for N
2O: its associations with the measured extracellular enzymes,
nirK, and
nosZ were not significant. Thus, the positive relationship between cumulative CO
2 and N
2O identifies a shared land-use-associated response but does not imply identical microbial controls over the two gases.
Together, the univariate results, correlation matrix, and PERMANOVA indicated that resource pools and functional attributes were organized differently among the land uses. ORMAI then expressed the relative distance between these two dimensions. Its markedly positive value in paddy soil indicates that standardized functional attributes were high relative to the measured organic-resource status. By contrast, both forest and agroforestry had negative ORMAI values, indicating that their standardized resource status exceeded their functional activation potential. The similarity of ORMAI between the forest and agroforestry systems does not mean that the two soils were functionally equivalent. Forest soil had both higher ORRI and higher MFAI than agroforestry soil, but the difference between these dimensions was similar. The two systems therefore reached comparable ORMAI values through different component configurations: high resource status with intermediate activation in the forest and intermediate resource status with low activation under agroforestry. Meaningful interpretation of ORMAI therefore requires consideration of ORRI, MFAI, and their constituent variables, rather than treating it as a stand-alone soil-quality score.
The paddy-associated elevation of ORMAI persisted when each constituent variable was removed sequentially and when equal weighting of individual variables replaced domain weighting. This sensitivity supports the conclusion that the pattern was not generated by one unusually responsive enzyme, gene, or organic N fraction. Because N2O and CO2 were excluded from index construction, their correlations with ORMAI were not produced by direct mathematical inclusion of the response variables. Nevertheless, the very strong ORMAI–N2O relationship largely reflects the separation of paddy soil from the other systems and does not establish that ORMAI is a causal predictor of N2O. Within these boundaries, the results support the third hypothesis, which predicted that potential N2O emission would be aligned more closely with the integrated functional configuration and its imbalance relative to retained resources than with large SOC, total N, or hydrolyzable organic N concentrations.
4.4. Implications of the Resource–Function Imbalance Framework
Our results show that contrasting land-use legacies can reorganize the correspondence between retained organic resources and microbial functional potential in qualitatively different ways. Long-term paddy cultivation produced a resource-depleted but functionally activated configuration, whereas the agroforestry soil retained an intermediate resource base but showed comparatively restrained functional activation. These configurations remained evident when the soils were exposed to common incubation conditions, indicating that their potential gaseous responses reflected legacy-associated differences in soil resource–function organization rather than differences in immediate temperature, moisture, or N addition. Thus, evaluating the two dimensions independently—and quantifying their relative imbalance—provides information that cannot be obtained by ranking individual resource or functional variables alone.
The strong contrast in ORMAI between paddy soil and the other systems illustrates the potential diagnostic value of this framework. A positive imbalance does not indicate desirable soil functioning, nor does it imply that resource depletion stimulates N
2O production. Rather, it identifies a configuration in which measured microbial functional potential is high relative to the organic-resource base available to support it. Such a configuration may signal greater potential for rapid resource processing and N
2O emissions following favorable environmental conditions or external N supply [
68]. Conversely, a negative imbalance identifies systems in which retained-resource status exceeds the measured level of functional activation, without implying that those resources are permanently stabilized or unavailable. ORMAI should therefore be regarded as a study-specific descriptor of resource–function configuration, not as a universal soil-quality index or a causal predictor of emissions.
The agroforestry soil further demonstrates why land-use systems should not be arranged along a single gradient from forest to intensive agriculture. Its combination of partial organic-resource preservation, high MBN and measured inorganic N concentrations, low enzyme and functional-gene indices, and the lowest cumulative potential N2O emissions represented a distinct configuration rather than an intermediate stage between forest and paddy soil. This pattern suggests that the vegetation and management characteristics of the six-year poultry-integrated system had not generated the functionally activated configuration observed under long-term paddy cultivation. Nevertheless, because only one agroforestry design and sampling period were examined, and field N inputs, plant uptake, seasonal dynamics, and annual gaseous losses were not quantified, these findings do not establish agroforestry generally as an N2O-mitigation strategy. They instead identify a specific land-use configuration that merits testing across management intensities, seasons, and field conditions.
4.5. Limitations
Several design limitations define the strength of inference. First, the study used a spatial comparison rather than repeated measurements of the same sites before and after conversion. Comparable texture, parent material, weathering status, regional climate, and original forest type strengthen the comparison, but they cannot eliminate all unmeasured site differences. Second, land-use type and conversion duration were confounded: agroforestry had been established for approximately six years, whereas paddy cultivation had continued for about 60 years. The results therefore represent the integrated legacies of contrasting conversion pathways rather than independent effects of management type or elapsed time. Third, each land-use system was represented by three independent field replicates. This design was sufficient to detect large and internally consistent differences, but it limits the stability and generalizability of replicate-level correlations. In particular, the high correlations between ORMAI and gas emissions were dominated by between-system separation and require validation across more sites and within broader gradients of management intensity. Fourth, ORRI summarizes relative concentrations of selected organic-resource indicators; it is not a measurement of C or N stocks, stabilization rates, or retention efficiency. MFAI similarly combines potential enzyme activities and DNA-level gene abundances and therefore represents potential functional capacity rather than realized microbial process rates [
77]. ORMAI is therefore a study-specific descriptor of relative resource–function configuration, not a universal index or mechanistic rate model.
4.6. Future Perspectives
Future work could test this framework using seasonal field measurements, bulk-density-corrected C and N stocks, gross N-transformation rates determined with 15N tracers, direct measurements of N
2O production and reduction, and expression of the targeted functional genes [
78,
79]. Repeated sampling across paddy drainage cycles and agroforestry development stages would help separate management effects from conversion duration. Such measurements would also determine whether the resource–function configurations identified under standardized incubation persist under field conditions.





 ,
,