1. Introduction
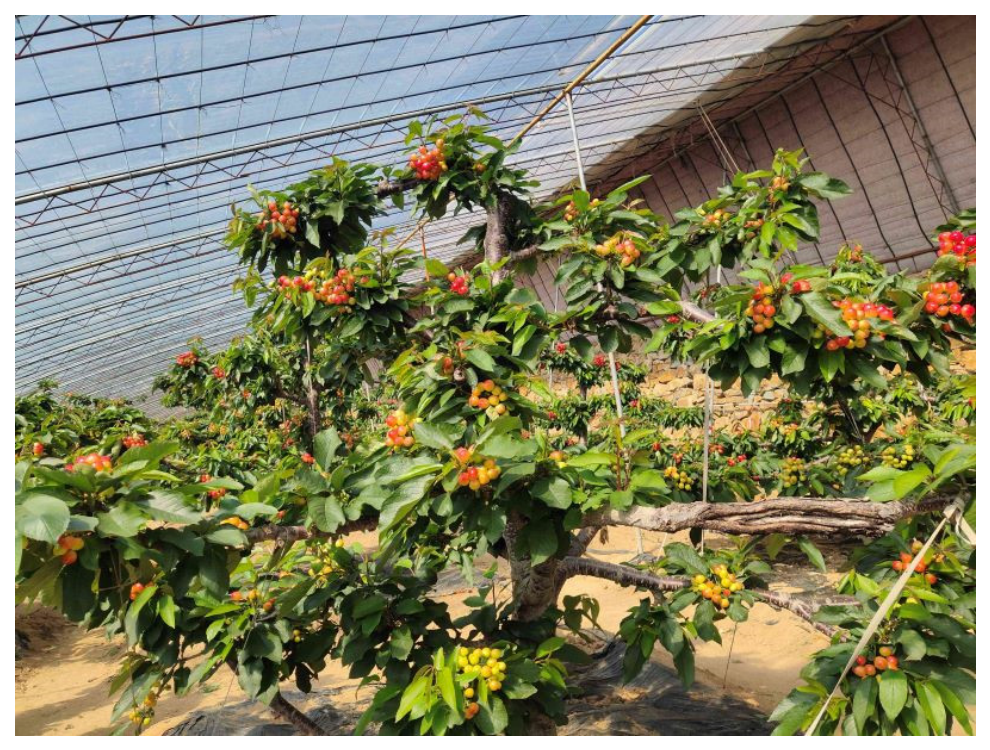
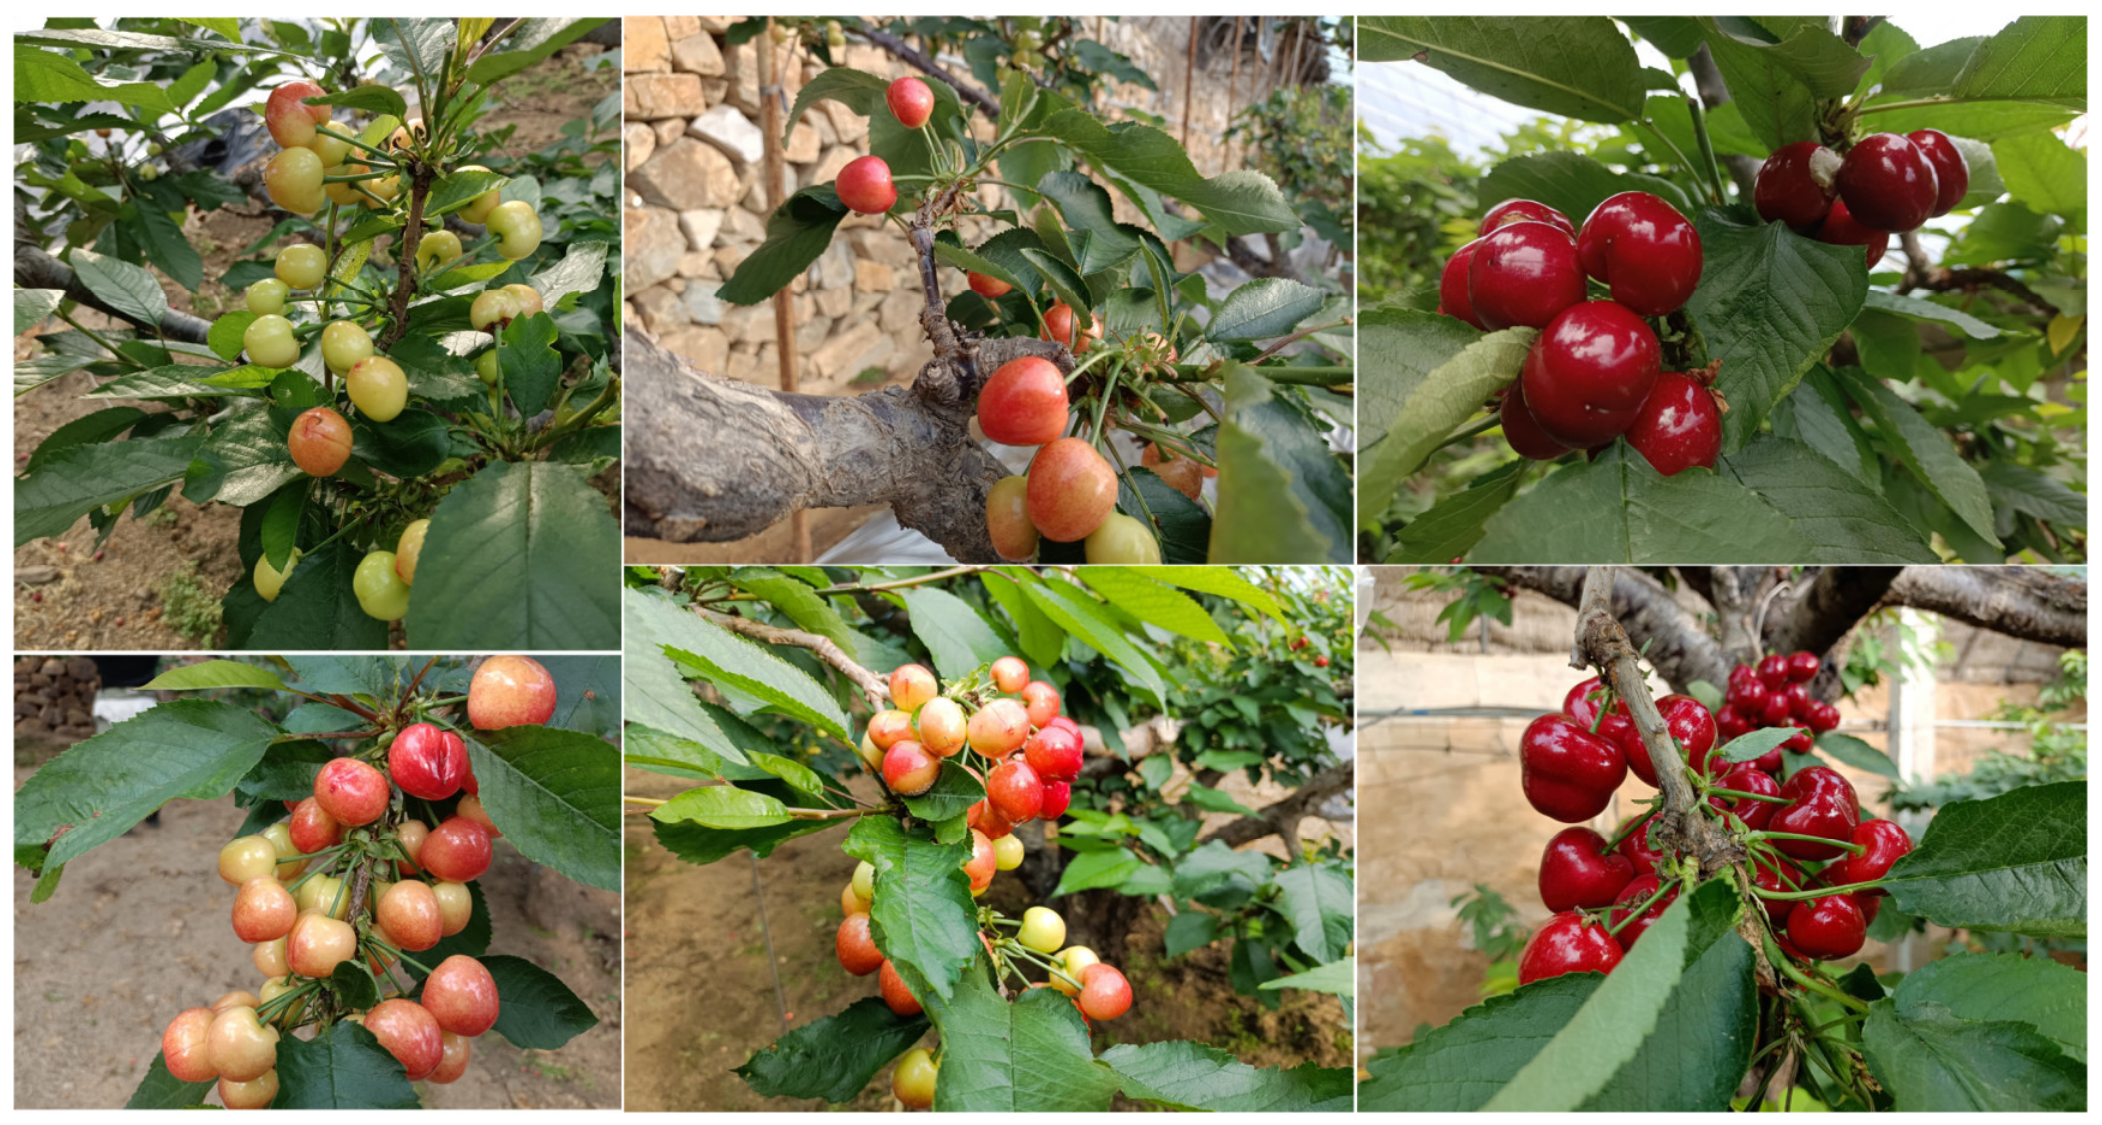
Cherry is a high-value fresh fruit crop in protected cultivation systems in northern China. As one of the major production regions for greenhouse cherries in China, Dalian has achieved off-season fruit marketing through advanced protected cultivation technologies and environmental regulation, thereby significantly improving economic returns. Fruit thinning is a key management practice in the middle and late stages of cherry production for regulating tree load, improving fruit quality, and reducing disease risk. Decisions regarding thinning strategy, implementation timing, and target selection directly affect fruit size and coloration uniformity and thus have a significant impact on final production outcomes [
1,
2,
3]. Although Koirala et al. [
4] pointed out that deep learning-based visual perception has become an important approach for tree load quantification, fruit thinning in practice still relies heavily on manual experience. Objective quantitative evidence derived from visual perception of fruit physiological status and spatial structure remains lacking, which limits the refinement and consistency of fruit-thinning management.
In recent years, as fruit thinning has long relied on experience rather than quantitative evidence, research has gradually shifted from experience-based practice toward quantifiable, predictable, and interpretable decision support. Early studies mainly focused on physiological regulation and chemical thinning [
5,
6]. For example, Hillmann et al. [
7] proposed a fruit set prediction model for apple fruitlets to evaluate the response to chemical thinning. For sweet cherry, Kurlus et al. [
8], Parveze et al. [
9], and Bound et al. [
10] analyzed the effects of different management strategies on fruit set, yield, fruit quality, and fruit cracking risk from the perspectives of chemical thinning, flower thinning, and load regulation, respectively. Usenik et al. [
11] explained the relationship between the load level of cherry fruiting branches and the ripening process from the perspective of the leaf-to-fruit ratio. These early methods provided physiological and agronomic bases for fruit thinning, but their research objects were mainly load responses at the tree or population scale, and the quantitative results were mostly used for determining thinning timing, thinning intensity, or chemical application schemes. Therefore, they are difficult to directly guide fine-grained individual fruit selection, and chemical thinning methods may also have adverse effects on fruit quality and nutritional components.
As a non-contact sensing technology, machine vision has promoted fruit thinning-related research from experience-based judgment to image-based quantitative perception. Farjon et al. [
12] used computer vision to detect and count apple flowers and used flower quantity information as quantitative input for chemical thinning; Wang et al. [
13] implemented young apple fruit detection based on pruned YOLOv5s to rapidly obtain fruit quantity information before thinning. Such studies provided measurable information on flower and fruit quantity for fruit-thinning management, but they largely remained at the level of load quantification and offered limited direct support for thinning execution. To address this limitation, Kang et al. [
14] further combined visual detection with precision spraying equipment to achieve targeted chemical thinning of young fruits, extending machine vision from load quantification to the thinning execution stage. As research progressed further, machine vision was also extended to precision load management and robotic thinning scenarios [
15]. Khanal et al. [
16] proposed a machine vision system for early apple flower detection in unstructured orchard environments and discussed its application in robotic flower thinning; Gongal et al. [
17] pointed out that machine vision-based tree load estimation can provide a quantitative basis for load regulation measures such as young fruit thinning. At a more specific robotic execution level, Hussain et al. [
18] studied young fruit segmentation and fruit stem orientation estimation in apple robotic thinning; Bhattarai et al. [
19] designed and integrated a precision apple flower thinning robotic system and validated it in the field. In summary, although existing studies have made progress in load quantification, visual detection, and robotic execution, a multi-factor decision-making framework for thinning object selection and thinning order determination has not yet been formed.
Fruit thinning is inherently a multi-factor decision-making process. Fruit ripeness is an important source of information because inconsistencies in fruit development within a cluster can provide a basis for thinning target selection. In small-target fruit scenarios such as sweet cherry, Li et al. [
20] proposed a real-time sweet cherry ripeness detection method in natural environments based on YOLOX, and Gai et al. [
21] conducted cherry fruit detection research based on an improved YOLOv4. For the requirements of small-target and real-time recognition, Li et al. [
22] proposed a lightweight detection model, CMD-YOLO, for small-target cherry ripeness detection; for fruit contour extraction, Cui et al. [
23] proposed Cherry-Net, which realized real-time cherry ripeness segmentation based on an improved PIDNet; Cossio-Montefinale et al. [
24] further combined orchard video detection with wireless sensor network data to estimate field cherry ripeness distribution. Existing studies have gradually expanded from detection and segmentation to ripeness distribution estimation, but how ripeness information can be further used for thinning target selection and priority ranking remains underexplored. In addition, existing ripeness detection methods are still easily affected by factors such as lighting changes, fruit adhesion, and branch-leaf occlusion, resulting in unstable detection and segmentation performance and limiting their application in real orchard environments.
In addition to fruit ripeness, spatial compactness at the fruiting-branch or fruit-cluster scale is also an important consideration in fruit-thinning decisions. Excessive fruit density not only increases competition for assimilates within the tree, restricts single-fruit growth, and affects quality [
25] but also increases the risks of fruit surface damage, fruit cracking, and surface indentation [
26,
27]; meanwhile, restricted ventilation can easily induce diseases such as gray mold [
28]. Regarding fruit cluster spatial structure, early studies mainly focused on the relationship between cluster compactness and disease risk. Zanchin et al. [
29] explored the relationship between grape bunch morphological characteristics and Botrytis infection, and Herzog et al. [
30] further analyzed the relationship between the physical barrier properties of grape bunches and resistance to gray mold by combining sensor analysis. Thereafter, related studies began to shift toward spatial structure quantification. Rist et al. [
31] obtained multidimensional structural parameters of grape bunches using rapid three-dimensional sensing and automated workflows. Rist et al. [
32] further combined automated three-dimensional field phenotyping workflows with predictive modeling for high-throughput and non-destructive phenotypic analysis of grape bunches. Xin and Whitty [
33] constructed a three-dimensional grape bunch reconstruction workflow based on constrained optimization and restricted reconstruction grammar; Woo et al. [
34] realized three-dimensional model reconstruction of grape bunches based on two-dimensional images; Liu et al. [
35] estimated grape bunch characteristic parameters using point cloud data. Cubero et al. [
36] proposed a fruit bunch compactness assessment method based on automated image analysis and incorporated fruit spatial arrangement and visible gap proportion into the analysis. In addition, Li et al. [
37] quantified fruit cluster compactness as an independent phenotypic indicator in blueberry, describing cluster compactness and spatial distribution characteristics through measures such as fruit mask area ratio and fruit spacing. Although phenotypic quantification methods around cluster compactness and three-dimensional structure have been developed for fruits such as grape and blueberry, their research objectives mainly focus on disease risk assessment, varietal phenotyping, or mechanical harvesting suitability analysis. However, the relationship between fruit-cluster density and fruit-thinning decisions remains insufficiently studied. Meanwhile, research on the spatial structure of cherry fruit clusters is currently lacking, and because cherry structures differ greatly from those of grape, blueberry, and other fruits, related studies are difficult to transfer directly to cherry fruit-cluster scenarios. For cherry fruit, existing vision studies still mainly focus on tasks such as fruit detection, counting, and ripeness recognition, but fruit number alone cannot directly describe intra-cluster fruit spacing, local crowding, or overall structural status and thus cannot provide data support for fruit-thinning decision tasks.
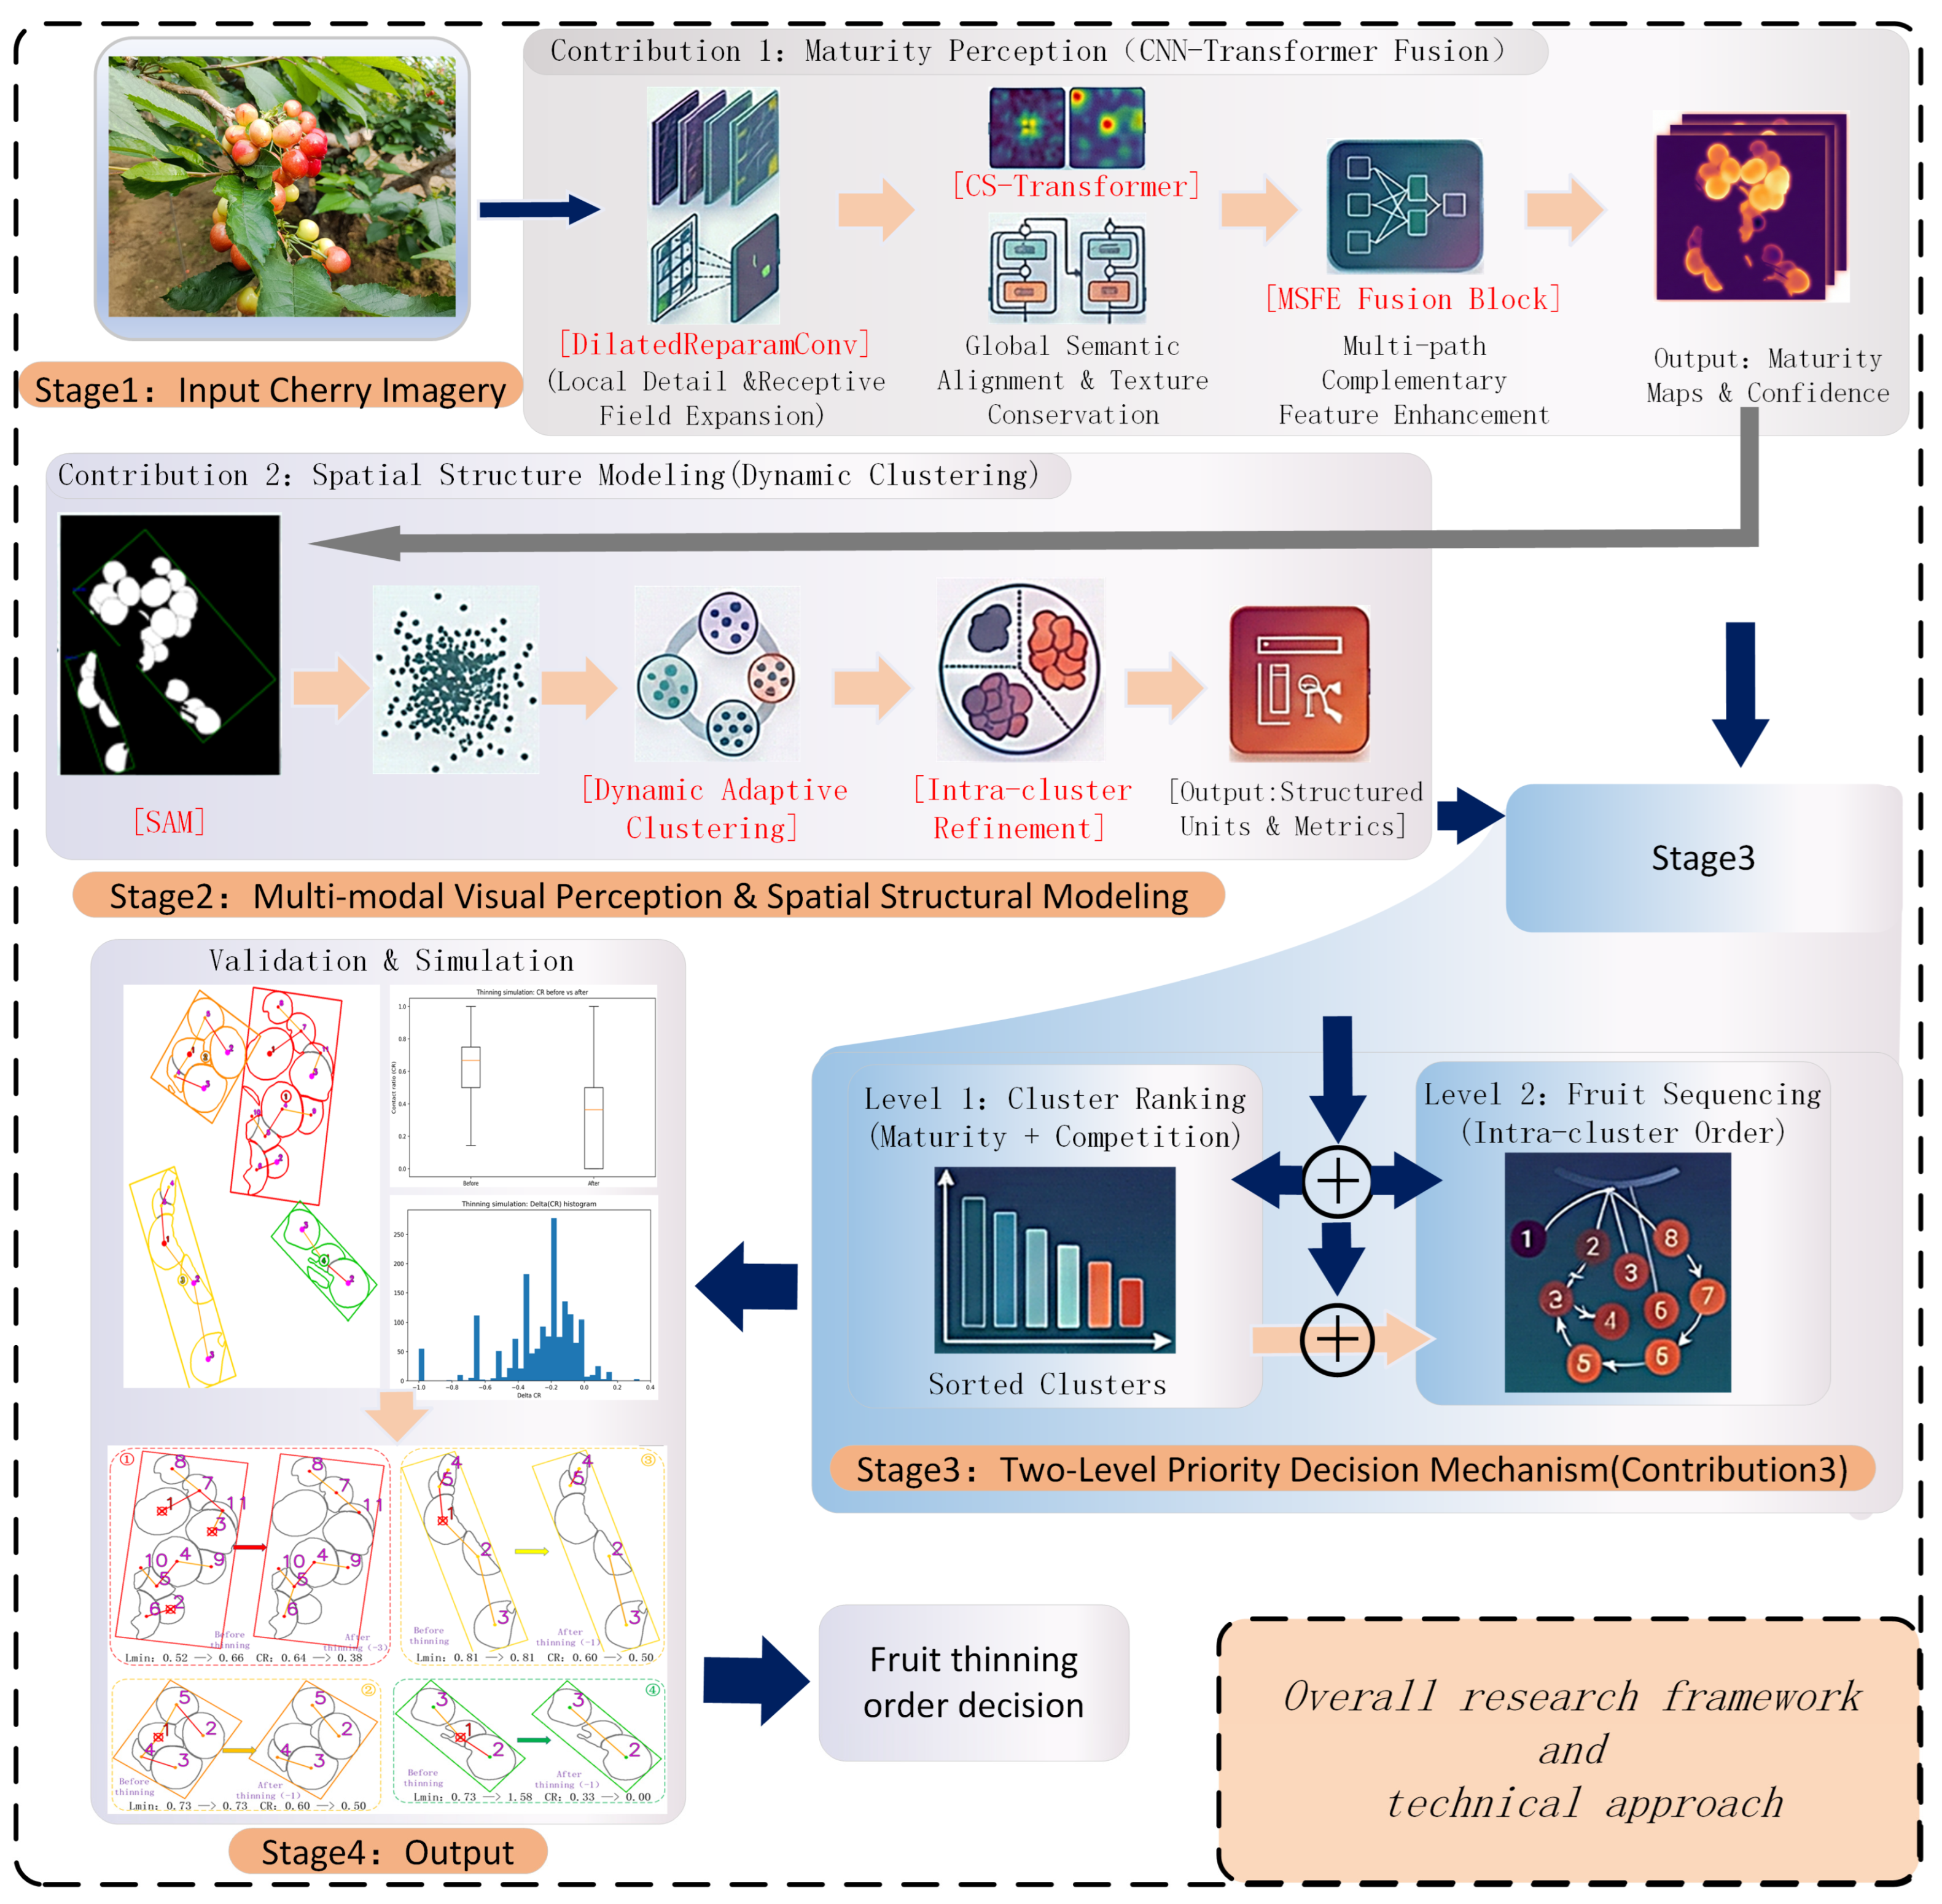
Based on the above analysis, existing fruit-thinning research lacks stable methods for ripeness detection and spatial structure quantification at the perception level and has not yet established a fine-grained multi-factor decision-making framework at the decision level. As a result, thinning target selection and priority determination remain insufficiently supported. Therefore, there is an urgent need to develop a refined decision-making method for cherry fruit thinning. To this end, this study focuses on dense fruit-cluster scenes in greenhouse cherries and proposes a unified framework that integrates visual perception and fruit-thinning decision-making through ripeness detection and phenotypic analysis of fruit-cluster spatial structure. The main contributions of this study are as follows:
To address severe fruit adhesion within cherry clusters, dense occlusion, inconspicuous visual features during transitions among ripeness stages, and susceptibility to lighting disturbances, this study proposes the DEIM-CMFNet model for ripeness detection in complex fruit-cluster scenes. Through collaborative modeling of local detail enhancement, global semantic alignment, and key-region response strengthening, the model improves the robustness of fruit ripeness discrimination and instance-level localization while enhancing the separation of adhering fruits. This provides reliable input for subsequent single-fruit segmentation, spatial structure modeling, and fruit-thinning decision analysis.
To address the dense clustered distribution of cherry fruits under greenhouse conditions, uneven inter-cluster distances, and multi-cluster adhesion and blurred cluster boundaries caused by occlusion, this study proposes a spatial modeling strategy for dense multi-cluster scenes. Through dynamic adaptive clustering and an intra-cluster refinement strategy based on reclustering, fruit clusters are transformed from visually merged aggregates into manageable structural units, thereby enabling accurate cluster extraction and providing reliable spatial structure representation for subsequent fruit spacing modeling, cluster density analysis, and fruit-thinning priority determination.
Based on the extracted fruit-cluster structural units and their spatial representations, this study further constructs a two-level fruit-thinning priority decision mechanism at the cluster and fruit levels by integrating ripeness and spatial structure information, thereby forming a decision method for cluster intervention order and intra-cluster thinning target selection. By jointly using information such as fruit-cluster ripeness level, ripeness dispersion, and spatial crowding, this method enables cluster-level priority ranking and the generation of intra-cluster fruit-level thinning sequences. Its effectiveness is validated by comparing changes in structural phenotypes such as fruit contact ratio, fruit spacing, and cluster compactness before and after fruit thinning.
4. Design of the Ripeness Perception Model DEIM-CMFNet
Under natural greenhouse imaging conditions, cherry fruits appear as densely distributed small targets and are affected by branch–leaf occlusion, fruit adhesion, and illumination fluctuations. In addition, ripeness-related visual features exhibit characteristics of continuous gradual change and weak boundaries, making detection and grading prone to missed detection, misclassification, and unstable confidence. To address this problem, this study proposes a color-aware multi-path feature-enhanced detection model, DEIM-CMFNet (DEIM Color-aware Multi-path Feature Network). Built upon DEIM [
39], DEIM-CMFNet improves robustness in complex scenes through a collaborative modeling strategy that expands the receptive field to strengthen local detail representation, stabilizes color and texture representation to maintain semantic consistency, and performs complementary multi-path fusion to focus on key regions. Under dense clustering conditions, it achieves joint prediction of fruit localization and ripeness categories and provides stable input for subsequent fruit-cluster structural modeling and fruit-thinning priority decision-making. In addition, in scenes with adhering fruits, DEIM-CMFNet can output single-fruit detection boxes that are closer to the true boundaries. These results are then used as prompts for the SAM (Segment Anything) segmentation model to obtain more accurate instance segmentation masks. If adjacent fruits are mistakenly merged into a single box during the detection stage, SAM often generates a connected merged mask, leading to mask adhesion and affecting subsequent fruit-cluster spatial structural modeling.
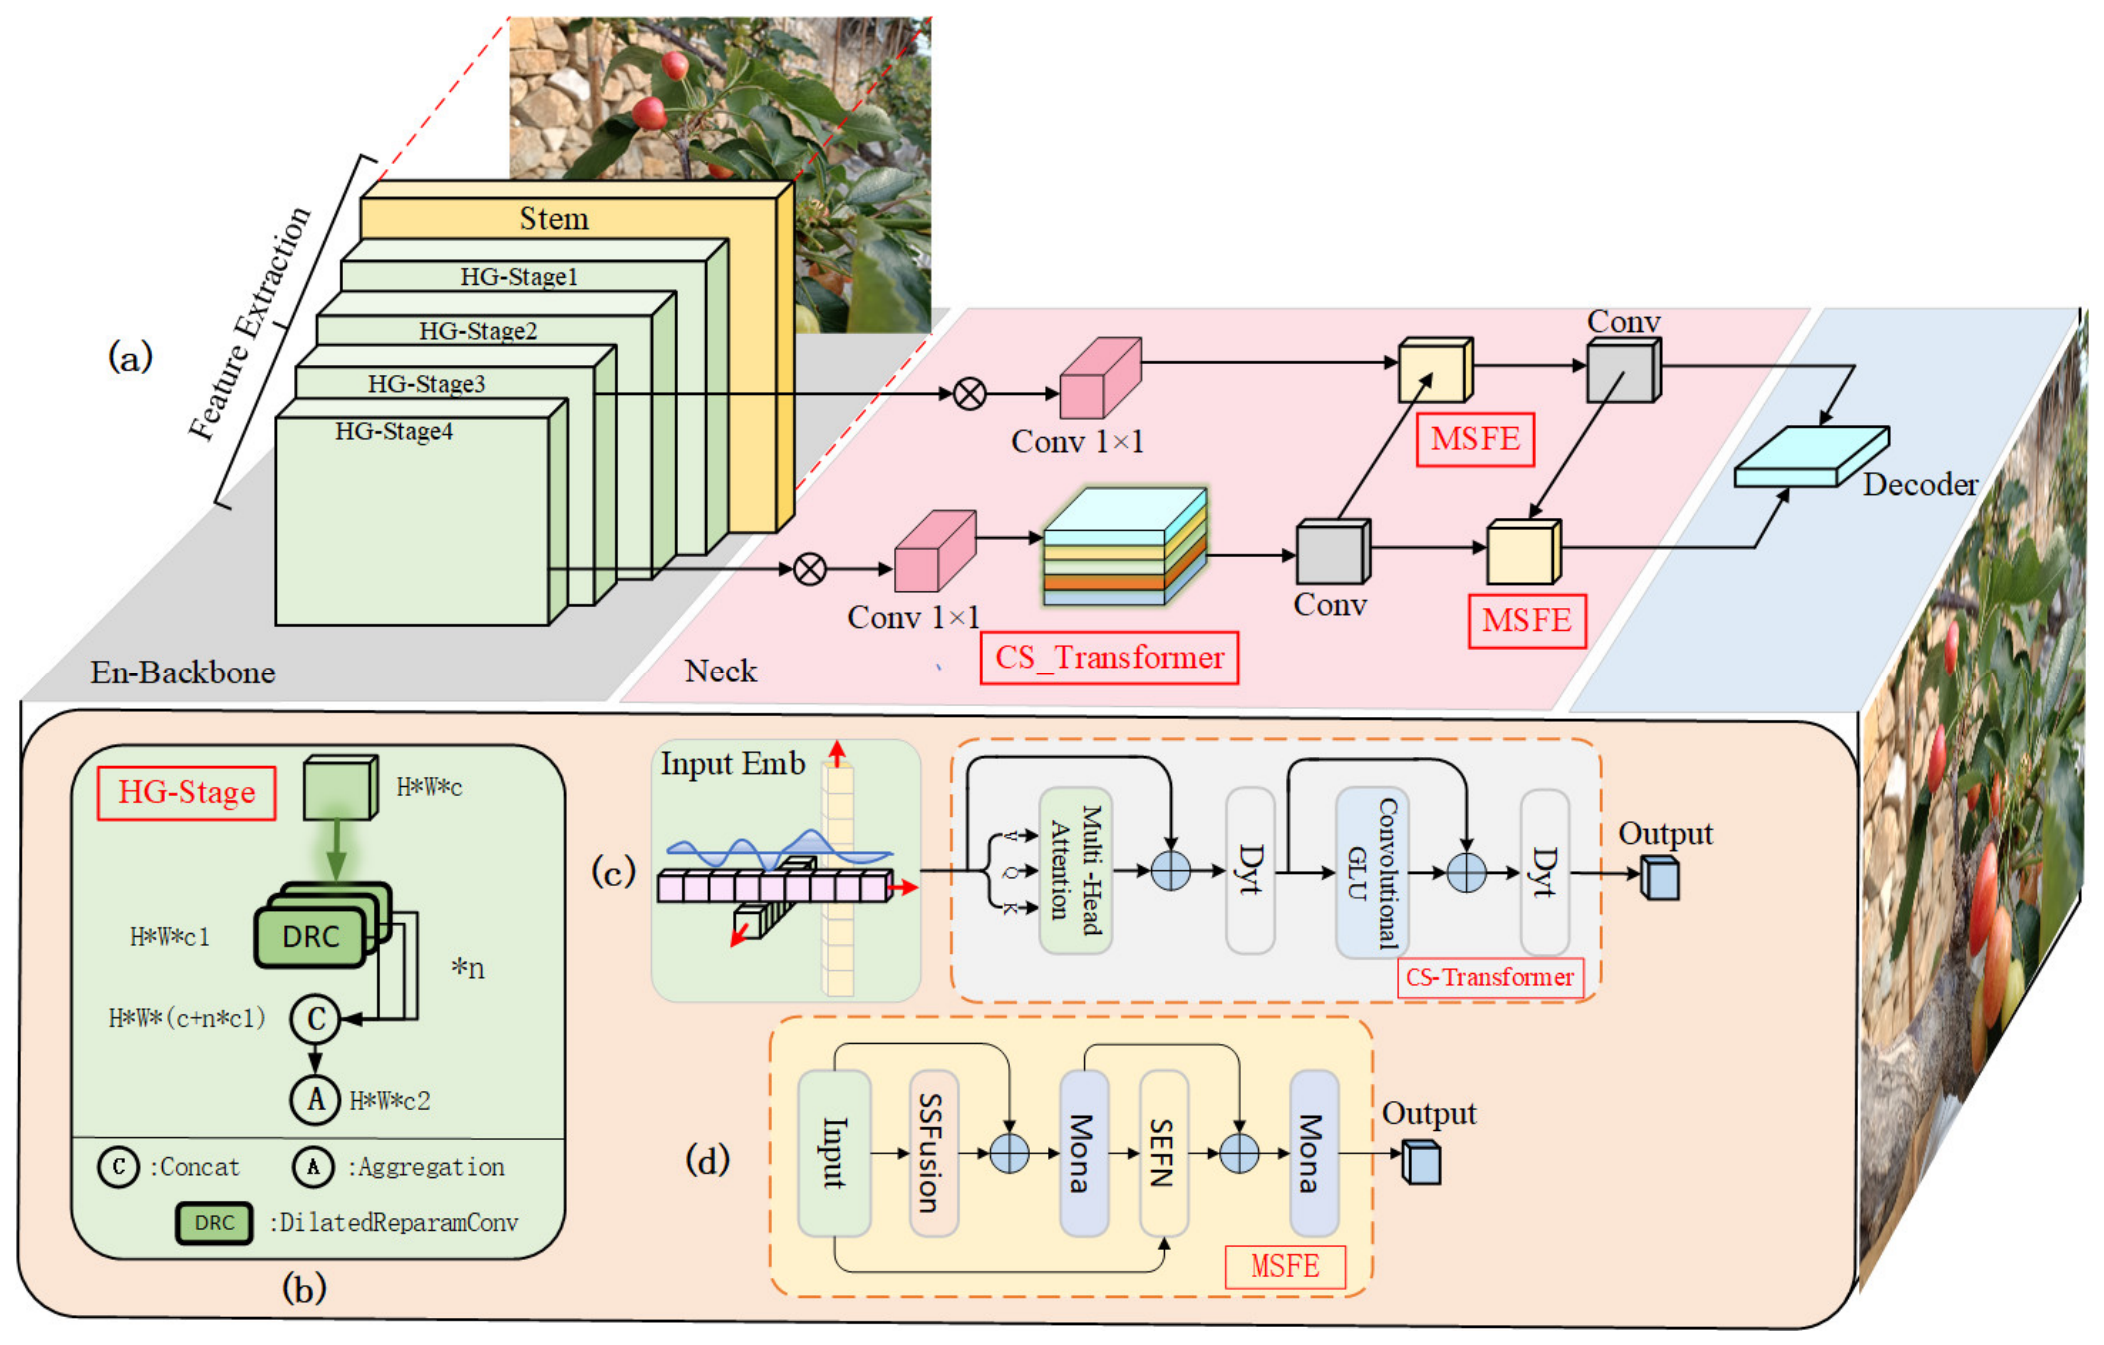
The architecture and workflow of DEIM-CMFNet are shown in
Figure 5. The upper part of
Figure 5 illustrates the overall network architecture and feature flow of DEIM-CMFNet, including the backbone, neck, feature enhancement modules, and decoder. The red boxes in the upper part indicate the positions where the proposed improved modules are embedded in the overall model. The lower part of
Figure 5 presents the internal structures of the three key improved modules, namely DilatedReparamConv, CS-Transformer, and MSFE. Overall, DEIM-CMFNet follows a backbone–encoder–feature enhancement–detection head pipeline. First, the input cherry image is fed into the backbone network for multi-scale feature extraction. In this stage, DilatedReparamConv is incorporated into the DEIM backbone, as shown in
Figure 5b, to enlarge the receptive field and enhance the representation of fruit-level color distribution, local texture details, and weak boundary cues. This helps reduce feature confusion between adjacent cherries under occlusion and adhesion conditions. Second, a lightweight CS-Transformer encoder is constructed, as shown in
Figure 5c, to improve the representation of color transitions and complex textures while preserving the advantage of global modeling. Third, the MSFE multi-path feature enhancement module is designed, as shown in
Figure 5d, to enable collaborative modeling of semantic consistency, spatial structure perception, and attention focusing. Finally, the enhanced features are fed into the detection head to predict the bounding boxes and ripeness categories of individual cherries. Therefore,
Figure 5 illustrates not only the structural composition of DEIM-CMFNet but also the collaborative workflow by which the proposed modules improve ripeness discrimination and instance-level localization in dense cherry fruit-cluster scenes.
4.1. DilatedReparamConv Module
To improve the model’s ability to represent fruit color structure and spatial details, this study introduces the DilatedReparamConv (Dilated Re-parameterized Convolution) module [
40] into the backbone network of the DEIM model to replace part of the standard convolution layers, thereby forming the HG-Stage structure, as shown in
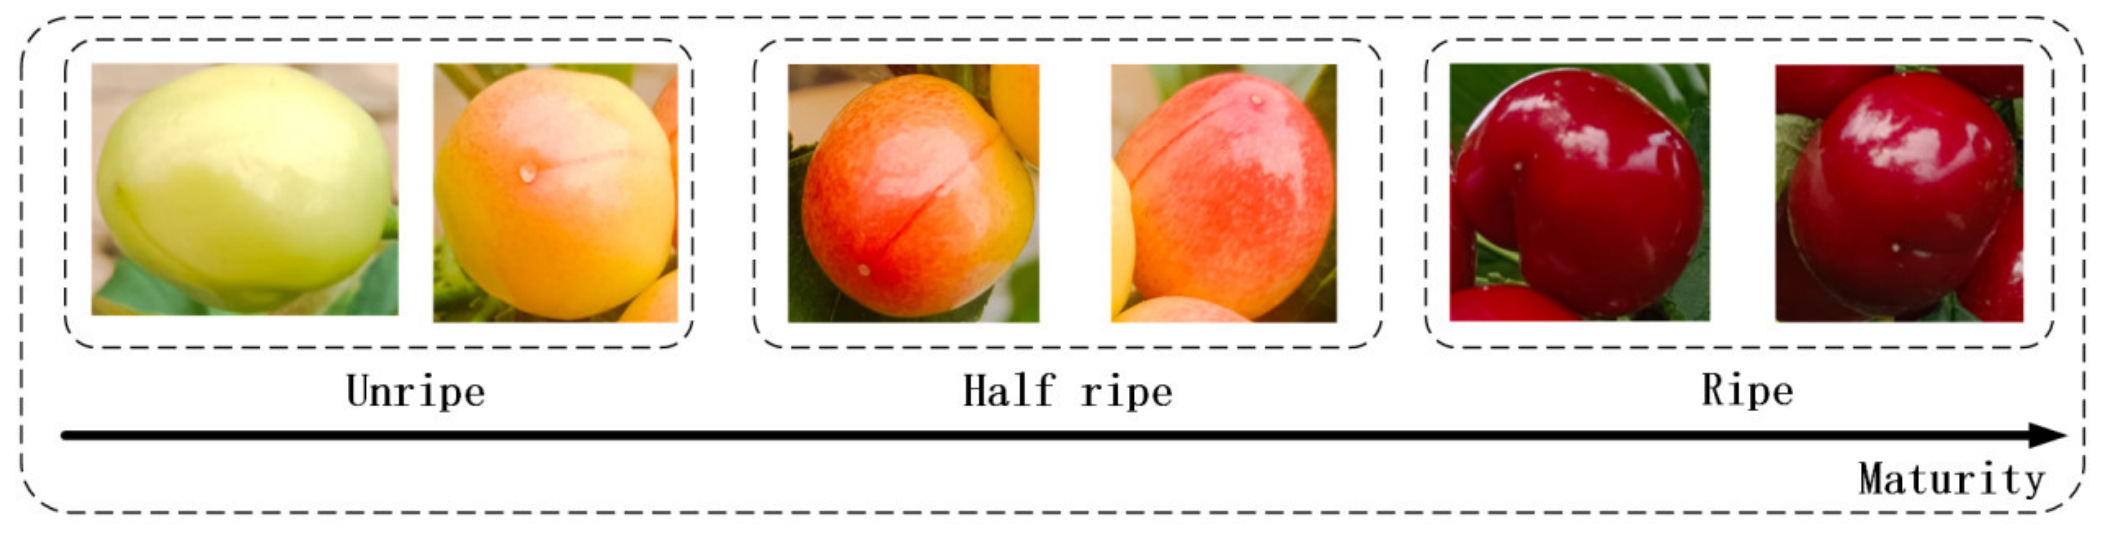
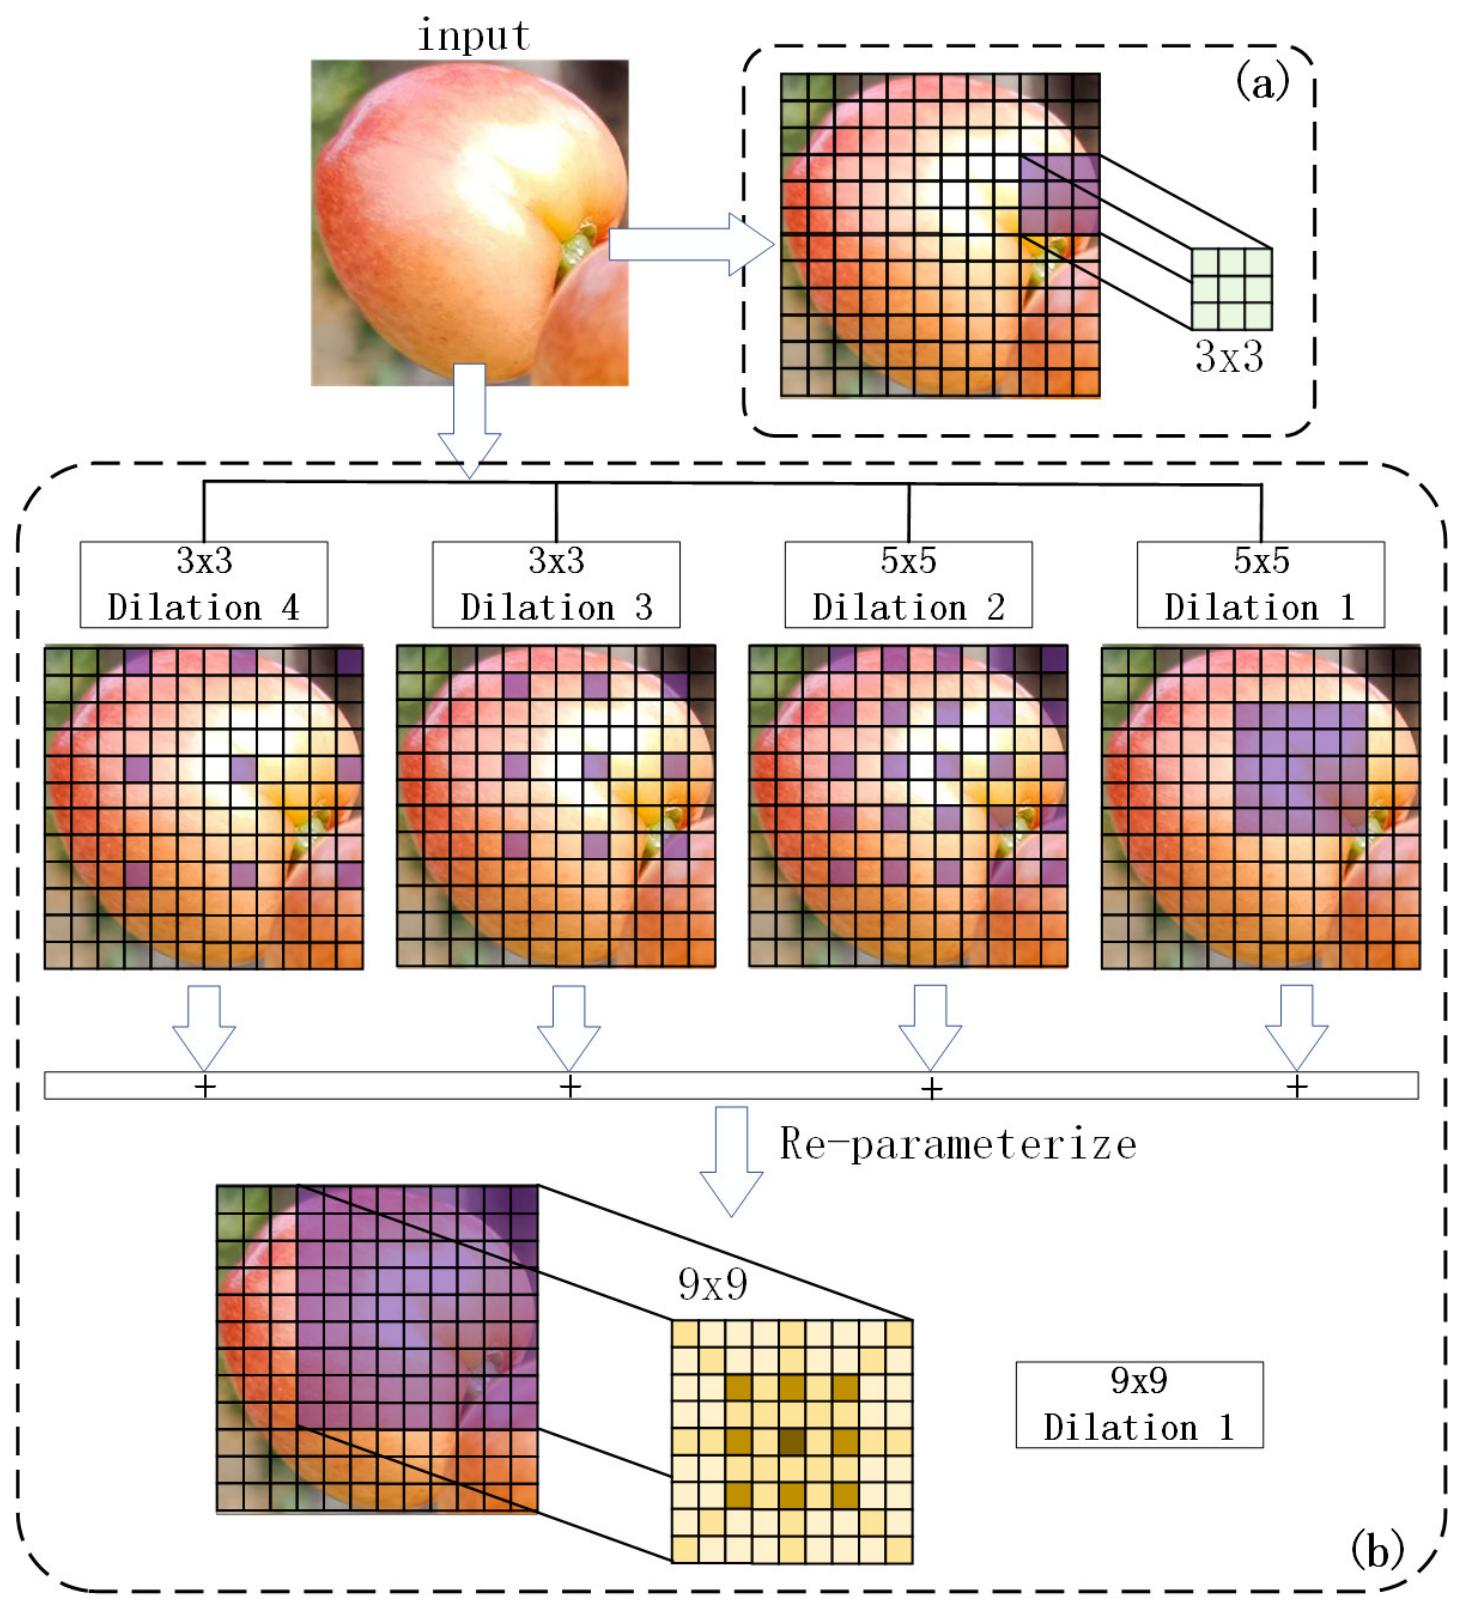
Figure 5b. However, under greenhouse conditions, cherry images exhibit typical characteristics of delicate color gradation, uneven illumination intensity, and weakened boundaries. On the one hand, the color changes across the unripe, half-ripe, and ripe stages are often not uniformly distributed over the fruit surface but instead present a continuous transition from the fruit shoulder to the fruit belly, accompanied by local color patches and texture differences with varying intensity. On the other hand, the waxy layer on the fruit surface leads to obvious specular reflection, and backlighting or inverse lighting conditions easily produce shadows and bright spots, causing fruits at the same ripeness stage to show different color responses in different regions. In addition, cherry fruit clusters are often densely distributed, and mutual adhesion and occlusion among fruits weaken the true boundaries, thereby increasing the risk of confusion between adjacent fruits with similar colors and unclear contours. Therefore, in the above scenarios, standard 3 × 3 convolution, due to its limited receptive field, is more likely to focus on local textures and short-range statistics. As shown in
Figure 6a, this leads to insufficient capture of cross-region color consistency, overall color distribution patterns, and continuous contours of weak boundaries, resulting in problems such as local illumination disturbances being amplified in ripeness features and adjacent fruits being easily mismerged or mistakenly segmented.
The DilatedReparamConv module achieves broader contextual aggregation through multiple branches of dilated convolutions with different dilation rates, as shown in
Figure 6b. This design significantly expands the effective receptive field without substantially increasing the number of parameters or computational cost, allowing feature extraction to simultaneously capture the overall color distribution within the fruit and local detail variations. Specifically, the sparse sampling mechanism of dilated convolution establishes longer-range pixel associations without increasing the kernel size, helping the model make predictions based on fruit-scale color structure rather than only local color fragments. When highlight patches or shadow occlusion appear on the fruit surface, the network can suppress and correct local abnormalities with the aid of broader contextual information, thereby improving the robustness of feature extraction in regions with local color heterogeneity and reducing ripeness misclassification caused by illumination. In addition, the combination of multiple branches with different dilation rates endows the network with multi-scale spatial perception. Smaller dilation rates focus more on fine-grained textures and contour cues near boundaries, whereas larger dilation rates aggregate more stable color trends and shape structure information within the fruit. Their complementarity helps improve instance discrimination and boundary localization accuracy in dense fruit-cluster scenes with weak boundaries and similar colors.
More importantly, DilatedReparamConv exhibits a re-parameterization property characterized by multi-branch representation during training and single-branch inference during deployment. During training, the multi-branch structure provides more diverse feature representations and improves model fitting capability. During inference, as shown in
Figure 6b, all branches can be re-parameterized into a single 9 × 9 large-kernel convolution, thereby achieving a larger effective receptive field and stronger structural modeling capability while preserving a simple inference structure. This design enhances the joint modeling of overall fruit color transitions, fruit-surface textures, and weak-boundary contours, while avoiding the additional inference cost of multi-branch structures in practical deployment. As a result, the model maintains stable ripeness discrimination and target localization performance under complex illumination and dense occlusion conditions.
4.2. Design of the CS-Transformer Module
When a conventional Transformer encoder is applied to cherry ripeness detection, the LayerNorm + MLP configuration can lead to two types of problems. First, normalization based on feature statistics tends to amplify local abnormal responses under uneven illumination conditions such as specular reflections, shadow occlusion, and backlighting, causing scene-dependent drift in feature magnitudes and thereby weakening the subtle color differences related to ripeness. Second, the point-wise transformation of the MLP lacks explicit spatial modeling capability, making it difficult to establish stable representations of fruit-surface texture gradients, weak fruit boundaries, and adhesion patterns in dense fruit clusters. To address these issues, this study proposes the CS-Transformer (Color–Space Enhanced Transformer), whose structure is shown in
Figure 5c. While retaining the global dependency modeling capability of self-attention, DyT [
41] and CGLU [
42] are introduced to redesign the normalization and feed-forward sublayers for cherry fruit scenes.
Unlike LayerNorm, which relies on channel statistics, DyT uses a learnable scaling factor to perform continuous, differentiable, and controllable magnitude compression on features:
where
is a learnable parameter used to adaptively regulate the compression strength. This design is highly targeted to cherry scenes. Highlights and shadows on the cherry surface can cause local extreme responses. If statistical normalization is used, the mean and variance are easily affected by abnormal pixels, leading to overall feature drift. In contrast, DyT suppresses extreme activations and stabilizes feature scales through the saturation property of
while preserving fine-grained gradient information of color transitions in the non-saturated range so that the model is more inclined to learn stable color trends related to ripeness rather than being driven by instantaneous illumination disturbances. In other words, without introducing statistical quantities, DyT achieves color-domain representation enhancement with stabilized magnitude, preserved gradients, and resistance to illumination abnormalities, thereby providing a more consistent input distribution for subsequent attention and feed-forward layers.
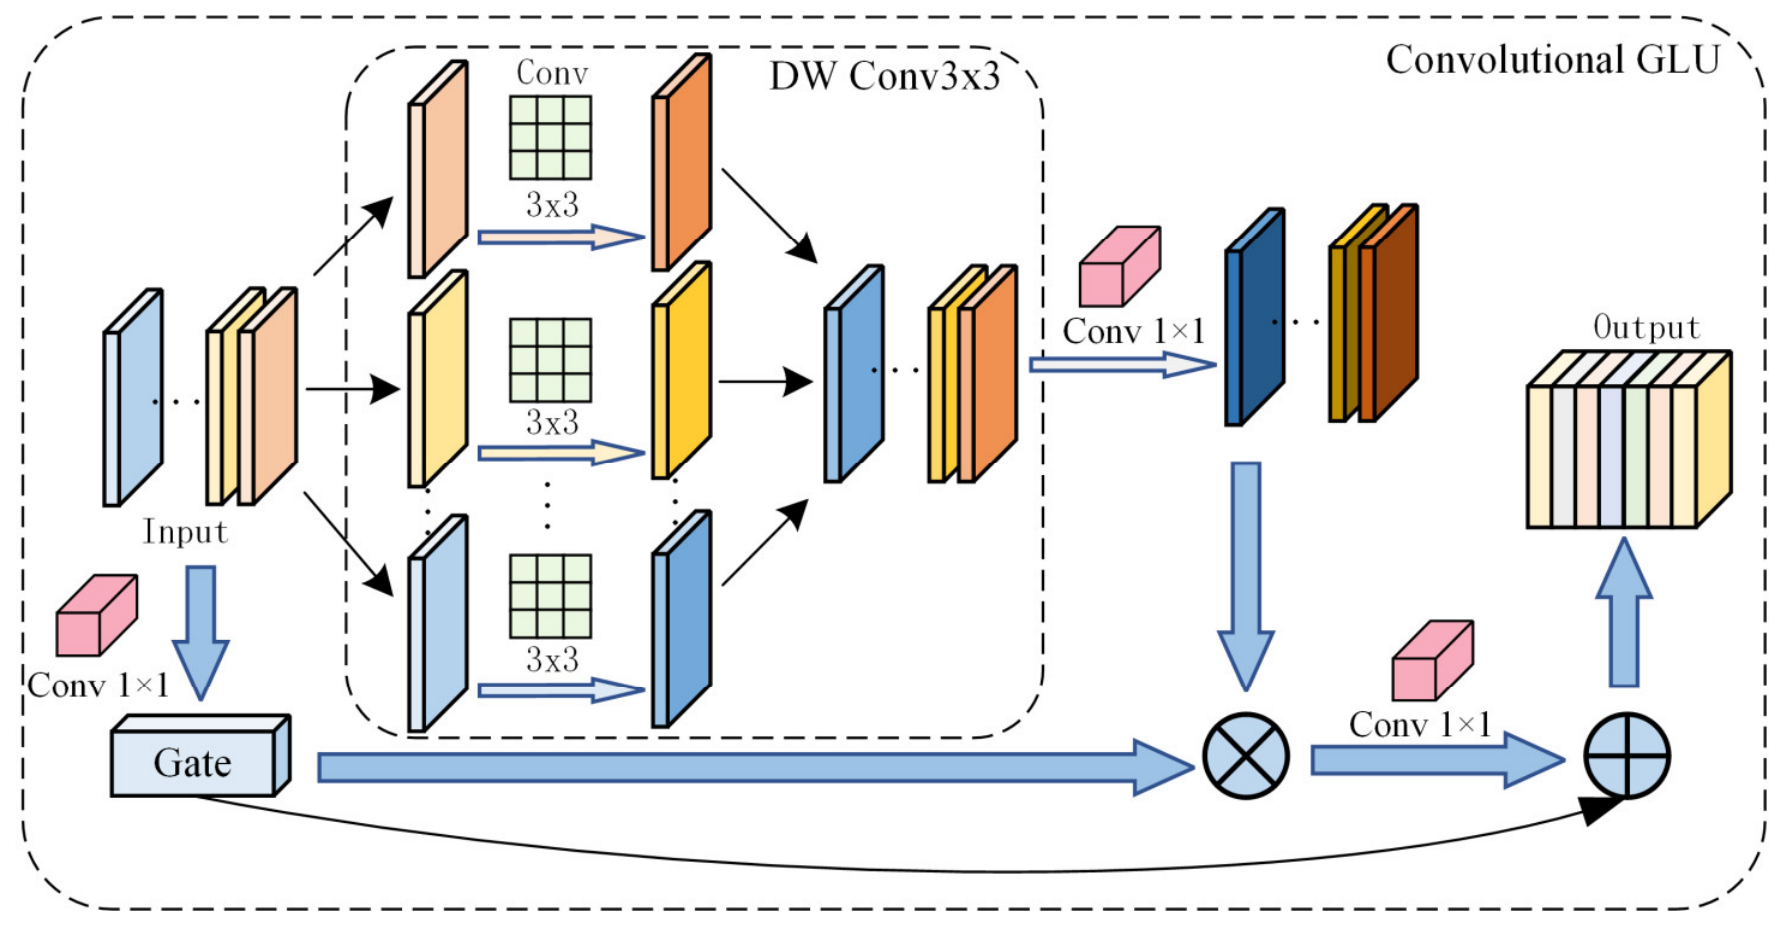
The multilayer perceptron (MLP) is used to perform position-wise channel mapping and nonlinear transformation on input features. Since each spatial position in the MLP acts independently, it is difficult to characterize weak fruit boundaries, adhesion between adjacent fruits, and continuous local texture changes. To solve this problem, this study introduces the CGLU (Convolutional GLU) module into the feed-forward sublayer, as shown in
Figure 7. This process couples the local spatial perception of convolution with the gated selection mechanism: one branch generates candidate features, while the other branch generates gating weights to selectively enhance and suppress the candidate responses. Therefore, in dense cherry fruit-cluster scenes, the model can more effectively strengthen weak boundaries and contour structures, improve stable responses at fruit edges, and reduce feature mixing between adjacent fruits. In addition, it can suppress redundant textures and illumination noise and gate down non-ripeness cues such as highlight patches and shadow textures.
4.3. Design of the Multi-Dimensional Synergistic Feature Enhancement Module MSFE
In fine-grained cherry ripeness detection, the RepNCSPELAN4 structure in the original DEIM model has limited sensitivity to color, and the stacked convolution structure lacks nonlinear interaction between channels, making it difficult to capture subtle transitions from green to red. Its representation of color boundaries is also insufficient, which easily leads to problems of color over-smoothing and boundary degradation. In cherry ripeness detection, affected by factors such as delicate color transitions, blurred fruit boundaries, and dense clustering, the model requires not only fine local parsing and global semantic consistency but also high-precision focus on key regions. To address the above problems and meet practical application requirements, this study proposes a multi-dimensional synergistic feature enhancement module, MSFE (Multi-Dimensional Synergistic Feature Enhancement).
As shown in
Figure 5d, the MSFE module combines the SSFusion Block and Mona [
43] to construct a collaborative dual-branch framework of backbone and memory and introduces SEFN (Semantic Enhanced Feature Normalization) [
44] as a lightweight attention unit, thereby forming a multi-dimensional feature enhancement path from global to local. This not only realizes three-dimensional complementary modeling for spatial refinement, semantic stabilization, and attention focusing but also achieves structural balance and defect compensation, enabling the model to effectively handle complex fruit scenes involving color transitions, blurred boundaries, and semantic mixing and improving the semantic modeling capability for cherry fruit ripeness. The design process of the MSFE module is described in detail below.
4.3.1. Analysis of the Color Over-Smoothing Problem Caused by Convolution
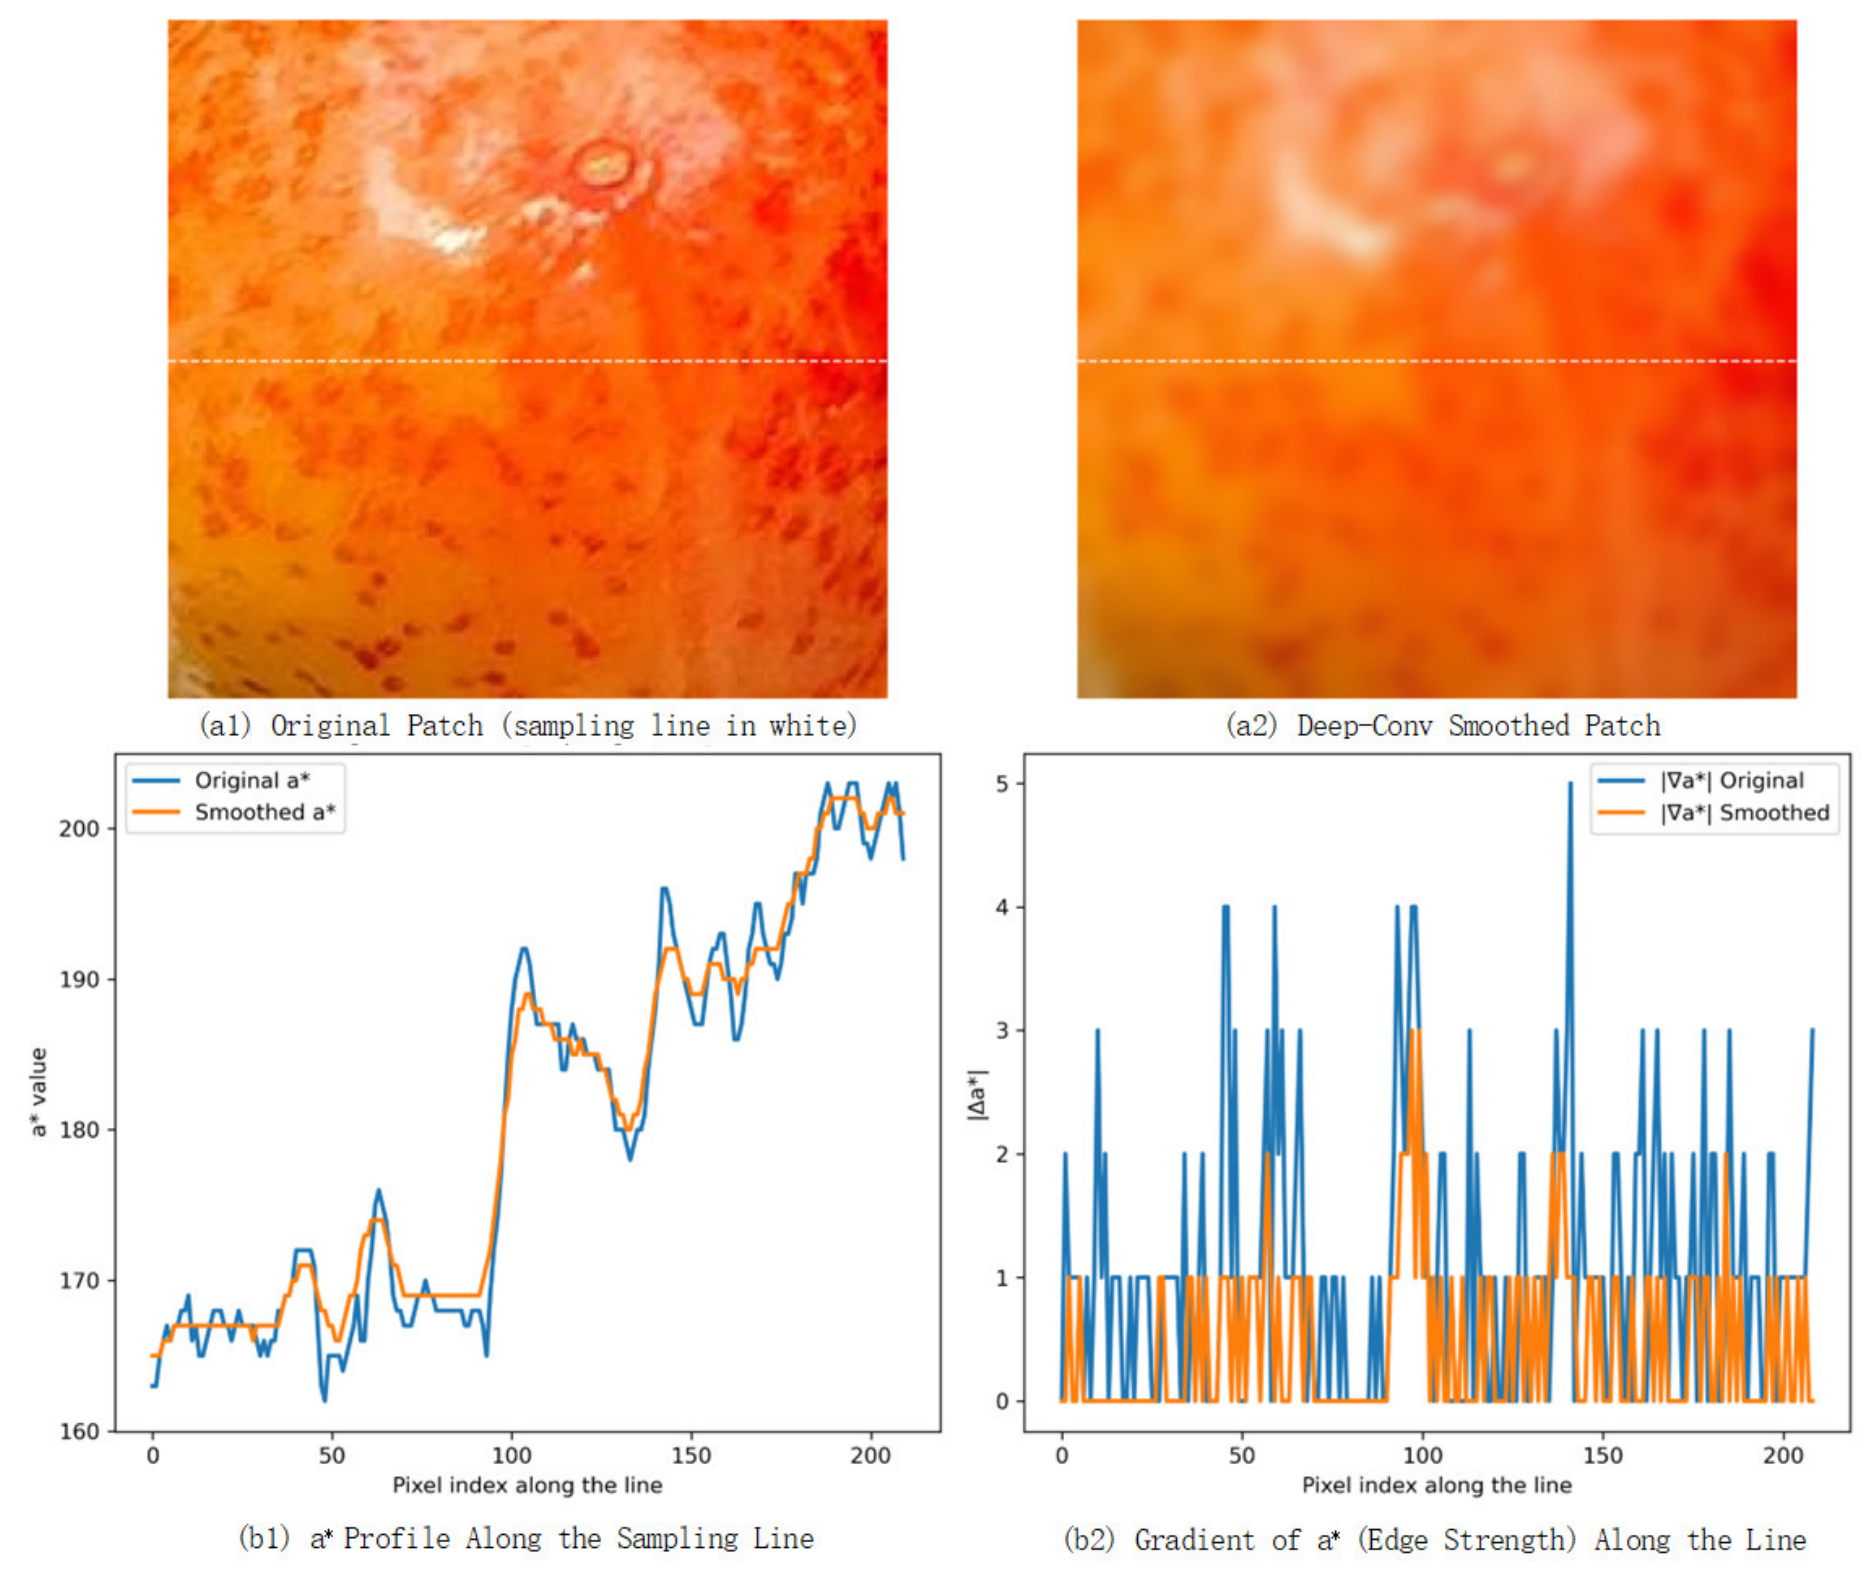
During deep stacking, convolution operations continuously perform local weighted averaging, thereby introducing obvious effects of color over-smoothing and edge blurring, which weaken or even obscure local cues that are crucial for ripeness discrimination, such as subtle color differences, weak boundaries, and spot-like textures. To visually demonstrate this limitation, this study conducted visualization and quantitative analysis on local regions of the cherry fruit surface, as shown in
Figure 8.
As shown in
Figure 8(a1), the original image contains a large number of fine-scale color textures and tiny spots on the fruit surface. Its a* chromaticity (the opponent axis in the CIELAB color space used to represent the transition from green to red, where a larger value usually indicates a stronger red component) exhibits frequent and sharp local fluctuations along the spatial dimension and can accurately characterize the subtle color differences between half-ripe and ripe regions.
Figure 8(a2) shows the result of this patch after successive 3 × 3 convolutions, which is used to simulate the cumulative smoothing effect of a deep CNN. It can be observed that the red spots on the surface, light-reflective regions, and color transition regions all become blurred, the color distribution tends to be uniform, and local textures are significantly lost.
To further quantify the color degradation caused by convolution,
Figure 8(b1) presents the distribution curve of the a* channel along the sampling line. The blue curve represents the original distribution and shows obvious peaks and valleys, reflecting the small-scale color differences and texture variations on the real fruit surface. The orange curve represents the smoothed distribution, from which it can be seen that the overall amplitude decreases, the local peaks and valleys are compressed, and the curve variation becomes gentler.
Figure 8(b2) shows the first-order gradient variation curves before and after convolution processing. The blue curve represents the variation in the absolute value of the first-order gradient of the original patch along the sampling line, while the orange curve represents the variation in the absolute value of the first-order gradient of the smoothed patch along the sampling line. These curves are used to evaluate the sharpness of color boundaries and textures. By comparing the two curves, it can be seen that the processed curve (orange) becomes significantly smoother and the differences between peaks and valleys are reduced, indicating that local color differences are flattened by the averaging operation of the convolution kernel. The original gradient curve contains many high-amplitude sharp peaks, which represent the real edges and abrupt color changes on the fruit surface. After smoothing, the overall gradient curve declines, and many sharp peaks disappear, further indicating that convolution effectively weakens edge intensity and makes color transitions excessively smooth.
4.3.2. Design of the SSFusion Block Module
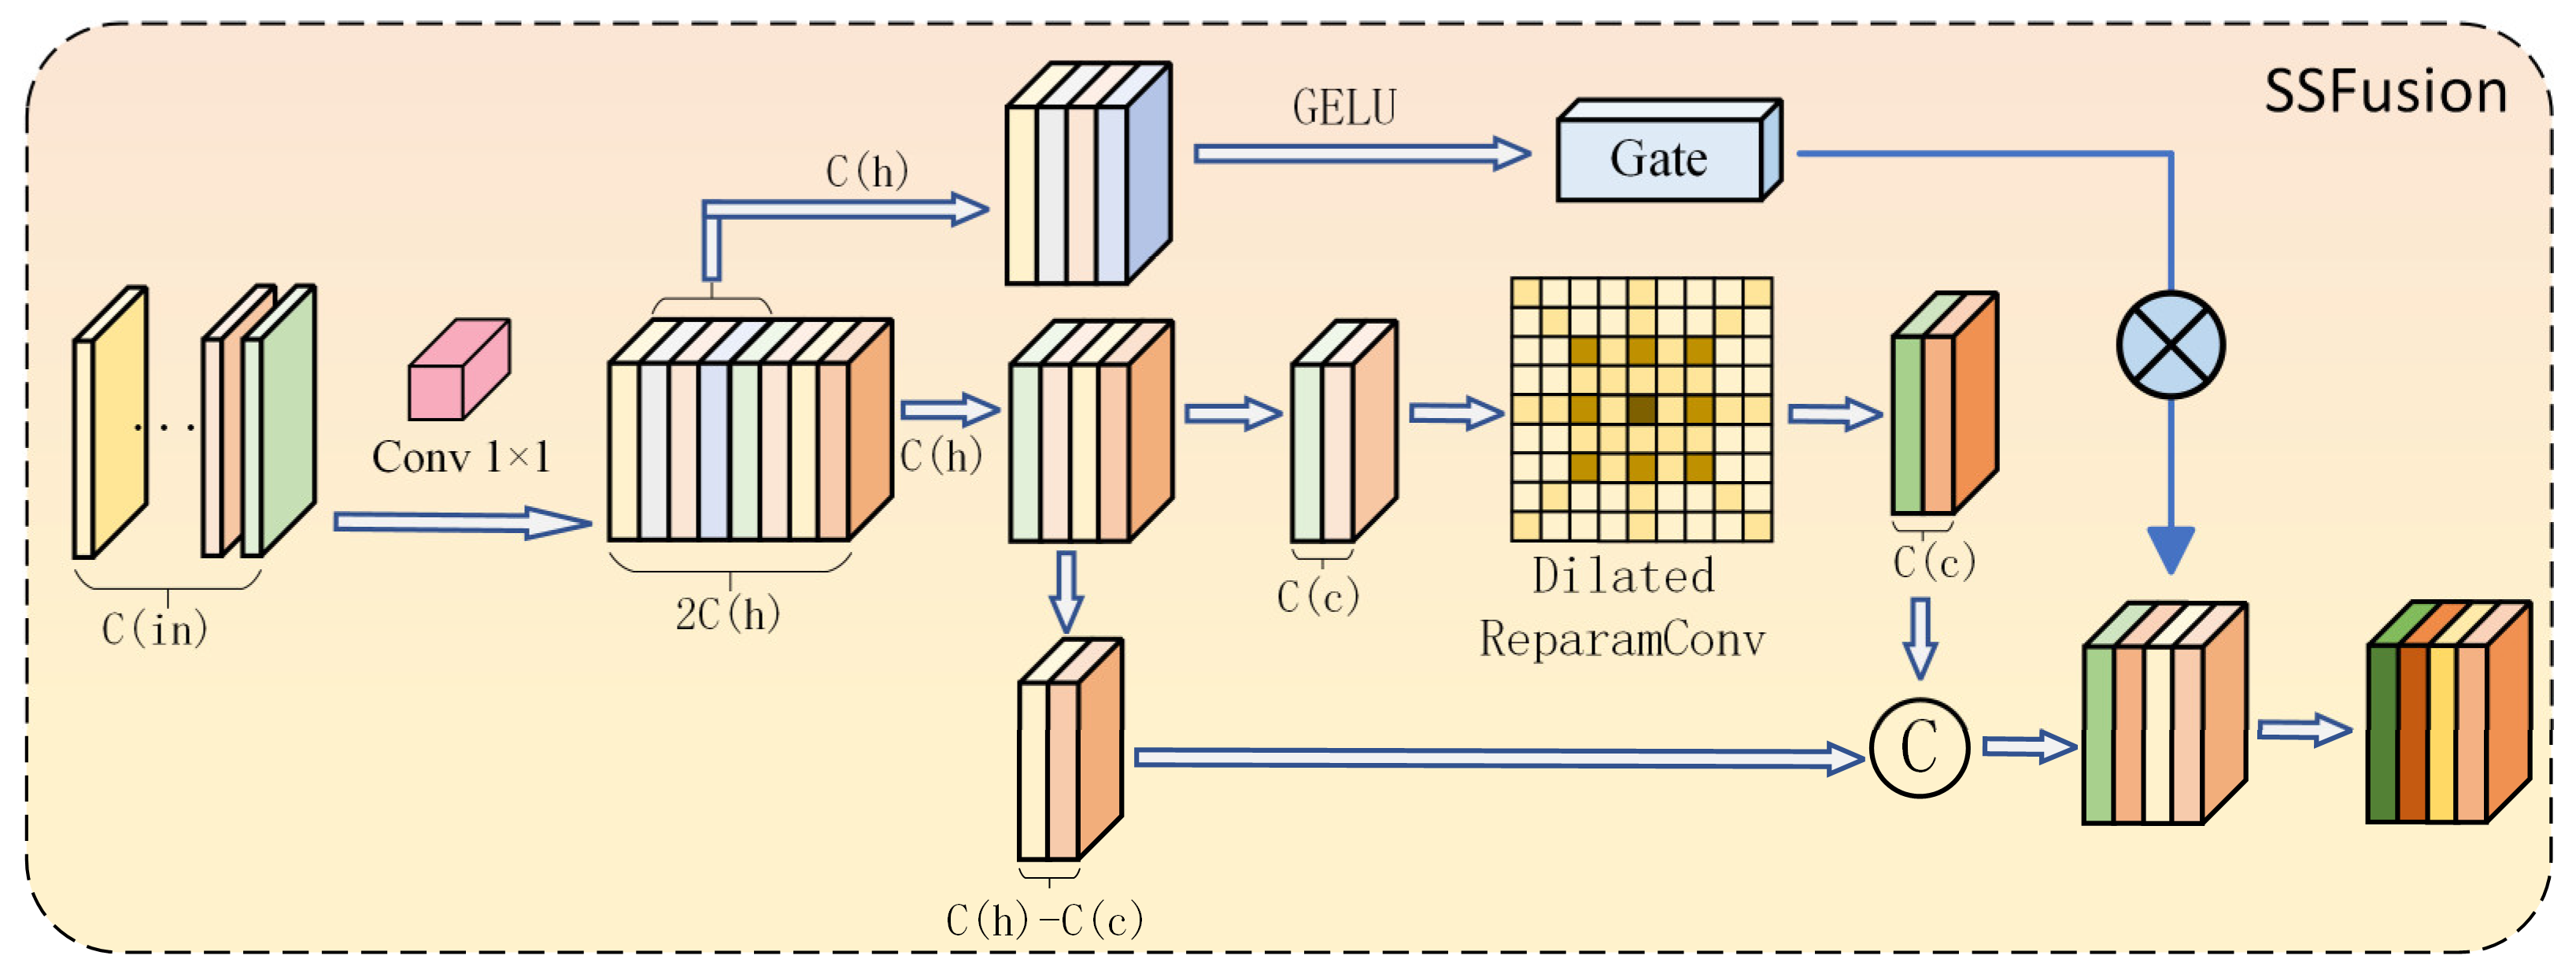
To address the smoothing effect caused by stacked convolutions, the SSFusion Block (Semantic–Spatial Fusion Block) module was specifically designed, as shown in
Figure 9.
In the semantic domain, the SSFusion module realizes global spatial interaction through bidirectional feature mixing and dynamically suppresses redundant responses and highlights discriminative features by using a channel gating mechanism. In this way, it maintains focus on key information in scenarios involving subtle color differences and semantic ambiguity, avoids the color over-smoothing that is likely to be caused by convolutional structures, and preserves strong responses in slowly varying regions such as color transitions, weak boundaries, and texture transitions. Compared with the local averaging property of convolution, this path effectively alleviates the problem that colors are smoothed and homogenized during continuous stacking. In the spatial domain, DilatedReparamConv is introduced to expand the receptive field, capture broader local structural variations, and strengthen boundary parsing. Especially under conditions of branch–leaf occlusion or fruit overlap, it can still recover clear contour information.
This complementary design, which combines explicit spatial detail parsing with implicit semantic channel modeling, enables the module to possess broad-range semantic focusing ability, preserve high-resolution local details, and suppress erroneous responses caused by similar colors between the background and the fruit within the same feature layer. Compared with stacked convolutional structures, this module performs better in preserving color transitions, restoring boundaries, and suppressing semantic interference.
4.3.3. Mona Module
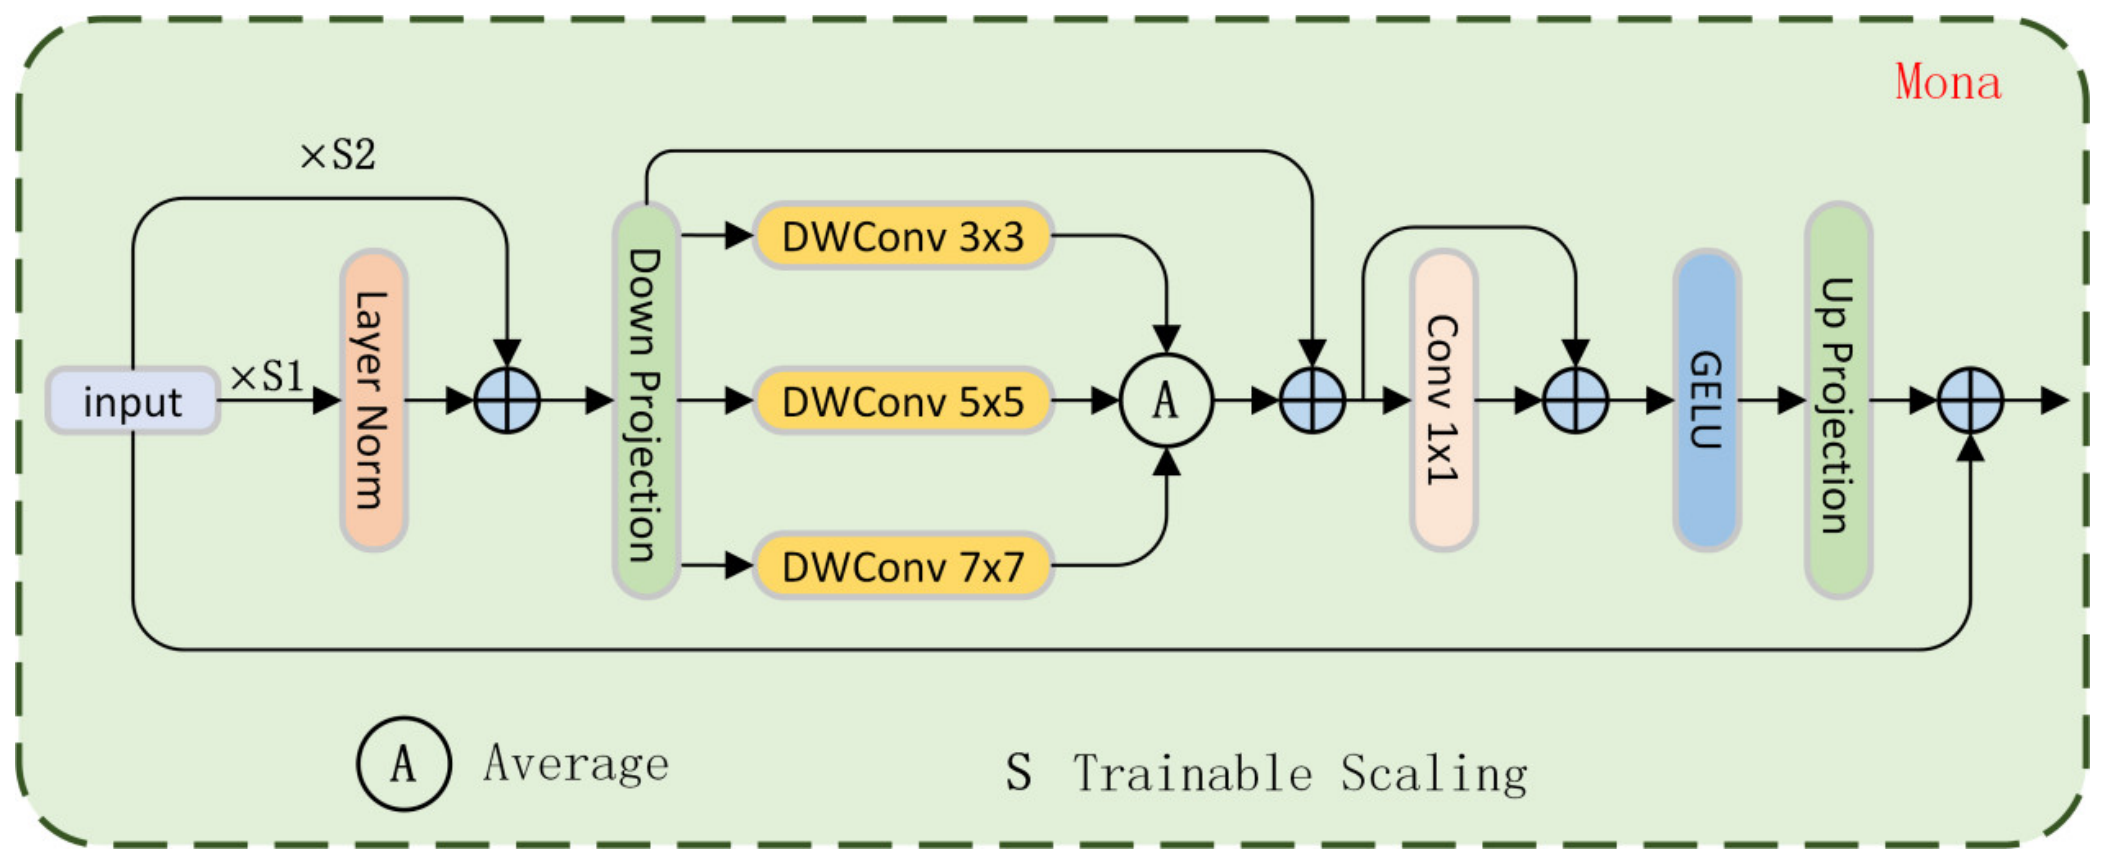
After the SSFusion Block performs global semantic filtering in the channel domain and captures multi-scale details by relying on dilated convolution, the Multi-cognitive Visual Adapter (Mona) module is introduced, as shown in
Figure 10, in order to align category and ripeness features across different layers and reduce the risks of semantic drift and misclassification. In terms of input optimization, Mona introduces normalization and a learnable scaling factor to stabilize the feature distribution and suppress abnormal shifts, thereby avoiding the excessive weakening of color differences caused by standard normalization and better preserving the color transition pattern of cherries from green to red. In terms of feature modeling, Mona employs Multi-Cognitive Visual Filters to introduce three convolution kernels, 3 × 3, 5 × 5, and 7 × 7, in parallel, so as to simulate human visual perception at multiple scales. This enables the model to simultaneously parse small-scale color patches on the fruit surface and the overall color transition, thereby improving its ability to characterize the transitional stage of half-ripe fruits.
4.3.4. SEFN Module
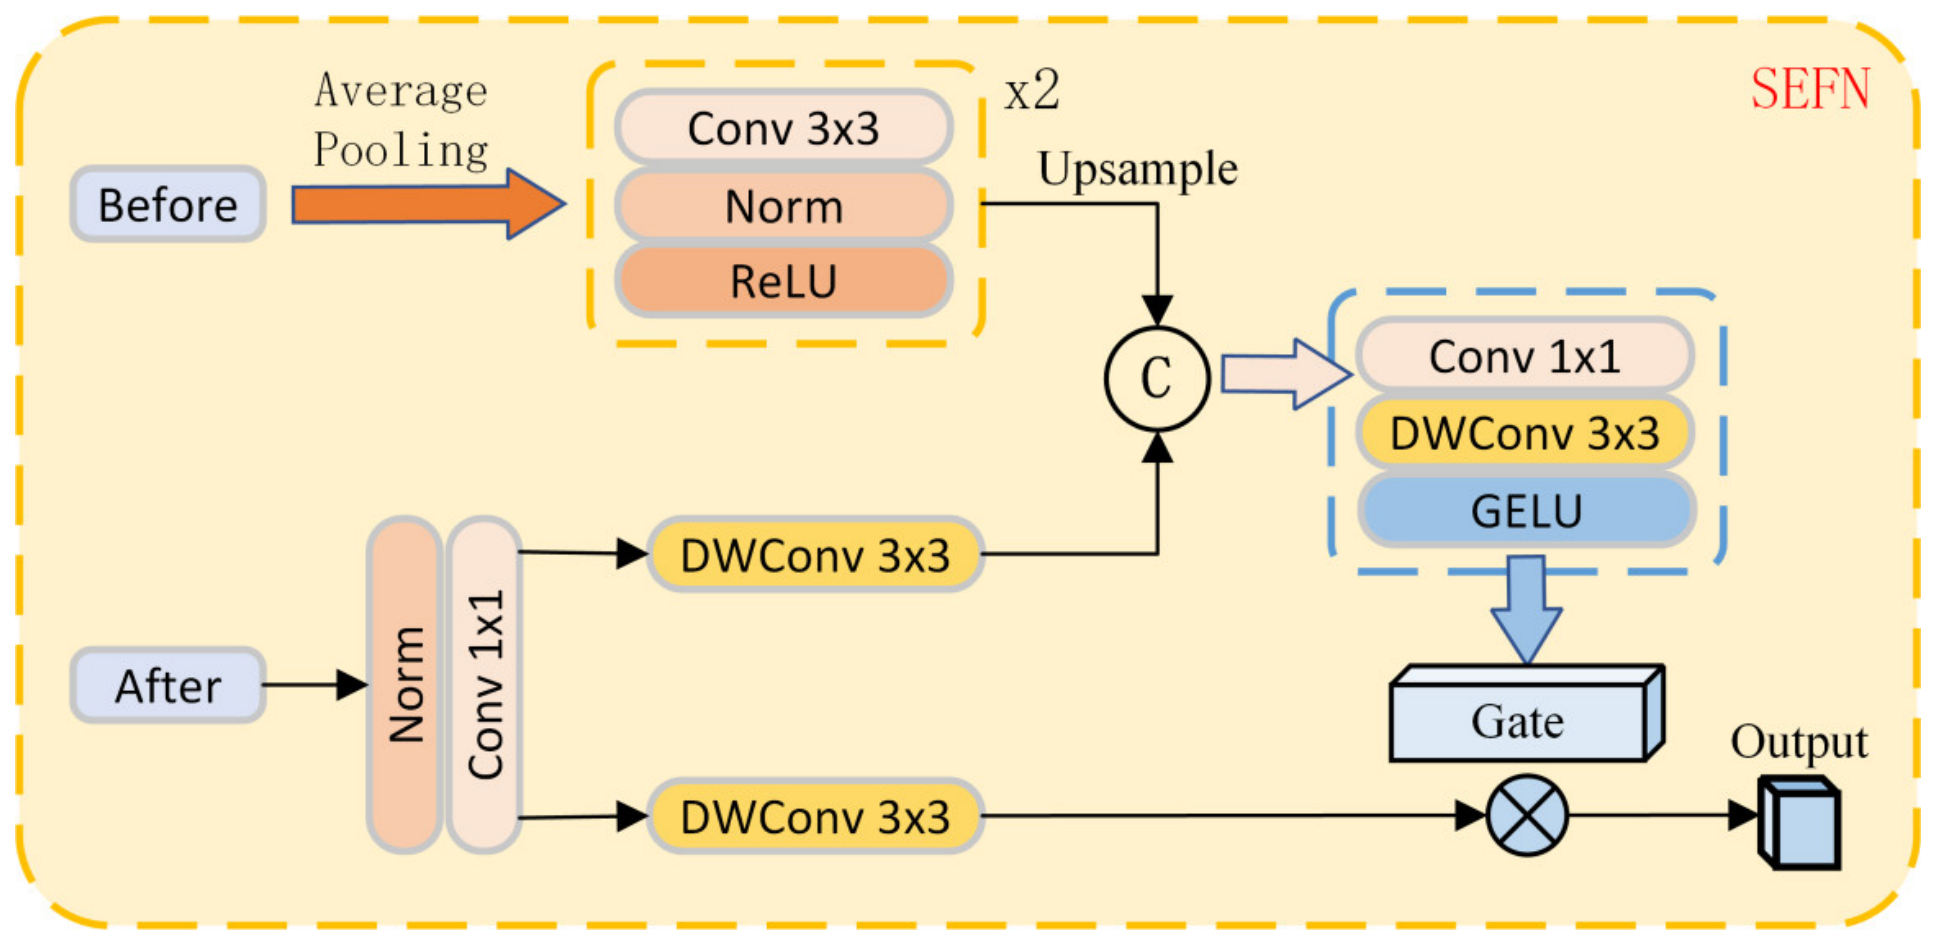
To improve Mona’s ability in boundary focusing and local fine-grained modeling and to enhance the robustness of the SSFusion Block under complex backgrounds, SEFN is further introduced (
Figure 11). On this basis, SEFN (
Figure 11) introduces semantically guided attention in both the channel and spatial domains. It uses normalization to eliminate non-structural shifts in the features, thereby improving semantic separation capability and the stability of feature representation, and then dynamically enhances the responses of key channels and spatial regions by using attention maps generated under semantic guidance, so as to strengthen fine-detail discrimination while maintaining global consistency. Compared with general attention mechanisms (such as SE and CBAM), SEFN exhibits stronger semantic sensitivity and redundancy suppression ability in color-dominated visual tasks.
5. Quantification of Fruit-Cluster Spatial Structural Phenotypes and Modeling of Fruit-Thinning Priority Decision-Making
To further characterize the intensity of spatial competition and the risk characteristics of fruit development within fruit clusters, this section presents the quantification of fruit-cluster spatial structural phenotypes and the fruit-thinning priority decision-making process and constructs fruit-thinning ranking methods at both the cluster level and the fruit level.
5.1. Fruit Density
In this study, cherry fruits often cluster along branches, and excessive local density not only aggravates shading and restricted ventilation but also increases the risk of micro-damage caused by fruit contact and compression. Therefore, in density modeling, this study adopts two complementary indicators, namely cluster-level aggregation morphology and fruit-level relative spacing, to reflect the crowding of cherry fruits at two scales. Cluster density provides an overall description of structural compactness at the cluster level, while fruit spacing supplements local crowding information at the individual level. Through these two indicators, the spatial structure of fruit clusters can be characterized more comprehensively, thereby providing reliable input for the spatial risk term in subsequent fruit-thinning priority modeling.
5.1.1. Cluster Density
Fruit-cluster density is an important phenotypic indicator for measuring the compactness of fruits within a cluster and is usually defined as the ratio of the fruit-cluster mask area to the area of its minimum bounding rectangle. In fruit spatial density modeling, traditional clustering methods based on a fixed neighborhood radius are difficult to adapt simultaneously to dense and sparse fruit distribution regions in an image and are prone to over-clustering or over-segmentation under complex branch structures. To address the characteristics of densely distributed and irregularly arranged cherry fruits, this study proposes two key improvements based on the traditional DBSCAN clustering method: dynamic EPS adaptive clustering and intra-cluster re-clustering. Through a threefold mechanism of dynamic scale selection, local re-clustering, and morphological constraints, adaptive, hierarchical, and structure-aware modeling of fruit-cluster density is achieved so that the cluster partitioning better conforms to the true growth morphology of the fruits.
In dynamic EPS adaptive clustering, traditional DBSCAN clustering relies on a manually specified fixed EPS radius, which can easily lead to over-clustering or excessive fragmentation in images with large variations in fruit density. To address this, this study proposes a dynamic EPS estimation strategy based on the median fruit spacing. First, the contour center of each cherry instance is extracted from the segmentation mask. Then, the pairwise Euclidean distances among all fruit centers are calculated, and their median,
, is taken as the feature-scale reference. Based on
, a clustering scale reference is defined, and symmetric multi-scale candidate intervals are set around it. A limited grid search is then performed so that EPS takes several values that are smaller than, close to, and larger than the reference, and DBSCAN clustering is performed for each value. This setting is intended to cover two extreme situations: a smaller EPS is used to suppress over-clustering and avoid merging adjacent but actually independent fruit clusters, while a larger EPS is used to enhance connectivity under dense and occluded conditions and reduce the risk of over-segmentation, thereby obtaining stable cluster partitioning in scenes with different densities. Finally, a comprehensive score is calculated by jointly considering average density, the number of clusters, and an EPS penalty term, which is defined as:
where
denotes the average density of all clusters, with a larger value being better;
is the number of clusters obtained, with more clusters being better; and
is a penalty term for larger clustering radii. The EPS with the highest score is selected as the final parameter in this study.
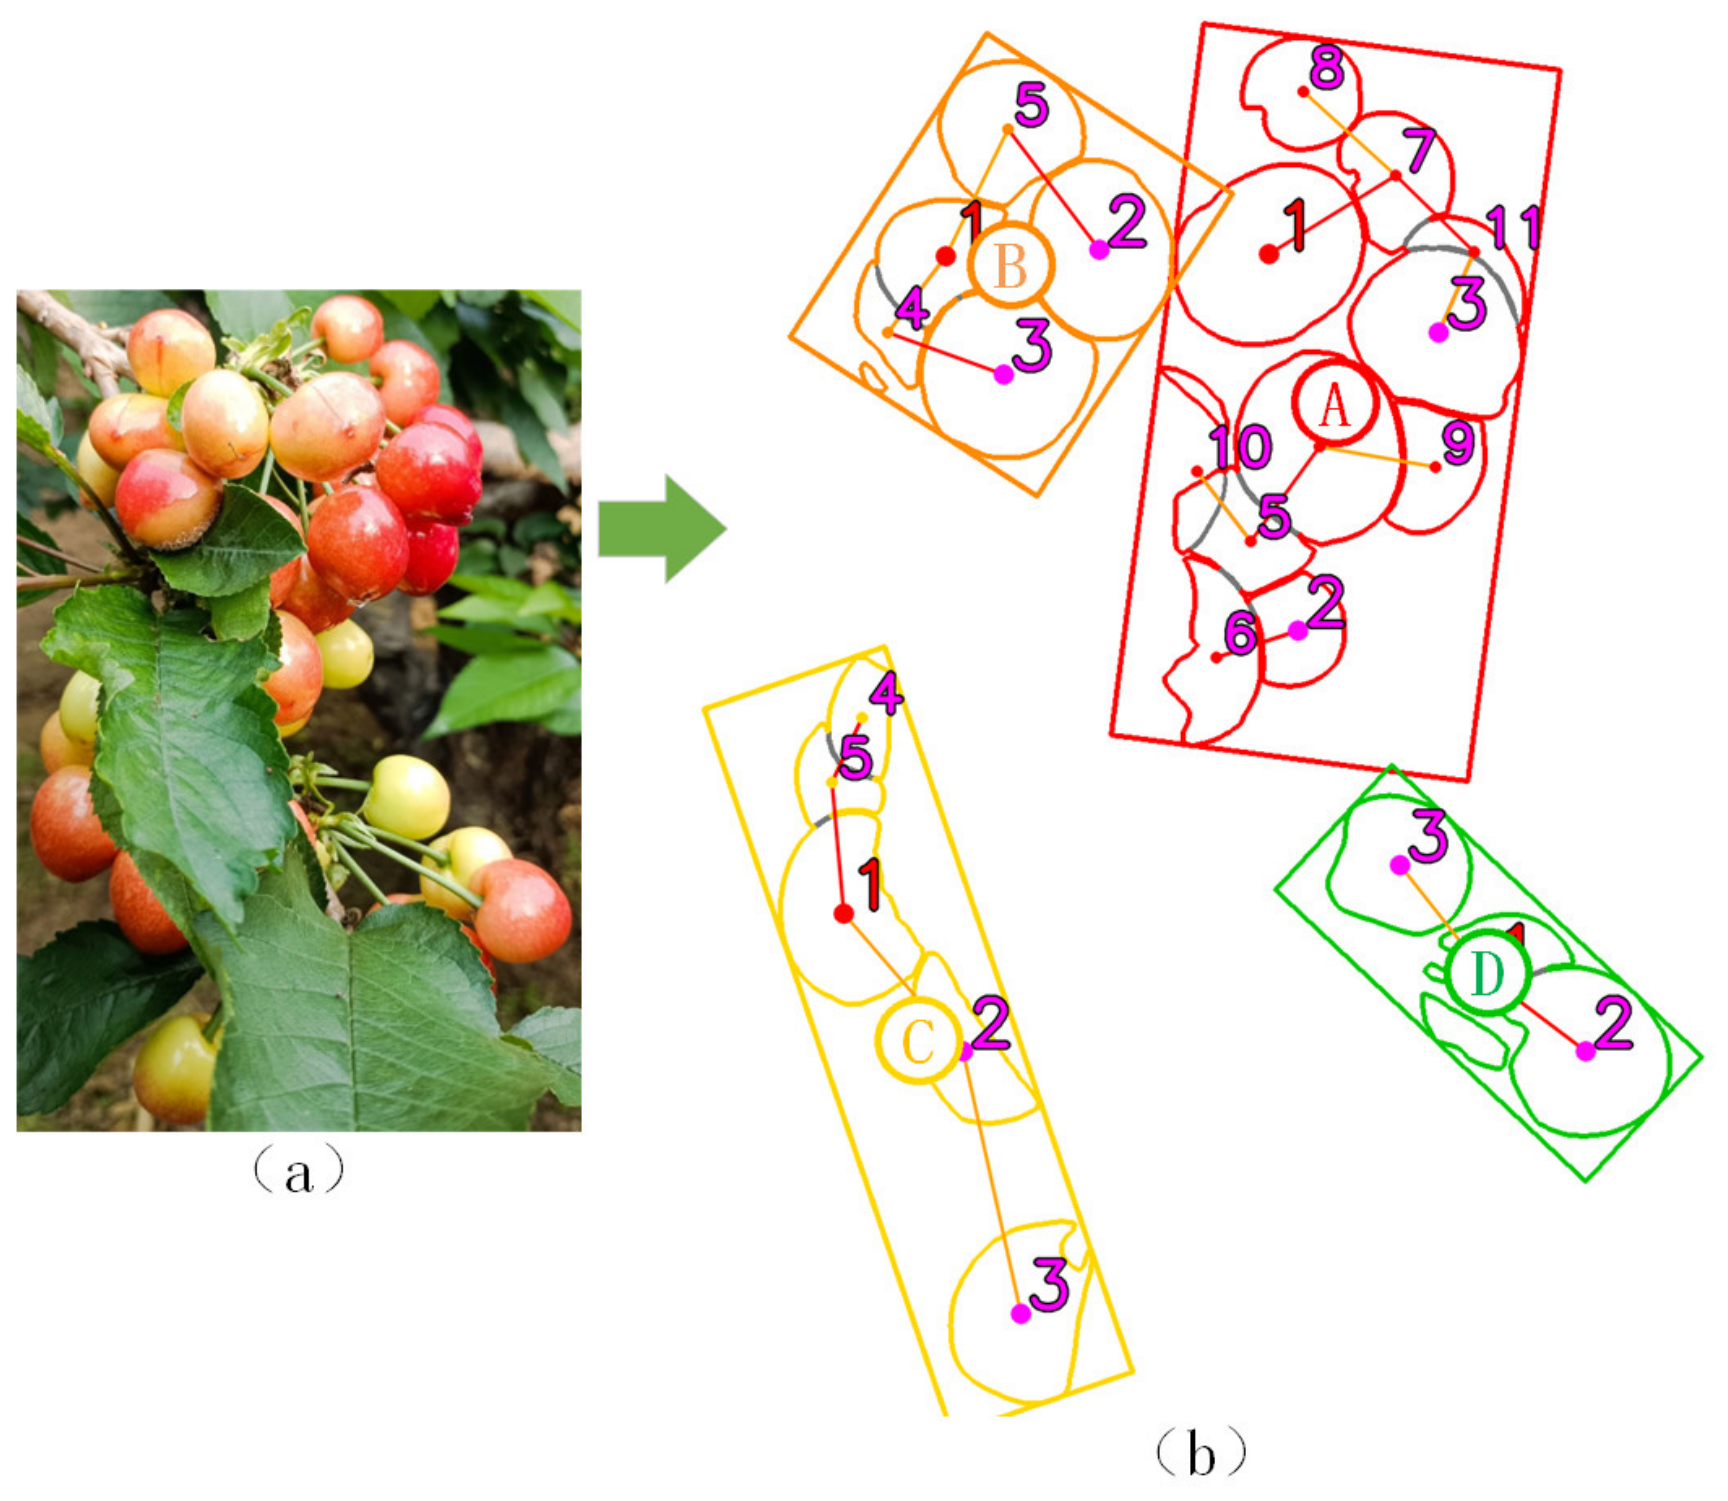
To handle the case where cherry fruits are densely distributed linearly along branches, this study further proposes an intra-cluster re-clustering mechanism. When the aspect ratio of the minimum bounding rectangle of a fruit cluster or the number of fruits within a single cluster exceeds a preset threshold, EPS is reduced to 50% of its original value, and clustering is performed again within that cluster. In this way, elongated clusters are further split into multiple sub-clusters, and their densities are calculated separately. This mechanism effectively reduces the underestimation bias of density in elongated fruit clusters and more accurately reflects the actual spatial distribution pattern of fruit clusters.
For the final clustering result, all fruit masks within a cluster are merged into an integral region, and the ratio of its area to the area of the minimum bounding rectangle of the cluster is calculated as the density indicator . A density value closer to 1 indicates that the fruits are more compactly arranged, thereby providing a quantitative description of the spatial structure of the fruit cluster.
5.1.2. Fruit Spacing
Fruit spacing is used to measure the degree of sparse or dense distribution of fruits in two-dimensional space and is an important structural phenotypic indicator reflecting the compactness of fruit arrangement. Different from density indicators based on fruit-cluster shape or overall area, this indicator directly characterizes the relative spatial relationships among individual fruits and has strong robustness to changes in fruit-cluster morphology. Even when there are obvious gaps between branches or occlusion between fruit clusters, fruit spacing can still stably reflect the compactness characteristics of the fruit cluster.
First, based on the segmentation mask
of each fruit, its centroid coordinates
are calculated, and the equivalent circular diameter
of the fruit is estimated using the mask area
, which is defined as follows:
This equivalent diameter is used to characterize the scale of the fruit and provides a unified reference for subsequent distance normalization. Then, in the centroid space, a nearest-neighbor search strategy is adopted to match each fruit
with its nearest neighboring fruit
, and the Euclidean distance
between them is calculated as:
To eliminate the influence of different image resolutions and fruit size differences on the distance scale, a normalized distance indicator based on fruit scale is introduced:
This normalization form enables fruit spacing to maintain good comparability across different fruit sizes, image resolutions, and imaging devices. A smaller indicates a shorter relative spacing between fruit and its nearest neighbor, and therefore represents greater local crowding.
5.2. Morphological Index
Morphological characteristics are important phenotypic indicators for evaluating the appearance quality and commercial grade of cherries. In this study, a comprehensive morphological index,
(Shape Morphology Index with Boundary Factor), is proposed by integrating geometric regularity and boundary detail features. It combines circularity, compactness, eccentricity, and boundary irregularity as follows:
where
,
,
,
, and
are weighting and penalty coefficients, which can be adjusted according to task requirements. In addition, circularity
is used to measure the closeness between the fruit contour and an ideal circle and is calculated as:
This indicator reflects the overall regularity of fruit shape. The closer the fruit contour is to a circle, the larger the value of
. Compactness
represents the filling degree of the fruit within its minimum bounding rectangle (MBR) and is used to characterize the fullness of fruit shape. It is defined as:
where
is the fruit region area and
is the area of the corresponding minimum bounding rectangle. To further describe the symmetry of fruit shape, the eccentricity
based on ellipse fitting is introduced and is calculated as:
where
and
represent the lengths of the major axis and minor axis of the fitted ellipse, respectively. A smaller eccentricity indicates that the fruit shape is closer to an axis-symmetric structure. In addition, to suppress the overestimation of fruits with irregular boundaries by geometric indicators, a boundary irregularity factor
is introduced to quantify the local concavity–convexity and irregularity of the fruit contour, which is defined as:
where
is the actual perimeter of the fruit contour, and
is the contour perimeter after smoothing, which is used to measure the concavity–convexity and irregularity of the boundary. A higher value of
indicates that the fruit surface has more small-scale irregularities, which are related to shrinkage, lesions, and other factors.
By combining geometric closeness, spatial utilization, shape balance, and boundary irregularity, provides a comprehensive morphological evaluation method that can reflect the appearance quality of cherries more comprehensively and accurately. Especially when evaluating fruits with irregular boundaries, can effectively suppress the influence of boundary factors on the morphological score, thereby avoiding the overestimation of irregular fruits in geometric scoring. This gives the index stronger adaptability and stability in fruit morphological analysis and quality evaluation.
5.3. Fruit-Thinning Priority Modeling Based on Spatial Competition and Ripeness Risk
In this study, the fruit-thinning decision-making process is divided into two levels, namely the cluster level and the fruit level, so as to simultaneously consider the effects of spatial competition and ripeness risk. First, at the fruit-cluster scale, the urgency of fruit thinning for each cluster is comprehensively ranked by quantifying the spatial compactness among fruit clusters and the ripeness status of fruits, thereby identifying the fruit clusters that should be prioritized for intervention. Subsequently, within each fruit cluster, the specific fruits to be removed are further finely ranked by combining the spatial relationships among fruits and the differences in individual ripeness, thereby realizing fruit-level priority decision-making. This hierarchical decision-making framework not only ensures the overall rationality of fruit-thinning operations at the spatial structural level but also takes into account the local differences in fruit developmental status.
5.3.1. Cluster-Level Fruit-Thinning Priority
In orchard management practice, fruit-thinning decisions are not triggered by a single indicator but instead require careful consideration of multidimensional information such as the spatial crowding degree of fruit clusters, fruit ripeness status, and overall morphological quality. In essence, fruit-thinning decisions should be established on the joint evaluation of two types of key information, namely spatial competition intensity and ripening-development risk. To this end, based on the aforementioned fruit-cluster density, fruit spacing, and morphological indicators, this study constructs a cluster-level priority scoring model for fruit thinning (cluster_score), which is used to rank multiple fruit clusters within the same image and determine the target regions for priority intervention.
- (1)
Crowding risk modeling
The spatial crowding of fruit clusters directly affects resource competition among fruits and the risk of contact compression and is one of the key bases for fruit-thinning decisions. Considering that the crowding of cherry fruit clusters is not a single-scale phenomenon, at the overall level it is necessary to measure the overall filling and compactness of fruits within a limited space to reflect the overall load pressure in that region. However, relying solely on overall indicators may mask extreme crowding in certain local regions. Therefore, it is necessary to introduce a minimum spacing indicator at the local level to characterize the most crowded location within the fruit cluster, which usually corresponds to the microenvironment with the most severe shading, restricted ventilation, and strongest competition. At the same time, the close adhesion of cherry fruits easily leads to fruit-surface friction and micro-damage, thereby increasing the risks of disease infection and decay, which are also high-risk conditions that should be avoided as a priority during fruit thinning. Therefore, this study jointly characterizes the spatial risk of fruit clusters from three aspects, namely, the overall density
, the local minimum spacing
, and the direct contact ratio
, and defines the raw spatial crowding risk term as:
where
denotes fruit-cluster density, that is, the ratio of the union area of fruit masks within the cluster to the area of its minimum bounding rectangle;
is the minimum nearest-neighbor normalized distance among fruits within the cluster;
is the contact ratio, i.e., the proportion of fruit pairs satisfying
≤ 1; and
is a very small constant used to prevent division by zero.
- (2)
Maturity risk modeling
In addition to spatial structural factors, the ripeness status of fruits within a fruit cluster also affects the urgency of fruit-thinning intervention. From an agronomic perspective, fruit clusters with an overall low ripeness level or asynchronous ripening progression often reflect the relative disadvantage of fruits in that region in terms of nutrient supply or growth conditions. If a high load state is maintained, significant differentiation in fruit size, coloration, and harvest time is more likely to occur during later development. Therefore, such fruit clusters are usually more suitable as priority targets for fruit-thinning intervention to avoid further amplification of developmental differences at later stages. Based on the above considerations, this study uses the mean and dispersion of fruit ripeness within the cluster to jointly describe the ripeness status of the fruit cluster, and the maturity risk term
is calculated as follows:
where
and
represent the mean and standard deviation of fruit ripeness within the cluster, respectively, calculated by assigning a value of 0 to unripe fruits, 0.5 to half-ripe fruits, and 1 to ripe fruits within the cluster. Through
, both the risk of delayed ripening progression and the risk of uneven ripening can be characterized simultaneously, which helps identify fruit clusters with unstable developmental status.
- (3)
Shape risk modeling
In actual production, fruit morphological quality is directly related to commercial value and postharvest quality. Based on the aforementioned comprehensive morphological index
, this study incorporates the degree of fruit morphological abnormality within the cluster into fruit-thinning priority modeling and defines the shape risk term
as:
where
is the number of fruits within the cluster, and
is the comprehensive morphological index of the
-th fruit. This term is used to avoid neglecting morphologically abnormal fruits in fruit-thinning decisions, thereby improving the overall appearance consistency of the fruit cluster.
- (4)
Multi-indicator normalization and cluster-level priority fusion
Since the above three types of risk indicators differ in numerical range and distribution characteristics, this study uses the robust min–max normalization method to map each risk term onto a unified scale. Subsequently, the cluster-level fruit-thinning priority score
(
) is constructed through weighted linear fusion:
where
represent the normalized spatial, maturity, and shape risk terms, respectively; and
are the corresponding weights. Finally, a larger
value indicates that the fruit cluster should be given higher priority for fruit-thinning intervention in the current image.
It should be noted that , , , and are two-dimensional image-based phenotypic indicators rather than calibrated three-dimensional physical measurements. Since is defined as the area ratio between the union of fruit masks and the minimum bounding rectangle, it is relatively insensitive to uniform image scaling. and are calculated based on normalized fruit spacing, where the centroid distance is divided by the equivalent fruit diameter, thereby reducing the influence of image resolution and moderate changes in camera-to-fruit distance. Similarly, is mainly composed of dimensionless shape descriptors, including circularity, compactness, eccentricity, and boundary irregularity, and is therefore relatively robust to uniform scale changes.
5.3.2. Fruit-Level Fruit-Thinning Priority
After determining the cluster-level fruit-thinning priority, it is still necessary to further specify the thinning order of individual fruits within the cluster. Since fruits within the same fruit cluster still show significant differences in spatial position, ripeness status, and morphological quality, relying only on cluster-level indicators for uniform treatment may easily overlook local structural risks or individual developmental abnormalities. Therefore, under the constraint of cluster-level priority, this study further constructs a fruit-level fruit-thinning priority scoring model (fruit_score) to rank the fruits within the same fruit cluster.
The local spatial environment in which a fruit is located within the cluster is one of the core bases for judging whether it should be preferentially removed. Different from focusing only on the minimum neighbor distance, this study uses the averaged normalized distance over multiple neighbors to characterize the local tightness of a fruit, so as to improve robustness to noise and accidental contact. Specifically, for the
-th fruit within the cluster, its
nearest neighbors are selected, and the mean normalized distance is calculated as:
where
denotes the Euclidean distance between fruit
and its
-th nearest neighboring fruit, which directly characterizes the spatial interval between the two fruits on the two-dimensional image plane.
is the equivalent diameter of fruit
; (
,
) are the centroid coordinates of the segmentation mask of the
-th fruit; and (
,
) are the centroid coordinates of the
-th nearest neighboring fruit. A smaller value of
indicates that the fruit is located in a more crowded local environment, and retaining it is more likely to intensify resource competition.
- 2.
Maturity factor
After the cluster-level priority is determined, the thinning order of specific fruits within the cluster also needs to be refined in combination with ripeness status. From the perspective of individual fruits, fruits with relatively low ripeness or obviously lagging development within the same fruit cluster are usually at a disadvantage in growth competition. Retaining such fruits not only makes it difficult to significantly improve the final commercial value but may also continue to occupy limited assimilate resources, thereby restricting the further development of surrounding dominant fruits. Therefore, preferentially removing fruits with relatively lower ripeness during fruit thinning helps concentrate nutrient supply and improve the overall ripeness uniformity and quality performance of the retained fruits. Based on the above agronomic logic, this study takes the fruit ripeness value as an important factor in fruit-level fruit-thinning priority and adopts a mapping strategy in score fusion such that lower ripeness corresponds to higher fruit-thinning priority, allowing ripeness status to directly participate in the fruit-level ranking process.
- 3.
Shape factor
Fruit morphological quality is directly related to commercial value and postharvest value. Based on the aforementioned comprehensive morphological index
, this study introduces a fruit-level shape factor to preferentially remove fruits with morphological abnormalities or irregular boundaries during fruit thinning:
where
is the comprehensive morphological index of the
-th fruit. This definition makes the fruit-thinning priority correspondingly higher for fruits with a greater degree of morphological abnormality.
- 4.
Fusion and ranking of fruit-level comprehensive priority
To unify indicators with different dimensions and distribution characteristics, robust min–max normalization is applied separately to the local spacing indicator
, maturity factor
, and shape factor
. Subsequently, the fruit-level fruit-thinning priority score
(
) is constructed through weighted linear fusion:
where
,
, and
are the normalized local spacing, ripeness, and shape-risk factors, respectively; and
,
, and
are the corresponding weights. Since a smaller local spacing value indicates greater local crowding, the term
is used in Equation (18) so that fruits located in more crowded local neighborhoods receive higher thinning-priority scores. Within the same fruit cluster, the fruits are ranked in descending order of
, thereby obtaining the fruit-level thinning order.
5.3.3. Priority-Based Fruit Removal Strategy
To transform the aforementioned cluster-level and fruit-level fruit-thinning priority models into an executable thinning sequence, this study further constructs a priority-based fruit removal strategy. Based on the two-level priority decision results obtained above, this strategy forms an executable fruit-thinning scheme for improving fruit-cluster spatial structure by specifying the selection method of target fruit clusters, the removal order of fruits within a cluster, and the stopping conditions for removal.
After completing the cluster-level priority screening, for each selected target fruit cluster, the fruit removal order is strictly restricted to within that cluster and is carried out according to the ranking results of the fruit-level fruit-thinning priority; that is, fruits ranked higher in the fruit-level thinning order within that cluster are removed first. This constraint ensures that the removal process is fully driven by the model scoring results, thereby avoiding the uncertainty caused by human intervention or random selection.
In terms of the removal mode, this study introduces an adaptive removal strategy; that is, the top
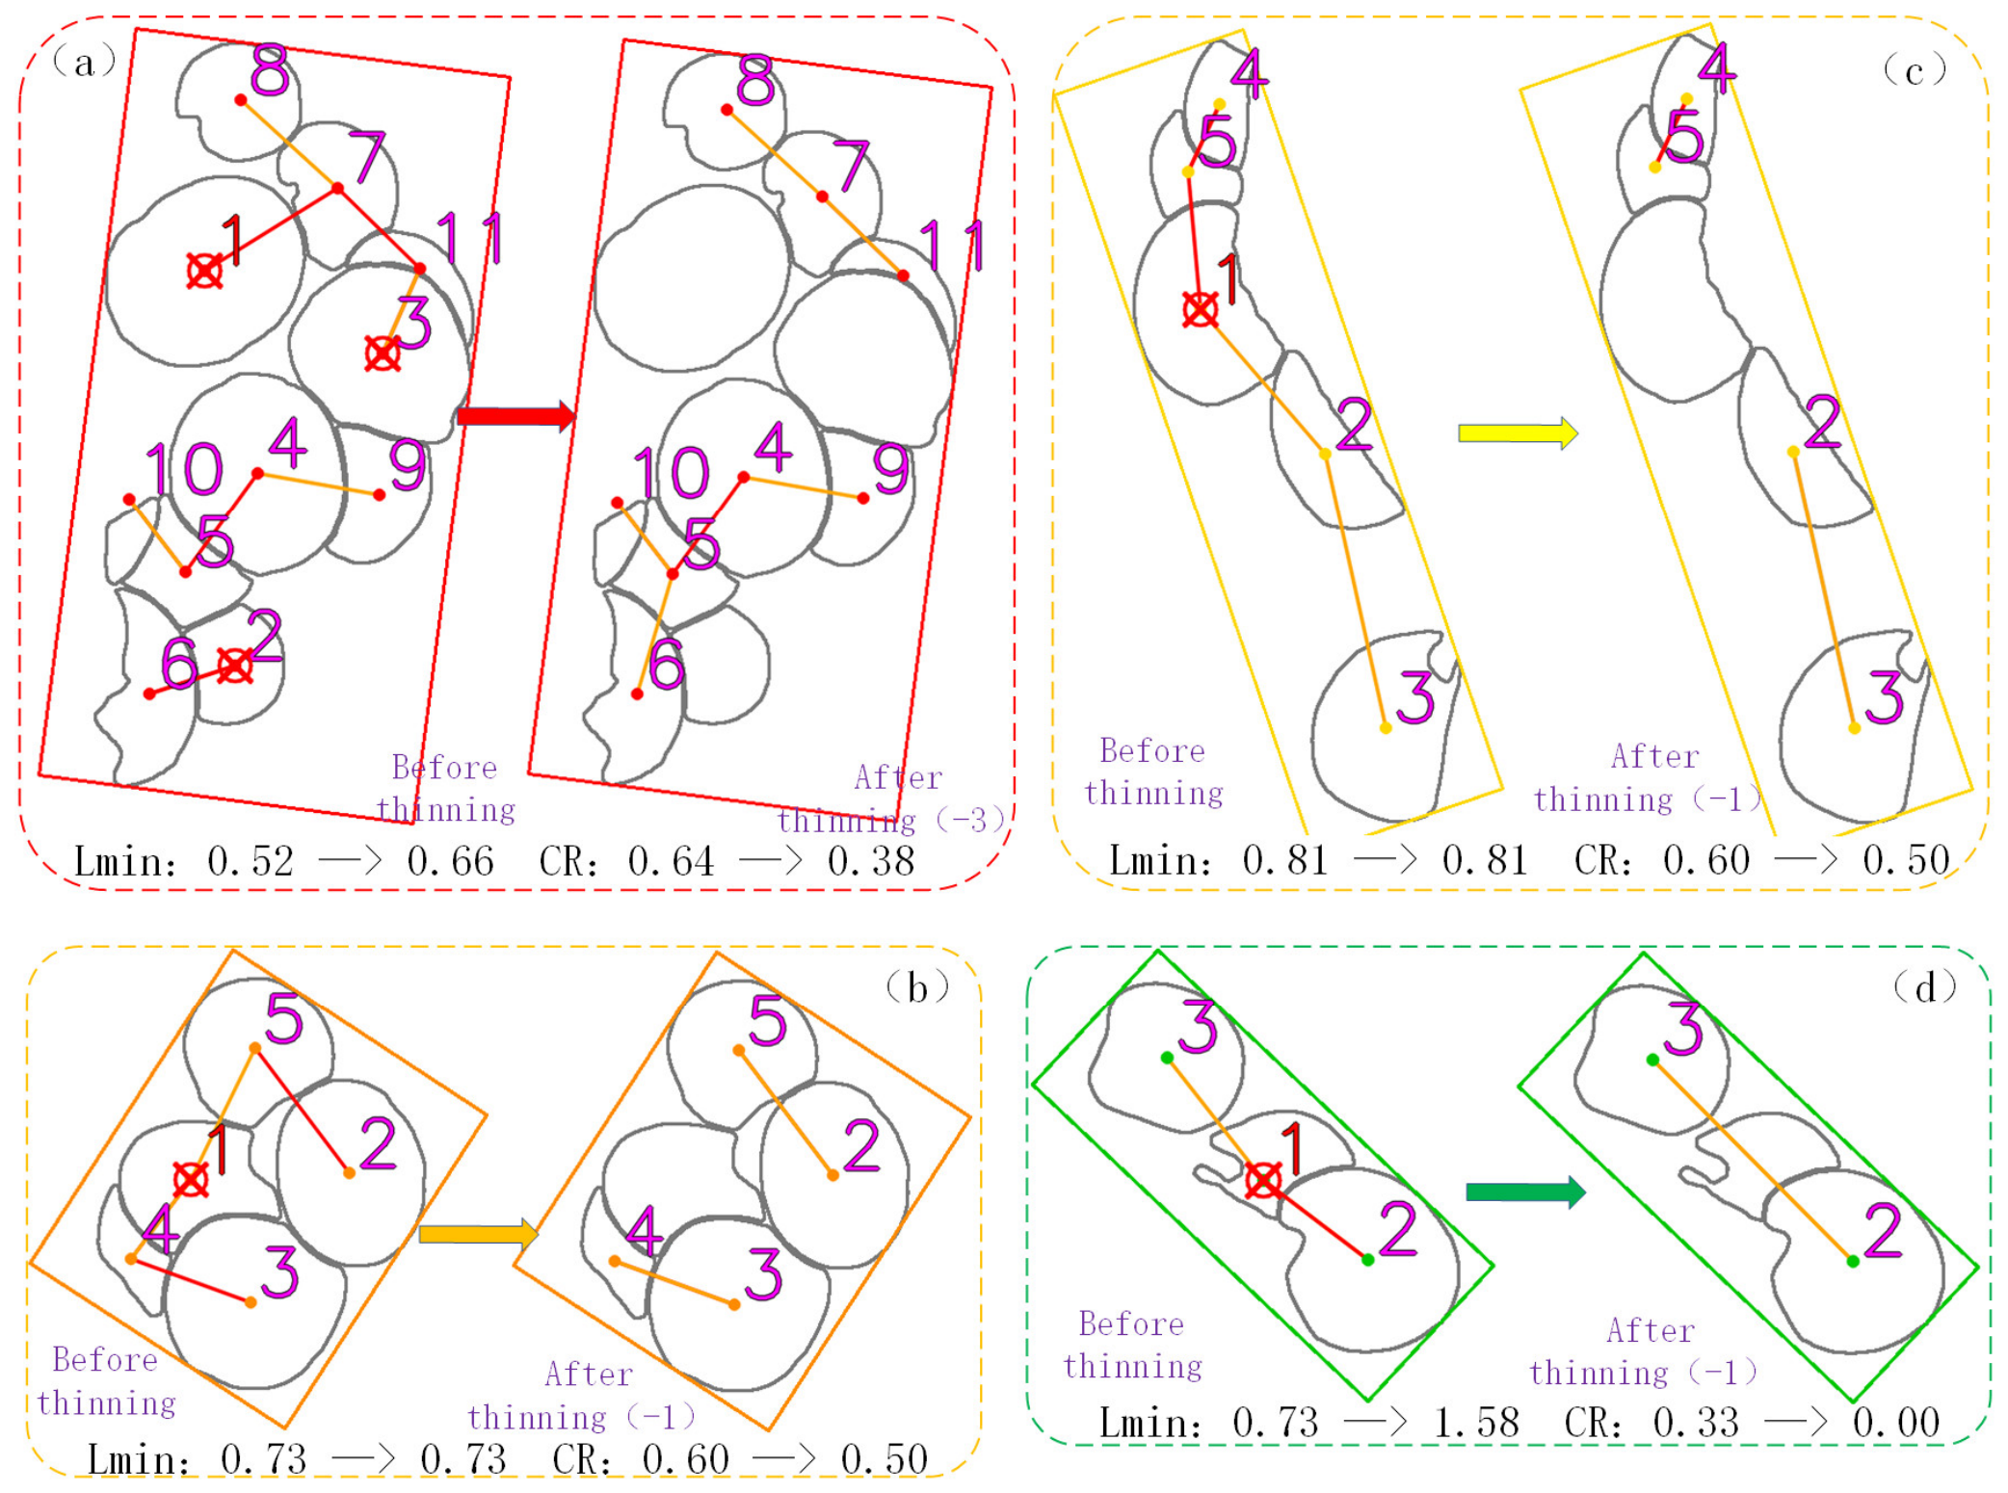
high-priority fruits are removed sequentially, and the spatial structural indicators of the fruit cluster are recalculated after each removal. When the fruit-cluster structure satisfies the preset acceptable interval conditions, further removal is stopped:
where
is the target threshold of the contact ratio, and
is the target threshold of the minimum normalized fruit spacing.
To avoid excessive fruit thinning, this strategy imposes multiple constraints on removal intensity. First, the number of removed fruits does not exceed a certain proportion of the total number of fruits within the cluster. Second, the absolute number of removed fruits does not exceed a preset upper limit. Finally, at least two fruits must remain in the cluster after thinning to ensure that the spatial structural indicators can still be calculated. Under the above constraints, if the target structural optimization requirements cannot be satisfied simultaneously, the removal scheme that achieves the greatest degree of structural improvement is selected as the final fruit-thinning result.
6. Experimental Results and Analysis
To systematically verify the effectiveness of the proposed cherry ripeness detection method, cluster modeling strategy, and fruit-thinning decision-making framework, three aspects of experiments were designed in this study. First, comparative experiments were conducted to evaluate the performance of the cherry ripeness detection model (see
Section 6.1,
Section 6.2,
Section 6.3 and
Section 6.4 for details). Second, the performance of the improved clustering strategy was verified under different fruit density and branch structure conditions by analyzing the clustering effects of fruit clusters (see
Section 6.5 for details). Finally, fruit-thinning decision validation experiments were carried out to examine the decision value of the proposed fruit-thinning strategy in alleviating spatial competition and reducing ripeness risk (see
Section 6.6 for details).
6.1. Experimental Environment and Evaluation Metrics
The experiments were conducted using Linux as the operating system and PyTorch 2.2.2 GPU version as the deep learning framework. Python 3.10 and CUDA 12.1 were used. The graphics card model was NVIDIA GeForce RTX 4090D (NVIDIA Corporation, Santa Clara, CA, USA) with 24 GB of memory. The detailed hyperparameters of the experiments are shown in
Table 2.
In addition, to compare the performance of different models, this study adopts the official COCO evaluation metrics, including AP(50), AP(50–95), and AR(50–95) as the main precision and recall performance indicators. At the same time, GFLOPs, GMACs, and Params are reported to measure computational complexity and model size, and FPS (Frames per Second) is used as the inference speed indicator to comprehensively evaluate model performance in terms of accuracy, efficiency, and deployment adaptability.
AP is defined as the integral of the precision–recall curve (PR curve) under different IoU thresholds:
where
denotes the precision at a given recall rate R, TP (True Positive) denotes the number of targets correctly detected by the model, and FP (False Positive) denotes the number of targets incorrectly detected by the model. Specifically, AP(50) refers to the average precision at the IoU = 0.5 threshold, while AP(50–95) denotes the average precision over IoU thresholds from 0.5 to 0.95.
- 2.
Average Recall (AR):
AR measures the average recall capability of the model under different upper limits of detected objects:
where
is the recall under a given detection upper limit n, FN (False Negative) denotes the number of targets missed by the model, and N is the total number of different detection upper limits.
6.2. Ablation Experiments on the Ripeness Detection Model
To verify the contribution of each key improvement module to the overall model performance and further analyze the necessity of its internal components, the original DEIM model was adopted as the baseline for ablation experiments. The proposed improvements include the DilatedReparamConv module (U), the CS-Transformer encoder (V), and the MSFE multi-path feature enhancement module (W). Specifically, the CS-Transformer encoder consists of DyT (V1) and CGLU (V2), while the MSFE module consists of the SSFusion Block (W1), Mona (W2), and SEFN (W3). Therefore, the ablation experiments were designed at two levels. At the main-module level, U, V, and W were introduced in a stepwise additive manner to evaluate their overall contributions to model performance. At the component level, V1 and V2 were introduced separately to analyze the independent roles of DyT and CGLU in CS-Transformer. Meanwhile, W1, W2, and W3 were further evaluated through combined ablation experiments to examine the contribution of each internal component of MSFE and whether redundancy exists among them. To reduce the influence of training randomness and evaluate the stability of the performance gains, all model configurations in
Table 3 and
Table 4 were trained three times using different random seeds, and the AP(50), AP(50–95), and AR(50–95) results are reported as the mean ± standard deviation. The ablation results are shown in
Table 3.
As can be seen from
Table 3, all three improvements bring stable gains to detection performance, and the improvements show a clear progressive trend. When only DilatedReparamConv is introduced, AP(50) increases from 89.0% to 89.6% and AP(50–95) increases from 76.0% to 76.3%, while AR(50–95) remains unchanged at 87.7%. This phenomenon indicates that the main gain of DilatedReparamConv is more inclined toward enhancing the representation of boundaries and local color transitions, and its direct contribution to overall recall is relatively limited, but it can provide cleaner low-level representations for subsequent modules. In terms of complexity, after adding DilatedReparamConv, the number of parameters increases only slightly from 3.73M to 3.75M, while GFLOPs and GMACs decrease slightly instead, indicating that this structure is computationally friendly to a certain extent at the implementation level.
Next, after adding the CS-Transformer, AP(50) further increases to 90.4%, AP(50–95) increases to 77.6%, and AR(50–95) increases to 88.7%. It can be noted that the gains brought by CS-Transformer are more obvious for AP(50–95) and AR(50–95), which usually means that the model achieves more stable localization under stricter IoU thresholds and has a stronger ability to detect difficult samples and dense targets. This can be explained in combination with the module mechanism: DyT alleviates feature magnitude drift caused by illumination abnormalities, making ripeness-related color distributions more stable; CGLU introduces local spatial gating, enabling the model to preserve more effective structural cues in densely adhesive and weak-boundary regions, thereby improving both localization quality and recall performance. In terms of complexity, after adding the CS-Transformer, GFLOPs, GMACs, and the number of parameters remain basically unchanged, indicating that this modification brings significant benefits under controllable cost. FPS increases from 95.42 to 107.08, which is higher than the baseline value of 103.42, and the model as a whole still maintains high-frame-rate inference capability.
Finally, after further adding MSFE, the performance reaches the optimum. AP(50) increases to 92.1%, AP(50–95) increases to 80.9%, and AR(50–95) increases to 90.8%. It can be seen that the improvement brought by MSFE is particularly prominent for AP(50–95), indicating that multi-path feature fusion contributes significantly to accurate localization and instance discrimination under medium-to-high IoU thresholds. This is highly consistent with the difficulties in dense cherry fruit-cluster scenes, where adjacent fruit boundaries are weakened, local textures are similar, and adhesion easily occurs: cross-scale spatial–semantic complementarity can better distinguish adjacent targets and enhance the response of key regions.
Compared with the baseline, the improved overall model achieves increases of 3.1% in AP(50), 4.9% in AP(50–95), and 3.1% in AR(50–95), while the number of parameters remains below 5M, indicating that this scheme still maintains a lightweight level while significantly improving accuracy.
In addition, the component-level ablation results further indicate that the internal components of CS-Transformer and MSFE are not simply redundant, but complementary. For CS-Transformer, V1 and V2 exhibit different performance tendencies when introduced separately. After introducing V1, AP(50) increases from 89.6% to 90.1%, indicating that DyT mainly contributes to stabilizing color- and illumination-related feature responses. In contrast, after introducing V2, AP(50–95) and AR(50–95) increase to 77.2% and 88.3%, respectively, suggesting that CGLU is more beneficial for enhancing local spatial structural representation and high-quality localization. When V1 and V2 are jointly introduced, the model achieves AP(50), AP(50–95), and AR(50–95) values of 90.4%, 77.6%, and 88.7%, respectively, outperforming the use of either V1 or V2 alone and demonstrating their complementary roles in CS-Transformer. Similarly, within MSFE, W1 increases AP(50–95) from 77.6% to 78.4%, verifying the effectiveness of cross-scale feature fusion. On the basis of W1, further introducing W2 increases AP(50–95) to 80.1%, while introducing W3 increases AP(50–95) to 79.6%, indicating that Mona and SEFN provide additional gains through local structural enhancement and feature recalibration, respectively. The complete MSFE module achieves the best results across all three accuracy metrics and outperforms the two partial combinations of W1 + W2 and W1 + W3. These results demonstrate that the submodules perform different but complementary functions, and the added complexity is not redundant stacking but effectively improves localization accuracy, recall capability, and instance discrimination in dense cherry fruit-cluster scenes.
6.3. Comparative Experiments on Cherry Ripeness Detection
To verify the effectiveness and overall performance of the proposed method in the task of cherry ripeness detection, this study compares the final model with several representative detectors, including the two-stage detector Faster R-CNN [
45], the classical single-stage detector SSD300 [
46], the lightweight YOLO series (YOLOv12n [
47] and YOLOv13n [
48]), the end-to-end DETR series (RT-DETR [
49] and RT-DETR v2 [
50]), and the lightweight DETR model D-FINE [
51].
To ensure a fair comparison, all detectors were trained and evaluated on the same dataset split described in
Section 2.2, with the training, validation, and test sets kept identical for all models. No test-set images were used during model training or hyperparameter selection. The same input image size, class definitions, annotation files, and evaluation metrics were used across all compared detectors. For each model, the official or commonly used training configuration was adopted as the initial setting, and the key training parameters, such as training epochs, batch size, optimizer, learning rate, and data augmentation strategy, were kept as consistent as possible under the constraints of each model framework. To reduce the influence of training randomness and evaluate the stability of the comparative results, all models in
Table 4 were trained three times using different random seeds, and the AP(50), AP(50–95), and AR(50–95) results are reported as the mean ± standard deviation. The comparison results are shown in
Table 4.
According to the experimental results in
Table 4, the proposed model achieves the best overall detection performance among the compared detectors in the cherry ripeness detection task. In terms of detection accuracy, the proposed method obtains 92.1% AP(50), 80.9% AP(50–95), and 90.8% AR(50–95), which are the highest values among all compared models. Compared with SSD300 and Faster R-CNN, the proposed method improves AP(50–95) by 6.6 and 5.8 percentage points, respectively, indicating better localization accuracy under stricter IoU thresholds. Compared with the lightweight YOLOv12n and YOLOv13n, although YOLOv12n has a higher inference speed and both YOLO models have fewer parameters, the proposed model achieves higher AP(50), AP(50–95), and AR(50–95), reflecting stronger detection accuracy and recall capability in dense cherry fruit-cluster scenes.
In terms of model size and computational cost, the proposed model has 4.93 M parameters and 8.44 G GFLOPs, which are substantially lower than those of Faster R-CNN, RT-DETR, and RT-DETR v2. Compared with RT-DETR v2, the proposed method improves AP(50), AP(50–95), and AR(50–95) by 1.2, 2.2, and 2.1 percentage points, respectively, while reducing the number of parameters from 19.88 M to 4.93 M and GFLOPs from 59.86 G to 8.44 G. This indicates that the proposed model achieves higher detection accuracy with a much lower computational cost. Compared with D-FINE, which has a similar lightweight design, the proposed method improves AP(50–95) and AR(50–95) by 5.8 and 3.4 percentage points, respectively, further demonstrating its stronger localization and recall capability in dense greenhouse cherry scenes.
Overall, the proposed model achieves the highest AP(50), AP(50–95), and AR(50–95) among the compared detectors while maintaining a moderate model size, relatively low computational cost, and practical inference speed. These results demonstrate that the proposed model achieves a favorable balance among detection accuracy, recall capability, computational complexity, and deployment efficiency, showing its application potential for cherry ripeness detection in dense fruit-cluster scenes.
6.4. Visual Evaluation of Cherry Ripeness Detection
6.4.1. Visual Comparative Analysis in Complex Natural Scenes
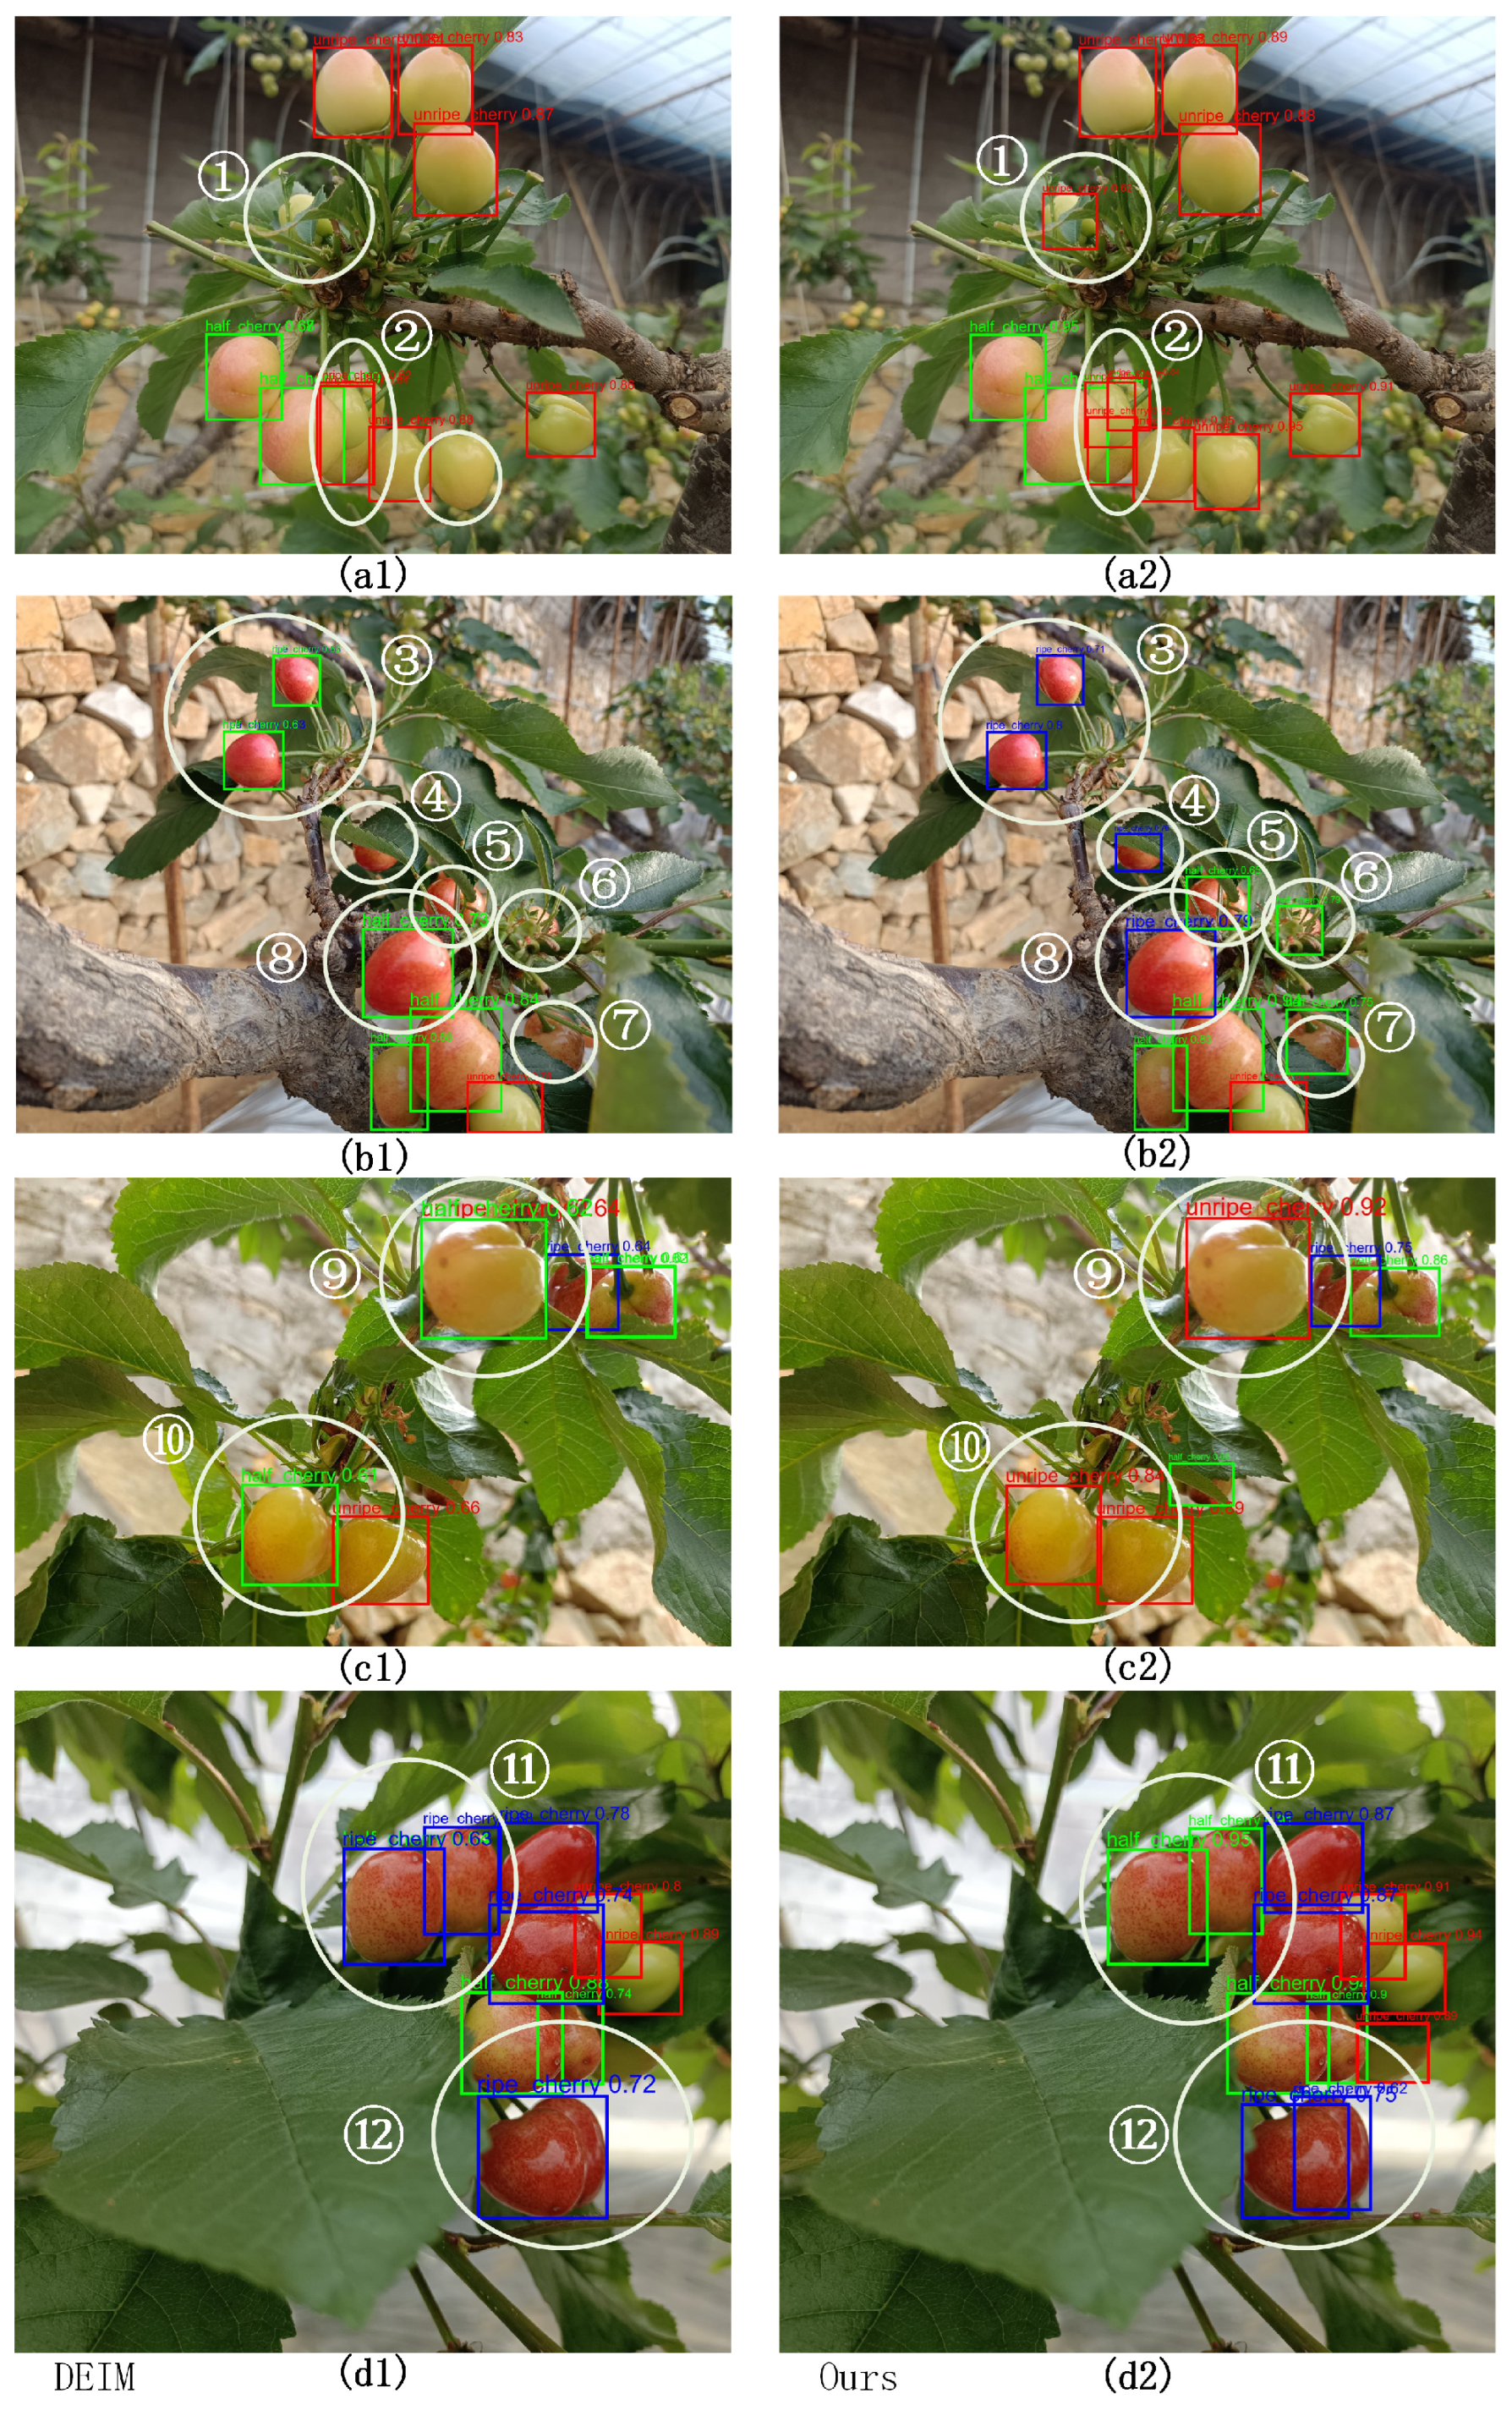
To further verify the applicability and robustness of the proposed method in complex natural scenes, this study selects multiple groups of representative greenhouse cherry images for visual comparison, as shown in
Figure 12. In the figure, blue detection boxes indicate detected ripe cherries, green detection boxes indicate detected half-ripe cherries, and red detection boxes indicate detected unripe cherries. The left column, a1–d1, shows the detection results of the baseline model DEIM, while the right column, a2–d2, shows the detection results of the proposed method. In the left column a1–d1, regions where the baseline model exhibits problems such as missed detection, adhesive merging, strong reflection interference, or category confusion are marked with white circles, and the detection results of the proposed method at the corresponding positions are presented in the right column a2–d2 for comparison.
From the comparisons between
Figure 12(a1,a2) and between
Figure 12(b1,b2), it can be seen that when branch overlap, leaf occlusion, or fruit-cluster overlap is severe, the baseline model is more likely to exhibit missed detections, false detections, low confidence, or unstable box localization in the numbered regions ① and ④–⑦. In contrast, the proposed method can recover the detection boxes at the same positions and maintain more stable confidence outputs, indicating stronger robustness to weak boundaries and incomplete textures. This advantage comes partly from the expanded effective receptive field of DilatedReparamConv, which enhances contextual aggregation under occlusion conditions, and partly from the suppression of background interference such as leaf veins and branch textures by the feature selection mechanism, making the model more inclined to preserve fruit-related responses.
Furthermore, from region ② in
Figure 12(a1,a2), as well as region ⑫ in
Figure 12(d1,d2), it can be seen that in fruit regions with similar colors and close adhesion, the baseline model is more likely to produce adhesive bounding boxes, where multiple fruits are merged into a single box or the box position is shifted. This phenomenon is particularly more obvious in red–yellow transition regions and local highlight regions, where the weakening of boundary cues leads to more severe merging. By contrast, the proposed method can effectively separate adjacent fruits from adhesive boxes and generate multiple independent detection boxes that better fit the true contours, demonstrating higher sensitivity to subtle chromatic differences and true boundaries. This is mainly because the CS-Transformer preserves fine-grained color transitions and weak-boundary gradients through color stabilization and spatial gating enhancement, while the multi-path feature fusion of MSFE strengthens the complementarity between multi-scale details and semantic consistency, thereby improving instance discrimination capability in dense scenes.
Finally, from regions ③ and ⑧ in
Figure 12(b1,b2), regions ⑨ and ⑩ in
Figure 12(c1,c2), and region ⑪ in
Figure 12(d1,d2), it can be seen that the baseline model is more prone to false detections in areas such as leaf highlights, branch textures, or bright background spots and is also accompanied by a certain degree of category confusion, resulting in unstable predictions for boundary samples between ripe and half-ripe fruits. In these regions, the proposed method significantly reduces false detections and provides more consistent category predictions and higher confidence for the discrimination between half-ripe and ripe fruits within the same cluster, indicating that the model can make fuller use of ripeness-related color phenotypic information and reduce category drift caused by illumination disturbances.
From the above visual analysis, it can be seen that the proposed method is superior to the baseline model in occlusion recovery, instance separation, and false detection suppression under complex natural scenes, thereby significantly improving the stability and reliability of cherry detection and ripeness recognition.
6.4.2. Grad-CAM Visualization Evaluation
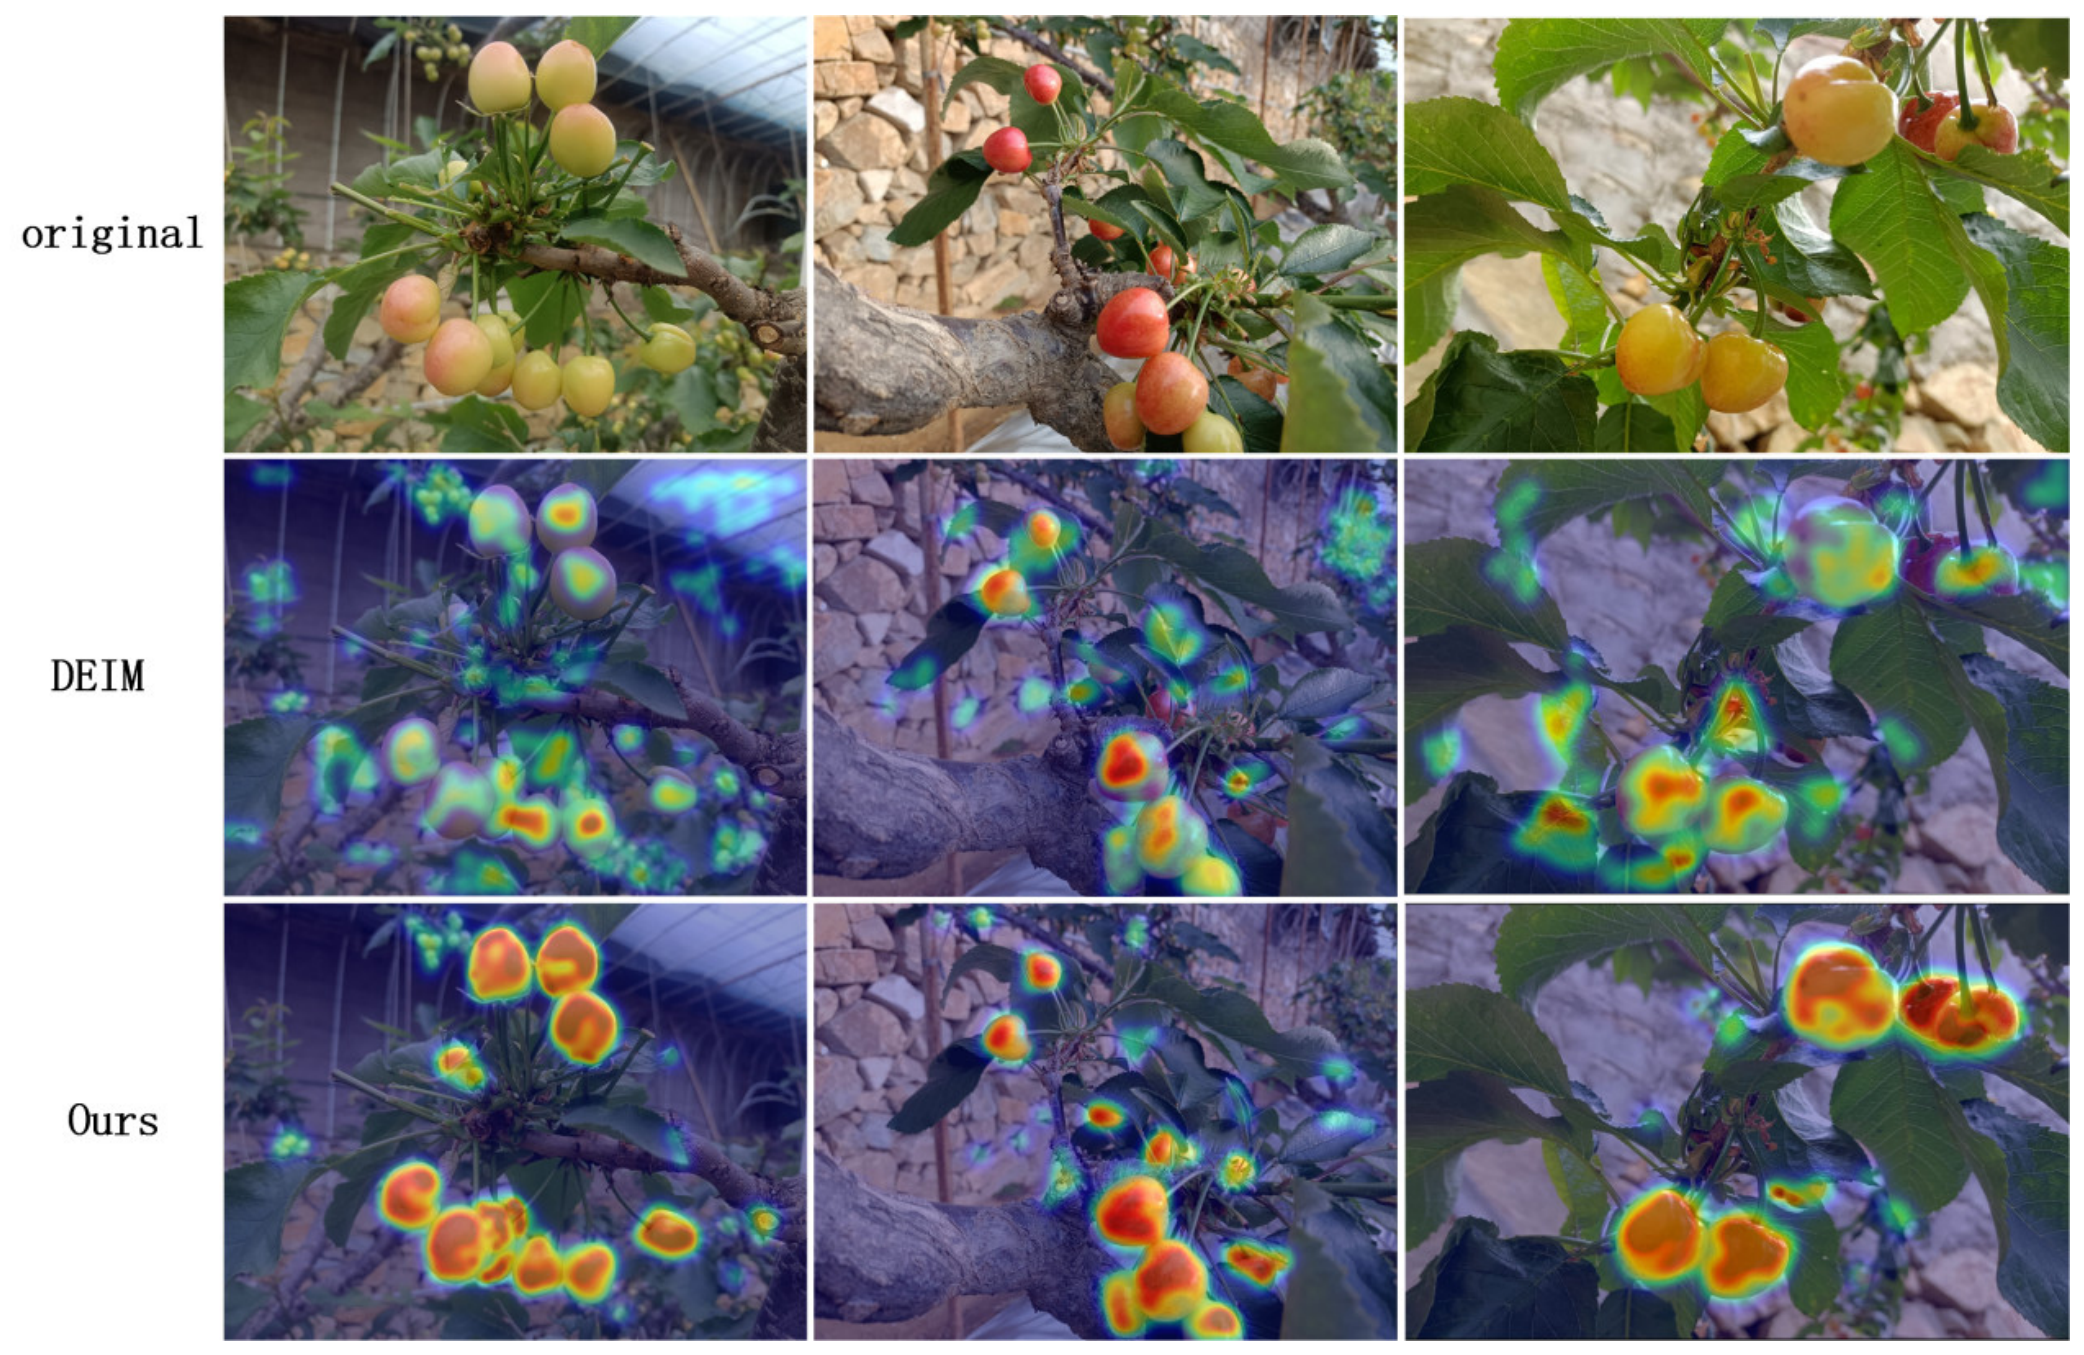
To further reveal the discriminative basis and representational differences in the improved model in natural cultivation environments, this study uses the gradient-weighted class activation mapping (Grad-CAM) method to visualize and analyze the detection processes of the baseline DEIM and the proposed model. The results are shown in
Figure 13. In the figure, warm-colored regions indicate key response locations with higher contributions to category discrimination, while cool-colored regions indicate lower contributions. For ease of comparison, each column in
Figure 13 presents, from top to bottom, the original image, the heatmap result of the baseline DEIM model, and the heatmap result of the improved model proposed in this study.
From the Grad-CAM visualization results shown in
Figure 13, it can be seen that the attention responses of DEIM are relatively scattered and exhibit background bias. Its high-response regions not only cover the fruits but are also distributed over branch textures, leaf-edge highlights, and background reflective spots, making it susceptible to interference from weakly related textures or abrupt brightness changes, which leads to false detections and ripeness confusion. In contrast, the high responses of the proposed method are more concentrated on the fruit surface and key contours, while the background responses are significantly weakened, showing a fruit-centered attention pattern. In the examples in the left and middle columns, the fruit clusters are partially occluded by branches and leaves. The responses of DEIM are distributed in scattered patches, whereas the improved model can still form continuous high-response regions near the occluded fruits, indicating effective use of contextual information. When fruits are closely adjacent, as shown in the middle and right columns, DEIM is prone to mixed attention, while the proposed method can form independent high-response clusters that are closer to the true fruit surface, showing stronger boundary discrimination capability. In the examples in the right column involving color transitions and highlight boundaries, the responses of the improved model are smoother and more continuous and more closely aligned with the fruit contours, which helps reduce ripeness drift caused by illumination disturbances. The Grad-CAM visualization verifies the stable focusing and discriminative advantages of the improved model under conditions of occlusion, reflection, and adhesion.
6.5. Visual Comparison Experiments and Analysis of Fruit-Cluster Density Under the Improved Clustering Strategy
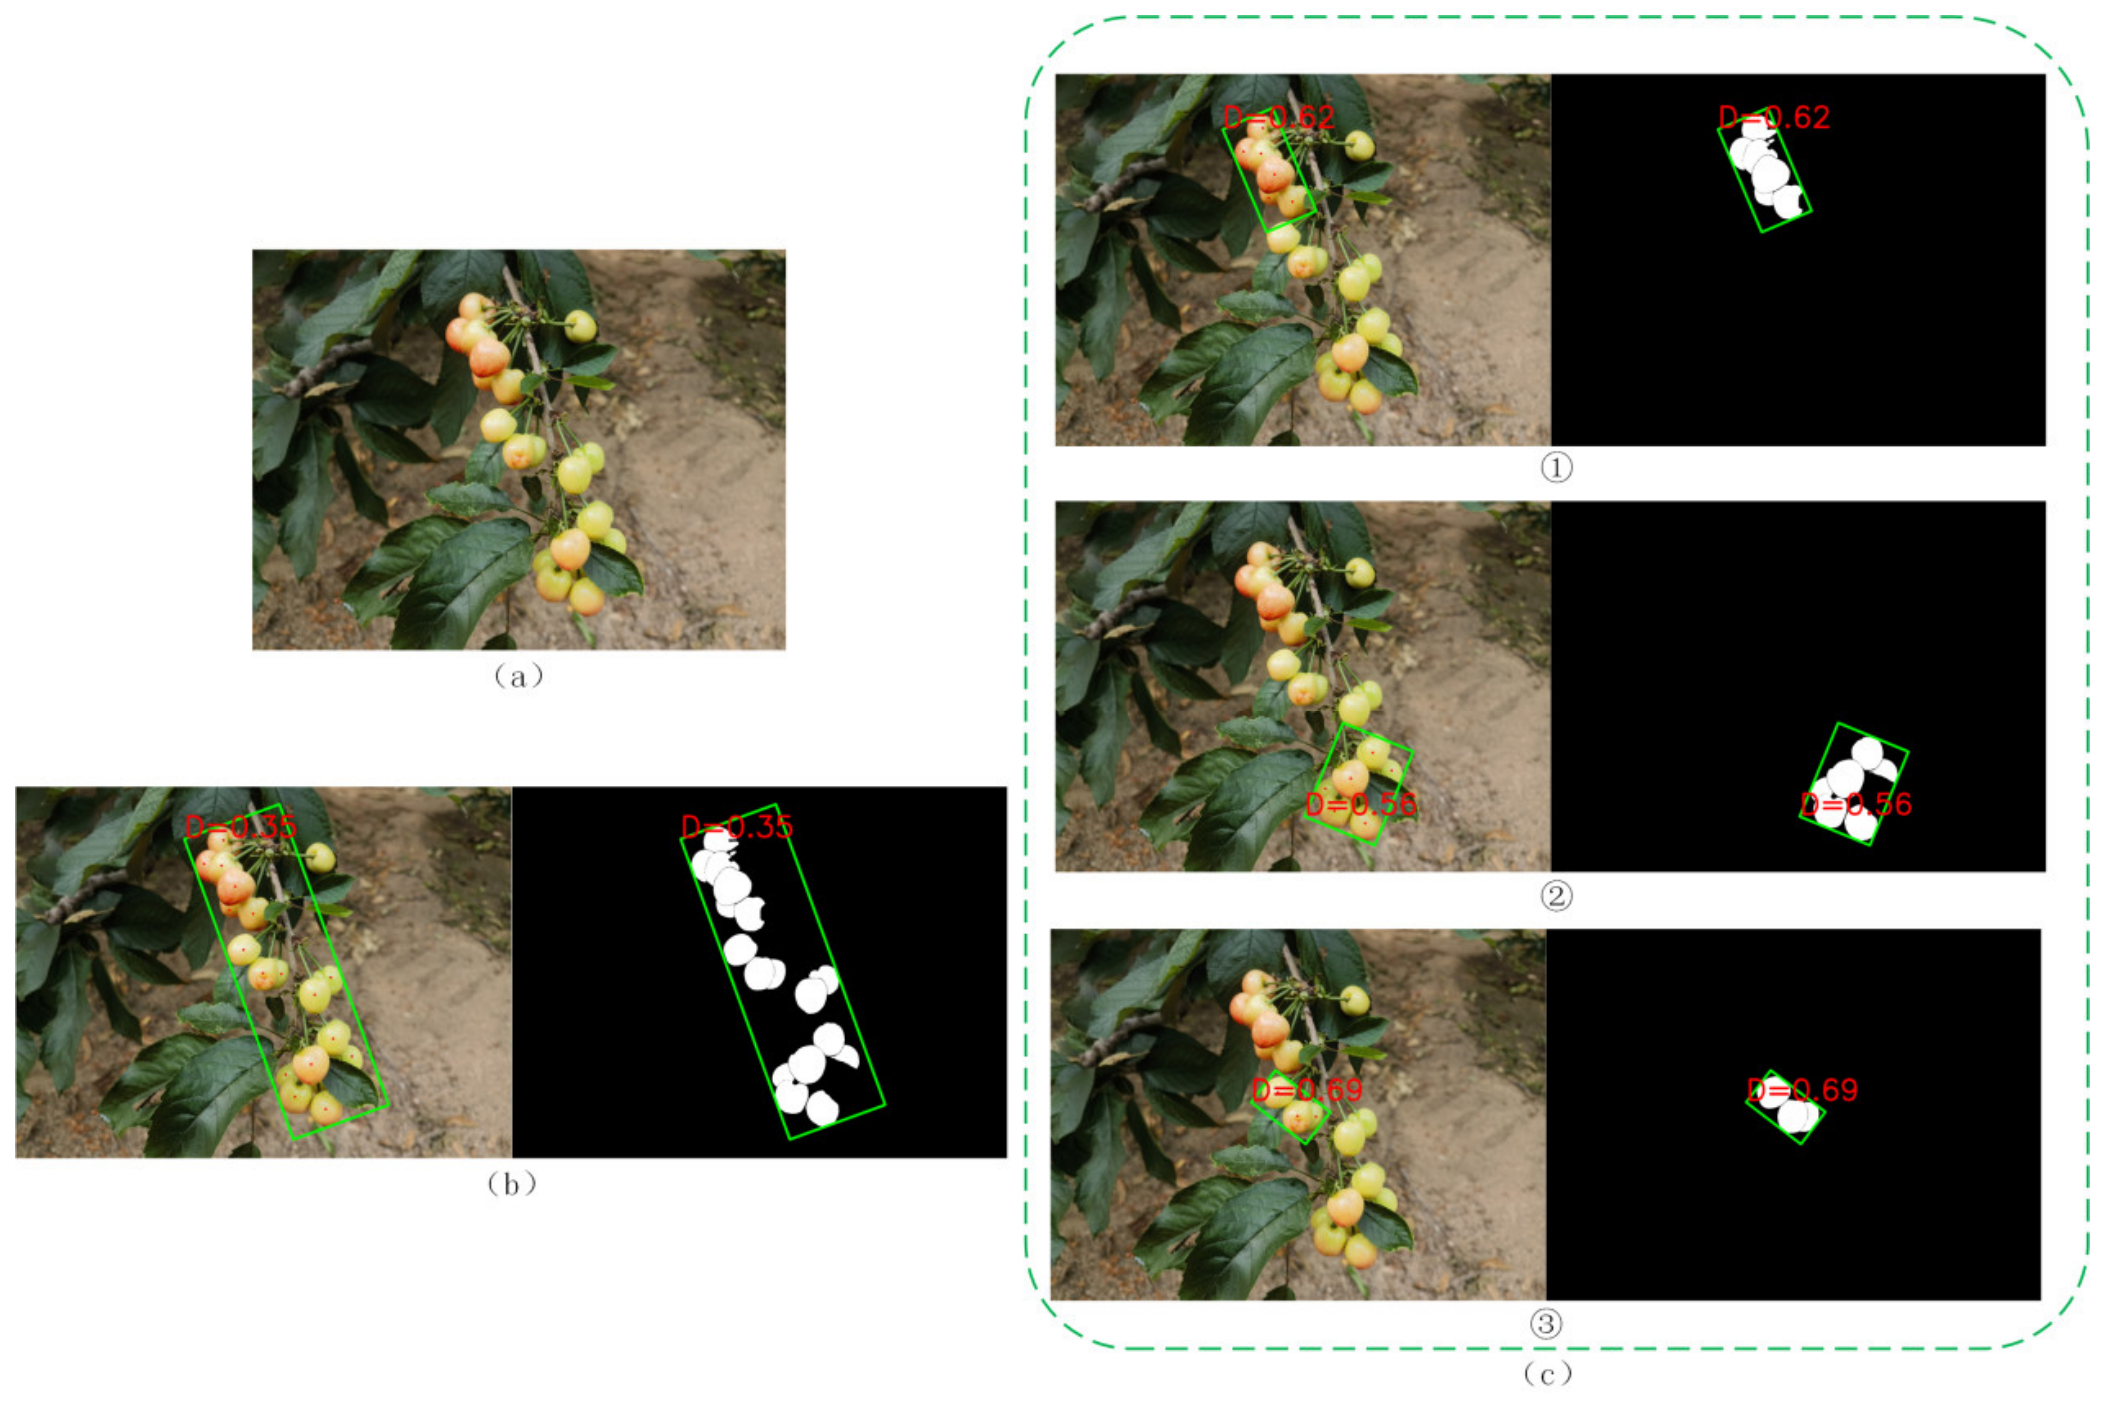
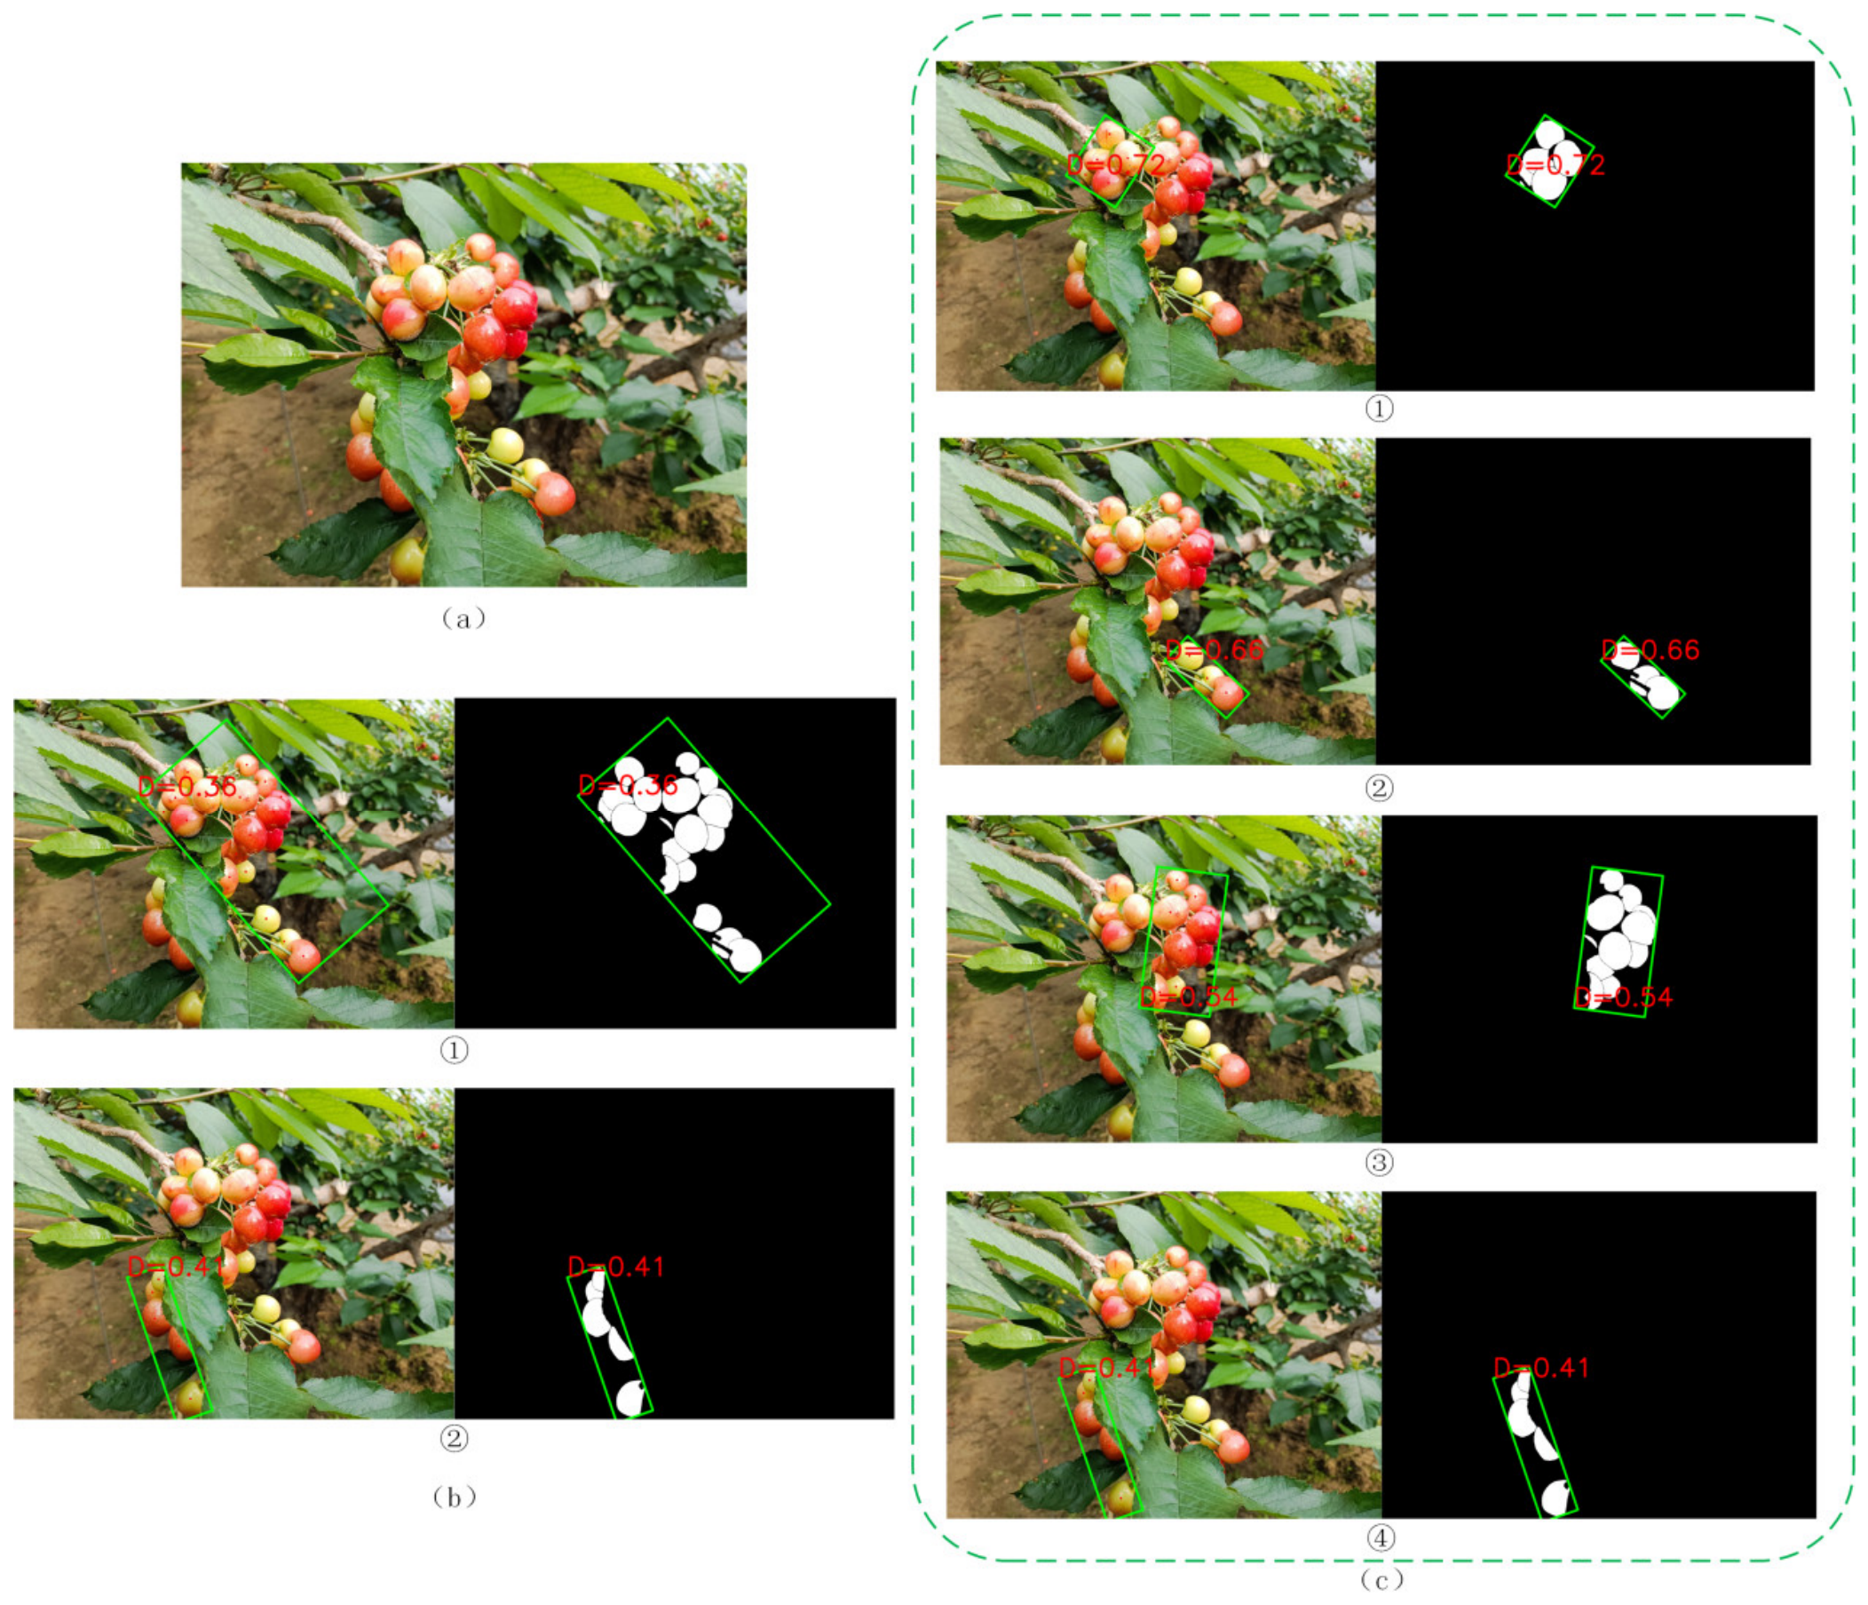
To further verify the effectiveness of the proposed dynamic EPS adaptive clustering and intra-cluster re-clustering strategy under different spatial distribution patterns, visual comparison experiments were conducted in three typical scenarios, namely, coexisting multiple clusters, fruit-bearing branches with connected fruits, and occlusion-compounded clusters.
6.5.1. Comparison of Clustering Boundaries and Density Estimation in the Coexisting Multiple-Cluster Scenario
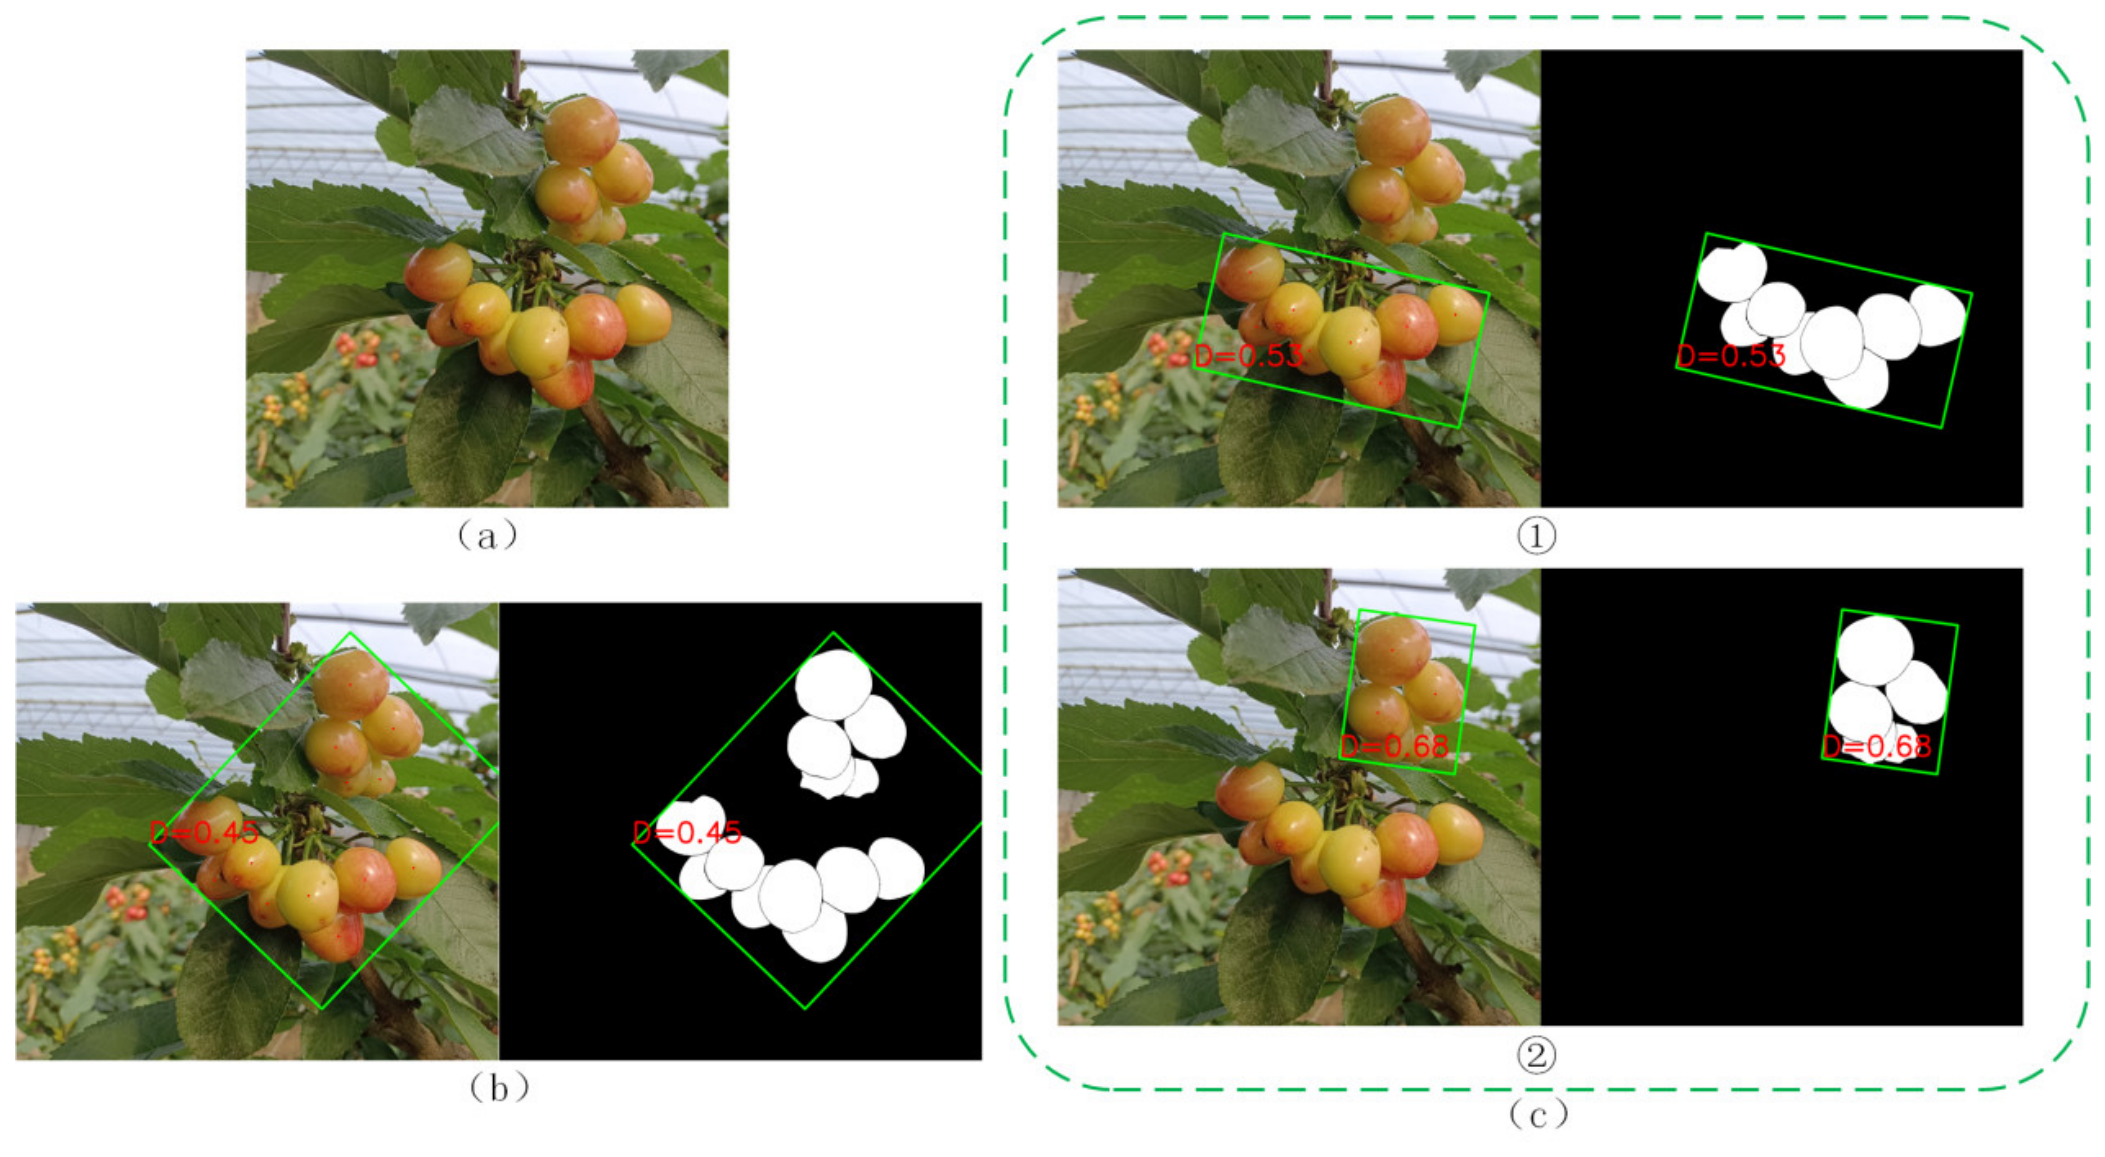
In the coexisting multiple-cluster scenario, fruits often exhibit a spatial distribution characterized by local compactness and inter-cluster separation. As shown in
Figure 14a, there are two relatively independent fruit groups located above and below on the same branch. The upper fruit group contains fewer fruits, and there is an obvious gap between it and the main fruit group below.
Figure 14b shows the clustering result obtained by the traditional fixed-radius clustering method. In the figure, the green rotated rectangle represents the minimum bounding rectangle of the cluster, and the red number denotes the fruit-cluster density indicator D. The black-background image on the right shows the binary mask of the corresponding cluster and its bounding rectangle, where the white region is the mask formed by the union of fruit instances within the cluster. As shown in
Figure 14b, if the traditional fixed-radius clustering method is adopted, the algorithm tends to mistakenly merge the two fruit groups into a single cluster, causing the minimum bounding rotated rectangle to cover both the upper and lower fruit groups simultaneously. Since the rectangle contains a large amount of non-fruit blank area, the cluster density D, i.e., the ratio of the cluster mask area to the bounding rectangle area, is significantly reduced to only 0.46, resulting in problems such as overly wide boundaries and underestimation of both the number of fruit clusters and fruit-cluster density.
In contrast, the proposed dynamic EPS adaptive clustering generates candidate radii by using the median distance between fruit centers as the scale reference and selects a more appropriate clustering scale by combining a comprehensive score of average compactness, the number of clusters, and the penalty for excessively large clustering radii, thereby avoiding the erroneous forced connection of fruit groups with relatively large inter-cluster distances, as shown in
Figure 14c. The improved method correctly separates the originally mismerged structure into two independent fruit clusters. In
Figure 14c, label ① corresponds to the main fruit group below, and label ② corresponds to the small fruit group above. The bounding rectangles of both clusters fit the fruit-group morphology more closely, and the blank regions inside the rectangles are significantly reduced so that the density indicator D increases to 0.53 and 0.68, respectively. Compared with the fixed-radius clustering result shown in
Figure 14b, these values better reflect the true density of the fruit clusters. It can thus be seen that the dynamic EPS strategy can improve the rationality of cluster partitioning in typical scenarios involving coexisting multiple clusters with inter-cluster separation, thereby enabling fruit-cluster density estimation to better conform to the true spatial structure.
6.5.2. Comparison of Clustering Boundaries and Density Estimation in the Long Fruit-Bearing Branch Scenario
In the fruit-bearing branch scenario where fruits are continuously distributed along the branch, the fruits extend in a chain-like manner along the branch direction, and the true separation between clusters is often linked by the branch structure itself. As shown in
Figure 15a, the fruits are continuously distributed from top to bottom along the branch. In this case, if the traditional fixed-radius clustering method is used, the algorithm will assign all fruits on the entire branch to the same cluster, forming a single elongated cluster. As shown in
Figure 15b, the original clustering result generates a rotated bounding rectangle covering the whole branch segment, and the rectangle contains a large amount of non-fruit blank area. In the black-background mask on the right, the white fruit regions are distributed in a strip-like pattern, causing the cluster density D, i.e., the ratio of the cluster mask area to the bounding rectangle area, to be significantly diluted to only 0.35, which is a typical problem characterized by overly wide boundaries, elongated cluster shape, and underestimated density.
To address the density underestimation bias caused by elongated clusters, the improved algorithm proposed in this study introduces a cluster morphology constraint after the initial clustering. Specifically, the aspect ratio of the minimum rotated bounding rectangle of the cluster is calculated. When it exceeds a threshold, indicating that the cluster shape is overly elongated, intra-cluster re-clustering is automatically triggered. In this process, EPS is reduced proportionally, and clustering is performed again within the cluster so that the long branch structure is split into several local sub-clusters and the local segmented structure along the branch is recovered at a smaller neighborhood scale. The experimental results are shown in
Figure 15c, where it can be clearly seen that the improved strategy further splits the original single elongated cluster into three local sub-clusters, labeled ①–③. By comparing the black-background mask images on the right, it can be seen that the bounding rectangles of each sub-cluster fit the local fruit groups more closely, and the blank regions inside the rectangles are significantly reduced. As a result, the density indicator D of the sub-clusters correspondingly increases to 0.62, 0.56, and 0.69, respectively, which better reflects the local compactness of different fruit groups in the connected fruit-bearing branch structure than the value of 0.35 obtained by the fixed-radius clustering result shown in
Figure 15b. This demonstrates that the intra-cluster re-clustering mechanism can effectively avoid mismerging and density underestimation under long branch structures and improve the structural consistency of clustering boundaries and the reliability of density estimation.
6.5.3. Comparison of Clustering Boundaries and Density Estimation in Complex Occlusion Scenes
In complex occlusion environments, branch–leaf coverage, partial fruit occlusion, and missed detections cause fruit centers within the same image to present a mixed distribution of locally high density and locally low density, making it difficult for fixed-radius clustering to achieve a compatible scale across regions with different densities. As shown in
Figure 16a, the fruits in the upper part of the cluster are relatively dense, while the fruits in the lower part extend in a band-like pattern along the branch, with some regions partially occluded by leaves. When fixed-radius clustering is used, as shown in
Figure 16b(①), the algorithm is more likely to mistakenly merge the upper and lower fruit groups, which have clearly different spatial structures, into a single composite elongated cluster. Its rotated bounding rectangle is forced to cover both the upper compact group and the lower string-like structure, and the rectangle contains a large amount of non-fruit blank area. The mask on the right also shows a morphology in which the compact group and the thin strip are forcibly joined together, thereby causing the cluster density indicator D to be significantly diluted to only 0.36.
To address the problems of mismerging composite clusters and underestimating elongated clusters under occlusion conditions, the proposed method adaptively adjusts the clustering scale through the joint effect of multi-radius scoring and cluster shape constraints. On the one hand, the scoring mechanism over multiple candidate EPS values avoids using an excessively large radius to bridge inter-cluster gaps; on the other hand, further splitting is triggered for clusters with elongated morphology or composite structure, thereby recovering cluster-level structures that better conform to the growth morphology along branches. The experimental results are shown in
Figure 16c, labels ①–④. The improved method separates the originally mismerged composite cluster into multiple independent sub-clusters, among which ① and ③ correspond to the more compact fruit-group structures in the upper part, and ② corresponds to the elongated fruit group extending along the lower branch. By comparing the black-background mask images on the right, it can be seen that the coverage of the bounding rectangles of each sub-cluster fits the true fruit distribution more closely, cross-region connections are effectively suppressed, and the cluster boundaries are more complete with higher internal consistency. As a result, the density indicator can separately reflect the compactness of different local structures, and the D values of ①, ②, and ③ are 0.72, 0.66, and 0.54, respectively, which are significantly higher than the value of 0.36 for the original mismerged cluster. Therefore, this method can still maintain good clustering continuity and boundary rationality under occlusion and illumination disturbance conditions, providing more reliable structural input for subsequent fruit-cluster density phenotyping and fruit-thinning decision modeling.
6.6. Fruit-Thinning Decision Experiments
6.6.1. Visualization of the Priority-Based Fruit-Thinning Strategy
To visually present the two-level decision-making mechanism of cluster-level priority and intra-cluster ranking during fruit thinning, this study provides a visualization of the fruit-cluster screening results and the fruit removal order within each cluster in the same image before fruit thinning begins, as shown in
Figure 17. Specifically,
Figure 17a shows the original cherry image, and
Figure 17b presents, before fruit thinning starts, the priority ranking results of different fruit clusters within the same image and the fruit-thinning order of fruits within each cluster. Rotated bounding rectangles in different colors represent different fruit clusters and their boundary ranges, and the numerical labels within each fruit cluster indicate the fruit-thinning order of fruits in that cluster, where a smaller number indicates a higher removal priority. In
Figure 17b, two sets of labels are used to express the two-level decision of cluster-level priority and intra-cluster ranking: the uppercase letter in the center of each rotated rectangle indicates the fruit-thinning priority order of the fruit cluster (cluster-level ranking, where a smaller value indicates higher intervention priority for that cluster), while the numbers inside the rectangle indicate the fruit-thinning priority order of fruits within the cluster (fruit-level ranking, where a smaller value indicates higher removal priority for that fruit). Together, these two sets of labels constitute the unified initial state of fruit thinning, namely, selecting the cluster first and then selecting the fruit.
To more intuitively present the intervention urgency of each fruit cluster in the current image and within the overall sample set, this study first calculates the comprehensive score
(as shown in Equation (14)) by combining D,
, CR, and the mean
and standard deviation
of fruit ripeness within the cluster. Based on this score, the spatial competition status and fruit-thinning priority of each fruit cluster in
Figure 17b are quantitatively evaluated and ranked. On this basis, two ranking indicators are further defined according to the ranking results of
: ImgRank represents the fruit-thinning priority order of fruit clusters within the current image, expressed by uppercase letters A–Z corresponding to the numerical order 1–26, where a smaller value indicates that the cluster should be intervened with earlier; GlobalRank represents the position of the fruit cluster after ranking by
over the entire dataset and is used to reflect its relative intervention urgency among all samples. The quantitative evaluation results of the spatial competition status and fruit-thinning priority of each fruit cluster in
Figure 17b are shown in
Table 5.
As can be seen from
Table 5, the red fruit cluster in
Figure 17b has an ImgRank of A, corresponding to the numerical order 1, indicating that it has the highest intervention priority in the current image. At the same time, its
is also the highest among the four fruit clusters, indicating that this fruit cluster shows stronger intervention urgency in terms of spatial crowding and ripeness-related risk. Although the orange fruit cluster has a relatively high D, its comprehensive score is lower than that of Red, and therefore it ranks second. The priorities of the yellow fruit cluster and the green fruit cluster decrease in sequence. This indicates that cluster-level ranking is not determined by a single indicator but is instead the result of a comprehensive evaluation jointly formed by spatial-structural and ripeness-related indicators.
At the fruit level, after the target fruit cluster is selected, the fruits within the cluster are further ranked according to the fruit score
calculated by Equation (18), thereby obtaining the fruit-level thinning order, which is marked in
Figure 17b in the form of numerical labels. A smaller number indicates that the fruit should be removed earlier within that cluster, thus forming a two-level decision-making process in which the fruit cluster requiring priority intervention is determined first, and then the fruit removal order within that cluster is determined.
6.6.2. Results of Fruit Sequence Sparsification
To demonstrate the advantages of the proposed method in fruit sequence sparsification, the fruit-thinning strategy was further applied to the corresponding fruit clusters, and the structural changes in the fruit clusters before and after thinning were visualized and analyzed. The results are shown in
Figure 18. During fruit thinning, the two-level decision principle of cluster-level priority and intra-cluster ranking was strictly followed; that is, fruits were gradually removed only within fruit clusters with higher cluster-level priority, according to the fruit-level thinning priority. An adaptive removal strategy was adopted during the fruit-thinning process. Under the constraint of a limited number of removed fruits, the changes in the spatial structure of the fruit cluster were dynamically evaluated, and the fruit-thinning process was automatically terminated when the structural indicators reached the upper bound of the interval corresponding to Equation (19) in
Section 5.3.3.
The fruit-thinning results shown in
Figure 18 are all based on the same initial decision state shown in
Figure 17b, and only the structural responses and indicator changes after the execution of fruit thinning are presented. In each dashed box, the left side shows the fruit-cluster structure before thinning, and the right side shows the result after fruit thinning is carried out according to the fruit-level thinning priority order. The fruits removed during the thinning process are marked with red crosses, and the arrows indicate the execution direction of fruit thinning. The numerical labels of the fruits within each cluster indicate the fruit-level thinning priority order, where a smaller number means that the fruit has a higher removal priority within that cluster.
and CR of the fruit clusters before and after thinning are also given in the figure to intuitively show the structural changes caused by the fruit-thinning strategy.
As can be seen from
Figure 18, when only a small number of fruits are removed,
within the fruit clusters either increases significantly or remains unchanged, while CR decreases significantly, indicating that the most crowded local structures within the fruit clusters are effectively alleviated. At the same time, the fruit-thinning process automatically stops after the structural threshold conditions are satisfied, thereby avoiding excessive fruit removal. These results indicate that the priority-based fruit-thinning strategy can effectively optimize the spatial structure of fruit clusters through limited fruit removal under a clearly defined decision starting point and provide intuitive experimental evidence for subsequent quantitative statistical analysis.
6.6.3. Overall Analysis of Fruit-Thinning Effects
To evaluate the effect of the fruit-thinning strategy on the spatial crowding degree of fruit clusters at the overall scale, this study statistically analyzed the changes in CR before and after fruit thinning. The results are shown in
Figure 19a. In the figure, the upper and lower boundaries of the box represent the first quartile and the third quartile, corresponding to the 25% and 75% positions of the sample distribution, respectively. The orange horizontal line inside the box denotes the median, and the whiskers extending outside the box represent the minimum and maximum values within the non-outlier range, which are used to characterize the overall distribution and dispersion of CR among different fruit clusters. As can be observed from
Figure 19a, before fruit thinning, the overall box distribution of fruit-cluster CR is relatively high, with a median of 0.67, and both the first quartile and the third quartile are also at relatively high levels. This indicates that, for the middle 50% of the samples, the contact ratio of fruits within the clusters remains in a relatively high range, suggesting that most fruit clusters exhibit obvious fruit contact in the original state. After applying the priority-based fruit-thinning strategy, the overall box distribution of the contact ratio CR shifts downward significantly. Not only does the median in the boxplot decrease to 0.37, representing a reduction of 44.8%, but the first quartile and the third quartile also decrease simultaneously. This indicates that the fruit contact ratio of the middle 50% of fruit-cluster samples decreases overall and that the proportion of samples falling into lower contact-ratio intervals increases significantly. These results demonstrate that the proposed fruit-thinning strategy effectively reduces the direct contact degree among fruits in most fruit clusters, thereby alleviating the risk of spatial crowding within the fruit clusters.
In addition to the contact ratio, this study further analyzed the effect of the fruit-thinning strategy on the minimum normalized fruit spacing (
) of fruit clusters, and its distributions before and after fruit thinning are shown in
Figure 19b. Compared with that before fruit thinning, the overall box distribution of
after fruit thinning shifts upward significantly, and the median as well as the first and third quartiles all increase. In particular, the median of
increases from 0.66 to 0.80, representing an increase of 21.2%. This indicates that not only does the overall minimum fruit spacing increase, but the lower
values among the middle 50% of the samples also increase simultaneously, meaning that the fruit spacing in the most crowded regions within the fruit clusters is effectively enlarged. It should be noted that the height of the box increases after fruit thinning; that is, the dispersion of the
distribution becomes larger, indicating that different fruit clusters show different response magnitudes to the fruit-thinning operation, which is closely related to the diversity of the initial cluster structure, fruit number, and spatial morphology.
In addition to local contact relationships and minimum fruit spacing, this study further analyzed the effect of the fruit-thinning strategy on D at the overall scale, and its distributions before and after fruit thinning are shown in
Figure 20a. It can be observed that the distribution of D before fruit thinning is overall relatively high, with a median of 0.57, reflecting that most fruit clusters have a relatively high degree of spatial compactness in the original state. After applying the priority-based fruit-thinning strategy, the overall distribution of D shifts downward significantly, and its median decreases to 0.43, corresponding to a reduction of 24.6%, indicating that the fruit clusters become looser at the overall scale. It should be noted that although the D values of some fruit clusters after fruit thinning still remain within the medium range, the overall distribution range expands toward lower values, indicating that the fruit-thinning strategy not only improves the most crowded local structures but also produces a stable reduction effect on the overall spatial compactness of fruit clusters.
To further characterize the magnitude of structural changes caused by fruit thinning, this study statistically analyzed the distribution of ΔCR before and after fruit thinning, as shown in
Figure 20b. Here, ΔCR is defined as the difference between CR after fruit thinning and CR before fruit thinning, and is calculated as:
When ΔCR is negative, it indicates that the contact ratio of fruits within the fruit cluster decreases after fruit thinning, and the degree of spatial crowding among fruits is alleviated; conversely, a positive ΔCR indicates that fruit thinning has a relatively weak structural effect on that fruit cluster.
As shown in
Figure 20b, most samples have negative ΔCR values, mainly concentrated in the interval from −0.4 to −0.1, indicating that the fruit-thinning strategy effectively reduces the fruit contact ratio in the vast majority of fruit clusters. At the same time, there are still a small number of samples whose ΔCR values are close to zero or slightly positive, which usually occur in fruit clusters with relatively loose initial structures or a small number of fruits. Such fruit clusters reach the structural threshold conditions relatively early during fruit thinning, and therefore exhibit only limited or insignificant structural changes.
In summary, the priority-based fruit-thinning strategy exhibits a stable trend of structural improvement at the overall scale. Through the removal of a limited number of fruits, the fruit contact ratio of most fruit clusters is significantly reduced, and the minimum fruit spacing is effectively increased. This result is consistent with the previous qualitative example analysis, indicating that the proposed fruit-thinning priority strategy can achieve relatively consistent spatial optimization effects under different fruit-cluster structural conditions.
6.7. Validation of DEIM-CMFNet Box-Prompted SAM Segmentation
To verify whether SAM can effectively segment the cherries detected by DEIM-CMFNet, this study further evaluated mask quality on the successfully detected fruit instances in the test set. Specifically, when the IoU between a predicted box and a ground-truth fruit box was greater than or equal to 0.5 and the predicted category was consistent with the ground-truth label, the predicted box and the corresponding ground-truth fruit instance were regarded as successfully matched. The successfully matched instances were considered to provide valid box prompts for SAM. Subsequently, the SAM-generated masks obtained under these box prompts were compared with the manually annotated instance masks, and mIoU, Dice coefficient, and Boundary F1 score were used to evaluate segmentation quality. It should be noted that this evaluation mainly aims to analyze the segmentation capability of SAM when valid detection boxes are provided by DEIM-CMFNet. Therefore, missing masks caused by missed detections of the detector were not included in the evaluation of SAM segmentation quality itself. The results are shown in
Table 6.
As shown in
Table 6, for the fruit instances successfully detected by DEIM-CMFNet and provided with valid box prompts, the masks generated by SAM show high consistency with the manually annotated masks. Since this task segments a single cherry within a detected bounding box, the segmentation problem is more constrained and less difficult than fully automatic prompt-free instance segmentation, allowing SAM to achieve high segmentation accuracy. The mIoU, Dice coefficient, and Boundary F1 score reach 99.89%, 99.92%, and 99.68%, respectively, indicating that, under valid detection-box prompts, SAM can stably generate instance masks that closely match the manually annotated visible fruit regions. This provides a reliable mask basis for the calculation of spatial phenotypic indicators such as D, CR,
, and
.
8. Future Work
Although the proposed indicators show relative robustness to uniform image scaling through area-ratio calculation, scale-normalized spacing, and dimensionless shape descriptors, they are still image-derived two-dimensional phenotypic indicators. Therefore, D, , CR, and should be interpreted mainly as relative descriptors of fruit-cluster spatial compactness and thinning priority under similar greenhouse imaging conditions, rather than as absolute three-dimensional measurements. In particular, severe viewpoint changes and perspective distortion may still affect the estimation of fruit spacing, cluster density, and visible fruit morphology. Similarly, because ripeness recognition in this study is based on single-view RGB images, ripening regions located on the non-visible side of a fruit or completely occluded by adjacent fruits cannot be directly observed or inferred. However, the purpose of ripeness detection in this work is to support thinning-priority determination based on the current visible and operable fruit-cluster state, rather than to estimate the complete three-dimensional maturity distribution of each fruit. In practical thinning or robotic operation, fruits or ripening regions that are completely occluded by outer fruits are also difficult to directly evaluate and remove from the current view. Therefore, visible-surface ripeness provides a practical basis for current-view thinning decision support. Future work will introduce fixed imaging devices, calibration references, multi-view images, temporal observation, or depth cameras to improve metric consistency, reduce the influence of perspective distortion and non-visible ripening regions, and further enhance the reliability of fruit maturity assessment.
The proposed fruit-thinning strategy is consistent with practical orchard thinning experience, in which fruit crowding, fruit contact, delayed ripeness, and inferior morphology are commonly considered when selecting fruits for removal. In this study, these empirical considerations were transformed into quantitative image-derived indicators and a reproducible two-level thinning-priority ranking framework. The effectiveness of the strategy was therefore evaluated from the perspective of visual phenotypic optimization. Specifically, the algorithm-generated thinning sequence reduced the fruit contact ratio, increased the minimum normalized fruit spacing, and decreased cluster density, indicating that the proposed strategy can alleviate crowding and improve the spatial distribution of retained fruits in the image domain. These results support the effectiveness of the proposed method as a visual decision-support tool for thinning-priority determination. Nevertheless, the current validation is based on image-derived phenotypic indicators rather than actual field thinning operations or direct measurements of final fruit quality and yield. Therefore, future field experiments combined with agronomic quality measurements are needed to further verify whether the proposed strategy can lead to actual improvements in fruit quality.
Future research will also expand data collection to multiple cherry cultivars, greenhouse sites, production years, cultivation modes, and environmental conditions. Although the current study focuses on greenhouse Meizao cherries collected from a representative greenhouse production area in Dalian during the 2025 production season, cross-cultivar, cross-site, and cross-year validation are still needed to evaluate the robustness and generalizability of the proposed framework. In addition, future studies will combine temporal observation, three-dimensional structure reconstruction, and multi-modal information fusion to explore the dynamic growth and structural evolution patterns of fruit clusters. By integrating actual fruit-thinning experiments and agronomic rule constraints, the fruit-thinning decision model can be continuously calibrated and validated, thereby promoting the application of visual phenotypic analysis methods in intelligent cherry production management.



 ,
,