Article

Non-Destructive Detection of Mycotoxin Contamination in Maize Silage Based on Machine Vision


1
College of Mechanical and Electrical Engineering, Inner Mongolia Agricultural University, Hohhot 010018, China
2
Department of Scientific Research, Baotou Vocational and Technical College, Baotou 014035, China
*
Author to whom correspondence should be addressed.
Agriculture 2026, 16(15), 1602; https://doi.org/10.3390/agriculture16151602
Submission received: 17 June 2026 / Revised: 23 July 2026 / Accepted: 24 July 2026 / Published: 27 July 2026
(This article belongs to the Section Artificial Intelligence and Digital Agriculture)

Abstract

Mycotoxin contamination by aflatoxin B1 (AFB1) and deoxynivalenol (DON) in maize silage threatens feed safety, requiring rapid, non-destructive monitoring tools. This study developed a visible-light machine vision approach combined with machine learning to quantify AFB1 and DON and classify contamination levels. A total of 210 silage samples were imaged, and 111 RGB-based color and texture features were extracted, followed by correlation analysis and model-based feature selection. Using the 10 selected features, support vector regression (SVR) achieved the best quantitative performance for AFB1 (R2 = 0.9945, RMSE = 3.18 µg·kg−1), while XGBoost performed best for DON (R2 = 0.9816, RMSE = 45.50 µg·kg−1). For classification, random forest and XGBoost correctly identified AFB1 contamination levels with an Accuracy of 90.48%, whereas SVM achieved 97.62% Accuracy for DON. Comparison of correlation-based and model-based feature importance confirmed the complementary value of statistically significant and nonlinearly predictive features. Biological interpretation suggested that color and texture responses may reflect fungal pigmentation/browning and multiscale surface-structure alterations, respectively, with selected texture descriptors changing earlier than color descriptors during aerobic exposure. The proposed low-cost RGB imaging strategy, coupled with multi-feature fusion, offers a promising approach for high-throughput preliminary mycotoxin screening in feed production.

1. Introduction

The intensification of modern livestock production has placed increasing pressure on feed supply chains, with silage maize widely used as a major roughage source because of its high biomass yield, favorable nutritive value, and good ensiling characteristics [1]. However, during the ensiling process, microbial contamination and improper storage often promote the proliferation of toxigenic fungi, leading to the production of harmful mycotoxins such as aflatoxin B1 (AFB1) and deoxynivalenol (DON) [2,3]. AFB1, identified as a Group I carcinogen by the World Health Organization, and DON, a known plant pathogen metabolite, are among the most prevalent and toxic mycotoxins found in silage [4,5]. Their presence in feed not only compromises animal productivity and welfare but also contributes to broader ecological risks through soil and water contamination [6,7]. Effective feed safety management therefore requires rapid, non-destructive detection methods capable of quantifying mycotoxin levels in silage maize.
Currently, the detection of mycotoxins in maize silage primarily relies on physicochemical analytical techniques. Common methods include high-performance liquid chromatography (HPLC), liquid chromatography-tandem mass spectrometry (LC-MS/MS), and enzyme-linked immunosorbent assay (ELISA) [8]. Despite their high analytical precision, these laboratory-based techniques present practical limitations: high capital and operating costs, labor-intensive sample preparation, extended analysis time, and dependence on skilled technicians [9,10]. These constraints necessitate alternative detection strategies that balance accuracy with operational efficiency and cost-effectiveness.
Non-destructive sensing technologies have emerged as promising alternatives, with near-infrared spectroscopy (NIR) and hyperspectral imaging (HSI) demonstrating capability for mycotoxin detection [11,12]. NIR has been successfully applied to detect mycotoxins in peanut crops, achieving a classification accuracy exceeding 94% [13]. HSI captures hundreds of continuous spectral bands, allowing for precise characterization of compound-specific absorption behavior across different wavelengths [14]. This enables strong detection capabilities for chemical contaminants. An increasing number of studies have demonstrated the strong potential of hyperspectral techniques in the field of mycotoxin detection. Zhang et al. employed HSI to classify AFB1 contamination in maize, reporting that the support vector regression (SVR) model yielded the highest performance, with an accuracy of 87.3% [15]. Teixido et al. applied near-infrared hyperspectral imaging (NIR-HSI) to predict T-2 and HT-2 toxin levels in oats. The quantitative model achieved a coefficient of determination (R2) of 0.64, while the classification accuracy reached 94.1% [16]. While spectroscopic methods show promise for mycotoxin quantification, their adoption remains limited by high equipment costs, computational complexity, and challenging field deployment. Accordingly, RGB imaging was selected in this study to evaluate whether visible color and texture phenotypes could support rapid and low-cost preliminary screening using readily available imaging hardware. This choice prioritizes practical deployability rather than spectral resolution or compound-specific chemical information.
Machine vision offers a compelling alternative by combining simplicity, speed, and accessibility [17]. Unlike spectroscopic systems requiring specialized hardware, vision-based methods leverage standard imaging sensors combined with advanced feature extraction algorithms [18]. Kim et al. integrated wheat surface image features with CO2 concentration measurements [19]. Based on this information, they classified early-stage mycotoxin contamination and achieved an accuracy of 83.3%. Yorulmaz et al. developed an image processing-based method to detect fungal infection in popcorn kernels [20]. By extracting pixel intensity and color features and applying support vector machine (SVM) classification, they achieved a recognition accuracy of up to 96.5%. In addition, machine vision has been applied to evaluate surface quality, detect mold, and perform preliminary screening for mycotoxin contamination in agricultural products such as citrus fruits and nuts. These studies demonstrate the promising application potential of the technology [21,22]. While these studies validate image-based contamination detection, current approaches predominantly perform categorical classification rather than continuous quantification of mycotoxin concentrations. Furthermore, limited biologically informed interpretation of feature–toxin associations constrains understanding of the visual information used by image-based prediction models.
This study develops a machine vision-based measurement system for quantitative mycotoxin detection in maize silage, addressing the dual requirements of continuous concentration prediction and categorical contamination classification. By systematically analyzing the relationships between image features and toxin levels, the study provides a biologically informed interpretation of visual phenotypes associated with fungal deterioration and measured mycotoxin concentrations. The specific objectives are to: (1) establish quantitative relationships between image features and AFB1/DON concentration levels; (2) identify optimal feature subsets through systematic selection and evaluation; and (3) develop and validate regression and classification models for practical mycotoxin measurement in feed production scenarios.

2. Materials and Methods

2.1. Sample Preparation

Maize silage samples were collected from dairy farming regions across northern Inner Mongolia (Baotou, Ulanqab, and Hohhot) between March and June 2024. Ten batches were obtained from multiple farms to ensure geographical representativeness and transported to Inner Mongolia Agricultural University for mycotoxin analysis and model development. The silage was produced from medium-early to medium-maturity maize hybrids (e.g., Xianyu 335, Heyu 187, and Lihe 1), with reported growth durations of approximately 127, 128, and 130 d, respectively, under northern spring-maize production conditions. These values are provided for general comparison because growth duration and maturity classification may vary among ecological regions and variety-testing systems. The hybrids were cultivated under irrigated conditions in the Tumochuan Plain with planting densities of 60,000–67,500 plants/ha. Whole-plant maize was harvested at the 1/2–2/3 milk line stage with 65–70% moisture content, chopped to 1–2 cm, and ensiled in bunker silos at a packing density of ≥650 kg/m3. The silos were sealed with polyethylene film and fermented under anaerobic conditions at ambient temperature for 3–6 months prior to sampling. The variation in fermentation duration resulted from differences in production schedules among the commercial farms and was not an experimentally controlled factor.
Each 4 kg sample was stored in polyethylene containers at a controlled room temperature of 18–22 °C during the 7-day aerobic exposure experiment. Containers were sealed with microporous aluminum foil, permitting controlled gas exchange while minimizing moisture loss. Samples were collected daily over a 7-day period (days 0–6) for each batch. At each sampling point, three subsamples were obtained via the quartering method to ensure representativeness. This yielded a total dataset of 210 samples (10 batches × 7 days × 3 replicates) for mycotoxin quantification and predictive modeling.

2.2. Machine Vision System and Image Preprocessing

The machine vision system comprised a high-resolution industrial camera, dual-sided LED illumination, a black-painted dark chamber, and an image acquisition workstation. The imaging setup employed a CMOS camera (2248 × 2048 pixels; BFLY-PGE-50H5C-C, Teledyne FLIR, Wilsonville, OR, USA) and bar-type LED light sources (RF-TX10030, KEMAI Vision Technology, Ltd., Dongguan, China), which were symmetrically installed on both sides of the dark chamber. The camera was mounted vertically above the sample platform, and image acquisition was performed using the Point Grey FlyCapture2 software (version 2.6.3.2, Teledyne FLIR, Wilsonville, OR, USA) after a 30 min system warm-up to ensure operational stability.
For each image acquisition, approximately 70 ± 0.5 g of maize silage was randomly obtained using the quartering method and evenly spread in a Petri dish (φ120 × 20 mm). The dish was then placed on a conveyor belt within the dark chamber. Imaging parameters such as exposure, gain, and brightness were optimized to ensure consistent illumination across all samples. Three images were captured per sample and stored in 24-bit RGB format (2248 × 2048 pixels) as BMP files. During preprocessing, a 1000 × 1000-pixel central region of interest (ROI) was extracted from each image to standardize subsequent feature analysis [23]. A multi-stage filtering strategy was employed to mitigate noise and enhance image quality. After comparative testing of Gaussian, mean, and median filters, a 3 × 3 median filter was selected for its superior balance between noise suppression and edge preservation. Edge enhancement was then performed using the Laplacian operator to improve contour sharpness and structural visibility.
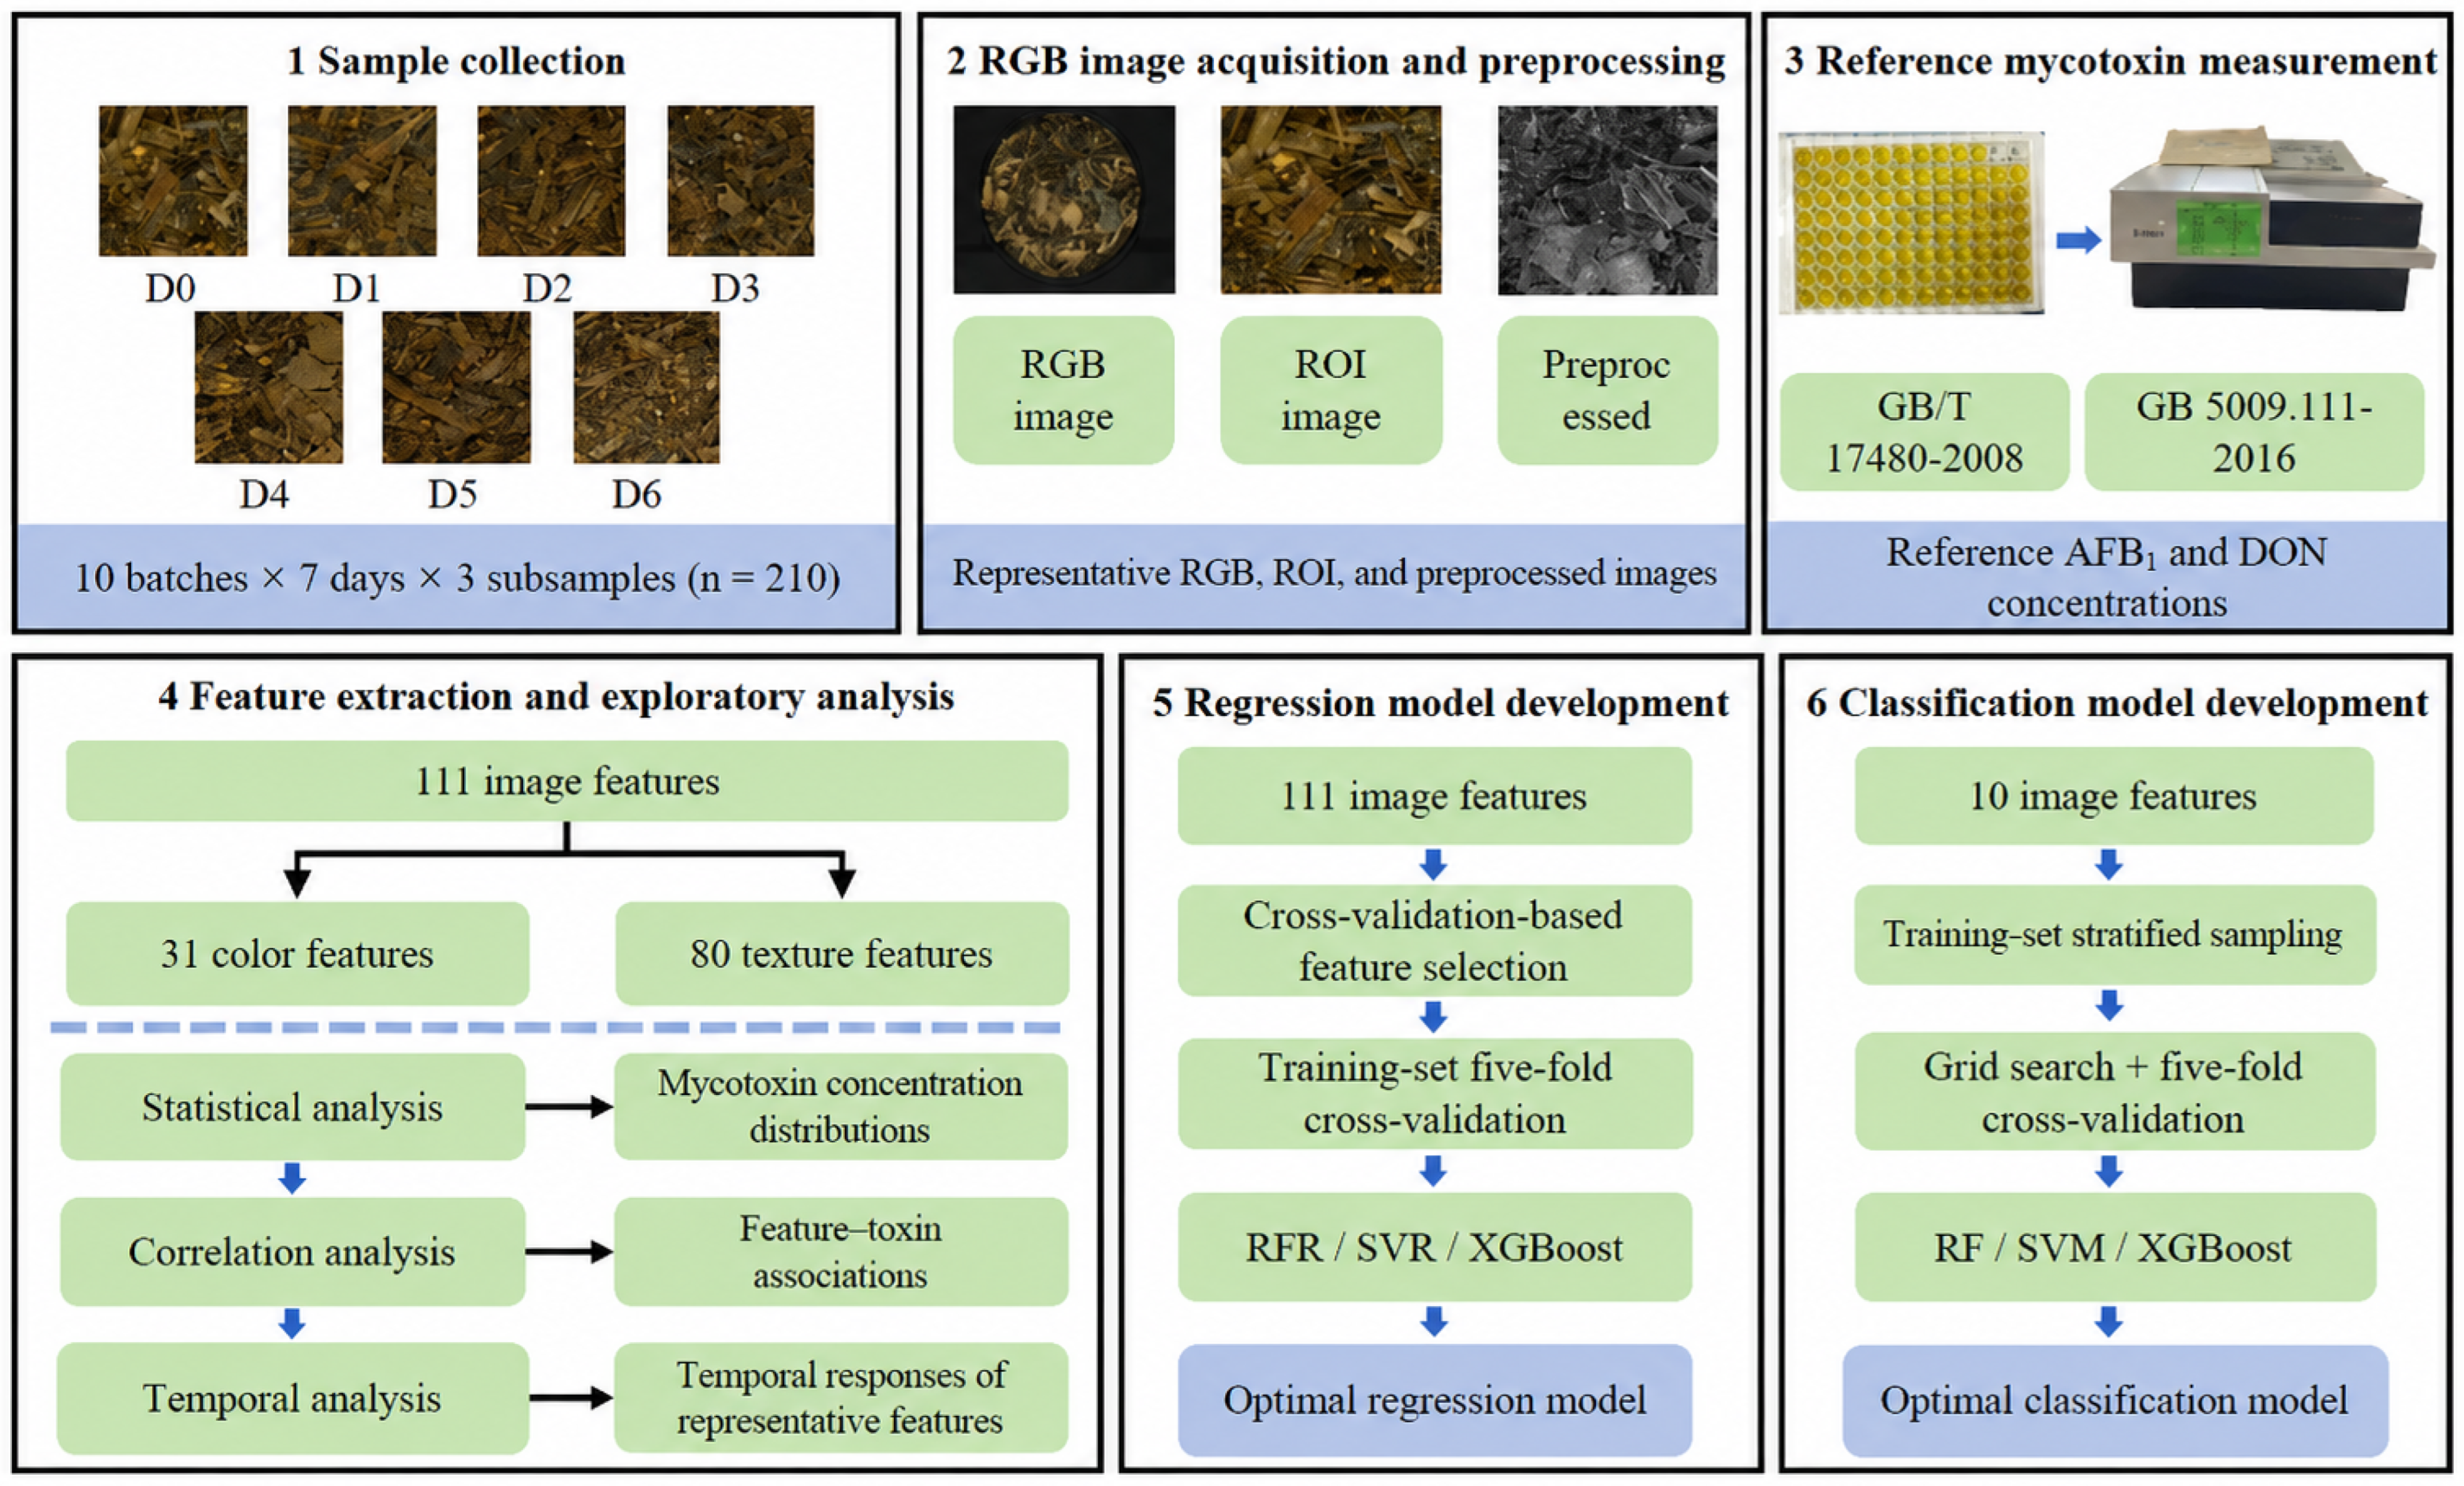
Following image preprocessing, a total of 111 color and texture features were extracted from each region of interest for downstream analysis. The feature design was informed by established methods in image-based agricultural analysis, comprising 31 color features and 80 texture features [24,25]. Color features were derived from the RGB, HSI, and CIE Lab color spaces using first- to third-order color moments. Additional color features included vegetation and chromatic indices such as excess green (EXG), color difference metrics, and hue angle. For texture feature extraction, grayscale conversion was first applied to each ROI. Texture features were computed using four descriptor types: gray-level statistical moments (GLMs), gray-level co-occurrence matrix (GLCM), local binary pattern (LBP), and discrete wavelet transform (DWT). For DWT analysis, the Daubechies 4 wavelet was used as the basis function with a decomposition level of 4, enabling multi-scale texture representation. The overall experimental workflow is shown in Figure 1, and a complete list of the extracted features and their definitions is provided in Table 1.

2.3. Mycotoxin Measurement

Mycotoxin detection was conducted at the Inner Mongolia Research Center for Experimental Biology. Quantification of AFB1 and DON concentrations in maize silage was performed using ELISA, in accordance with GB/T 17480-2008 and GB 5009.111-2016 [26,27]. A 2.50 g subsample was placed in a centrifuge tube and extracted with 20 mL of 60% methanol–water solution, followed by homogenization. An additional 5 mL of solvent was used to rinse the tube walls. The combined solution was shaken at room temperature for 5 min and centrifuged at 4000 rpm for 5 min. The supernatant was filtered through qualitative paper, and the filtrate was used for ELISA.
Quantitative determination was carried out using PriboFast® ELISA kits (EKT-010 for AFB1; EKT-030 for DON; Pribolab, Ltd., Qingdao, China). The limits of detection (LOD) and limits of quantification (LOQ) for AFB1 were 0.3 µg·kg−1 and 1 µg·kg−1, respectively; for DON, the LOD and LOQ were 75 µg·kg−1 and 250 µg·kg−1, respectively. For ELISA detection, the test solution (200 μL) was mixed with diluent (300 μL) and vortexed thoroughly. The pH was adjusted to 6.0–8.0 before proceeding. All samples were analyzed in duplicate. Following the kit protocol, standard solutions, test samples, enzyme conjugates, and antibody reagents were sequentially added to the microplate wells. After incubation at room temperature for color development, the reaction was terminated and the optical density (OD) was measured using a microplate reader. Toxin concentrations were determined by interpolating the OD values from the standard curve and applying the corresponding dilution factor. Concentrations below the assay LOD were not extrapolated but were replaced with one-half of the corresponding LOD, namely 0.15 μg·kg−1 for AFB1 and 37.5 μg·kg−1 for DON. Measurements equal to or above the LOD but below the LOQ were retained as reported by the ELISA and were directly used as reference values for model development.

2.4. Dataset Preparation

Each of the 210 subsamples was assigned a unique sample ID and treated as an individual observation during dataset partitioning. Although three subsamples were collected from each batch and aerobic-exposure day, they were separately obtained through the quartering procedure and independently subjected to image acquisition, feature extraction, and ELISA measurement, resulting in distinct image-feature vectors and toxin concentrations. A total of 168 samples were assigned to the training set and 42 samples to the held-out test set at a ratio of 4:1. For quantitative prediction, the Kennard–Stone (KS) algorithm was applied at the individual-sample level to improve the representativeness of the training set. For classification, stratified sampling was performed at the individual-sample level to maintain similar class proportions between the training and test sets. No explicit grouping constraint based on batch and aerobic-exposure day was imposed during partitioning.
The extracted color and texture features exhibited substantial variation in scale and units across dimensions due to their heterogeneous nature. To mitigate this, Z-score normalization was applied to standardize the feature values. The standardization formula is given by Equation (1):
x s = x μ σ
where xs denotes the standardized value, x is the original feature value, μ is the arithmetic mean, and σ is the standard deviation of the corresponding feature dimension.
To ensure reliable model development, five-fold cross-validation was performed exclusively within the training set. Feature ranking and selection of the 10 most informative descriptors were embedded within the cross-validation procedure and conducted using only the corresponding training folds, while the remaining fold was used for internal validation. The held-out test set was completely excluded from feature selection, cross-validation, hyperparameter optimization, and model fitting. After the optimal feature subset and hyperparameters were determined, the final models were fitted using the complete training set and evaluated once on the held-out test set. Accordingly, the performance metrics reported in this study were calculated from the held-out test set rather than averaged across the cross-validation folds. For regression models, the mean root mean square error (RMSE) across folds was used as the evaluation metric, where lower RMSE values indicated superior generalization. For classification tasks, average accuracy was used to assess inter-fold consistency. The parameter set that yielded the lowest RMSE or highest accuracy was selected as the optimal configuration for the respective model type.

2.5. Development of Quantitative Prediction Models

To construct robust and interpretable models for quantitative prediction of AFB1 and DON concentrations, three widely adopted regression algorithms were investigated: Random Forest Regression (RFR), SVR, and Extreme Gradient Boosting (XGBoost). RFR employs an ensemble learning approach and is recognized for its robustness and strong generalization capability. SVR is well suited for regression tasks involving small sample sizes, high-dimensional feature spaces, and complex nonlinear relationships. XGBoost, a computationally efficient implementation of gradient boosting, balances prediction accuracy and training speed. Grid search integrated with five-fold cross-validation was conducted exclusively on the training set to optimize the hyperparameters of each model, while the independent test set remained untouched until final model evaluation. The explored hyperparameter ranges are summarized in Table 2.
Model performance was evaluated using three metrics calculated on the prediction set: R2, RMSE, and ratio of performance to deviation (RPD) [28,29].
The corresponding calculation formulas are as follows:
R 2 = 1 i = 1 n p ( y i y ^ i ) 2 i = 1 n p ( y i y ^ p ) 2
where np is the number of samples in the prediction set, y ^ i is the predicted value of the i-th sample, yi is the corresponding true value, and y ^ p is the mean of all true values in the prediction set.
R M S E = 1 n p i = 1 n p ( y i y ı ¯ ) 2
where np is the number of samples in the prediction set, y ı ¯ is the predicted value of the i-th sample, and yi is the corresponding true value.
R P D = S D R M S E P
where SD is the standard deviation of the prediction set, and RMSEP is the root mean square error of prediction.
Based on comparative analysis of R2, RMSE, and RPD values on the test set, the model demonstrating the best overall performance was selected for subsequent analysis.

2.6. Development of Classification Models

For robust classification models for AFB1 and DON contamination levels, three representative classification algorithms—Random Forest (RF), SVM, and XGBoost—were employed. RF employs an ensemble of decision trees, providing noise resistance with stable classification performance. SVM suits nonlinear classification tasks involving small sample sizes and high-dimensional feature spaces, with strong generalization capability. XGBoost, a computationally efficient implementation of gradient boosting, balances predictive accuracy and training efficiency in complex classification scenarios. Model construction followed the same procedure as the regression tasks. Grid search with five-fold cross-validation was used to optimize the hyperparameters of each classifier. The final parameter configurations are listed in Table 2. The DON classification threshold of 250 μg·kg−1 was derived from one-quarter of the statutory limit of 1000 μg·kg−1 and coincided with the reported ELISA LOQ. Samples with DON concentrations greater than 250 μg·kg−1 were classified as contaminated, whereas those with concentrations equal to or below 250 μg·kg−1 were classified as uncontaminated.
Classification performance was evaluated using five metrics. Accuracy provided an overall measure of correct predictions. Precision and Sensitivity (Se) assessed the model’s ability to correctly identify contaminated samples, while Specificity (Sp) quantified correct identification of uncontaminated samples. F1-score provided a balanced measure of classification performance. The corresponding formulas are given in Equations (5)–(9):
A c c u r a c y = T P + T N T P + T N + F P + F N
P r e c i s i o n = T P T P + F P
S e = T P T P + F N
S p = T N T N + F P
F 1 = 2 T P 2 T P + F P + F N
where TP is the number of true positives (positive samples correctly predicted as positive), TN is the number of true negatives (negative samples correctly predicted as negative), FP is the number of false positives (negative samples incorrectly predicted as positive), and FN is the number of false negatives (positive samples incorrectly predicted as negative).
The classifier with the highest accuracy on the test set was selected as the optimal model for on-site discrimination of silage maize contamination levels.

3. Results

3.1. Effects of Mycotoxin Contamination on Maize Silage Image Features

3.1.1. Statistics of Mycotoxin Data

Mycotoxin accumulation patterns in maize silage were systematically analyzed across 10 batches over a 7-day storage period (n = 210). The two target mycotoxins exhibited markedly different concentration ranges but similarly high variability. AFB1 concentrations ranged from 0.15 to 63.82 µg·kg−1 (mean: 15.32 µg·kg−1, median: 13.14 µg·kg−1, CV: 94.91%), while DON concentrations ranged from 37.50 to 964.20 µg·kg−1 (mean: 238.59 µg·kg−1, median: 167.78 µg·kg−1, CV: 91.17%). Both mycotoxins showed high dispersion, with standard deviations approaching their mean values (AFB1: 14.54 µg·kg−1; DON: 217.53 µg·kg−1) and large interquartile ranges (AFB1: 25.92 µg·kg−1; DON: 299.36 µg·kg−1).
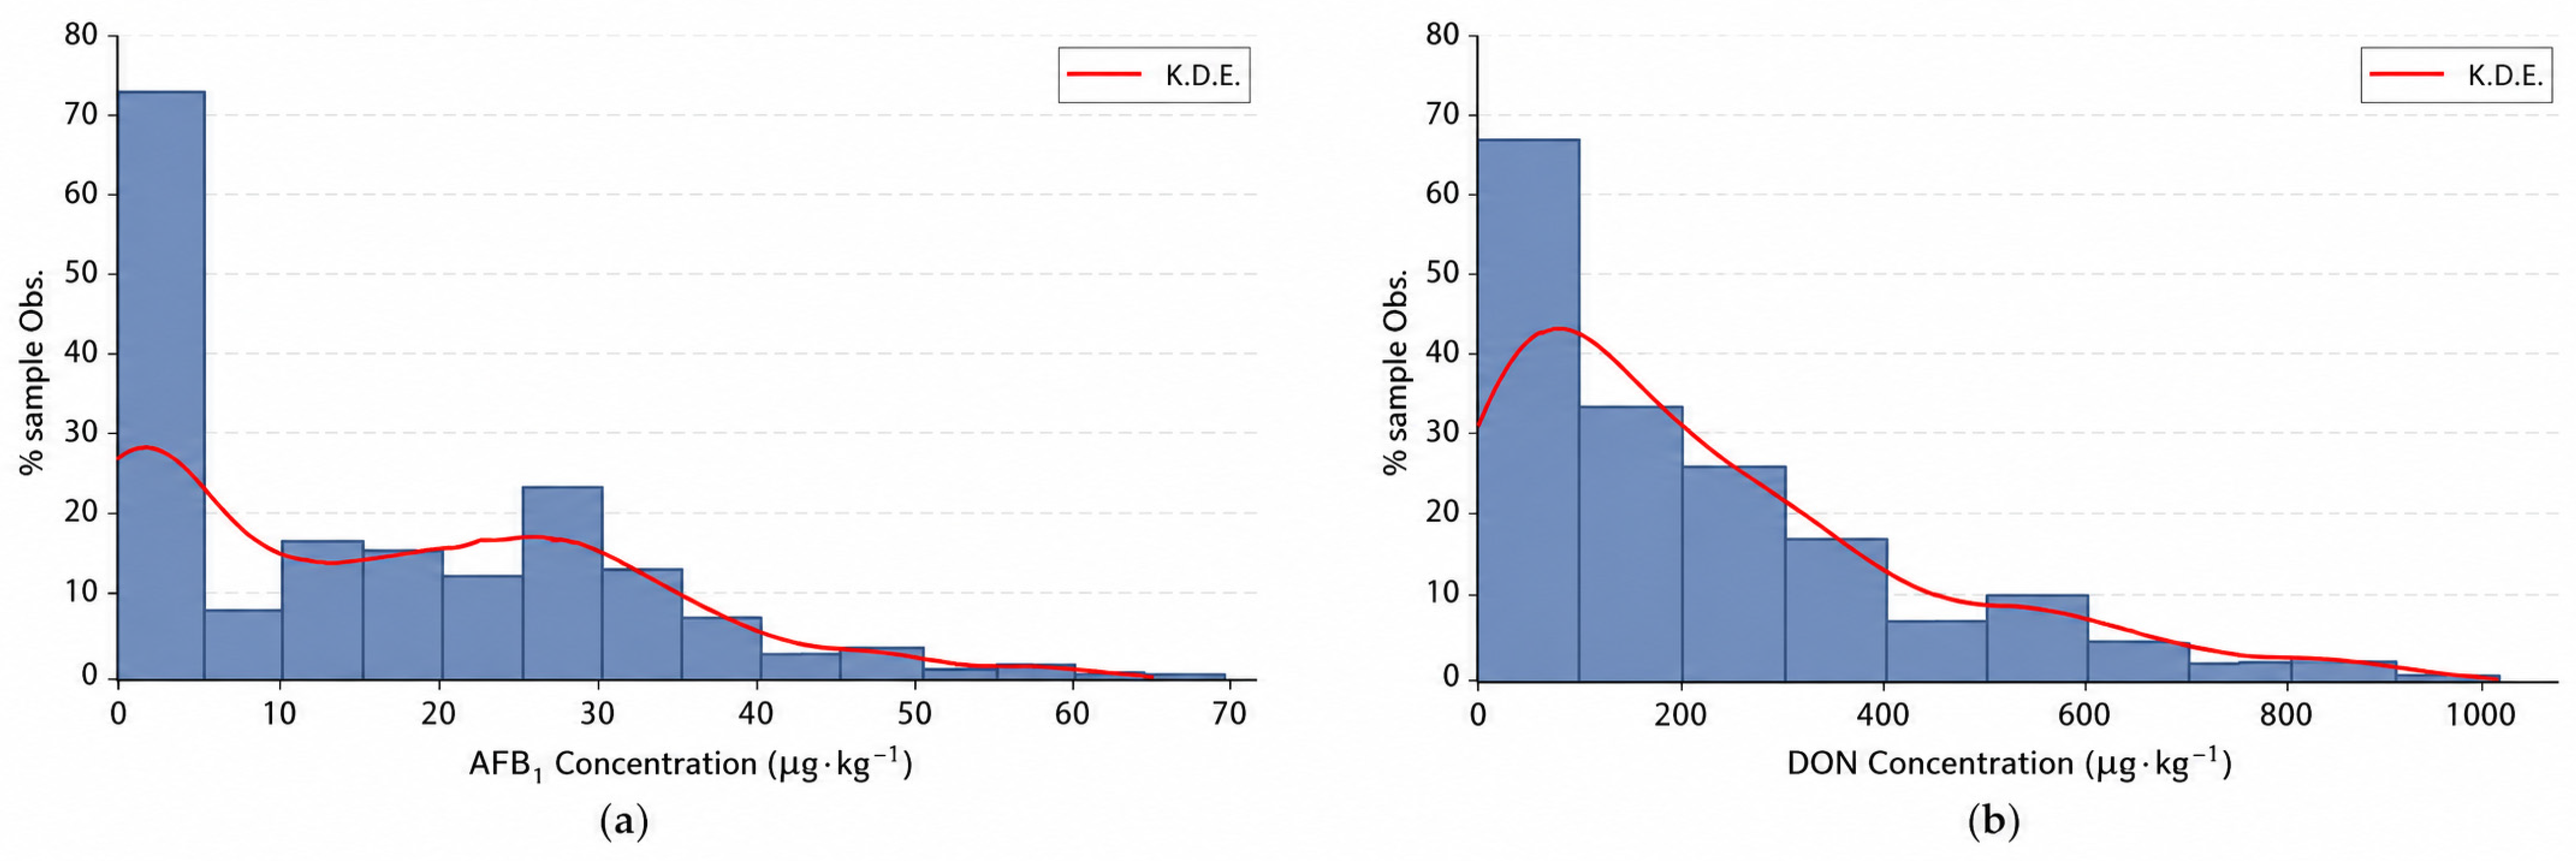
Kernel density estimation combined with frequency histograms revealed that both mycotoxins exhibited right-skewed, unimodal distributions with extended tails toward higher concentrations (Figure 2). The KDE peaks near the median values indicated that most samples had moderate contamination, while a minority showed severe contamination. Shapiro–Wilk tests confirmed significant deviation from normality (AFB1: W = 0.890, p < 0.001; DON: W = 0.881, p < 0.001), and positive skewness values (AFB1: 0.72; DON: 1.12) quantitatively validated the visual asymmetry. This non-normal distribution pattern, combined with high dispersion (CV > 90%), therefore justified the z-score normalization applied in subsequent data preprocessing.
The high variability in AFB1 and DON concentrations may be related to differences in initial contamination, microbial communities, fermentation conditions, and local temperature, moisture, and oxygen availability among the field-collected silage batches. AFB1 and DON are commonly associated with toxigenic species within the genera Aspergillus and Fusarium, respectively, which differ in biosynthetic pathways and ecological preferences [30,31,32,33,34]. These differences provide relevant biological context for the distinct toxin distributions observed. However, because the fungal species and biomass in the present samples were not determined, the observed distributions cannot be attributed to specific fungal taxa or developmental states.
Fungal colonization and aerobic deterioration can produce visible changes in pigmentation, browning, and surface organization that may occur concurrently with mycotoxin accumulation [35]. The relationships between these visible phenotypes and measured toxin concentrations therefore provide a biological rationale for the proposed image-based screening approach. Nevertheless, the present imaging data do not directly quantify fungal biomass or verify the specific biological processes responsible for the observed visual changes.

3.1.2. Correlation Analysis Between Image Features and Mycotoxin Concentrations

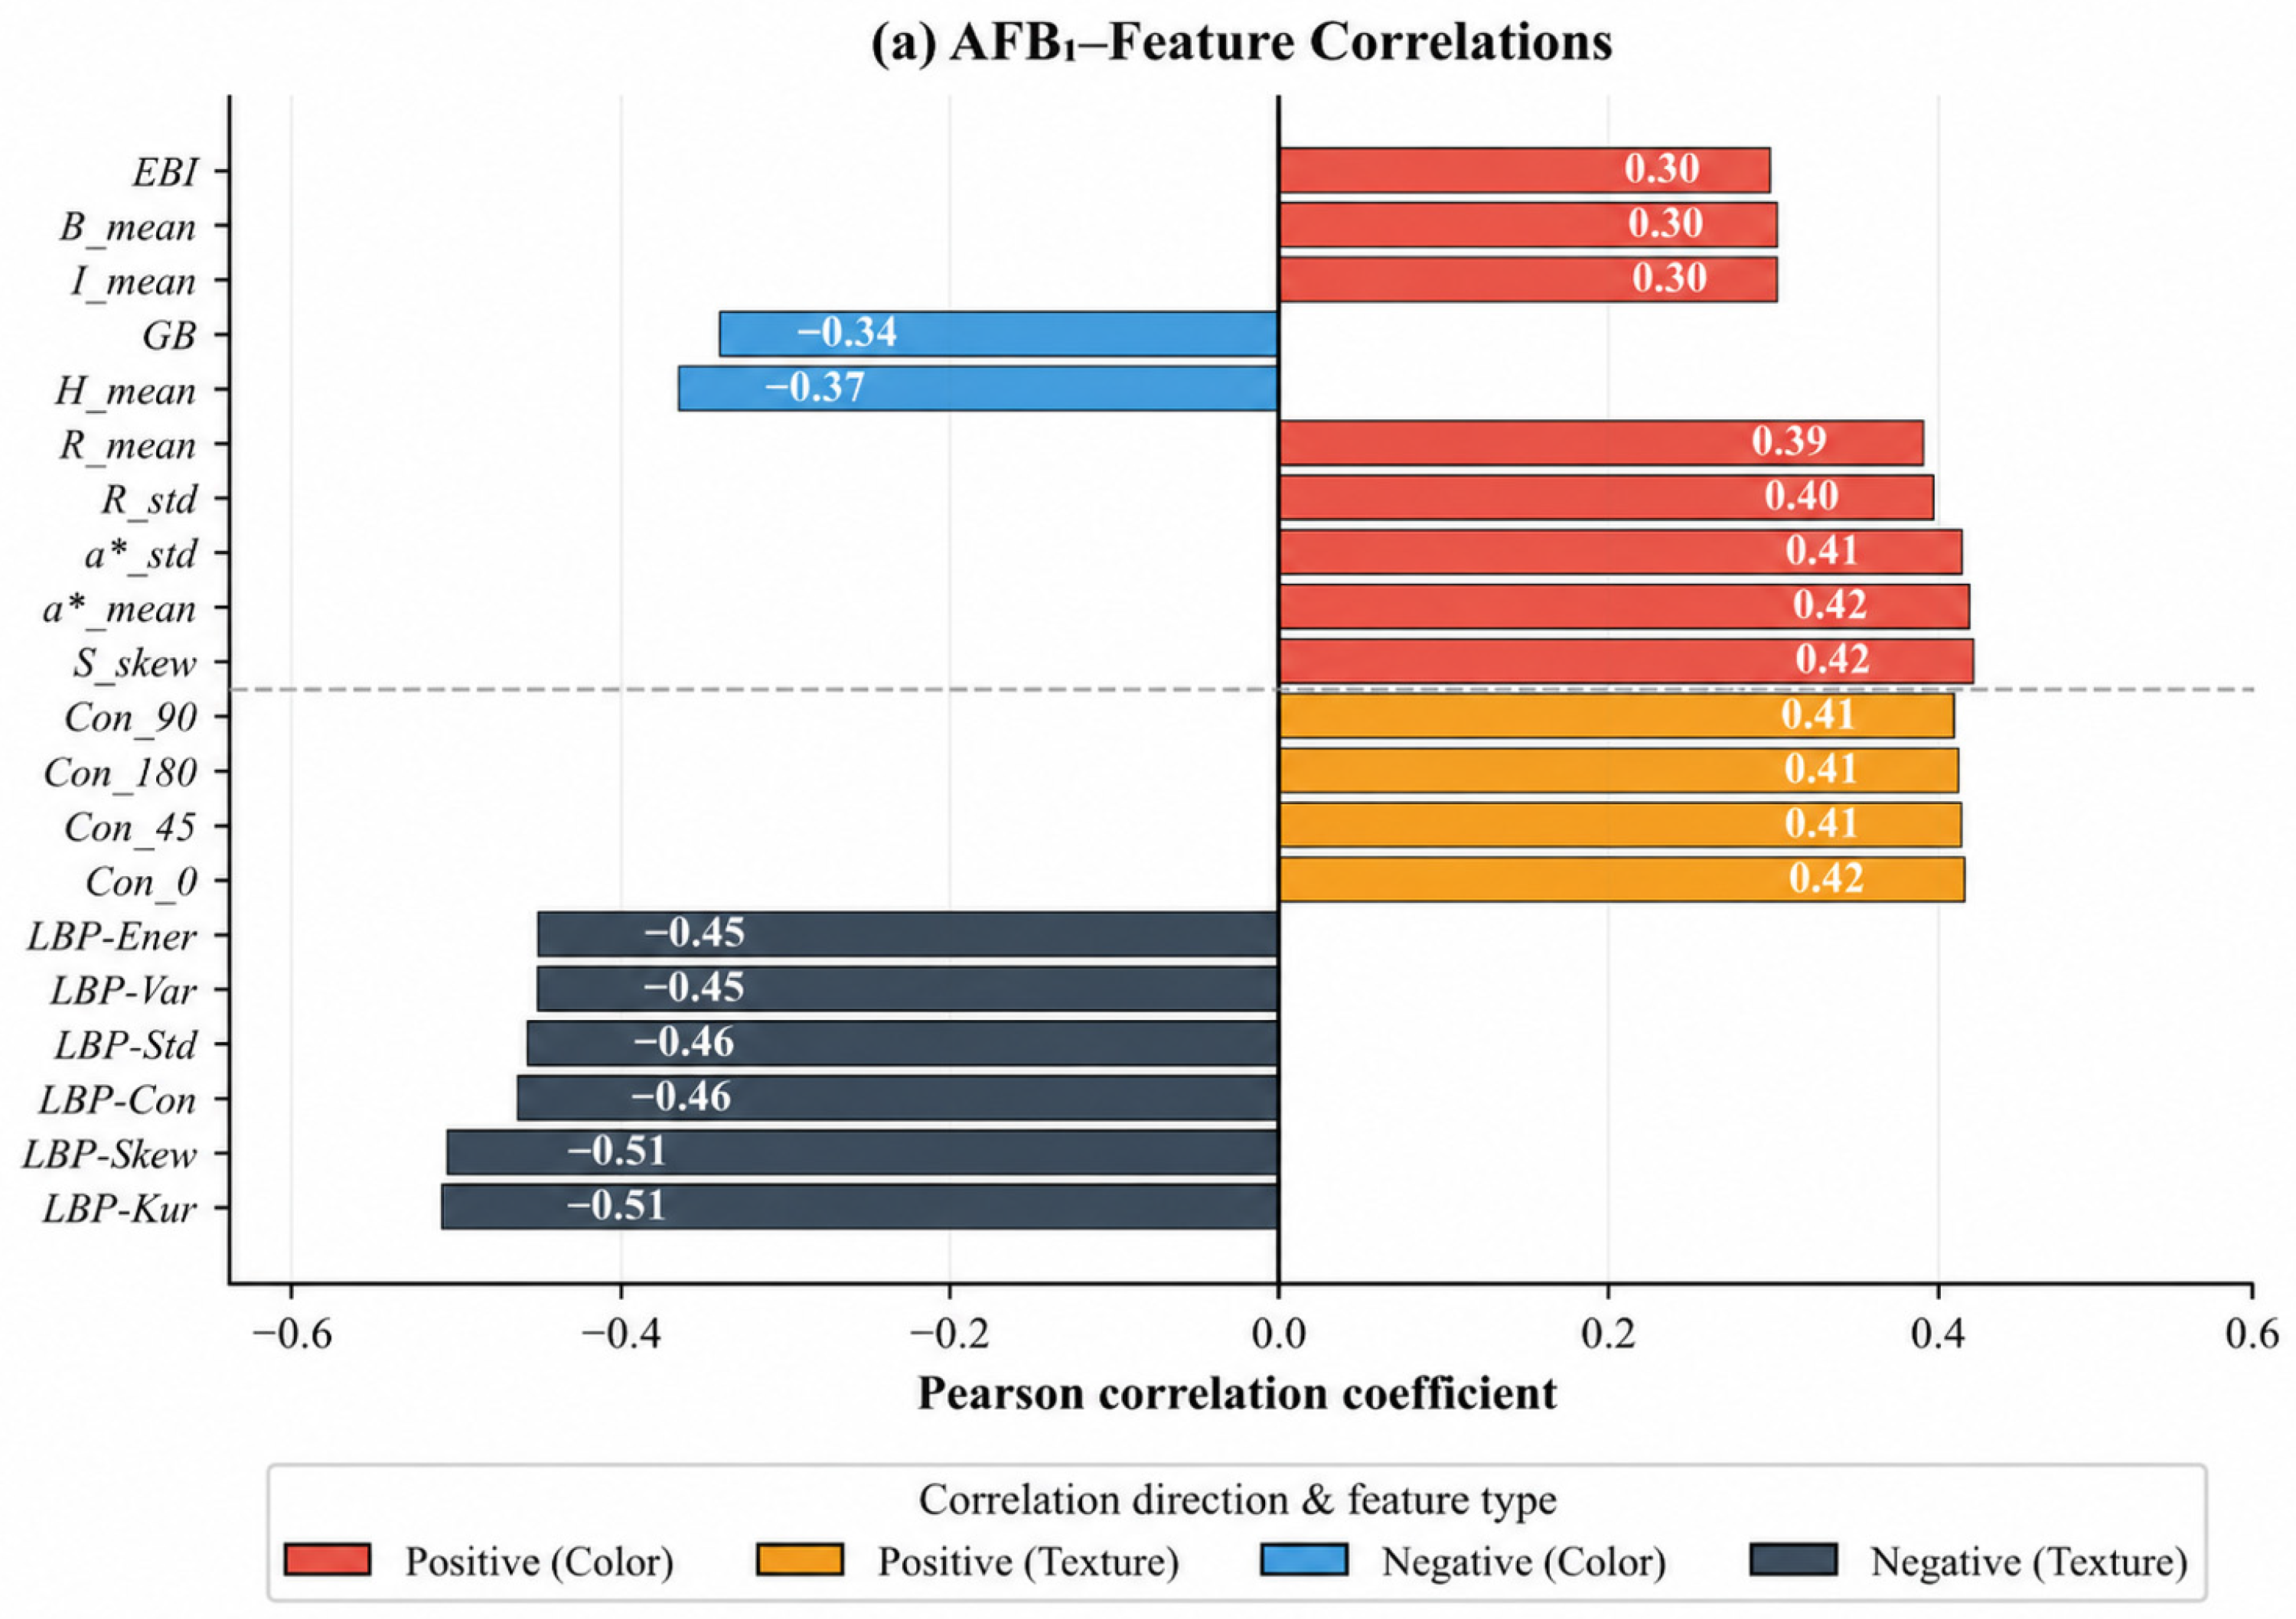
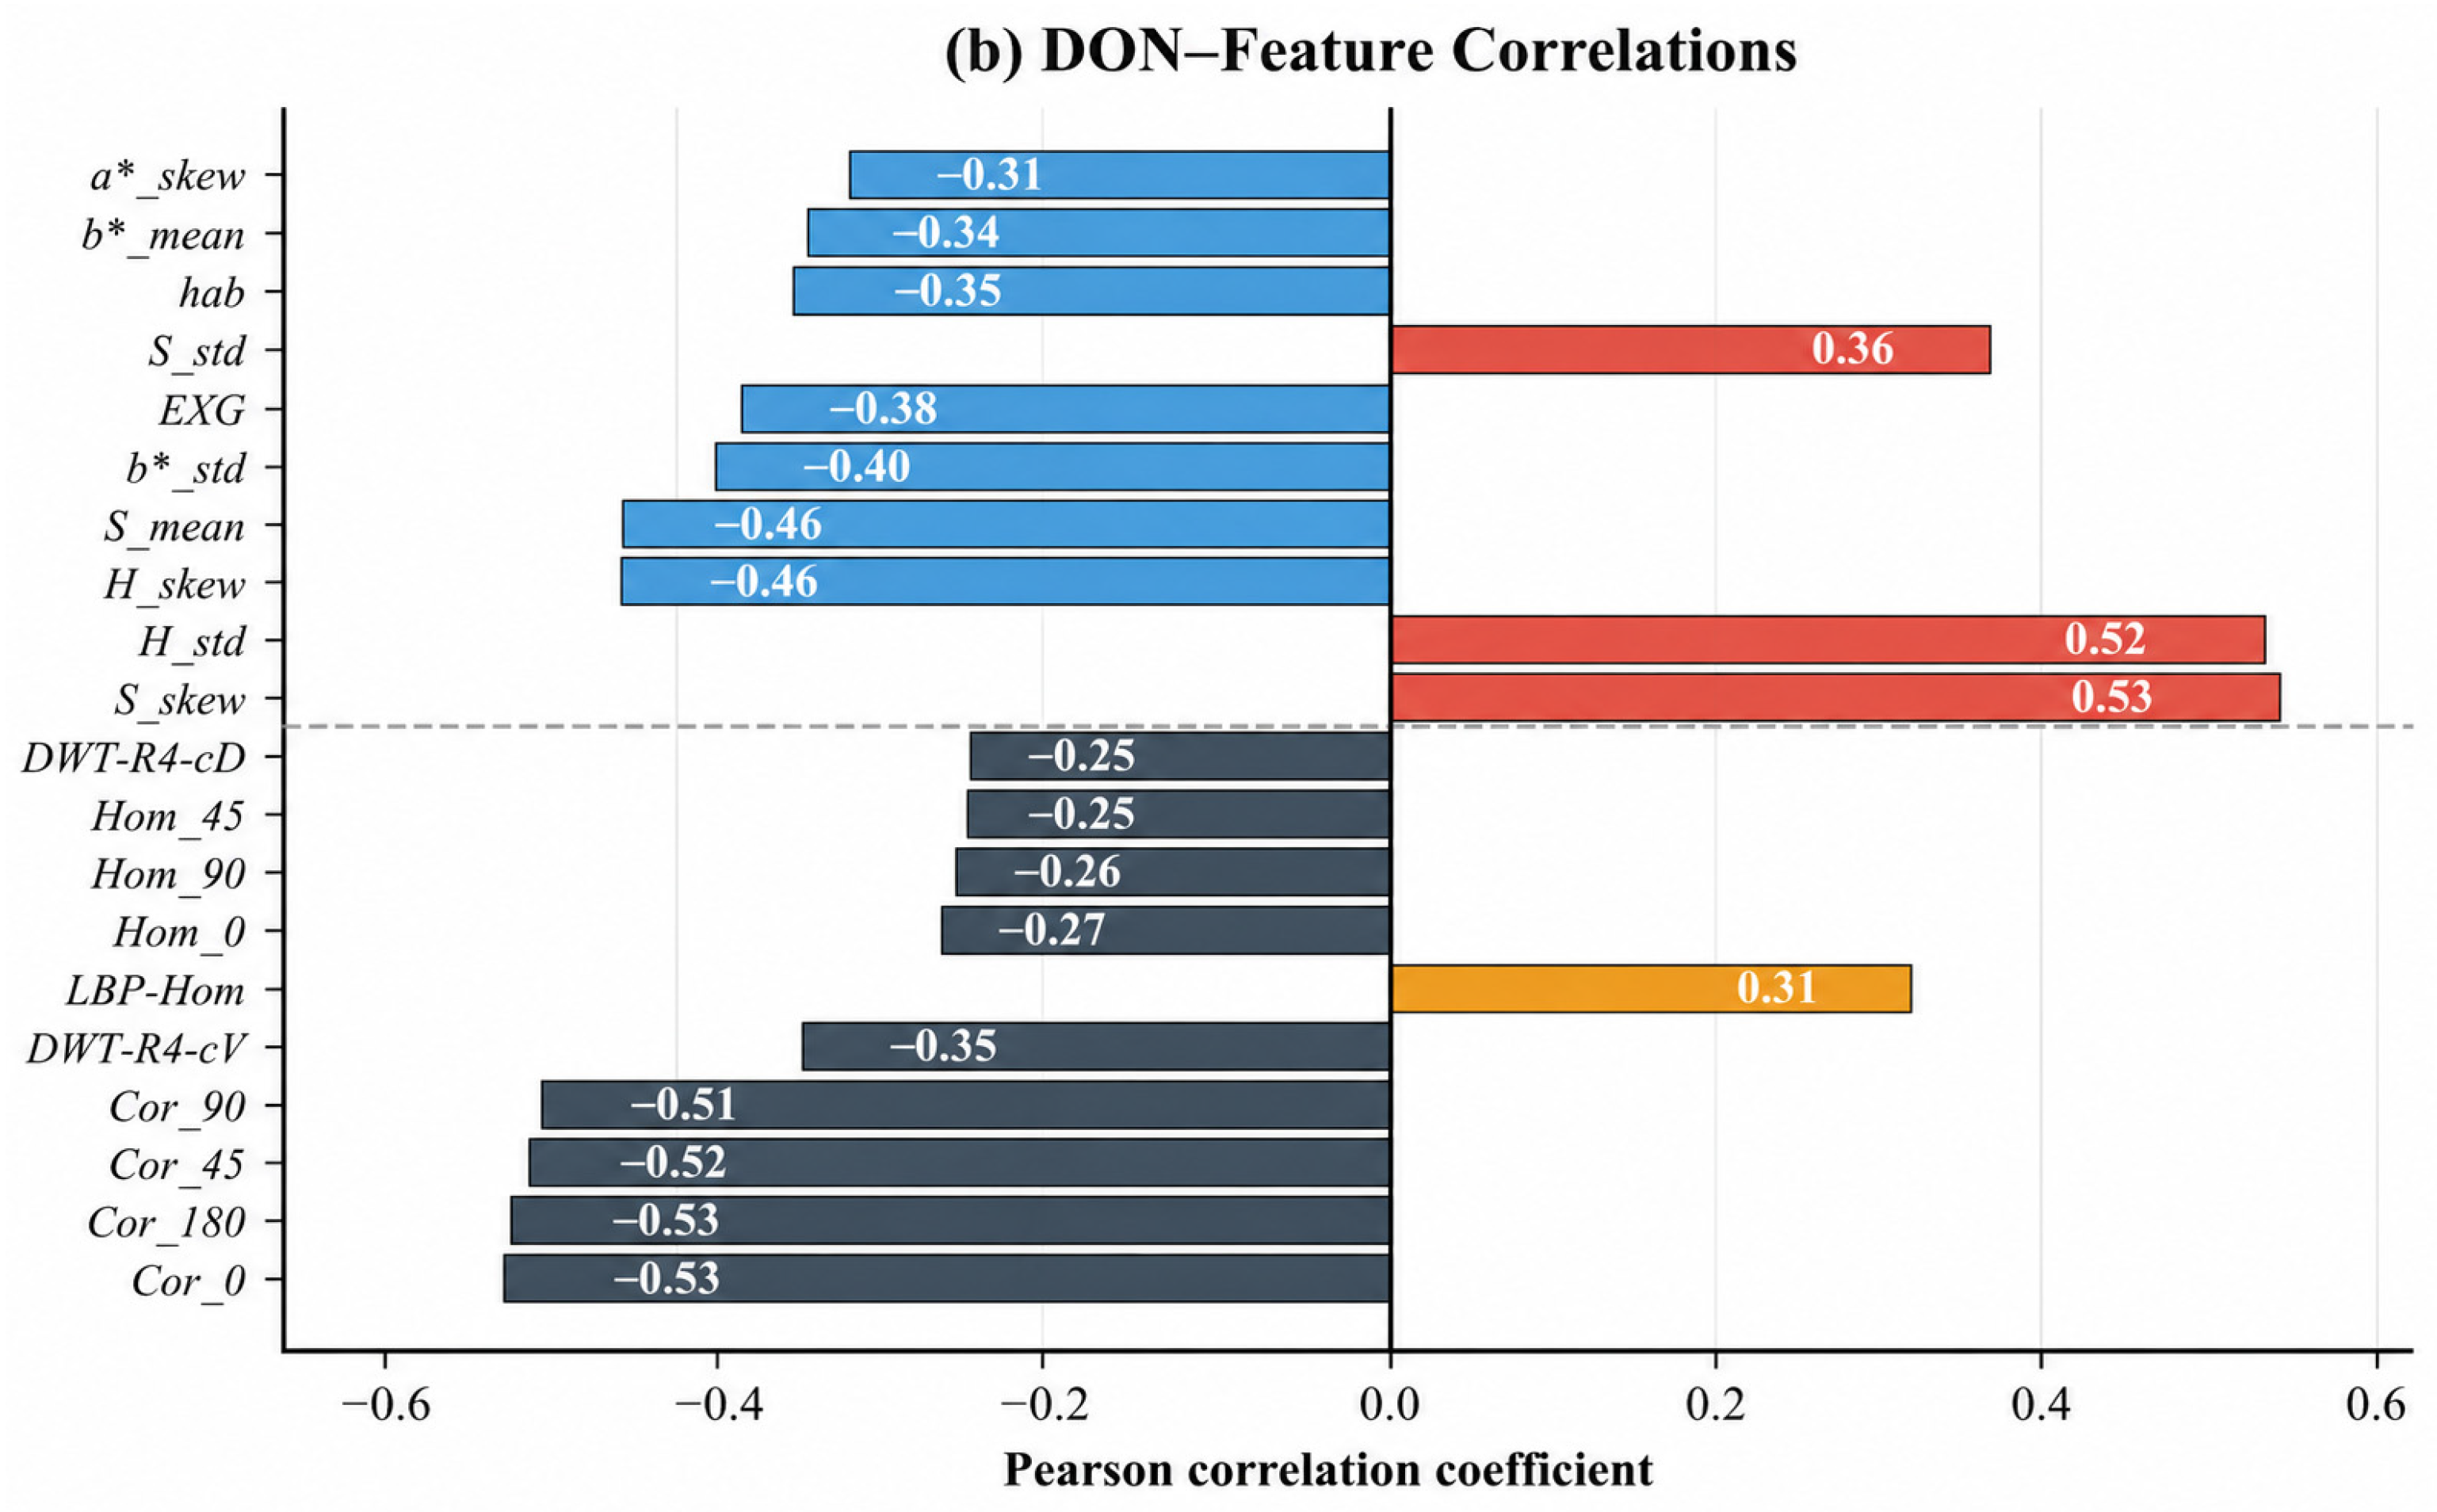
To quantify the relationship between visual changes and mycotoxin levels, Pearson correlation analyses were performed between 111 image features and the concentrations of AFB1 and DON. The results revealed that 67 features were significantly correlated (p < 0.05) with AFB1 levels and 60 with DON levels, demonstrating significant associations between mycotoxin concentrations and quantifiable image characteristics [36]. Correlation analysis showed that AFB1 concentration was significantly associated with 21 color features and 46 texture features (Figure 3a). Among color descriptors, red-channel metrics (a_mean, a_std, R_mean) increased markedly in contaminated samples, while H_mean and GB decreased, indicating a shift toward warmer tones at higher AFB1 concentrations, which is consistent with pigmentation patterns previously reported for toxigenic Aspergillus species. Top-ranked texture descriptors included local binary pattern features (LBP-Var, LBP-Ener, LBP-Kur) and gray-level co-occurrence matrix (GLCM) contrast features (Con_0, Con_45), indicating pronounced changes in local microtexture patterns. DON concentration was significantly associated with 24 color features and 36 texture features (Figure 3b). As DON levels increased, H_std rose while S_mean and EXG declined, indicating reduced chromatic diversity and increased hue dispersion. For texture, DON exhibited strong negative correlations with GLCM correlation features (Cor_0, Cor_180) and wavelet-derived features (DWT-B4-cV, DWT-R4-cD), suggesting disrupted spatial gray-level structures.
These feature–mycotoxin associations are biologically consistent with visible changes reported during fungal colonization and aerobic deterioration. Previous studies indicate that fungal pigmentation, chlorophyll degradation, oxidative browning, mycelial development, and changes in surface coverage can alter the color and texture of agricultural materials [37,38]. These processes may therefore provide plausible explanations for the observed responses of H_mean, GB, GLCM, LBP, and related descriptors. However, fungal pigments, chlorophyll degradation, browning, hyphal development, and tissue structure were not directly measured in the present study. Thus, these explanations should be regarded as literature-supported biological interpretations rather than mechanisms directly verified by the current experiment.
As illustrated in Figure 3, AFB1 and DON exhibited distinct feature response profiles: texture descriptors showed stronger associations with AFB1 (46 vs. 36 significant correlations), whereas color descriptors were more sensitive to DON (24 vs. 21 significant correlations). This differential sensitivity is consistent with contrasting colonization and pigmentation patterns previously reported for toxigenic Aspergillus and Fusarium species. Such biological differences may help explain the stronger texture associations with AFB1 and the slightly greater color sensitivity to DON. However, the fungal taxa present in the analyzed samples were not identified. The complementarity between feature types suggests that combining color and texture descriptors provides a more comprehensive characterization of contamination-induced changes. To further elucidate these feature–mycotoxin relationships, the temporal dynamics of representative features were examined across the storage period.

3.1.3. Temporal Variation in Image Features During Aerobic Exposure

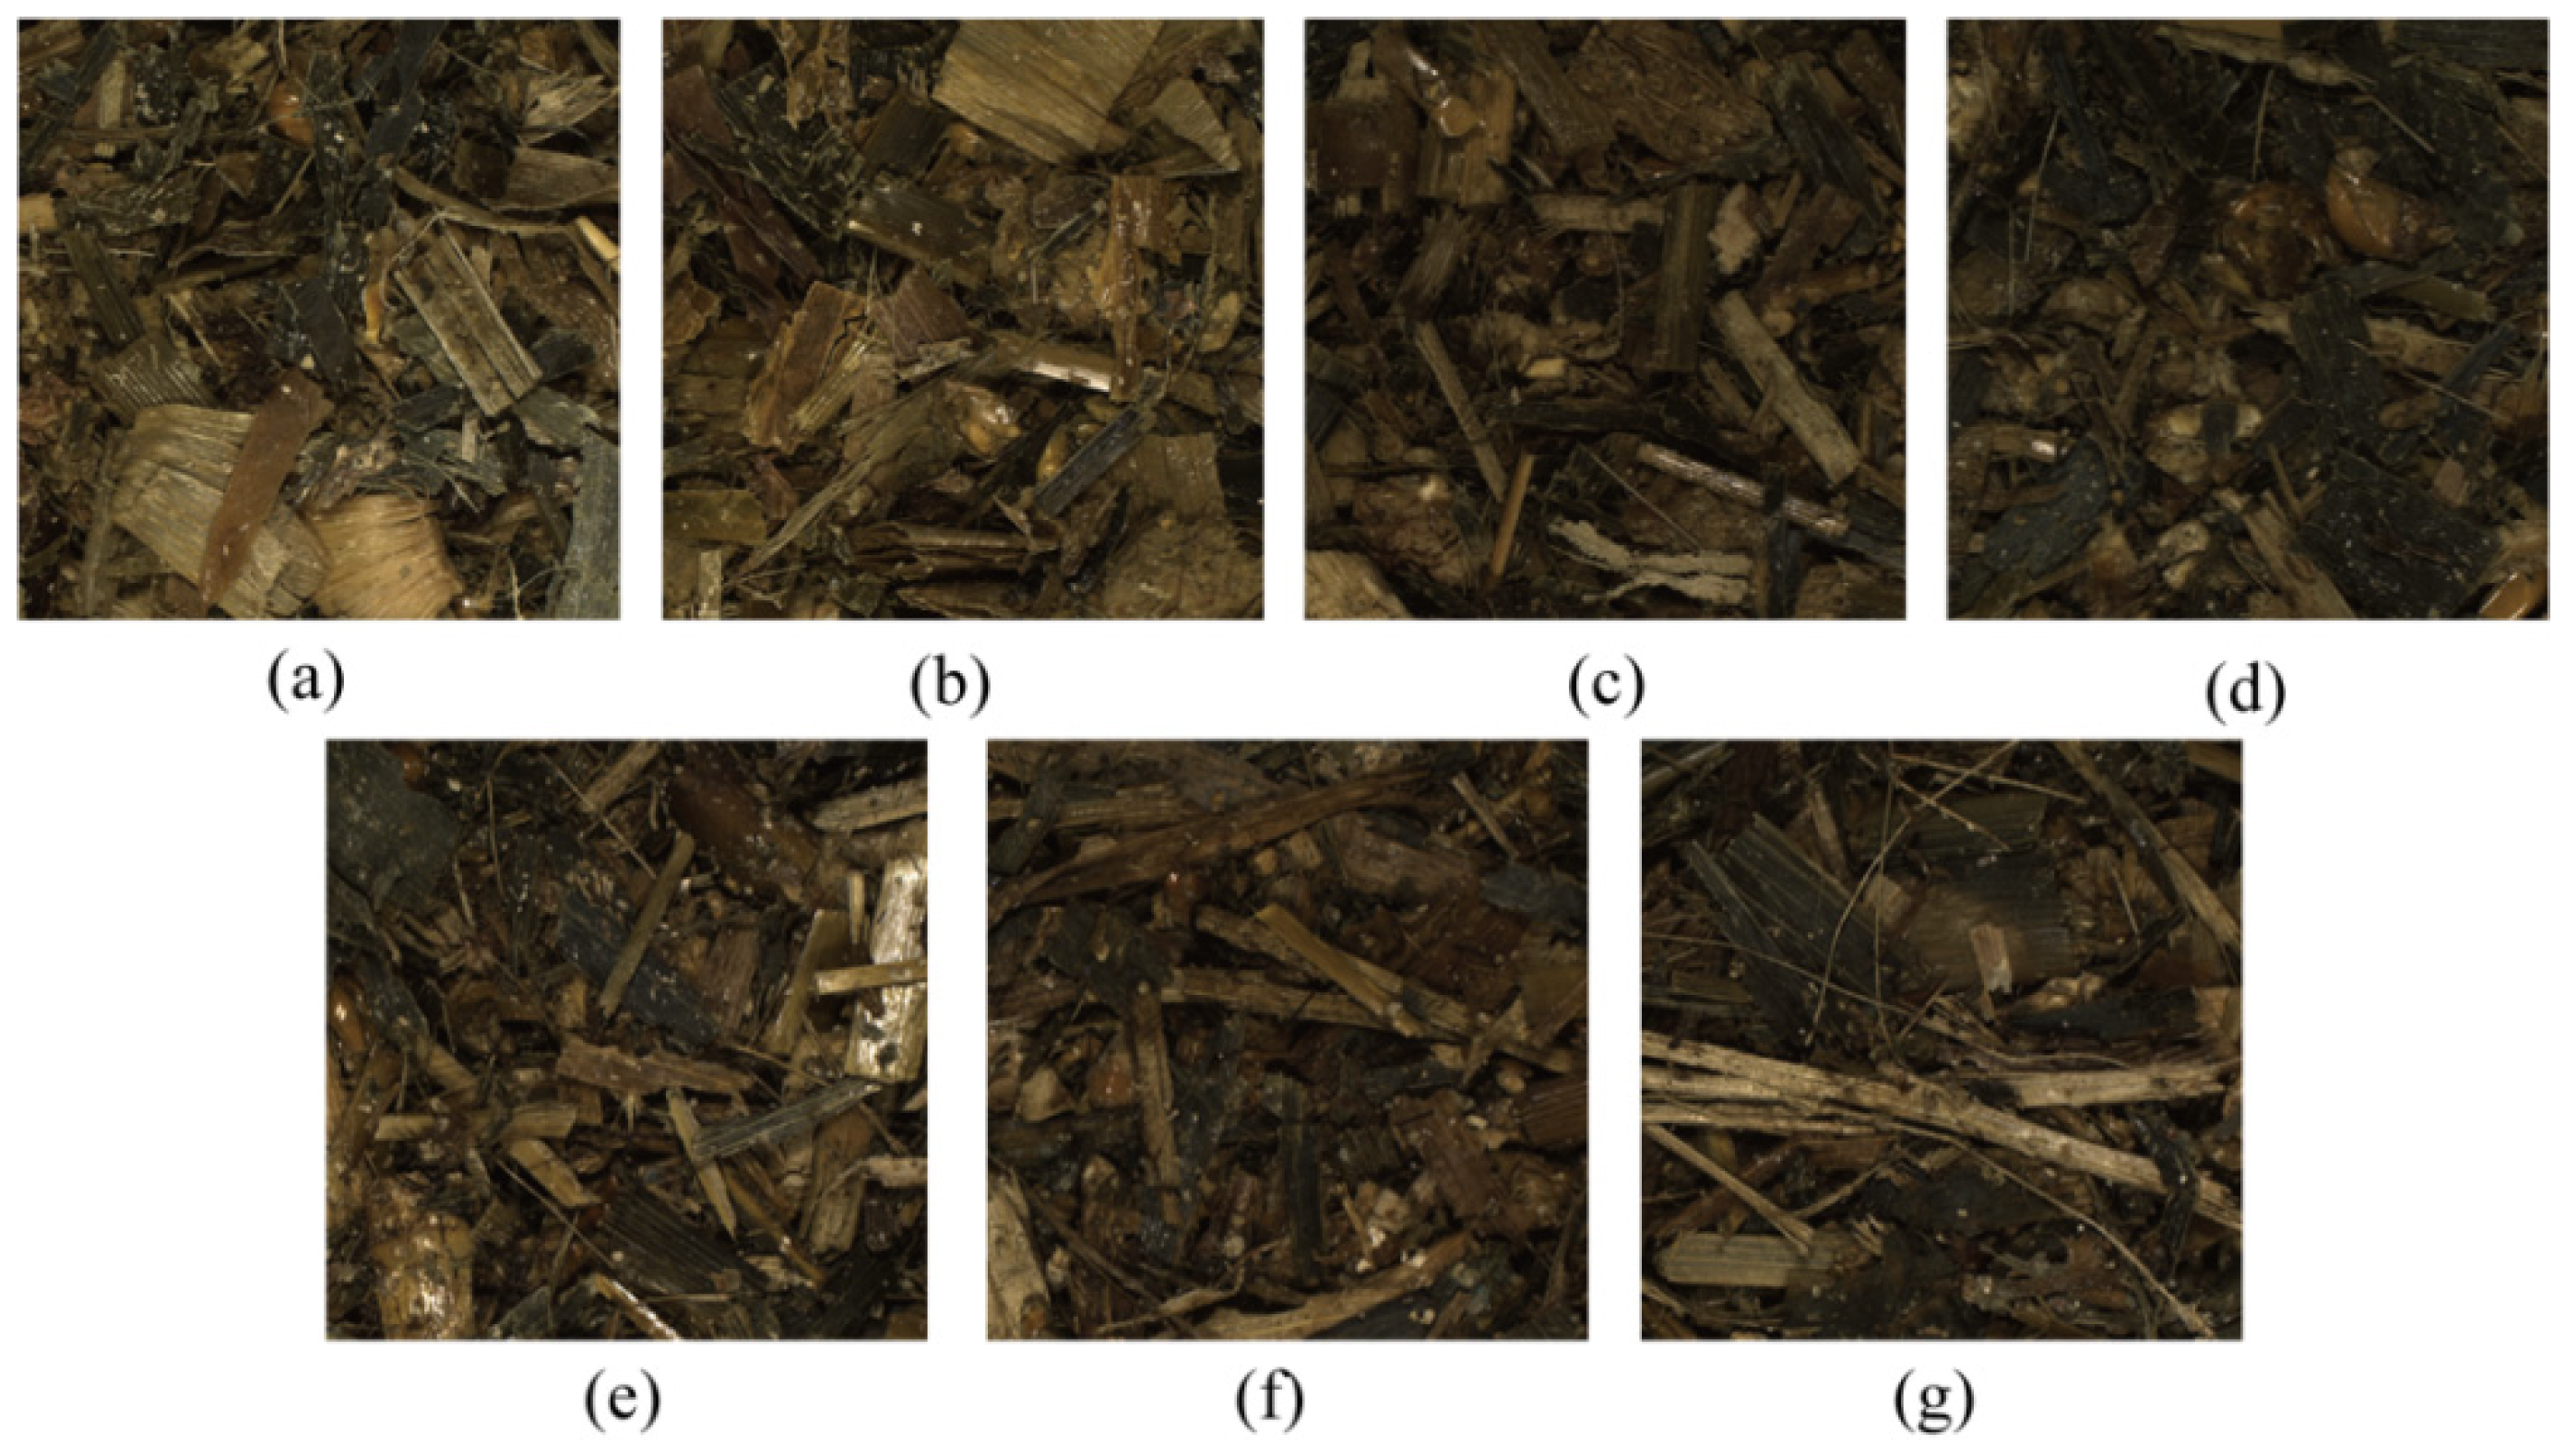
Figure 4 illustrates progressive changes in the visible appearance of maize silage during the 7-day aerobic exposure period. Samples at days 0–1 generally exhibited brighter coloration and relatively intact visible structure. Gradual darkening and increasing color heterogeneity became apparent at days 2–3, followed by more pronounced dark spots, aggregation, and surface heterogeneity at days 4–6. These temporal changes occurred alongside changes in the selected image descriptors and measured mycotoxin concentrations and are consistent with progressive fungal deterioration reported in previous studies. However, the images alone do not permit objective identification of specific fungal developmental stages such as spore germination, hyphal penetration, conidiogenesis, or mature colony formation.
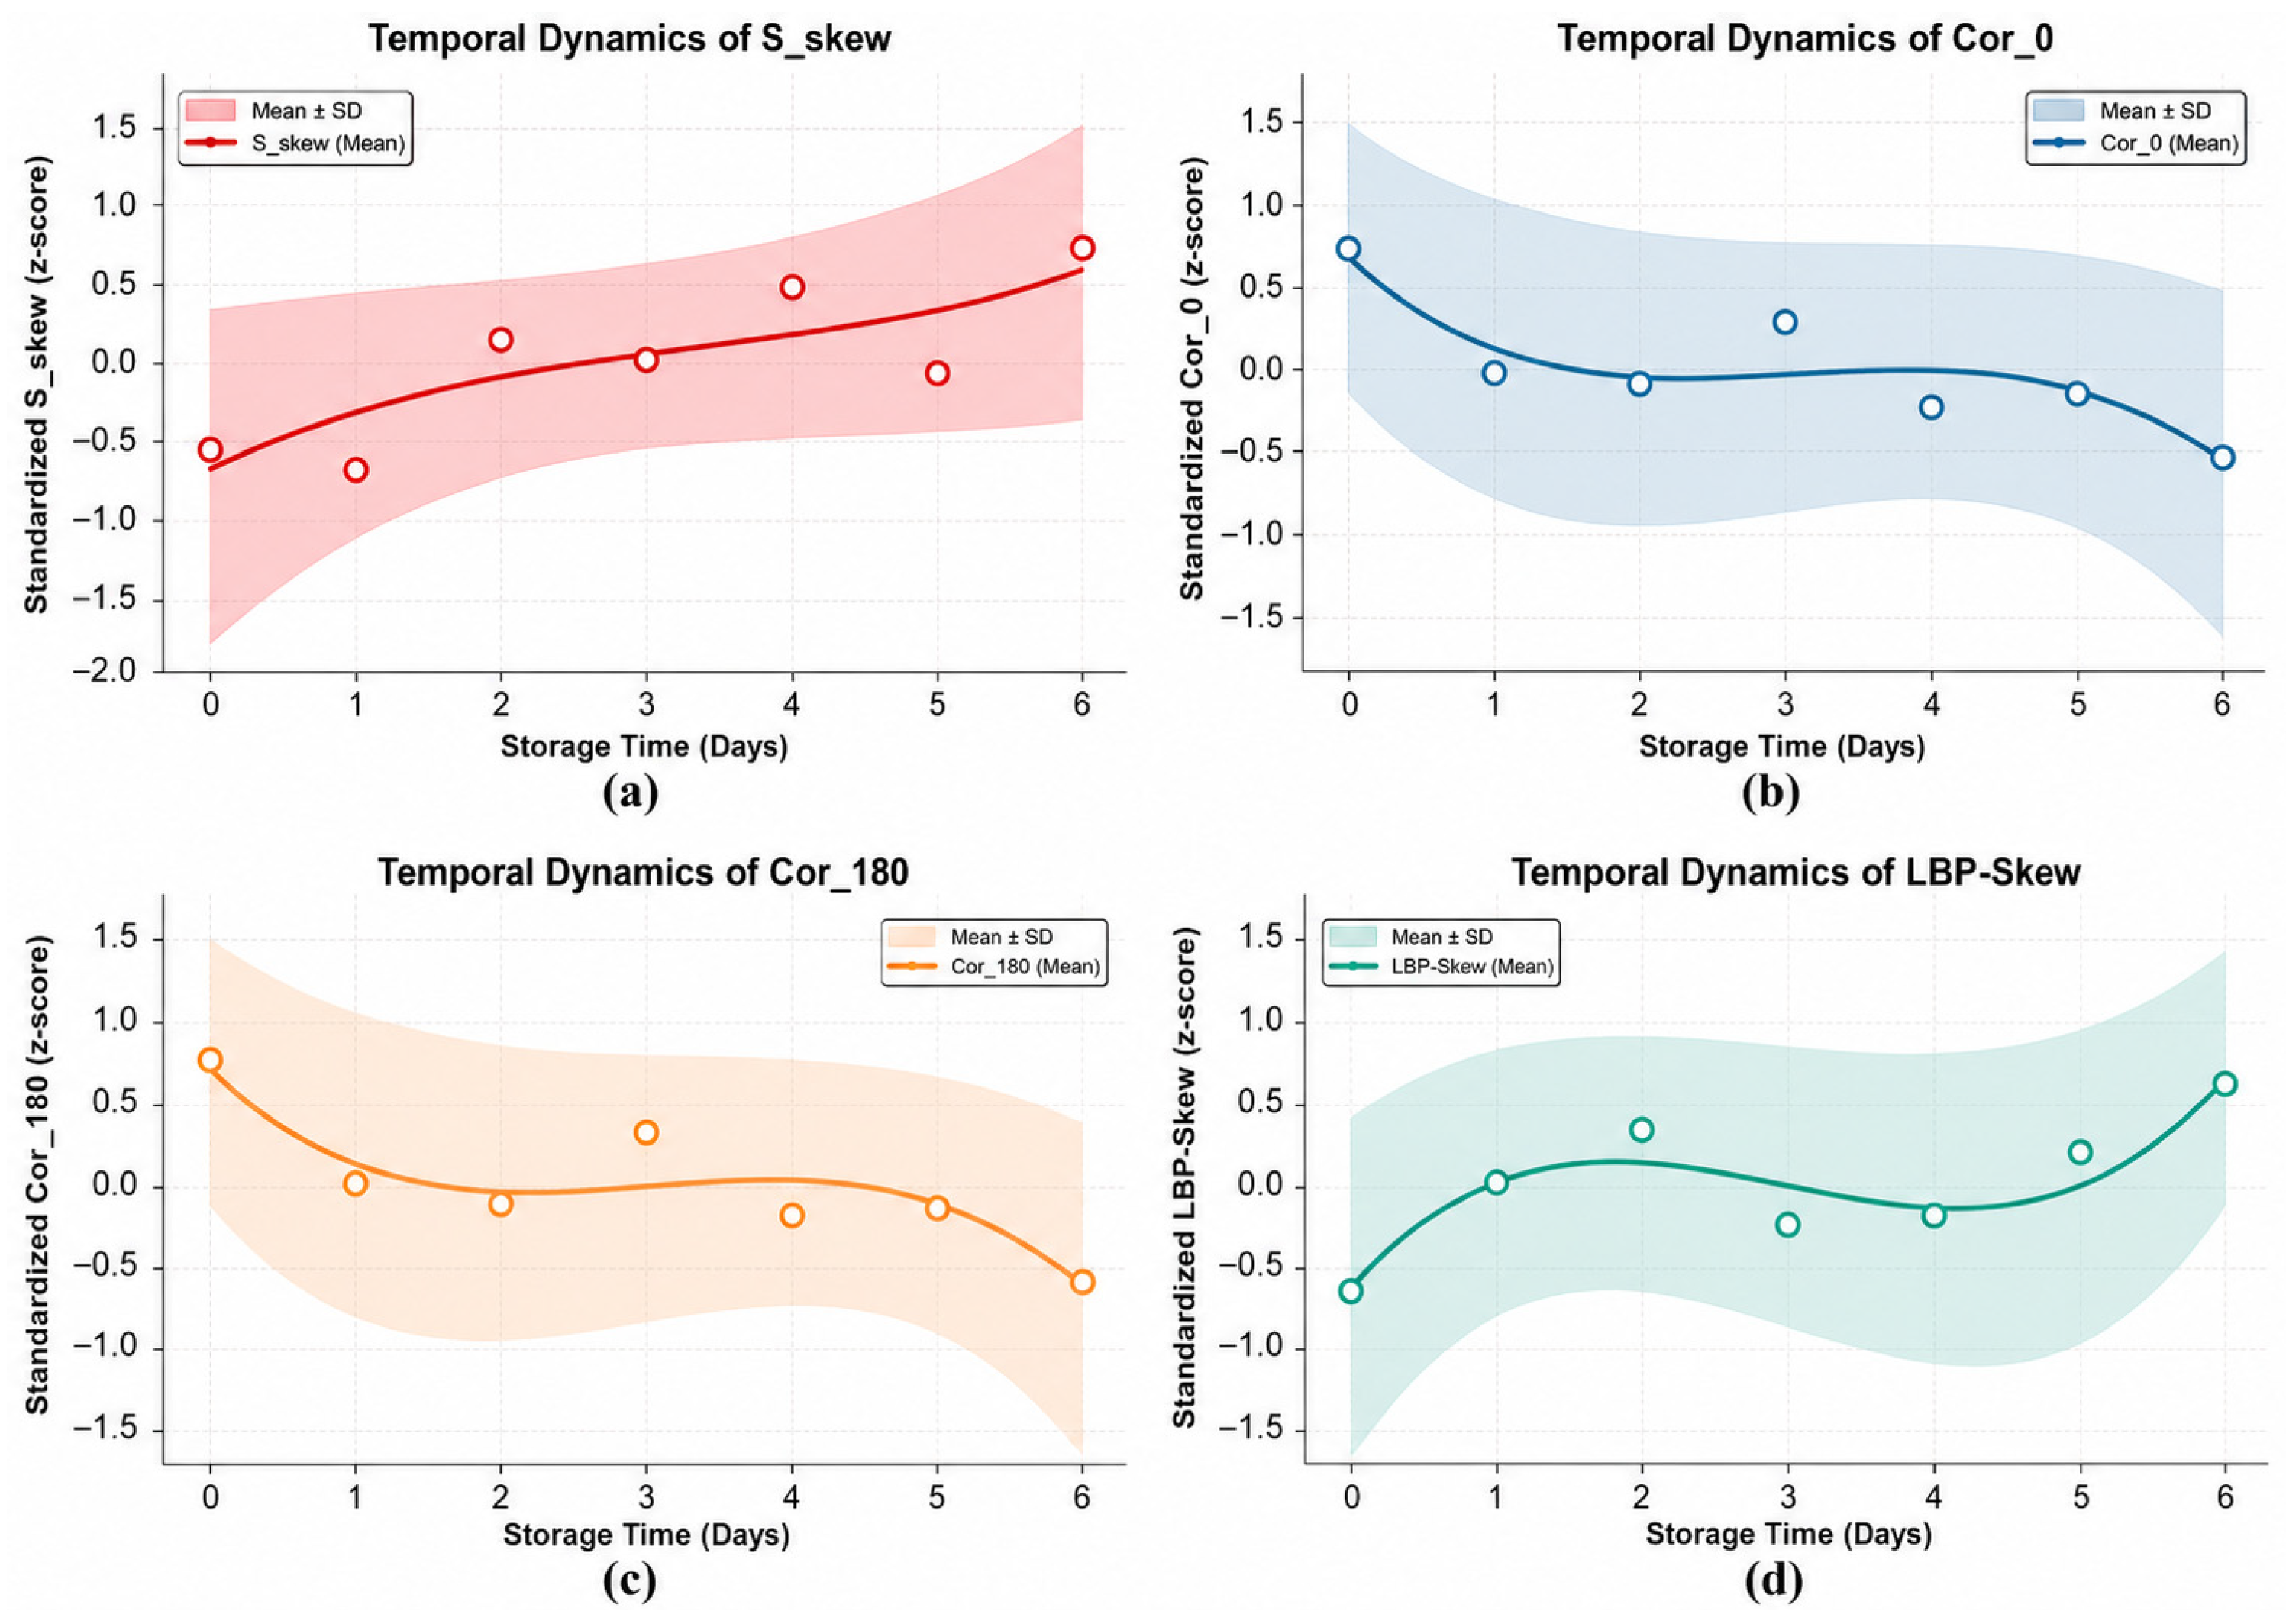
Representative image features identified by the correlation analysis were z-score standardized and tracked across the aerobic exposure period. As shown in Figure 5, S_skew generally increased, indicating greater asymmetry and heterogeneity in the saturation distribution, whereas Cor_0 and Cor_180 generally decreased, indicating changes in spatial gray-level relationships. LBP-Skew also varied over time, reflecting changes in the local texture distribution. The earlier changes observed in selected texture descriptors than in color descriptors may reflect early alterations in surface organization before stronger pigmentation and browning-related signals emerged. These interpretations are consistent with reported fungal deterioration processes, but they cannot be assigned to specific fungal developmental stages because fungal growth, sporulation, pigmentation, and substrate structure were not independently measured. These temporal response differences provided an empirical and biologically interpretable basis for subsequent feature selection and model analysis.

3.2. Quantitative Prediction Models

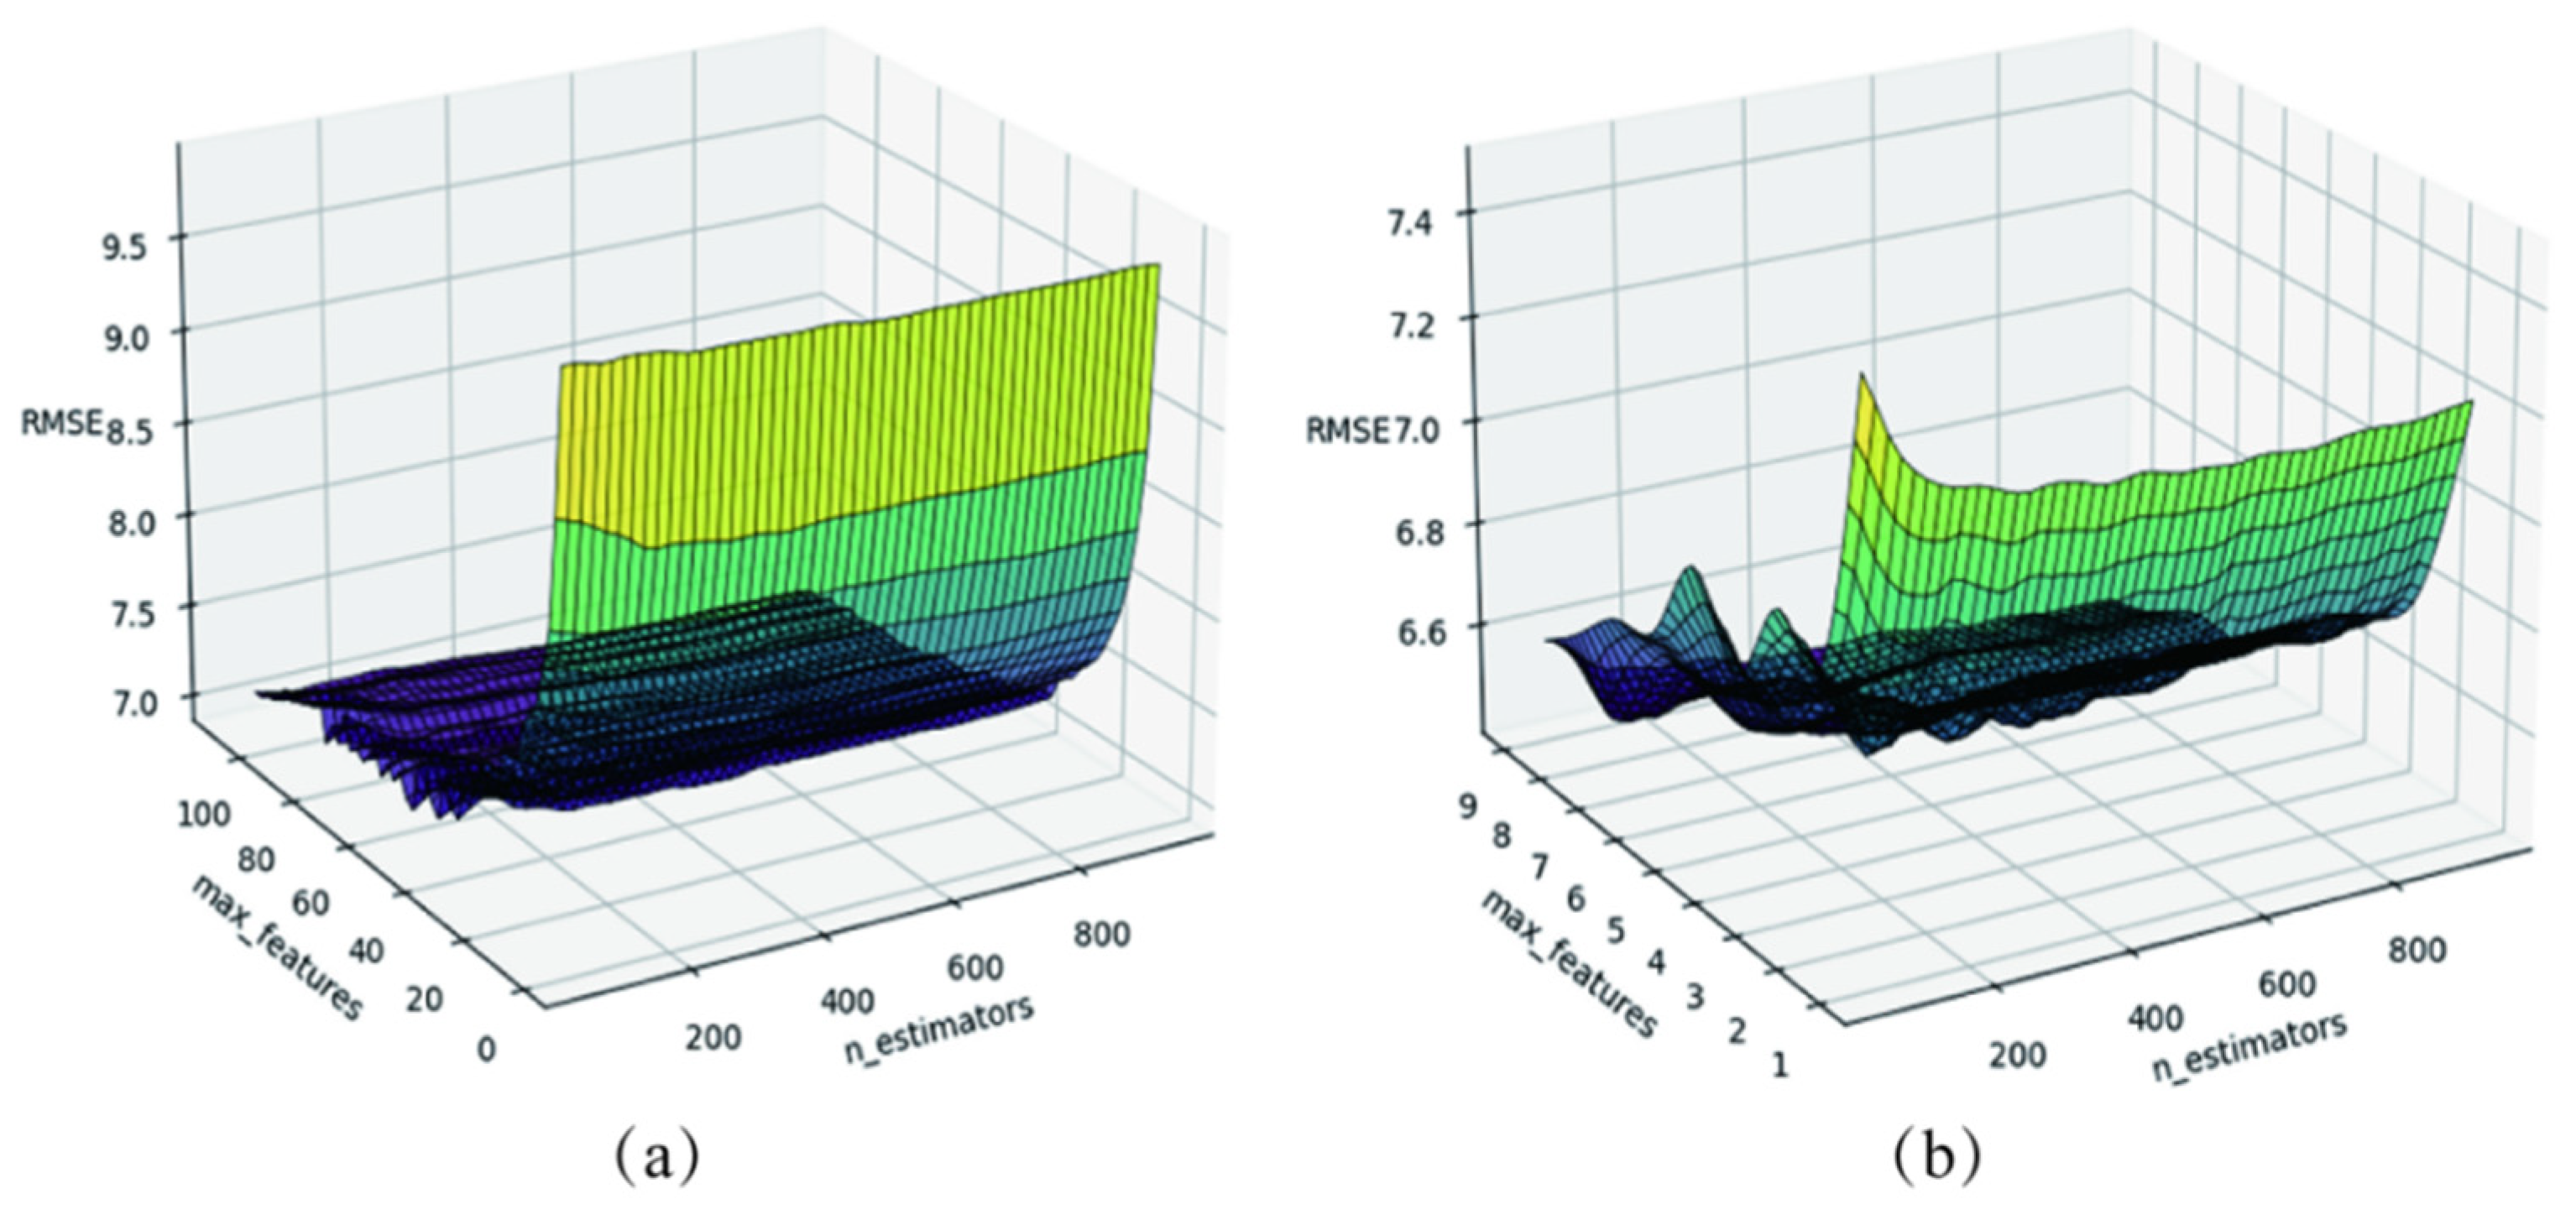
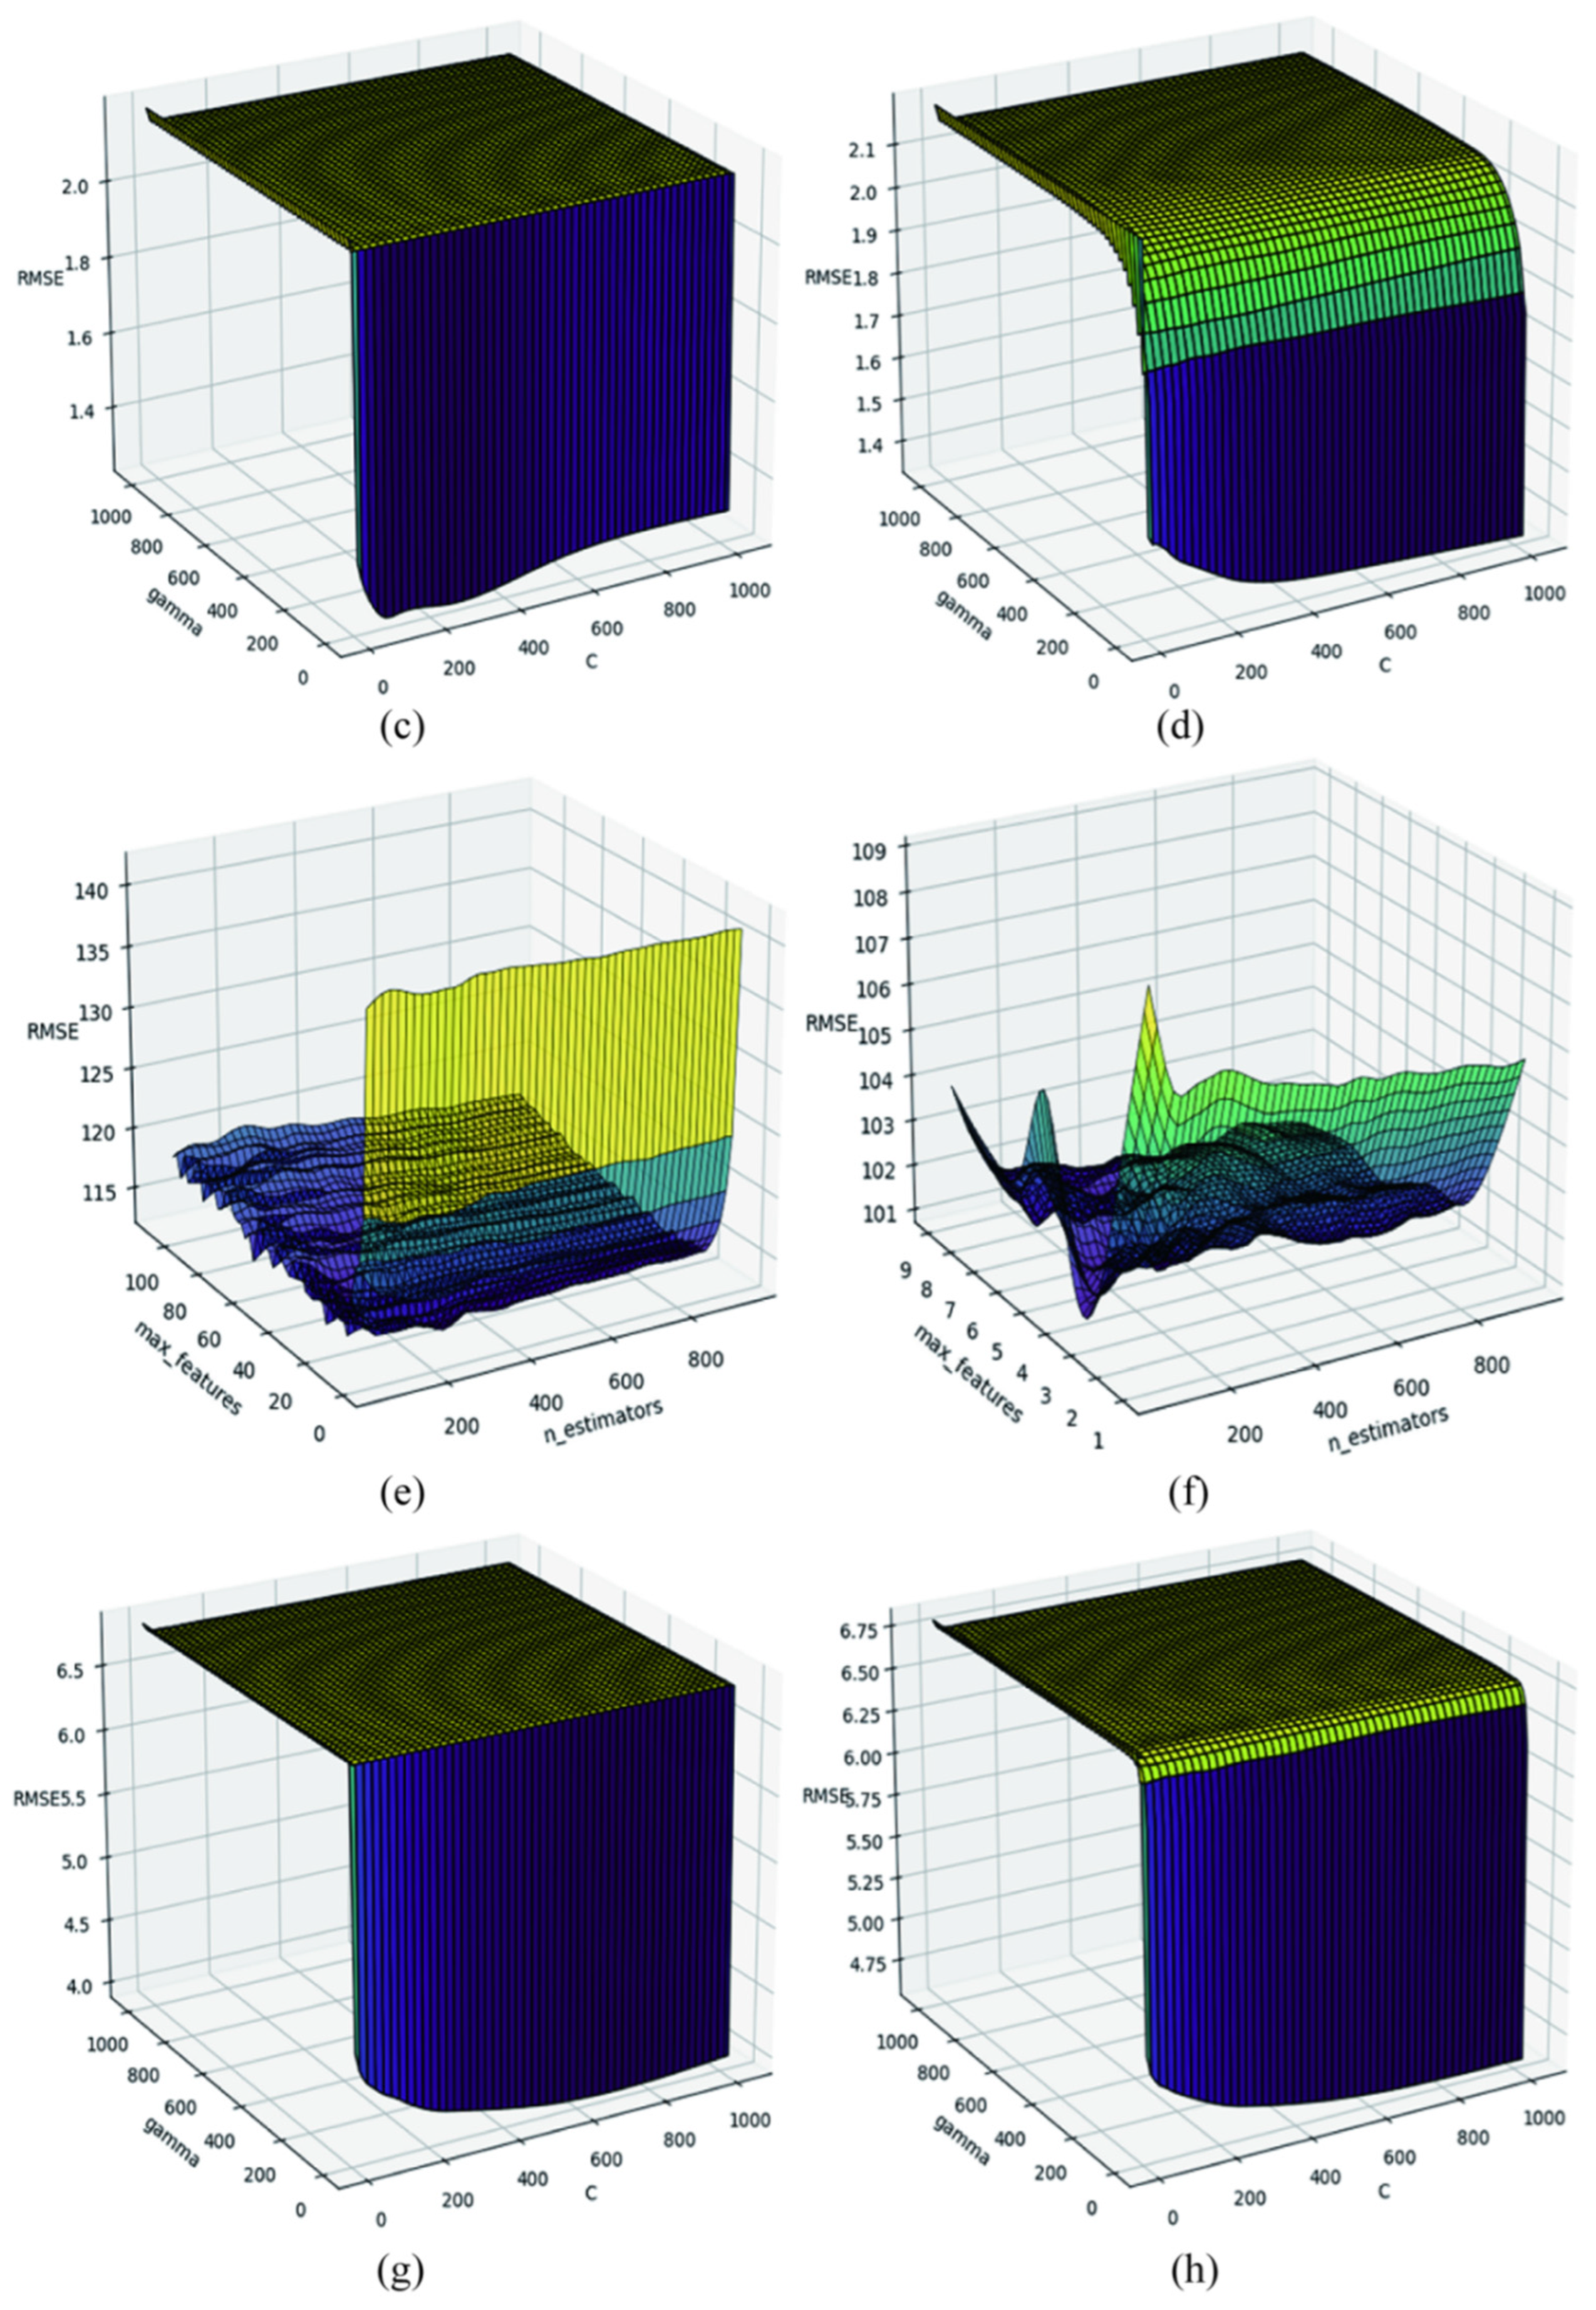
Three regression models (RFR, SVR, and XGBoost) were used to predict AFB1 and DON concentrations. Hyperparameter optimization was performed using grid search with five-fold cross-validation. The tuning procedure and the resulting optimal hyperparameter configurations are shown in Figure 6 and Table 3, respectively. The ten key features selected for each model are presented in Table 4.
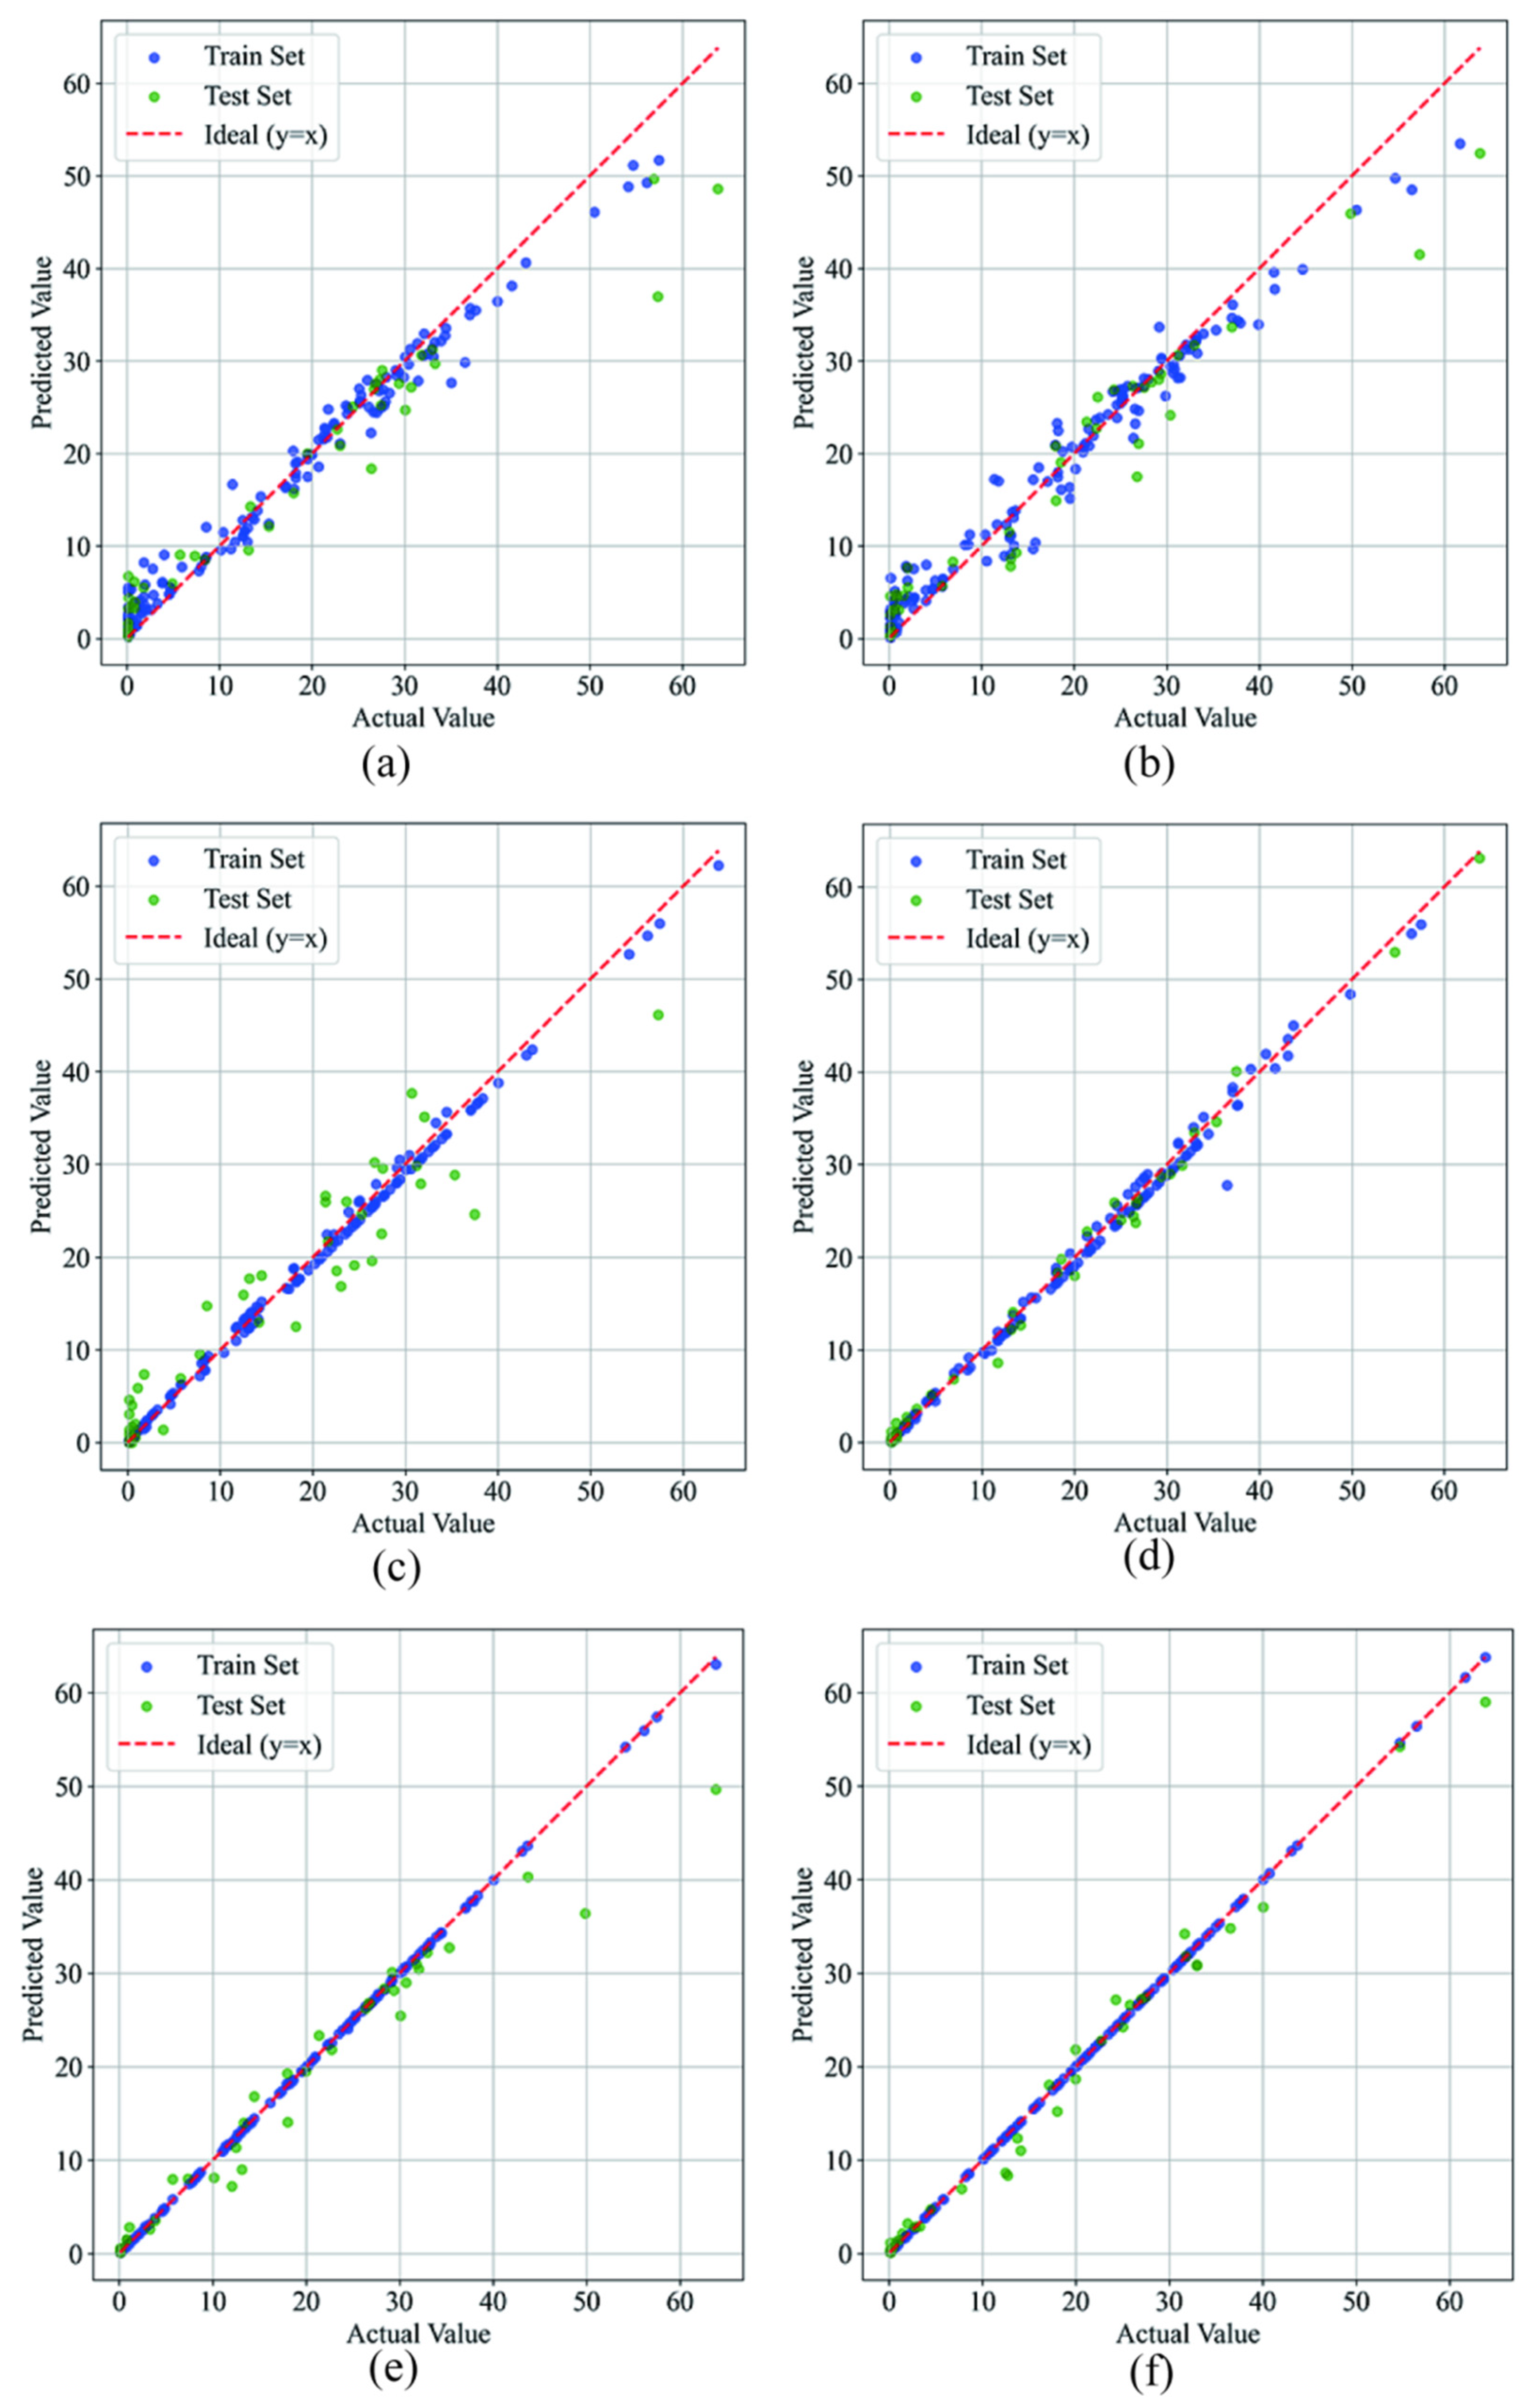
The predictive performance of the models for AFB1 concentration is summarized in Table 5, and the regression plots of predicted versus actual values for each model are illustrated in Figure 7, providing a visual evaluation of prediction accuracy and fitting performance. In the modeling scenario using all features (Model 1), the XGBoost Model 1 exhibited the best performance (R2 = 0.9497, RMSE = 3.9939 µg·kg−1, RPD = 3.9387), followed by RFR Model 1 (R2 = 0.9146, RMSE = 4.9371 µg·kg−1, RPD = 3.4637), while SVR Model 1 performed relatively poorly (R2 = 0.8944, RMSE = 4.5194 µg·kg−1, RPD = 3.1139). Based on these selected features, optimized models (Model 2) were constructed. The optimized SVR Model 2 achieved the best performance, with R2 = 0.9945, RMSE = 3.1794 µg·kg−1, and RPD = 5.0669. The RFR and XGBoost Models showed slightly lower performance, with R2 values of 0.9272 and 0.9885, respectively. These results highlight the significant impact of feature optimization on detection accuracy.
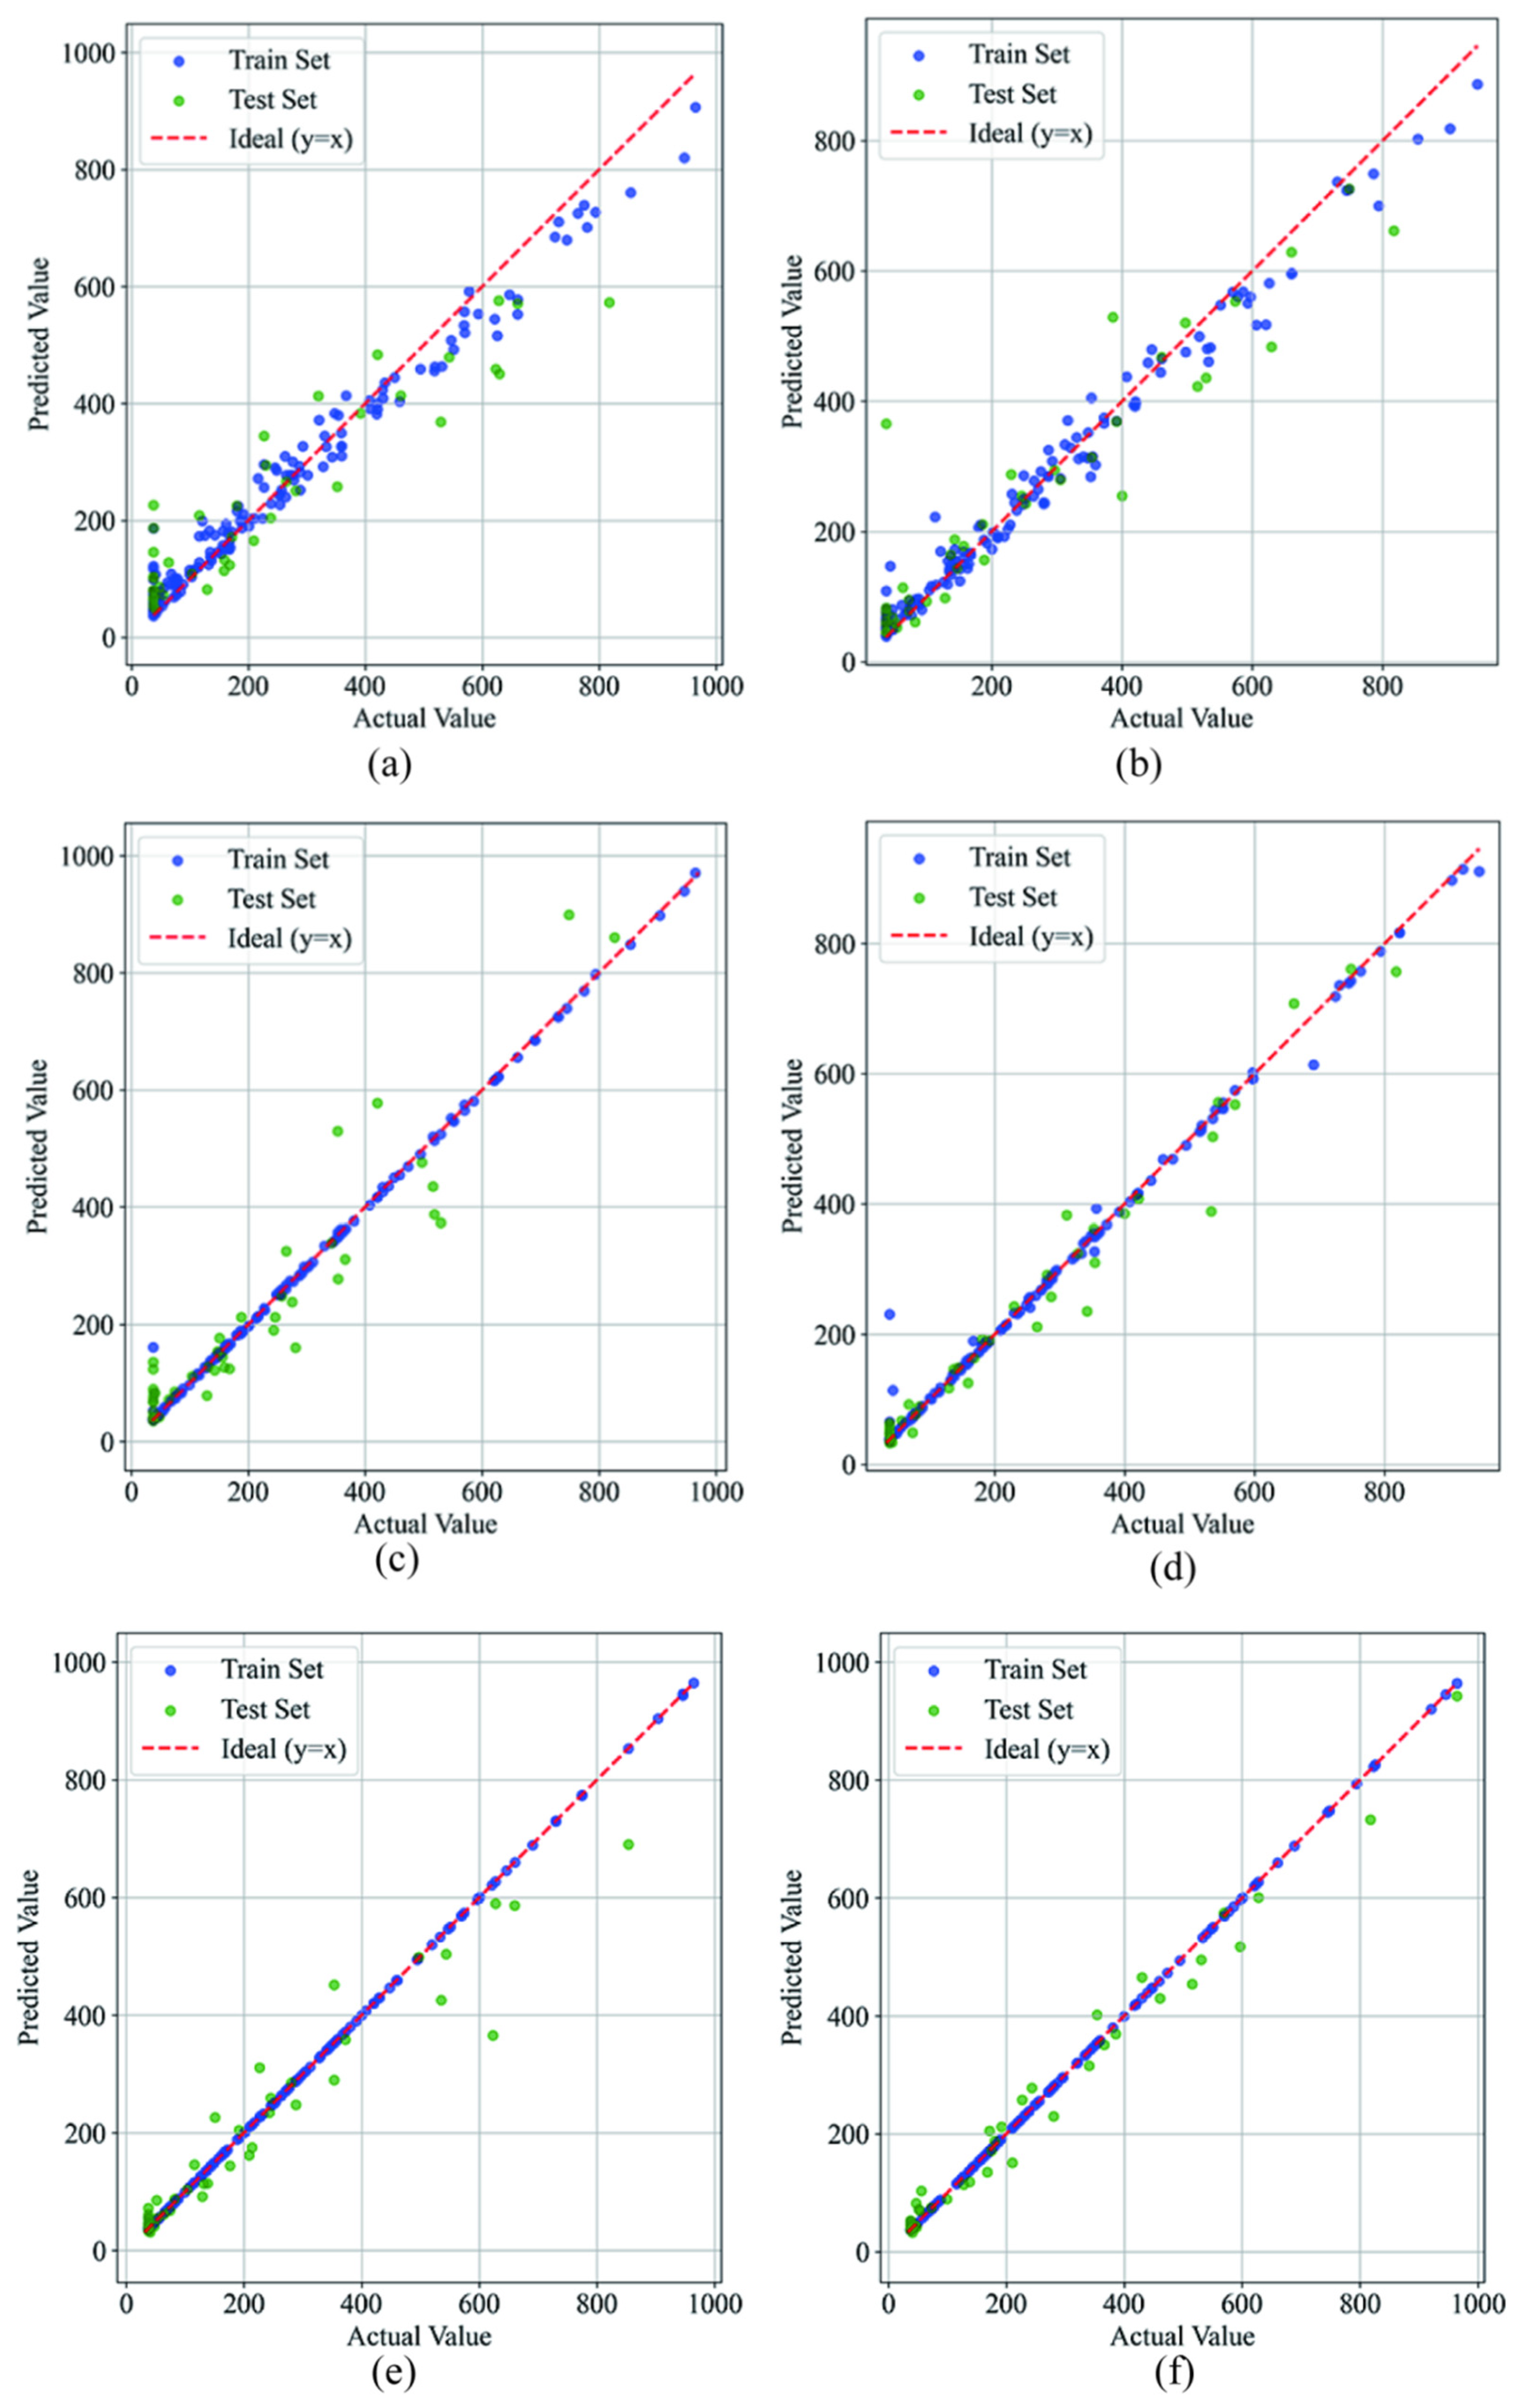
The prediction results for DON are summarized in Table 5, and the regression relationships between predicted and actual values for each model are illustrated in Figure 8, providing a visual assessment of modeling accuracy and fitting performance. In the modeling scenario using all features (Model 1), the XGBoost Model 1 exhibited the best performance (R2 = 0.9163, RMSE = 60.6055 µg·kg−1, RPD = 3.4987), followed by RFR Model 1 (R2 = 0.8405, RMSE = 86.3705 µg·kg−1, RPD = 2.5339) and SVR Model 1 (R2 = 0.8820, RMSE = 68.0665 µg·kg−1, RPD = 2.9465). As shown in Table 4, feature selection based on importance ranking significantly improved model performance. Among them, the SVR Model 2 exhibited the most prominent improvement (R2 = 0.9708, RMSE = 46.6408 µg·kg−1, RPD = 4.6567), followed by XGBoost Model 2 (R2 = 0.9816, RMSE = 45.5023 µg·kg−1, RPD = 5.1663), while RFR Model 2 also showed a notable enhancement (R2 = 0.8849, RMSE = 75.0753 µg·kg−1, RPD = 2.9828).

3.3. Classification Models

To address this challenge, regulatory authorities worldwide have established strict thresholds for AFB1 and DON in animal feed. Maximum allowable concentrations typically range from 20 µg·kg−1 (AFB1) and 1000–5000 µg·kg−1 (DON) across major markets including China, the European Union, and the United States [39]. These thresholds underscore the necessity of accurate and rapid quantification of AFB1 and DON in maize. To enable early warning, this study followed the statutory limits specified in GB 13078-2017 for AFB1 (20 µg·kg−1) and DON (1000 µg·kg−1), and set one-quarter of each limit—AFB1 > 5 µg·kg−1 and DON > 250 µg·kg−1—as the alert threshold for identifying potential contamination [40].
To enable rapid identification and automated classification of mycotoxin contamination levels in maize silage, this study constructed three classification models—RF, SVM, and XGBoost. The models were built using key image features selected during the quantitative prediction phase. Their classification performance for AFB1 and DON contamination levels was systematically evaluated and compared.
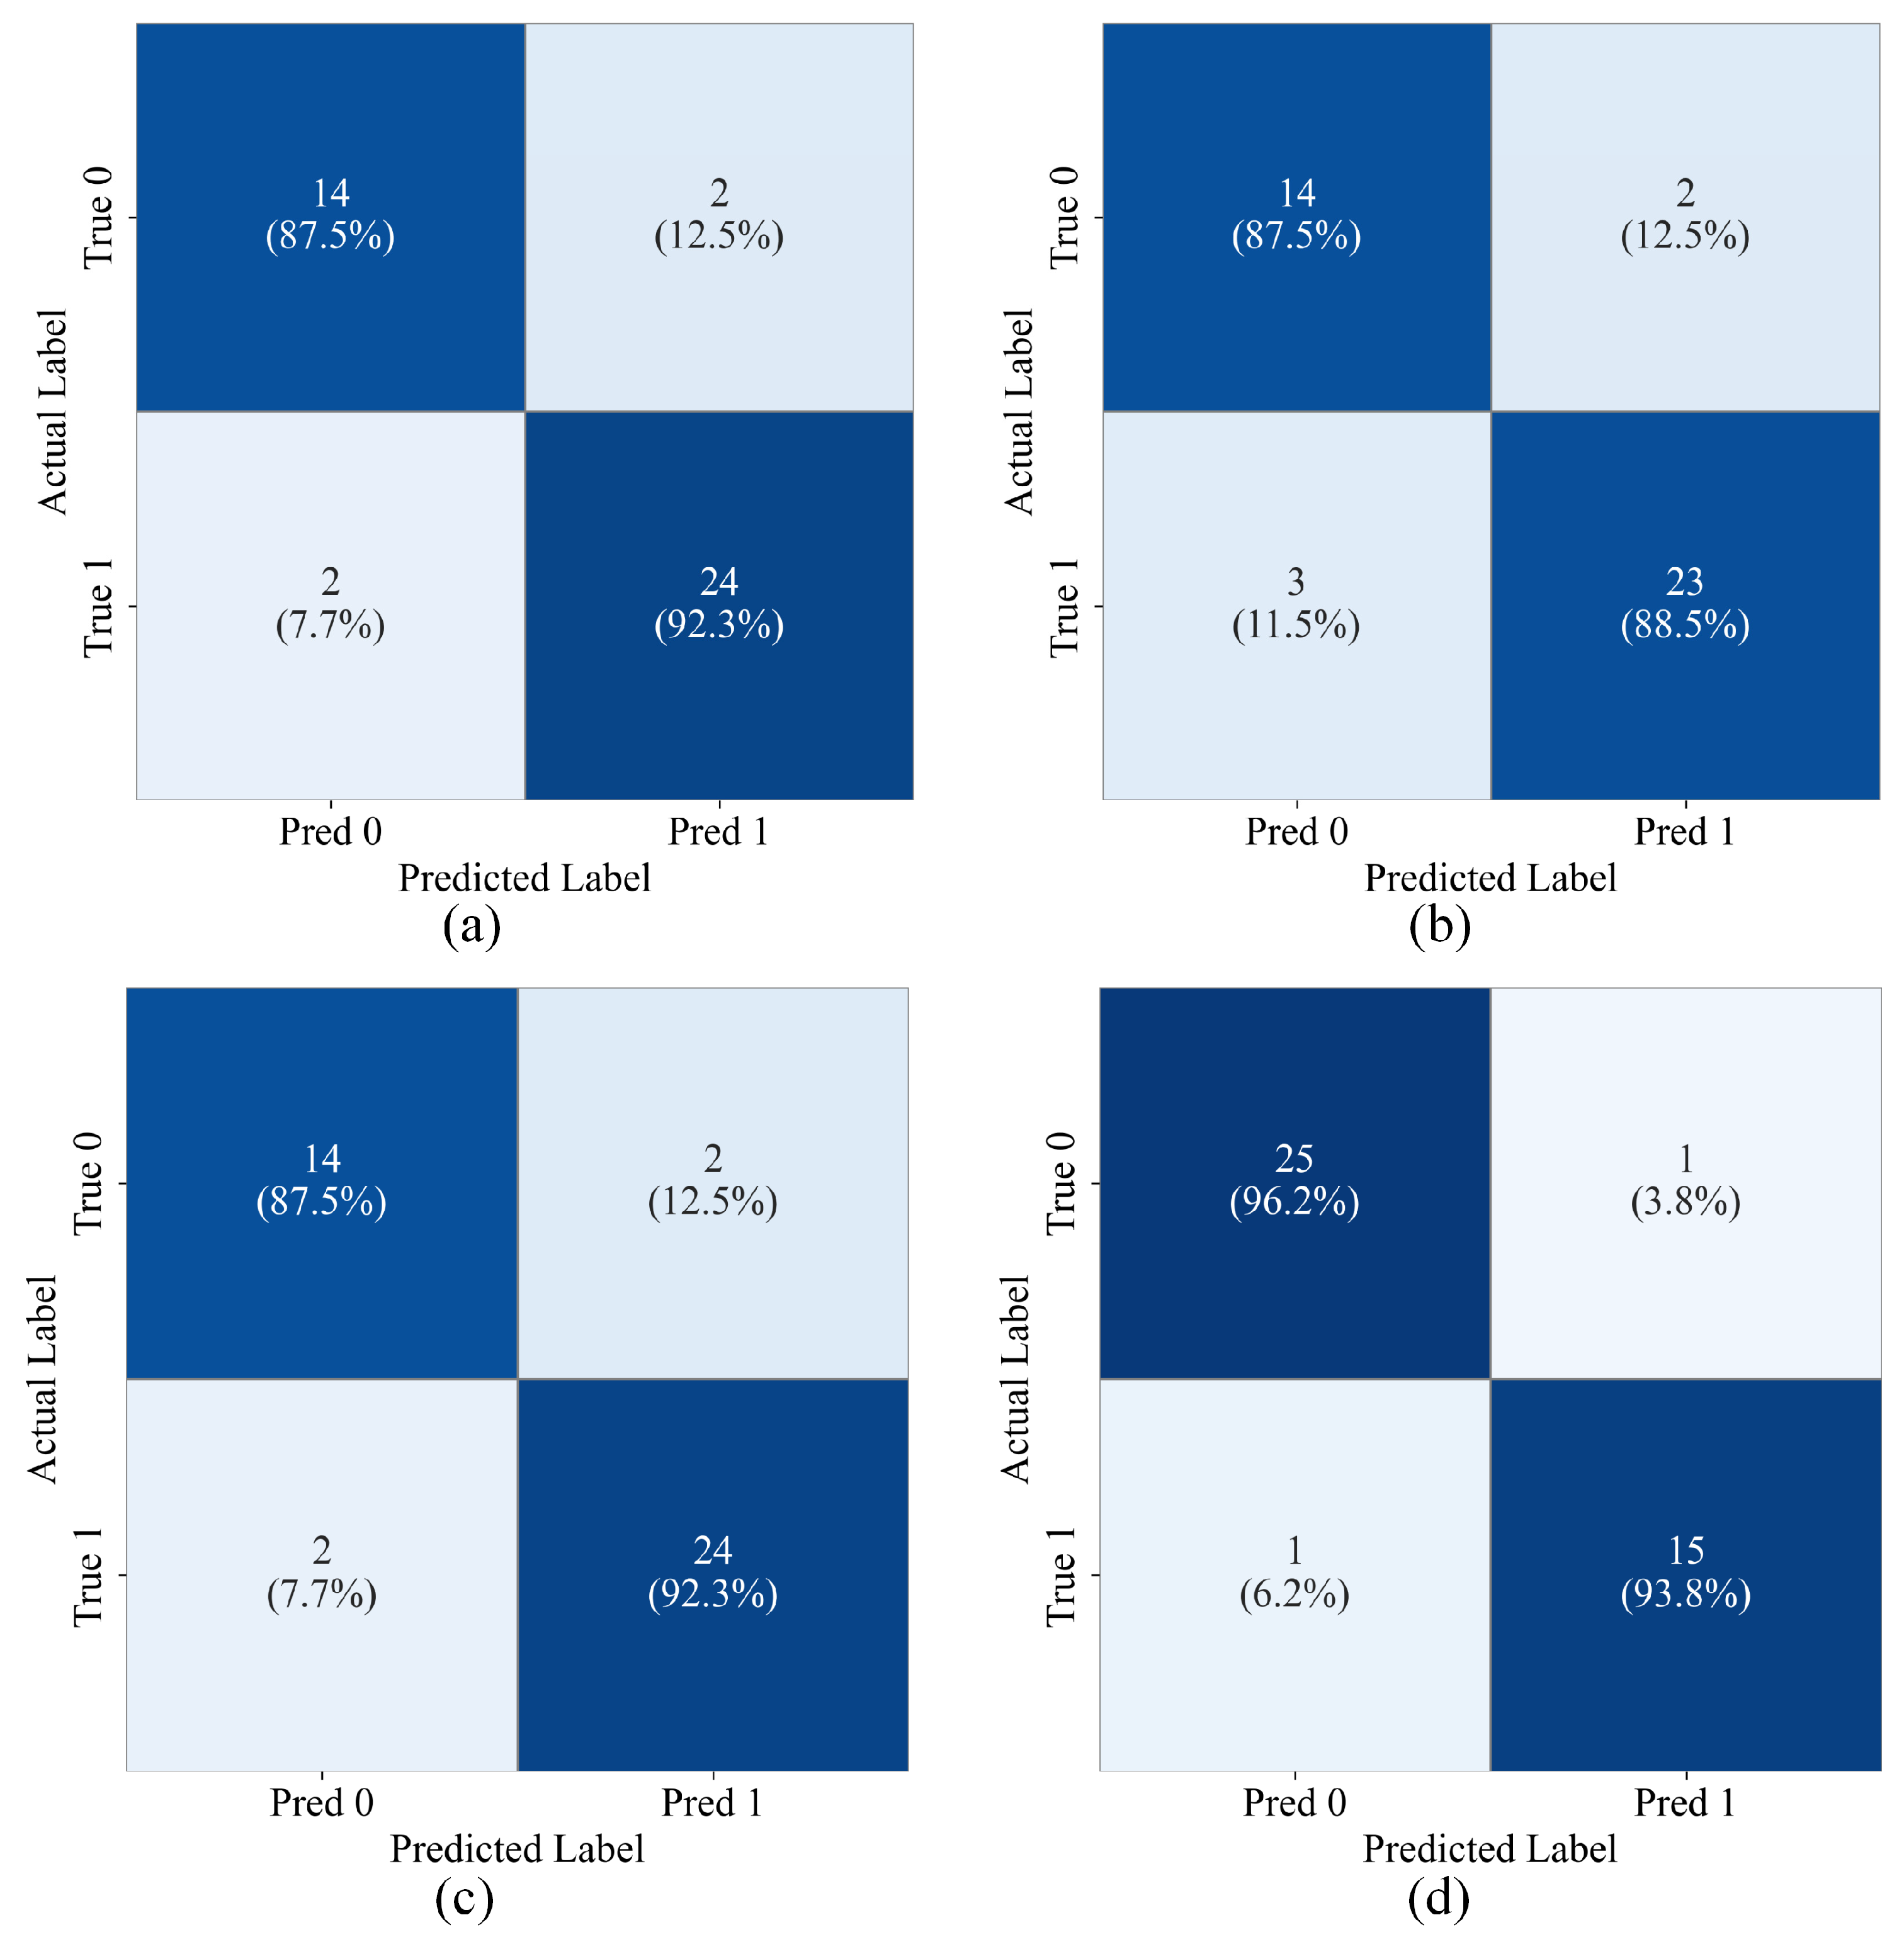
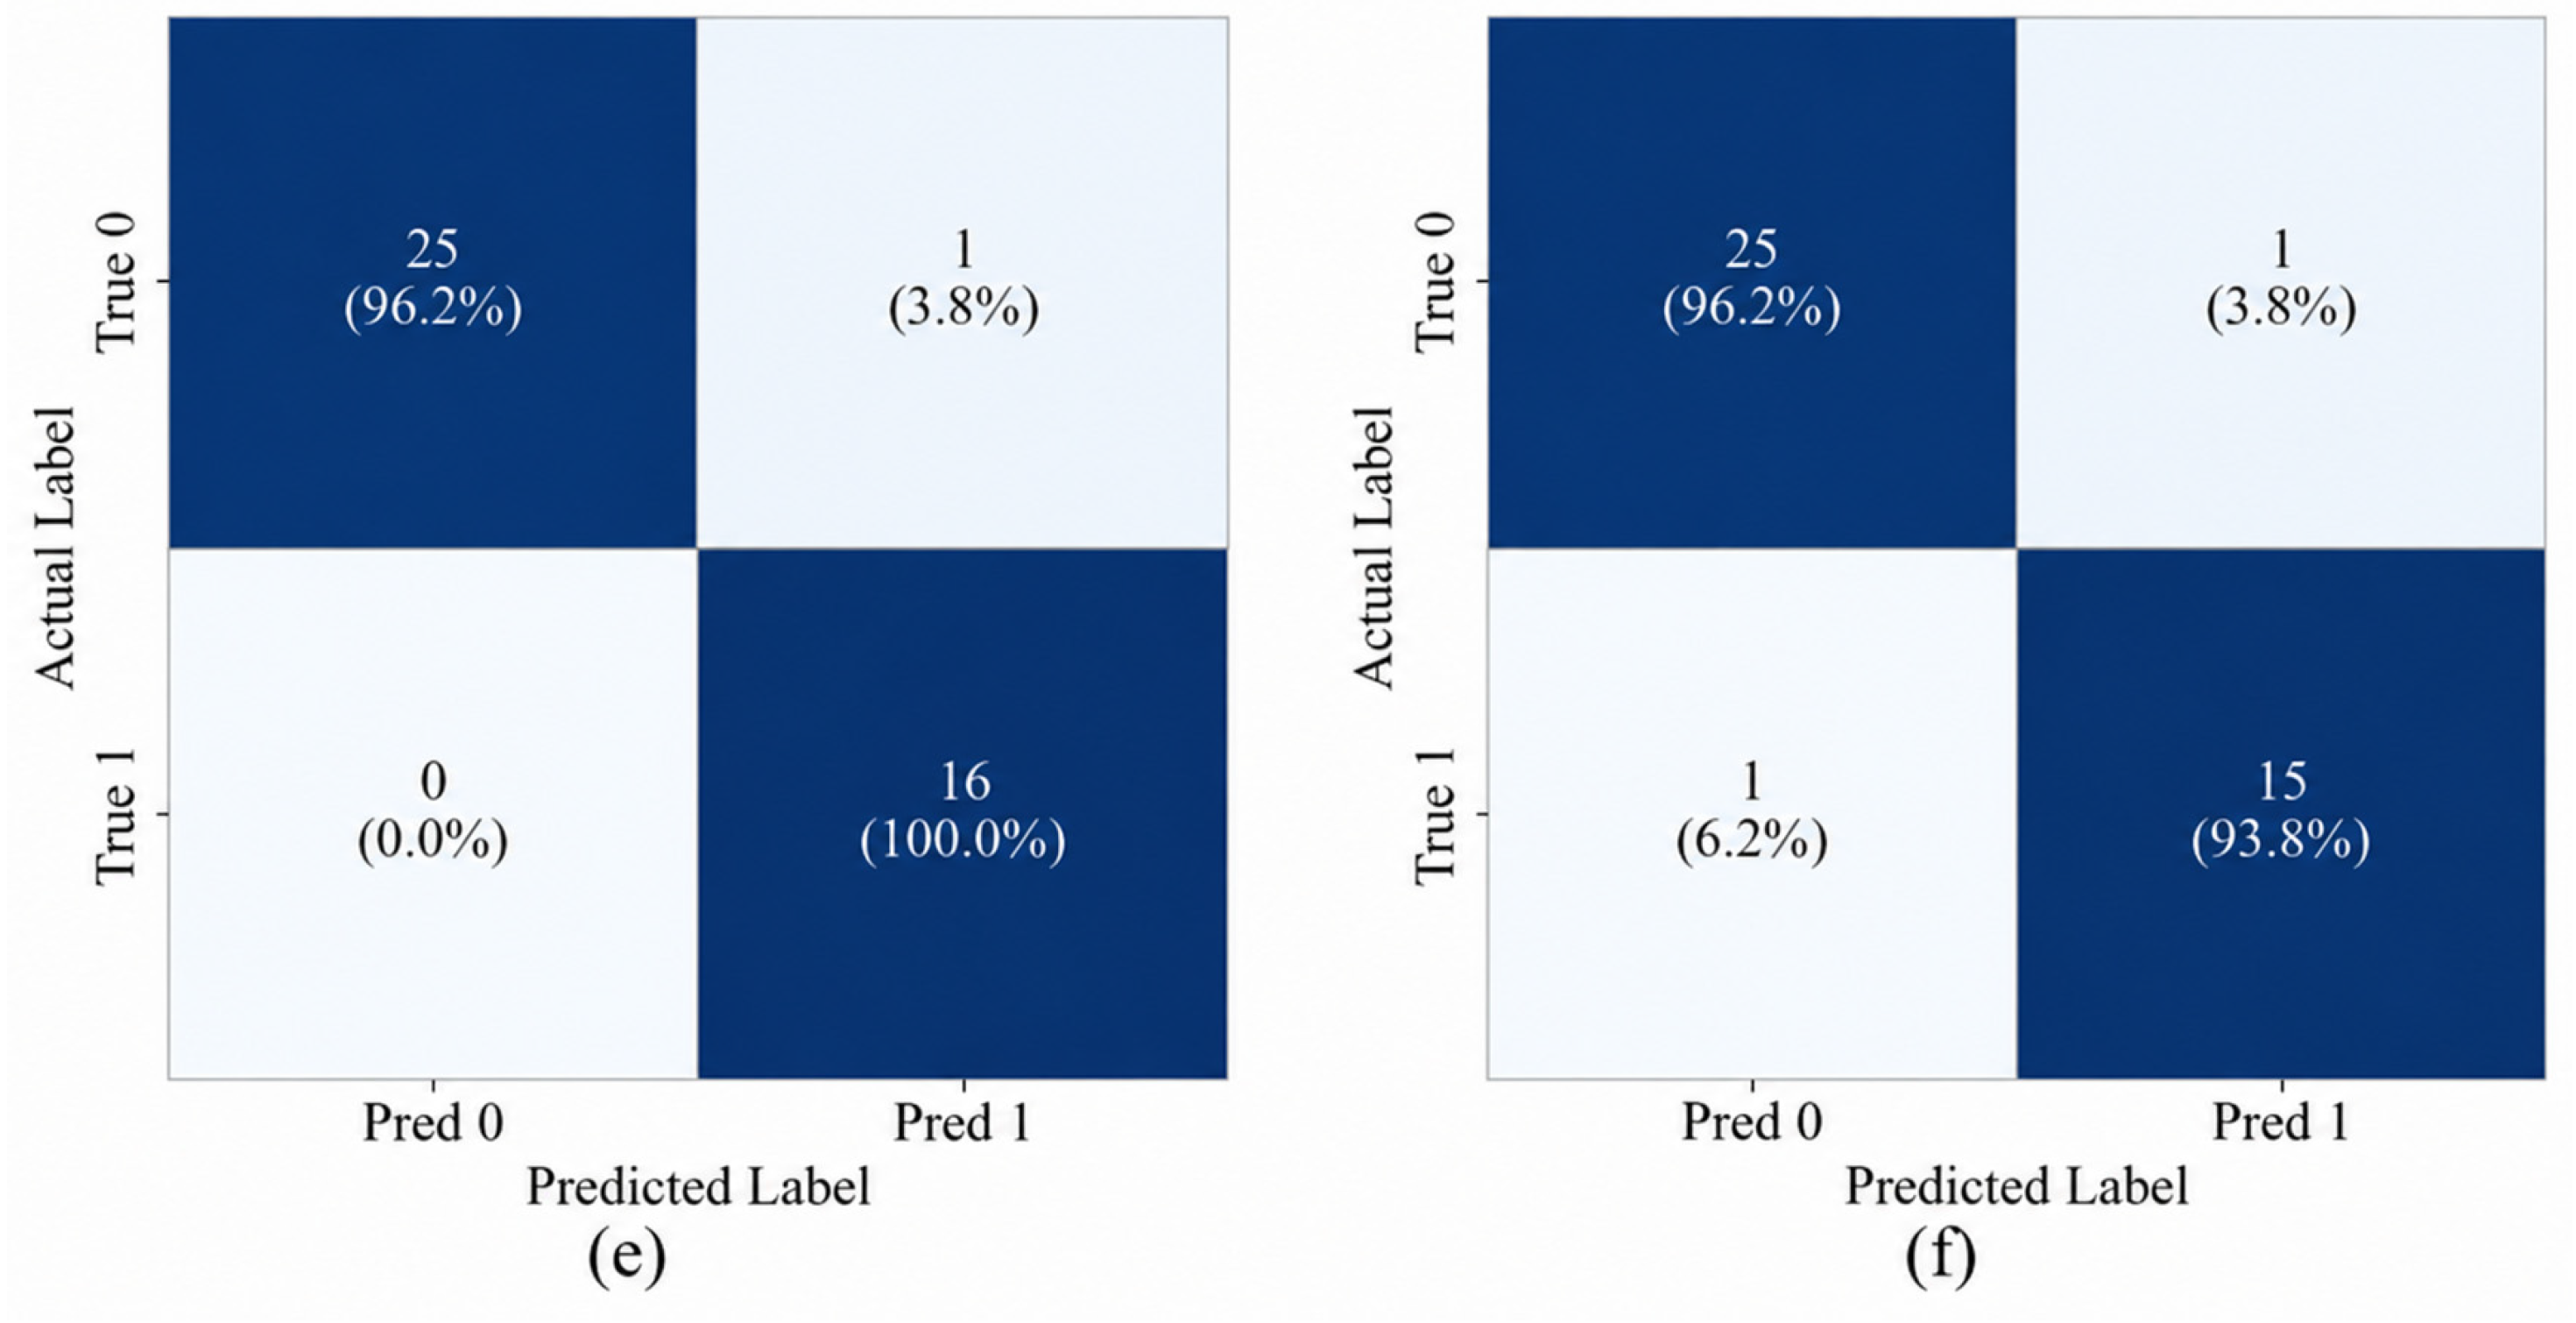
For AFB1 contamination classification, RF and XGBoost models demonstrated superior performance, both achieving test Accuracy of 90.48%, Precision of 92.31%, Se of 92.31%, and Sp of 87.50% (Table 6, Figure 9a–c). The F1-scores of 92.31% for both models indicate excellent balance between precision and recall. In comparison, SVM achieved slightly lower performance with Accuracy of 88.10%, Precision of 92.00%, Se of 88.46%, and F1-score of 90.20%, while maintaining the same Sp of 87.50%. Both RF and XGBoost exhibited consistent performance across all evaluation metrics.
For DON contamination classification, SVM model achieved the highest Accuracy of 97.62%, with perfect Se of 100%, indicating no missed detections (Table 6, Figure 9d–f). SVM exhibited Precision of 94.12%, Sp of 96.15%, and F1-score of 96.97%, XGBoost demonstrated competitive performance with Accuracy of 95.24%, Precision of 93.75%, Se of 93.75%, Sp of 96.15%, and F1-score of 93.75%. Similarly, RF model achieved Accuracy of 95.24% with Precision of 93.75%, Se of 93.75%, and Sp of 96.15%. The 100% Se achieved by SVM indicates complete detection of all contaminated samples in the test set.
These results demonstrate that the proposed machine vision-based classification approach achieves high accuracy for mycotoxin detection in maize silage. Model selection should consider the specific application requirements: RF and XGBoost offer balanced performance for AFB1, while SVM provides perfect sensitivity for DON, making it suitable for critical safety monitoring systems.

4. Discussion

Comparing the Pearson correlation analysis (Figure 3) with the model-selected features (Table 4) reveals both convergent and divergent patterns between univariate statistical significance and multivariate predictive importance. For AFB1, several features exhibited high rankings in both analyses: LBP-Kur, a*_std, GB, and EXG showed strong Pearson correlations with toxin concentration and were consistently selected among the top 10 predictors across all three regression models (RFR, SVR, and XGBoost). This convergence supports the statistical and predictive relevance of these features for visual variation associated with AFB1 contamination. Based on previous reports, such variation may be partly related to pigmentation and surface changes accompanying colonization by toxigenic Aspergillus species. Similarly, for DON, H_std, S_skew, DWT-B4-cV, and DWT-R4-cD demonstrated high Pearson correlations and appeared consistently in the model-selected feature sets, supporting their dual roles as statistically significant indicators and effective predictors of DON-associated visual variation. These patterns may be biologically related to deterioration processes associated with toxigenic Fusarium species, although the fungal taxa present in the samples were not determined.
However, notable divergences emerged between the two analytical approaches. Certain features with moderate Pearson correlations were elevated to top predictors by the machine learning models, likely due to their complementary information content and nonlinear interaction effects. For instance, b*_std and EBI ranked among the top 10 model-selected features for AFB1 despite not being among the highest Pearson-correlated features. This suggests that these features, while exhibiting weaker linear associations individually, provide unique discriminative information when combined with other predictors in ensemble or kernel-based models. Conversely, some features with high Pearson correlations (e.g., Con_0, Con_45 for AFB1; Cor_0, Cor_180 for DON) were not consistently selected by all models. This may indicate redundancy with other selected features or limited additive predictive value within the multivariate context. The divergence underscores that Pearson correlation captures only linear, pairwise relationships, whereas the model-based feature selection accounts for feature interactions, redundancy, and nonlinear contributions to prediction accuracy.
Importantly, the model-selected feature combinations integrated both color and texture descriptors for both mycotoxins, confirming the complementary nature of these feature categories. For AFB1, the optimal feature sets combined LBP-based texture descriptors (LBP-Kur, LBP-Skew) with chromatic indices (GB, EXG) and CIE Lab color features (a*_std, b*_std). For DON, wavelet-derived texture features (DWT-B4-cV, DWT-R4-cD) were paired with HSI color space features (H_std, S_skew). This multi-feature fusion strategy, whereby statistically significant individual features are combined into synergistic feature sets, helps explain the substantial improvement in model performance (Model 2 vs. Model 1 in Table 5) and supports a biologically informed interpretation in which effective prediction benefits from jointly characterizing pigmentation-related and surface-structure variations associated with fungal deterioration.
The temporal patterns of the selected image features provide a biologically informed interpretation of the visual information used by the models. Selected texture descriptors changed earlier than color descriptors during aerobic exposure. This sequence may be related to early alterations in surface organization followed by more pronounced pigmentation and browning, as reported during fungal deterioration [41,42]. Because hyphal development, sporulation, and substrate structure were not directly measured, these processes are considered biologically plausible explanations rather than experimentally confirmed developmental stages.
The literature-reported differences among toxigenic fungi also provide biological context for the toxin-specific feature responses. AFB1 is commonly associated with toxigenic Aspergillus species, including A. flavus, whose pigmented conidia can contribute yellow–green coloration, whereas DON is commonly associated with toxigenic Fusarium species that may produce white-to-pink mycelia and yellow-to-red pigments [43,44]. These differences in pigmentation and colonization patterns may help explain why texture descriptors showed stronger associations with AFB1, whereas color descriptors were slightly more sensitive to DON. However, because fungal isolation and identification were not performed, the responses observed in the present samples cannot be assigned to specific fungal species.
At the feature level, decreases in H_mean and GB may be associated with pigment changes, chlorophyll degradation, and browning reactions, whereas variations in GLCM, LBP, and DWT descriptors may reflect changes in surface heterogeneity and multiscale spatial organization [45,46,47,48]. The correlation and feature-selection results support the relevance of this biological interpretation framework, but they do not directly demonstrate pigment synthesis, hyphal penetration, tissue degradation, or cellular collapse.
Importantly, the observed associations should not be interpreted as evidence that AFB1 or DON molecules directly caused the image-feature changes. A more plausible causal framework is that fungal colonization and aerobic deterioration may simultaneously contribute to visible phenotypic changes and mycotoxin accumulation. Accordingly, the RGB imaging system detects visual phenotypes statistically associated with ELISA-measured toxin concentrations rather than the toxin molecules themselves [49,50]. Within this framework, the combined use of color and texture descriptors provides complementary information for mycotoxin prediction, with selected texture features showing potential as earlier indicators of visible deterioration and color features providing stronger signals later during aerobic exposure.
From a practical and methodological perspective, the performance of the proposed RGB imaging approach was further compared with that of previously reported spectroscopic methods. This study systematically expands the scope of image-feature extraction and analysis for mycotoxin detection by introducing a comprehensive set of 111 color and texture descriptors. To validate the effectiveness of the proposed method, its quantitative prediction performance was compared with that of previous studies employing spectroscopic techniques. Liu et al. employed Fourier transform near-infrared spectroscopy to detect AFB1 in maize, achieving R2 = 0.995 and RMSEP = 1.56 µg·kg−1 [51]. Teixido et al. applied NIR-HSI to predict DON levels in oat kernels, obtaining R2 = 0.75 and RMSEP = 403.18 µg·kg−1 [52]. The optimized models in this study demonstrated satisfactory prediction accuracy within the tested concentration ranges: R2 = 0.9945 and RMSE = 3.18 µg·kg−1 for AFB1 (SVR Model 2), and R2 = 0.9816 and RMSE = 45.50 µg·kg−1 for DON (XGBoost Model 2). Despite relying solely on visible-light image features—which are more cost-effective and require simpler hardware configurations—these results suggest that the proposed approach offers promising predictive capability for practical mycotoxin screening. The strong quantitative performance can be attributed to two factors: (1) the comprehensive feature extraction strategy, which captures both color changes associated with fungal pigmentation and texture variations reflecting structural degradation, as discussed above; and (2) the feature selection process, which identified the most informative predictors while reducing noise from redundant variables (Table 4).
For classification tasks, the proposed models also demonstrated competitive performance. Zhang et al. reported classification Accuracy of 78–87% for maize toxins using hyperspectral imaging, whereas Kim et al. combined short-wave infrared hyperspectral imaging with SVM to identify multiple toxins in cornmeal, achieving validation Accuracy of 72–96% [48,53]. In comparison, the RF and XGBoost classifiers developed in this study achieved Accuracy of 90.48% for AFB1 and 95.24% for DON using only visible-light image features. This improvement can be attributed to the carefully optimized combination of color and texture features and the strong nonlinear modeling capability of ensemble algorithms such as RF and XGBoost. These results demonstrate that high-precision automatic classification can be achieved without costly spectroscopic instrumentation, thereby providing a practical pathway for rapid on-site screening of mycotoxin contamination.
The differential performance of models for AFB1 and DON detection reveals important insights into model-data relationships. For quantitative prediction, SVR achieved optimal performance for AFB1 (R2 = 0.9945), while XGBoost performed best for DON (R2 = 0.9816). This divergence reflects the distinct contamination characteristics of each toxin: The different optimal algorithms may reflect differences in the concentration scale, distributional characteristics, and nonlinear feature–response relationships of AFB1 and DON. However, further validation is required to determine the specific factors responsible for these model-performance differences.
For classification tasks, RF and XGBoost achieved comparable Accuracy for AFB1 (90.48%), while SVM demonstrated superior performance for DON (97.62% Accuracy, 100% Se). SVM’s maximum-margin principle effectively exploits the well-defined decision boundaries created by Fusarium contamination’s distinct visual characteristics. The perfect sensitivity achieved by SVM is particularly valuable for feed safety screening, as it eliminates false negatives. These findings indicate that model selection should consider toxin-specific characteristics: SVR for low-variability quantification, XGBoost for heterogeneous distributions, and SVM when maximizing sensitivity is critical.
Compared with conventional chemical methods, the proposed image-based approach has potential advantages in processing speed, equipment cost, and operational simplicity. However, its suitability for high-throughput on-site screening and early warning requires further validation under field conditions and against chromatographically confirmed reference measurements. The quantitative image features exhibit high controllability as model inputs, supporting the development of interpretable machine learning models for both contamination level classification and concentration prediction. While further validation across diverse sample batches and environmental conditions would strengthen confidence in model generalizability, the current findings provide theoretical and technical support for intelligent and automated monitoring of feed quality.
Although the proposed method demonstrated strong predictive and classification performance, several limitations should be acknowledged. First, the samples were collected from dairy farming regions in northern China during a single season, which may limit model generalizability across geographical regions and seasonal conditions. Second, the field-collected silage batches differed in fermentation duration from 3 to 6 months, which may have contributed to between-batch variation in mycotoxin concentrations. Future studies should standardize the fermentation period or include it as an explicit covariate. Third, Pearson correlation analysis captures only linear feature–toxin associations and may not fully reflect nonlinear relationships or interaction effects. Fourth, dataset partitioning was performed at the individual-sample level without grouping the three subsamples collected from the same batch and aerobic-exposure day. Although these subsamples were collected, imaged, and analyzed independently, some within-group similarity cannot be excluded. Therefore, the present evaluation primarily reflects generalization to held-out subsamples under the studied batch conditions, whereas validation using completely independent batches remains necessary.
Fifth, fungal identity, biomass, sporulation, pigmentation, oxidative browning, and tissue structure were not directly assessed. Therefore, the proposed biological interpretations require further microbiological, microscopic, and chemical validation. Sixth, aerobic exposure and image acquisition were conducted under controlled laboratory conditions at 18–22 °C with standardized illumination. Model performance under other temperatures and variable field illumination remains to be evaluated. Seventh, although the initial pool of 111 image descriptors was reduced to 10 features through training-set cross-validation, the total sample size remained relatively modest (n = 210). The reported results should therefore be regarded as preliminary and validated using larger and more diverse datasets. Eighth, AFB1 and DON concentrations were quantified by ELISA rather than chromatographic methods. Concentrations below the LOD were replaced with one-half of the corresponding LOD, whereas measurements between the LOD and LOQ were retained as reported by the assay. Because substituted values and measurements below the LOQ involve greater analytical uncertainty, their inclusion may reduce model calibration precision, particularly at the lower end of the concentration range. This uncertainty may propagate into model calibration and performance evaluation. Future studies should incorporate chromatographic confirmation using HPLC or LC–MS/MS to improve the reliability of the reference measurements.
Future research should focus on the following directions: (1) expanding the sample collection to include diverse geographical origins, crops and hybrids, and storage conditions to enhance model robustness; (2) investigating the influence of environmental factors such as ambient lighting, temperature, and humidity on image feature stability; (3) developing portable imaging devices integrated with embedded computing platforms for real-time, on-site detection; and (4) exploring deep learning approaches (e.g., convolutional neural networks) that may further improve feature extraction and prediction accuracy. Despite these limitations, the validated detection ranges (AFB1: 0.15–63.82 µg·kg−1; DON: 37.50–964.20 µg·kg−1) adequately cover the regulatory thresholds specified in GB 13078-2017, supporting the practical applicability of this method for feed safety monitoring.

5. Conclusions

In this study, a non-destructive detection method integrating machine vision and machine learning was developed to quantify AFB1 and DON contamination in maize silage using visible-light images. A total of 111 color and texture features were extracted, and the optimized models achieved high prediction accuracy (SVR: R2 = 0.9945 for AFB1; XGBoost: R2 = 0.9816 for DON) and reliable classification performance (RF/XGBoost: 90.48% for AFB1; SVM: 97.62% for DON), confirming the feasibility of low-cost RGB imaging for mycotoxin screening. The main conclusions are as follows: First, visible-light image features were strongly associated with measured AFB1 and DON concentrations and jointly characterized chromatic, textural, and surface-quality variation during aerobic deterioration. Second, comparison between Pearson correlation analysis and model-based feature selection revealed that optimal feature subsets integrate both statistically significant indicators and features contributing nonlinear predictive value, supporting multi-feature fusion strategies. Third, biologically informed interpretation suggests that color descriptors may reflect fungal pigmentation and browning-related changes, whereas texture descriptors may reflect multiscale alterations in surface organization. Selected texture descriptors also changed earlier than color descriptors during aerobic exposure. These interpretations are consistent with established fungal-deterioration processes, but require direct biological validation. Finally, the proposed visible-light imaging strategy, combined with biologically informed feature interpretation, offers a promising low-cost approach for preliminary on-site mycotoxin screening and provides a methodological reference for image-based assessment of other fungal deterioration systems. This work therefore advances measurement science by establishing an interpretable, machine-vision-based measurement model for mycotoxin concentrations, bridging visual feature extraction and quantitative regulatory thresholds.

Author Contributions

Conceptualization, X.Z., K.Z. and L.G.; methodology, X.Z. and L.G.; software, X.Z. and D.W.; validation, X.Z., K.Z., L.G. and Y.Y.; formal analysis, X.Z.; investigation, X.Z., L.G. and D.W.; resources, X.Z.; data curation, X.Z.; writing—original draft preparation, X.Z.; writing—review and editing, H.T., K.Z., Y.Y., C.Z. and S.W.; visualization, C.Z.; supervision, S.W.; project administration, X.Z.; funding acquisition, H.T. All authors have read and agreed to the published version of the manuscript.

Funding

This work was funded by the National Natural Science Foundation of China [32071893]; the National Natural Science Foundation of China [52365035]; the Natural Science Foundation of Inner Mongolia Autonomous Region [2024MS03019]; the Natural Science Foundation of Inner Mongolia Autonomous Region [2025QN03148]; and the First-class Discipline Research Special Projects of the Inner Mongolia Autonomous Region [YLXKZX_NND_046].

Institutional Review Board Statement

Not applicable.

Data Availability Statement

Data will be made available on request.

Conflicts of Interest

The authors declare no conflicts of interest.

Abbreviations

The following abbreviations are used in this manuscript:
AFB1Aflatoxin B1
DONDeoxynivalenol
ELISAEnzyme-linked immunosorbent assay
HPLCHigh-performance liquid chromatography
HSIHyperspectral imaging
KSKennard–Stone
LC–MS/MSLiquid chromatography–tandem mass spectrometry
LODLimits of detection
LOQLimits of quantification
NIRNear-infrared spectroscopy
ODOptical density
RFRandom Forest
RFRRandom Forest Regression
ROIRegion of interest
SeSensitivity
SpSpecificity
SVRSupport vector regression
XGBoostExtreme Gradient Boosting

References

  1. Zhao, M.; Feng, Y.; Shi, Y.; Shen, H.; Hu, H.; Luo, Y.; Xu, L.; Kang, J.; Xing, A.; Wang, S.; et al. Yield and quality properties of silage maize and their influencing factors in China. Sci. China Life Sci. 2022, 65, 1655–1666. [Google Scholar] [CrossRef] [PubMed]
  2. Golzarian, M.R.; Frick, R.A. Classification of images of wheat, ryegrass and brome grass species at early growth stages using principal component analysis. Plant Methods 2011, 7, 28. [Google Scholar] [CrossRef] [PubMed]
  3. Leslie, J.F.; Moretti, A.; Mesterházy, Á.; Ameye, M.; Audenaert, K.; Singh, P.K.; Richard-Forget, F.; Chulze, S.N.; Del Ponte, E.M.; Chala, A.; et al. Key global actions for mycotoxin management in wheat and other small grains. Toxins 2021, 13, 725. [Google Scholar] [CrossRef] [PubMed]
  4. Jardon-Xicotencatl, S.; Díaz-Torres, R.; Marroquín-Cardona, A.; Villarreal-Barajas, T.; Méndez-Albores, A. Detoxification of aflatoxin-contaminated maize by neutral electrolyzed oxidizing water. Toxins 2015, 7, 4294–4314. [Google Scholar] [CrossRef] [PubMed]
  5. Ogunade, I.M.; Martinez-Tuppia, C.; Queiroz, O.C.M.; Jiang, Y.; Drouin, P.; Wu, F.; Vyas, D.; Adesogan, A.T. Silage review: Mycotoxins in silage: Occurrence, effects, prevention, and mitigation. J. Dairy Sci. 2018, 101, 4034–4059. [Google Scholar] [CrossRef] [PubMed]
  6. Chen, C.; Frank, K.; Wang, T.; Wu, F. Global wheat trade and Codex Alimentarius guidelines for deoxynivalenol: A mycotoxin common in wheat. Glob. Food Secur. 2021, 29, 100538. [Google Scholar] [CrossRef]
  7. Zong, C.; Wu, Q.; Dong, Z.; Wu, A.; Wu, J.; Shao, T.; Liu, Q. Recycling deteriorated silage to remove hazardous mycotoxins and produce a value-added product. J. Hazard. Mater. 2022, 424, 127627. [Google Scholar] [CrossRef] [PubMed]
  8. Hao, M.; Zhang, M.; Tian, H.; Sun, J. Research on silage corn forage quality grading based on hyperspectroscopy. Agriculture 2024, 14, 1484. [Google Scholar] [CrossRef]
  9. Femenias, A.; Gatius, F.; Ramos, A.J.; Teixido-Orries, I.; Marín, S. Hyperspectral imaging for the classification of individual cereal kernels according to fungal and mycotoxins contamination: A review. Food Res. Int. 2022, 155, 111102. [Google Scholar] [CrossRef] [PubMed]
  10. Zhu, H.; Yang, L.; Fei, J.; Zhao, L.; Han, Z. Recognition of carrot appearance quality based on deep feature and support vector machine. Comput. Electron. Agric. 2021, 186, 106185. [Google Scholar] [CrossRef]
  11. Jiao, T.; Ahmad, W.; Zhu, J.; Hassan, M.M.; Wang, J.; Rong, Y.; Guo, Z.; Li, H.; Ding, Z.; Lv, C.; et al. Aggregation triggered aflatoxin B1 determination in foodstuff employing 5-aminotetramethylrhodamine decorated gold-silver core-shell nanoparticles in surface enhanced Raman scattering. Sens. Actuators B Chem. 2021, 331, 129424. [Google Scholar] [CrossRef]
  12. Wang, C.; Liu, B.; Liu, L.; Zhu, Y.; Hou, J.; Liu, P.; Li, X. A review of deep learning used in the hyperspectral image analysis for agriculture. Artif. Intell. Rev. 2021, 54, 5205–5253. [Google Scholar] [CrossRef]
  13. Qiao, X.; Jiang, J.; Qi, X.; Guo, H.; Yuan, D. Utilization of spectral–spatial characteristics in shortwave infrared hyperspectral images to classify and identify fungi-contaminated peanuts. Food Chem. 2017, 220, 393–399. [Google Scholar] [CrossRef] [PubMed]
  14. Chu, X.; Wang, W.; Yoon, S.C.; Ni, X.; Heitschmidt, G.W. Detection of aflatoxin B1 (AFB1) in individual maize kernels using short wave infrared (SWIR) hyperspectral imaging. Biosyst. Eng. 2017, 157, 13–23. [Google Scholar] [CrossRef]
  15. Zhang, J.; Xu, B.; Wang, Z.; Cheng, F. Application of hyperspectral imaging in the detection of aflatoxin B1 on corn seed. J. Food Meas. Charact. 2022, 16, 448–460. [Google Scholar] [CrossRef]
  16. Teixido-Orries, I.; Molino, F.; Gatius, F.; Sanchis, V.; Marín, S. Near-infrared hyperspectral imaging as a novel approach for T-2 and HT-2 toxins estimation in oat samples. Food Control 2023, 153, 109952. [Google Scholar] [CrossRef]
  17. Rayhana, R.; Sangha, J.S.; Ruan, Y.; Liu, Z. Harnessing machine learning for grain mycotoxin detection. Smart Agric. Technol. 2025, 11, 100923. [Google Scholar] [CrossRef]
  18. Yang, D.; Jiang, J.; Jie, Y.; Li, Q.; Shi, T. Detection of the moldy status of the stored maize kernels using hyperspectral imaging and deep learning algorithms. Int. J. Food Prop. 2022, 25, 170–186. [Google Scholar] [CrossRef]
  19. Kim, Y.; Kang, S.; Ajani, O.S.; Mallipeddi, R.; Ha, Y. Predicting early mycotoxin contamination in stored wheat using machine learning. J. Stored Prod. Res. 2024, 106, 102294. [Google Scholar] [CrossRef]
  20. Yorulmaz, O.; Pearson, T.C.; Çetin, A.E. Detection of fungal damaged popcorn using image property covariance features. Comput. Electron. Agric. 2012, 84, 47–52. [Google Scholar] [CrossRef]
  21. Munera, S.; Ancillo, G.; Prieto, A.; Palou, L.; Aleixos, N.; Cubero, S.; Blasco, J. Quantifying the ultraviolet-induced fluorescence intensity in green mould lesions of diverse citrus varieties: Towards automated detection of citrus decay in postharvest. Postharvest Biol. Technol. 2023, 204, 112468. [Google Scholar] [CrossRef]
  22. Wu, Q.; Xie, L.; Xu, H. Determination of toxigenic fungi and aflatoxins in nuts and dried fruits using imaging and spectroscopic techniques. Food Chem. 2018, 252, 228–242. [Google Scholar] [CrossRef] [PubMed]
  23. Bakhshipour, A.; Zareiforoush, H.; Bagheri, I. Application of decision trees and fuzzy inference system for quality classification and modeling of black and green tea based on visual features. J. Food Meas. Charact. 2020, 14, 1402–1416. [Google Scholar] [CrossRef]
  24. Garcia-Lamont, F.; Cervantes, J.; López, A.; Rodriguez, L. Segmentation of images by color features: A survey. Neurocomputing 2018, 292, 1–27. [Google Scholar] [CrossRef]
  25. González-Jartín, J.M.; Ferreiroa, V.; Rodríguez-Cañás, I.; Alfonso, A.; Sainz, M.J.; Aguín, O.; Vieytes, M.R.; Gomes, A.; Ramos, I.; Botana, L.M. Occurrence of mycotoxins and mycotoxigenic fungi in silage from the north of Portugal at feed-out. Int. J. Food Microbiol. 2022, 365, 109556. [Google Scholar] [CrossRef] [PubMed]
  26. GB/T 17480-2008; Determination of Aflatoxin B1 in Animal Feeding Stuffs—Enzyme-Linked Immunosorbent Assay. Standards Press of China: Beijing, China, 2008.
  27. GB 5009.111-2016; National Food Safety Standard—Determination of Deoxynivalenol and Its Acetylated Derivatives in Foods. Standards Press of China: Beijing, China, 2016.
  28. Díaz, E.O.; Kawamura, S.; Matsuo, M.; Kato, M.; Koseki, S. Combined analysis of near-infrared spectra, colour, and physicochemical information of brown rice to develop accurate calibration models for determining amylose content. Food Chem. 2019, 286, 297–306. [Google Scholar] [CrossRef] [PubMed]
  29. Porep, J.U.; Kammerer, D.R.; Carle, R. On-line application of near infrared (NIR) spectroscopy in food production. Trends Food Sci. Technol. 2015, 46, 211–230. [Google Scholar] [CrossRef]
  30. Caceres, I.; Al Khoury, A.; El Khoury, R.; Lorber, S.; Oswald, I.P.; El Khoury, A.; Atoui, A.; Puel, O.; Bailly, J.-D. Aflatoxin biosynthesis and genetic regulation: A review. Toxins 2020, 12, 150. [Google Scholar] [CrossRef] [PubMed]
  31. Dänicke, S.; Saltzmann, J.; Waurich, B.; Wöckel, A.; Wippermann, W.; Hermenau, G.; Wittich, J.; Bannert, E.; Rachidi, F.; Hufe, P.; et al. A method for estimating the outer exposure of dairy cows to deoxynivalenol (DON) and zearalenone (ZEN) as a precondition for risk assessment based on inner exposure with toxin residue levels in blood and urine as indicators. Mycotoxin Res. 2024, 40, 369–387. [Google Scholar] [CrossRef] [PubMed]
  32. Cambaza, E. Comprehensive description of Fusarium graminearum pigments and related compounds. Foods 2018, 7, 165. [Google Scholar] [CrossRef] [PubMed]
  33. Mannaa, M.; Kim, K.D. Influence of temperature and water activity on deleterious fungi and mycotoxin production during grain storage. Mycobiology 2017, 45, 240–254. [Google Scholar] [CrossRef] [PubMed]
  34. Gallo, A.; Ghilardelli, F.; Atzori, A.S.; Zara, S.; Novak, B.; Faas, J.; Fancello, F. Co-occurrence of regulated and emerging mycotoxins in corn silage: Relationships with fermentation quality and bacterial communities. Toxins 2021, 13, 232. [Google Scholar] [CrossRef] [PubMed]
  35. Zhu, F.; Yao, H.; Hruska, Z.; Kincaid, R.; Brown, R.; Bhatnagar, D.; Cleveland, T. Integration of fluorescence and reflectance visible near-infrared (VNIR) hyperspectral images for detection of aflatoxins in corn kernels. Trans. ASABE 2016, 59, 785–794. [Google Scholar] [CrossRef]
  36. Deng, J.; Ni, L.; Bai, X.; Jiang, H.; Xu, L. Simultaneous analysis of mildew degree and aflatoxin B1 of wheat by a multi-task deep learning strategy based on microwave detection technology. LWT 2023, 184, 115047. [Google Scholar] [CrossRef]
  37. Santra, K.; Song, A.; Petrich, J.W.; Rasmussen, M.A. The degradation of chlorophyll pigments in dairy silage: The timeline of anaerobic fermentation. J. Sci. Food Agric. 2021, 101, 2863–2868. [Google Scholar] [CrossRef] [PubMed]
  38. Islam, M.R.; Tudryn, G.; Bucinell, R.; Schadler, L.; Picu, R.C. Morphology and mechanics of fungal mycelium. Sci. Rep. 2017, 7, 13070. [Google Scholar] [CrossRef] [PubMed]
  39. Panasiuk, L.; Jedziniak, P.; Pietruszka, K.; Piatkowska, M.; Bocian, L. Frequency and levels of regulated and emerging mycotoxins in silage in Poland. Mycotoxin Res. 2019, 35, 17–25. [Google Scholar] [CrossRef] [PubMed]
  40. GB 13078-2017; Hygienical Standard for Feeds. Standards Press of China: Beijing, China, 2017.
  41. Fuhr, M.J.; Stührk, C.; Münch, B.; Schwarze, F.W.M.R.; Schubert, M. Automated quantification of the impact of the wood-decay fungus Physisporinus vitreus on the cell wall structure of Norway spruce by tomographic microscopy. Wood Sci. Technol. 2012, 46, 769–779. [Google Scholar] [CrossRef]
  42. Wang, W.; Huang, W.; Yu, H.; Tian, X. Identification of maize with different moldy levels based on catalase activity and data fusion of hyperspectral images. Foods 2022, 11, 1727. [Google Scholar] [CrossRef] [PubMed]
  43. Zhu, M.; Huang, D.; Hu, X.J.; Tong, W.H.; Han, B.L.; Tian, J.P.; Luo, H.B. Application of hyperspectral technology in detection of agricultural products and food: A Review. Food Sci. Nutr. 2020, 8, 5206–5214. [Google Scholar] [CrossRef] [PubMed]
  44. Singh, C.B.; Jayas, D.S.; Paliwal, J.; White, N.D.G. Detection of midge-damaged wheat kernels using short-wave near-infrared hyperspectral and digital colour imaging. Biosyst. Eng. 2010, 105, 380–387. [Google Scholar] [CrossRef]
  45. Ataky, S.T.M.; Saqui, D.; de Matos, J.; de Souza Britto Junior, A.; Lameiras Koerich, A. Multiscale analysis for improving texture classification. Appl. Sci. 2023, 13, 1291. [Google Scholar] [CrossRef]
  46. Fujinoki, K.; Ashizawa, K. Directional lifting wavelet transform for image edge analysis. Signal Process. 2024, 216, 109188. [Google Scholar] [CrossRef]
  47. Xiao, Y.; Dong, Y.; Huang, W.; Liu, L.; Ma, H. Wheat fusarium head blight detection using UAV-based spectral and texture features in optimal window size. Remote Sens. 2021, 13, 2437. [Google Scholar] [CrossRef]
  48. Zhang, H.; Huang, L.; Huang, W.; Dong, Y.; Weng, S.; Zhao, J.; Ma, H.; Liu, L. Detection of wheat Fusarium head blight using UAV-based spectral and image feature fusion. Front. Plant Sci. 2022, 13, 1004427. [Google Scholar] [CrossRef] [PubMed]
  49. Huang, P.; Yu, X.; Liu, H.; Ding, M.; Wang, Z.; Xu, J.-R.; Jiang, C. Regulation of TRI5 expression and deoxynivalenol biosynthesis by a long non-coding RNA in Fusarium graminearum. Nat. Commun. 2024, 15, 1216. [Google Scholar] [CrossRef] [PubMed]
  50. Zhang, B.; Huang, W.; Li, J.; Zhao, C.; Fan, S.; Wu, J.; Liu, C. Principles, developments and applications of computer vision for external quality inspection of fruits and vegetables: A review. Food Res. Int. 2014, 62, 326–343. [Google Scholar] [CrossRef]
  51. Liu, T.; He, J.; Yao, W.; Jiang, H.; Chen, Q. Determination of aflatoxin B1 value in corn based on Fourier transform near-infrared spectroscopy: Comparison of optimization effect of characteristic wavelengths. LWT 2022, 164, 113657. [Google Scholar] [CrossRef]
  52. Teixido-Orries, I.; Molino, F.; Femenias, A.; Ramos, A.J.; Marín, S. Quantification and classification of deoxynivalenol-contaminated oat samples by near-infrared hyperspectral imaging. Food Chem. 2023, 417, 135924. [Google Scholar] [CrossRef] [PubMed]
  53. Kim, Y.-K.; Baek, I.; Lee, K.-M.; Kim, G.; Kim, S.; Kim, S.-Y.; Chan, D.; Herrman, T.J.; Kim, N.; Kim, M.S. Rapid detection of single-and co-contaminant aflatoxins and fumonisins in ground maize using hyperspectral imaging techniques. Toxins 2023, 15, 472. [Google Scholar] [CrossRef] [PubMed]
Figure 1. Schematic illustration of the experimental workflow.
Agriculture 16 01602 g001
Figure 2. Histograms of AFB1 and DON concentration distributions: (a) AFB1 distribution histogram; (b) DON distribution histogram.
Agriculture 16 01602 g002
Figure 3. Image features significantly correlated with mycotoxin concentrations in maize silage samples: (a) AFB1; (b) DON. Note: a* and b* denote the green–red and blue–yellow chromaticity coordinates, respectively, in the CIE Lab* color space; the asterisks are part of the standard notation and do not indicate footnotes.
Agriculture 16 01602 g003aAgriculture 16 01602 g003b
Figure 4. Daily visual changes in silage maize feed samples (ag) corresponding to storage days 0–6.
Agriculture 16 01602 g004
Figure 5. Temporal dynamics of key image features during maize silage storage: (a) S_skew; (b) Cor_0; (c) Cor_180; (d) LBP-Skew. Open circles represent the daily mean standardized values, solid curves represent the fitted temporal trends, and shaded areas represent the mean ± SD.
Agriculture 16 01602 g005
Figure 6. Hyperparameter optimization results: (ad) AFB1 (RFR Models 1–2; SVR Models 1–2); (eh) DON (RFR Models 1–2; SVR Models 1–2). The surface colors represent the corresponding RMSE values, as indicated by the color bars.
Agriculture 16 01602 g006aAgriculture 16 01602 g006b
Figure 7. Regression plots of predicted vs. actual AFB1 values: (a,b) RFR; (c,d) SVR; (e,f) XGBoost (Models 1–2).
Agriculture 16 01602 g007
Figure 8. Regression plots for DON concentration: (a,b) RFR; (c,d) SVR; (e,f) XGBoost (Models 1–2).
Agriculture 16 01602 g008
Figure 9. Confusion matrices: (a) RF Model for AFB1; (b) SVM Model for AFB1; (c) XGBoost Model for AFB1; (d) RF Model for DON; (e) SVM Model for DON; (f) XGBoost Model for DON. Darker blue indicates a larger number and proportion of samples in the corresponding cell.
Agriculture 16 01602 g009aAgriculture 16 01602 g009b
Table 1. Summary of color and texture features extracted from images of maize silage.
NO.NameDescription
1–3R_mean/R_std/R_skewMean value/Standard deviation/Skewness of the R channel
4–6G_mean/G_std/G_skewMean value/Standard deviation/Skewness of the G channel
7–9B_mean/B_std/B_skewMean value/Standard deviation/Skewness of the B channel
10–12H_mean/H_std/H_skewMean value/Standard deviation/Skewness of the H channel
13–15S_mean/S_std/S_skewMean value/Standard deviation/Skewness of the S channel
16–18I_mean/I_std/I_skewMean value/Standard deviation/Skewness of the I channel
19–21L_mean/L_std/L_skewMean value/Standard deviation/Skewness of the L channel
22–24a*_mean/a*_std/a*_skewMean value/Standard deviation/Skewness of the a* channel
25–27b*_mean/b*_std/b*_skewMean value/Standard deviation/Skewness of the b* channel
28EXGExcess green (2 × Gavg − Ravg − Bavg)
29GBGreen minus blue (Gavg − Bavg)
30EBIAdditional blue index ((Bavg − Gavg) × (Bavg − Ravg))
31habHue angle
32MeanMean
33StdStandard Deviation
34SkewSkewness
35SmoothSmoothness
36UUniformity
37–40Ener/Entr/Med/RangeEnergy/Entropy/Median/Range
41–43MeanAbs/RMS/KurMean absolute deviation/Root mean square/Kurtosis
44–47Con_0/45/90/135Contrast in four orientations (0°, 45°, 90°, and 135°)
48–51ASM_0/45/90/135Angular second moment in four orientations (0°, 45°, 90°, and 135°)
52–55RMSE_0/45/90/135Root mean square energy in four orientations (0°, 45°, 90°, and 135°)
56–59Hom_0/45/90/135Homogeneity in four orientations (0°, 45°, 90°, and 135°)
60–63Cor_0/45/90/135Correlation in four orientations (0°, 45°, 90°, and 135°)
64–67Entr_0/45/90/135Entropy in four orientations (0°, 45°, 90°, and 135°)
68LBP-StdStandard deviation of local binary pattern
69LBP-VarVariance of local binary pattern
70LBP-SkewSkewness of local binary pattern
71LBP-KurKurtosis of local binary pattern
72LBP-EntrEntropy of local binary pattern
73LBP-EnerEnergy of local binary pattern
74LBP-ConContrast of local binary pattern
75LBP-HomHomogeneity of local binary pattern
76–87DWT-R1/2/3/4-cH/cV/cDMean of high-frequency coefficients in the horizontal/vertical/diagonal direction at level 1/2/3/4 of the red channel
88–99DWT-G1/2/3/4-cH/cV/cDMean of high-frequency coefficients in the horizontal/vertical/diagonal direction at level 1/2/3/4 of the green channel
100–111DWT-B1/2/3/4-cH/cV/cDMean of high-frequency coefficients in the horizontal/vertical/diagonal direction at level 1/2/3/4 of the blue channel
Note: a* and b* denote the green–red and blue–yellow chromaticity coordinates, respectively, in the CIE Lab* color space; the asterisks are part of the standard notation and do not indicate footnotes.
Table 2. Various parameters of models.
ModelModel ParametersValues and Specifications
RFR/RFn_tree
m_try
50–1000 (value every 50)
1–number of feature inputs (value every 1)
SVR/SVMC
g
2−10–210 (value every 20.5)
XGBoostlearning_rate
n_estimators
max_depth
0.01–0.3 (value every 0.01)
50–2000 (value every 50)
3–10 (value every 1)
Table 3. Optimal combinations of hyperparameters for each model.
MycotoxinModelsOptimal Hyperparameters
AFB1RFR Model 1max_features: 106, n_estimators: 700
RFR Model 2max_features: 9, n_estimators: 950
SVR Model 1C: 26, gamma: 2−7
SVR Model 2C: 25, gamma: 2−1
XGBoost Model 1learning_rate: 0.16, max_depth: 5, n_estimators: 850
XGBoost Model 2learning_rate: 0.05, max_depth: 5, n_estimators: 300
DONRFR Model 1max_features: 35, n_estimators: 50
RFR Model 2max_features: 9, n_estimators: 350
SVR Model 1C: 26, gamma: 2−7
SVR Model 2C: 25, gamma: 2−1
XGBoost Model 1learning_rate: 0.04, max_depth: 4, n_estimators: 1200
XGBoost Model 2learning_rate: 0.05, max_depth: 5, n_estimators: 1600
Table 4. Ten most influential image features contributing to the regression models.
MycotoxinModelsTop 10 Important Features
AFB1RFR Model LBP-Kur, EXG, S_skew, b*_std, LBP-Skew, a*_std, I_mean, GB, DWT-R3-cV, EBI
SVR ModelGB, EXG, a*_std, LBP-Kur, DWT-B4-cD, S_skew, b*_std, DWT-G4-cD, H_mean, LBP-Skew
XGBoost ModelLBP-Kur, GB, EXG, b*_std, S_skew, Con_0, I_mean, a*_std, EBI, R_std
DON RFR ModelS_skew, a*_skew, EXG, DWT-B4-cV, H_skew, H_std, DWT-R4-cD, GB, b*_std, EBI
SVR Model H_std, GB, S_skew, b*_std, S_mean, EXG, DWT-B4-cV, b*_skew, Hom_180, a*_skew
XGBoost Model S_skew, b*_std, DWT-R4-cD, H_std, GB, EXG, Kur, DWT-B4-cV, H_skew, a*_std
Note: a* and b* denote the green–red and blue–yellow chromaticity coordinates, respectively, in the CIE Lab* color space; the asterisks are part of the standard notation and do not indicate footnotes.
Table 5. Performance of quantitative prediction models for AFB1 and DON concentrations.
MycotoxinModelsR2RMSERPD
AFB1RFR Model 10.91464.93713.4637
RFR Model 20.92724.39753.7515
SVR Model 10.89444.51943.1139
SVR Model 20.99453.17945.0669
XGBoost Model 10.94973.99393.9387
XGBoost Model 20.98853.7134.3588
DONRFR Model 10.840586.37052.5339
RFR Model 20.884975.07532.9828
SVR Model 10.88268.06652.9465
SVR Model 20.970846.64084.6567
XGBoost Model 10.916360.60553.4987
XGBoost Model 20.981645.50235.1663
Note: Bold values indicate the best quantitative prediction performance for each mycotoxin.
Table 6. Performance of classification models.
MycotoxinModelsAccuracy (%)Precision (%)Se (%)Sp (%)F1
AFB1RF Model90.4892.3192.3187.5092.31
SVM Model88.1092.0088.4687.5090.20
XGBoost Model90.4892.3192.3187.5092.31
DONRF Model95.2493.7593.7596.1593.75
SVM Model97.6294.1210096.1596.97
XGBoost Model95.2493.7593.7596.1593.75
Note: Bold values indicate the best classification performance for each metric within each mycotoxin.
Disclaimer/Publisher’s Note: The statements, opinions and data contained in all publications are solely those of the individual author(s) and contributor(s) and not of MDPI and/or the editor(s). MDPI and/or the editor(s) disclaim responsibility for any injury to people or property resulting from any ideas, methods, instructions or products referred to in the content.