1. Introduction
Agriculture-related entrepreneurship plays an important role in rural industrial upgrading, value chain integration, and the modernization of agricultural production systems. In many developing and transitional economies, rural development policies have long emphasized the expansion of market entities, including farms, cooperatives, agribusiness firms, service providers, and logistics or processing enterprises. However, an increase in the number of registered entities does not necessarily imply an improvement in their economic contribution. New entrants with low capital commitment, weak organizational capacity, or limited value chain connections may generate entry growth without supporting durable productivity gains, stable farmer linkages, or rural industrial upgrading. Therefore, the analytical focus needs to move from the quantity of agriculture-related market entry to the quality and structural characteristics of new entrants.
This study focuses on agriculture-related enterprises and market entities because they are important organizational carriers of county economic development. County economies are not driven by agricultural resources alone; they require entities that can organize production factors, connect smallholders with markets, transform local resources into standardized products, and extend agriculture toward processing, logistics, services, and digital circulation. In this sense, high-quality agriculture-related enterprises provide the micro-level vehicle through which county-level institutional improvement is translated into rural industrial upgrading. They are also the main actors through which financial services, market connectivity, human capital, and public service reforms influence agricultural modernization.
This question is relevant beyond China. International research on agrifood transformation shows that smallholders and rural enterprises benefit from modern value chains only when they can access finance, meet standards, coordinate with downstream buyers, and participate in processing, logistics, and service segments [
1,
2]. Rural entrepreneurship research emphasizes that farmers and agribusiness entrants require entrepreneurial capabilities and institutional support [
3], while supply chain research highlights the role of transaction costs and reliable coordination [
4]. These studies imply that local institutions may shape not only whether rural entities enter the market but also whether they enter with the resources and organizational forms needed for value chain upgrading.
China provides a relevant institutional setting for examining this issue. Since the reform of business registration and administrative approval procedures, entry barriers for rural and agriculture-related entities have been substantially reduced [
5]. These reforms have facilitated the rapid growth of registered agricultural business entities. At the same time, China’s rural revitalization strategy has increasingly emphasized agricultural modernization, integrated rural industries, and the cultivation of new agricultural business entities with stronger organizational and value chain capacities [
6,
7]. This policy transition implies that county-level governance is no longer limited to simplifying registration procedures. Instead, it must provide a broader institutional environment that supports financing, market connectivity, human capital, public services, and infrastructure.
Existing studies have shown that institutional quality and the business environment affect entrepreneurship and firm entry by reducing transaction costs, improving access to finance, and stabilizing expectations [
8,
9]. Studies on China further show that administrative approval reforms, digital economy development, public data openness, and digital village policies can promote entrepreneurship, improve factor allocation, and stimulate rural economic activity [
10,
11]. Recent studies on new agricultural business entities also emphasize their role in linking smallholders with modern agriculture, but they remain constrained by weak capital strength, insufficient governance capacity, and limited access to financial and insurance services [
12,
13].
Recent MDPI research further supports this positioning. Text-based evidence on China’s business environment policies shows that the policy agenda has increasingly shifted toward service integration, digital governance, and market facilitation [
14]. Related research on high-quality agricultural development and new quality productive forces shows that advanced technology, resource allocation, and industrial upgrading are closely connected with agricultural transformation [
15,
16]. These studies reinforce the need to examine business environment improvement together with agriculture-related entry quality rather than treating registration growth as a sufficient outcome.
The literature therefore leaves a central unresolved issue: county-level institutional conditions may affect not only how many agriculture-related entities enter, but also whether new entrants possess the capital, organizational form, and value chain position required for durable rural industrial upgrading [
17].
Section 2 develops this gap in detail.
Accordingly, the main goal is to estimate the relationship between the county-level business environment and the share of high-quality agriculture-related entrants. The study has three detailed objectives: to identify the average conditional association; to test whether financial services, market connectivity, and human capital supply are consistent channels; and to determine how the association varies across county contexts. These objectives correspond to three research questions: (RQ1) Is a better county-level business environment associated with a higher share of high-quality agriculture-related entrants? (RQ2) Which factor and service channels are consistent with this relationship? (RQ3) Under which agricultural, financial, market, regional, and administrative conditions is the relationship stronger? We answer these questions using Chinese business registration records and county socioeconomic data for 2010–2023, together with fixed effects, double machine learning, fractional response, robustness, heterogeneity, and supplementary instrumental variable analyses.
This study makes three contributions. First, it shifts the focus of agricultural entrepreneurship research from entry quantity to entry quality, thereby distinguishing market entity generation from structural upgrading. Second, it constructs a multidimensional measure of high-quality agriculture-related entry based on business registration data, incorporating capital quality, organizational quality, and value chain extension. Third, it identifies the mechanisms and boundary conditions through which the county-level business environment shapes agricultural entry quality. In particular, we examine financial services, market connectivity, and human capital supply as key channels, and explore whether the effects differ across regions, agricultural foundations, initial factor market conditions, and county types.
2. Literature Review and Research Gap
2.1. Business Environment, Institutions, and Market Entry
A large body of research links institutional quality to entrepreneurship, firm entry, and resource allocation. From the perspective of institutional economics, formal rules, administrative procedures, property right protection, and contract enforcement shape the expected returns and transaction costs of market participation [
8,
18]. Studies on entry regulation further show that complicated licensing procedures and high registration costs can reduce entrepreneurial activity and delay firm formation [
9,
19]. In this literature, the business environment is usually understood as a set of institutional and service conditions that determine whether firms can enter, operate, and expand under predictable rules.
This institutional perspective is also consistent with international business environment research. Entry regulation studies show that the administrative burden associated with registration and licensing can discourage entrepreneurship and reduce formal firm creation [
9,
19]. The World Bank’s business environment framework similarly treats regulatory procedures, credit access, contract enforcement, and public services as important conditions for private sector development [
20]. Recent MDPI research also links institutional environments and knowledge spillovers with entrepreneurship in China [
21]. For rural areas, these institutional conditions are not abstract background variables; they directly affect land-use coordination, access to credit, quality certification, logistics, and linkages with downstream buyers.
Recent research on China has extended this discussion to administrative approval reform, digital government, public data openness, digital village policies, and local marketization [
22,
23]. These studies provide important evidence that institutional improvement can stimulate entrepreneurship and promote factor allocation. However, most existing studies focus on the number of new firms, overall entrepreneurship activity, innovation, investment, or aggregate economic performance. Relatively little attention has been paid to whether institutional improvement changes the structural quality of entrants, especially in county-level agricultural economies where entry decisions are closely tied to land, finance, logistics, farmers, and rural public services.
2.2. Agriculture-Related Market Entities and Rural Industrial Upgrading
Agriculture-related market entities differ from general industrial or service firms. They are embedded in biological production cycles, natural resource constraints, seasonal demand, local factor markets, and rural governance systems. New agricultural business entities can connect smallholders with modern production, agricultural services, digital platforms, and downstream markets, thereby supporting agricultural modernization and rural industrial integration [
12,
24]. At the same time, they face stronger uncertainty because agricultural output is affected by weather, pests and diseases, price volatility, perishability, and spatial separation between production areas and consumer markets.
Agriculture-related enterprises are therefore not simply another category of registered firms. They are the organizational carriers that translate county resources into marketable agricultural products, stable farmer linkages, and integrated rural industries. MDPI studies on new agricultural business entities show that these entities affect farmers’ welfare and display distinct spatial–temporal development patterns across China [
25,
26]. This evidence supports treating agriculture-related enterprises as a central research object rather than as a peripheral subgroup of general entrepreneurship.
The agrifood value chain literature provides a useful lens for understanding this difference. Agrifood transformation in developing countries is increasingly characterized by processing, quality standards, logistics, contract farming, and links between smallholders and downstream firms [
1,
27]. Smallholder market participation depends not only on production capacity but also on collective action, access to buyers, information, and the ability to meet formal standards [
28,
29]. These findings suggest that agriculture-related entrants contribute to rural development only when they can move beyond isolated primary production and participate in broader value chains.
Existing agricultural economics research has examined the role of new agricultural business entities in land transfer, farmer linkage, carbon reduction, performance improvement, and digital transformation [
30,
31]. These studies clarify the importance of organizational form and industrial integration. Nevertheless, much of the literature evaluates entities after they have already entered the market. Less is known about the quality of the entry process itself. In practice, a county may experience rapid growth in registrations, but many entrants may remain small, informal, weakly capitalized, or disconnected from value chains. This distinction between entry quantity and entry quality is central to evaluating whether rural entrepreneurship contributes to durable industrial upgrading.
2.3. Measurement of High-Quality Entry and County-Level Institutional Conditions
A key limitation in the existing literature is measurement. Firm entry is often measured by the number of newly registered firms, entry rates, or entrepreneurship indices. These measures are useful for identifying market vitality, but they do not distinguish between low-capital trial entry and entrants with stronger investment capacity, formal governance, or value chain participation. For agriculture-related entities, this distinction is particularly important because the policy objective is not only to increase the number of entities but also to cultivate organizations that can invest, survive, connect farmers, and participate in integrated rural industries.
The measurement of county-level business environment also requires adaptation. National, city-level, and marketization-oriented business environment indices provide useful references but are not directly available for all counties, and their indicators are often designed for urban economies [
32,
33]. County-level agricultural development depends on a broader combination of public services, market conditions, financial accessibility, human capital, and infrastructure. MDPI research on high-quality agricultural development and digital-economy-driven rural revitalization similarly emphasizes regional disparities, industrial upgrading, and the role of enabling conditions in agricultural transformation [
34,
35]. Therefore, constructing a county–year business environment index from county socioeconomic indicators provides a feasible way to capture local institutional and factor conditions. The use of entropy weighting further reduces subjective weighting and improves comparability across counties and years.
For high-quality agriculture-related entry, a multidimensional measure is more appropriate than a single firm count indicator. Registered capital reflects the scale of initial resource commitment; organizational form reflects the governance capacity needed to contract with farmers, workers, and downstream buyers; and value chain extension reflects whether entrants participate in processing, services, logistics, or technology activities. These dimensions correspond to the resource-based and value chain views of rural enterprise development [
1,
36].
2.4. Research Gap and Contribution of This Study
The literature leaves three research gaps. First, existing studies mainly examine whether the business environment promotes entry quantity, while the structural quality of new entrants remains underexplored. Second, agricultural entities face both natural and market risks, but most business environment studies are based on general firms or urban settings and do not fully incorporate agricultural specificity. Third, empirical research has rarely connected county-level institutional conditions with the multidimensional quality of agriculture-related entry, including capital quality, organizational quality, and value chain extension.
This study responds to these gaps by constructing a county–year measure of high-quality agriculture-related market entry and examining its relationship with the county-level business environment. Compared with simple registration counts, the measure captures whether entrants have stronger capital capacity, more formal organizational forms, and broader value chain participation. The analysis treats financial services, market connectivity, and human capital supply as the primary testable channels, while prefecture-level government service integration is used only as supplementary institutional evidence. It also examines whether the association varies across regions, agricultural foundations, initial factor market conditions, and county types.
3. Theoretical Framework and Hypotheses
3.1. Institutional Economics and Transaction Cost Logic
Institutional economics provides the basic theoretical foundation for this study. Institutions influence market entry by defining property rights, reducing uncertainty, lowering transaction costs, and shaping expectations about future returns [
8,
18]. For agriculture-related entrants, institutional conditions are especially important because entry is not a simple act of registration. It requires capital commitment, land-use arrangements, production planning, contractual coordination with farmers and downstream firms, and compliance with multiple administrative procedures.
Transaction cost theory further suggests that firms choose organizational forms and governance structures according to the costs of search, negotiation, monitoring, and enforcement activities [
18,
37]. Agriculture-related activities involve dispersed farmers, seasonal production, difficult quality observation, and multiple value chain participants. These features increase the cost of contracting and make local institutions more consequential. A county-level business environment that improves rule transparency, service efficiency, factor access, and market connectivity can therefore alter both the probability and the quality of market entry [
4].
3.2. Resource-Based View, Dynamic Capability, and Agricultural Specificity
The resource-based view emphasizes that firms’ competitive positions depend on access to valuable resources and the ability to combine them effectively [
36]. For agriculture-related entrants, key resources include capital, land-use arrangements, production facilities, cold chain capacity, professional labor, agricultural technology, certification, and market channels. These resources are often locally embedded and difficult for entrants to obtain through standardized markets. County-level institutional supply can therefore affect whether entrants remain small and informal or form organizations with stronger resource bases.
Dynamic capability theory is also relevant because agricultural entrants must respond to weather shocks, disease risks, changing prices, food safety requirements, and market demand fluctuations [
38]. Entry quality depends not only on initial registration but also on whether the entrant has the capacity to coordinate resources, adjust production, and participate in value chain upgrading. Because agricultural production has biological cycles, perishability, seasonal concentration, and asset specificity, the role of business environment improvement is more direct than in many non-agricultural sectors.
3.3. County-Level Business Environment and High-Quality Entry
High-quality agriculture-related market entry can be understood as entry with stronger capital capacity, more formal organizational governance, and deeper value chain participation. When county governance only reduces registration thresholds, it may increase the number of registered entities without improving their industrial contribution. By contrast, when local institutions improve finance, markets, human capital, public services, and infrastructure, new entrants can make more credible investments, choose more formal organizations, and connect with processing, logistics, technology, and service segments.
The business environment therefore works as a local institutional infrastructure. It reduces uncertainty, improves access to complementary factors, and raises the expected returns to substantive entry. In agricultural settings, this is particularly important because entrants face natural risks and market risks simultaneously. A better business environment can transform entry from low-cost experimentation into a more durable form of rural industrial investment.
H1. Improvements in the county-level business environment are positively associated with high-quality agriculture-related market entry.
3.4. Financing Constraints and Capital Quality
Agriculture-related entrants often require upfront investment in land transfer, production facilities, storage, cold chain logistics, machinery, seedlings, breeding stock, and working capital. However, biological assets and land-use rights are difficult to value, pledge, and dispose of, which weakens their function as collateral. Long production cycles delay cash flow recovery, while climate shocks and disease risks increase lenders’ risk premiums. These conditions make financing constraints more binding for agriculture-related entrants than for many ordinary commercial firms.
A favorable business environment can mitigate these constraints through rural credit systems, policy-backed guarantees, agricultural insurance, warehouse receipt financing, order financing, and public information sharing. When business records, orders, insurance policies, quality certification, and transaction histories are converted into credit-relevant information, entrants can obtain capital that matches agricultural investment cycles. This mechanism directly improves capital quality at the time of entry and supports fixed-asset investment rather than short-term speculative registration. It also helps entrants transform biological assets, future orders, and verified production records into credible information for lenders.
3.5. Professional Services and Organizational Quality
Organizational quality is central to the difference between low-quality entry and durable agricultural entrepreneurship. Moving from household-based or informal operations to limited liability companies, corporate entities, or standardized cooperatives requires accounting capacity, tax compliance, labor management, quality control, contract enforcement, and internal governance. Agriculture-related entrants must also coordinate farmers, cooperatives, processors, distributors, e-commerce platforms, and service providers, which increases the value of professional services.
County-level human capital conditions and professional service availability can reduce the fixed cost of formal organization. Legal, accounting, agricultural technology, inspection, certification, and supply chain services allow new entrants to establish clearer property relations, traceable production standards, and stable contractual arrangements. Therefore, the business environment promotes organizational quality by increasing the expected net benefits of formal and standardized governance.
3.6. Market Connectivity and Value Chain Extension
Agricultural products are often perishable, seasonally concentrated, and spatially separated from final consumers. Without timely logistics, reliable price information, order matching, and cold chain services, investment in land, facilities, and biological assets may generate asset-specific losses. Market connectivity is therefore not only a sales condition but also a prerequisite for entrants to extend beyond primary production into processing, distribution, agricultural services, e-commerce, technology services, and other high-value segments.
A better business environment can improve market rules, public data access, logistics infrastructure, platform services, cold chain nodes, and rural e-commerce systems [
39]. These conditions reduce search costs, improve matching efficiency, and stabilize expectations about downstream demand. As a result, entrants are more likely to participate in value chain extension instead of remaining limited to traditional planting, breeding, or fragmented local circulation. This mechanism is consistent with agrifood value chain research, which emphasizes standards, logistics, contracts, and downstream coordination as conditions for upgrading [
1,
40].
3.7. Government Service Integration and Institutional Transaction Costs
Agriculture-related entrants often face administrative procedures related to business registration, land-use approval, animal and plant quarantine, food production licensing, environmental assessment, logistics permits, subsidies, and quality certification. These procedures involve multiple departments and may affect production timing. Because agriculture is constrained by farming seasons and biological cycles, administrative delay can turn into real economic losses, such as missing planting windows, breeding cycles, storage periods, or market delivery opportunities.
Government service integration can reduce these institutional transaction costs. One-stop service centers, online approval platforms, cross-departmental information sharing, and standardized procedures reduce repeated document submission, approval uncertainty, and coordination costs. Although government service data may be observed at a higher administrative level, this channel is theoretically important because prefecture-level platforms often provide the institutional infrastructure that counties use to serve entrants.
H2. Financial services, market connectivity, and human capital supply are channels consistent with the positive association between the county-level business environment and high-quality agriculture-related market entry.
3.8. Boundary Conditions and Heterogeneous Effects
The effect of business environment improvement is unlikely to be uniform across counties. Counties with stronger agricultural foundations have more stable raw material supply, stronger industrial demand, and more potential transaction partners. In these counties, institutional improvements can be converted more easily into high-quality entry because entrants can connect with existing production bases and value chain networks.
Initial factor market conditions also matter. Counties with weaker financial and market foundations face stronger constraints, so marginal institutional improvement may generate larger returns. Regional and administrative differences may further shape the effect. Central and western counties often face weaker market development, lower financial inclusion, and greater talent outflow than eastern counties. Non-municipal districts may receive fewer urban service spillovers than municipal districts. These conditions imply stronger marginal effects where institutional constraints are more binding.
H3a. The positive association is stronger in counties with stronger agricultural foundations.
H3b. The positive association is stronger in counties with weaker initial financial and market conditions.
H3c. The positive association is stronger in counties with weaker access to urban spillovers.
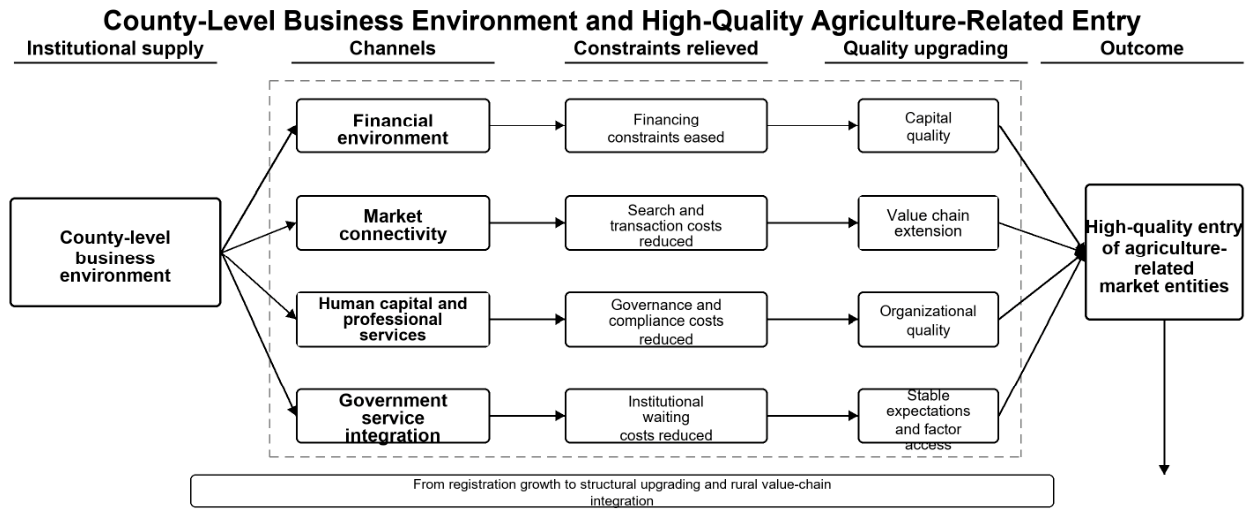
Figure 1 summarizes the theoretical pathways and the corresponding hypotheses.
4. Materials and Methods
4.1. Data Sources and Sample Construction
This study combines Chinese business registration records with county-level socioeconomic data for 2010–2023. The registration records provide establishment year, registered capital, organizational form, industry classification, business scope, and county code; the county data provide the business environment indicators and controls. The unit of analysis is the county–year.
Agriculture-related entrants are identified from industry codes and business scope text. The narrow scope covers agriculture, forestry, animal husbandry, and fishery. The broad scope additionally includes agricultural processing, inputs and machinery services, logistics, technology services, and related value chain activities, thereby capturing integrated primary, secondary, and tertiary agricultural industries.
Supplementary Table S1 reports the keyword dictionary used for broad scope identification, including processing, cold chain logistics, inputs and machinery, technology services, e-commerce, testing, branding, and other value chain services. Combining industry codes with business scope text reduces omissions outside the primary sector classification.
Sample construction proceeds as follows. We remove duplicate firm records, observations outside 2010–2023, records with missing or impossible establishment years, unidentifiable county codes, and observations lacking valid information for the three quality dimensions. This produces 17,587,295 agriculture-related firms, of which 17,215,381 have complete quality information. Aggregation yields 39,750 county–years; matching to county socioeconomic data yields 38,349; screening for complete six control variable information yields 32,838; and excluding county–years with fewer than 10 entrants yields the final 32,351 observations across 2733 counties.
The minimum-entry rule limits denominator-driven volatility in the ratio outcome, and continuous county variables are winsorized annually at the 1st and 99th percentiles. The panel structure is retained so that identification uses within-county changes over time.
The threshold removes 487 of 32,838 otherwise eligible county–years (1.48%). The excluded observations are concentrated in western and non-municipal counties, so threshold sensitivity is assessed using minimum-entry cutoffs of 1, 5, 10, and 20.
Table 1 summarizes the screening process.
4.2. Dependent Variable: High-Quality Agriculture-Related Market Entry
The dependent variable is the share of high-quality agriculture-related entrants in each county–year. Traditional studies often measure market entry using the number of newly registered firms, firm entry rates, or entrepreneurship activity. These measures capture entry scale but do not distinguish entrants with different levels of capital capacity, organizational governance, and value chain integration. In this study, high-quality entry is measured using three dimensions: capital quality, organizational quality, and value chain extension.
Capital quality equals one if the registered capital of firm i is not lower than the median registered capital of firms in the same year and industry, and zero otherwise. Organizational quality equals one if the firm is registered as a limited liability company, joint stock company, corporate legal entity, or farmer cooperative, and zero otherwise. Value chain extension equals one if the firm belongs to the broad-scope agriculture-related sample but not to the narrow-scope agriculture, forestry, animal husbandry, and fishery category.
For firm i, the quality score is constructed by aggregating the three binary dimensions. A firm is defined as a high-quality entrant if it satisfies at least two of the three quality dimensions. The county–year high-quality entry ratio is then obtained by dividing the number of high-quality entrants by the number of agriculture-related entrants with complete quality information. This threshold reduces misclassification caused by a single dimension. It should be noted that this measure captures structural characteristics at the time of registration and does not directly measure realized performance, productivity, or survival quality.
This measurement is appropriate for the research question for three reasons. First, registered capital captures the scale of initial commitment and the ability to bear agricultural production risks. Second, organizational form captures whether the entrant has a governance structure that can support contracts, compliance, and farmer linkage. Third, value chain extension captures whether the entrant is connected to processing, distribution, services, or technology rather than remaining confined to primary production. The measure therefore moves beyond entry quantity and reflects the structural upgrading emphasized in rural revitalization policy.
The indicator also has boundaries. Registered capital is a commitment recorded at registration rather than realized paid-in capital. This distinction is especially relevant after the reform from paid-in capital registration to subscribed capital registration, because some firms may report capital commitments that exceed actual initial investment. The study therefore interprets registered capital as an ex ante signal of scale commitment and risk-bearing intention, not as a direct measure of realized assets. Organizational form cannot fully capture internal governance quality, and value chain extension is inferred from registration information rather than transaction-level supply chain data. For this reason, the empirical analysis uses alternative dependent variables, component-level outcomes, winsorized ratios, and a narrow-scope agricultural sample to examine whether the conclusions depend on one specific definition.
Equations (1)–(3) define the firm-level quality dimensions and aggregate them to the county–year level. This design ensures that the dependent variable measures the share of entrants with multidimensional quality characteristics rather than the absolute number of registered entities.
4.3. Core Explanatory Variable: County-Level Business Environment
The core explanatory variable is the county-level business environment index. Existing city-level or national business environment indicators cannot directly cover the large number of Chinese counties. Therefore, this study constructs a county-level index using six dimensions: government services, market environment, financial environment, human capital environment, public services, and infrastructure. These dimensions reflect the institutional and factor conditions that agriculture-related entrants rely on.
The basic indicators are winsorized at the 1st and 99th percentiles by year and then normalized using min–max standardization. A full-sample fixed entropy weighting method is used to aggregate the indicators. The fixed weighting scheme reduces year-to-year changes in the measurement scale, while entropy weighting reduces subjective weighting by using the amount of information contained in each indicator. Alternative business environment measures are used in the robustness checks.
The six-dimensional index is designed for county-level agricultural settings. Government services and public services capture administrative and social support capacity. Market environment and infrastructure capture local demand, circulation conditions, and transaction convenience. Financial environment captures the availability of credit resources, which is particularly important for capital-intensive agricultural entry. Human capital captures the supply of basic labor and service conditions that affect organizational upgrading. Compared with a single fiscal or economic indicator, this composite index better reflects the local ecosystem faced by agriculture-related entrants.
Several indicators require cautious interpretation. For example, the ratio of general public budget revenue to GDP may reflect both fiscal capacity and potential tax burden, while fixed-line telephone users may capture traditional infrastructure rather than current digital connectivity. These limitations are addressed by using alternative index constructions in the robustness checks and by interpreting the composite index as a proxy for the overall county-level institutional and factor environment rather than a direct measure of any single administrative procedure.
A further measurement concern is that some market environment indicators, such as GDP-related measures and retail consumption, partly reflect local economic outcomes rather than pure institutional supply. To address this concern, the robustness checks construct an alternative institutional service index that excludes the market environment dimension and retains government services, finance, human capital, public services, and infrastructure. This alternative is not intended to replace the baseline ecosystem index; instead, it tests whether the main association is driven solely by outcome-type market development indicators.
Equations (4)–(6) describe the fixed entropy weighting procedure. The indicators are first normalized, then converted into information shares, and finally aggregated using entropy weights. This procedure gives greater weight to indicators with stronger cross-county and temporal variation while maintaining a fixed weighting structure for comparability.
Table 2 reports the indicator system used to construct the county-level business environment index.
4.4. Control Variables and Empirical Strategy
The model includes six county-level control variables: population size, administrative area, grain resource endowment, urban–rural structure, agricultural industrial structure, and economic growth rate. These variables control for county scale, resource conditions, industrial structure, and local economic dynamics that may affect agriculture-related entry quality. All control variables are lagged by one period in the baseline specification.
The baseline model uses a two-way fixed effects specification. HQEct is the share of high-quality agriculture-related entrants in county c and year t, BEc,t-1 is the lagged county-level business environment index, Xc,t-1 is the vector of lagged control variables, county fixed effects absorb time-invariant county characteristics, and year fixed effects absorb common temporal shocks. Standard errors are clustered at the county level. The baseline estimates are interpreted as robust associations rather than unconditional causal effects.
The use of lagged explanatory and control variables reduces simultaneity concerns and reflects the fact that institutional conditions affect entry decisions with a time lag. County fixed effects control for time-invariant local characteristics, such as historical agricultural traditions, geographic location, and long-standing institutional features. Year fixed effects control for national policy cycles, macroeconomic shocks, and common changes in registration rules.
Equation (7) is the baseline two-way fixed effects model. The coefficient beta captures the association between the lagged county-level business environment and high-quality agriculture-related entry after controlling for observed county characteristics, county fixed effects, and year fixed effects.
4.5. Mechanism and Heterogeneity Specifications
To examine mechanism channels, this study estimates two connected equations. The first equation examines whether the business environment improves the channel variable, and the second equation examines whether the channel variable is associated with high-quality entry after controlling for the business environment and county-level covariates. The main channel variables include financial services, market connectivity, human capital supply, and supplementary evidence on government service integration.
To examine heterogeneous effects, the baseline model is extended by interacting the business environment index with group indicators. The grouping variables include region, agricultural foundation, initial financial development, initial market development, and county type. This design tests whether the institutional effect differs across counties with different factor market constraints and agricultural foundations.
The mechanism analysis is interpreted as channel evidence rather than as a strict causal mediation test because some mechanism variables may themselves be affected by unobserved local policies [
41]. Nevertheless, the approach is useful for examining whether the empirical patterns are consistent with the theoretical framework. The heterogeneity analysis further clarifies where business environment improvement produces larger marginal returns.
Equation (8) reports the channel testing framework, where Mct denotes a mechanism variable such as financial services, market connectivity, or human capital supply. Equation (9) introduces interactions between the business environment and group indicators to test heterogeneous effects across county types.
4.6. Double Machine Learning, Robustness Checks, and Supplementary Instrumental Variable Analysis
To account for possible nonlinear relationships between county characteristics, the business environment, and entry quality, this study applies double machine learning (DML) as a complementary method [
42,
43]. After absorbing county and year fixed effects, the outcome equation and treatment equation are estimated using random forest and extra-trees algorithms. Five-fold cross-fitting is conducted at the county level to reduce overfitting and to avoid placing observations from the same county in both the training and prediction folds. The nuisance functions include the same lagged controls used in the baseline model, and inference is based on clustered standard errors at the county level. The main estimations were conducted in Python 3.10.8 using statsmodels 0.14.4, and DML was implemented in Python 3.12.13 using scikit-learn 1.9.0.
The DML specification uses the same lagged controls as the baseline model, including population size, administrative area, grain resource endowment, rural population share, agricultural industrial structure, and economic growth. Because the dependent variable is a fraction bounded between zero and one, the linear DML estimates are interpreted as orthogonalized partial effect estimates rather than predictions of the conditional mean itself. Fractional logit and fractional probit specifications are therefore reported as complementary bounded-outcome checks.
Several robustness checks are conducted. Alternative business environment indices and dependent variables are used; the dependent variable is winsorized by year; the sample is restricted by excluding municipal districts or using stricter entry count thresholds; a narrow-scope agricultural sample is used; and fractional logit and fractional probit models are estimated because the dependent variable is bounded between zero and one [
44,
45].
Reverse causality is possible because high-quality entry may itself induce local governments to improve services and infrastructure. As a supplementary diagnostic, we use the interaction between county terrain ruggedness and the logarithm of provincial broadband access ports. Ruggedness affects infrastructure and public service diffusion costs, while provincial broadband expansion supplies time variation. However, ruggedness can also influence transportation costs, logistics efficiency, and market radius independently of the measured business environment. The exclusion restriction is therefore contestable, and the IV estimates are not treated as stand-alone causal evidence.
We additionally tested the logarithm of county road mileage as a control for the direct transportation channel. Road mileage is available for only 29.59% of county–years, and the restricted-sample first-stage F-statistic falls to 1.8074. Because this specification is weakly identified, it is reported only as a diagnostic. The main IV specification instead includes a distance-to-prefecture-center trend and explicitly retains the transportation channel as a limitation.
The robustness design is layered: alternative measures assess index dependence; sample restrictions assess sensitivity to administrative units and low-entry county–years; fractional response models address the bounded outcome; and the IV exercise checks whether the positive sign survives a source of external variation. Given the exclusion concern, the IV exercise is interpreted as evidence against a purely contemporaneous reverse-causality account, not as proof of a causal effect.
Equation (10) summarizes the orthogonalized DML estimating equation. Equations (11) and (12) define the terrain–broadband interaction instrument and the corresponding two-stage least squares specification.
5. Empirical Results
5.1. Descriptive Statistics
Table 3 reports the descriptive statistics of the main variables. The final baseline sample contains 32,351 county–year observations. The mean value of the high-quality entry ratio is 0.4666, indicating that approximately 46.66% of new agriculture-related entrants satisfy at least two of the three quality criteria defined in this study. The standard deviation is 0.2015, suggesting substantial variation across counties and years. This variation provides the empirical basis for identifying how local institutional conditions are associated with entry quality.
The mean value of the lagged county-level business environment index is 0.1653, with a standard deviation of 0.0907. This indicates that the business environment differs considerably across counties, which is consistent with the uneven distribution of public services, market development, financial resources, and infrastructure in China’s county economy. The descriptive statistics also show meaningful variation in population size, administrative area, grain resource endowment, urban–rural structure, and agricultural industrial structure, supporting the need to control for county-level scale and resource characteristics.
5.2. Baseline Results
Table 4 presents the baseline two-way fixed effects estimates. Column (1) includes county and year fixed effects only. The coefficient of the lagged business environment index is positive but statistically insignificant. After controlling for population size and administrative area, the coefficient increases to 0.4189 and becomes statistically significant at the 1% level. When grain resource endowment, urban–rural structure, agricultural industrial structure, and economic growth are further included, the coefficient remains stable at approximately 0.4160.
This pattern is consistent with a suppression effect. Traditional agricultural counties often have large administrative areas, substantial agricultural populations, and strong production foundations, yet may also face remoteness, high public service costs, and thin factor markets. Omitting scale and endowment controls can therefore mask the conditional institutional association. In the preferred specification, a 0.1 increase in the business environment index is associated with a 4.16 percentage point increase in the high-quality entry ratio. Using the index standard deviation of 0.0907, a one-standard-deviation increase corresponds to approximately 3.77 percentage points, or about 8.1% of the sample mean of 46.66%. The statistical and economic magnitudes support H1, while remaining conditional associations rather than unconditional causal effects.
The stepwise specification helps clarify the source of this suppression. Population size and administrative area absorb the scale of local entry demand, while grain resource endowment and the agricultural share capture the production base of traditional agricultural counties. These variables are positively related to the potential number of agriculture-related entrants but may coexist with weaker market services, longer logistics distances, and higher public service delivery costs. Controlling for these endowment and scale factors therefore isolates the institutional component of the business environment more clearly.
5.3. DML Estimates and Main Model Coefficient Comparison
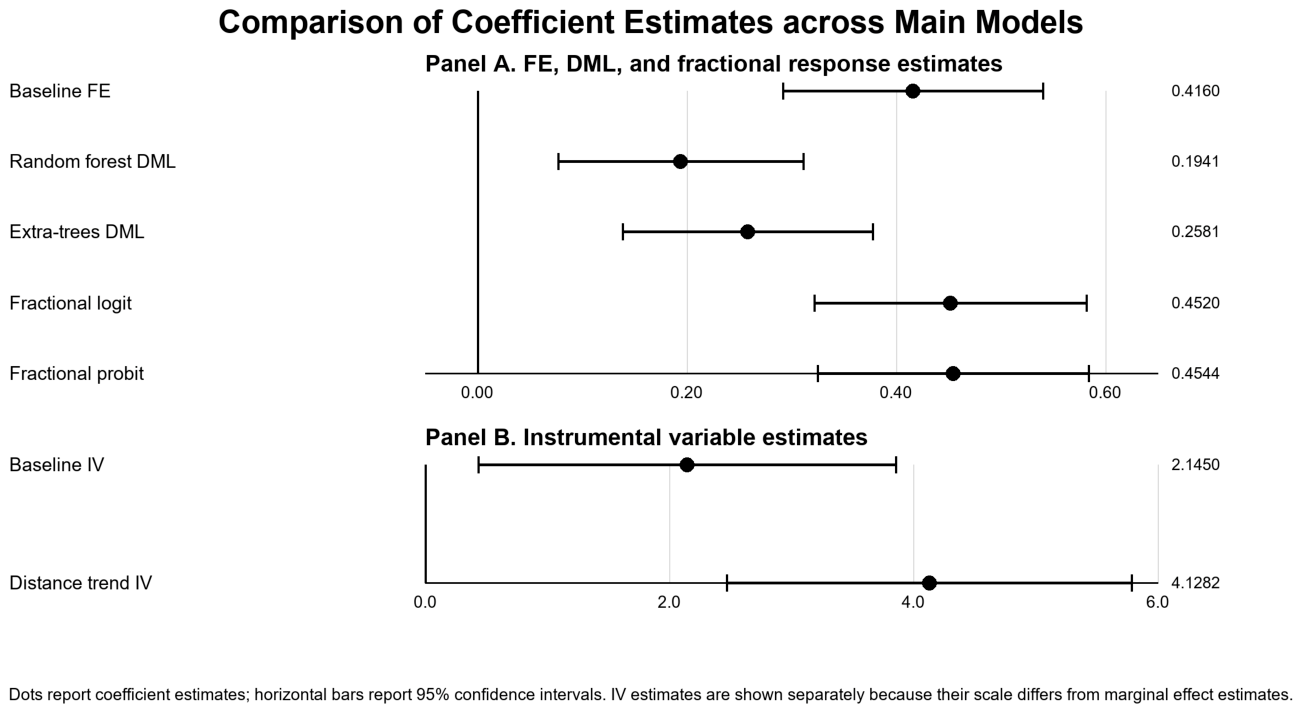
Table 5 reports the double machine learning estimates. The random forest and extra-trees specifications produce coefficients of 0.1941 and 0.2581, respectively, both significant at the 1% level. These estimates are smaller than the baseline fixed effects coefficient, corresponding to approximately 46.66% and 62.04% of the baseline estimate. The coefficient reduction is informative rather than problematic: it suggests that county characteristics may influence both the business environment and entry quality through nonlinear thresholds or interactive patterns that linear controls cannot fully absorb.
The coefficient reduction suggests that nonlinear thresholds and interactions in population, agricultural foundations, and factor market conditions explain part of the baseline association. DML adjusts for these components more flexibly and therefore provides a more conservative nonlinear-adjusted benchmark, although it is not interpreted as a formal lower bound. Both DML estimates remain positive and significant, so H1 is supported under the stricter adjustment strategy.
Figure 2 compares the estimates across model families. Panel A shows positive coefficients for two-way fixed effects, DML, and fractional response models, with smaller DML estimates after nonlinear adjustment. Panel B reports IV estimates separately because their scale is not directly comparable with marginal effects in Panel A. The figure demonstrates specification consistency in sign; it does not establish that all estimates identify the same causal parameter.
5.4. Mechanism Analysis
Table 6 examines the three channels specified in H2. The business environment is positively associated with financial services, market connectivity, and human capital supply, and each channel variable is positively associated with high-quality entry conditional on the business environment and controls. The indirect effect estimates are also positive and significant. The financial result is consistent with lower financing constraints and stronger capital commitment; the market result is consistent with lower search and matching costs and greater value chain extension; and the human capital result is consistent with improved access to accounting, legal, technical, and managerial services. These patterns support H2.
These estimates are channel consistency tests rather than a strict causal mediation decomposition, because the channel variables may share unobserved determinants with entry quality. Their value lies in linking the reduced-form association to observable factor and service conditions. For agriculture-related entrants, credit access, market reach, and professional capabilities jointly determine whether registration is followed by substantive investment, formal organization, and value chain participation.
Table 7 provides supplementary evidence on government service integration using prefecture-level administrative approval center data. The results show that counties located in prefectures with more integrated administrative approval services tend to exhibit stronger high-quality entry. Because these data are measured at the prefecture level, they are not interpreted as a strict county-level mediation test. Nevertheless, they provide institutional evidence that integrated public services may reduce administrative waiting time and coordination costs. This is particularly relevant for agriculture-related entrants because delayed approvals can interfere with production seasons, certification timing, and logistics arrangements.
5.5. Heterogeneity Analysis
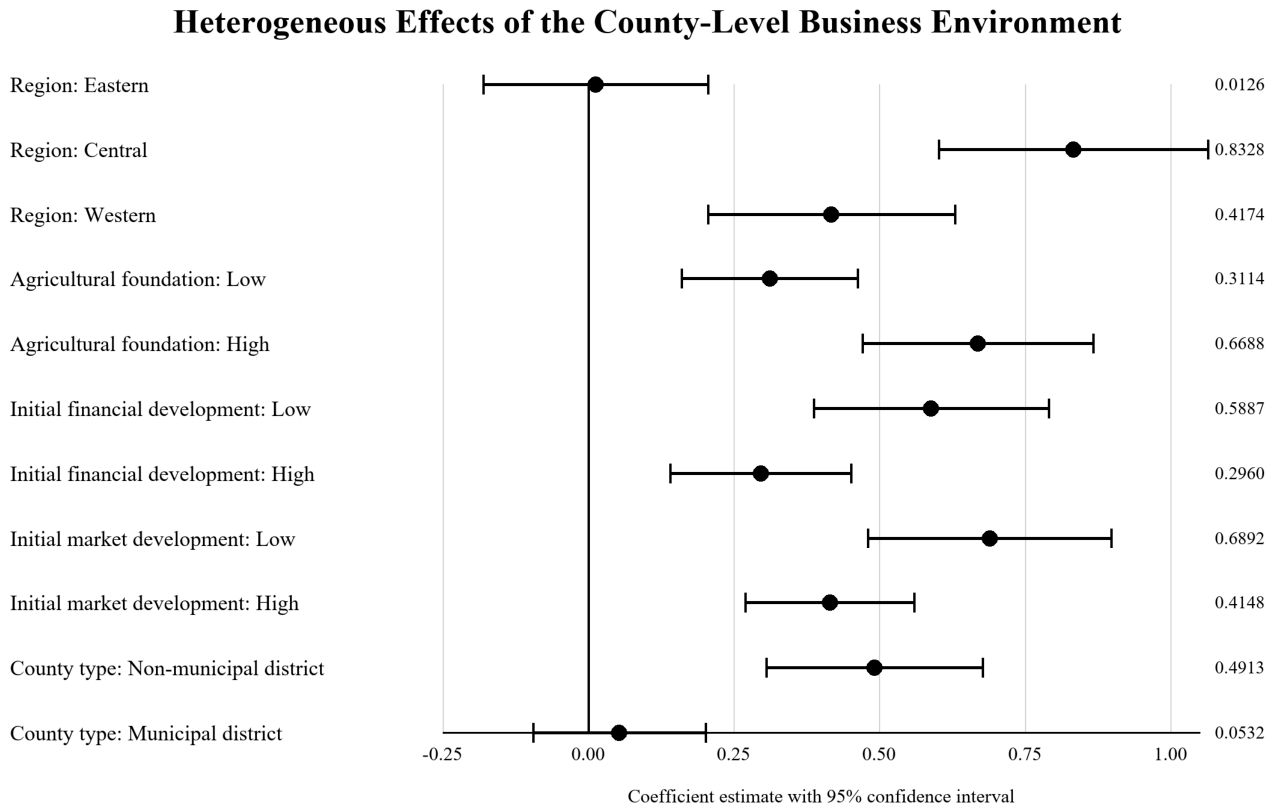
Table 8 and
Figure 3 report the heterogeneity tests. The larger coefficient in counties with stronger agricultural foundations supports H3a. The larger coefficients under weaker initial financial and market conditions support H3b. The larger coefficient for non-municipal districts, which receive weaker urban service spillovers, supports H3c. Central and western counties also display larger associations than eastern counties, consistent with stronger binding institutional constraints.
The pattern is economically coherent. Strong agricultural foundations supply raw materials, farmer networks, and downstream demand, allowing institutional improvements to be converted into entry quality. Where finance and markets are initially weak, the same improvement relaxes more binding constraints. The smaller estimates in eastern counties and municipal districts are consistent with lower marginal returns where market institutions and urban services are already more developed; they should not be interpreted as evidence that institutional quality is irrelevant in those locations.
5.6. Robustness Checks and Instrumental Variable Results
Table 9 reports several robustness checks. The results remain positive when alternative business environment indices are used, when the dependent variable is replaced by the average quality score or the logarithm of high-quality entrants, when the dependent variable is winsorized, and when stricter sample restrictions are applied. Additional reviewer-oriented checks further support this pattern. When the market environment dimension is excluded from the business environment index, the coefficient remains positive and significant (0.2457). When the minimum entry threshold is changed to 5 or 20 entrants, the coefficients are 0.4310 and 0.3906, respectively. Component-level regressions also show positive associations with capital quality (0.2445), organizational quality (0.3140), and value chain extension (0.0625). The last coefficient is weaker but remains significant at the 10% level. These tests indicate that the main conclusion is not driven by a specific measurement choice, sample restriction, or linear probability specification.
The fixed-effect sensitivity materially qualifies the baseline result. Adding province-by-year fixed effects reduces the coefficient to 0.1152 (p = 0.0723), and adding prefecture-by-year fixed effects reduces it to 0.0602 (p = 0.3351). A variance decomposition shows that 56.37% of total index variation lies between prefecture–year cells and 43.63% lies within them. Thus, substantial within-prefecture variation remains, but it does not yield a statistically precise coefficient once common prefecture–year shocks are absorbed. Restricting the sample to prefectures represented by at least two counties leaves the county-and-year fixed effects estimate essentially unchanged at 0.4159 (SE = 0.0632; N = 32,327), whereas the prefecture-by-year fixed effects estimate in the same subsample is 0.0623 (SE = 0.0584; p = 0.2864). The result is therefore not driven by single-county prefectures, but the baseline specification cannot distinguish county implementation from prefecture-level policies or shocks. Accordingly, this specification defines an identification boundary rather than an additional robustness confirmation.
Table 10 reports the supplementary IV diagnostic. The first-stage F-statistics confirm relevance, and the second-stage coefficients remain positive, including after the distance-to-prefecture-center trend is controlled. Relevance, however, does not establish the exclusion restriction. Terrain may directly affect transport accessibility, logistics costs, market radius, and cold chain viability. The limited road mileage coverage and weak first stage in that restricted sample prevent a decisive empirical closure of this channel. We therefore use
Table 10 only to show that the positive sign survives this source of external variation and to reduce concern about a purely contemporaneous reverse causality explanation. The IV estimates are not used to claim a causal magnitude.
6. Discussion
The results extend research on entrepreneurship and business environment improvement by shifting attention from entry quantity to entry quality. Prior studies show that administrative approval reform, digital development, digital village policy, and public data openness can stimulate entrepreneurship and factor allocation [
46,
47]. The present evidence links local institutional conditions to the capital commitment, organizational form, and value chain position of new agriculture-related entrants. This interpretation is consistent with recent non-MDPI research emphasizing institutional innovation and value networks in smallholder-inclusive agrifood chains [
48] and ecosystem-based agricultural value chain finance [
49].
The channel results clarify why the association is plausible for agriculture-related entrants. Financial services partly address the limited collateral value of biological assets and land-use rights. Market connectivity reduces search costs and improves demand predictability for perishable and seasonal products. Human capital and professional services strengthen accounting, compliance, quality control, and supply chain management. These capabilities can support rural resilience through closer interaction between agrifood value chains and local communities [
50].
The heterogeneity results further indicate that institutional improvement does not have uniform effects across counties. The effects are stronger in central and western counties, non-municipal districts, and counties with weaker initial financial and market conditions. This pattern is consistent with the idea of marginal institutional returns: when factor markets and service systems are underdeveloped, improvements in the business environment directly relax binding constraints. In contrast, eastern counties and municipal districts may already benefit from more mature markets, stronger financial systems, and urban service spillovers, reducing the marginal effect of additional institutional improvement.
The prefecture-by-year fixed-effect result sets a clear identification limit. Once shocks common to counties within the same prefecture and year are absorbed, the remaining coefficient is small and statistically imprecise. The baseline association may therefore combine county implementation with prefecture-level pilot programs, rural revitalization funding, municipal leadership, credit platforms, or other common shocks. The data do not allow these explanations to be separated conclusively.
A multi-level governance interpretation remains plausible because approval platforms, credit systems, and industrial service infrastructure are often coordinated above the county level. However, the fixed-effect result does not by itself prove this mechanism. It indicates that policy design and evaluation should consider prefecture-level institutional supply together with county-level service delivery, while the empirical conclusion should remain associational.
Several limitations remain. First, registration records measure ex ante structural characteristics rather than paid-in investment, productivity, tax contribution, innovation, survival, or realized farmer linkages. Second, value chain extension is inferred from industry codes and business scope text. Third, the loss of significance under prefecture-by-year fixed effects means that county-level causal identification is not secured and that prefecture-level shocks may account for part of the baseline association. Fourth, the terrain–broadband instrument has a strong first stage but an unverifiable exclusion restriction because terrain also affects transport and logistics. Fifth, prefecture-level government service integration is supplementary evidence rather than county-level mediation. Sixth, the dataset lacks a comparable non-agricultural entry quality panel. Future research should combine registration records with paid-in capital, tax, credit, social security, patent, logistics, survival, and non-agricultural entrant data, and exploit reforms with clearer county-level timing.
7. Conclusions and Policy Implications
This study examines whether the county-level business environment is associated with the quality of agriculture-related market entry in China. Using registration records and county socioeconomic data for 2010–2023, we construct a county–year measure combining capital quality, organizational quality, and value chain extension. The preferred fixed effects estimate is positive and economically meaningful, and the sign is stable across alternative measures, DML, fractional response models, sample restrictions, and the supplementary IV diagnostic. However, the coefficient becomes statistically insignificant with prefecture-by-year fixed effects; the conclusion is therefore a robust conditional association rather than a definitive county-level causal effect.
Three conclusions follow. First, a better county-level business environment is positively associated with the structural quality, not merely the quantity, of agriculture-related entry. Second, financial services, market connectivity, and human capital supply provide channel evidence consistent with this association. Third, the association is stronger in counties with stronger agricultural foundations, weaker initial financial and market conditions, and weaker urban spillovers. These findings support H1, H2, and H3a-H3c within the stated identification limits.
Several policy implications follow from these results. First, local governments should move from registration-based performance evaluation to quality-oriented governance. The number of newly registered entities should not be treated as the only indicator of rural entrepreneurial vitality. More attention should be paid to capital capacity, organizational form, compliance records, survival duration, and value chain participation.
Second, financial support for agriculture-related entrants should be based on integrated credit, guarantee, and insurance systems. This recommendation follows directly from the financial service channel identified in the mechanism analysis. Counties with weaker financial foundations should not build costly independent platforms. Instead, they can rely on prefecture-level or provincial data platforms while focusing on local verification, firm classification, and service delivery. This approach is particularly suitable for central and western counties, where the marginal return to business environment improvement is high but fiscal and digital governance capacities may be limited.
Third, counties should improve value chain service platforms according to their industrial foundations. This recommendation corresponds to the market connectivity channel and the stronger effect found in counties with stronger agricultural foundations. Counties with mature agricultural clusters can develop integrated service platforms for cold chain logistics, testing, certification, branding, and order matching. Counties with weaker fiscal and digital capacity should prioritize existing resources, such as industrial parks, supply and marketing cooperatives, postal logistics networks, and leading enterprises, rather than building large independent platforms from scratch.
Fourth, human capital and professional services should be provided in a targeted and cost-effective way. This recommendation corresponds to the human capital channel. Training and advisory services should be differentiated by firm development stage. Early-stage entrants need basic compliance, accounting, and contract support, while growth-stage firms require quality certification, brand development, supply chain management, and digital marketing services. Overall, county-level institutional improvement should be understood as a structural policy tool. Its value lies not only in reducing entry barriers but also in enabling agriculture-related entrants to develop stronger capital capacity, more formal organizations, and deeper value chain integration.