Article

Multilevel Effects of Heat Stress on Welfare, Physiology, Oxidative Status, and Productivity in a Commercial Farrow-to-Finish Pig Farm


by
Vasileios G. Papatsiros
1,*,
Georgios I. Papakonstantinou
1,
Eleftherios Meletis
1,
Dimitrios Gougoulis
1,
Konstantina Dimoveli
1,
Evangelos-Georgios Stampinas
1,
Christos Eliopoulos
2,
Lampros Fotos
1,
Nikoleta Polychronidou
3,
Dimitrios Arapoglou
2,
George Tsegas
4,
Eleftherios Chourdakis
4,
Christos Vlachocostas
4 and
Dimitra Psalla
3
1
Clinic of Medicine, Faculty of Veterinary Medicine, University of Thessaly, 43100 Karditsa, Greece
2
Institute of Technology of Agricultural Products, Hellenic Agricultural Organization-Demeter (HAO-Demeter), 14123 Athens, Greece
3
Laboratory of Pathology, School of Veterinary Medicine, Faculty of Health Sciences, Aristotle University of Thessaloniki, 54124 Thessaloniki, Greece
4
Sustainability Engineering Laboratory, Aristotle University, 54124 Thessaloniki, Greece
*
Author to whom correspondence should be addressed.
Agriculture 2026, 16(14), 1498; https://doi.org/10.3390/agriculture16141498
Submission received: 26 May 2026 / Revised: 5 July 2026 / Accepted: 7 July 2026 / Published: 10 July 2026

Abstract

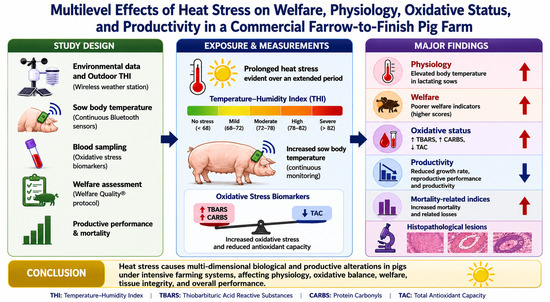
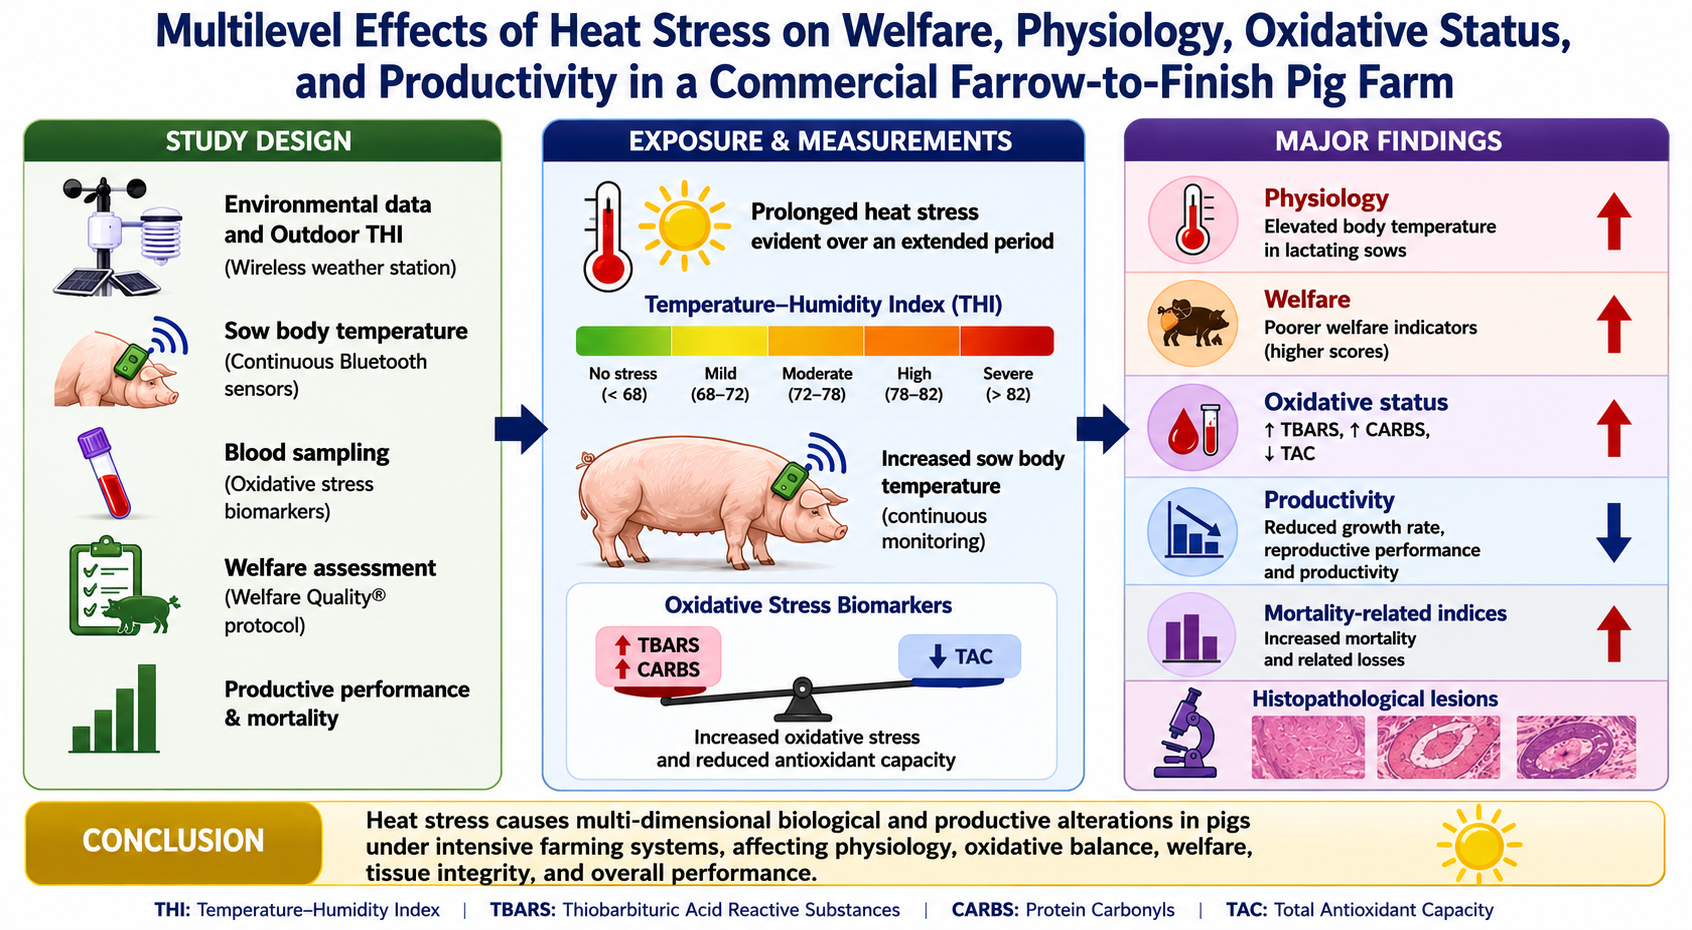
Heat stress remains a significant issue in pig production, particularly in Mediterranean regions, due to the link between climate change and rising temperatures. This study evaluated the effects of heat stress on physiology, oxidative status, animal welfare, histopathological changes, and production in a commercial farrow-to-finish pig farm during the warm season of 2025. Environmental conditions, physiological parameters, welfare, and oxidative stress biomarkers were monitored throughout the study period, while continuous neck skin surface temperature monitoring in lactating sows was carried out using Bluetooth sensor technology. Heat stress was evident over an extended period, as indicated by increased temperature in lactating sows, compromised welfare, oxidative stress, reduced antioxidant capacity, poor reproductive and productive performance, decreased daily growth rate, and higher mortality-related indices. Histopathological examination also revealed multisystemic lesions, including fibrinous microthrombi in renal vessels, hepatocellular degeneration, perivascular oedema with vascular wall thickening in the skin, and lymphocyte depletion in splenic germinal centres. These findings are consistent with endothelial dysfunction, ischaemic tissue damage, and stress-induced immunomodulation. In conclusion, heat stress causes multi-dimensional biological and productive alterations in pigs under intensive farming systems, involving thermoregulatory, oxidative, welfare, reproductive, and histopathological impairments, which support the implementation of integrated precision livestock farming monitoring approaches.

Graphical Abstract

1. Introduction

Heat stress is one of the most serious environmental threats affecting the pig industry today, especially in Mediterranean areas where long periods of high temperatures and humidity occur. This problem is exacerbated by global warming, and pigs are among the most affected species due to their limited ability to lose heat through evaporation, relying mainly on behaviour and respiration [1].
When exposed to high environmental temperatures, pigs display various physiological responses, including vasodilation, increased breathing rate, decreased feed intake, and activation of the HPA axis. If the environmental heat load exceeds the animals’ adaptive capacity, these mechanisms become ineffective, leading to hyperthermia, metabolic imbalance, oxidative stress, immune system disorders, and reduced productivity. Numerous studies have highlighted the metabolic and hormonal adjustments induced by heat stress in livestock [2]. Additionally, activation of systemic inflammation and endothelial dysfunction have been identified as crucial factors in the occurrence of heat stroke [3,4]. At the cellular level, heat stress results in overproduction of reactive oxygen species (ROS), causing oxidative stress, which is characterized by increased levels of thiobarbituric acid reactive substances (TBARS) and protein carbonyls (CARBS). Total antioxidant capacity (TAC) measures systemic antioxidant defence [5,6,7]. The temperature-humidity index (THI) is commonly used as a quantitative measure of environmental heat load by integrating environmental temperature and humidity into a single index [8]. Previous studies on pigs have confirmed that the oxidative system is affected by nutritional and environmental stresses [9]. Furthermore, pigs subjected to heat stress experience intestinal barrier dysfunction and metabolic imbalance [10].
Both behavioural and clinical signs are equally important as indicators of heat stress. The use of validated frameworks for assessing animal welfare, such as the Welfare Quality® assessment system, provides reliable methodologies for evaluating animal-based welfare indicators [11,12]. Combining environmental parameters with animal physiology and welfare indicators may lead to a better understanding of the effects of heat stress in commercial environments. Although many studies have been conducted experimentally, very few have examined these aspects together in pigs [13].
The objective of this study was to investigate the relationships between THI, physiological responses, oxidative stress biomarkers, animal welfare indicators, and productive performance on a commercial farrow-to-finish pig farm. By integrating environmental and animal-based data, this study aims to provide a comprehensive evaluation of heat stress under real production conditions and to explore the potential of multi-level monitoring for Precision Livestock Farming (PLF) applications. To our knowledge, this is among the first field studies to integrate all these domains within a single commercial farrow-to-finish system under Mediterranean conditions, specifically applying continuous Bluetooth Low Energy (BLE)-based skin temperature monitoring as an animal-based indicator of thermoregulatory strain.

2. Materials and Methods

2.1. Ethical Approval and Compliance

The study was conducted in accordance with the Code of Practice for the Conduct of Clinical Trials for Veterinary Medicinal Products and the Guide for the Care and Use of Agricultural Animals in Research and Teaching. The experimental protocol was reviewed and approved by the Research Ethics & Conduct Committee, University of Thessaly, Greece (Approval No. 45, dated 12 May 2025).

2.2. Trial Farm

The present study was conducted on a commercial farrow-to-finish farm in central Greece (Thessaly) from May 2025 to October 2025. The farm has a capacity of 520 sows (Large White × Landrace).
All gilts and sows on the farm were individually ear-tagged and housed in a separate mating building, where they were artificially inseminated with semen from Duroc boars from the same boar stud. On the day of weaning, sows were moved to the mating building and housed in individual cages (2.2 m × 0.65 m) with slatted plastic floors and separate feeding stalls until artificial insemination. The mating building was naturally ventilated through adjustable side curtains; no mechanical cooling or evaporative cooling systems were installed. The inseminated sows remained in individual cages until the 25th to 30th day of gestation, when they were moved to group housing (pens of 8–10 sows; floor space ≥ 2.25 m2 per sow on fully slatted concrete floors) until one week before the expected farrowing date. The weaning age of piglets was 25–28 days, and weaned piglets were transferred weekly to the flat deck unit in pens with groups of 25 (0.33 m2 per piglet on perforated plastic flooring). Fattening pigs were housed in groups of 12–15 on fully slatted concrete floors (0.65 m2 per pig), in a naturally ventilated building with adjustable ridge ventilation and side openings. A one-week farrowing series and a 25- to 28-day lactation period were implemented on the experimental farm, so approximately 40–50 sows were grouped per series. The farm had mechanical ventilation fans for air movement, but no active cooling (e.g., evaporative pads or sprinkler/misting systems) in place during the study period.

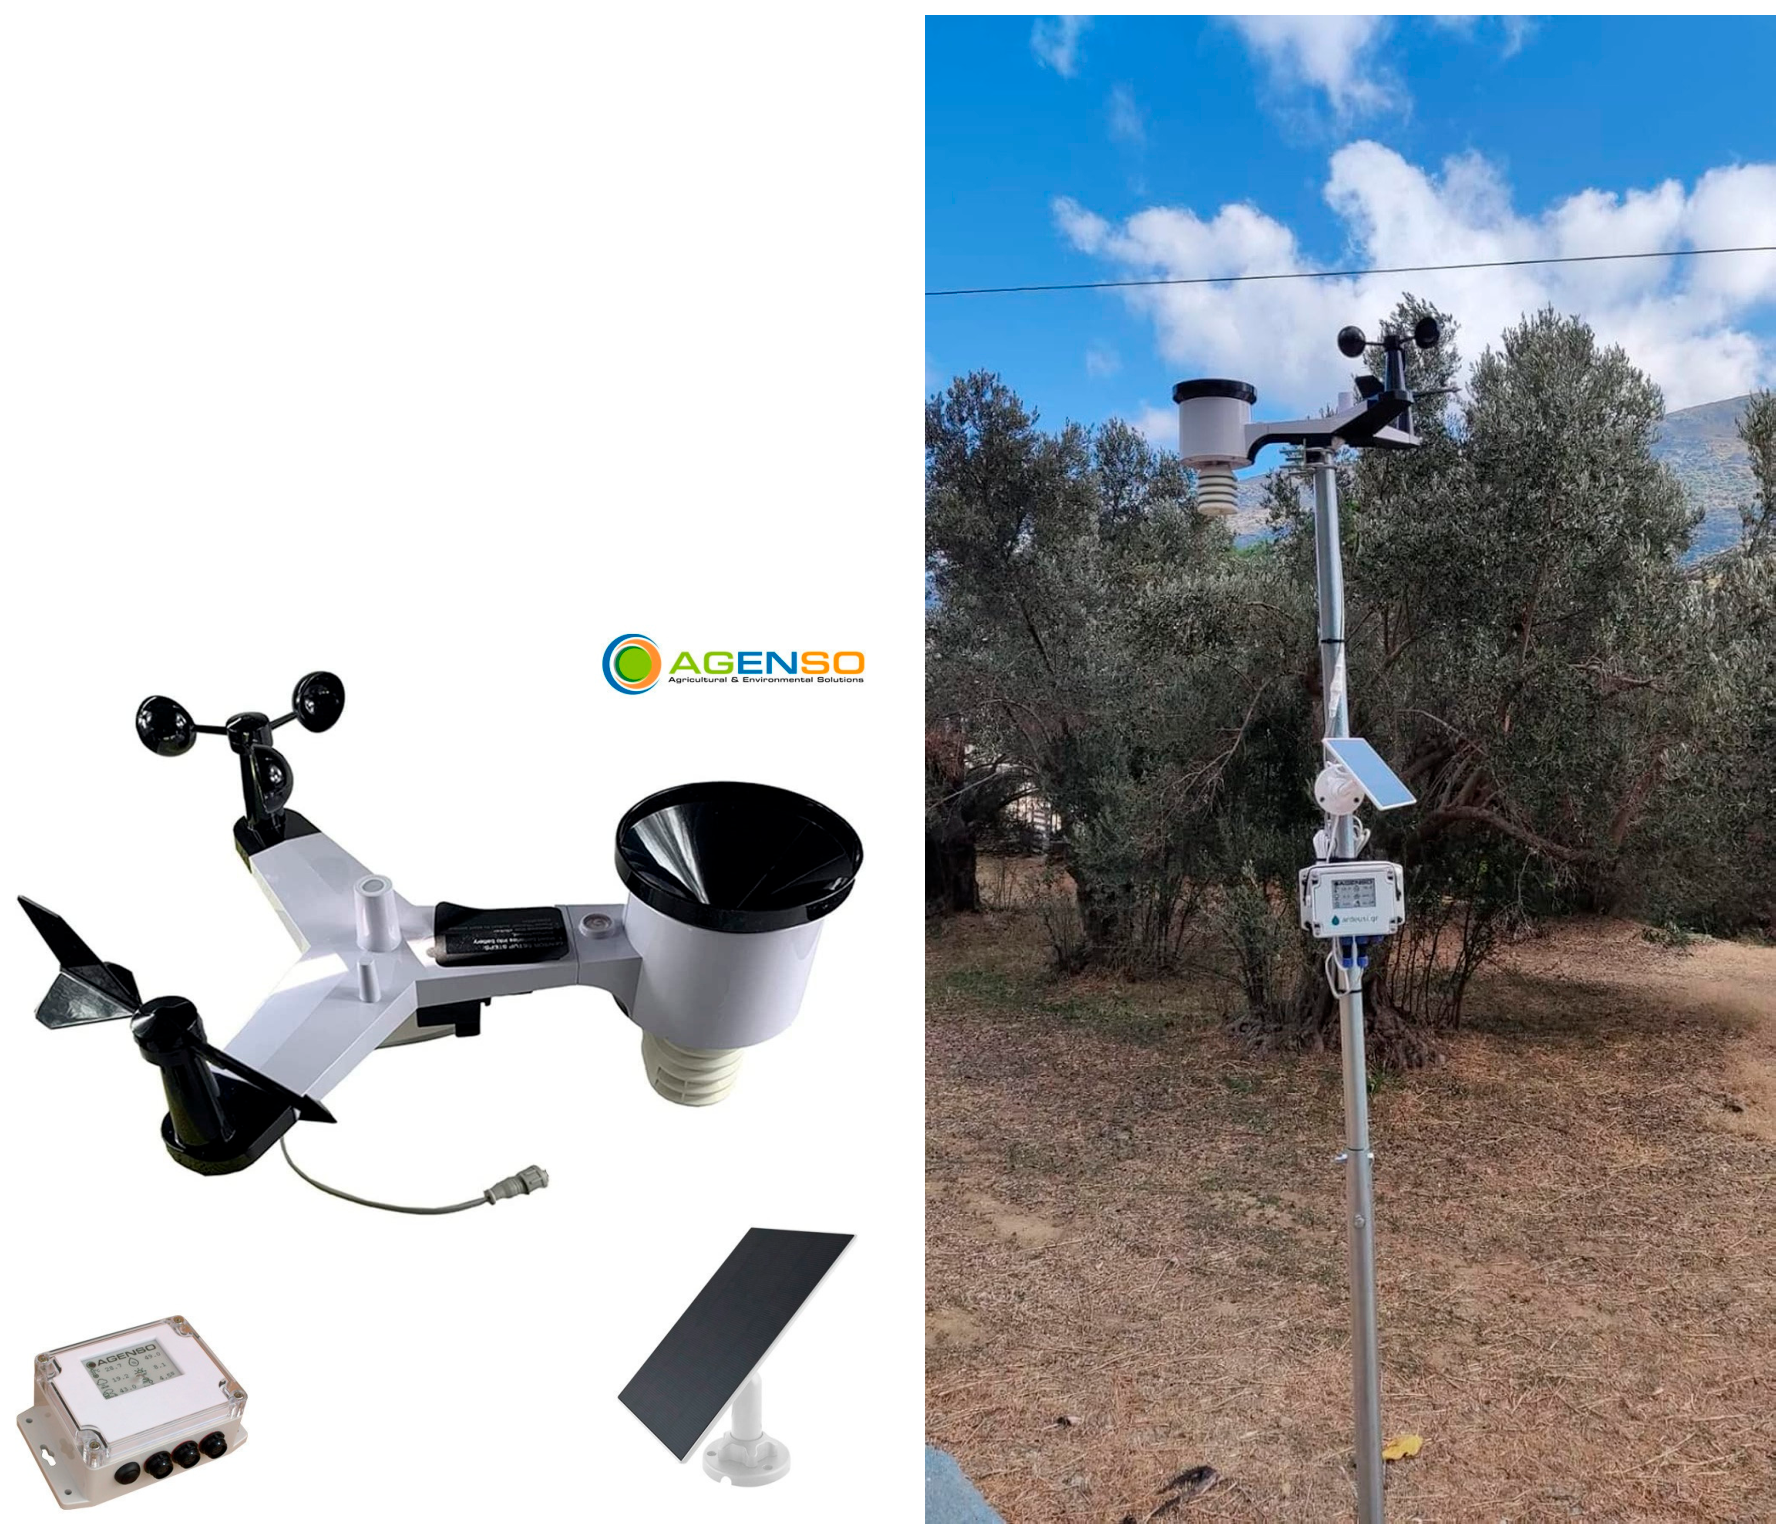
2.3. Environmental Data and Outdoor THI

Meteorological data (ambient temperature and relative humidity) were obtained from a nearby weather station (Moschochori), using a Wireless Digital Weather Station Agenso MeteoIo T 2100S 4G (Agenso, Athens, Greece) (Figure 1). Monthly mean values were calculated, and THI was estimated using a standard formula for pigs. Housing microclimate measurements reflected external climatic conditions. Hourly recordings of ambient temperature (°C) and relative humidity (as a proportion) were used to compute the hourly THI according to the formula of Rauw et al. (2020) [14]: THI = 0.8 × T + RH × (T − 14.4) + 46.4, where T is temperature in °C and RH is relative humidity expressed as a proportion. This formula was applied consistently to all outdoor THI calculations. Heat stress thresholds were: no stress (THI < 68), mild (68–72), moderate (72–78), high (78–82), and severe (>82), following the classification established for pigs by Huynh et al. (2005) [1] and Renaudeau et al. (2012) [8].
Analyses focused on the study period (June–October 2025). Full-year data (8760 hourly observations) were used for THI category distribution. Daily outdoor THI means were computed for correlation analyses with sow neck skin surface temperature because daily outdoor THI provided continuous daily resolution (n = 120 calendar days), whereas indoor microclimate data were available only as monthly averages from four spot-measurement sessions. The use of outdoor THI as a proxy for the overall thermal environment the animals experienced is further supported by the high correlation between indoor and outdoor environmental indices (WBGT–THI: r ≈ 0.99; Section 3.2).

2.4. Indoor Microenvironmental Data

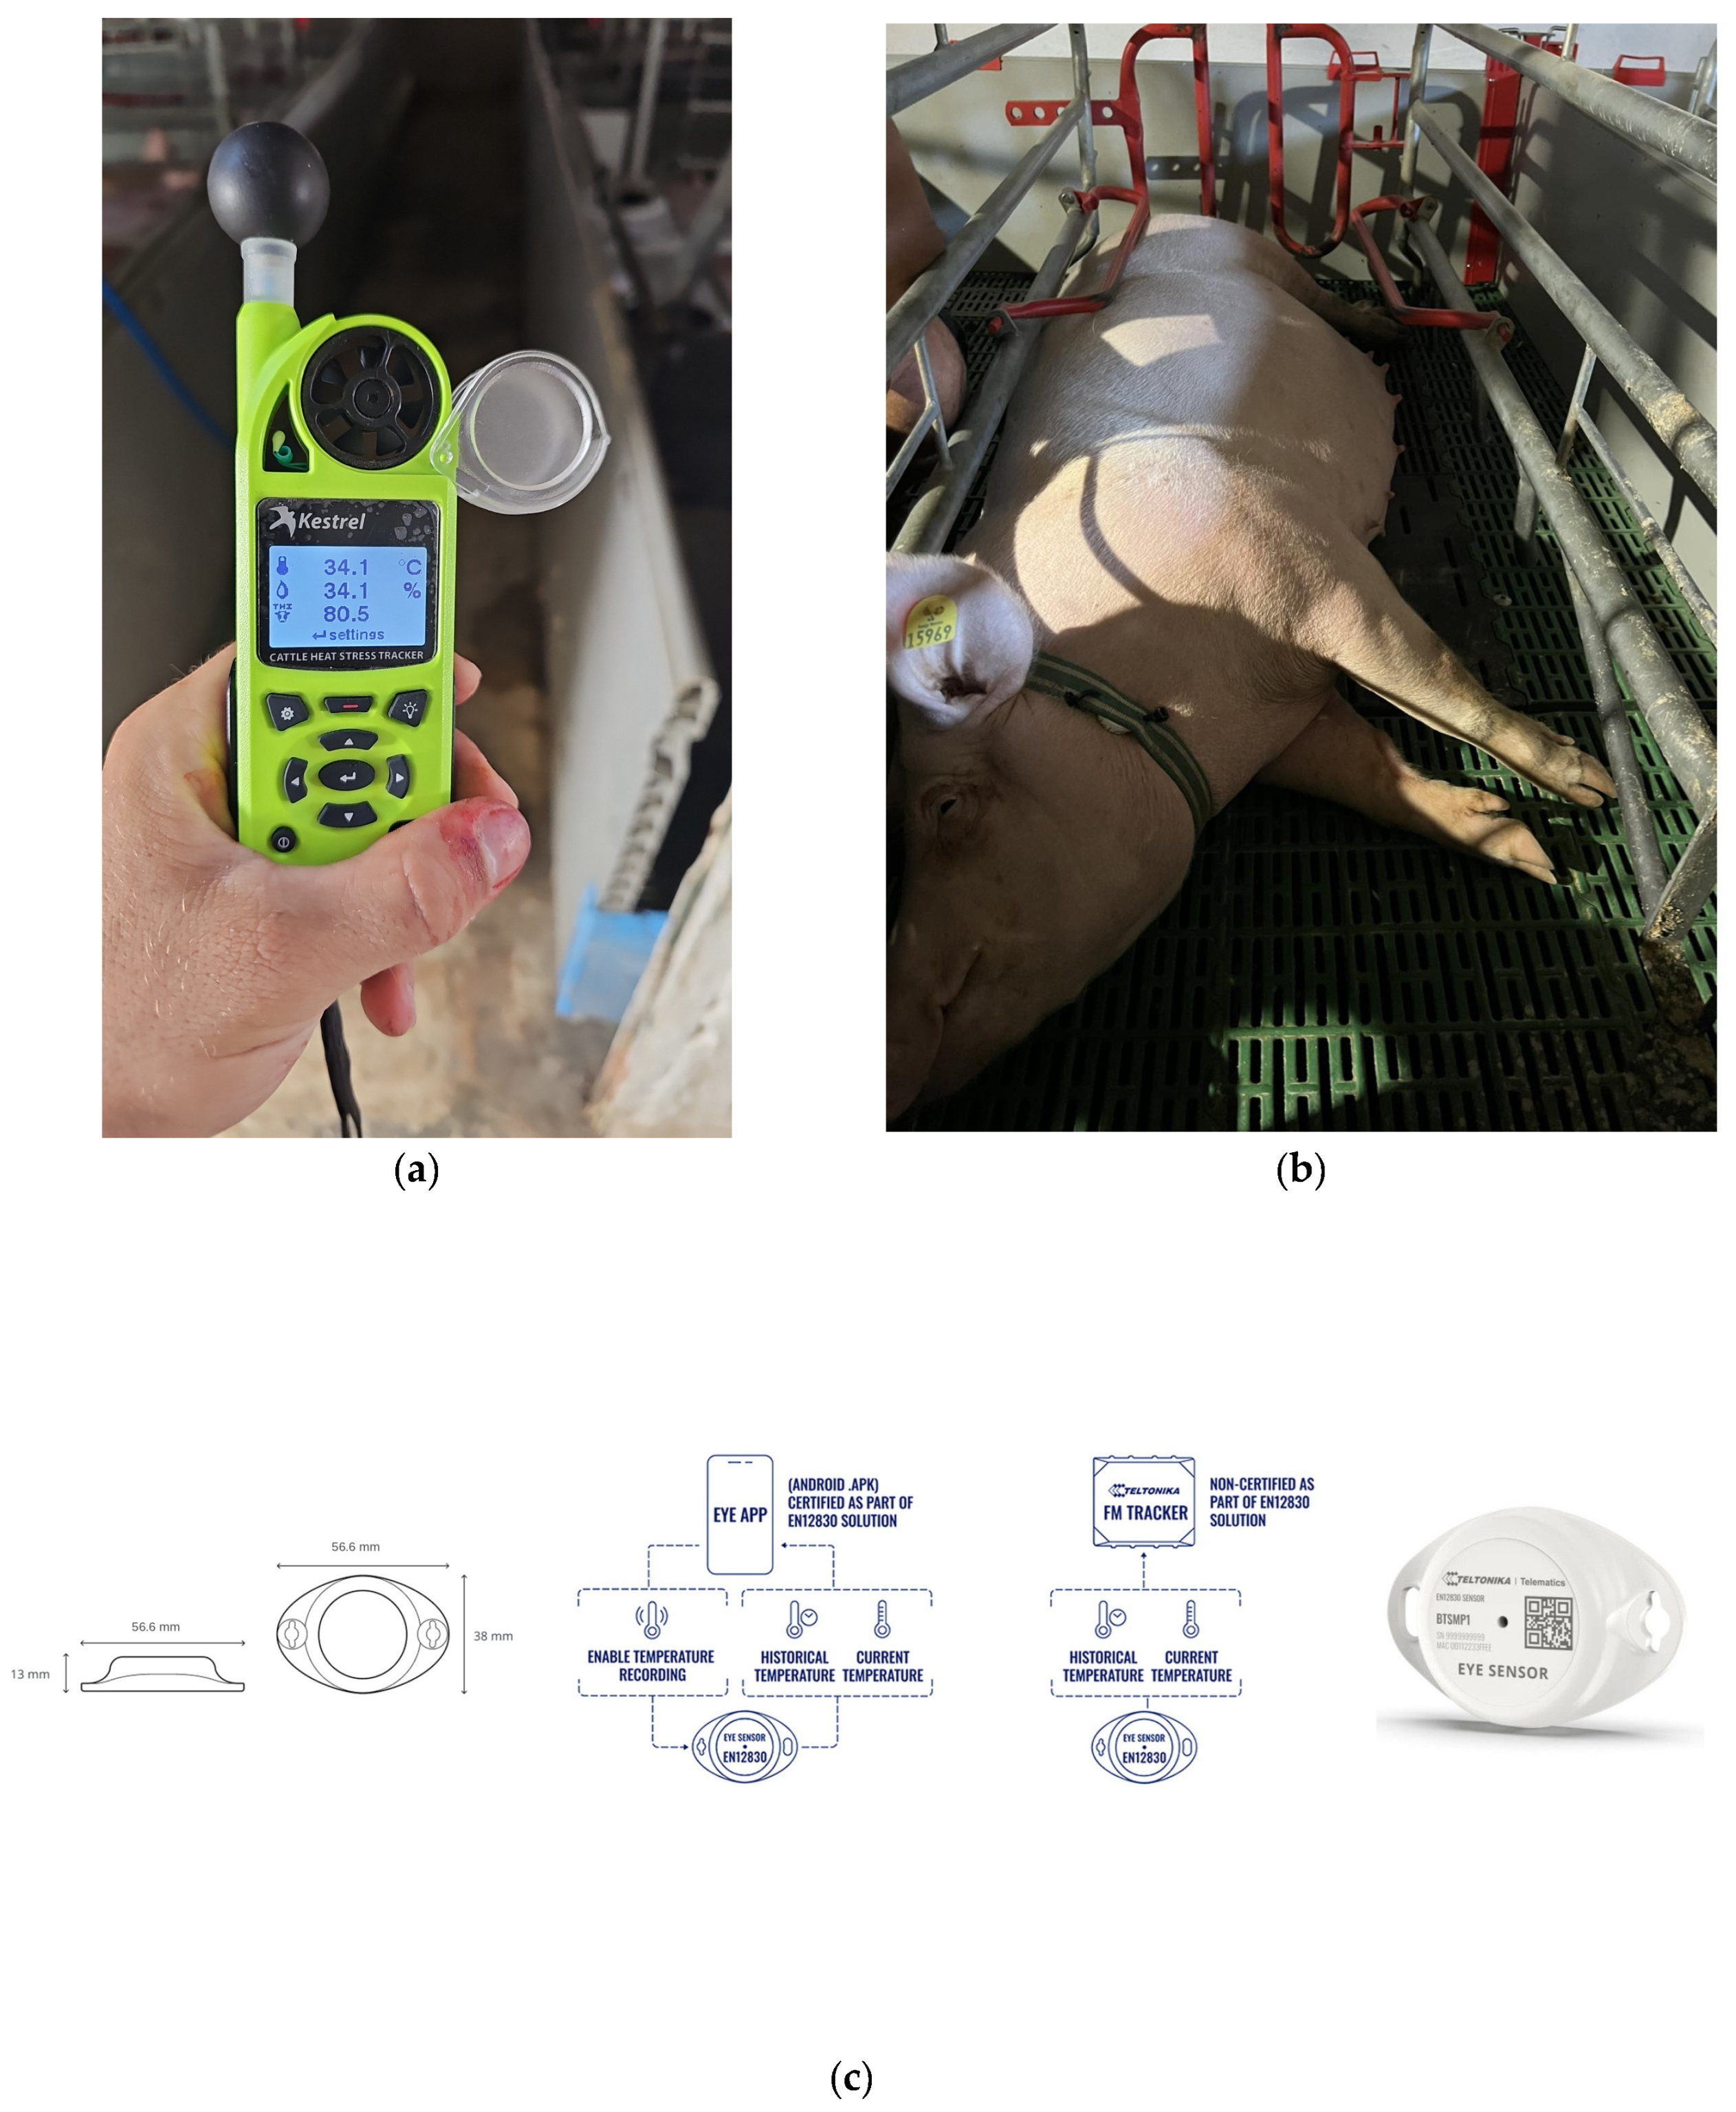
Indoor microenvironmental parameters, including ambient temperature (Ta) and relative humidity (RH), were measured using a Kestrel 5400 Heat Stress Tracker environment meter (Nielsen-Kellerman, Kestrel Instruments, Boothwyn, PA, USA), which was placed approximately 1.6 m above the floor and as close as possible to the centre of the rooms and at equal intervals within the house rooms [15,16,17,18] (Figure 2a).
The Kestrel 5400 directly measures five primary environmental parameters from on-board sensors: ambient (dry-bulb) air temperature (AT, °C; accuracy ± 0.5 °C, resolution 0.1 °C), relative humidity (RH, %; accuracy ± 2% RH, resolution 0.1% RH), globe temperature (GT, °C; accuracy ± 1.4 °C, resolution 0.1 °C), wind speed (WS, m/s; accuracy ± 3% of reading, resolution 0.1 m/s), and barometric pressure (hPa; accuracy ± 1.5 hPa). Globe temperature is recorded by a thermistor housed within a 1-inch (25 mm) black powder-coated copper globe, whose output is algorithmically converted to the equivalent of a standard 6-inch (150 mm) globe [18]. From these primary inputs, the device calculates a suite of composite thermal indices. Of these, dew point temperature (Tdp, °C; accuracy ± 1.9 °C) and Wet Bulb Globe Temperature (WBGT, °C; accuracy ± 0.7 °C) were retained for analysis in the present study. The WBGT display requires approximately 8 min to reach 95% accuracy following large environmental changes; all recorded values were obtained after this equilibration period had elapsed.
The indoor Temperature–Humidity Index (THI) was calculated from AT and Tdp using the equation of Yousef (1985) [19]:
THI = AT + (0.36 × T~dp~) + 41.2
where AT is the dry-bulb temperature (°C) and T~dp~ is the dew point temperature (°C). The Heat Load Index (HLI) was computed from GT, RH, and WS, following Gaughan et al. (2008) [20]. Although the HLI was originally developed for feedlot cattle, it integrates globe temperature, relative humidity, and wind speed in a manner that captures the combined thermal load on the animal in a way relevant to housed livestock more broadly. In the absence of a validated pig-specific equivalent incorporating globe temperature and wind speed, the HLI was used here as a supplementary composite indoor thermal index, alongside WBGT. Its values should therefore be interpreted in relative rather than absolute terms, and its application to pigs is acknowledged as a limitation of the present study.
HLI~GT ≥ 25~ = 8.62 + 0.38 × RH + 1.55 × GT − 0.5 × WS + e(2.4 − WS)
HLI~GT < 25~ = 10.66 + 2.8 × RH + 1.3 × GT − WS
where RH is expressed as a percentage, GT is globe temperature (°C), WS is wind speed (m/s), and e is the base of the natural logarithm.
The monthly average value of each indoor parameter was determined by averaging four indoor measurements taken each month (one measurement per week, conducted on the same day of the week at midday, representing peak daily thermal conditions). Measurements were taken during the hours 12:00–14:00 to capture maximum daily indoor heat load. It should be noted that the Kestrel 5400 does include a built-in data logger function capable of continuous recording; however, given the practical constraints of a commercial farm setting, where the device was also used for routine farm monitoring, only four manual spot-measurement sessions per month were conducted. This represents a limitation of the indoor dataset, and continuous logging in future studies would provide a more complete picture of indoor thermal dynamics. It is important to note that the indoor THI [19] and outdoor THI [14] are calculated using two different formulas: The indoor THI uses the Yousef (1985) [19] equation, incorporating dew point temperature. This formula is built into the Kestrel 5400 device and was the most appropriate given the sensor’s available outputs (AT and Tdp). The outdoor THI, however, follows Rauw et al. (2020) [14] using relative humidity. Consequently, the two THI values serve different monitoring purposes and cannot be compared numerically. A unified formula could not be applied because the two data sources provided different sensor output variables. Data collection was carried out using a USB cable connection, followed by on-screen verification of the results.

2.5. Continuous Sow Neck Skin Surface Temperature Monitoring

Neck skin surface temperature was recorded continuously using Bluetooth Low Energy (BLE) temperature sensors (Teltonika BTSMP1 EN12830; Teltonika IOT Group, Vilnius, Lithuania) applied to the neck skin of eight (8) lactating sows (Figure 2b,c) per month during the entire lactation period (25–30 days per cycle; June–September). The sensor is certified under EN12830 for cold chain monitoring and was selected for its small size, light weight, and non-invasive application. The sensors recorded neck skin surface temperature at 15-min intervals. It is acknowledged that neck skin surface temperature is a proxy measure and does not directly correspond to rectal (core) body temperature; validation against rectal temperature was performed in a subset of animals during the study and is discussed in the Limitations section. Raw logger data were corrected for scale (÷100) and screened for artefacts (values < 5 °C excluded). Total valid observations: 50,871.

2.6. Blood Sampling and Oxidative Stress Biomarkers

Blood samples were collected via jugular vein puncture from sows during lactation (n = 8 per month) and the dry period (n = 8 per month), weaners (n = 8 per month), and fatteners (n = 8 per month) each month from June to October (5 months), yielding 40 samples per animal category and 160 samples in total. Samples were collected using BD Vacutainer® plasma tubes (Becton Dickinson, Franklin Lakes, NJ, USA) with EDTA as an anticoagulant. Plasma was obtained by centrifuging the samples at 12,000× g for 10 min at 4 °C. The resulting plasma was transferred to 1.5-mL microcentrifuge tubes and stored frozen at −80 °C until analysis.
Three oxidative stress biomarkers were quantified: (i) TBARS using a modified assay based on Keles et al. (2001) [6], with TBARS concentration calculated from the molar extinction coefficient of malondialdehyde (MDA); (ii) protein carbonyls (CARBS) following the DNPH method of Patsoukis et al. (2004) [7], expressed as nmol per mg protein; and (iii) total antioxidant capacity (TAC), determined by the DPPH radical-scavenging method of Janaszewska and Bartosz (2002) [5], expressed as mmol DPPH per litre of plasma. Statistical analysis of oxidative stress biomarkers is described in Section 2.10.

2.7. Animal Welfare Index (AWI) Assessment

Animal welfare was assessed monthly (June–October) using a Welfare Quality®-based Animal Welfare Indicators (AWI) scoring protocol [11,12], separately for sows, weaners, and fatteners (n = 10 animals per group per month).
Twenty indicators were scored using standardised ordinal scales (0 = normal; 1 = mild; 2 = severe for most indicators), adapted from the Welfare Quality® assessment protocol for pigs [11,12]. The indicators covered four welfare principle domains: (1) Good Feeding: body condition score, lameness; (2) Good Housing: thermal comfort (panting rate, huddling behaviour), cleanliness, pen space and floor condition; (3) Good Health: respiratory signs (coughing, sneezing), skin lesions and wounds, tail lesions, ear lesions, rectal prolapse, hernias, ocular discharge, nasal discharge, limb lesions; and (4) Appropriate Behaviour: stereotypies, social negative behaviour (biting/fighting), positive social behaviour, human–animal relationship (avoidance distance test), play behaviour. Scan sampling was conducted during 10 min observation sessions (5 scans per 2 min). For each animal-month, a total AWI score was calculated as the sum of all indicator scores (range 0–40), where higher scores indicate greater welfare impairment. All assessments were carried out by a single trained observer; inter-observer reliability was not formally assessed in this study, which is acknowledged as a limitation.

2.8. Productive Performance

Monthly farm records (May–October 2025) provided data on farrowing rate, abortion rate, regular and irregular returns to oestrus, total born and liveborn per litter, deadborn and mummies per litter, weaned piglets per sow, weaning weight, pre- and post-weaning mortality, average daily gain (ADG) during fattening, and age at slaughter. As these records were aggregated at farm level, denominators for individual-animal-level testing were not available; descriptive summaries and Spearman rank correlations with monthly THI are reported (see Section 2.10).

2.9. Histopathology

Tissue samples were collected post-mortem from animals that died during the summer monitoring period. Samples from the liver, kidney, skin, and spleen were fixed in 10% neutral-buffered formalin for 24 h, routinely processed through graded alcohols and xylene, embedded in paraffin, and sectioned at 4–5 μm thickness. Sections were stained with haematoxylin and eosin (H&E) and examined independently by two veterinary pathologists, who were blinded to the month of collection. Histopathological evaluation focused on the following parameters: hepatocellular degeneration (vacuolar degeneration, necrosis), glomerular and tubular changes in the kidney, presence of fibrinous microthrombi in small renal vessels, vascular wall alterations in the skin (perivascular oedema, eosinophilic proteinaceous material deposition), and lymphocyte depletion in splenic germinal centres. Lesion severity was scored on a semi-quantitative scale (0 = absent; 1 = mild/focal; 2 = moderate/multifocal; 3 = severe/diffuse). Discrepancies between the two pathologists were resolved by consensus. A total of samples from 4 deceased sows and 8 deceased fatteners were examined.

2.10. Statistical Analysis

All analyses were performed in Python (v3.12; SciPy v1.11; pandas v2.1). Normality was assessed using the Shapiro–Wilk test. Descriptive statistics are presented as mean ± SD.
Neck skin surface temperature analysis: The unit of analysis was the animal-day mean temperature, calculated by averaging all valid 15 min readings for each sow on each calendar day (n = 480 animal-day observations across 4 months). One-way ANOVA was applied to these animal-day means. Additionally, a more conservative analysis used animal monthly means as the unit (n = 32 animal-month values; n = 8 sows × 4 months), as each animal contributed measurements across multiple days within a month. Tukey HSD post hoc comparisons were performed following significant ANOVA results. Associations between daily outdoor THI and daily mean sow neck skin surface temperature were assessed using Pearson r and Spearman ρ (n = 120 unique calendar days with corresponding temperature and THI data). Linear regression was used to assess the predictive relationship between indoor WBGT (monthly means) and sow neck skin surface temperature (monthly means across n = 4 months).
Welfare analysis: The Friedman test evaluated within-category seasonal effects on AWI total scores (repeated measures, animal as block; n = 10 animals, k = 5 months). Kendall’s W was calculated as the effect size measure. Between-category differences within each month were assessed using the Kruskal–Wallis H-test. Oxidative stress analysis: Statistical comparisons between months for each animal group (lactating sows, dry sows, weaners, fatteners) were performed using one-way ANOVA with Tukey HSD post hoc test. Shapiro–Wilk normality testing was conducted prior to all parametric tests. The experimental unit was the individual animal sample.
Correlation analyses: Spearman rank correlations between monthly outdoor THI and outcome variables (biomarkers, AWI scores, production parameters) were calculated using monthly aggregate data (n = 5 time-points: June–October). With n = 5, the minimum detectable |ρ| at α = 0.05 (two-tailed) is approximately 0.878; these correlations should therefore be interpreted as descriptive and hypothesis-generating, not as confirmatory statistical tests. Results are reported as ρ with exact p-values. Effect sizes for Spearman correlations were classified as moderate (0.50–0.70), strong (0.70–0.90), or very strong/perfect (≥0.90) [21]. Statistical significance was set at α = 0.05 (two-tailed).

3. Results

3.1. Outdoor Environmental Heat Load

The results of the monthly environmental analysis showed that July had the highest heat load, with a mean THI of 91.96 and a maximum of 122.03. August was the next month with high THI values, with a mean THI of 85.79. There was a significant decrease in mean THI values during September (mean THI 78.98) and October (mean THI 64.13) (Table 1, Figure 3).
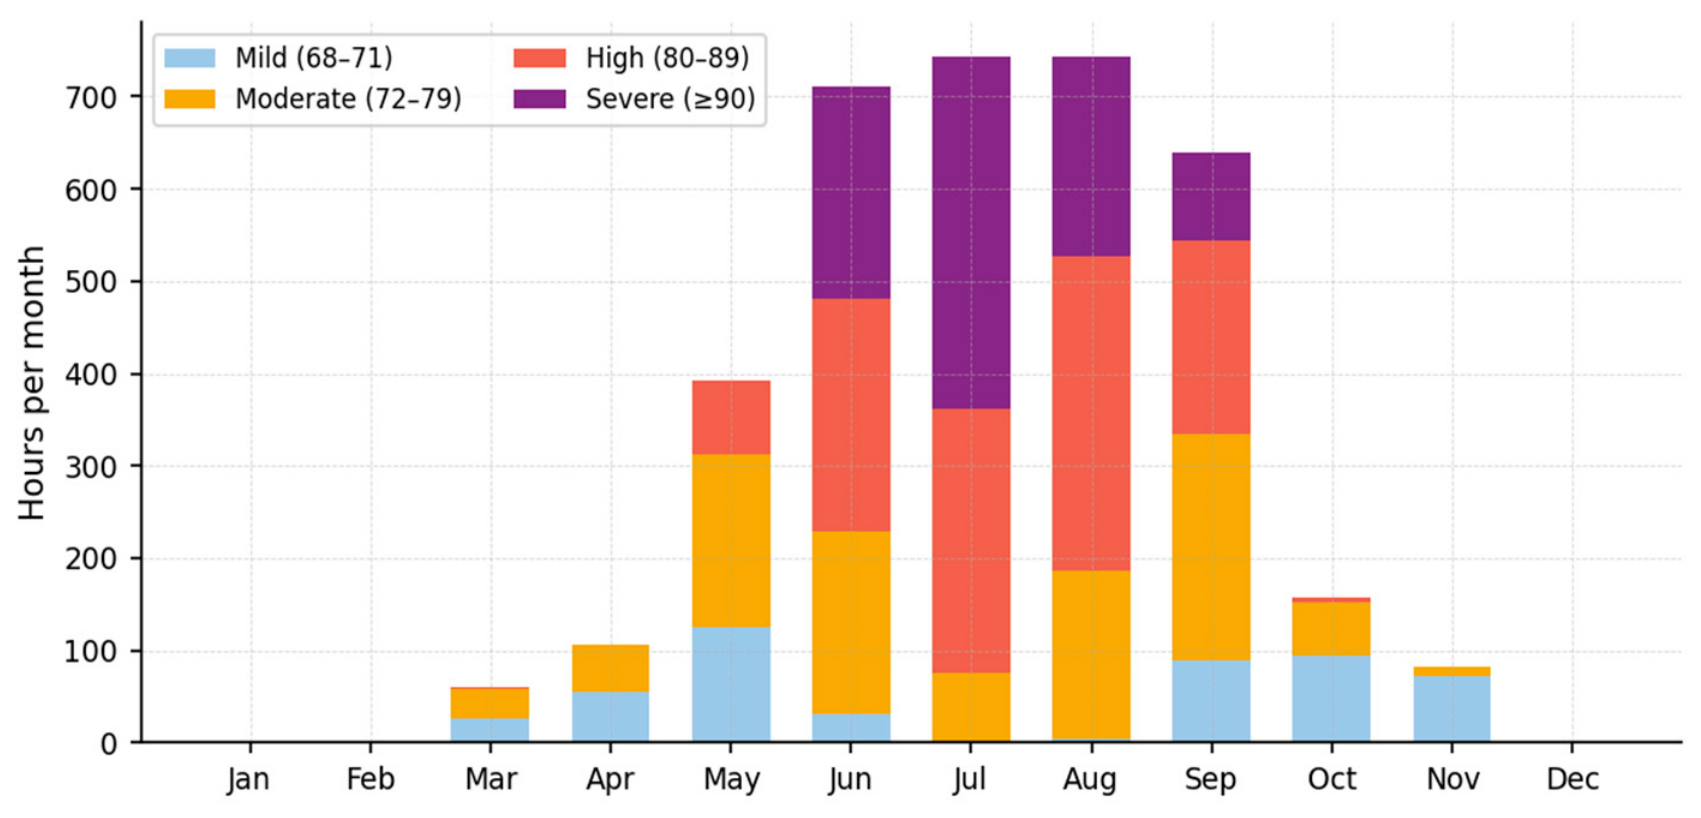
The distribution of heat-stress hours by category and month is reported in Table 2 and illustrated in Figure 3. The cumulative stress burden (THI ≥ 72) was 35.9% in May, rising to 94.2% in June, 100% in July (744 h), and 99.5% in August, before declining through September (76.5%) and October (8.6%). Severe stress (THI ≥ 90) was absent in May and October, but accounted for 229 h in June, 382 h in July, and 217 h in August.
Figure 3 presents the stacked monthly distribution of heat-stress hours. The data highlight the concentration of high and severe stress in June–August, with July showing the greatest proportional burden of severe conditions (382 h; 51.3% of the month). The rapid transition from mild-to-no-stress conditions in October underscores the abrupt ending of the heat-stress season.
The findings indicate a clear seasonal trend linking environmental heat loads with physiological responses in pigs. Severe heat stress (THI > 82) accounted for 20.9% of the total hours studied; the cumulative percentage of high to severe heat stress exceeded 27%, suggesting long-term and cumulative effects of thermal stress (Table 3, Figure 4).

3.2. Indoor Microclimate and Sow Neck Skin Surface Temperature

Indoor thermal conditions followed the outdoor seasonal pattern, remaining at high-stress levels throughout June–September for both HLI and WBGT (Table 4). Peak indoor conditions were recorded in July (WBGT = 80.25, HLI = 85.95) and August (WBGT = 80.18, HLI = 85.72). Environmental indices were highly intercorrelated (WBGT–THI: r ≈ 0.99).
After screening for physiological plausibility, 40,585 valid BLE readings were retained from 4 sows per month across June–September (8 sows were instrumented per month, but only 4 provided complete datasets due to sensor attrition (detachment or battery depletion)). Of the eight sows instrumented per month, four were excluded per month on average due to sensor loss or malfunction (sensor detachment from the neck during lactation or battery depletion before the end of the cycle), yielding complete monthly datasets from four sows. Computing animal-day means (n = 480 animal-day observations; 4 sows × ~30 days/month × 4 months) yielded the following monthly mean neck skin surface temperatures: June 36.76 ± 0.68 °C; July 37.81 ± 0.90 °C; August 37.06 ± 0.75 °C; September 36.42 ± 0.61 °C (Table 5). These values represent neck skin surface temperatures and are lower than typical rectal body temperatures in sows (38.5–39.5 °C); the relative seasonal variation (peak in July) is nonetheless consistent with thermoregulatory strain and is the primary outcome of interest in this analysis.
One-way ANOVA on animal-day means confirmed a highly significant month effect (F(3,476) = 76.50, p < 0.001). The more conservative ANOVA on animal monthly means (n = 16 animal-months; k = 4 months) also demonstrated a significant month effect (F(3,12) = 4.875, p = 0.019). Tukey HSD post-hoc analysis on animal monthly means identified a significant difference between July and September (mean difference = 1.387 °C, p = 0.015); other pairwise comparisons did not reach significance at α = 0.05 (Table 5). Normality of residuals was confirmed by the Shapiro–Wilk test for all month groups (all W > 0.93, all p > 0.05).
A strong positive association was observed between daily outdoor THI and daily mean sow neck skin surface temperature (Pearson r = 0.599, Spearman ρ = 0.547; both p < 0.001; n = 120 days). Indoor WBGT (monthly means, n = 4) explained 57.1% of neck skin surface temperature variability by linear regression (R2 = 0.571; β0 = 23.74, β1 = 0.169; p = 0.244). Note that the regression is exploratory given n = 4 monthly data points.

3.3. Animal Welfare Index Scores

AWI total scores showed a consistent and statistically significant seasonal pattern across all three production categories, with scores peaking in July and declining through September and October (Table 6). The AWI score represents the additive sum of 20 ordinal indicators, each scored 0 (normal), 1 (mild impairment), or 2 (severe impairment), yielding a theoretical range of 0 (no welfare issues) to 40 (maximum welfare impairment). Mean AWI scores in July were as follows: fatteners 17.1 ± 3.4; weaners 16.9 ± 5.1; sows 15.5 ± 4.9 (out of a possible maximum of 40). Compared to October baseline values, July scores were higher by 338% (fatteners), 284% (weaners), and 216% (sows).
The Friedman test confirmed highly significant within-category seasonal effects for all three groups: fatteners (χ2 = 32.93, df = 4, p < 0.001, Kendall’s W = 0.823), weaners (χ2 = 28.46, df = 4, p < 0.001, Kendall’s W = 0.711), and sows (χ2 = 26.52, df = 4, p < 0.001, Kendall’s W = 0.663; Table 7a). Kendall’s W values indicated strong-to-very-strong concordance in the seasonal welfare response across animals within each category.

3.4. Oxidative Stress Biomarkers

All three oxidative biomarkers demonstrated statistically significant monthly variation within each animal group (one-way ANOVA, Tukey HSD; Table 8). TAC was significantly reduced in July and August relative to June across all groups, reaching its nadir in July, then recovering progressively from September onwards. Protein carbonyls (CARBS) peaked in July across all groups. TBARS showed the most pronounced variation: July values were 1.47-fold (weaners) to 2.70-fold (lactating sows) higher than October values. The highest TBARS were recorded in lactating sows in July (10.04 ± 0.31 μM) versus October (3.72 ± 0.34 μM). Seasonal recovery of all biomarkers in September–October confirms that these changes are largely environmentally reversible.

3.5. Production and Reproductive Performance

Monthly farm records revealed consistent seasonal variation in reproductive and productive performance parameters (Table 9). The farrowing rate declined from 87.8% in May to 76.5% in August. The abortion rate peaked in July (4.23%), representing a 14-fold increase relative to October (0.30%). Total returns to oestrus reached 24.65% in July and 24.24% in August versus 10.0% in October. Deadborn piglets per sow rose sharply in August (4.45 vs. 3.04 in October), while mummies per sow peaked in July (0.30 vs. 0.09 in May). Post-weaning mortality peaked in July (18.2% vs. 5.1% in October). ADG in fattening declined from 768.5 g/day (May) to 610.0 g/day (July), and age at slaughter extended from 165 days (October) to 186 days (July). These production records are farm-level aggregates; individual-animal-level inferential testing was not applied.

3.6. Spearman Rank Correlation Analysis

All Spearman correlations in Table 10 are based on n = 5 monthly aggregate time-points (June–October). With n = 5, the minimum detectable |ρ| at α = 0.05 (two-tailed) is approximately 0.878. These analyses therefore have very limited statistical power for detecting moderate-to-strong (|ρ| < 0.88) associations. Results should be interpreted as descriptive and hypothesis-generating, not as confirmatory evidence. The reported correlations are nonetheless biologically coherent with a heat-stress aetiology and are consistent across multiple outcome domains.
Notwithstanding the above caveat, Spearman rank correlations between monthly outdoor THI and outcome variables revealed extensive, biologically coherent associations (Table 10). AWI scores showed perfect positive correlations with THI for all three groups (ρ = +1.00, p < 0.001), reflecting monotone seasonal patterns. TBARS were strongly to perfectly correlated with THI (ρ = +0.90 to +1.00); TAC showed strong-to-perfect negative correlations (ρ = −0.90 to −1.00). Among production variables, ADG (ρ = −1.00, p < 0.001), age at slaughter (ρ = +1.00, p < 0.001), total returns to oestrus (ρ = +1.00, p < 0.001), pre-weaning mortality (ρ = +1.00, p < 0.001), wean-to-service interval (ρ = +0.975, p = 0.005), farrowing rate (ρ = −0.90, p = 0.037), abortion rate (ρ = +0.90, p = 0.037), and weaning weight (ρ = −0.90, p = 0.037) all showed significant or near-significant associations with THI. Deadborn per sow (ρ = +0.50, p = 0.391) and non-productive days (ρ = +0.50, p = 0.391) did not reach significance, illustrating the statistical limitations of n = 5 analyses.

3.7. Histopathological Findings

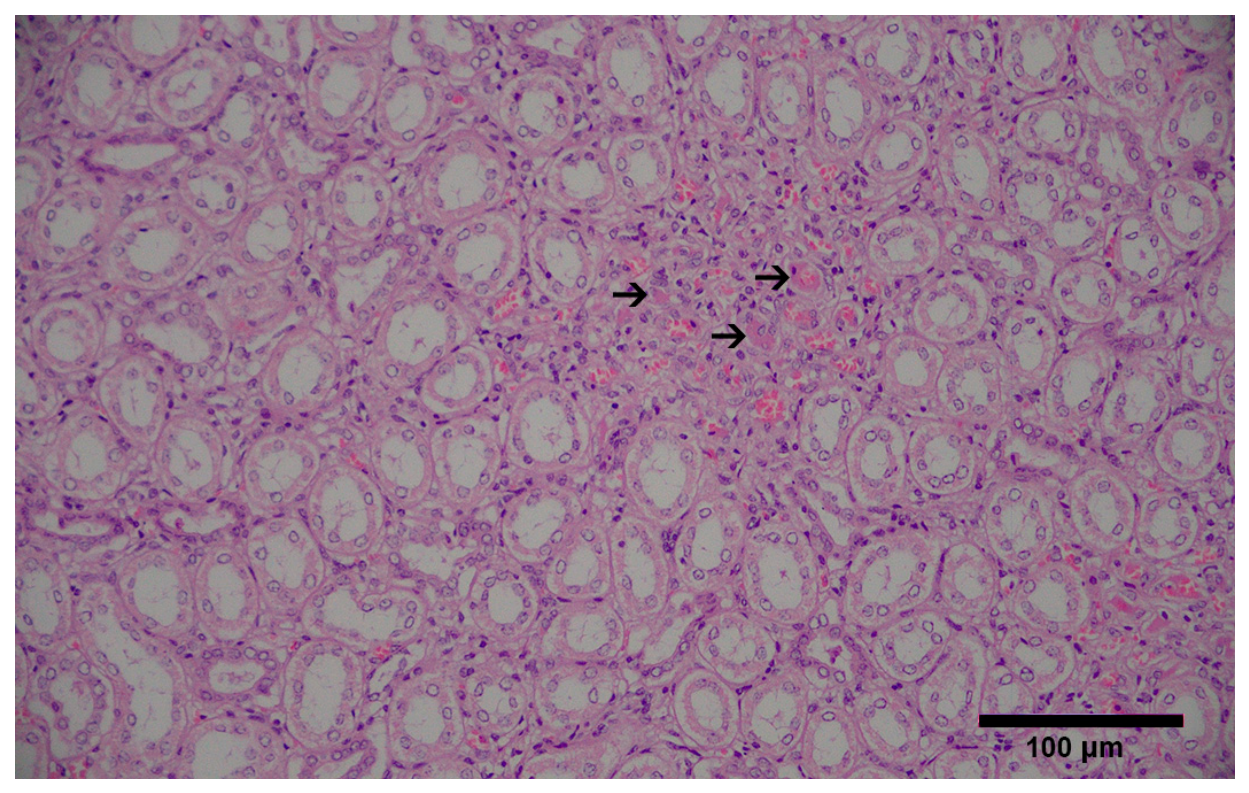
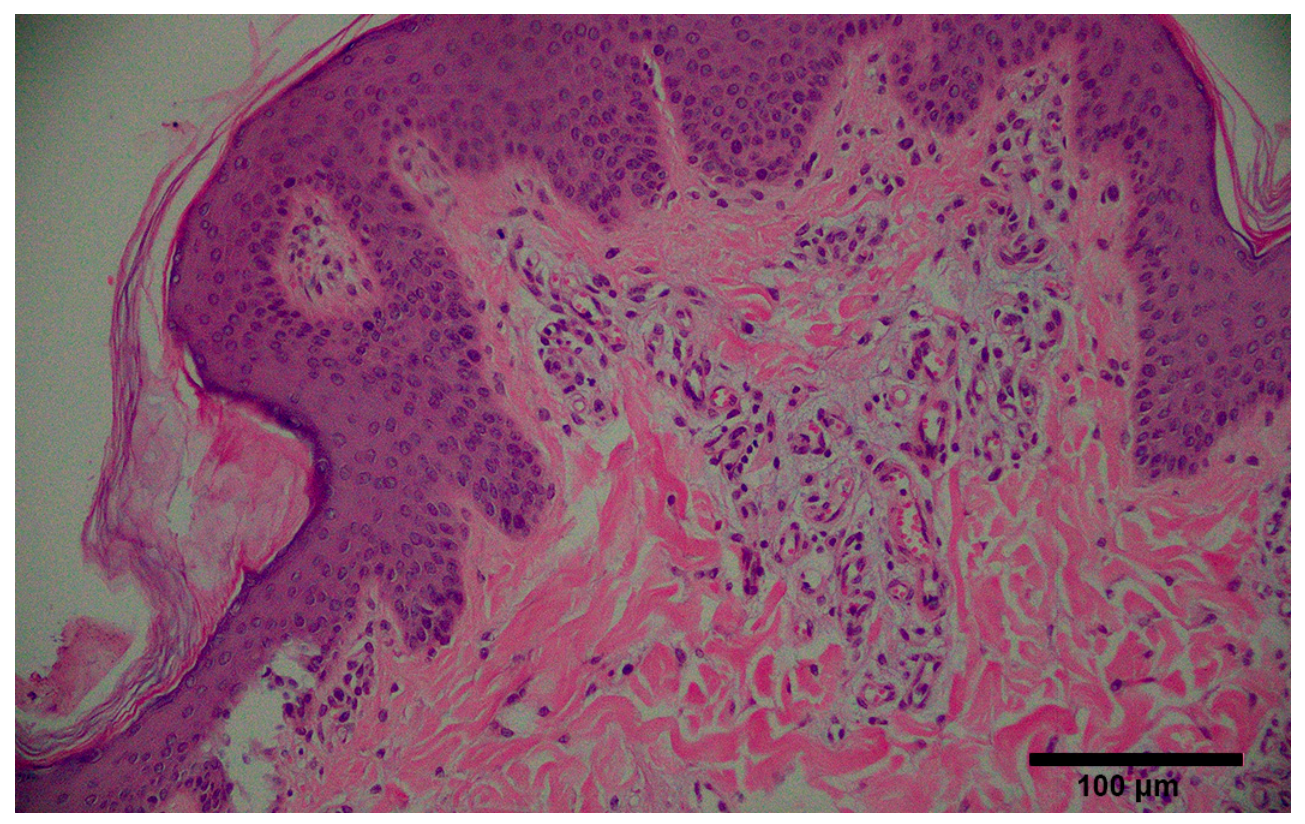
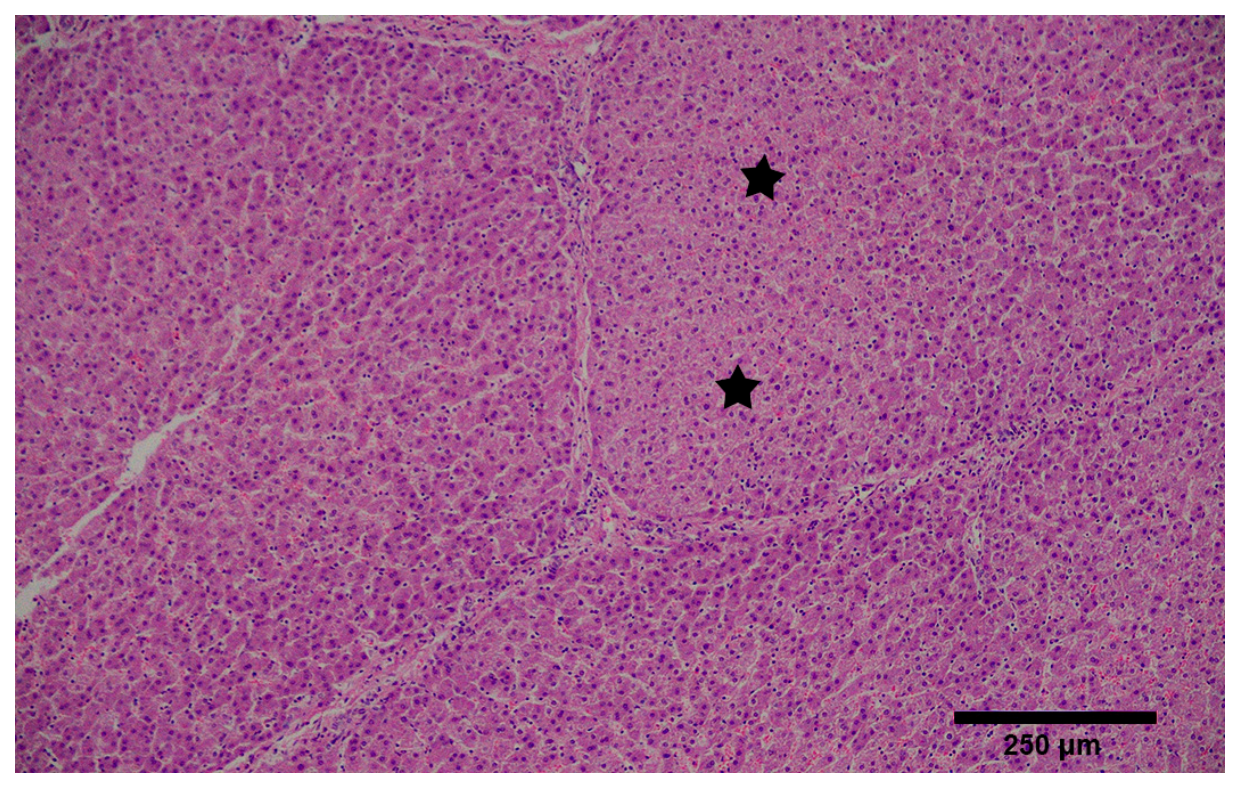
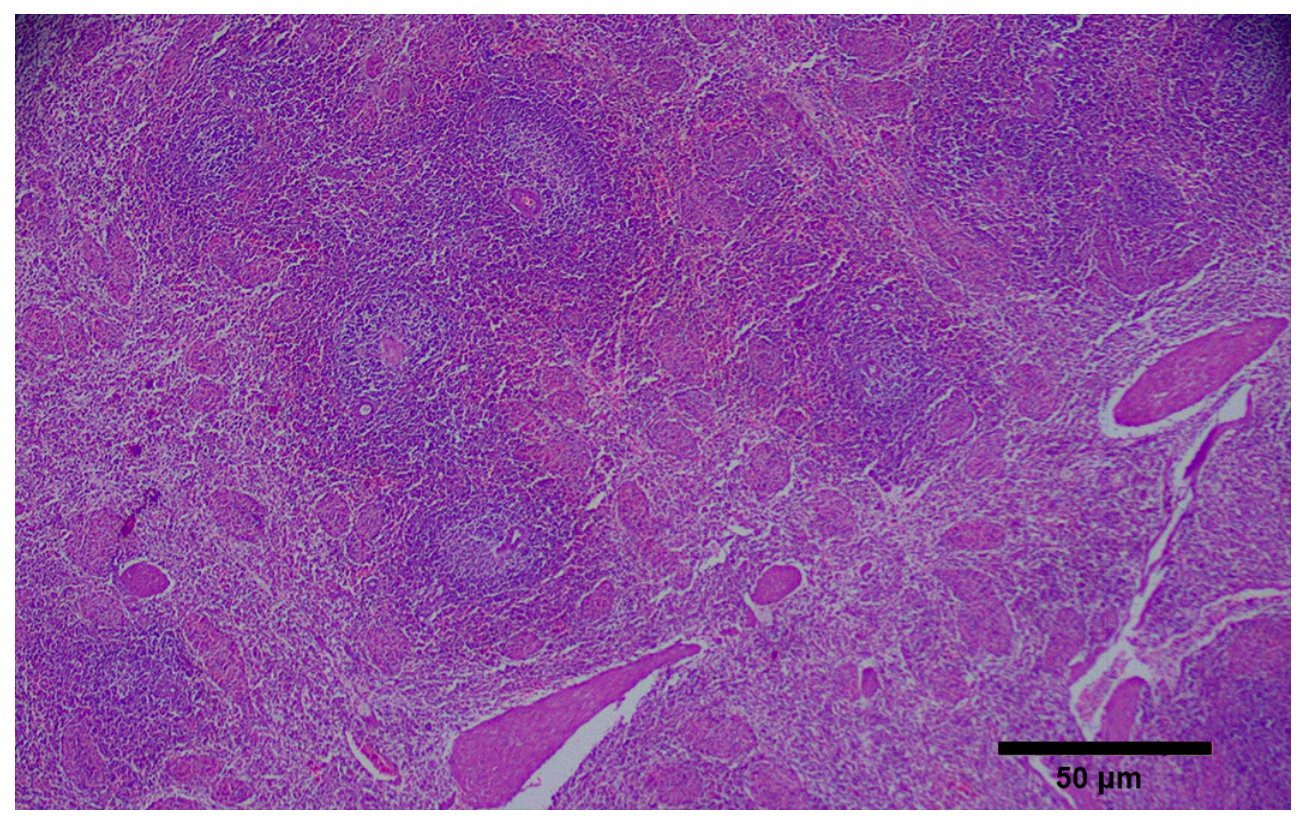
The histopathological findings observed in the examined pig are consistent with systemic vascular injury and ischaemic tissue damage compatible with severe heat stress. The multisystemic lesions, including fibrinous microthrombi in renal vessels (Figure 5), vascular alterations in the skin (Figure 6), hepatocellular degeneration (Figure 7), and lymphoid depletion in the spleen (Figure 8), suggest endothelial dysfunction, microcirculatory disturbance, activation of coagulation pathways, and stress-induced immunomodulation.

4. Discussion

The study offers a comprehensive, multi-parameter assessment of heat stress experienced by pigs raised on an intensive farrow-to-finish commercial farm under Mediterranean climatic conditions. A key aspect of the study design is the simultaneous analysis of multiple parameters related to the external environment, biology, physiology, well-being, and production.

4.1. Environmental Heat Load and Thermoregulation

The outcome of the study demonstrates that environmental heat load remains a critical issue in pig production in the Mediterranean climate. The length of time each year spent above the heat stress threshold was considerable, suggesting that pigs suffered from accumulated heat load rather than acute heat load. The influence of thermal stress in Mediterranean climates has often been understated due to insufficient emphasis on high temperatures in studies [8]. The hot period, occurring in July, is an important aspect of this issue [8].
The positive correlation between environmental heat indices and sow neck skin surface temperatures confirms a physiological response to changes in the ambient thermal environment. The choice to use outdoor THI for daily-resolution correlation analyses, rather than indoor WBGT, was dictated by data availability: indoor measurements were recorded only four times per month, providing insufficient resolution for day-level analyses, whereas outdoor THI was available at hourly resolution throughout the study. The close agreement between indoor and outdoor indices (r ≈ 0.99) supports outdoor THI as an adequate proxy for the thermal load experienced by animals under the naturally ventilated housing conditions of this farm. Future studies with continuous indoor logging would allow more precise indoor-based correlations. It should be noted that using animal-level aggregation in this study minimizes the risk of exaggerating these relationships, which can occur when using high-frequency sensor data. This approach is important in the context of precision livestock farming research based on continuous sensor data streams [22]. The seasonal variations in neck skin surface temperatures indicate that thermoregulatory strain occurred throughout the hot summer months.
In addition, this outcome reflects the difficulty pigs experience in dissipating excess heat through evaporation. As temperature and humidity rise, it becomes increasingly difficult for behavioural and respiratory thermoregulation to reduce body temperature, resulting in increased body heat storage and, consequently, higher body temperature [1]. Since standard housing facilities do not provide sufficient protection from such conditions, as evidenced by high heat load indices indoors, this factor exacerbates the problem. Such limitations of naturally ventilated facilities under high thermal load have been demonstrated in other livestock housing studies [20].
The correlation between various environmental parameters appears to be high, demonstrating their ability to detect a single factor and indicating their usefulness as field tools for measuring heat stress [20]. However, the presence of high indoor readings despite the environmental measurements implies that measurement alone is insufficient and that measures should be taken to counteract the problem.

4.2. Welfare Implications of Heat Stress

The present results show a steady deterioration in animal welfare with increasing environmental heat load across all production categories. The seasonal change in this study, with the greatest reduction recorded in mid-summer and a subsequent reversal in autumn, clearly demonstrates the significant impact of heat stress on animal welfare under practical farm conditions. The correlation between the two variables supports the conclusion that environmental factors play a crucial role in influencing animal well-being [12,23].
Notably, there were no statistically significant differences in welfare impairment scores when comparing production categories on a monthly basis. This indicates a consistent negative effect of heat stress on animal welfare across all production categories. It suggests that heat stress should be addressed at the whole-farm level rather than by individual production categories, as previous animal welfare assessments targeted specific categories, despite environmental factors negatively affecting several welfare parameters [11].
The reduction in welfare impairment scores due to high heat loads results from decreased movement and interaction, increased breathing rate, and discomfort. These are all physiological signs of heat stress in animals. Pigs initially respond to heat stress through behavioural changes, which are ineffective under high heat loads [1].
The analysis reveals a highly significant relationship between the environmental indices and welfare scores; however, these findings must be interpreted with caution, given the limited sample size. Conversely, analyses using data from individual animals support the assertion that welfare deterioration is linked to thermal load and cannot be attributed solely to seasonal changes.

4.3. Oxidative Stress and Redox Imbalance

The assessment of oxidative biomarker status in this study has provided significant evidence of heat-induced redox imbalance in pigs under farm conditions. Notably, the seasonal pattern observed during the hot period, characterized by an increase in oxidative damage biomarkers and a decrease in antioxidant capacity, indicates the impact of heat stress on the balance between the production of reactive oxygen species (ROS) and antioxidants [2,24].
Heat stress is known to stimulate ROS synthesis in mitochondria and suppress the activity of antioxidant enzymes, resulting in oxidative modification of lipids, proteins, and other cellular structures [2]. The observed increase in the end products of lipid and protein peroxidation, together with the reduction in total antioxidant potential, confirms this physiological process. The findings of this study are consistent with data from other studies on heat and metabolic stress in animals [2].
The strong reaction observed in the lactating sows was highly significant, likely due to the increased energy demands of lactation. Lactation is characterized by high energy consumption and elevated oxidative reactions, which make the animal more vulnerable to oxidative disturbances under adverse environmental conditions. Understanding the relationship between the animal’s physiological state and its environmental sensitivity is important when assessing the effects of heat stress at specific production stages.
The return of oxidative parameters to normal values following a reduction in ambient temperatures also indicated that the observed redox disturbances were primarily caused by environmental factors and were therefore reversible. Consequently, specific measures can be implemented to mitigate the harmful effects of heat stress on the animals’ physiological processes. These measures include supplementing their diet with nutrients and antioxidants, as well as modifying environmental conditions, such as providing shade.

4.4. Productive Performance Under Heat Stress

The present observational data are consistent with the view that environmental heat stress was associated with significant impairments in both reproductive efficiency and farm productivity. This association is reflected in the marked seasonal changes observed in all analysed indicators, suggesting that heat stress contributes to limiting farm production potential.
The reduction in farrowing rate, together with the increased abortion rate and higher frequency of returns to oestrus, indicates disruption of normal reproductive function associated with increasing thermal load. These associations are consistent with the well-documented adverse effects of heat stress on the hypothalamus–pituitary–gonadal axis, follicular development, and foetal viability described in the literature [25,26], although the observational nature of the present data does not allow definitive attribution of causality. High temperatures are believed to impair conception and increase foetal mortality through these mechanisms.
Negative effects on growth performance were also observed, including lower average daily weight gains and delayed age at slaughter. These findings are consistent with the known effects of reduced feed intake, metabolic changes, and the additional energy required for thermoregulation under heat stress conditions. This is a well-established pattern of response to heat exposure in pigs, in which energy that would otherwise be used for growth is redirected towards heat dissipation [8], though the farm-level aggregated nature of these data precludes individual-level inference.
In addition, higher pre- and post-weaning mortality rates observed during the peak heat stress months further suggest increased vulnerability in animals, especially young ones, during periods of high thermal load. These findings are consistent with the proposed mechanisms of heat-stress-associated immunosuppression, compromised gut permeability, and increased sensitivity to concurrent stressors [10], though causality cannot be directly established from the farm-level records available in this study.
These findings highlight that integrating environmental monitoring with production data is an effective approach to identify critical periods when strategies such as cooling, feeding, and breeding need to be implemented to prevent thermal stress [8,27].

4.5. Histopathological Evidence of Systemic Impact

The histological findings observed in 4 deceased sows and 8 deceased fatteners—including microvascular damage, coagulation disturbances, vascular changes, and lymphocyte depletion—are consistent with patterns described in the literature for systemic injury associated with severe heat stress [3,4]. Fibrinous microthrombi in renal blood vessels are consistent with the activation of coagulation pathways, while the vascular lesions observed in the skin suggest endothelial injury and increased permeability. Lymphocyte depletion in splenic germinal centres is compatible with stress-induced immunomodulation, possibly mediated by glucocorticoids [28]. Hepatocellular degeneration and renal lesions may be consistent with ischaemia or hypoxia secondary to circulatory redistribution under high thermal load [29]. It is important to emphasise, however, that these animals died during the summer monitoring period, and the histopathological findings cannot be attributed exclusively to heat stress, as intercurrent disease or other concurrent stressors cannot be ruled out. The lesions are described as being “consistent with” or “compatible with” heat-stress-related injury, not as confirmed causal findings. The pathological changes are nonetheless broadly aligned with the physiological and biochemical responses observed in other parameters of this study. The limited number of animals examined (4 sows and 8 fatteners) precludes population-level conclusions; these findings should be regarded as exploratory and hypothesis-generating.
Furthermore, all the aforementioned histopathological results have been confirmed by the physiological, welfare, and oxidative stress measurements conducted in this study. Higher levels of TBARS and protein carbonyls, along with reduced antioxidant activity, demonstrate the role of oxidative reactions in tissue disorders. Although the histopathological analysis was performed on a limited number of animals and therefore requires further investigation, it still provides additional evidence suggesting that heat stress may lead to organ malfunction.

4.6. Integrated Interpretation and Precision Livestock Farming Implications

The significance of this study lies in the inclusion of information obtained through environmental, physiological, biochemical, welfare, histopathological, and production measurements within a single commercial pig production unit. Increased THI and indoor heat load were associated with elevated neck skin surface temperature, reduced welfare index values, oxidative imbalance, decreased reproductive and production efficiency, and histopathological lesions indicative of tissue damage. The presence of biological responses at several of these levels provides further justification for considering heat stress in pigs as a multifactorial syndrome rather than solely an environmental issue. Importantly, these biological responses were statistically confirmed; correlations between environmental and production variables were demonstrated using monthly measurements.
Regarding Precision Livestock Farming (PLF), this study offers insights into the advantages of integrating environmental monitoring systems with sensor devices in practice. The results show that continuous measurement of neck skin surface temperature by Bluetooth Low Energy (BLE) is feasible and may assist in detecting thermoregulation disorders in pigs. When integrated with physiological measurements and environmental factors, this approach can support more effective heat stress mitigation strategies [22,30].

4.7. Limitations and Future Directions

Several issues should be considered when drawing conclusions from the results presented in our study. Firstly, the correlations between monthly average outdoor THI values and combined variables were calculated using only five months of observations (June–October), which results in limited statistical power to detect associations of moderate strength. The minimum detectable |ρ| at α = 0.05 with n = 5 is approximately 0.878; therefore, all reported Spearman correlations should be interpreted as descriptive and hypothesis-generating rather than confirmatory. Secondly, although changes in neck skin surface temperature followed a clear seasonal pattern, there may be within-subject autocorrelation due to multiple daily measurements for each animal. A mixed-effects model with animal as a random factor would provide a more robust analytical design in future studies. Nevertheless, the conservative analysis using animal monthly means (n = 16 animal-months) also confirmed the significant month effect, supporting the reliability of the main findings. Thirdly, the BLE sensors measured neck skin surface temperature, not core body temperature. Neck skin surface temperature is expected to be systematically lower than rectal temperature (typically 38.5–39.5 °C in sows), which is reflected in the recorded values (36.4–37.8 °C). While validation against concurrent rectal temperature measurements was performed in a subset of animals and confirmed that the relative seasonal pattern was consistent, formal paired validation across a larger sample would strengthen the application of this technology. Users of these data should note that absolute temperature values are not interchangeable with rectal temperature. Furthermore, sensor attrition (detachment or battery depletion) meant that only 4 of 8 instrumented sows per month contributed complete datasets, limiting statistical power at the animal level. Fourthly, the study was conducted on a single commercial farm in a Mediterranean climate, without active cooling systems, which may have amplified the thermal load relative to farms with climate control. The results may therefore not be fully generalizable to farms with different management, housing, or cooling conditions, or to non-Mediterranean climates. Fifthly, welfare assessments were performed by a single trained observer, ensuring internal consistency but precluding formal inter-observer reliability testing; this should be included in future studies. The AWI total score was computed as an unweighted additive sum across 20 indicators; the equal weighting assigned to each indicator was not formally validated. Sixthly, the indoor microclimate was characterized by only four spot measurements per month. Although the Kestrel 5400 has a built-in logging function, continuous indoor recording was not implemented in this study; future studies should exploit this capability for more representative indoor thermal characterization. Lastly, histopathological examination was conducted on a limited number of animals (4 sows and 8 fatteners) that died during the monitoring period. These animals cannot be assumed to be representative of the general farm population; the lesions observed are compatible with heat-stress-related injury but cannot be attributed exclusively to heat stress in the absence of a control group or comprehensive diagnostic workup. These findings should therefore be regarded as supportive and hypothesis-generating rather than conclusive.

5. Conclusions

This study presents a comprehensive field evaluation of the associations between heat stress and multiple biological, welfare, and productive parameters on a commercial farrow-to-finish pig farm under Mediterranean climatic conditions. Using environmental measurements, neck skin surface temperature monitoring with BLE technology, oxidative stress analysis, animal welfare assessments, histopathological examination, and farm-level production records, it is shown that periods of high thermal load were consistently associated with biological and productive impairments in pigs. Specifically, elevated heat load during summer months was associated with increased neck skin surface temperature in lactating sows, worsened animal welfare scores, increased oxidative stress markers, decreased antioxidant capacity, histopathological lesions compatible with heat-stress-related tissue damage, reduced reproductive performance, decreased weight gain, and higher mortality rates. Given the observational and single-farm design of this study, these findings are interpreted as associations consistent with a heat-stress aetiology, rather than definitive causal conclusions.
This study further highlights the potential benefits of combining environmental monitoring with animal monitoring in precision livestock farming (PLF). Specifically, continuous monitoring of pig neck skin surface temperature using BLE technology was found to be practical on commercial farms and could assist in the early detection of thermoregulation issues. Given the increasing thermal challenges facing livestock production systems, effective mitigation strategies—such as improving ventilation and cooling methods, providing antioxidant-rich nutrition, and managing reproduction—are expected to become increasingly important in modern commercial pig farming. Longitudinal multi-farm studies are recommended to extend and confirm the findings of this study.

Author Contributions

Conceptualization, V.G.P., L.F. and C.V.; methodology, V.G.P., E.C., C.E., D.A., G.T., C.V., L.F., N.P., D.P. and G.I.P.; validation, E.M.; formal analysis, E.C., C.E., G.T., C.V., L.F. and G.I.P.; investigation, V.G.P., E.C., C.E., D.A., G.T., C.V., L.F., D.G., K.D., E.-G.S. and G.I.P.; writing—original draft preparation, E.C., C.E., D.A., G.T., E.M., D.G., K.D., E.-G.S., L.F., N.P. and G.I.P.; writing—review and editing, V.G.P., C.V. and D.P.; supervision, V.G.P. and C.V. All authors have read and agreed to the published version of the manuscript.

Funding

This research was funded by “SUB1.1. Clusters of Research Excellence (CREs)” (O.P.S. code TA 5180519). It is included in Subproject 1 of the Action “Promoting Quality, Innovation, and Extroversion in Universities” (Strategy for Excellence in Universities & Innovation—ID 16289) of the National Recovery and Resilience Plan “Greece 2.0,” with the title “Study on the impact of heat stress on livestock: Adaptation and Mitigation/AdaMit-Livestock HS” and under grant number 8289 of the Research Committee of the University of Thessaly.

Institutional Review Board Statement

This study was approved by the Institutional Ethical Committee of the University of Thessaly (Approval No. 45, dated 12 May 2025).

Data Availability Statement

The original contributions presented in this study are included in the article. Further inquiries can be directed to the corresponding author.

Acknowledgments

The authors sincerely thank the farm owner and the management staff for their valuable collaboration, access to facilities, and contributions to this study. During the preparation of this manuscript/study, the authors used ChatGPT Go (Open AI, GPT-5.5) for the preparation of the Graphical Abstract. The authors have reviewed and edited the output and take full responsibility for the content of this publication.

Conflicts of Interest

The authors declare no conflicts of interest.

Abbreviations

The following abbreviations are used in this manuscript:
ATAmbient Temperature
AWIAnimal Welfare Indicators
BLEBluetooth Low Energy
CARBSProtein Carbonyls
GTGlobe Temperature
HLIHeat Load Index
HPA axisHypothalamic–Pituitary–Adrenal axis
MDAMalondialdehyde
WSWind Speed
PLFPrecision Livestock Farming
RHRelative Humidity
ROSReactive Oxygen Species
TACTotal Antioxidant Capacity
TBARSThiobarbituric Acid Reactive Substances
TdpDew Point Temperature
THITemperature–Humidity Index
WBGTWet Bulb Globe Temperature

References

  1. Huynh, T.T.T.; Aarnink, A.J.A.; Gerrits, W.J.J.; Heetkamp, M.J.W.; Canh, T.T.; Spoolder, H.A.M.; Kemp, B.; Verstegen, M.W.A. Thermal behaviour of growing pigs in response to high temperature and humidity. Appl. Anim. Behav. Sci. 2005, 91, 1–16. [Google Scholar] [CrossRef]
  2. Bernabucci, U.; Lacetera, N.; Baumgard, L.H.; Rhoads, R.P.; Ronchi, B.; Nardone, A. Metabolic and hormonal acclimation to heat stress in domesticated ruminants. Animal 2010, 4, 1167–1183. [Google Scholar] [CrossRef] [PubMed]
  3. Bouchama, A.; Knochel, J.P. Heat stroke. N. Engl. J. Med. 2002, 346, 1978–1988. [Google Scholar] [CrossRef] [PubMed]
  4. Leon, L.R.; Helwig, B.G. Heat stroke: Role of the systemic inflammatory response. J. Appl. Physiol. 2010, 109, 1980–1988. [Google Scholar] [CrossRef] [PubMed]
  5. Janaszewska, A.; Bartosz, G. Assay of total antioxidant capacity: Comparison of four methods as applied to human blood plasma. Scand. J. Clin. Lab. Investig. 2002, 62, 231–236. [Google Scholar] [CrossRef]
  6. Keles, M.S.; Taysi, S.; Sen, N.; Aksoy, H.; Akçay, F. Effect of corticosteroid therapy on serum and CSF malondialdehyde and antioxidant proteins in multiple sclerosis. Can. J. Neurol. Sci. 2001, 28, 141–143. [Google Scholar] [CrossRef] [PubMed]
  7. Patsoukis, N.; Zervoudakis, G.; Panagopoulos, N.T.; Georgiou, C.D.; Angelatou, F.; Matsokis, N.A. Thiol redox state and oxidative stress in the mouse hippocampus after pentylenetetrazol-induced epileptic seizure. Neurosci. Lett. 2004, 357, 83–86. [Google Scholar] [CrossRef] [PubMed]
  8. Renaudeau, D.; Collin, A.; Yahav, S.; de Basilio, V.; Gourdine, J.L.; Collier, R.J. Adaptation to hot climate and strategies to alleviate heat stress in livestock production. Animal 2012, 6, 707–728. [Google Scholar] [CrossRef] [PubMed]
  9. Gerasopoulos, K.; Stagos, D.; Petrotos, K.; Kokkas, S.; Kantas, D.; Goulas, P.; Kouretas, D. Feed supplemented with polyphenolic byproduct from olive mill wastewater processing improves the redox status in blood and tissues of piglets. Food Chem. Toxicol. 2015, 86, 319–327. [Google Scholar] [CrossRef] [PubMed]
  10. Pearce, S.C.; Mani, V.; Weber, T.E.; Rhoads, R.P.; Patience, J.F.; Baumgard, L.H.; Gabler, N.K. Heat stress reduces intestinal barrier integrity and favors intestinal glucose transport in growing pigs. PLoS ONE 2013, 8, e70215. [Google Scholar] [CrossRef] [PubMed]
  11. Dalmau, A.; Velarde, A.; Scott, K.; Edwards, S.; Butterworth, A.; Veissier, I.; Keeling, L.; van Overbeke, G.; Bedaux, V. Welfare Quality® Assessment for Pigs (Sows and Piglets, Growing and Finishing Pigs); Welfare Quality Consortium: Lelystad, The Netherlands, 2009. [Google Scholar]
  12. Friedrich, L.; Krieter, J.; Kemper, N.; Czycholl, I. Interobserver reliability of the Welfare Quality® animal welfare assessment protocol for sows and piglets. Anim. Welf. 2020, 29, 323–337. [Google Scholar] [CrossRef]
  13. Baumgard, L.H.; Rhoads, R.P. Effects of heat stress on postabsorptive metabolism and energetics. Annu. Rev. Anim. Biosci. 2013, 1, 311–337. [Google Scholar] [CrossRef] [PubMed]
  14. Rauw, W.M.; de Mercado de la Peña, E.; Gomez-Raya, L.; García-Cortés, L.A.; Ciruelos, J.J.; Gómez-Izquierdo, E. Impact of environmental temperature on production traits in pigs. Sci. Rep. 2020, 10, 2106. [Google Scholar] [CrossRef] [PubMed]
  15. Bakony, M. Heat Stress in Dairy Calves: Insights on Importance, Methodology and Abatement. Ph.D. Thesis, University of Veterinary Medicine, Budapest, Hungary, 2021. [Google Scholar]
  16. Bang, N.N.; Gaughan, J.B.; Hayes, B.J.; Lyons, R.E.; McNeill, D.M. Application of infrared thermal technology to assess the level of heat stress and milk yield reduction of cows in tropical smallholder dairy farms. J. Dairy Sci. 2022, 105, 8454–8469. [Google Scholar] [CrossRef] [PubMed]
  17. Bang, N.N.; Gaughan, J.B.; Hayes, B.J.; Lyons, R.E.; Chanh, N.V.; Trach, N.X.; Khang, D.N.; McNeill, D.M. Characteristics of cowsheds in Vietnamese smallholder dairy farms and their associations with microclimate—A preliminary study. Animals 2021, 11, 351. [Google Scholar] [CrossRef] [PubMed]
  18. Nielsen-Kellerman Co. Product Specifications for Kestrel 5400 Heat Stress Tracker. Available online: https://kestrelinstruments.com (accessed on 24 May 2026).
  19. Yousef, M.K. Basic Principles. In Stress Physiology in Livestock; CRC Press: Boca Raton, FL, USA, 1985; Volume 1. [Google Scholar]
  20. Gaughan, J.B.; Mader, T.L.; Holt, S.M.; Lisle, A. A new heat load index for feedlot cattle. J. Anim. Sci. 2008, 86, 226–234. [Google Scholar] [CrossRef] [PubMed]
  21. Mukaka, M.M. A guide to appropriate use of correlation coefficient in medical research. Malawi Med. J. 2012, 24, 69–71. [Google Scholar] [PubMed]
  22. Berckmans, D. General introduction to precision livestock farming. Anim. Front. 2017, 7, 6–11. [Google Scholar] [CrossRef]
  23. Bracke, M.B.M.; Spruijt, B.M.; Metz, J.H.M. Overall animal welfare assessment reviewed. Part 2: Assessment tables and schemes. Neth. J. Agric. Sci. 1999, 47, 293–305. [Google Scholar] [CrossRef]
  24. Nardone, A.; Ronchi, B.; Lacetera, N.; Ranieri, M.S.; Bernabucci, U. Effects of climate changes on animal production and sustainability of livestock systems. Livest. Sci. 2010, 130, 57–69. [Google Scholar] [CrossRef]
  25. Hansen, P.J. Effects of heat stress on mammalian reproduction. Philos. Trans. R. Soc. B Biol. Sci. 2009, 364, 3341–3350. [Google Scholar] [CrossRef]
  26. Tao, S.; Dahl, G.E. Heat stress effects during late gestation on dry cows and their calves. J. Dairy Sci. 2013, 96, 4079–4093. [Google Scholar] [CrossRef] [PubMed]
  27. St-Pierre, N.R.; Cobanov, B.; Schnitkey, G. Economic losses from heat stress by US livestock industries. J. Dairy Sci. 2003, 86, E52–E77. [Google Scholar] [CrossRef]
  28. Sapolsky, R.M.; Romero, L.M.; Munck, A.U. How do glucocorticoids influence stress responses? Integrating permissive, suppressive, stimulatory, and preparative actions. Endocr. Rev. 2000, 21, 55–89. [Google Scholar] [CrossRef] [PubMed]
  29. Hall, D.M.; Buettner, G.R.; Oberley, L.W.; Xu, L.; Matthes, R.D.; Gisolfi, C.V. Mechanisms of circulatory and intestinal barrier dysfunction during whole-body hyperthermia. Am. J. Physiol. Heart Circ. Physiol. 2001, 280, H509–H521. [Google Scholar] [CrossRef] [PubMed]
  30. Papakonstantinou, G.I.; Voulgarakis, N.; Terzidou, G.; Fotos, L.; Giamouri, E.; Papatsiros, V.G. Precision livestock farming technology: Applications and challenges of animal welfare and climate change. Agriculture 2024, 14, 620. [Google Scholar] [CrossRef]
Figure 1. Wireless Digital Weather Station Agenso MeteoIo T 2100S 4G (Agenso, Athens, Greece).
Agriculture 16 01498 g001
Figure 2. (a) Kestrel 5400 Heat Stress Tracker, (b) Sow with an applied Bluetooth Low Energy (BLE) temperature sensor on the neck of lactating sow (c) The used Bluetooth Low Energy (BLE) temperature sensor (Teltonika BTSMP1 EN12830).
Agriculture 16 01498 g002
Figure 3. Monthly distribution of heat-stress hours by THI category (mild, moderate, high, severe) from May to October 2025.
Agriculture 16 01498 g003
Figure 4. Overall cumulative distribution of heat-stress hours across all study months (May–October 2025) by THI category (mild, moderate, high, severe), expressed as total hours and as a percentage of monitored hours (8760 h). Data derived from Table 3. Note: Figure 3 presents the monthly breakdown; this figure provides the aggregated seasonal perspective.
Agriculture 16 01498 g004
Figure 5. Kidney: Fibrinous microthrombi in small renal vessels indicated by arrows (consistent with ischemic injury), magnification ×200.
Agriculture 16 01498 g005
Figure 6. Skin: Perivascular edema and thickening of the walls of small vessels with eosinophilic proteinaceous material deposition in capillary walls (indicative of early vascular injury), magnification ×200.
Agriculture 16 01498 g006
Figure 7. Liver: Mild disturbance of hepatic lobular architecture due to hepatocellular degeneration in the area indicated by asterisks, magnification ×100.
Agriculture 16 01498 g007
Figure 8. Spleen: Lymphocyte depletion within the germinal centres; magnification ×40.
Agriculture 16 01498 g008
Table 1. Monthly outdoor environmental summaries (May–October 2025).
MonthMean (°C)SDMinMaxMean (%)SDMeanSDMinMax
Temperature (°C)Relative Humidity (%)THI
May19.24.310.128.766.018.169.47.454.687.7
June26.64.416.737.453.816.285.39.065.0111.4
July29.74.720.441.445.217.292.010.272.4122.0
August27.03.718.836.452.517.685.87.270.0107.8
September23.84.514.635.260.620.479.08.761.9103.3
October16.23.29.125.876.614.664.15.353.182.1
Note: Data represent hourly recordings. SD = standard deviation. RH = relative humidity. THI = Temperature–Humidity Index. Months with mean THI exceeding the moderate heat-stress threshold (72).
Table 2. Monthly heat-stress hours by THI category (May–October 2025).
MonthMild
(68–71)
Moderate
(72–79)
High
(80–89)
Severe (≥90)Total ≥ 72% of Month
May12518879026735.9%
June3219725222967894.2%
July075287382744100.0%
August418234121774099.5%
September892452109655176.5%
October945950648.6%
Note: Hours refer to total hours per month in each THI category. % of month calculated on 744 h (31-day months) or 720 h (30-day months).
Table 3. Stress levels in outdoor environment of study farm.
Stress LevelsBelowMildModerateHighSevere
Number of hours51224997575521830
Percentages58.5%5.7%8.6%6.3%20.9%
Table 4. Monthly indoor microclimate parameters (June–October 2025). Values are means across four within-month measurement sessions.
MonthIndoor THIHLIWBGT
June80.3283.6279.22
July81.3885.9580.25
August81.0885.7280.18
September78.0374.7074.68
October71.6572.8070.82
Note: Indoor THI is not directly numerically comparable to outdoor THI.
Table 5. Monthly sow neck skin surface temperature (mean ± SD of animal-day means) and ANOVA results.
MonthBody Temp (°C)n (Animal-Days)n (Sows)
June36.76 ± 0.681204
July37.81 ± 0.901204
August37.06 ± 0.751204
September36.42 ± 0.611204
ANOVA (animal-day unit)F(3,476) = 76.50, p < 0.001
ANOVA (animal monthly means)F(3,12) = 4.875, p = 0.01916 animal-months4 per month
Tukey HSD (animal monthly means): July vs. September—mean difference = 1.387 °C, p = 0.015. All other pairwise comparisons: p > 0.05.
Table 6. Mean ± SD AWI total scores by production group and month (n = 10 animals per cell).
GroupJuneJulyAugustSeptemberOctober
Fatteners10.0 ± 2.617.1 ± 3.414.4 ± 2.17.0 ± 4.13.9 ± 3.2
Weaners8.8 ± 2.416.9 ± 5.114.3 ± 2.66.7 ± 4.14.4 ± 3.6
Sows10.3 ± 3.215.5 ± 4.914.7 ± 4.97.0 ± 3.44.9 ± 3.8
Higher scores indicate greater welfare impairment. The scale is an additive sum of 20 ordinal indicators (range 0–40).
Table 7. (a) Friedman test results for within-category seasonal effect of month on AWI total scores (n = 10 animals, k = 5 months). (b) Kruskal–Wallis test: between-category AWI differences within each month (all comparisons non-significant).
(a)
Categoryχ2 (Friedman)dfp-ValueKendall’s W
Fatteners32.934<0.0010.823 (strong)
Weaners28.464<0.0010.711 (strong)
Sows26.524<0.0010.663 (moderate–strong)
(b)
MonthKruskal Hp-ValueInterpretation
June2.7850.248No between-group difference
July0.4470.800No between-group difference
August0.7010.704No between-group difference
September0.0180.991No between-group difference
October0.3960.820No between-group difference
No significant between-category differences were observed within any month (Kruskal–Wallis, all H < 3.0, all p > 0.05; Table 7b), indicating that heat stress exerted a broadly uniform effect across all production stages.
Table 8. Mean ± SD for oxidative stress biomarkers by production group and month (June–October 2025). Different superscript letters indicate statistically significant differences between months (p < 0.05, Tukey HSD).
GroupJuneJulyAugustSeptemberOctober
TAC—Total Antioxidant Capacity (mmol DPPH/L Plasma)
Weaners0.36 ± 0.05 a0.28 ± 0.04 ab0.23 ± 0.02 b0.42 ± 0.16 c0.51 ± 0.09 d
Fatteners0.34 ± 0.17 a0.23 ± 0.06 b0.27 ± 0.08 b0.49 ± 0.08 c0.62 ± 0.11 d
Lactating sows0.42 ± 0.10 a0.29 ± 0.07 b0.38 ± 0.10 ac0.48 ± 0.06 ae0.57 ± 0.03 f
Dry sows0.37 ± 0.04 a0.25 ± 0.10 b0.31 ± 0.07 ac0.56 ± 0.11 d0.69 ± 0.09 e
Protein Carbonyls/CARBS (nmol/mg protein)
Weaners1.28 ± 0.18 a1.41 ± 0.15 bc1.36 ± 0.06 cd1.19 ± 0.27 e0.99 ± 0.12 f
Fatteners1.01 ± 0.40 a1.45 ± 0.09 b1.29 ± 0.22 b1.05 ± 0.14 ac0.89 ± 0.07 d
Lactating sows0.97 ± 0.05 a1.42 ± 0.11 b1.31 ± 0.39 b1.23 ± 0.28 bc0.82 ± 0.09 d
Dry sows1.02 ± 0.14 a1.39 ± 0.14 ab1.25 ± 0.08 bc1.11 ± 0.30 d0.92 ± 0.13 e
TBARS—Thiobarbituric Acid Reactive Substances (μM)
Weaners6.00 ± 0.96 a7.86 ± 0.14 b7.09 ± 0.23 b3.88 ± 0.71 c2.99 ± 0.45 d
Fatteners4.48 ± 0.23 a8.15 ± 0.23 b7.53 ± 0.45 c4.33 ± 0.97 ad3.48 ± 0.17 e
Lactating sows6.85 ± 0.65 a10.04 ± 0.31 b9.41 ± 0.55 b4.01 ± 0.54 c3.72 ± 0.34 c
Dry sows4.90 ± 0.92 a8.44 ± 0.25 b6.78 ± 0.17 c4.87 ± 0.18 ad3.86 ± 0.11 e
TAC = Total Antioxidant Capacity (higher = better antioxidant defence). CARBS = protein carbonyls (higher = greater protein oxidative damage). TBARS = Thiobarbituric Acid Reactive Substances (higher = greater lipid peroxidation).
Table 9. Monthly reproductive and productive performance parameters (May–October 2025).
ParameterMayJuneJulyAugustSeptemberOctober
Farrowing rate (%)87.880.3478.7576.585.6487.8
Abortion rate (%)0.61.254.232.341.30.3
Irregular returns to oestrus (%)8.59.59.869.096.675.0
Non-irregular returns to oestrus (%)7.59.214.7915.1510.835.0
Total returns to oestrus (%)16.018.724.6524.2417.510.0
Duration of gestation (days)116.1117.6117.3117.7116.4116.5
Total born/sow16.2315.5816.0416.4616.2816.2
Total liveborn/sow13.1713.3712.7812.0112.612.8
Deadborn/sow3.062.213.264.453.033.04
Mummies/sow0.090.070.300.210.200.22
Weaned piglets/sow12.111.7110.7710.211.612.1
Body weight at weaning (kg)7.857.256.256.456.757.85
Pre-weaning mortality (%)8.1212.4115.7215.0711.675.46
Post-weaning mortality (%)9.59.618.29.47.05.1
ADG—fattening stage (g/day)768.5665.0610.0610.5735.0762.0
Age at slaughter (days)168174186181169165
Table 10. Spearman rank correlations (ρ) between monthly outdoor THI and key outcome variables (n = 5 monthly time-points, June–October). Results are descriptive and hypothesis-generating; see text for interpretation caveats.
Variable (vs. Monthly Outdoor THI)ρp-ValueInterpretation
AWI—Fatteners+1.000<0.001Very strong (+) †
AWI—Weaners+1.000<0.001Very strong (+) †
AWI—Sows+1.000<0.001Very strong (+) †
TBARS—Weaners+1.000<0.001Very strong (+) †
TBARS—Fatteners+1.000<0.001Very strong (+) †
TBARS—Lactating sows+1.000<0.001Very strong (+) †
TBARS—Dry sows+1.000<0.001Very strong (+) †
CARBS—Weaners+1.000<0.001Very strong (+) †
CARBS—Fatteners+0.9000.037Strong (+) *
CARBS—Lactating sows+0.9000.037Strong (+) *
CARBS—Dry sows+0.9000.037Strong (+) *
TAC—Weaners−0.9000.037Strong (−) *
TAC—Fatteners−1.000<0.001Very strong (−) †
TAC—Lactating sows−1.000<0.001Very strong (−) †
TAC—Dry sows−1.000<0.001Very strong (−) †
ADG—fattening−1.000<0.001Very strong (−) †
Age at slaughter+1.000<0.001Very strong (+) †
Total returns to oestrus+1.000<0.001Very strong (+) †
Pre-weaning mortality+1.000<0.001Very strong (+) †
Wean-to-service interval+0.9750.005Very strong (+)
Post-weaning mortality+0.9000.037Strong (+) *
Farrowing rate−0.9000.037Strong (−) *
Abortion rate+0.9000.037Strong (+) *
Weaning weight−0.9000.037Strong (−) *
Weaned piglets/sow−0.8000.104Moderate (−), ns
Deadborn/sow+0.5000.391Weak (+), ns
Non-productive days+0.5000.391Weak (+), ns
† Perfect monotone rank (n = 5 months, all ranks preserved). * p < 0.05 (two-tailed). ns = not significant. Minimum detectable |ρ| at α = 0.05 with n = 5 ≈ 0.878.
Disclaimer/Publisher’s Note: The statements, opinions and data contained in all publications are solely those of the individual author(s) and contributor(s) and not of MDPI and/or the editor(s). MDPI and/or the editor(s) disclaim responsibility for any injury to people or property resulting from any ideas, methods, instructions or products referred to in the content.