Article

Spatial Mismatch Between Agricultural Heritage Systems and Eco-Cultural Service Provision in Zhejiang Province, China

1
College of Art Design, Nanjing Forestry University, Nanjing 210037, China
2
Jinpu Research Institute, Nanjing Forestry University, Nanjing 210037, China
*
Author to whom correspondence should be addressed.
Agriculture 2026, 16(11), 1199; https://doi.org/10.3390/agriculture16111199
Submission received: 2 May 2026 / Revised: 25 May 2026 / Accepted: 27 May 2026 / Published: 29 May 2026

Abstract

Agricultural heritage systems are traditional agroecosystems formed through long-term ecological adaptation, farming practices, and local knowledge transmission. Their conservation depends not only on formal recognition but also on ecological support and effective links with contemporary cultural service networks. Yet it remains unclear whether they are spatially aligned with the eco-cultural service conditions required for socio-ecological resilience and agroecological transition. Using 205 important agricultural heritage systems in Zhejiang Province, China, this study integrates nearest neighbor analysis, kernel density estimation, the InVEST model, a cultural service index, and spatial autocorrelation analysis. Results show that agricultural heritage systems are significantly clustered in northern and southwestern Zhejiang. Ecosystem service values are concentrated in the mountainous and hilly areas of southwestern and south-central Zhejiang, whereas cultural service provision is concentrated in the northern Zhejiang Plain and urbanized areas around Hangzhou Bay. Agricultural heritage systems show weak but statistically detectable spatial associations with ecosystem services, cultural service provision, and their eco-cultural synergy pattern, indicating limited spatial correspondence rather than strong spatial coupling. These findings indicate a spatial mismatch between historically evolved agricultural heritage systems, ecological support conditions, and contemporary cultural service provision. This study contributes a spatial diagnostic framework for identifying ecological-support gaps, cultural-service gaps, and eco-cultural mismatch areas, thereby informing differentiated agricultural heritage governance and regional planning.

1. Introduction

Agricultural heritage systems (AHS) are historically evolved agroecosystems shaped by long-term interactions between farming practices, ecological processes, and local knowledge. They integrate traditional agricultural technologies, biological resources, landscape patterns, and agrarian cultural values, reflecting the co-evolution of agricultural civilization and environmental conditions [1,2,3]. As living agroecosystems, AHS sustain traditional production modes, agricultural biodiversity, cultural landscapes, and place-based identity [4,5]. With the development of the Globally Important Agricultural Heritage Systems (GIAHS) initiative and China’s agricultural heritage conservation system, AHS have become important carriers of ecological security, agrarian civilization, and rural revitalization [6,7,8]. However, rapid urban expansion, agricultural modernization, and changing rural livelihoods have placed many traditional agricultural systems under growing pressure, leading to functional decline, landscape fragmentation, land-use conflict, and weakening knowledge transmission [9,10,11,12]. A key issue is therefore not only whether AHS are formally recognized, but whether they remain embedded in the ecological and cultural service conditions that support their long-term continuity.
Existing studies have made substantial progress in identifying the values and conservation approaches of agricultural heritage. Agricultural heritage is widely regarded as a composite system in which ecological, productive, economic, and cultural values are intertwined, and as an important link between traditional agrarian civilization and modern sustainable development [3,13]. In China, research has examined the objects, actors, and mechanisms of agricultural heritage conservation, emphasizing government guidance, multi-actor participation, dynamic conservation, and industrial integration [14,15,16]. Other studies have highlighted the multifunctionality of AHS in sustainable tourism, livelihood improvement, agrobiodiversity conservation, landscape maintenance, and ecological regulation [4,17,18]. Recent international studies further link agricultural heritage conservation with farmers’ practices, agrobiodiversity, local knowledge, cultural identity, and livelihood resilience in GIAHS and other small-scale farming systems [19,20,21]. These studies have clarified why agricultural heritage should be protected and how conservation can be organized. However, they have paid less attention to whether agricultural heritage systems remain spatially connected to the ecological foundations and cultural service networks required for their continued functioning as living agroecosystems.
Spatial research on agricultural heritage has also expanded from individual cases to national, watershed, and regional scales. Existing studies have revealed that agricultural heritage generally shows a broad distribution with localized clustering, and that its spatial center in China has gradually shifted from the Central Plains and the Yellow River Basin to the middle and lower reaches of the Yangtze River and then to the southeastern coast [22,23,24,25]. Zhejiang Province is one of the regions with the highest density and richest diversity of agricultural heritage in China, making it an important case for examining the internal spatial differentiation of AHS [26,27]. Previous studies have identified high-density clusters of agricultural heritage in Zhejiang and explored the effects of natural conditions, transport accessibility, economic development, tourism resources, and policy support on their spatial distribution [23,25,28,29]. These studies explain where agricultural heritage is distributed and what factors shape its spatial pattern, but they rarely evaluate whether heritage clusters overlap with ecosystem service advantages or contemporary cultural service provision.
This gap is important because the conservation of AHS increasingly requires more than the identification of heritage sites or the designation of protection units. In practice, agricultural heritage conservation is shifting toward regional systems, network-based protection, corridor-oriented governance, and zoning control [30]. Cultural tourism and industrial integration can enhance the visibility and economic vitality of agricultural heritage, but they may also cause cultural dilution, landscape homogenization, and ecological degradation if they are disconnected from ecological and cultural values [31,32]. Indicator systems and multi-criteria spatial analysis have therefore been introduced to identify conservation priority areas and support management decisions [33,34,35]. Nevertheless, existing zoning approaches still tend to rely on qualitative judgment or rule-based classification, and few studies have developed a quantitative framework that simultaneously links heritage distribution, ecological support, cultural service provision, and spatial mismatch.
Ecosystem service theory provides a useful perspective for diagnosing this problem. As living agroecosystems, AHS generate and depend on multiple services, including production, water regulation, soil retention, habitat maintenance, landscape experience, knowledge transmission, cultural identity, and public participation [13]. Methodologically, models such as InVEST have been widely used to assess ecosystem services, including water yield, habitat quality, and soil retention, and have supported ecological security pattern construction, key ecological source identification, and ecological corridor extraction [15,30,36,37]. Cultural ecosystem service research has also developed spatialized analytical approaches based on proxy indicators such as POIs, tourism statistics, accessibility, and landscape perception to represent cultural experience, public education, recreation, and participation [38,39,40]. Recent rural and agricultural landscape studies have further connected CES assessment with agrobiodiversity, public participation, and spatial planning [41,42]. Some studies have further incorporated natural, cultural, and socioeconomic factors into integrated frameworks to reveal the spatial differentiation of agricultural heritage multifunctionality [43,44,45]. For agricultural heritage, cultural services do not represent the intrinsic cultural value of heritage itself; rather, they indicate the contemporary service environment through which heritage knowledge, landscape experience, public participation, and value realization can be activated. Integrating ecosystem services and cultural services therefore makes it possible to examine whether AHS are spatially aligned with the eco-cultural conditions that support long-term conservation and resilience-oriented heritage governance.
Spatial mismatch provides a useful concept for clarifying this relationship. In ecosystem service research, spatial mismatch usually refers to the imbalance or disconnection between service-providing areas, service-demanding areas, service flows, and accessibility; such mismatch may weaken the realization of ecosystem service benefits and reduce the effectiveness of spatial planning [46,47,48]. Cultural ecosystem service studies further show that cultural benefits depend not only on landscape resources themselves, but also on accessibility, interpretation, public participation, social relations, and cultural value recognition [35,38,49]. In heritage contexts, studies on agricultural heritage in southern Chile have mapped intangible cultural ecosystem services based on culturally significant species, knowledge systems, and social relationships, and have shown that agricultural heritage can generate cultural values for both local and distant populations [35,50]. Recent studies have also begun to examine the spatial resilience of agricultural heritage and the dynamic relationship between natural and cultural ecosystem service supply and demand in heritage landscapes [51,52]. However, existing studies have mainly focused on the mapping, valuation, or supply-demand diagnosis of ecosystem services or cultural services. Few studies have examined whether agricultural heritage hotspots are spatially aligned with ecological support, cultural service capacity, and their eco-cultural synergy at the regional scale. This study therefore understands spatial mismatch as an ecological, cultural, functional, and accessibility-related problem, and uses it to diagnose where agricultural heritage conservation faces ecological-support gaps, cultural-service weaknesses, or limited eco-cultural synergy.
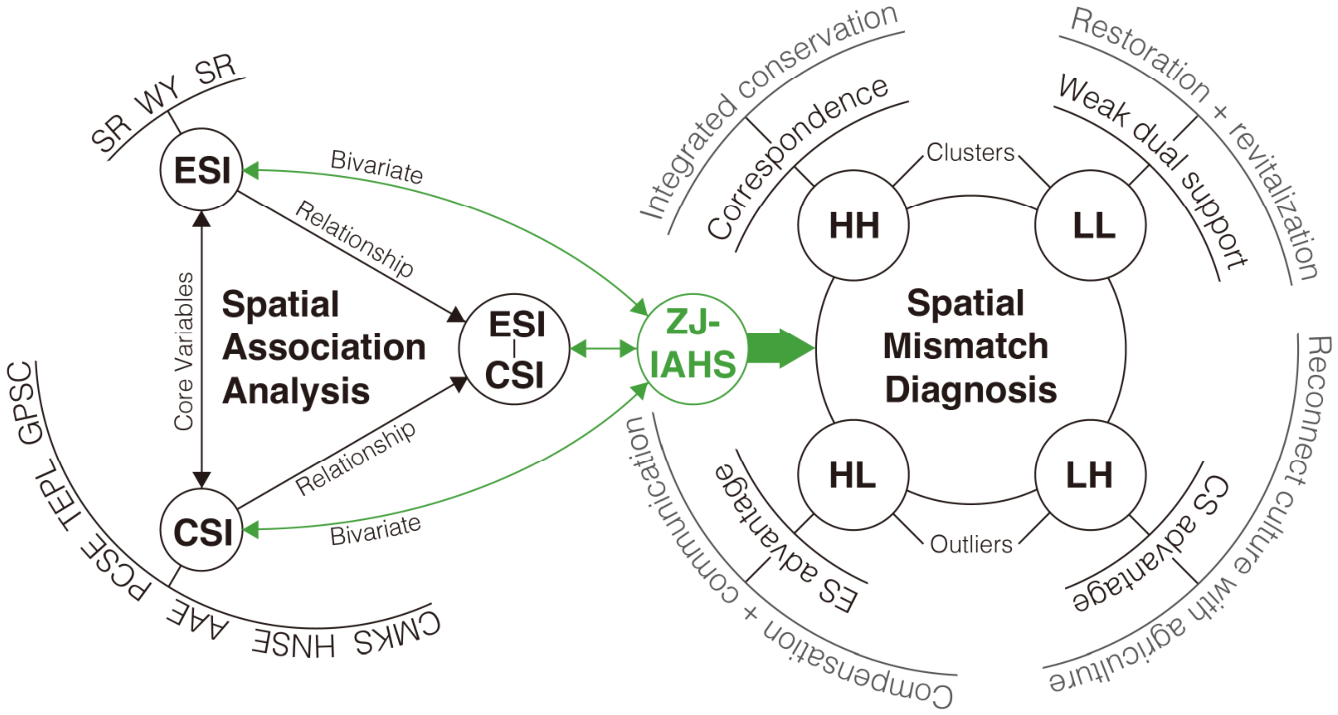
To address this issue, this study examines 205 important agricultural heritage systems in Zhejiang Province, China, and develops a provincial-scale spatial diagnostic framework linking agricultural heritage distribution, ecosystem services conditions, and contemporary cultural service provision. Zhejiang provides a representative case because it has a high concentration and rich diversity of AHS, together with marked internal differences in topography, ecological conditions, urbanization, and public service provision [53]. Specifically, this study identifies the spatial patterns of ZJ-IAHS, constructs ecosystem service and cultural service provision indices, and diagnoses their spatial correspondence and mismatch through spatial autocorrelation and bivariate spatial association analysis. This study clarifies whether historically evolved agricultural heritage systems are spatially aligned with ecological support and cultural service provision. To make this logic explicit, it proposes a spatial diagnostic model that links agricultural heritage systems, ecosystem service conditions, cultural service provision, spatial mismatch typologies, and differentiated governance implications (Figure 1). By doing so, the study shifts agricultural heritage research from the identification of heritage values and site distributions toward the diagnosis of spatial conditions that may inform resilience-oriented heritage governance and regional planning.

2. Materials and Methods

2.1. Study Area

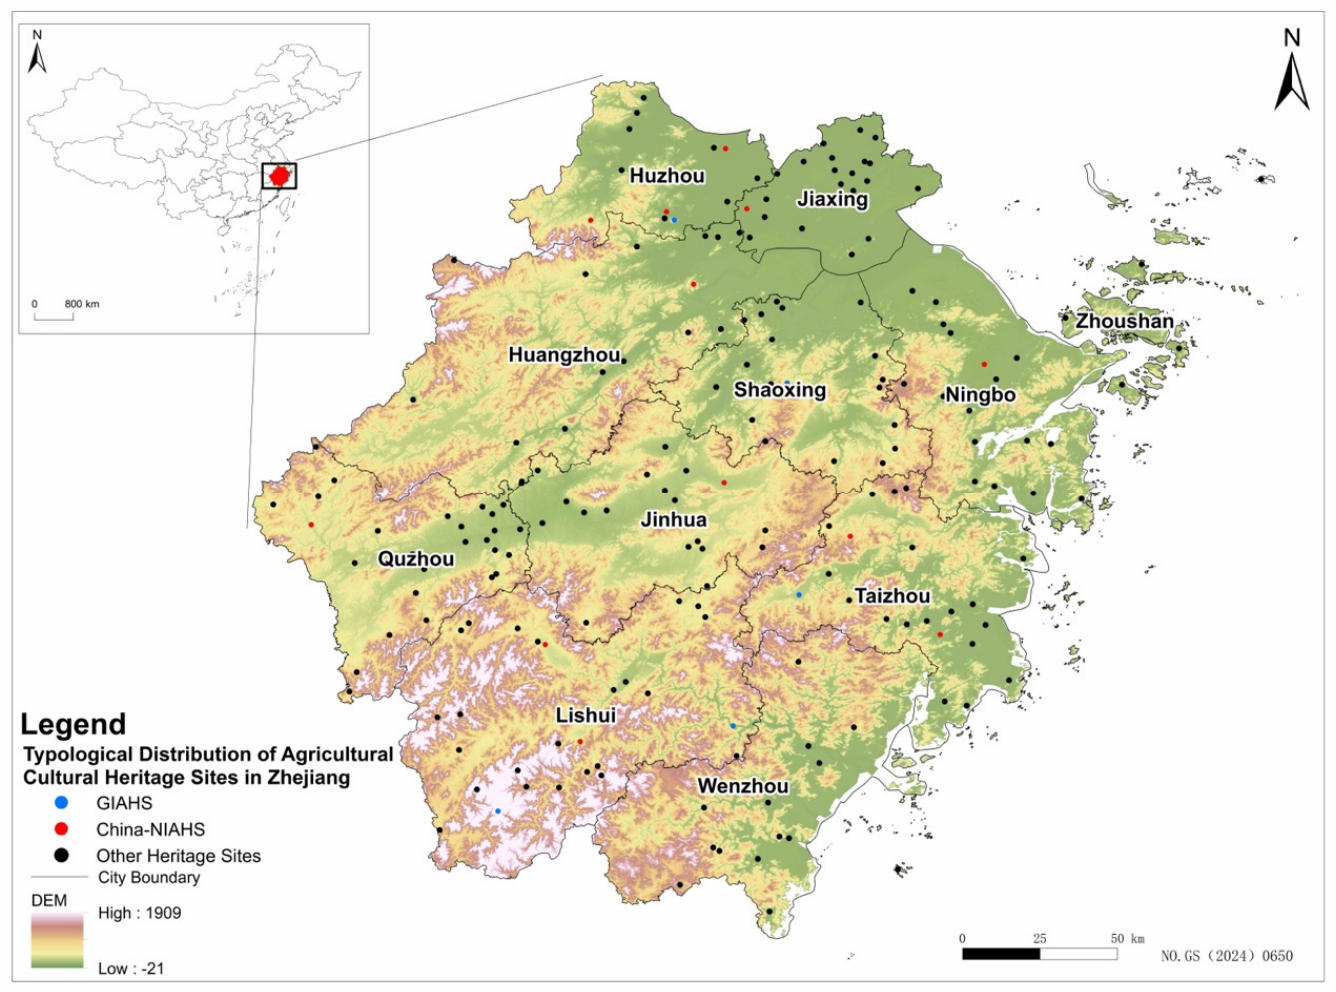
Zhejiang Province is located on the southeastern coast of China, on the southern wing of the Yangtze River Delta. It borders the East China Sea to the east, Shanghai and Jiangsu to the north, Anhui and Jiangxi to the west, and Fujian to the south (Figure 2). The province is dominated by hilly and mountainous terrain. Mountainous and hilly areas are mainly distributed in the southwest and central parts, the southeast includes coastal and island areas, and the northeast is characterized by low-altitude plains and river-network landscapes. Zhejiang has a subtropical monsoon climate with distinct seasons, concurrent heat and rainfall, and favorable hydrothermal conditions, providing a suitable natural basis for the long-term development of rice, tea, fruit trees, bamboo, and diverse integrated agricultural systems.
Zhejiang is one of the core provinces with the highest concentration of agricultural heritage resources in China. It has consistently ranked first nationwide in the number of China-NIAHS and also exhibits pronounced typological diversity. Marked internal differences in topography, ecological conditions, urbanization, and public service provision make Zhejiang a representative provincial case for examining the spatial relationships between agricultural heritage and contemporary eco-cultural service landscapes.

2.2. Data Sources

The agricultural heritage samples used in this study were derived from the list of important agricultural heritage resources published by the Department of Agriculture and Rural Affairs of Zhejiang Province. A total of 205 ZJ-IAHS samples were identified from the inventory and are distributed across the 11 prefecture-level cities of Zhejiang Province. Among them, five are recognized as GIAHS and are also listed as China-NIAHS. In addition to these five sites, 12 are designated as China-NIAHS, while the remaining 188 are recognized as provincial-level agricultural heritage systems. To avoid ambiguity in hierarchical statistics, all samples were treated as 205 unique heritage units in the spatial analysis, and differentiated weights were assigned according to designation level in the subsequent analysis. To diagnose the spatial relationships between agricultural heritage and contemporary eco-cultural service landscapes, this study integrated multi-source spatial data and statistical materials (Table 1).
All raster datasets were reprojected to the China Geodetic Coordinate System 2000 (CGCS2000, the National Earth System Science Data Center, Beijing, China) and resampled to 30 m to ensure spatial consistency across data sources. After coordinate standardization, topology checking, and duplicate removal, the administrative boundary and POI datasets were used for spatial analysis and kernel density estimation. Land use/land cover, precipitation, and soil data were used as core inputs of the InVEST model to quantify habitat quality, water conservation, and soil retention, whereas POI data were used to characterize contemporary cultural service provision in areas where agricultural heritage systems are located.

2.3. Research Methods

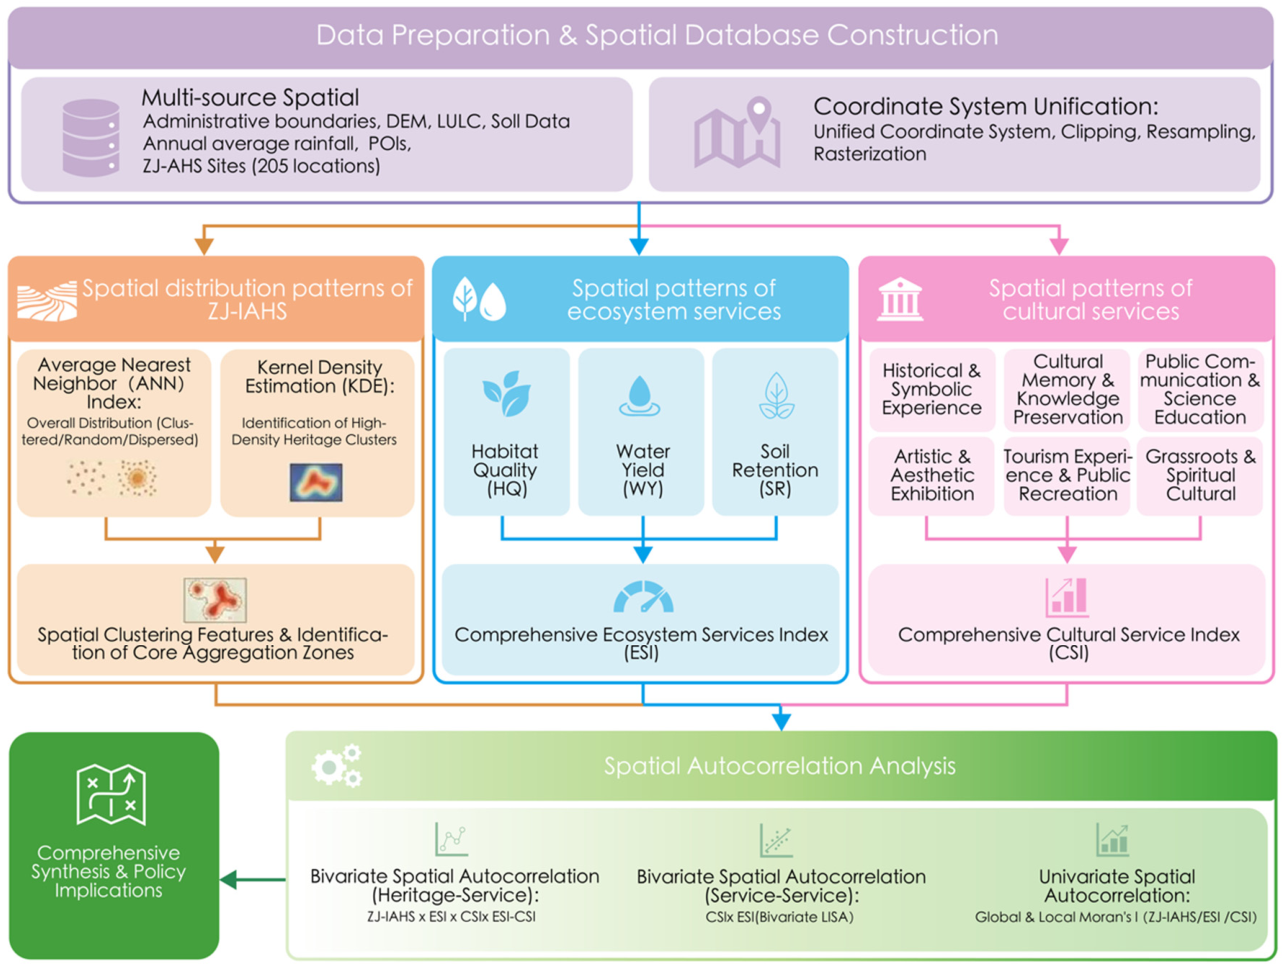
Using ArcGIS 10.8 (Esri, Redlands, CA, USA), and based on a unified spatial reference system and multi-source data preprocessing, this study constructed an analytical framework consisting of agricultural heritage characterization, eco-cultural service assessment, and spatial mismatch diagnosis (Figure 3). The framework addresses one core question: whether agricultural heritage systems remain spatially aligned with contemporary ecosystem service and cultural service conditions that support long-term conservation, socio-ecological resilience, and agroecological transition.
The analysis proceeded in three steps. First, the spatial distribution pattern of ZJ-IAHS was identified to characterize the spatial organization and clustering features of agricultural heritage systems. Second, the ecosystem service index (ESI) and cultural service index (CSI) were constructed to represent ecological support conditions and contemporary cultural service provision, respectively. Third, the weighted KDE surface of ZJ-IAHS, together with ESI and CSI, was incorporated into a unified spatial analytical framework to diagnose the spatial correspondence and mismatch between agricultural heritage systems, ecosystem services, cultural services, and their eco-cultural synergy through spatial autocorrelation and bivariate spatial autocorrelation analyses.

2.3.1. Spatial Distribution Analysis of ZJ-IAHS Samples

Analyzing the spatial distribution characteristics of agricultural heritage is a prerequisite for diagnosing its spatial relationships with ecosystem and cultural services. In this study, the Average Nearest Neighbor (ANN) index was first employed to identify the overall distribution pattern of ZJ-IAHS points at the provincial scale. By measuring the distance between each point and its nearest neighbor, ANN is used to determine whether point features are spatially clustered, randomly distributed, or dispersed [54,55]. The formula is expressed as follows:
A N N = D ¯ O D ¯ E
D ¯ O = i = 1 n d i n
D ¯ E = 0.5 n 2 / A
where D ¯ O is the observed mean nearest neighbor distance; d i is the distance between sample point i and its nearest neighboring point; and n is the total number of sample points. D ¯ E is the expected mean nearest neighbor distance, and A is the area of the study region. When ANN < 1, the sample points tend to be clustered; when ANN = 1, the sample points are approximately randomly distributed; and when ANN > 1, the sample points tend to be dispersed. Statistical significance was tested using the standardized Z-score:
Z = D ¯ O D ¯ E S E
where SE is the standard error of the nearest neighbor distance. In general, when Z < −2.58, the point features are considered to be significantly clustered at the 99% confidence level; when Z > 2.58, they are considered to be significantly dispersed; and when Z is close to 0, the distribution is closer to random.
After identifying the overall distribution pattern, kernel density estimation (KDE) was further applied to generate a continuous density surface of ZJ-IAHS points, so as to identify hotspot areas and spatial core areas of agricultural heritage [56]. KDE reveals the hotspot structure of ZJ-IAHS at the local clustering level and thus complements ANN in describing the overall distribution pattern. Considering the differences in importance among heritage systems with different designation levels, weights of 5, 3, and 1 were assigned to GIAHS, China-NIAHS, and provincial-level agricultural heritage systems, respectively, and incorporated into the density calculation. To examine the robustness of the designation-level weighting scheme, the 5–3–1 scheme was further compared with an alternative 3–2–1 scheme. The results show that the KDE surfaces generated by the two schemes are highly consistent, while the 5–3–1 scheme better captures the differentiation among designation levels without substantially altering the spatial pattern. Therefore, the 5–3–1 scheme was retained as the main analytical setting (Appendix A, Table A1). The formula is expressed as follows:
f ^ x = 1 h 2 i = 1 n w i K d i h
where f ^ x is the estimated kernel density value at location x ; w i is the weight assigned to sample point i; d i is the distance between the estimation location x and sample point i; h is the bandwidth; and K(⋅) is the kernel function. A higher kernel density value indicates a denser distribution of agricultural heritage in the area and a higher degree of spatial clustering. The KDE search radius was set to 2 km, and the same bandwidth was applied to all ZJ-IAHS samples to ensure comparability of the resulting heritage density surface.

2.3.2. Construction of the Ecosystem Service Index

The persistence of agricultural heritage depends on both traditional agricultural production activities and the supporting capacity of the regional ecological environment. To comprehensively characterize the ecological support conditions of agricultural heritage, this study selected three ecosystem services, namely water yield (WY), habitat quality (HQ), and soil retention (SR), and carried out spatial assessments based on the InVEST model. This selection is consistent with previous InVEST-based ecosystem service assessments in the Yangtze River Delta and Zhejiang coastal areas, where WY, HQ, and SR have been used to represent water regulation, habitat maintenance, and soil conservation functions, respectively [57,58]. The results were then integrated to construct the ecosystem service index (ESI) [59]. Specifically, HQ was used to characterize the capacity of ecosystems to support biodiversity under the combined effects of land-use patterns and human disturbance, WY was used to represent regional water supply and regulation capacity, and SR was used to reflect the capacity of ecosystems to mitigate erosion processes. The parameter settings of the habitat quality module are reported in Appendix A, Table A2 and Table A3.
The InVEST WY module estimates ecosystem water yield under different land-use types based on the annual water balance principle (Natural Capital Alliance, 2026. InVEST 3.19.0). In this study, precipitation, potential evapotranspiration, plant available water content, root depth, and topographic conditions were jointly considered to assess the water conservation capacity of areas associated with agricultural heritage. The model is formulated as follows:
Y x = 1 A E T x P x × P x
where Y x is the water yield of pixel x under land use type j , A E T x is the annual actual evapotranspiration of pixel x , and P x is the annual precipitation of pixel x . A higher water yield indicates a stronger capacity for water supply and regulation in the area.
The InVEST HQ module was used to assess the capacity of ecosystems to support biodiversity under the combined effects of land-use patterns and human disturbance. In this study, urban construction land, intensively cultivated farmland, and major transportation corridors were identified as habitat threat factors. Their weights, maximum impact distances, and decay types were determined according to relevant studies and the actual conditions of Zhejiang Province. The formula is given as follows:
Q x j = H j 1 D x j z D x j z + k z
where Q x j represents the habitat quality of pixel x under land use type j ; H j is the habitat suitability of land use type j ; D x j is the integrated habitat degradation score; k is the half-saturation constant; and z is a scaling constant. The value of Q x j ranges from 0 to 1, with higher values indicating higher habitat quality and stronger ecological support capacity.
SR was estimated using the sediment delivery ratio module of InVEST (SDR) [59], which is primarily based on the Revised Universal Soil Loss Equation (RUSLE) model [60]. The formula is as follows:
S E a = R × K × L × S × P × C
where S E a is the average annual soil loss (t/ha·a), R is the rainfall erosivity factor (MJ·mm/(hm2·h·a)), K is the soil erodibility factor (t·hm2·h/(MJ·mm), L is the slope length factor, S is the slope steepness factor, P is the conservation practice factor (dimensionless), and C is the vegetation cover and management factor (dimensionless). In this study, soil retention service was represented by the difference between potential soil erosion and actual soil erosion. A higher value indicates a stronger capacity of the regional ecosystem to reduce soil loss.
Because HQ, WY, and SR differ in units and value ranges, the results of the three ecosystem services were first normalized using min-max normalization:
X i = X i X m i n X m a x X m i n
On this basis, ESI was constructed using an equal-weighting method, which has been used in integrated ecosystem service assessment and ecological function pattern identification to avoid assigning subjective priority to a single service when no explicit service hierarchy is available [61,62]. The formula is expressed as follows:
E S I = 1 3 H Q + W Y + S R
where H Q , W Y , and S R denote the normalized indices of habitat quality, water yield, and soil retention, respectively. A higher ESI value indicates a higher level of ecosystem services in the region. The InVEST parameter settings were determined with reference to the InVEST User Guide and previous ecosystem service studies using similar modules and regional conditions [63,64,65,66], and the main parameters are reported in Appendix A, Table A3.

2.3.3. Construction of the Cultural Service Index

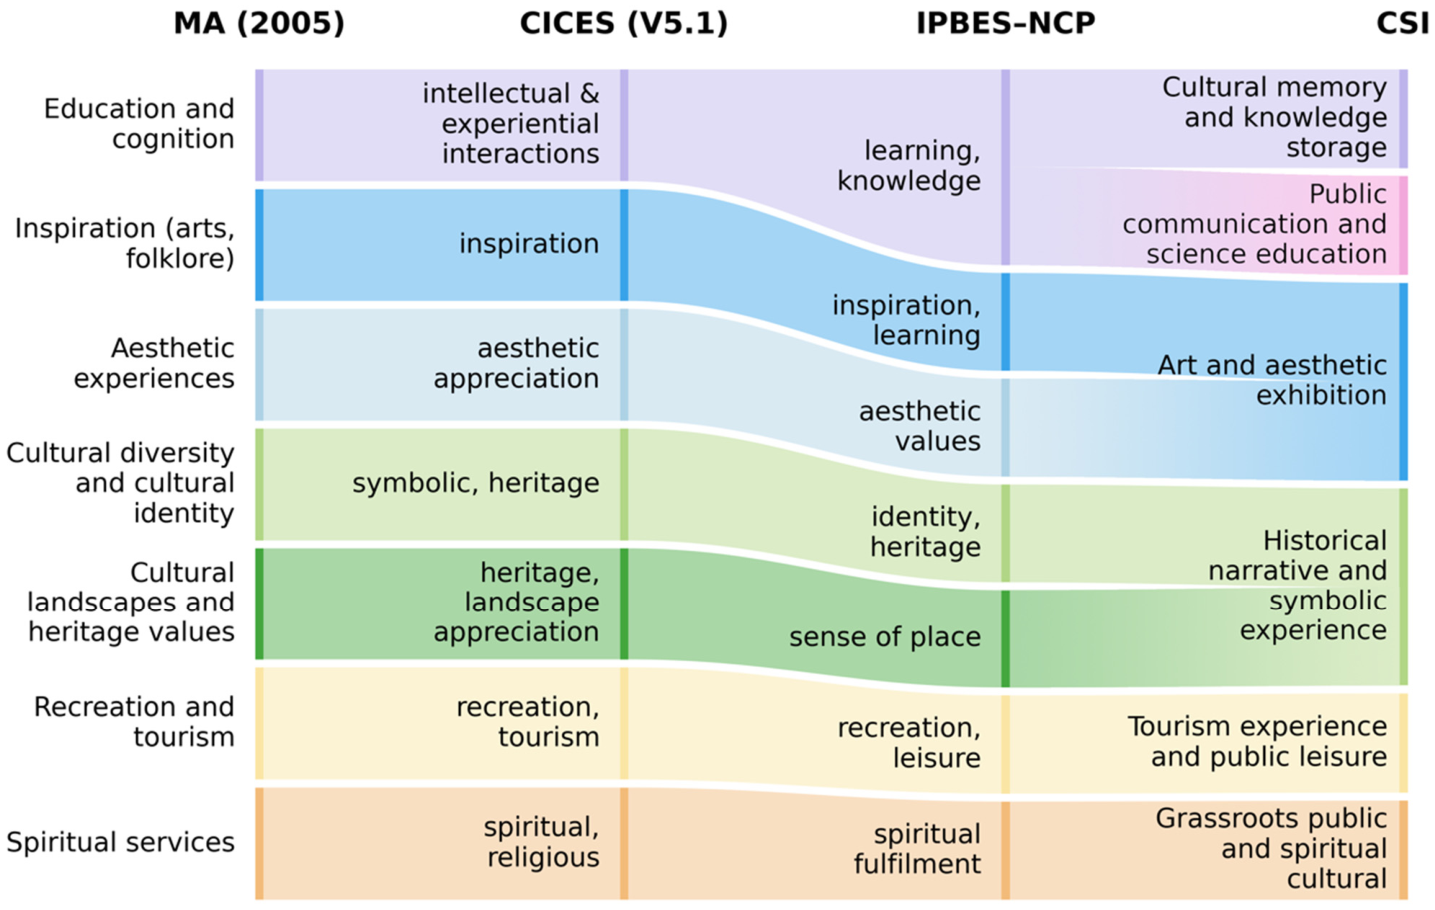
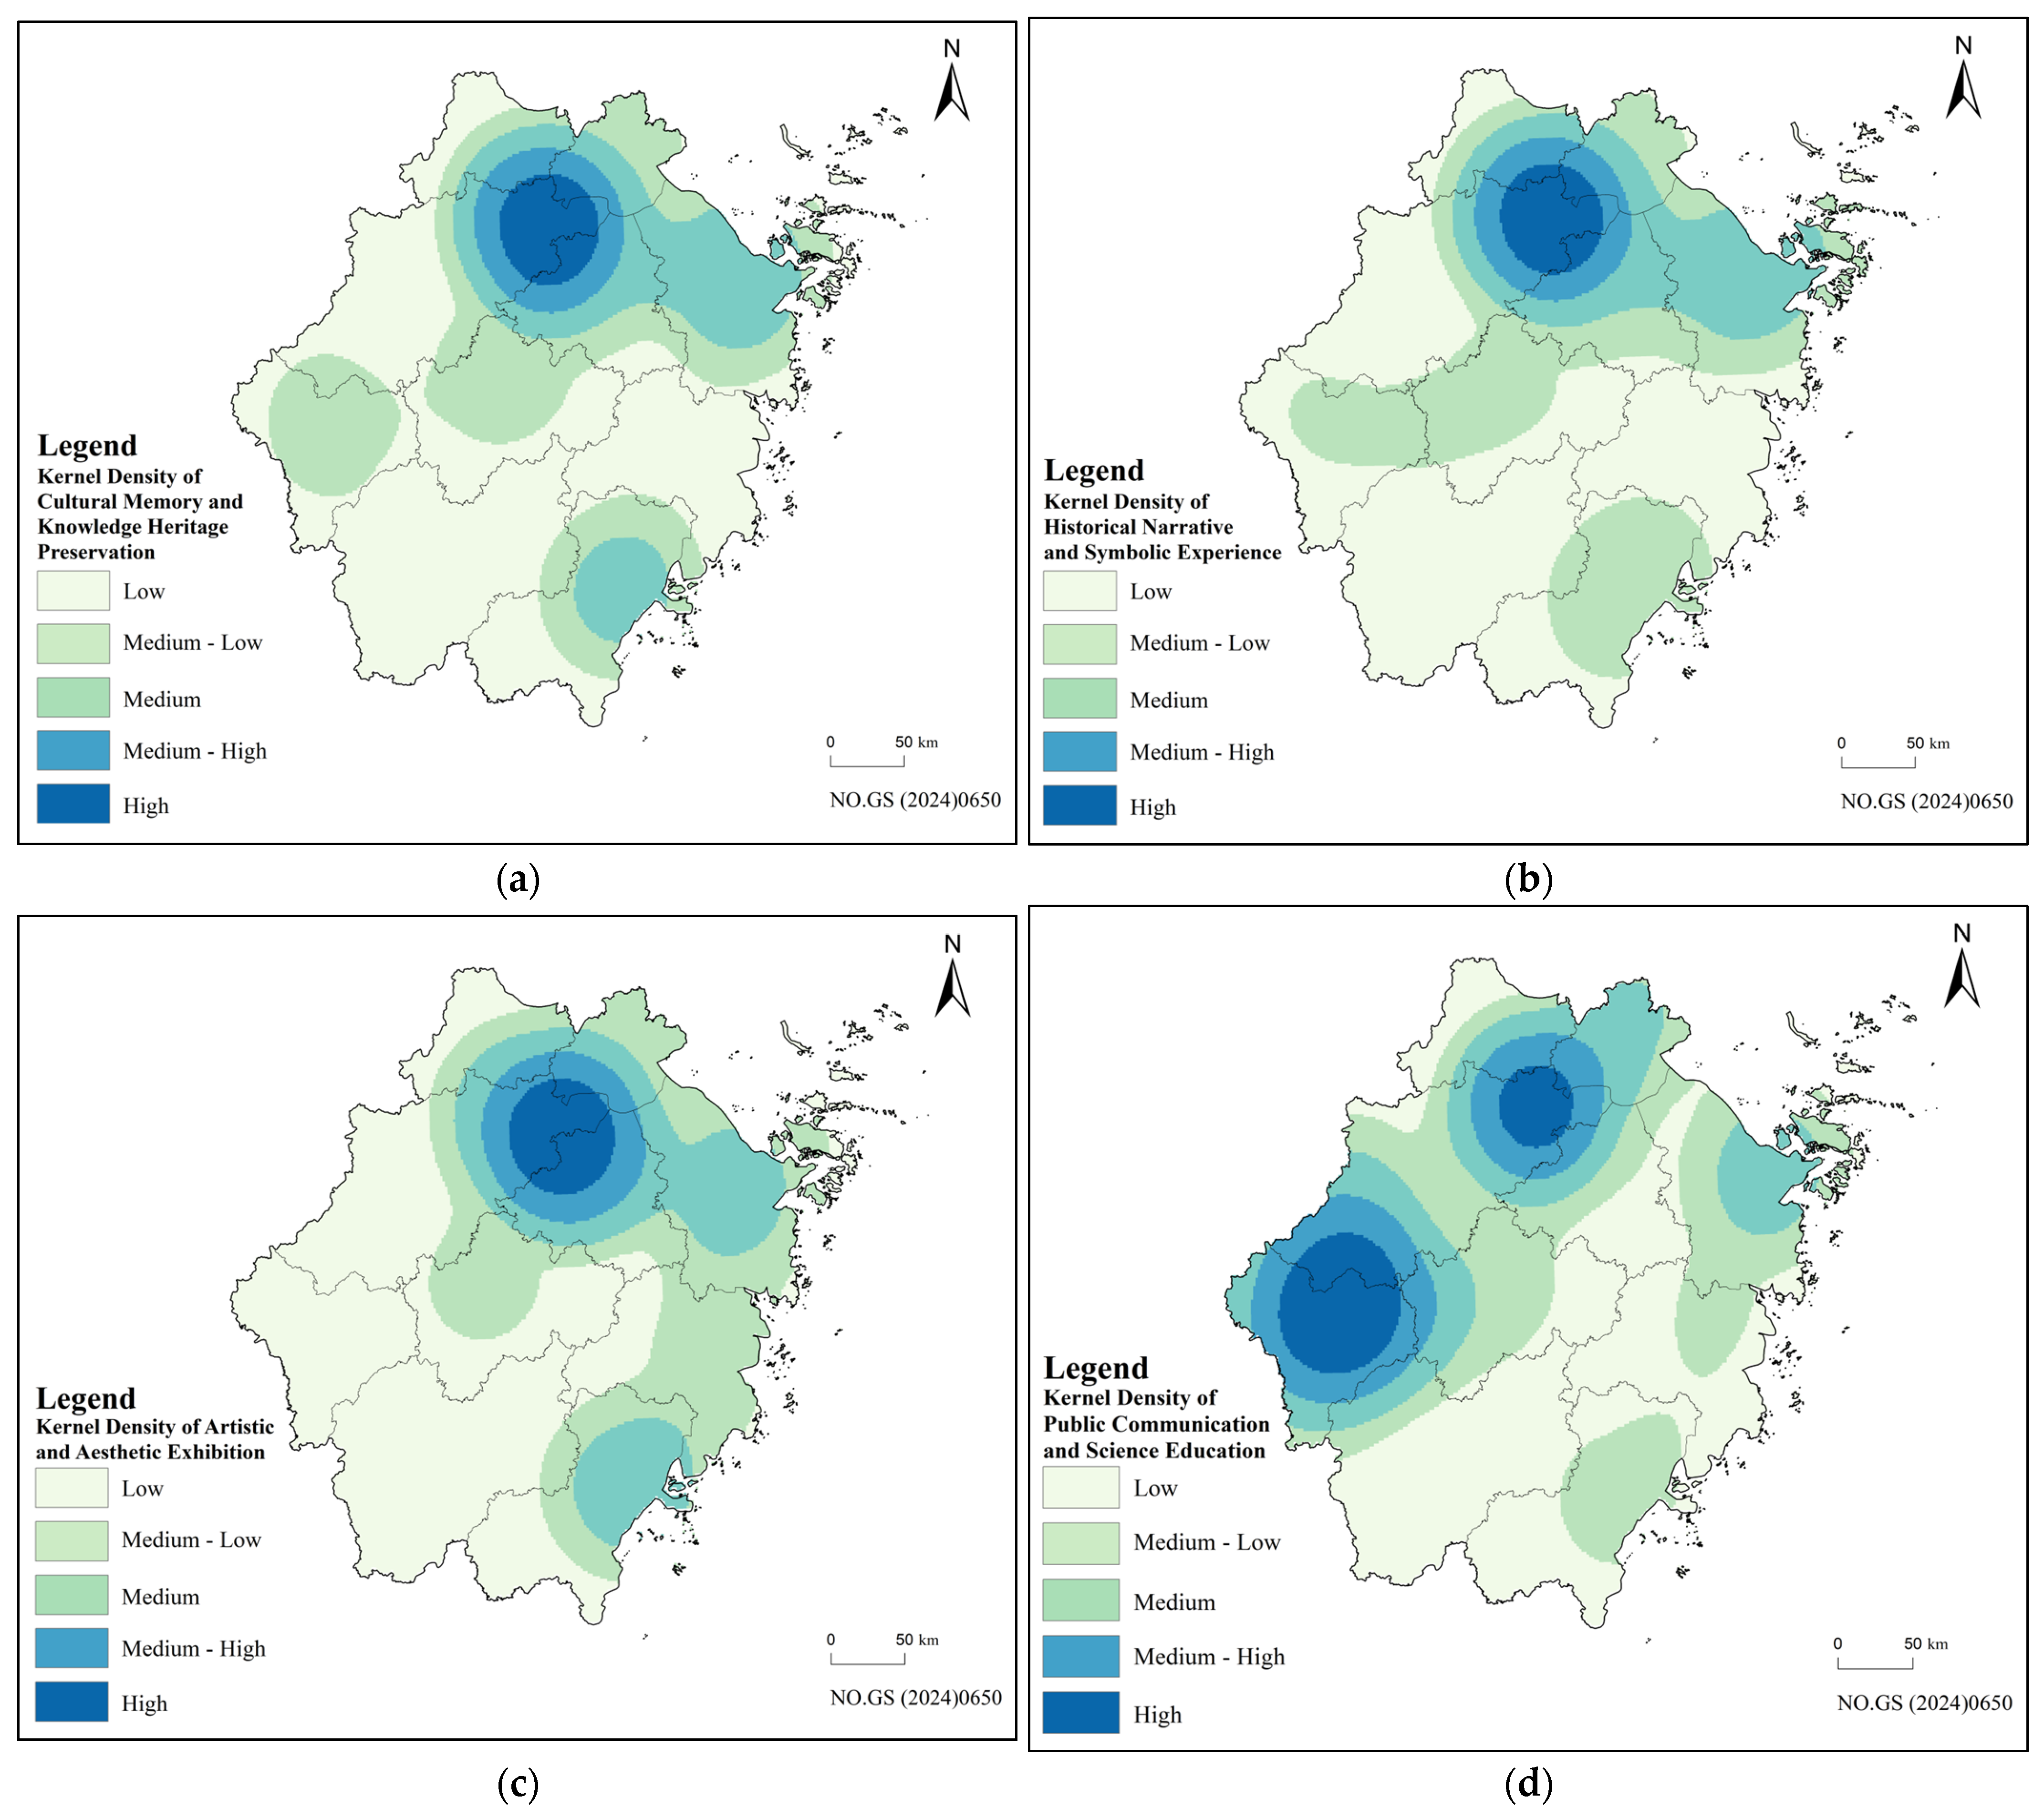
Agricultural heritage is closely related to ecological processes and to cultural service processes such as knowledge transmission, cultural identity, historical narration, and public participation. To characterize the spatial pattern of cultural services in areas associated with agricultural heritage, this study developed a spatial proxy-based representation of cultural services based on the theoretical frameworks of the Millennium Ecosystem Assessment (MA), the Common International Classification of Ecosystem Services (CICES), and Nature’s Contributions to People (NCP) [67,68,69]. At the same time, considering that heritage spaces themselves are important places for the reproduction of cultural memory and the occurrence of cultural practices, this study, based on the correspondence among the MA, CICES, and NCP frameworks and in combination with the characteristics of spatial display, knowledge transmission, and public participation in agricultural heritage [70], divided cultural services into six operational dimensions (Figure 4): cultural memory and knowledge storage services (CMKS), public communication and science education services (PCSE), art and aesthetic exhibition services (AAE), historical narrative and symbolic experience services (HNSE), tourism experience and public leisure services (TEPL), and grassroots public and spiritual cultural services (GPSC).
Cultural ecosystem services are intangible, context-dependent, and shaped by human perception, making them difficult to measure using a single direct indicator. Therefore, previous studies commonly use proxy indicators to represent the spatial conditions of cultural service provision [39,40]. CES indicators have been used in urban planning and heritage research to support the spatial identification of relationships among people, facilities, and environmental settings in cultural landscapes [49,71]. In this study, POI data were used as spatial proxies for the six dimensions of contemporary cultural service provision, mainly reflecting the external facility-based conditions that support the display, interpretation, communication, education, tourism experience, and public participation of agricultural heritage (Table 2).
For each POI category, KDE was used to generate a continuous density surface for each cultural service dimension [72], representing the spatial concentration and provision conditions of facility-based cultural services. Within each cultural service dimension, POIs were treated as equally weighted points, and the KDE search radius was set to 2 km. The formula is expressed as follows:
C S j x = 1 h 2 i = 1 n w i K d i h
where C S j x is the kernel density value of the j-th cultural service category at location x. A higher density value indicates a stronger spatial provision capacity for the corresponding cultural service dimension at that location.
To eliminate differences in units among the density surfaces of different dimensions, min-max normalization was applied separately to the six cultural service dimensions.
C S j = C S j C S j , m i n C S j , m a x C S j , m i n
On this basis, CSI was constructed using an equal-weighting method:
C S I = 1 6 j = 1 6 C S j
where C S j denotes the normalized value of the j-th cultural service dimension. A higher CSI value indicates denser facility-based cultural service provision, which can provide spatial support for cultural dissemination, experience, and participation.

2.3.4. Spatial Autocorrelation and Bivariate Spatial Relationship Analysis

After identifying the spatial patterns of agricultural heritage, ecosystem services, and cultural services, this study further examined the spatial relationships among them. To this end, all spatial variables were aggregated to a unified 1 km × 1 km fishnet grid as the basic analytical unit for both univariate and bivariate spatial autocorrelation analyses. The values of ZJ-IAHS KDE, ESI, CSI, and the ESI–CSI spatial relationship layer were assigned to each grid cell using mean zonal statistics. Spatial autocorrelation analyses were conducted in GeoDa 1.16 (Center for Spatial Data Science, University of Chicago, Chicago, IL, USA). The spatial weight matrix was constructed using queen contiguity to reflect geographic neighboring relationships among grid cells [73]. Statistical significance for Moran’s I and LISA was assessed using 999 random permutations, with significance levels reported at p < 0.05, p < 0.01, and p < 0.001. Univariate spatial autocorrelation analysis was used to identify the spatial clustering characteristics of ecosystem services and cultural services themselves. Taking ESI and CSI as the variables of interest, global Moran’s I and local Moran’s I (LISA) were employed to analyze their degree of spatial clustering and local spatial variation at the provincial scale of Zhejiang.
Global Moran’s I was used to test the overall spatial autocorrelation of the variable across the study area. The formula is expressed as follows:
I = n i n j n w i j × i = 1 n j = 1 n w i j x i x ¯ x j x ¯ i = 1 n x i x ¯ 2
where n is the number of spatial units; x i and x j are the values of the variable for spatial units i and j , respectively, here referring to ESI or CSI; x ¯ is the mean value of the variable; and w i j is the spatial weight in the spatial weight matrix. When I > 0, the variable exhibits positive spatial autocorrelation, indicating that high or low values tend to cluster in space. When I < 0, high and low values tend to be interspersed. When I is close to 0, the variable tends to be randomly distributed. Statistical significance was assessed using the Z-score:
Z = I E I V a r I
When Z > 1.96 , the spatial autocorrelation is statistically significant at the 95% confidence level.
Local Moran’s I was used to identify spatial heterogeneity and local clustering types [74,75]. The formula is expressed as follows:
I i = x i x ¯ 1 n i = 1 n x j x ¯ 2 j = 1 n w i j x j x ¯
where I i denotes the local spatial autocorrelation statistic for spatial unit i . According to the combination of the variable value and the mean value of its neighboring units, the study units can be classified into four types, namely high-high clusters (HH), low-low clusters (LL), high-low outliers (HL), and low-high outliers (LH), thereby identifying the local spatial clustering and dispersion characteristics of ecosystem services and cultural services.
Bivariate local spatial autocorrelation was used to identify local spatial association patterns between two variables [76,77]. To identify the spatial synergy and mismatch between ecosystem services and cultural services, this study further employed bivariate Moran’s I and bivariate LISA for analysis [74]. The formula is expressed as follows:
I i x y = z i x j = 1 n w i j z j y
where I i x y is the bivariate local spatial autocorrelation statistic, z i x is the standardized value of variable x in spatial unit i, z j y is the standardized value of variable y in neighboring unit j, and w i j is the spatial weight. HH indicates a high-value unit associated with high-value neighboring units, LL indicates a low-value unit associated with low-value neighboring units, HL indicates a high-value unit surrounded by low-value neighboring units, and LH indicates a low-value unit surrounded by high-value neighboring units.
On this basis, the weighted KDE surface of ZJ-IAHS was used to represent agricultural heritage hotspots and was analyzed with ESI, CSI, and the ESI-CSI relationship surface, which represent ecological support, cultural service capacity, and eco-cultural synergy, respectively. A larger HH area indicates stronger local spatial correspondence between ZJ-IAHS hotspots and areas with high ecological support, high cultural service provision, or high eco-cultural synergy. A wider distribution of HL or LH types indicates weaker spatial alignment between agricultural heritage hotspots and the corresponding ecological or cultural service conditions.

3. Results

3.1. Spatial Distribution Patterns of ZJ-IAHS

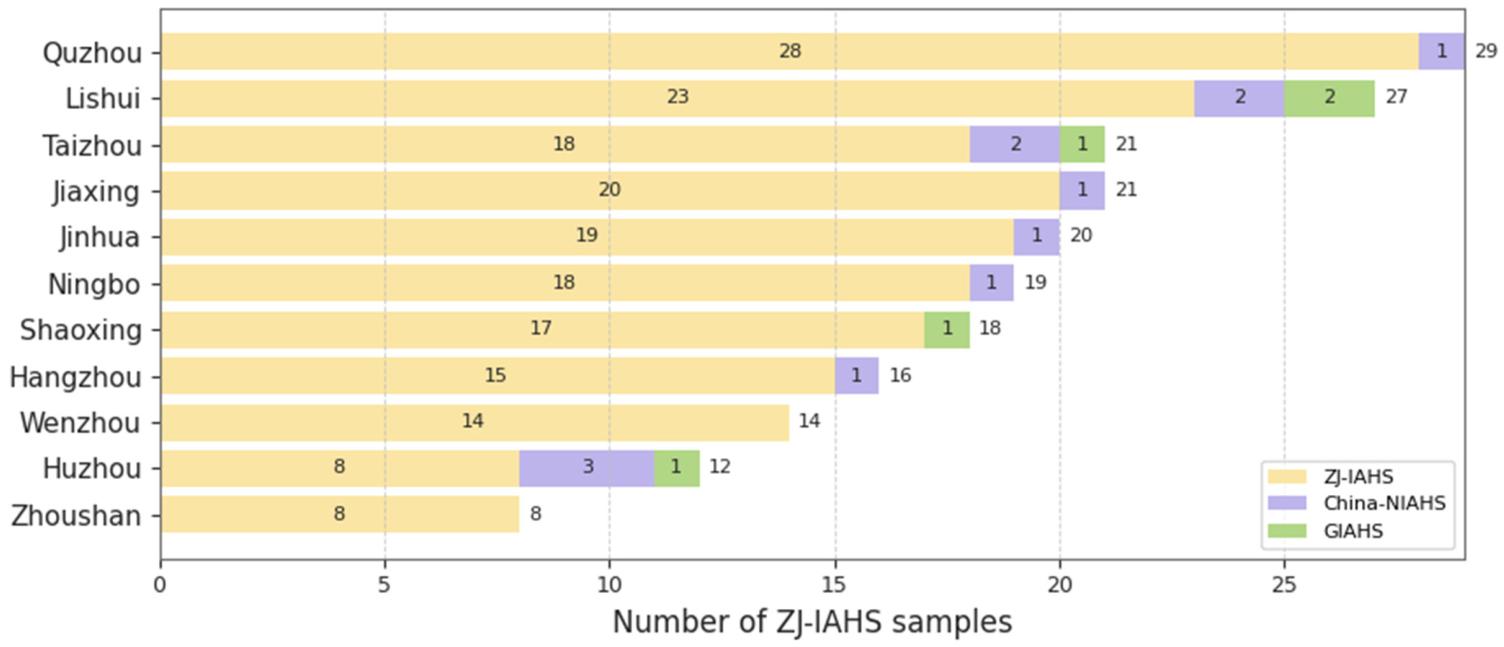
The 205 ZJ-IAHS samples in Zhejiang Province exhibit a significant spatially clustered distribution at the provincial scale, and clear differences are observed in the spatial organization of heritage systems across different designation levels. Overall, ZJ-IAHS samples are mainly distributed in low- and medium-elevation areas, with particularly high concentrations in transitional zones from mountainous and hilly areas to plains. City-level statistics further show marked internal differences in the number of ZJ-IAHS across Zhejiang Province (Figure 5), with Quzhou having the largest number of samples, followed by Lishui.
There are also marked differences in the distribution density of ZJ-IAHS within Zhejiang Province (Table 3). Jiaxing has the highest distribution density, followed by Zhoushan and Quzhou, which all fall into the high-density category. Ningbo, Jinhua, Huzhou, and Taizhou are at a moderate density level, whereas Hangzhou, Wenzhou, and Shaoxing show relatively low distribution densities.
ANN analysis further confirmed the clustered pattern of ZJ-IAHS and the differences among designation levels (Table 4). The 205 ZJ-IAHS samples exhibited a significantly clustered distribution at the provincial scale. By contrast, China-NIAHS showed significantly dispersed distributions, indicating that higher-level agricultural heritage systems tend to be more spatially dispersed, whereas ZJ-IAHS is more likely to form localized clusters. Considering the very small sample size of GIAHS (n = 5), this study does not conduct a separate ANN interpretation for GIAHS to avoid overinterpreting unstable nearest-neighbor results.
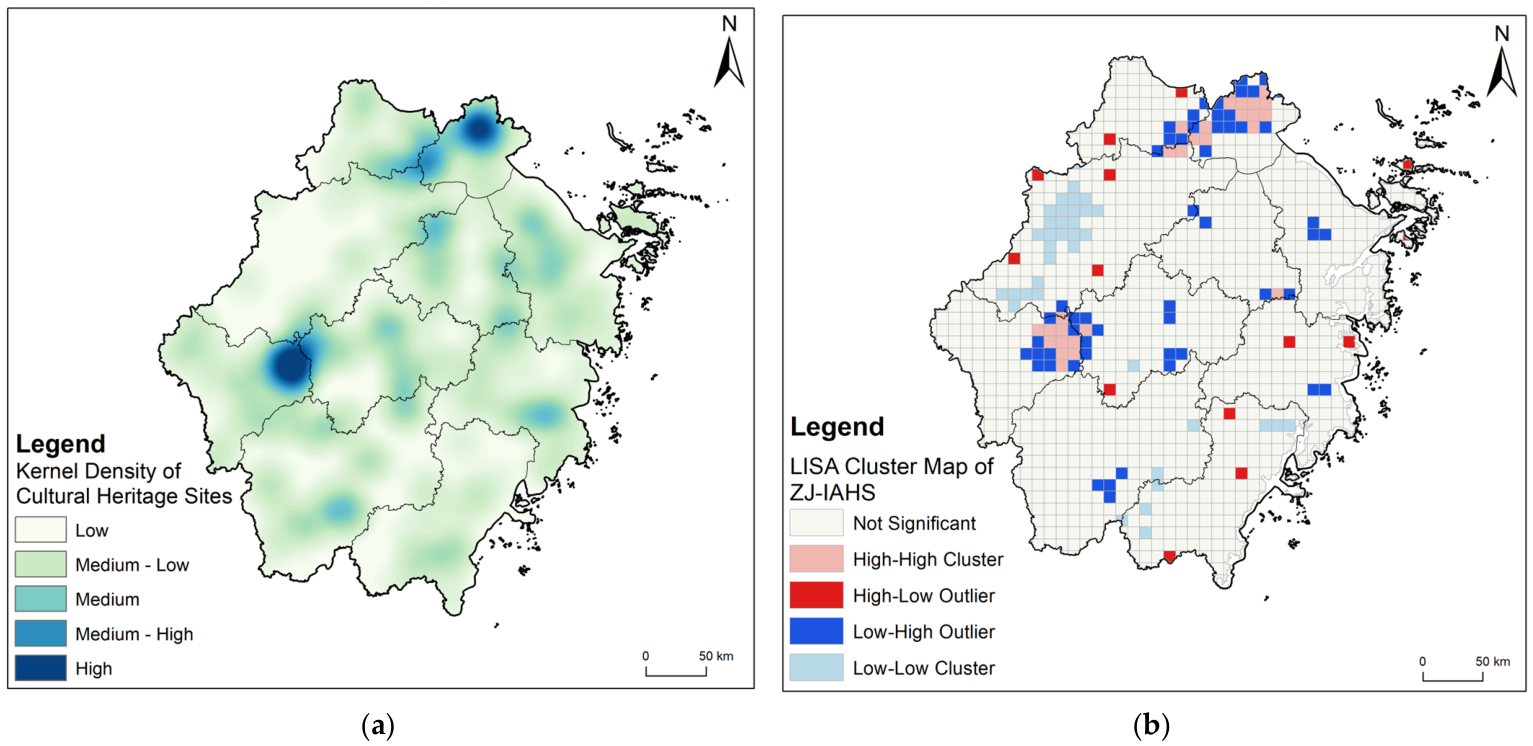
KDE results show that the high-density areas of ZJ-IAHS exhibit a clear dual-core pattern with several secondary centers (Figure 6a). The two primary high-density core areas are concentrated in the Quzhou-Jinhua area of western Zhejiang and the Jiaxing-Huzhou area of northern Zhejiang. In addition, relatively evident secondary high-density centers are found in central Taizhou, southern Lishui, and the Shaoxing-Ningbo area. By contrast, some mountainous areas and coastal marginal areas are dominated by low-density distributions. These results show that ZJ-IAHS form an overall clustered pattern, with a dual-core structure and several secondary local hotspots.
Global Moran’s I further indicates a weak but statistically detectable positive spatial autocorrelation of ZJ-IAHS at the provincial scale (Moran’s I = 0.048), suggesting limited local clustering rather than strong spatial dependence. Local Moran’s I (LISA) results reveal clear local differentiation (Figure 6b). HH clusters are mainly distributed in northern Jiaxing and eastern Quzhou, with smaller contiguous patches or scattered points also appearing in western Jiaxing, northeastern Hangzhou, western Jinhua, southeastern Huzhou, and southern Shaoxing, indicating that these areas constitute the main high-value clusters of ZJ-IAHS. LL clusters are mainly distributed in western Hangzhou, with scattered points in Jinhua, Lishui, and Wenzhou, reflecting an overall pattern of low-value clustering. LH outliers are mostly located around HH clusters, mainly in Quzhou, Jinhua, Huzhou, and Jiaxing, with additional small patches or scattered points in Shaoxing, Ningbo, Lishui, and Taizhou, indicating local discontinuities or transitional zones within a high-value background. HL outliers are more scattered and occur in Hangzhou, Huzhou, Wenzhou, Taizhou, Jinhua, and Zhoushan, suggesting that these areas contain local high values that have not yet formed continuous high-value zones with adjacent areas.

3.2. Spatial Patterns of Ecosystem Services in Zhejiang Province

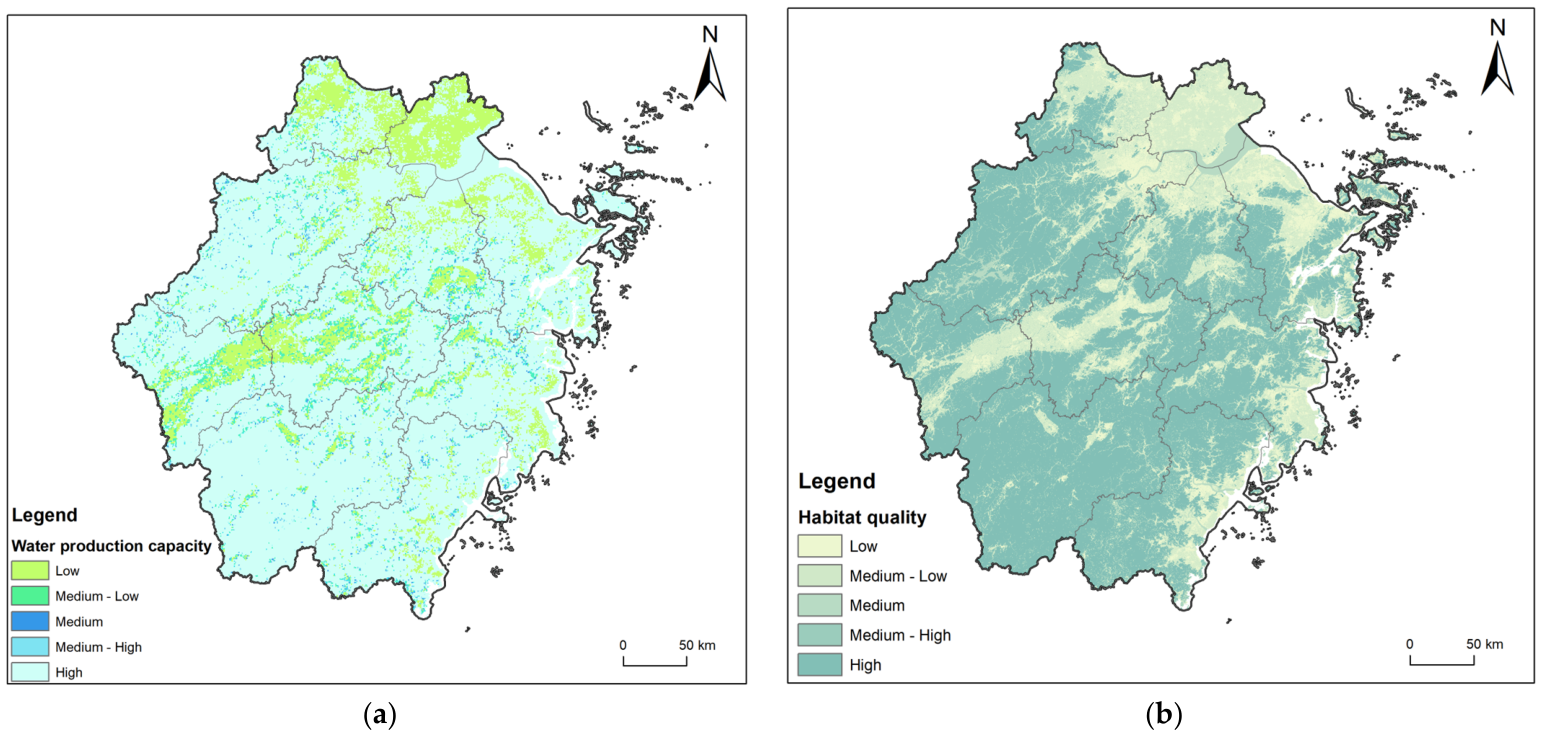
Based on the InVEST assessment, ecosystem services in Zhejiang Province show clear spatial differentiation. Different service types display generally consistent spatial patterns at the provincial scale, with high values concentrated in mountainous and hilly areas and low values in plains and coastal areas (Figure 7). ESI further indicates that high-value areas are mainly distributed in the mountainous and hilly regions of southwestern and south-central Zhejiang, whereas relatively low values are concentrated in the core plain areas of northern Zhejiang and parts of the coastal urban expansion belt.
WY shows a spatial pattern of higher values in the south and northwest and lower values in the central and northern plains (Figure 7a). High-value areas are mainly distributed in mountainous and hilly regions such as Lishui, southern Wenzhou, and northwestern Hangzhou, where they form relatively extensive continuous zones. Low-value areas are mainly found in the central hilly regions, including Quzhou, Jinhua, southern Shaoxing, and northern Taizhou, as well as in the northern plains such as Huzhou and Jiaxing, where local high values mostly occur as scattered patches. Relatively concentrated low-value areas are also present in coastal regions.
HQ exhibits a clear gradient pattern, with high values in the southwest and low values in the northeast (Figure 7b). High-value areas are mainly concentrated in the continuous mountainous and hilly regions of southwestern and south-central Zhejiang, including the mountainous areas of Lishui, Quzhou, Jinhua, Taizhou, and Wenzhou, and form large contiguous zones. The mountainous areas of western Hangzhou also show relatively high HQ. Medium- and low-value areas are widely distributed across the northern Zhejiang Plain, the central-western plains, and highly urbanized coastal areas, with a fragmented spatial pattern.
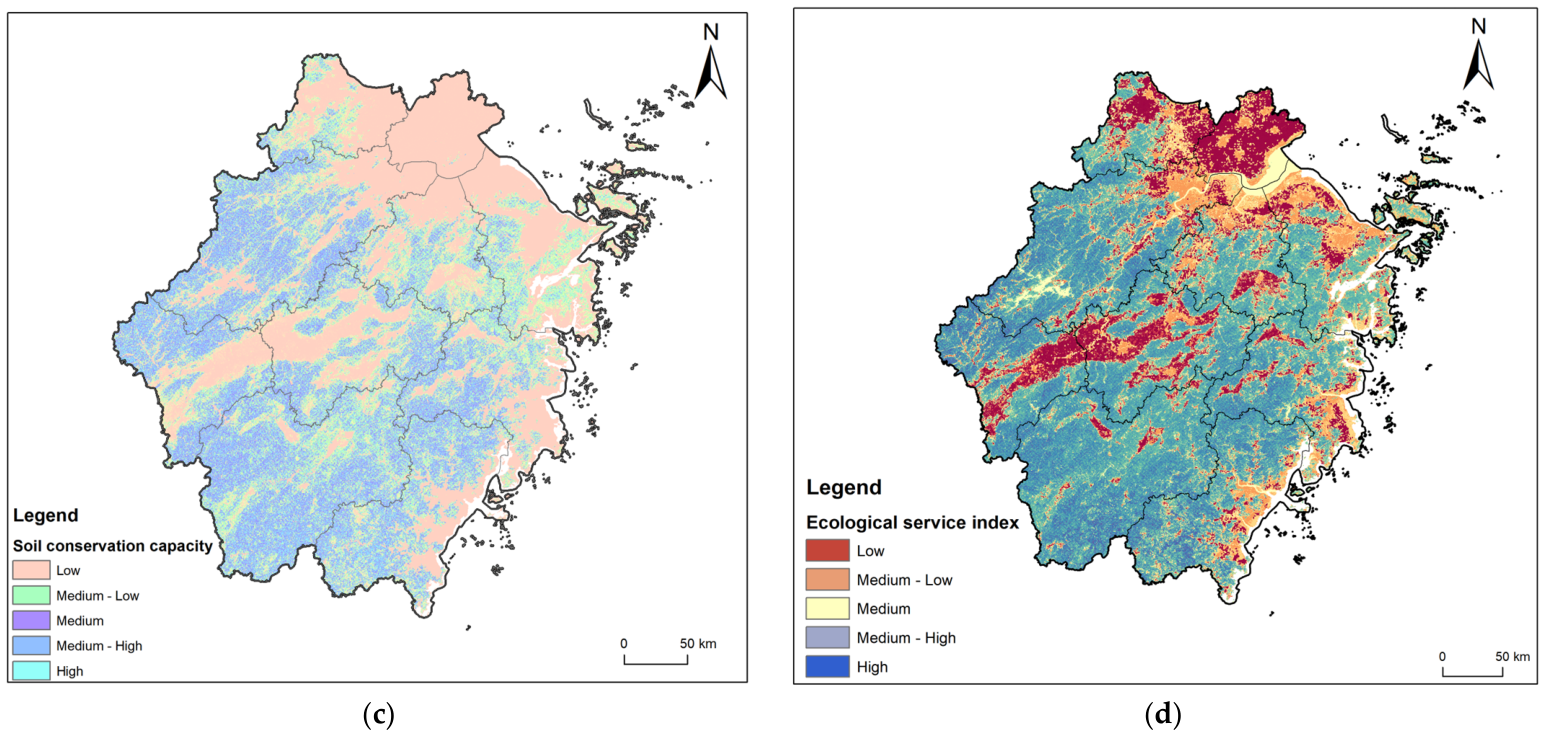
SR shows an interwoven pattern of belt-like and patch-like structures (Figure 7c). Medium- and high-value areas are mainly distributed continuously along mountainous and hilly regions, forming several belt-shaped zones with strong soil retention capacity. In contrast, the northeastern plains, the central-western plains, and low-lying coastal areas are dominated by medium- and low-value areas. Local high-value areas generally correspond to mountainous regions with steeper slopes and better vegetation cover.
By integrating the three ecosystem services, ESI clearly reflects the overall spatial differentiation of ecosystem services in Zhejiang Province (Figure 7d). High- and relatively high-value areas are mainly concentrated in the mountainous and hilly belt of southwestern Zhejiang, forming continuous zones of ecosystem service advantage. Medium-value areas are widely distributed in the central part of the province. Low-value areas are mainly located in the Hangzhou Bay urban agglomeration and its surrounding core plain areas in northern Zhejiang, and also occur as relatively concentrated patches in central Quzhou, Jinhua, central Shaoxing, and the coastal urban expansion belt. Ecosystem services in Zhejiang show clear topographic dependence and regional continuity, providing the ecological context for subsequent analysis of the relationship between agricultural heritage and ESI.

3.3. Spatial Patterns of Cultural Services Associated with ZJ-IAHS

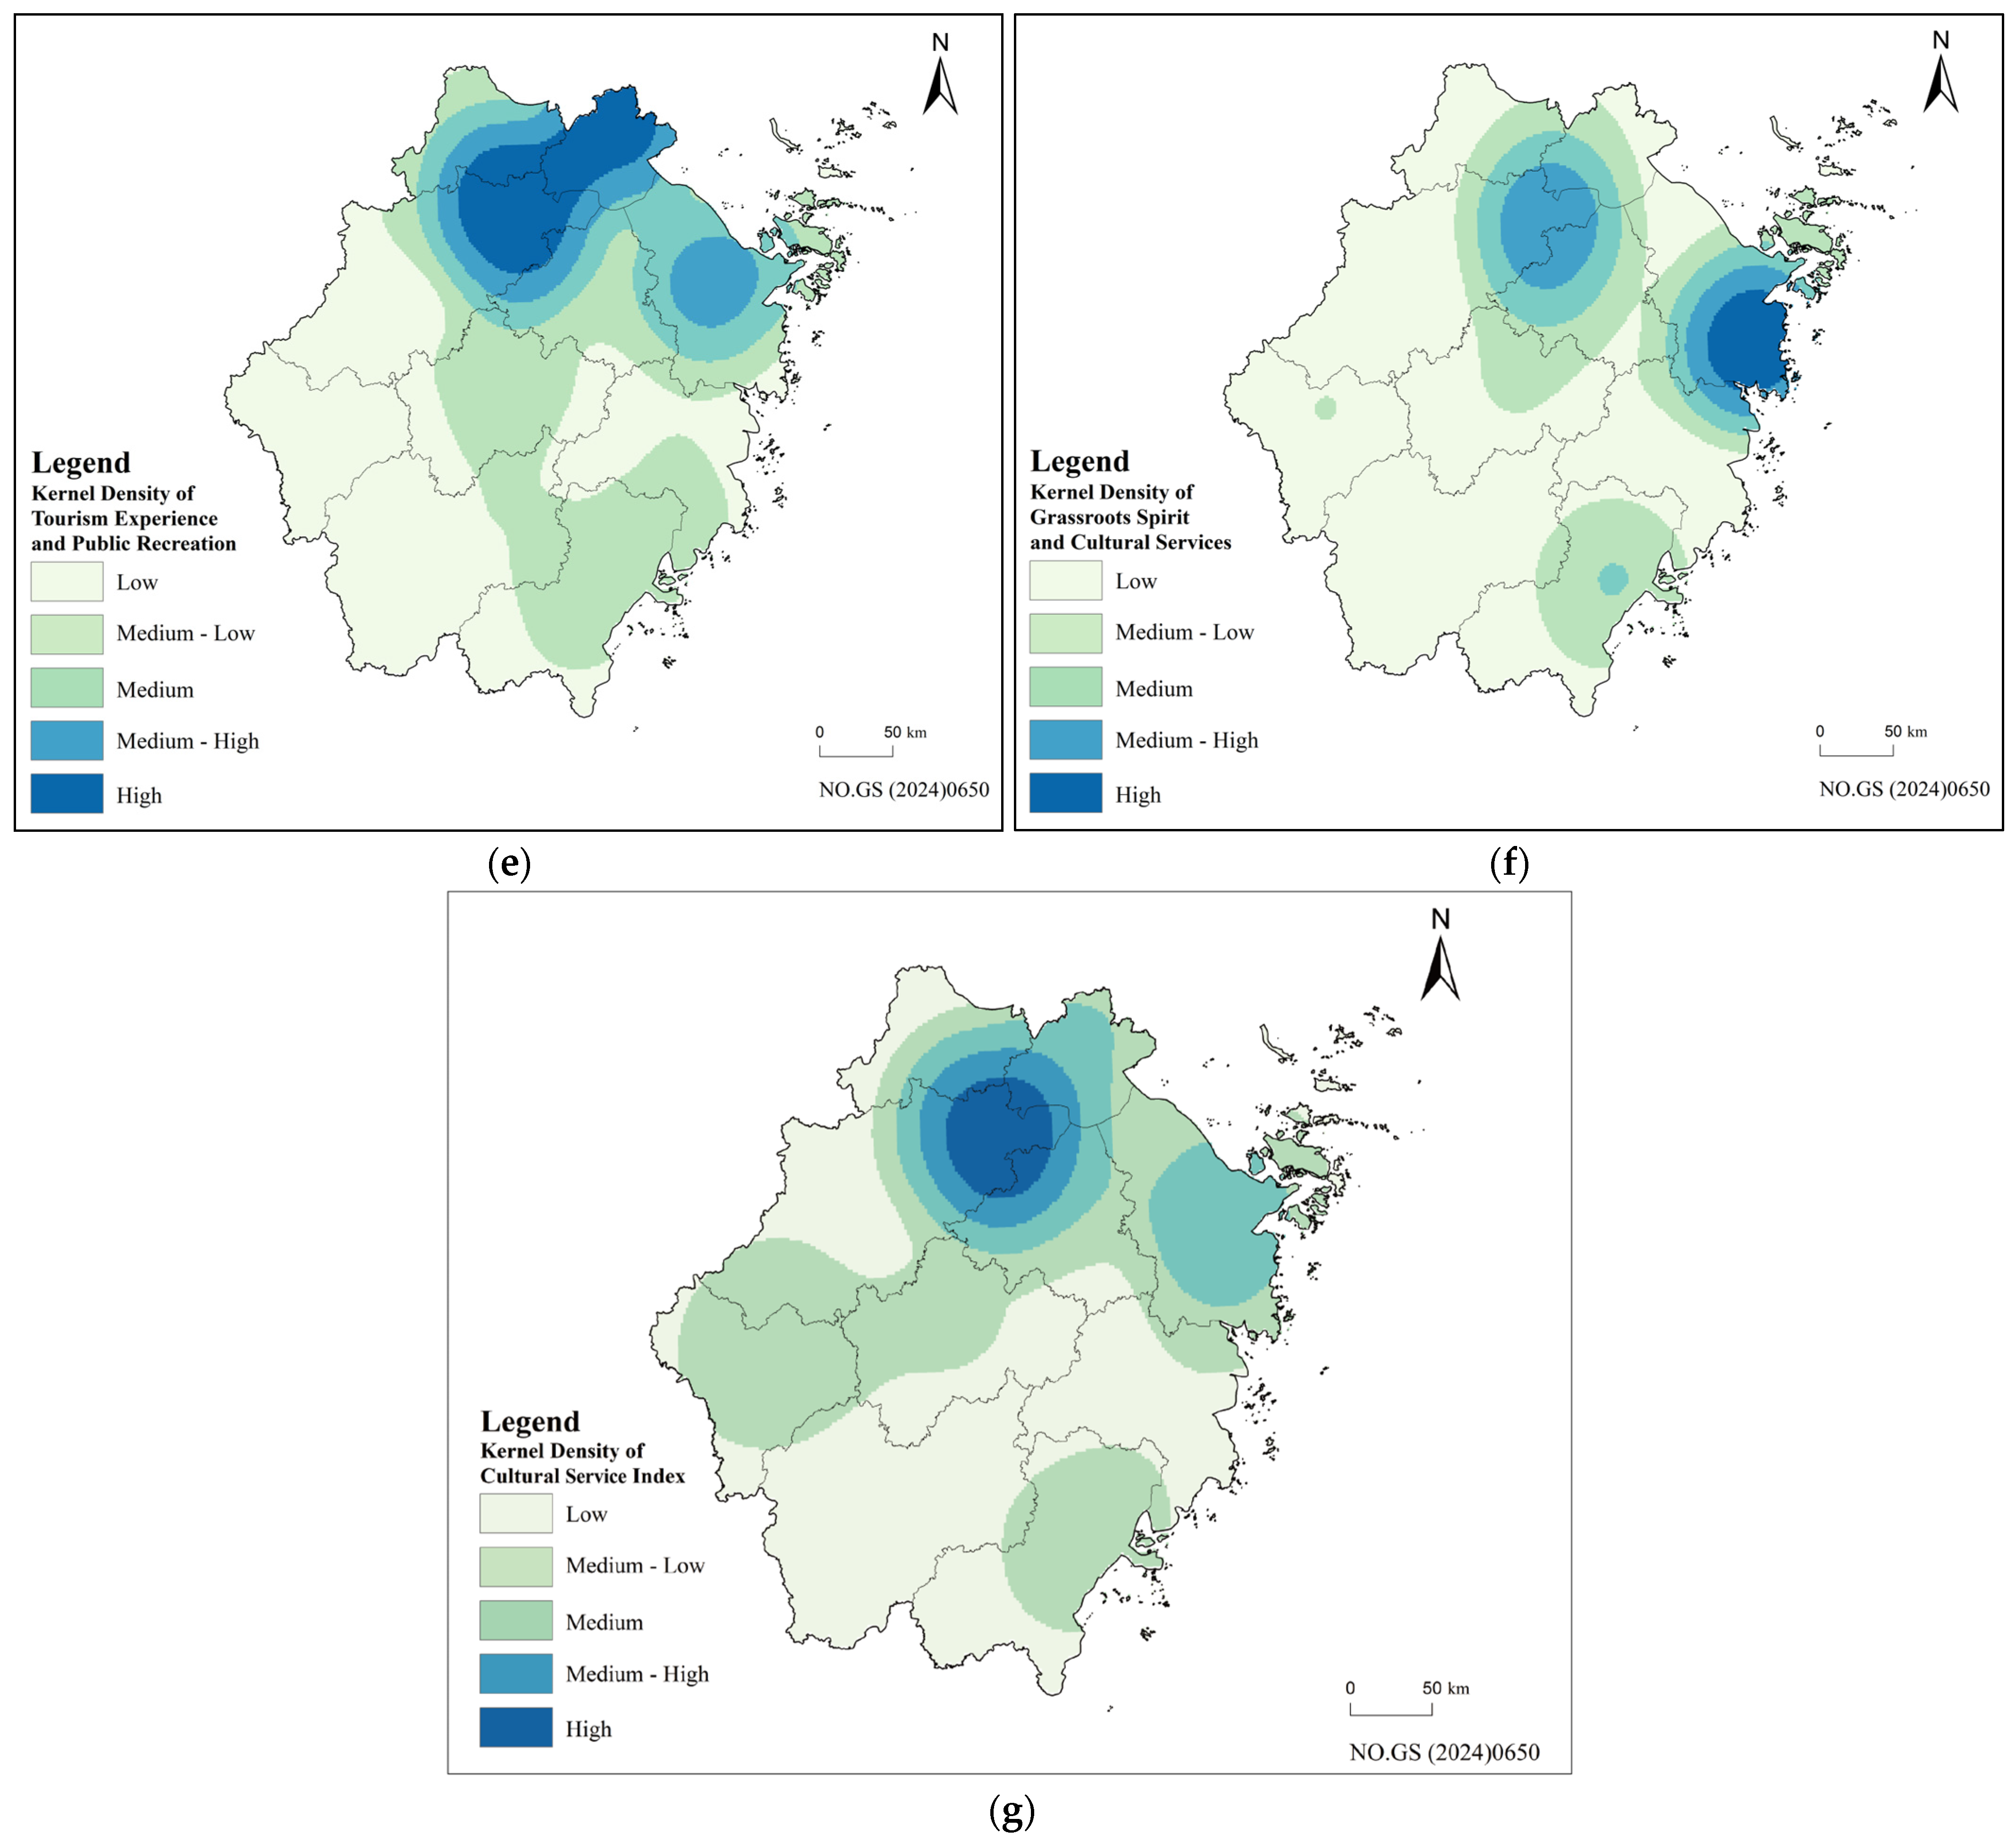
Based on the KDE results for the six POI-based proxy indicators (Figure 8), cultural services in Zhejiang Province show a pronounced pattern of spatial differentiation. High-value areas are mainly concentrated in the northern Zhejiang Plain and the highly urbanized areas around Hangzhou Bay, whereas low-value areas are mainly distributed in the mountainous and hilly regions of southwestern Zhejiang and some inland mountainous areas. Cultural services exhibit a clear core concentration pattern, and their spatial distribution differs markedly from the mountain-oriented pattern of high ESI values.
The spatial distributions of CMKS, HNSE, and AAE are broadly similar. All three show a dominant high-value core in northern Zhejiang, especially in the border area among Hangzhou, Huzhou, and Jiaxing, with eastward extension toward Ningbo and relatively weak distribution in mountainous areas (Figure 8a–c). Knowledge-related, historical-cultural, and aesthetic-exhibition services are all closely associated with dense urban cultural facility networks and concentrated population centers. CMKS is most closely related to knowledge preservation and public access, HNSE to historical narrative and symbolic functions, and AAE to exhibition and aesthetic experience. All three are concentrated in the northern Zhejiang Plain and other urbanized areas.
PCSE exhibits a more pronounced dual-core structure (Figure 8d). One core is located in the border area between Quzhou and Hangzhou, and the other in the border area among Hangzhou, Huzhou, and Jiaxing, while central Ningbo forms a secondary high-value area. Compared with the other dimensions, PCSE shows a more evident multicenter spatial pattern.
TEPL high-value areas are mainly concentrated in the border area among Hangzhou, Huzhou, and Jiaxing and extend toward northeastern Jiaxing to form a long continuous high-value belt, while central Ningbo forms a secondary core (Figure 8e). Tourism- and public leisure-related cultural services therefore show a strong plain-oriented concentration pattern at the provincial scale.
GPSC high-value areas are mainly distributed in eastern Ningbo, while the border area among Hangzhou, Huzhou, and Jiaxing forms a secondary high-value center (Figure 8f). Compared with the other dimensions, the high-value areas of GPSC are more dispersed, but still generally concentrated in urban and densely populated areas.
By integrating the results of all six dimensions, CSI shows an overall single-core pattern centered on the Hangzhou metropolitan area and extending toward the surrounding plain areas (Figure 8g). Its spatial pattern is broadly similar to those of CMKS, HNSE, and AAE, indicating that the integrated cultural service landscape is concentrated in areas with strong knowledge-related, historical-cultural, and aesthetic-exhibition functions. Unlike ecosystem services, whose high-value areas are mainly concentrated in mountainous and hilly regions, areas with high cultural service levels are mainly distributed in the northern Zhejiang Plain and the urbanized areas around Hangzhou Bay. By contrast, cultural service provision remains relatively weak in the southwestern mountainous areas where agricultural heritage is highly concentrated. Overall, cultural services in Zhejiang show a clear urban agglomeration orientation, providing the service background for subsequent analysis of the spatial relationships between agricultural heritage and CSI.

3.4. Spatial Autocorrelation and Eco-Cultural Interaction Patterns

To identify the spatial clustering characteristics of ESI and CSI and their local interaction patterns, spatial autocorrelation analysis was conducted for ESI, CSI, and the ESI-CSI relationship surface. Global Moran’s I results show significant positive spatial autocorrelation for all three variables (Table 5), indicating clear spatial clustering across Zhejiang Province. CSI shows the strongest clustering, reflecting a more pronounced core concentration pattern of cultural service provision. By contrast, the clustering intensity of ESI is relatively lower, suggesting that although ecosystem services are significantly clustered, their spatial pattern is more strongly characterized by regional gradients. The ESI-CSI relationship surface also shows significant positive spatial autocorrelation, indicating local spatial synergy between ecosystem services and cultural services, but not a widely consistent pattern of overlapping high values at the provincial scale.
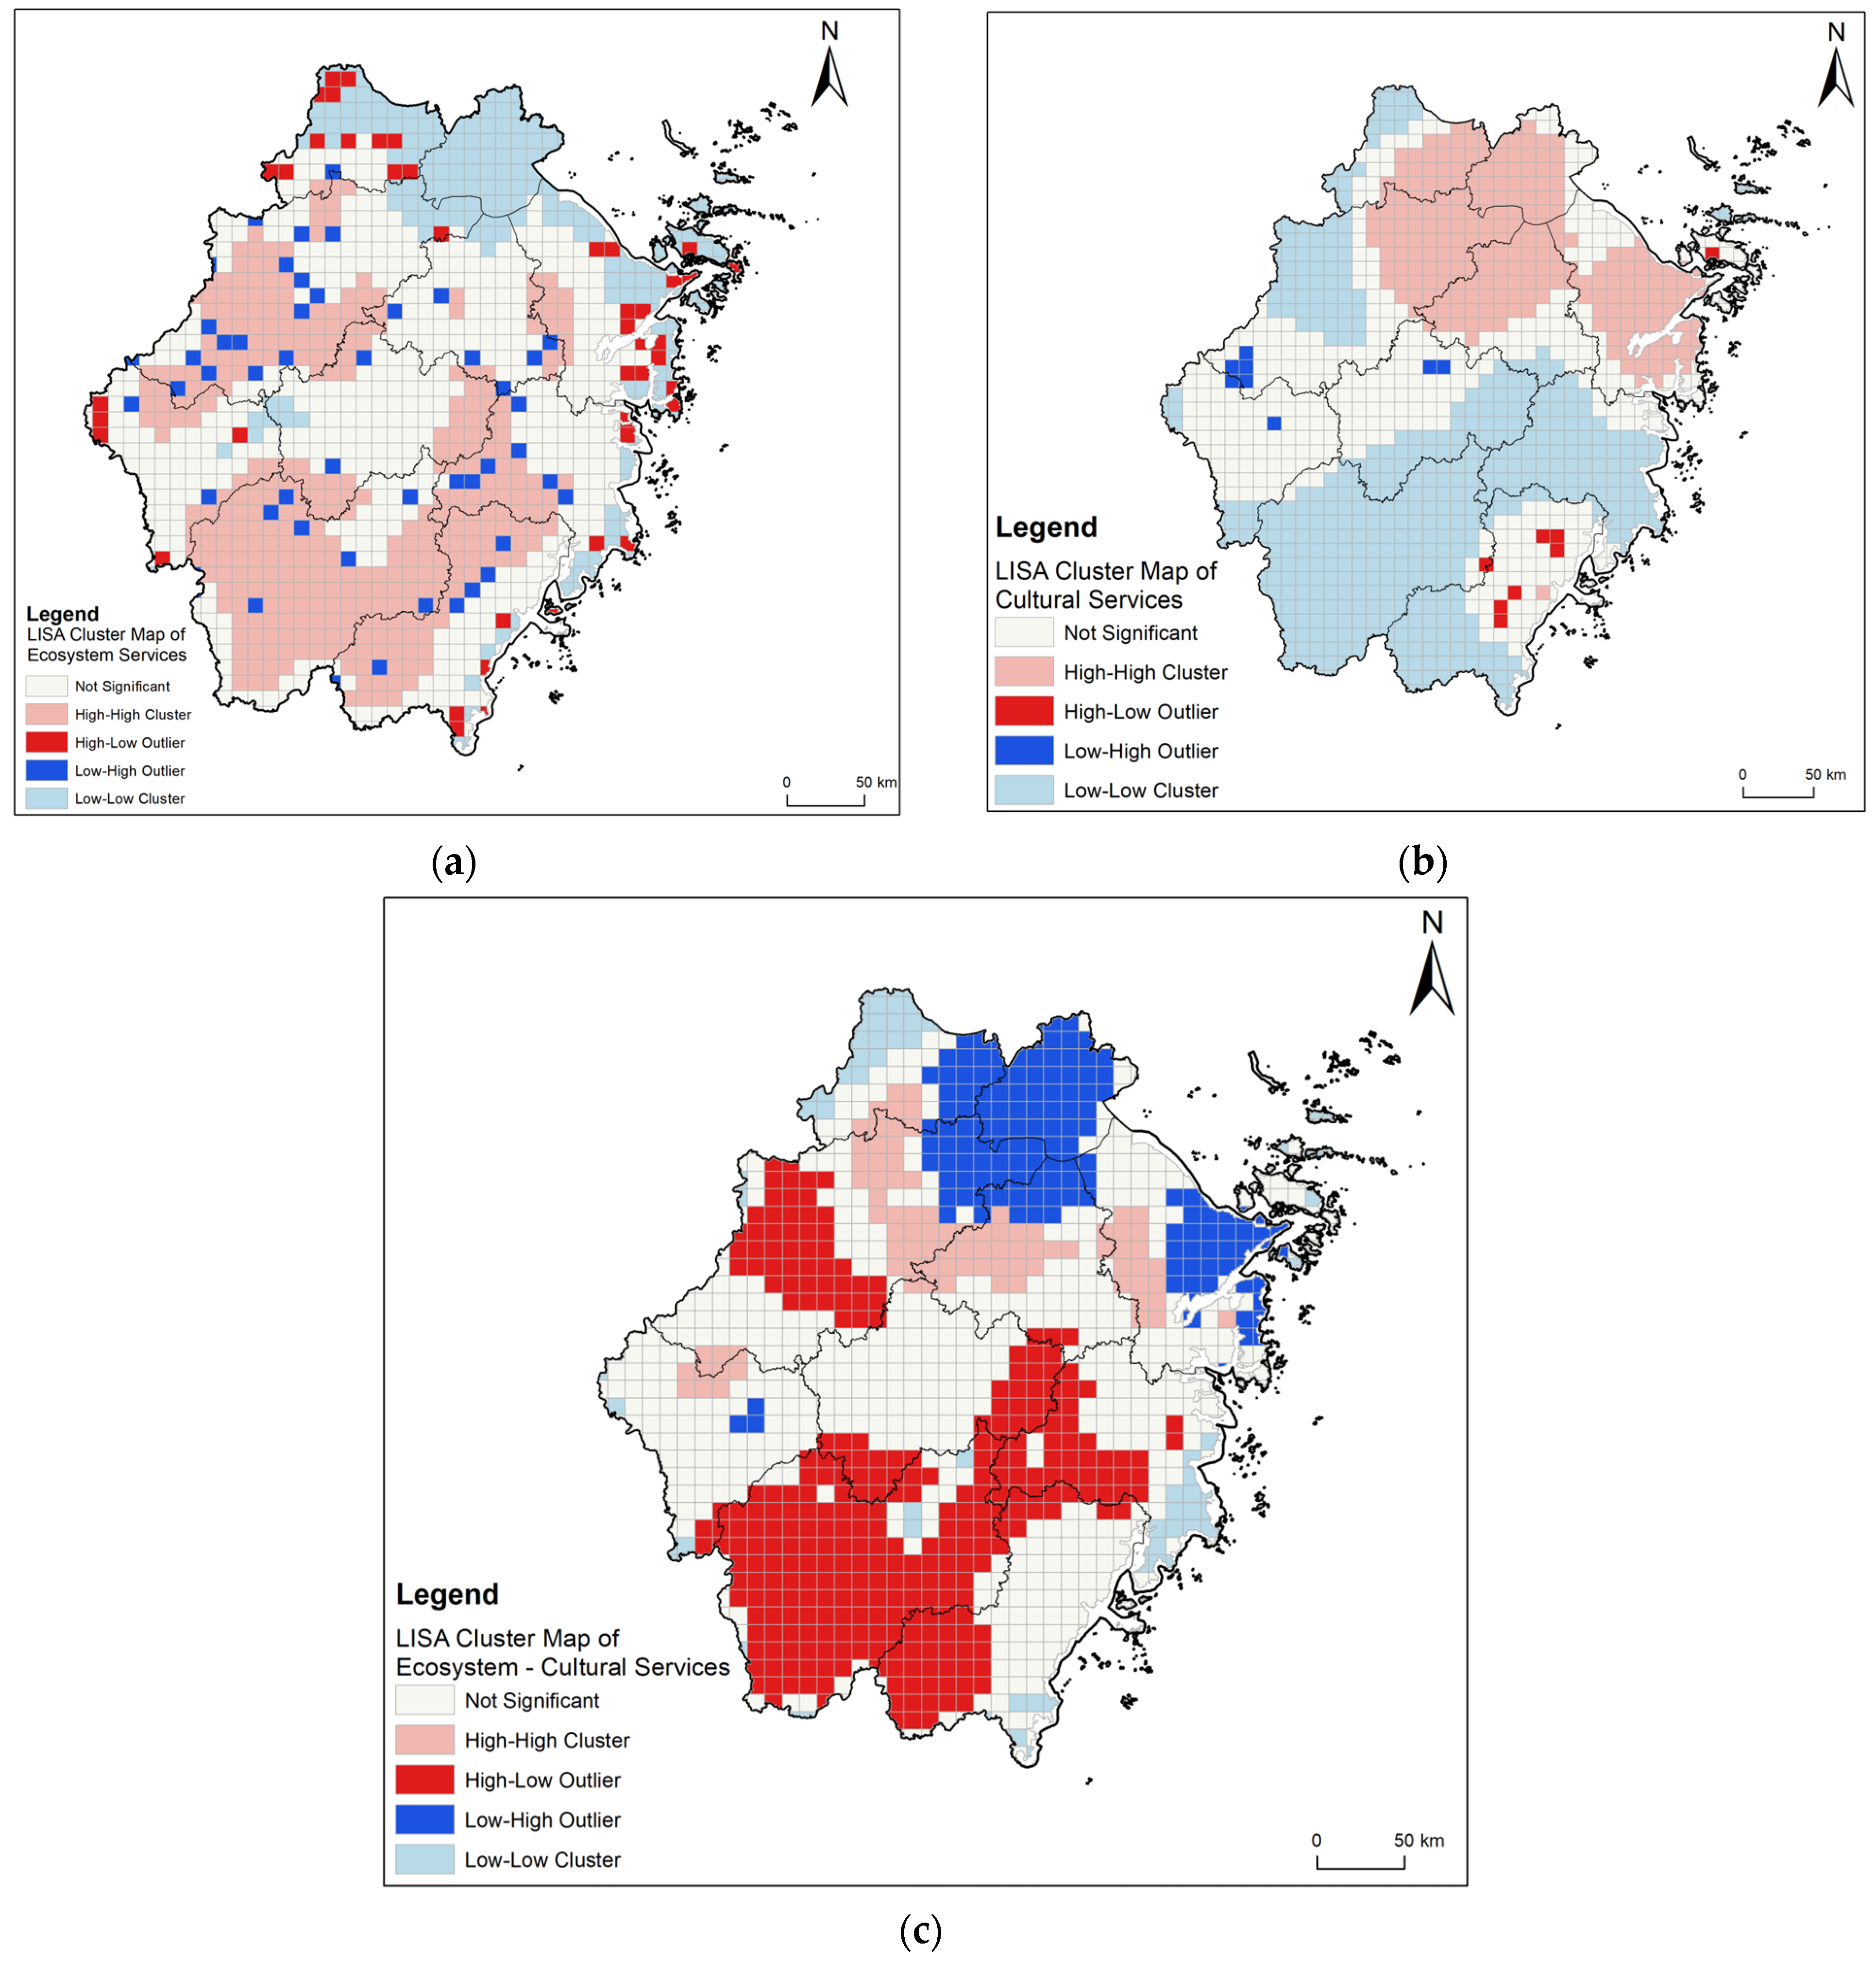
The local Moran’s I (LISA) results further reveal the spatial differences between ESI and CSI (Figure 9). HH clusters of ESI are mainly concentrated in Lishui and the mountainous and hilly areas of western Hangzhou, forming relatively large and continuous patches that reflect the contiguous distribution of ecosystem service advantage areas in mountainous regions (Figure 9a). LL clusters are mainly distributed in the northern Zhejiang Plain and highly urbanized coastal areas, indicating generally low ecosystem service levels in these regions. HL and LH types are mainly located in the mountainous and hilly belt and its transitional margins, showing local interspersion between areas with high and low ecosystem service values.
Compared with ESI, the spatial clustering pattern of CSI shows a more pronounced core-periphery structure (Figure 9b). HH clusters are mainly concentrated in the Hangzhou metropolitan area and the border area among Huzhou, Shaoxing, and Jiaxing, while another relatively large high-value cluster occurs in Ningbo. Cultural service provision therefore depends strongly on urban nodes and their surrounding facility networks. LL clusters form a relatively large and continuous low-value area in the mountainous regions of southwestern Zhejiang, reflecting the overall weakness of cultural service provision in these areas. HL and LH types are relatively scattered and are mainly distributed along the margins of the core areas or in mountain-plain transitional zones.
The local spatial pattern of the ESI-CSI relationship surface shows that ecosystem services and cultural services in Zhejiang Province exhibit both local synergy and clear mismatch (Figure 9c). HH clusters are mainly distributed in Hangzhou and its surrounding areas, southern Huzhou, northwestern Shaoxing, western Ningbo, and the Quzhou-Hangzhou border area, indicating that these areas simultaneously have relatively high ecosystem services and strong cultural service provision. LL clusters are scattered across the eastern coastal area of Taizhou, northern Huzhou, and some marginal areas of southwestern Zhejiang, reflecting weak areas with both low ecological and low cultural service levels. By contrast, HL and LH types are more widely distributed. HL outliers are mainly concentrated in the mountainous and hilly belt, especially around Lishui, and extend toward Quzhou, Jinhua, Taizhou, and Wenzhou, indicating that these areas have relatively high ecosystem service levels but insufficient cultural service provision. LH outliers are mainly found in the northern Zhejiang Plain, including Huzhou and Jiaxing, as well as in some coastal areas, indicating that these areas have stronger cultural services but relatively lower ecosystem service levels. ESI and CSI do not form a widely consistent pattern of overlapping high values at the provincial scale, and mismatch types are more common than synergy types.

3.5. Spatial Association Between ZJ-IAHS Distribution and Ecosystem and Cultural Services

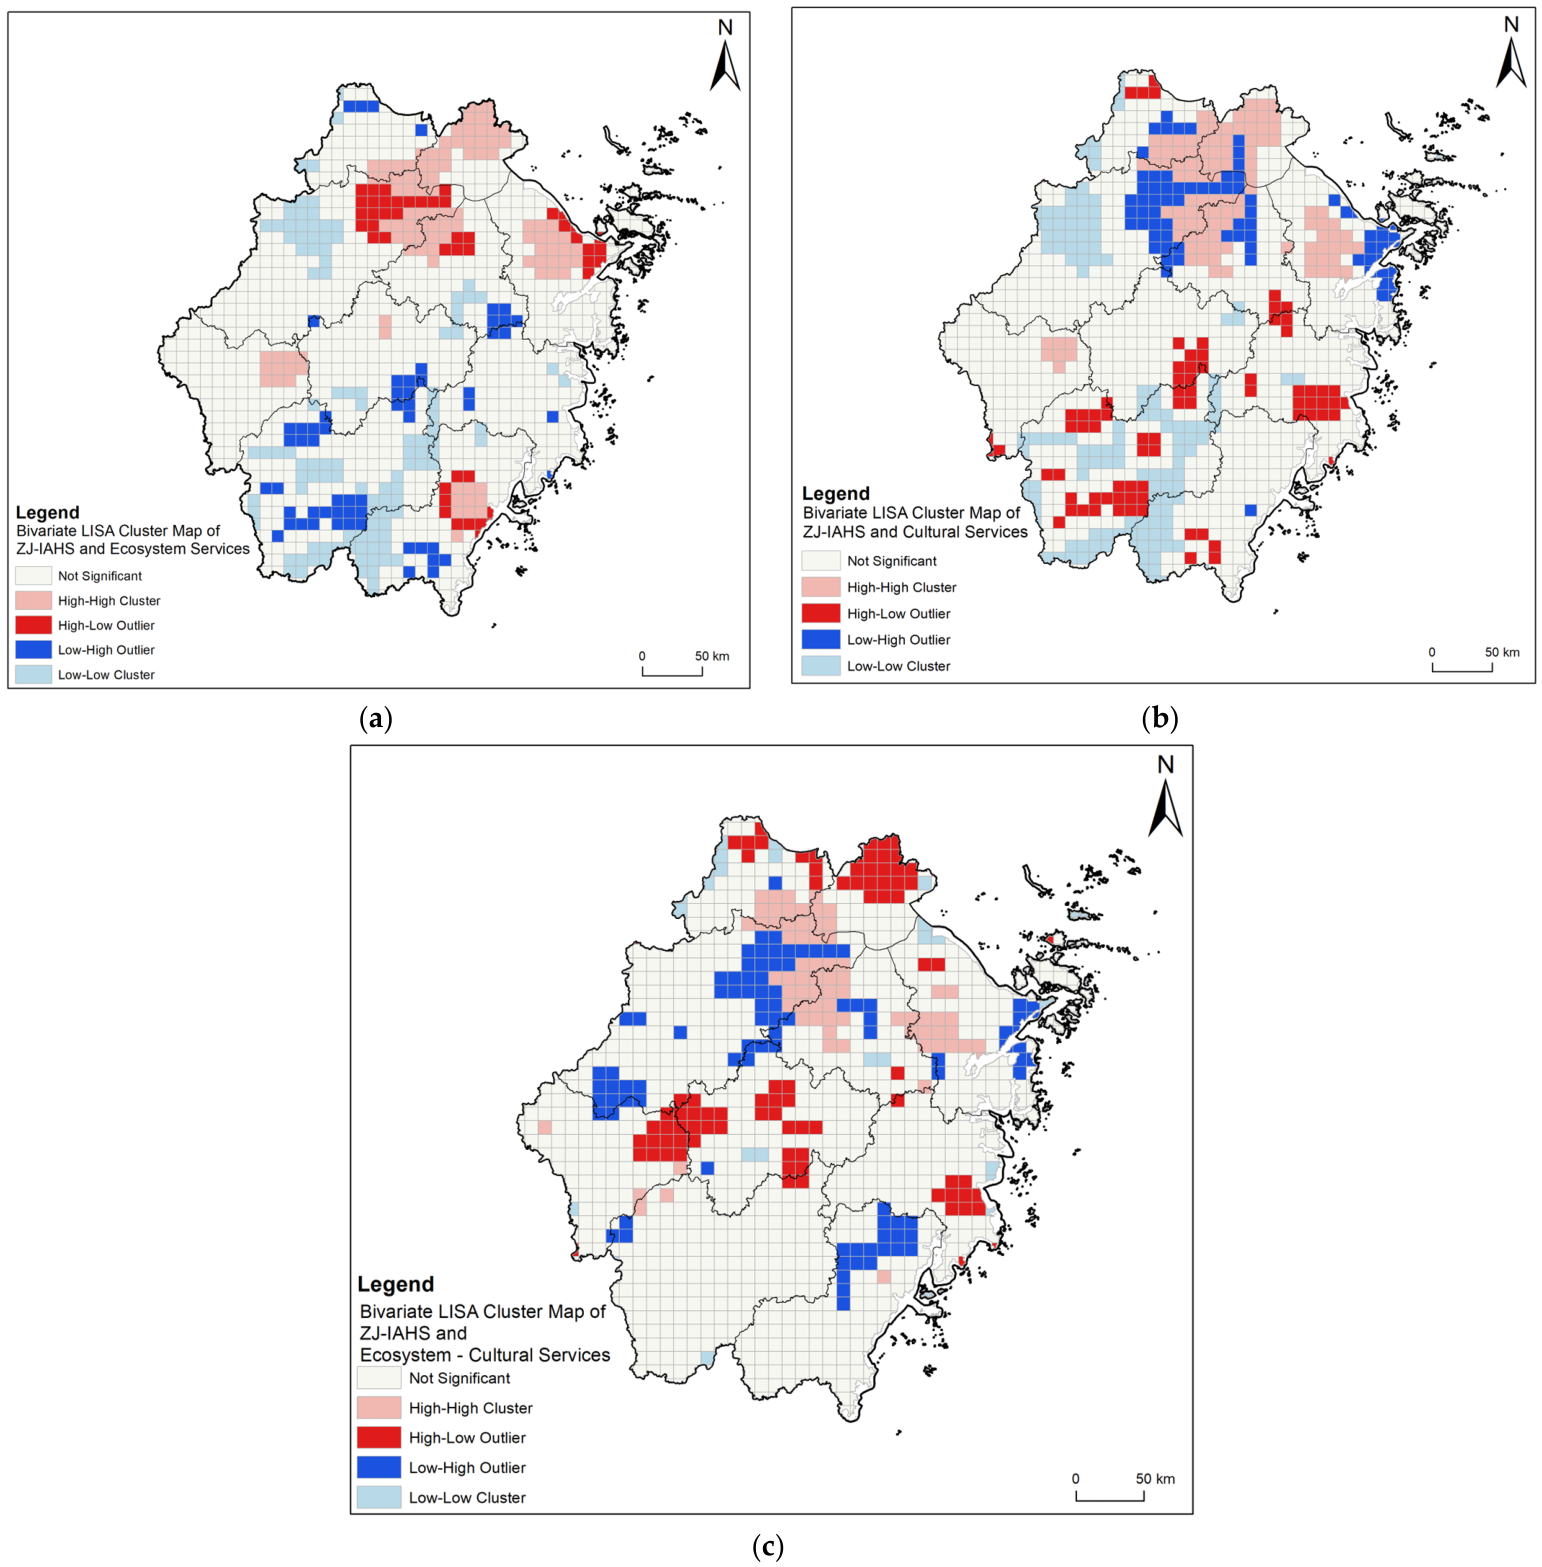
To identify the spatial relationships between agricultural heritage and contemporary ecosystem and cultural services, bivariate spatial autocorrelation analysis was conducted between the KDE surface of ZJ-IAHS and ESI, CSI, and the ESI-CSI relationship surface. ZJ-IAHS showed a weak positive correlation with ESI (Moran’s I = 0.094), an even weaker correlation with CSI (Moran’s I = 0.082), and a weak negative correlation with the ESI-CSI relationship surface (Moran’s I = −0.044). These results suggest limited overall spatial correspondence between ZJ-IAHS hotspots and ESI, CSI, and their synergy pattern. Given the small magnitude of these coefficients, the results are interpreted as weak but statistically detectable spatial associations rather than strong substantive spatial dependence.
The local spatial relationship between ZJ-IAHS and ESI is characterized by limited overlap and widespread interspersion (Figure 10a). HH clusters are mainly distributed in the northeastern Zhejiang Plain and several urban nodes, including northwestern Jiaxing, northern Hangzhou, southern Huzhou, the Hangzhou-Shaoxing border area, and central Ningbo. Additional areas of high-value correspondence also occur in urban Wenzhou and eastern Quzhou. By contrast, LL clusters are mainly distributed in the mountainous areas of central–southern and northern Zhejiang, especially as a relatively large continuous patch along the Lishui-Wenzhou border. HL and LH types are more frequently found in mountain-plain transitional zones and urban fringe areas, indicating that hotspot areas of agricultural heritage and areas with high ecosystem services do not form extensive and stable overlap, and that areas with ecological advantages do not necessarily correspond to hotspots of agricultural heritage.
The spatial correspondence between ZJ-IAHS and CSI is more strongly concentrated in the northern Zhejiang core area than that between ZJ-IAHS and ESI (Figure 10b). HH clusters are mainly concentrated in the border area among Hangzhou, Huzhou, and Jiaxing, as well as in the Hangzhou-Shaoxing border area, with several continuous patches also occurring in central Ningbo and eastern Quzhou. These areas show local spatial correspondence between agricultural heritage and cultural service provision. LL clusters are mainly distributed in the mountainous areas of central–southern and northwestern Zhejiang, especially as relatively large continuous patches in the border areas among Lishui, Wenzhou, Taizhou, and Jinhua. HL outliers occur more frequently in the mountainous areas of central–southern Zhejiang, reflecting the relative lag of cultural service provision in some areas with concentrated agricultural heritage. By contrast, LH outliers are mainly concentrated in the northern Zhejiang Plain and some coastal areas, where strong cultural services do not necessarily coincide with agricultural heritage hotspots. Overall, local correspondence between agricultural heritage and CSI is concentrated in more urbanized plain areas, while mismatch is more common in mountainous, coastal, and transitional zones.
Compared with the previous two relationships, the spatial correspondence between ZJ-IAHS and the ESI-CSI relationship surface is weaker (Figure 10c). HH clusters contract further and are mainly distributed in the border area among Hangzhou, Huzhou, and Jiaxing, as well as in the Hangzhou-Shaoxing border area, with a small continuous patch also occurring along the Shaoxing-Ningbo border. Stable overlap between ZJ-IAHS and areas with high ESI-CSI synergy is therefore very limited. LL clusters are relatively few and scattered. By contrast, HL and LH types occupy a much wider spatial extent. HL outliers are more evident in northern Jiaxing, the Quzhou-western Jinhua area, and the coastal area of Taizhou, whereas LH outliers are mainly distributed along the outer margins of the northern Zhejiang core area, northwestern Hangzhou, and some inland and coastal units in southeastern Zhejiang. These patterns indicate that the spatial correspondence between agricultural heritage hotspots and eco-cultural synergy areas is limited and uneven.
No strong spatial coupling is observed between ZJ-IAHS and ESI, CSI, or the ESI-CSI relationship surface. Local spatial correspondence is mainly concentrated in the low-elevation core area of northern Zhejiang and a few urban nodes, whereas interspersion and mismatch are more common across broader mountainous, coastal, and transitional areas. Among the three relationships, local overlap is strongest between ZJ-IAHS and CSI, while the HH area is smallest between ZJ-IAHS and the ESI-CSI synergy pattern. Agricultural heritage hotspots do not show strong spatial alignment with areas where ecological support and cultural service provision are simultaneously high.

4. Discussion

4.1. Historical Path Dependence and the Spatial Persistence of Agricultural Heritage Systems

The spatial pattern of ZJ-IAHS reflects strong historical path dependence rooted in the long-term evolution of agricultural systems across different regional environments. Agricultural development in Zhejiang can be traced back to prehistoric rice civilization, and the rice farming systems, irrigation organization, and settlement structures represented by the Liangzhu culture indicate a long history of adaptation between farming practices and local environments [78]. Present-day ZJ-IAHS are not newly created conservation objects, but agricultural systems that have persisted through long-term production, ecological adaptation, and knowledge transmission. Their current spatial pattern therefore preserves the accumulated results of historical agricultural development and provides the basic spatial foundation for understanding their contemporary conservation challenges.
This historical persistence is closely related to Zhejiang’s geomorphological differentiation. The province is dominated by mountains and hills, while plains, basins, river networks, and coastal areas provide different environmental conditions for agricultural development. Over time, these differences have supported the formation of diverse agricultural systems, including rice-polder-mulberry-fish systems in lowland water-network areas, terrace, tea, forest-fruit, and rice-fish systems in mountainous and hilly areas, and agro-fishery composite systems in coastal and island regions [79,80,81]. The dual-core and multi-center pattern of ZJ-IAHS is therefore not only a result of heritage recognition, but also the spatial expression of long-term agricultural system differentiation.
The results also show that the spatial logic of local agricultural heritage accumulation is not identical to that of high-level institutional recognition. While ZJ-IAHS as a whole are significantly clustered, China-NIAHS and GIAHS show more dispersed patterns. This indicates that provincial-level heritage more directly reflects the clustered retention of regional agricultural systems, whereas higher-level designations are shaped more strongly by representativeness, rarity, and institutional selection. Therefore, agricultural heritage conservation cannot be understood only as the protection of listed sites. It should also recognize the broader historical landscapes and regional agroecosystem lineages that support the persistence of these systems.
This finding has important implications for agroecological transition. The persistence of ZJ-IAHS suggests that agricultural transition in Zhejiang cannot be designed as a uniform modernization process. Instead, it should build on historically differentiated agricultural systems, locally adapted ecological knowledge, and region-specific landscape structures. In this sense, historical path dependence is not merely a background condition; it is a resource for designing differentiated agroecological transition pathways.

4.2. Different Spatial Logics of Ecological Support and Cultural Service Provision

The weak spatial associations among ZJ-IAHS, ESI, CSI, and the ESI–CSI synergy pattern reveal uneven spatial alignment among heritage resources, ecological conditions, cultural service capacity, and service accessibility in Zhejiang. Agricultural heritage systems retain ecological and cultural significance, but many heritage hotspots do not coincide with areas where ecological support and cultural service provision are both strong. This pattern provides a spatial basis for identifying ecological-support gaps, cultural-service gaps, and eco-cultural mismatch areas.
This mismatch reflects Zhejiang’s terrain–urbanization gradient. High ESI areas are mainly located in the mountainous and hilly regions of southwestern and south-central Zhejiang, where higher vegetation cover, lower development intensity, and complex terrain support habitat quality, soil retention, and water-related ecosystem functions [3,82,83]. Here, high ESI values indicate regional ecological capacity, mainly reflected in habitat quality, water yield, and soil retention in mountainous areas. High CSI areas are concentrated in the northern Zhejiang Plain and the urbanized areas around Hangzhou Bay, where population density, transport accessibility, public cultural facilities, tourism spaces, and cultural consumption networks are more developed [40,49]. The spatial separation between mountain-based ecological support and plain-based cultural service provision forms the basic structure of eco-cultural mismatch.
Agricultural heritage distribution follows another spatial logic. ZJ-IAHS are rooted in long-term farming practices, environmental adaptation, and local knowledge accumulation [84]. Their current distribution reflects historical path dependence and regional agroecosystem differentiation. Contemporary cultural service facilities are shaped more strongly by urbanization, public service allocation, tourism development, and accessibility [85,86]. The weak overlap among ZJ-IAHS, ESI, and CSI is therefore shaped by historical agricultural system formation, regional ecological conditions, land-use intensity, and uneven public service provision. Heritage listing can strengthen value representation and social recognition, but it does not automatically reshape the spatial foundations required for long-term conservation [87].
At the heritage-resource level, this mismatch is expressed as insufficient alignment between agricultural heritage hotspots and contemporary cultural service provision. The mountainous areas of southwestern and south-central Zhejiang retain strong ecological foundations, traditional production practices, and local knowledge, while facilities for cultural display, public communication, educational interpretation, tourism reception, and public participation remain relatively weak. The northern Zhejiang Plain and the urbanized areas around Hangzhou Bay have denser cultural service facilities, yet their links with agricultural production continuity, local knowledge transmission, and agricultural heritage landscape protection remain limited. Therefore, the mismatch identified in this study is mainly reflected in functional and accessibility differences, indicating insufficient external service support for agricultural heritage conservation and activation. This also explains why agricultural heritage hotspots do not necessarily become eco-cultural synergy areas, especially when tourism activation and cultural service development are not closely connected with ecological and heritage value guidance [31,32].
Recent international studies increasingly frame agricultural heritage systems as living landscapes that integrate traditional farming practices, agrobiodiversity, local knowledge, cultural values, and community-based management. Studies on GIAHS in Japan and southern Chile show that agricultural heritage conservation is closely related to farmers’ practices, local knowledge, cultural identity, livelihood resilience, and responses to social-ecological change [19,20]. Other recent work has further emphasized the identification of agricultural heritage areas through agrobiodiversity and the integration of cultural ecosystem services into rural landscape planning [41,88]. Compared with these site-based or value-identification studies, this study highlights the regional spatial conditions through which agricultural heritage can be connected to ecological support and cultural service provision. It also extends cultural ecosystem service and agricultural landscape studies by showing that cultural service capacity does not automatically overlap with ecological service advantages at the regional scale [41,89]. This finding adds a spatial mismatch perspective to agricultural heritage and landscape governance research, especially for regions where mountain-based ecological resources and urban-centered cultural services are unevenly distributed.

4.3. From Spatial Mismatch Diagnosis to Differentiated Heritage Governance

The spatial mismatch identified above provides a basis for differentiated heritage governance. The key task is to coordinate historically rooted agricultural systems, ecological foundations, cultural service provision, and local knowledge practices across different regional contexts. This argument is consistent with cultural ecosystem service and landscape governance studies, which emphasize the role of cultural values, public participation, and spatial planning in landscape management [38,86]. Eco-cultural service mismatch can therefore be used as a spatial diagnostic basis for identifying differentiated governance priorities. Accordingly, differentiated governance should respond not only to ecological and cultural gaps, but also to functional disconnection and accessibility constraints.
In the northern Zhejiang Plain and the urbanized areas around Hangzhou Bay, agricultural heritage systems are relatively close to dense cultural service networks. These areas have strong conditions for display, education, tourism, branding, and public participation. The governance priority is to use existing cultural service capacity to strengthen heritage interpretation, public education, tourism routes, urban-rural cultural corridors, and regional branding. At the same time, production spaces, water-network landscapes, traditional farming practices, and local knowledge should be maintained as the material and cultural basis of heritage activation [31,45].
In the mountainous and hilly areas of southwestern and south-central Zhejiang, many agricultural heritage systems are located near strong ecological foundations but relatively weak cultural service networks. The governance priority is to maintain ecological processes, agricultural production continuity, landscape integrity, and local knowledge systems, while improving interpretation facilities, digital communication platforms, small-scale public cultural spaces, and community-based tourism services. This approach can strengthen the communication and public recognition of agricultural heritage knowledge, ecological practices, and landscape experience through locally adapted cultural service mechanisms.
In transitional zones, urban fringes, and some coastal nodes, agricultural heritage systems face stronger pressures from land-use change, construction expansion, agricultural restructuring, and tourism development. The governance priority is to stabilize the spatial foundation of agricultural heritage by controlling the fragmentation of farmland, water systems, and traditional landscape structures. Cultural service development and tourism activation should be coordinated with production continuity, ecological support, and landscape integrity, so that value realization does not weaken the agroecosystem basis of heritage [32].
These differentiated governance priorities translate spatial mismatch diagnosis into planning and management actions. Areas with strong ecological foundations and weak cultural service provision require interpretation facilities, communication platforms, public participation mechanisms, and locally adapted tourism services. Areas with strong cultural service networks and weaker ecological or heritage foundations require stronger links to real agricultural production, local knowledge, and landscape continuity. At the regional scale, this framework can support heritage conservation zoning, eco-cultural corridor planning, sustainable tourism management, and coordination between rural revitalization and ecological protection. It provides spatial guidance for agricultural heritage conservation and resilience-oriented planning, while the direct assessment of socio-ecological resilience requires future community-level, temporal, and institutional data. For climate adaptation and rural resilience, these priorities suggest that heritage governance should protect ecological functions such as water regulation, soil retention, and habitat maintenance, while strengthening cultural communication, local knowledge transmission, and community participation.
The mismatch typology can inform a planning-oriented governance framework. First, heritage conservation zoning could distinguish areas with strong eco-cultural synergy, ecological-support advantages, cultural-service advantages, and weak dual support. HH areas may be considered priority areas for integrated heritage conservation, interpretation, and sustainable tourism. HL areas, often located in mountainous and hilly regions with strong ecological foundations but weak cultural service provision, would benefit from improved interpretation facilities, public communication, community-based tourism, and ecological compensation mechanisms. LH areas, often located in plains and urbanized areas with stronger cultural service networks but weaker ecological or heritage foundations, could strengthen the connection between cultural activation, agricultural production, local knowledge, farmland-water networks, and landscape continuity. LL areas may require ecological restoration, basic public cultural services, and rural revitalization support. Second, eco-cultural corridors could be planned along water systems, mountain-plain transition zones, historical farming landscapes, and tourism routes to connect heritage sites, ecological source areas, cultural facilities, and rural communities. Third, sustainable tourism planning should pay attention to landscape homogenization and excessive commercialization, while supporting local products, farming experiences, heritage education, and community participation. In this way, spatial mismatch diagnosis can provide differentiated planning references for agricultural heritage conservation and rural revitalization.

4.4. Limitations and Future Research Directions

This study has several limitations. First, the CSI constructed in this study mainly represents facility-based cultural service provision in areas associated with agricultural heritage systems. It captures the spatial facility conditions that support cultural display, public communication, educational interpretation, tourism experience, and public participation. However, POI data cannot fully capture non-facility-based cultural services, such as local knowledge, community practices, agrarian experience, ritual activities, and everyday cultural participation. Future research could combine tourism flows, visitation statistics, social media activity, community interviews, and participatory mapping to further examine how cultural services are actually generated in agricultural heritage contexts.
Second, although the spatial analysis and model settings used in this study follow common practices in GIS, InVEST, KDE, and spatial autocorrelation studies, uncertainty remains. These uncertainties mainly arise from differences in data sources and spatial resolution, the sensitivity of KDE bandwidth, InVEST parameters, ecosystem service weights, grid size, and spatial weight matrices, as well as possible classification bias in LULC and POI data. They may affect subsequent index construction, grid aggregation, and spatial autocorrelation results. Future research could further examine these uncertainties through sensitivity analysis and cross-validation with field surveys, visitation data, social media activity, or participatory mapping.
Third, this study mainly provides a provincial-scale spatial diagnosis. It identifies spatial alignment and mismatch among agricultural heritage, ecosystem services and cultural service provision, but the causal mechanisms behind these relationships require further examination. County-level, village-level, and site-level studies are needed to identify how local communities, farmers, governance institutions, and market actors shape the conservation and activation of agricultural heritage systems.
Fourth, the study is based on cross-sectional spatial data. Socio-ecological resilience is treated as a governance-oriented implication, and its direct measurement requires additional indicators related to livelihood resilience, adaptive governance, ecological recovery, community participation, and temporal change. Future research could also integrate temporal data to examine how eco-cultural service mismatch evolves and how different governance interventions affect the resilience of agricultural heritage systems.

5. Conclusions

This study examined 205 ZJ-IAHS in Zhejiang Province to assess how agricultural heritage systems are spatially embedded in ecosystem services, cultural service provision, and their eco-cultural synergy. The results show that ZJ-IAHS are significantly clustered, with high-density areas concentrated in northern and southwestern Zhejiang. ESI and CSI follow contrasting spatial logics: high ESI areas are mainly distributed in the mountainous and hilly regions of southwestern and south-central Zhejiang, whereas high CSI areas are concentrated in the northern Zhejiang Plain and the urbanized areas around Hangzhou Bay. The weak spatial associations between ZJ-IAHS, ESI, CSI, and the ESI-CSI synergy pattern indicate limited spatial correspondence among agricultural heritage hotspots, ecological support, and cultural service capacity.
The main contribution of this study is to provide a spatial diagnostic framework for identifying ecological-support gaps, cultural-service gaps, and eco-cultural mismatch areas in agricultural heritage governance. The findings support differentiated governance strategies, including heritage conservation zoning, eco-cultural corridor planning, sustainable tourism management, and coordination between rural revitalization and ecological protection. Future research should integrate community-level data, temporal dynamics, tourism flows, participatory mapping, and governance indicators to examine how spatial mismatch affects the long-term conservation and activation of agricultural heritage systems.

Author Contributions

Conceptualization, F.J. and Z.Z.; methodology, F.J.; software, F.J.; validation, F.J. and Z.Z.; formal analysis, F.J.; investigation, F.J.; resources, F.J.; data curation, F.J.; writing—original draft preparation, F.J.; writing—review and editing, Z.Z.; visualization, F.J.; supervision, Z.Z.; project administration, Z.Z.; funding acquisition, F.J. All authors have read and agreed to the published version of the manuscript.

Funding

This research was funded by Jiangsu Provincial Department of Education under the 2024 Universities’ philosophy and social science studies in Jiangsu Province, grant number 2024SJYB0134.

Data Availability Statement

The original contributions presented in this study are included in the article. Further inquiries can be directed to the corresponding author.

Conflicts of Interest

The authors declare no conflicts of interest.

Appendix A

Table A1. Robustness comparison of KDE results under the 5–3–1 and 3–2–1 agricultural heritage weighting schemes.
IndicatorResultInterpretation
Pearson correlation between c531 and c3210.982High consistency in grid values
Spearman rank correlation0.985High consistency in spatial ranking
Kendall correlation0.898Stable rank structure
Quintile classification exact agreement81.25%Most grid cells remain in the same class
Quintile classification adjacent agreement100.00%No grid cell shifts by more than one class
Top 10% high-value area overlap88.67%Core hotspot areas remain stable
Bottom 10% low-value area overlap93.88%Low-value areas remain stable
Standard deviation: c321/c5318.15/9.185–3–1 strengthens spatial differentiation
Coefficient of variation: c321/c5310.421/0.4305–3–1 slightly improves discrimination
P95/P5 ratio: c321/c5315.62/5.885–3–1 better reflects hierarchical differences
Table A2. Threat factors.
ThreatsMax Distance of Influence (km)WeightDecay Type
Cropland1.00.6Linear
Urban land8.01.0Exponential
Rural settlements6.00.8Exponential
Other construction land5.00.6Exponential
Unused land3.00.5Linear
Table A3. Habitat suitability.
Land-Use TypesHabitat
Suitability
Sensitivity to Threat Factors
CroplandUrban LandRural
Settlements
Other Construction LandUnused Land
Cropland0.50.00.80.70.60.4
Forest1.00.60.90.80.80.5
Shrub0.80.60.80.60.70.5
Sparse woodland0.70.50.70.70.80.4
Other woodland0.60.50.70.70.80.4
High-coverage grassland0.70.60.70.70.70.6
Medium-coverage grassland0.60.50.70.70.70.6
Low-coverage grassland0.50.50.70.70.70.6
Water bodies0.80.40.70.60.70.4
Urban land0.00.00.00.00.00.0
Rural settlements0.00.00.00.00.00.0
Other construction land0.00.00.00.00.00.0
Unused land0.30.30.50.40.50.0

References

  1. Koohafkan, P. Globally Important Agricultural Heritage Systems—A Legacy for the Future. Available online: https://openknowledge.fao.org/handle/20.500.14283/i1979e (accessed on 29 September 2025).
  2. FAO. Globally Important Agricultural Heritage Systems (GIAHS). Combining Agricultural Biodiversity, Resilient Ecosystems, Traditional Farming Practices and Cultural Identity. Available online: https://www.fao.org/family-farming/detail/en/c/1147754/ (accessed on 29 September 2025).
  3. Min, Q.; Zhang, Y.; Jiao, W.; Sun, X. Responding to common questions on the conservation of agricultural heritage systems in China. J. Geogr. Sci. 2016, 26, 969–982. [Google Scholar] [CrossRef]
  4. Agnoletti, M.; Santoro, A. Agricultural heritage systems and agrobiodiversity. Biodivers. Conserv. 2022, 31, 2231–2241. [Google Scholar] [CrossRef]
  5. Park, H.C.; Oh, C.H. Flora, life form characteristics, and plan for the promotion of biodiversity in South Korea’s Globally Important Agricultural Heritage System, the traditional Gudeuljang irrigated rice terraces in Cheongsando. J. Mt. Sci. 2017, 14, 1212–1228. [Google Scholar] [CrossRef]
  6. Cruz, M.J.D.; Koohafkan, P. Globally Important Agricultural Heritage Systems: A shared vision of agricultural, ecological and traditional societal sustainability. Resour. Sci. 2009, 31, 905–913. [Google Scholar]
  7. Editorial Board. Official launch of the “China Agricultural Cultural Heritage Protection Project”. Anc. Mod. Agric. 2004, 03, 104. [Google Scholar]
  8. Koohafkan, P.; Cruz, M.J.d. Conservation and Adaptive Management of Globally Important Agricultural Heritage Systems(GIAHS). J. Resour. Ecol. 2011, 2, 22–28. [Google Scholar] [CrossRef]
  9. Huang, Q.; Liu, Z.; He, C.; Gou, S.; Bai, Y.; Wang, Y.; Shen, M. The occupation of cropland by global urban expansion from 1992 to 2016 and its implications. Environ. Res. Lett. 2020, 15, 084037. [Google Scholar] [CrossRef]
  10. Yang, L.; Liu, M.; Min, Q.; Li, W. Specialization or diversification? The situation and transition of households’ livelihood in agricultural heritage systems. Int. J. Agric. Sustain. 2018, 16, 455–471. [Google Scholar] [CrossRef]
  11. Gao, P.; Xie, Y.; Song, C.; Cheng, C.; Ye, S. Exploring detailed urban-rural development under intersecting population growth and food production scenarios: Trajectories for China’s most populous agricultural province to 2030. J. Geogr. Sci. 2023, 33, 222–244. [Google Scholar] [CrossRef]
  12. Jiao, W.; Min, Q. Reviewing the Progress in the Identification, Conservation and Management of China-Nationally Important Agricultural Heritage Systems (China-NIAHS). Sustainability 2017, 9, 1698. [Google Scholar] [CrossRef]
  13. Min, Q.; He, L.; Sun, Y.; Zhang, D.; Yuan, Z.; Xu, Y.; Bai, Y. On the value, conservation and sustainable development of GIAHS pilot sites in China. Chin. J. Eco-Agric. 2012, 20, 668–673. [Google Scholar] [CrossRef]
  14. Zhang, Y.; He, L. Protecting important agricultural heritage systems (IAHS) by industrial integration development (IID): Practices from China. J. Resour. Ecol. 2021, 12, 555–566. [Google Scholar] [CrossRef]
  15. Zhang, Y.; Min, Q.; Jiao, W.; Liu, M. Values and Conservation of Honghe Hani Rice Terraces System as a GIAHS Site. J. Resour. Ecol. 2016, 7, 197–204. [Google Scholar] [CrossRef]
  16. Hua, C.; Zhang, J.; Zhang, C. Agricultural Heritage Protection and Development Policy from the Perspective of Government Documents. J. Resour. Ecol. 2023, 14, 102–113. [Google Scholar] [CrossRef]
  17. Bai, Y.; Sun, X.; Tian, M.; Anthony, M.F. Typical water-land utilization GIAHS in low-lying areas: The Xinghua duotian agrosystem example in China. J. Resour. Ecol. 2014, 5, 320–327. [Google Scholar]
  18. He, L.; Min, Q. The role of multi-functionality of agriculture in sustainable tourism development in Globally Important Agricultural Heritage Systems (GIAHS) sites in China. J. Resour. Ecol. 2013, 4, 250–257. [Google Scholar] [CrossRef]
  19. Nath, T.K.; Inoue, M.; Ee Wey, Y.; Takahashi, S. Globally Important Agricultural Heritage Systems in Japan: Investigating selected agricultural practices and values for farmers. Int. J. Agric. Sustain. 2024, 22, 2355429. [Google Scholar] [CrossRef]
  20. Caviedes, J.; Ibarra, J.T.; Calvet-Mir, L.; Álvarez-Fernández, S.; Junqueira, A.B. Indigenous and local knowledge on social-ecological changes is positively associated with livelihood resilience in a Globally Important Agricultural Heritage System. Agric. Syst. 2024, 216, 103885. [Google Scholar] [CrossRef]
  21. Ibarra, J.T.; Caviedes, J.; Monterrubio-Solís, C.; Barreau, A.; Marchant, C. Social-ecological resilience: Knowledge of agrobiodiversity by campesinos and migrants in the face of global changes. J. Environ. Manag. 2024, 370, 122461. [Google Scholar] [CrossRef]
  22. Liu, H.; Luo, M.; Xu, M.; Liu, Y.; Chen, B.; Zhao, W.; Huang, B. Gini coefficient-based spatial distribution features of Globally Important Agricultural Heritage Systems (GIAHS) and their influence factors. Chin. J. Eco-Agric. 2020, 28, 1465–1474. [Google Scholar]
  23. Li, M.; Zhang, Y.; Xu, M.; He, L.; Liu, L.; Tang, Q. China eco-wisdom: A review of sustainability of agricultural heritage systems on aquatic-ecological conservation. Sustainability 2019, 12, 60. [Google Scholar] [CrossRef]
  24. Ge, B.; Song, Y.; Wang, J.; Wang, Y.; Yuan, X. Spatio-temporal pattern and entropy variation of agricultural heritage in China. Herit. Sci. 2024, 12, 415. [Google Scholar] [CrossRef]
  25. Zhang, H.; Li, F.; Zhang, J.; Liang, H.; Huangfu, Y. Spatial structure and influencing factors of agricultural civilization heritage in the Yellow River Basin. Sci. Rep. 2025, 15, 29836. [Google Scholar] [CrossRef]
  26. Xu, L.; Liao, Y.; Liu, J. Study on the evolution of the spatial patterns and driving factors of national agricultural cultural heritage in China. PLoS ONE 2025, 20, e0313926. [Google Scholar] [CrossRef]
  27. Xu, X.; Zhang, J.-G. On Temporal and Spatial Distribution and Evolution Characteristics of Agricultural Cultural Heritage in Zhejiang Province. J. Southwest China Norm. Univ. (Nat. Sci. Ed.) 2021, 46, 50–57. [Google Scholar] [CrossRef]
  28. Guo, X.; Min, Q.; Jiao, W. Spatial distribution characteristics and differentiated management strategies of China Nationally Important Agricultural Heritage Systems. J. Geogr. Sci. 2024, 34, 483–498. [Google Scholar] [CrossRef]
  29. Li, C.; Tong, T.; Huang, X. Sustainable farming genes: Spatial distribution and influencing factors of Chinese Agricultural Heritage Sites (CAHSs). Front. Sustain. Food Syst. 2023, 7, 1141986. [Google Scholar] [CrossRef]
  30. Plieninger, T.; Kizos, T.; Bieling, C.; Le Dû-Blayo, L.; Budniok, M.-A.; Bürgi, M.; Crumley, C.L.; Girod, G.; Howard, P.; Kolen, J. Exploring ecosystem-change and society through a landscape lens: Recent progress in European landscape research. Ecol. Soc. 2015, 20, 5. [Google Scholar] [CrossRef]
  31. Sun, Y.; Song, Y.; Chen, Y.; Yao, C.; Li, W. Sustainable or not? Tourism development in agricultural heritage sites. J. Resour. Ecol. 2021, 12, 543–554. [Google Scholar] [CrossRef]
  32. Zhang, Y.; Zheng, Q.; Tang, C.; Liu, H.; Cui, M. Spatial characteristics and restructuring model of the agro-cultural heritage site in the context of culture and tourism integration. Heliyon 2024, 10, e30227. [Google Scholar] [CrossRef]
  33. Reyes, S.R.C.; Miyazaki, A.; Yiu, E.; Saito, O. Enhancing sustainability in traditional agriculture: Indicators for monitoring the conservation of globally important agricultural heritage systems (GIAHS) in Japan. Sustainability 2020, 12, 5656. [Google Scholar] [CrossRef]
  34. Arnés García, M.; Yagüe, J.L.; de Nicolás, V.L.; Díaz-Puente, J.M. Characterization of Globally Important Agricultural Heritage Systems (GIAHS) in Europe. Sustainability 2020, 12, 1611. [Google Scholar] [CrossRef]
  35. Nahuelhual, L.; Carmona, A.; Laterra, P.; Barrena, J.; Aguayo, M. A mapping approach to assess intangible cultural ecosystem services: The case of agriculture heritage in Southern Chile. Ecol. Indic. 2014, 40, 90–101. [Google Scholar] [CrossRef]
  36. Wei, Q.; Halike, A.; Yao, K.; Chen, L.; Balati, M. Construction and optimization of ecological security pattern in Ebinur Lake Basin based on MSPA-MCR models. Ecol. Indic. 2022, 138, 108857. [Google Scholar] [CrossRef]
  37. Wang, X.; Xie, X.; Wang, Z.; Lin, H.; Liu, Y.; Xie, H.; Liu, X. Construction and optimization of an ecological security pattern based on the MCR model: A case study of the Minjiang River Basin in Eastern China. Int. J. Environ. Res. Public Health 2022, 19, 8370. [Google Scholar] [CrossRef]
  38. Fish, R.; Church, A.; Winter, M. Conceptualising cultural ecosystem services: A novel framework for research and critical engagement. Ecosyst. Serv. 2016, 21, 208–217. [Google Scholar] [CrossRef]
  39. La Rosa, D.; Spyra, M.; Inostroza, L. Indicators of Cultural Ecosystem Services for urban planning: A review. Ecol. Indic. 2016, 61, 74–89. [Google Scholar] [CrossRef]
  40. Hernández-Morcillo, M.; Plieninger, T.; Bieling, C. An empirical review of cultural ecosystem service indicators. Ecol. Indic. 2013, 29, 434–444. [Google Scholar] [CrossRef]
  41. Pingarroni, A.; Alba, D.; Otamendi Urroz, I.; Murillo-Lopez, B.; Tauro, A. Cultural ecosystem services across agricultural landscapes. In The Routledge Handbook of Cultural Ecosystem Services; Routledge: London, UK, 2025; pp. 170–185. [Google Scholar] [CrossRef]
  42. You, W.; Xu, H.; Duan, J.; Zhou, Y.; Li, J.; He, D.; Kizos, T. Assessing spatial differences of perceptions of cultural ecosystem services for coastal cultural landscape management: A case study from rural and urban areas in Quanzhou, China. J. Environ. Manag. 2025, 395, 127674. [Google Scholar] [CrossRef] [PubMed]
  43. Song, Z.; Liu, J.; Huang, Z. Evaluating Spatial Patterns and Drivers of Cultural Ecosystem Service Supply-Demand Mismatches in Mountain Tourism Areas: Evidence from Hunan Province, China. Sustainability 2025, 17, 9702. [Google Scholar] [CrossRef]
  44. Liu, G.; Doronzo, D.M. A novel approach to bridging physical, cultural, and socioeconomic indicators with spatial distributions of agricultural heritage systems (AHS) in China. Sustainability 2020, 12, 6921. [Google Scholar] [CrossRef]
  45. Chan, K.M.A.; Satterfield, T.; Goldstein, J. Rethinking ecosystem services to better address and navigate cultural values. Ecol. Econ. 2012, 74, 8–18. [Google Scholar] [CrossRef]
  46. Syrbe, R.-U.; Grunewald, K. Ecosystem service supply and demand—The challenge to balance spatial mismatches. Int. J. Biodivers. Sci. Ecosyst. Serv. Manag. 2017, 13, 148–161. [Google Scholar] [CrossRef]
  47. Lorilla, R.S.; Kalogirou, S.; Poirazidis, K.; Kefalas, G. Identifying spatial mismatches between the supply and demand of ecosystem services to achieve a sustainable management regime in the Ionian Islands (Western Greece). Land Use Policy 2019, 88, 104171. [Google Scholar] [CrossRef]
  48. González-García, A.; Palomo, I.; González, J.; López-Santiago, C.; Montes, C. Quantifying spatial supply-demand mismatches in ecosystem services provides insights for land-use planning. Land Use Policy 2020, 94, 104493. [Google Scholar] [CrossRef]
  49. López Sánchez, M.; Tejedor Cabrera, A.; Linares Gómez del Pulgar, M. The potential role of cultural ecosystem services in heritage research through a set of indicators. Ecol. Indic. 2020, 117, 106670. [Google Scholar] [CrossRef]
  50. Barrena, J.; Nahuelhual, L.; Báez, A.; Schiappacasse, I.; Cerda, C. Valuing cultural ecosystem services: Agricultural heritage in Chiloé island, southern Chile. Ecosyst. Serv. 2014, 7, 66–75. [Google Scholar] [CrossRef]
  51. Zhao, L.; Ma, R.; Chen, F.; Li, J.; Chen, Q.; Fan, Y. Enhancing the spatial resilience of agricultural heritage through constructing a balanced production-living-ecological space protection network. npj Herit. Sci. 2025, 13, 368. [Google Scholar] [CrossRef]
  52. You, C.; Liu, W.; Qu, H.; Feng, C.-C.; Guo, L. Nonlinear dynamics of natural and cultural ecosystem service supply and demand. npj Herit. Sci. 2025, 13, 555. [Google Scholar] [CrossRef]
  53. Ju, F.; Yang, R.; Yang, C. Analysis of Spatiotemporal Dynamics and Driving Factors of China’s Nationally Important Agricultural Heritage Systems. Agriculture 2025, 15, 221. [Google Scholar] [CrossRef]
  54. Li, F.; Zhang, L. Comparison of point pattern analysis methods for classifying the spatial distributions of spruce-fir stands in the north-east USA. Forestry 2007, 80, 337–349. [Google Scholar] [CrossRef]
  55. Shi, X. Selection of bandwidth type and adjustment side in kernel density estimation over inhomogeneous backgrounds. Int. J. Geogr. Inf. Sci. 2010, 24, 643–660. [Google Scholar] [CrossRef]
  56. Moreau, G.; Auguste, P.; Locht, J.-L.; Patou-Mathis, M. Detecting human activity areas in Middle Palaeolithic open-air sites in Northern France from the distribution of faunal remains. J. Archaeol. Sci. Rep. 2021, 40, 103196. [Google Scholar] [CrossRef]
  57. Zhang, S.; Sun, C.; Zhang, Y.; Hu, M.; Shen, X. Exploring the Spatiotemporal Changes and Driving Forces of Ecosystem Services of Zhejiang Coasts, China, Under Sustainable Development Goals. Chin. Geogr. Sci. 2024, 34, 647–661. [Google Scholar] [CrossRef]
  58. Wang, Y.; Xinchen, G.; Yu, H. Spatiotemporal Variation in the Yangtze River Delta Urban Agglomeration from 1980 to 2020 and Future Trends in Ecosystem Services. Land 2023, 12, 929. [Google Scholar] [CrossRef]
  59. Duan, L.; Yang, S.; Xiang, M.; Li, W.; Li, J. Spatiotemporal evolution and driving factors of ecosystem service value in the Upper Minjiang River of China. Sci. Rep. 2024, 14, 23398. [Google Scholar] [CrossRef]
  60. Abd, M.H.; Kadhim, S.J. USLE and RUSLE Approach-mportant Tools for Soil Erosion Risk Assessment: A Review. East Afr. Sch. J. Eng. Comput. Sci. 2020, 3, 23–29. [Google Scholar]
  61. Wang, L.; Mao, X.-F.; Yu, H.; Zhao, B.; Tang, W.; Li, H.; Wang, X.; Zhou, N. Identifying the Key Protection Areas of Alpine Marsh Wetlands in the Qinghai Qilian Mountains, China: An Ecosystem Patterns–Characteristics–Functions Combined Method. Land 2024, 13, 2115. [Google Scholar] [CrossRef]
  62. Maes, J.; Barbosa, A.; Baranzelli, C.; Zulian, G.; Batista e Silva, F.; Vandecasteele, I.; Hiederer, R.; Liquete, C.; Paracchini, M.L.; Mubareka, S.; et al. More green infrastructure is required to maintain ecosystem services under current trends in land-use change in Europe. Landsc. Ecol. 2015, 30, 517–534. [Google Scholar] [CrossRef] [PubMed]
  63. Wang, J.; Wu, Y.; Gou, A. Habitat quality evolution characteristics and multi-scenario prediction in Shenzhen based on PLUS and InVEST models. Front. Environ. Sci. 2023, 11, 1146347. [Google Scholar] [CrossRef]
  64. Li, M.; Zhou, Y.; Xiao, P.; Tian, Y.; Huang, H.; Xiao, L. Evolution of Habitat Quality and Its Topographic Gradient Effect in Northwest Hubei Province from 2000 to 2020 Based on the InVEST Model. Land 2021, 10, 857. [Google Scholar] [CrossRef]
  65. Redhead, J.W.; Stratford, C.; Sharps, K.; Jones, L.; Ziv, G.; Clarke, D.; Oliver, T.H.; Bullock, J.M. Empirical validation of the InVEST water yield ecosystem service model at a national scale. Sci. Total Environ. 2016, 569–570, 1418–1426. [Google Scholar] [CrossRef] [PubMed]
  66. Qiao, X.; Li, Z.; Lin, J.; Wang, H.; Zheng, S.; Yang, S. Assessing current and future soil erosion under changing land use based on InVEST and FLUS models in the Yihe River Basin, North China. Int. Soil. Water Conserv. Res. 2024, 12, 298–312. [Google Scholar] [CrossRef]
  67. Assessment, M.E. Ecosystems and Human Well-being: Synthesis. Available online: https://www.oas.org/dsd/tool-kit/Documentos/ModuleIdoc/Summary%20for%20Decision-Makers.pdf?utm (accessed on 7 January 2026).
  68. Haines-Young, R.; Potschin, M. Common International Classification of Ecosystem Services; Centre for Environmental Management, University of Nottingham: Nottingham, UK, 2012. [Google Scholar]
  69. Daniel, T.C.; Muhar, A.; Arnberger, A.; Aznar, O.; Boyd, J.W.; Chan, K.M.; Costanza, R.; Elmqvist, T.; Flint, C.G.; Gobster, P.H. Contributions of cultural services to the ecosystem services agenda. Proc. Natl. Acad. Sci. USA 2012, 109, 8812–8819. [Google Scholar] [CrossRef]
  70. Perry, B.; Ager, L.; Sitas, R. Cultural heritage entanglements: Festivals as integrative sites for sustainable urban development. Int. J. Herit. Stud. 2020, 26, 603–618. [Google Scholar] [CrossRef]
  71. Havinga, I.; Bogaart, P.W.; Hein, L.; Tuia, D. Defining and spatially modelling cultural ecosystem services using crowdsourced data. Ecosyst. Serv. 2020, 43, 101091. [Google Scholar] [CrossRef]
  72. Pan, J.; Ma, Y.; Cai, S.; Chen, Y.; Chen, Y. Distribution patterns of lake-wetland cultural ecosystem services in highland. Environ. Dev. 2022, 44, 100754. [Google Scholar] [CrossRef]
  73. Moran, P.A. Notes on continuous stochastic phenomena. Biometrika 1950, 37, 17–23. [Google Scholar] [CrossRef]
  74. Anselin, L. Local indicators of spatial association—LISA. Geogr. Anal. 1995, 27, 93–115. [Google Scholar] [CrossRef]
  75. Anselin, L.; Syabri, I.; Kho, Y. GeoDa: An introduction to spatial data analysis. In Handbook of Applied Spatial Analysis: Software Tools, Methods and Applications; Springer: Berlin/Heidelberg, Germany, 2009; pp. 73–89. [Google Scholar]
  76. Wartenberg, D. Multivariate spatial correlation: A method for exploratory geographical analysis. Geogr. Anal. 1985, 17, 263–283. [Google Scholar] [CrossRef]
  77. Lee, S.-I. Developing a bivariate spatial association measure: An integration of Pearson’s r and Moran’s I. J. Geogr. Syst. 2001, 3, 369–385. [Google Scholar] [CrossRef]
  78. Huan, X.; Zhang, J.; Zhuang, Y.; Fan, C.; Wang, N.; Ji, X.; Shao, K.; He, K.; Jin, J.; Zuo, X.; et al. Intensification of rice farming and its environmental consequences recorded in a Liangzhu reservoir, China. Quat. Int. 2022, 619, 39–45. [Google Scholar] [CrossRef]
  79. Chen, Y.; Zhou, J.; Qian, J. Comprehensive exploration of spatial planning in Zhejiang Province. Front. Urban Rural. Plan. 2023, 1, 4. [Google Scholar] [CrossRef]
  80. Zheng, L.; Rong, Y.; Guo, J.; Yan, Y.; Zhang, Y.; Zhao, Y.; Li, X.; Wang, R.; Zhang, J. Improving economic efficiency of traditional rice-fish symbiosis system for sustainable mountainous development: A case study of the world agricultural heritage in Qingtian, China. Ecol. Front. 2025, 45, 472–482. [Google Scholar] [CrossRef]
  81. Meng, C.; Chen, Y.; Yang, J.; Su, X.; Guo, W.; Zhang, K. Association between multilevel landscape characteristics and rural sustainability: A case study of the water-net region in the Yangtze River Delta, China. Ecol. Inform. 2024, 82, 102677. [Google Scholar] [CrossRef]
  82. Aneseyee, A.B.; Soromessa, T.; Elias, E.; Noszczyk, T.; Feyisa, G.L. Evaluation of Water Provision Ecosystem Services Associated with Land Use/Cover and Climate Variability in the Winike Watershed, Omo Gibe Basin of Ethiopia. Environ. Manag. 2022, 69, 367–383. [Google Scholar] [CrossRef] [PubMed]
  83. Fu, B.; Liu, Y.; Lü, Y.; He, C.; Zeng, Y.; Wu, B. Assessing the soil erosion control service of ecosystems change in the Loess Plateau of China. Ecol. Complex. 2011, 8, 284–293. [Google Scholar] [CrossRef]
  84. Tappeiner, U.; Leitinger, G.; Zariņa, A.; Bürgi, M. How to consider history in landscape ecology: Patterns, processes, and pathways. Landsc. Ecol. 2021, 36, 2317–2328. [Google Scholar] [CrossRef]
  85. Evans, G. Measure for Measure: Evaluating the Evidence of Culture’s Contribution to Regeneration. Urban Stud. 2005, 42, 959–983. [Google Scholar] [CrossRef]
  86. Plieninger, T.; Bieling, C.; Fagerholm, N.; Byg, A.; Hartel, T.; Hurley, P.; López-Santiago, C.A.; Nagabhatla, N.; Oteros-Rozas, E.; Raymond, C.M.; et al. The role of cultural ecosystem services in landscape management and planning. Curr. Opin. Environ. Sustain. 2015, 14, 28–33. [Google Scholar] [CrossRef]
  87. Kajihara, H.; Zhang, S.; You, W.; Min, Q. Concerns and Opportunities around Cultural Heritage in East Asian Globally Important Agricultural Heritage Systems (GIAHS). Sustainability 2018, 10, 1235. [Google Scholar] [CrossRef]
  88. Bai, Y.; Li, X.; Feng, Y.; Liu, M.; Chen, C. Preserving traditional systems: Identification of agricultural heritage areas based on agro-biodiversity. Plants People Planet 2024, 6, 670–682. [Google Scholar] [CrossRef]
  89. Dramstad, W.E.; Tsegaye, D.; Krøgli, S.O.; Pedersen, C.; Aune-Lundberg, L. Beyond provisioning: Unveiling ecosystem services of agricultural landscapes. Nor. Geogr. Tidsskr.-Nor. J. Geogr. 2025, 79, 101–107. [Google Scholar] [CrossRef]
Figure 1. Spatial diagnostic model of eco-cultural mismatch for agricultural heritage systems.
Agriculture 16 01199 g001
Figure 2. Location of the study area and spatial distribution of ZJ-IAHS samples in Zhejiang Province, China.
Agriculture 16 01199 g002
Figure 3. Analytical framework.
Agriculture 16 01199 g003
Figure 4. Mapping relationships among cultural ecosystem service classification systems, including cultural service types in the Millennium Ecosystem Assessment, corresponding items in CICES (V5.1), corresponding types in IPBES-NCP, and the CSI dimensions adopted in this study.
Agriculture 16 01199 g004
Figure 5. Distribution of ZJ-IAHS, China-NIAHS and GIAHS across prefecture-level cities in Zhejiang Province.
Agriculture 16 01199 g005
Figure 6. Spatial patterns of ZJ-IAHS in Zhejiang Province: (a) kernel density estimation (KDE) of ZJ-IAHS; (b) LISA cluster map of ZJ-IAHS.
Agriculture 16 01199 g006
Figure 7. Spatial patterns of ecosystem services related in Zhejiang Province: (a) WY; (b) HQ; (c) SR; (d) ESI.
Agriculture 16 01199 g007aAgriculture 16 01199 g007b
Figure 8. Kernel density estimation of cultural service proxies in Zhejiang: (a) CMKS; (b) HNSE; (c) AAE; (d) PCSE; (e) TEPL; (f) GPSC; (g) CSI.
Agriculture 16 01199 g008aAgriculture 16 01199 g008b
Figure 9. LISA cluster maps of (a) ESI, (b) CSI, and (c) the ESI-CSI relationship surface.
Agriculture 16 01199 g009
Figure 10. Global bivariate Moran’s I scatter plot and Bivariate LISA Cluster Map: (a) ZJ-IAHS and ESI; (b) ZJ-IAHS and CSI; (c) ZJ-IAHS and ESI–CSI spatial relation.
Agriculture 16 01199 g010
Table 1. Main data sources and types.
DatasetTypeResolutionYearSourceAnalytical Use
ZJ-IAHS sample dataText/Point2025http://nynct.zj.gov.cn/art/2024/1/16/art_1229235418_5250278.html (accessed on 26 January 2026)Representation of agricultural heritage objects
Administrative boundariesVector2025http://www.geodata.cn (accessed on January 2026)Spatial analysis and cartographic presentation
Terrain and river networkRaster/Vector2025http://www.resdc.cn (accessed on 26 January 2026)
DEMRaster30 m2025http://www.geodata.cn (accessed on 26 January 2026)
LULCRaster30 m2025http://www.resdc.cn (accessed on 26 January 2026)Ecological service assessment
Soil dataRaster1 km2025https://download.geofabrik.de/asia/china/zhejiang.html# (accessed on 26 January 2026)
Annual average rainfallRaster1 km2025http://www.geodata.cn (accessed on 26 January 2026)
POI data (cultural, educational, and tourism facilities)Point2025https://lbs.amap.com/ (accessed on 26 January 2026)Cultural service representation
Note: All datasets used in this study were obtained from publicly accessible official websites, open data platforms, or platform-based web services.
Table 2. Proxy indicators and interpretation criteria for the six CSI dimensions.
DimensionCorresponding POIs
CMKSMuseums, archives, and libraries
PCSEScience and technology museums, convention and exhibition facilities
AAEArt exhibition venues
HNSEWorld Heritage sites, red tourism sites, and memorial halls
TEPLTourist attractions, parks, squares, zoos, botanical gardens, and aquariums
GPSCCultural centers, cultural halls, and religious sites
Table 3. Statistical summary of ZJ-IAHS samples and distribution density by prefecture-level cities in Zhejiang.
CitySamples_NArea_km2DensityDensity_Grade
Jiaxing2142370.00496Very High
Zhoushan515200.00329High
Quzhou2988450.00328High
Taizhou2110,0720.00208Moderate
Huzhou1258200.00206Moderate
Ningbo1998160.00194Moderate
Jinhua2010,9420.00183Moderate
Lishui2717,2750.00156Low
Wenzhou1512,1030.00124Very Low
Shaoxing1082790.00121Very Low
Hangzhou1616,8500.00095Very Low
Table 4. ANN analysis results of ZJ-IAHS and China-NIAHS in Zhejiang.
Heritage Level Size OMDEMDANNz-Score p-Value SP
ZJ-IAHS20512,027.85 14,303.75 0.840888−4.3475880.000014Clustered
China-NIAHS1759,033.83 39,075.64 1.5107583.3848290.000712Dispersed
OMD: Observed Mean Distance (Meters); EMD: Expected Mean Distance (Meters); SP: Spatial Pattern.
Table 5. Results of the global Moran’s I analysis.
Service TypeMoran’s Iz-Score p-Value
ESI0.35783135.5164310.000000
CSI0.93192892.5738670.000000
ESI-CSI0.48181847.8525790.000000
Disclaimer/Publisher’s Note: The statements, opinions and data contained in all publications are solely those of the individual author(s) and contributor(s) and not of MDPI and/or the editor(s). MDPI and/or the editor(s) disclaim responsibility for any injury to people or property resulting from any ideas, methods, instructions or products referred to in the content.