1. Introduction
Unlike general market participants in grain circulation, state-owned grain enterprises (SOGEs) in China engage in market-oriented purchasing and selling. However, they also shoulder critical responsibilities for safeguarding national food security, stabilizing market prices, and regulating supply and demand. As grain circulation system reforms deepen, the share of SOGEs in the procurement market and wholesale markets has steadily grown [
1]. Their behaviors now exert an increasingly strong influence on grain market price formation. International grain price volatility, domestic supply–demand swings, weak market expectations, and intensified policy interventions create a sensitive market environment for SOGEs. This makes a systematic examination of their market effects imperative. FAO monitoring data show that international corn and wheat prices in 2023 saw their largest decade decline, a downward trend that persisted into 2024. Due to international price fluctuations and changes in domestic supply and demand, domestic grain price instability has increased. In response to downward pressure on grain prices, the state expanded policy-oriented procurement and storage. This has further strengthened the influence of SOGEs’ purchasing and selling behaviors on grain market dynamics and price formation.
Existing research has examined the relationship between policy-oriented grain procurement and sales and grain price volatility, but the findings are inconclusive. At the international level, government interventions in Ethiopia failed to stabilize prices. Instead, these actions widened the gap between domestic and international wheat prices [
2]. In another study focusing on Indian wheat, price support policies were found to raise grain prices and undermine market stability [
3]. Prajisha P., using data from 1994 to 2023, analyzed India’s minimum support price, government procurement, buffer stocks, and grain prices. The findings showed that the minimum support price significantly increased grain inflation both in the short and long term. However, procurement and buffer stock policies helped curb grain inflation [
4]. Domestically, studies show that China’s grain price support policies contributed to stabilizing grain prices. These policies, however, led to issues such as inventory accumulation, domestic–international price inversions, and excessive grain import pressures [
5,
6]. Another study examined the latest corn storage and pricing system reforms. It was found that while reforms lowered average domestic corn prices, they significantly increased price volatility. This suggests that policy adjustments themselves can become a source of price instability [
7]. Tan et al. (2024) [
8] further demonstrate that China’s grain price support policies raised market prices. At the same time, these policies weakened the decisive role of market mechanisms and hindered the signaling function of market prices. Most existing studies treat policy-related procurement and sales as institutional variables or exogenous shocks, focusing on the macro-level relationship between support policies and grain price volatility [
9,
10]. However, the fundamental reason these policies affect grain price volatility is that the purchasing and selling behaviors of SOGEs alter the supply and demand structure. Therefore, it is necessary to incorporate the actual operational processes of policy-driven procurement and sales into the analytical framework. This approach can more accurately identify their specific impact pathways and effects on price volatility.
Among the limited number of studies focusing on the purchasing and selling behaviors of SOGEs, existing findings remain inconclusive. Ref. [
11] pointed out that SOGEs’ purchasing and selling activities help to regulate supply and demand and reduce price volatility. By contrast, Ref. [
12] argued that excessive government intervention may amplify market fluctuations or squeeze out private market participants. Existing literature has utilized time-series data and financial methods to identify a correlation between SOGEs and grain market price volatility [
13]. Ref. [
14] also examined SOGEs’ purchasing and selling behaviors in relation to price volatility in different grain markets. However, the strength and direction of these relationships remain unclear. It is generally believed that SOGEs can influence market stability due to their substantial control over grain sources. This mechanism, though, lacks empirical support and testing [
1]. Other mechanisms also remain unexplored. SOGEs encounter different market participants and operate under varying supply–demand environments in the purchasing and selling phases, so their price-influencing mechanisms may differ.
In summary, the existing literature exhibits several research gaps that warrant further investigation. First, most studies treat the grain market as a homogeneous entity and fail to distinguish the potentially differentiated impact mechanisms of SOGEs in the purchase market versus the wholesale market. Second, although policy effects are transmitted through the specific purchasing and selling behaviors of SOGEs, few studies have incorporated these enterprises as independent behavioral agents into their analytical frameworks. Third, there is a lack of systematic empirical evidence regarding the channels through which SOGEs influence price volatility, leaving the underlying mechanisms insufficiently identified. This paper focuses on SOGEs’ purchasing and selling behaviors to answer two key questions: (1) How do these behaviors influence price volatility in the grain procurement market and wholesale markets, and are the effects consistent? (2) Through which mechanisms do these behaviors affect price volatility in different market environments? By addressing these questions, this paper aims to clarify the boundaries of policy-oriented purchasing and selling in grain price formation and to provide empirical evidence for improving the grain price determination mechanism.
The potential contributions of this paper are threefold. First, from the perspective of policy implementers, it systematically examines the impact of SOGEs’ purchasing and selling behaviors on grain price volatility. This enriches research on grain market intervention mechanisms. Second, by distinguishing between policy-oriented purchasing and selling behaviors, the paper reveals the differential impacts of different stages of policy operations on price volatility, providing empirical evidence for understanding the dynamic effects of government intervention. Third, by revealing how the pro-cyclical characteristics of SOGEs’ purchasing behavior and counter-cyclical characteristics of their selling behaviors shape grain price volatility, this study offers valuable insights for optimizing grain regulation policies and enhancing the regulatory efficiency of SOGEs.
The structure of this paper is organized as follows.
Section 2 presents the theoretical analysis and research hypotheses.
Section 3 describes the research design.
Section 4 reports the empirical results and analysis.
Section 5 conducts mechanism tests.
Section 6 performs heterogeneity analysis.
Section 7 concludes the study and discusses the policy implications.
Section 8 presents a discussion of the limitations of this study.
2. Theoretical Analysis and Research Hypotheses
2.1. Purchasing and Selling Behaviors of SOGEs and Grain Price Volatility
In the grain procurement market, SOGEs aim to safeguard farmers’ incentives for grain production. When market prices fall below certain thresholds, SOGEs enter the market to purchase grain at support prices above the market level; this policy-induced intervention increases grain price volatility. During periods of concentrated grain supply, short-term supply elasticity is limited. As a result, grain prices become sensitive to changes in demand. When SOGEs engage in large-scale purchases during the peak harvest season, the concentrated purchasing efforts create a strong demand shock over time, thereby amplifying price reactions to short-term operational changes [
15]. With market-oriented reforms, the market participants in grain procurement have diversified. Other grain enterprises typically accelerate their follow-up purchasing. This further consolidates grain demand within a short period, making prices more prone to short-term fluctuations.
In the grain wholesale market, the main policy goal of SOGEs is to ensure market supply and stabilize prices. Their selling behavior exhibits distinct counter-cyclical characteristics. When grain prices are high, SOGEs increase their releases. When prices weaken, they scale back releases moderately [
13]. By easing supply–demand tensions, this behavior curbs sharp price fluctuations during times of high or volatile prices. On the demand side, downstream grain processing enterprises and traders dominate the market. There is a diverse range of market participants and high demand elasticity. This means inventory releases can spread market pressure over time and buffer price volatility in the wholesale market. In summary, H1 is proposed as follows:
Hypothesis 1 (H1). The pro-cyclical purchasing behavior of SOGEs during periods of concentrated market supply amplifies demand shocks and intensifies price volatility in the purchase market. In contrast, their counter-cyclical selling operations, implemented through reserve regulation, help mitigate price volatility in the wholesale market.
2.2. Market Structure and Market Power
According to the theory of monopsony power [
16], when a single buyer or a small number of buyers exist in a market, the buyer can influence prices by adjusting the quantity purchased. In the grain procurement market, grain producers are numerous and fragmented in terms of supply, and the market as a whole is characterized by high competition coupled with weak individual bargaining power [
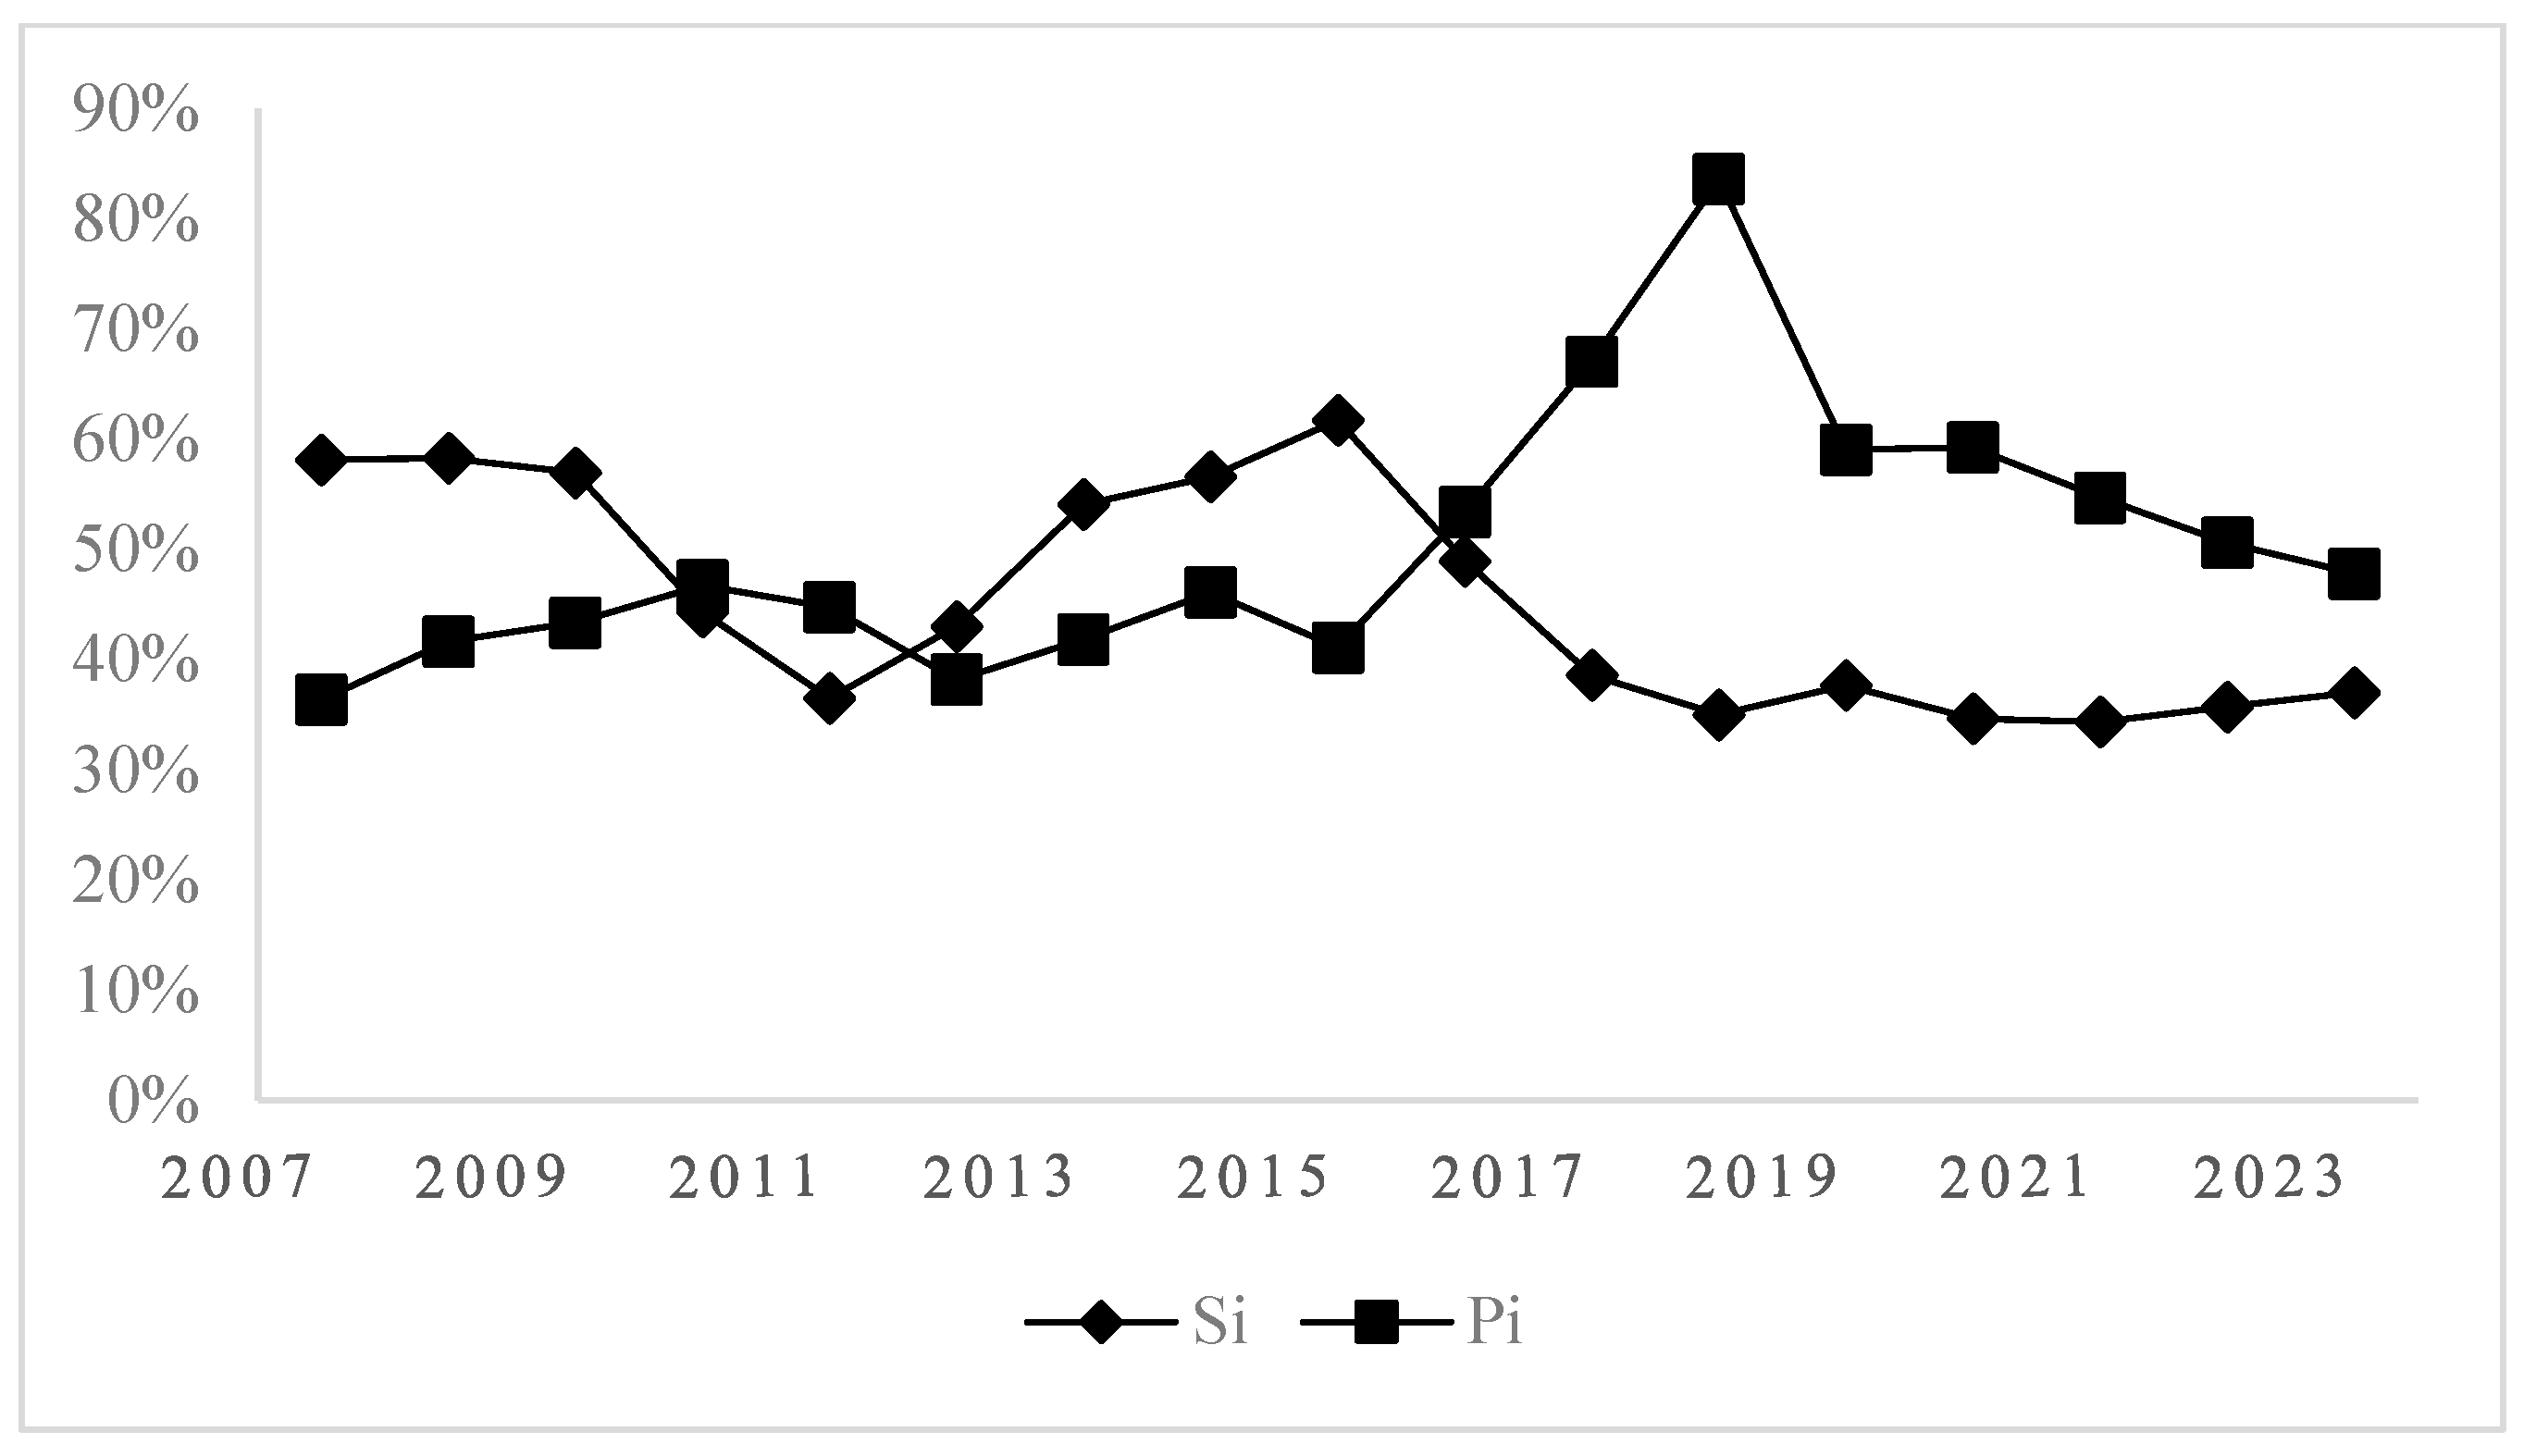
17]. Leveraging their strong capacity for grain source organization, financial advantages, and policy support, SOGEs have long maintained a purchase market share (Si) exceeding 50%. Although it has declined in recent years, it remains stable at around one-third (see
Figure 1). As the dominant buyer in the purchase market during the harvest season, SOGEs directly drive market price increases far beyond the level justified by contemporaneous supply and demand fundamentals, thereby amplifying price volatility. The procurement pace set by dominant buyers directly determines the intensity of demand during the procurement season. However, policy implementation directives and non-continuous policy-oriented procurement arrangements can exacerbate supply–demand imbalances and increase price volatility. In regions with well-developed infrastructure and smooth cross-regional logistics, such signal effects and competitive responses can spread rapidly across regions [
18], further reinforcing the interconnectivity of price volatility [
19].
Market power theory suggests that agents with sizeable organizational and scale advantages can influence price formation and price volatility in markets with asymmetric resources, channels, or information [
20,
21]. In the grain wholesale market, by virtue of their storage scale and cross-regional dispatch capacity, SOGEs help stabilize the orderly operation of the grain market through regulating the pace of inventory releases and smoothing market supply. Specifically, SOGEs account for more than half of the total market share (Pi) in wholesale markets (see
Figure 1). As major suppliers, SOGEs can dominate the timing and scale of inventory flows. This enables them to counteract seasonal supply–demand imbalances, reduce price deviations from equilibrium, and curb excessive price volatility. Through their cross-regional transportation abilities, SOGEs break down circulation barriers between major and non-major production areas, thereby eliminating price volatility caused by regional supply–demand imbalances. In regions with well-developed infrastructure, by further reducing inter-regional transaction costs and enhancing trade [
22], SOGEs promote price convergence across regions [
23]. Based on the above analysis, H2 is proposed as follows:
Hypothesis 2 (H2). In the grain purchase market, SOGEs amplify price volatility through pronounced demand shocks by leveraging their capacity for grain source organization and financial advantages. In the wholesale market, they stabilize price fluctuations by utilizing their inventory regulation capabilities and cross-regional distribution advantages.
2.3. Policy Signals and Market Expectations
Grain prices depend not only on current supply and demand, but also on market participants’ expectations regarding future price trends [
24]. Farmers, traders, and processing companies base their plans for selling, buying, and storing grain on these price expectations, which are influenced by policy signals and others’ actions. SOGEs play a key policy role, so their buying and selling send strong market signals that help shape expectations.
In the grain procurement market, SOGEs’ purchasing behavior primarily influences farmers’ assessments of market trends and future returns, which in turn affects their timing of grain sales and long-term supply arrangements. The price floor signals conveyed by SOGEs’ policy-oriented grain procurement, together with clearly specified policy implementation periods, tend to induce farmers to concentrate their grain sales within the same time window. The concentrated purchasing by SOGEs further adds to this effect. As a result, there is a rigid clash between short-term supply and demand, which increases short-term price volatility. At the same time, policy-based purchases effectively raise farmers’ expected returns from grain production. When farmers anticipate higher returns from future grain production, their willingness to expand production scale strengthens, driving continuous improvements in the scale of farmland operation. For large-scale grain farmers, factors such as storage management constraints and liquidity pressures often compel them to sell their grain within a relatively short period after harvest [
25]. This further intensifies the temporal concentration of supply and amplifies price volatility.
In the grain wholesale market, the pace and scale of SOGEs’ sales also affect how downstream processing enterprises and traders assess future supply. Their inventory decisions and raw grain procurement strategies reflect these assessments. Policy signals from SOGEs, released through their reserve sales and trading arrangements, help form stable supply expectations. This reduces defensive or panic-driven inventory shifts from uncertainty, narrowing price volatility. In light of this, H3 is proposed as follows:
Hypothesis 3 (H3). The purchasing and selling behaviors of SOGEs influence grain price volatility by affecting market participants’ expectations about future supply and price trends. In the grain procurement market, SOGEs intensify procurement price volatility by affecting the timing of farmers’ grain sales. In the grain wholesale market, SOGEs mitigate price volatility by guiding the inventory strategies of downstream processing enterprises and traders.
2.4. Strategic Responses of Private Grain Enterprises
Research suggests that SOGEs possess competitive advantages in resource access and market position [
26]. In contrast, private enterprises exhibit more rational investment decision-making behaviors [
27]. In the grain market, SOGEs benefit from policy implementation functions, scale advantages, and information advantages. These factors often put them in a “pioneering” position in grain purchasing and selling decisions, and their price levels and operational rhythms convey strong market signals. In practice, private grain enterprises typically use the purchasing and selling behaviors of SOGEs as an important reference. This helps them avoid disadvantages in grain sourcing or inventory value. As a result, a sequential and amplifying behavioral interaction mechanism appears in the grain market.
In the grain procurement market, when SOGEs accelerate their purchasing pace or raise purchase prices, these actions signal demand expansion and price floor support to the market. This study expects that, to avoid being marginalized in the competition for grain sources, private grain enterprises tend to accelerate their market entry for procurement or raise their bid prices. This drives the concentrated release of demand over time. Given the difficulty of adjusting grain supply in the short term, this “follow-on” purchasing behavior is likely to prompt farmers to sell their grain earlier or in a more concentrated manner. Consequently, it amplifies short-term price volatility during the purchasing phase. For example, during the late rice procurement period in Jiangxi Province in 2010, the government’s increase in the minimum purchase price and rising early-season rice prices influenced market dynamics. Enterprises entered the market early and actively procured rice; some private enterprises even rushed to purchase rice directly from the fields. The enterprises’ bullish market sentiment drove up rice prices.
In the grain wholesale market, private grain enterprises primarily act as buyers of raw grain. When SOGEs increase inventory releases or accelerate sales pace, these actions signal supply expansion and lower price expectations [
28]. This study expects that, in response to expected price declines and relatively ample future supply, private grain enterprises seek to control costs and manage inventory risk. They often delay purchases, reduce periodic purchases, or adjust their purchasing pace. These actions cause a short-term contraction in effective demand, smoothing fluctuations in market demand. As a result, prices may rapidly reach a new equilibrium with lower trading volumes, and short-term price volatility decreases. Thus, H4 is proposed:
Hypothesis 4 (H4). In the procurement market, synchronized purchasing by private enterprises concentrates demand shocks over time, amplifying short-term price volatility. In the wholesale market, private enterprises act as demand-side participants. They adjust procurement and inventory timing based on the release pace of SOGEs, which reduces short-term price volatility.
3. Research Design
3.1. Sample Selection and Data Sources
This paper uses provincial-level monthly panel data to empirically analyze the relationship between SOGEs’ purchasing and selling behaviors and grain price volatility. Data on grain procurement and sales volumes of SOGEs are sourced from the “Authoritative Column” of China Grain Economy, a monthly publication. This source systematically reports the procurement and sales activities of SOGEs across different regions; these data are characterized by high authority and continuity. Corn procurement and wholesale prices are compiled from the wind, EPS, and Bric databases. Cross-verification and missing value checks are performed to ensure data consistency and reliability.
Qinghai, Ningxia, Hainan, and Tibet are excluded due to substantial missing data and their status as grain production–consumption balance regions, where their overall impact on national grain market price volatility is relatively limited. The final sample includes the remaining provinces of China from January 2013 to December 2023, forming a provincial-level monthly panel dataset. For individual missing indicators, linear interpolation is used, yielding 3564 observations.
This study selects corn as the research subject due to its representativeness in China’s grain market. The rationale is fourfold. (1) Corn is a staple grain in China, with large cultivation areas spanning Northeast China, North China, the Huang-Huai-Hai region, and Southwest China. There are major differences in production and distribution across provinces. This enables the identification of SOGEs’ impacts on price volatility at the provincial level. (2) Corn achieved market-oriented pricing before rice and wheat. Policy interventions like minimum procurement prices are limited. Therefore, market prices are driven mainly by supply and demand. This allows for a more accurate assessment of SOGEs’ impacts on price volatility, avoiding confounding effects from rigid policy pricing. (3) The corn industry chain is long, with multiple end-uses including animal feed, deep processing, and industrial raw materials. Wholesale market transactions are active, and price formation mechanisms are well developed. This facilitates the analysis of how inventory, cross-regional circulation, and shifting expectations affect price volatility. These factors align with this study’s focus on procurement and sales rhythms, market power, and expectation transmission. (4) Although corn, rice, and wheat share some substitution and linkage, corn’s demand is more elastic in the feed and industrial sectors. Its price responds more to shifts in supply, demand, and market participant behavior. Thus, corn is better suited for analyzing SOGEs’ influence on price volatility.
3.2. Model Specification and Variable Description
This study adopts the approach of [
29] to specify econometric models: Equation (1) tests SOGEs’ purchasing behavior on procurement price volatility, while Equation (2) examines their selling behavior on wholesale price volatility. We conducted the empirical analysis using Stata 17.0.
In the above equations, i, t and m represent province, year, and month, respectively. and represent grain procurement and wholesale price volatility, for province i in year t and month m. and denote the contemporaneous grain procurement and sales volume of SOGEs. is a set of control variables affecting grain price volatility. , and represent individual fixed effects, month fixed effects, and the stochastic error term. The detailed variable definitions are given below.
3.2.1. Dependent Variables
Grain price volatility exhibits both long-term trends and short-term fluctuations [
30]. Simple price change rates, such as month-on-month growth rates, cannot distinguish between trends and cycles. In contrast, the Hodrick–Prescott (HP) filter can decompose a price series into a long-term trend component and a short-term cyclical fluctuation component, thereby helping to identify the fundamental movements of grain markets. Compared with the Baxter–King (BK) filter, the HP filter does not require data trimming at either end of the sample period, which preserves complete sample information. The HP filter has been widely applied in research on grain price volatility. Accordingly, this paper uses the Hodrick–Prescott (HP) filter to measure corn procurement price volatility (PP) and wholesale price volatility (WP) [
31], as shown in Equation (3). In this model,
represents the observed price,
represents the trend component, and λ is the penalty factor. Regarding the selection of the smoothing parameter λ, Hodrick and Prescott proposed that λ should be determined according to the periodicity of the data [
30], recommending λ = 100 for annual data, λ = 1600 for quarterly data, and λ = 14,400 for monthly data. This parameterization has become the mainstream specification adopted by most empirical studies. With monthly data, λ is set to 14,400 by common practice. By decomposing the data into the trend term
and the volatility term
, the corn price volatility is calculated as HP =
/
. The absolute value of the volatility term measures procurement price volatility and wholesale price volatility.
3.2.2. Explanatory Variables
The grain procurement and sales volume statistics for SOGEs represent total grain procurement and sales conditions across all grain varieties in each region. Directly using these data to analyze their impact on corn prices would lead to biased regression results. Due to data availability constraints, monthly crop-specific purchase and sales data for SOGEs are not directly reported in any statistical yearbook. The only available crop-specific data are the annual provincial-level purchase and sales volumes reported in the China Grain and Material Reserves Yearbook. Therefore, a structural decomposition method is employed to obtain monthly corn purchase and sales volumes for SOGEs. The specific steps are as follows: (1) For province i in year t, the share of corn purchases in total annual grain purchases by SOGEs is calculated, as is the share of corn sales in total annual grain sales; (2) these annual shares are then multiplied by the corresponding monthly total grain purchases and total grain sales of SOGEs, respectively, to obtain estimated monthly corn purchase and sales volumes. The core explanatory variables in this study are the corn procurement and corn sales volumes of SOGEs from January 2013 to December 2023. Both variables are transformed by adding 1 and taking the natural logarithm.
Due to data limitations, this study employs the annual share method to disaggregate monthly purchase and sales data. Although this approach cannot precisely capture the true monthly levels of corn purchases and sales, it is justified on both theoretical and practical grounds, as elaborated in the following three aspects.
First, this method reasonably preserves the seasonal patterns of corn purchasing and selling behavior. In China, the peak harvest and marketing season for corn typically occurs from September to November. The monthly aggregate grain purchase and sales volumes capture this seasonal variation to a certain extent. Multiplying the aggregate volumes by the province-year-specific corn share, while unable to exactly reproduce month-to-month changes in corn purchases and sales, still preserves the seasonal characteristics of corn marketing activities.
Second, the decomposition ratios are calculated at the province-year level, which retains cross-provincial and interannual differences in the structure of corn purchases and sales. This avoids the larger bias that would result from imposing a single uniform ratio across all regions and years.
Third, if the GP and GW variables constructed using this method contain random measurement error, the estimated coefficients would typically be subject to attenuation bias. Despite this, this study still observes significant economic effects, indicating that the true effects may be even stronger than the estimates obtained. Therefore, the empirical results presented here are conservative rather than spurious.
3.2.3. Control Variables
Based on existing studies, this study chooses control variables that influence corn price volatility from supply, demand, market conditions, and international perspectives. ① On the supply side, these include corn yield changes (cf) (cf = (
—
)/
, where
represents corn yield in year t, and
represents the five-year moving average of corn yield), total production cost (cost), planted area (area), and climate risk index (cpri). ② Following previous research, feed grain consumption (cv) and household consumption structure in each province (cs) are included as demand-side factors affecting prices [
32,
33]. ③ For the market, the control variables are freight volume (traffic), informatization level (internet), railway network density (rail), information infrastructure (inf), and the development level of the national market (market) [
34]. ④ For international factors, grain import volume (import) is chosen. It should be noted that grain import data for Inner Mongolia from 2013 to 2023 are unavailable, resulting in the automatic exclusion of 132 observations for this province after all control variables were included. Consequently, the actual sample size for the regression analysis is 3432 observations, and all regression tables report data based on this sample. The definitions and descriptive statistics of the main variables are presented in
Table 1.
4. Empirical Analysis
4.1. Benchmark Regression Analysis
Table 2 reports the baseline regression results of the impact of SOGEs’ procurement and sales volumes on grain market price volatility. All regressions control for time and individual fixed effects.
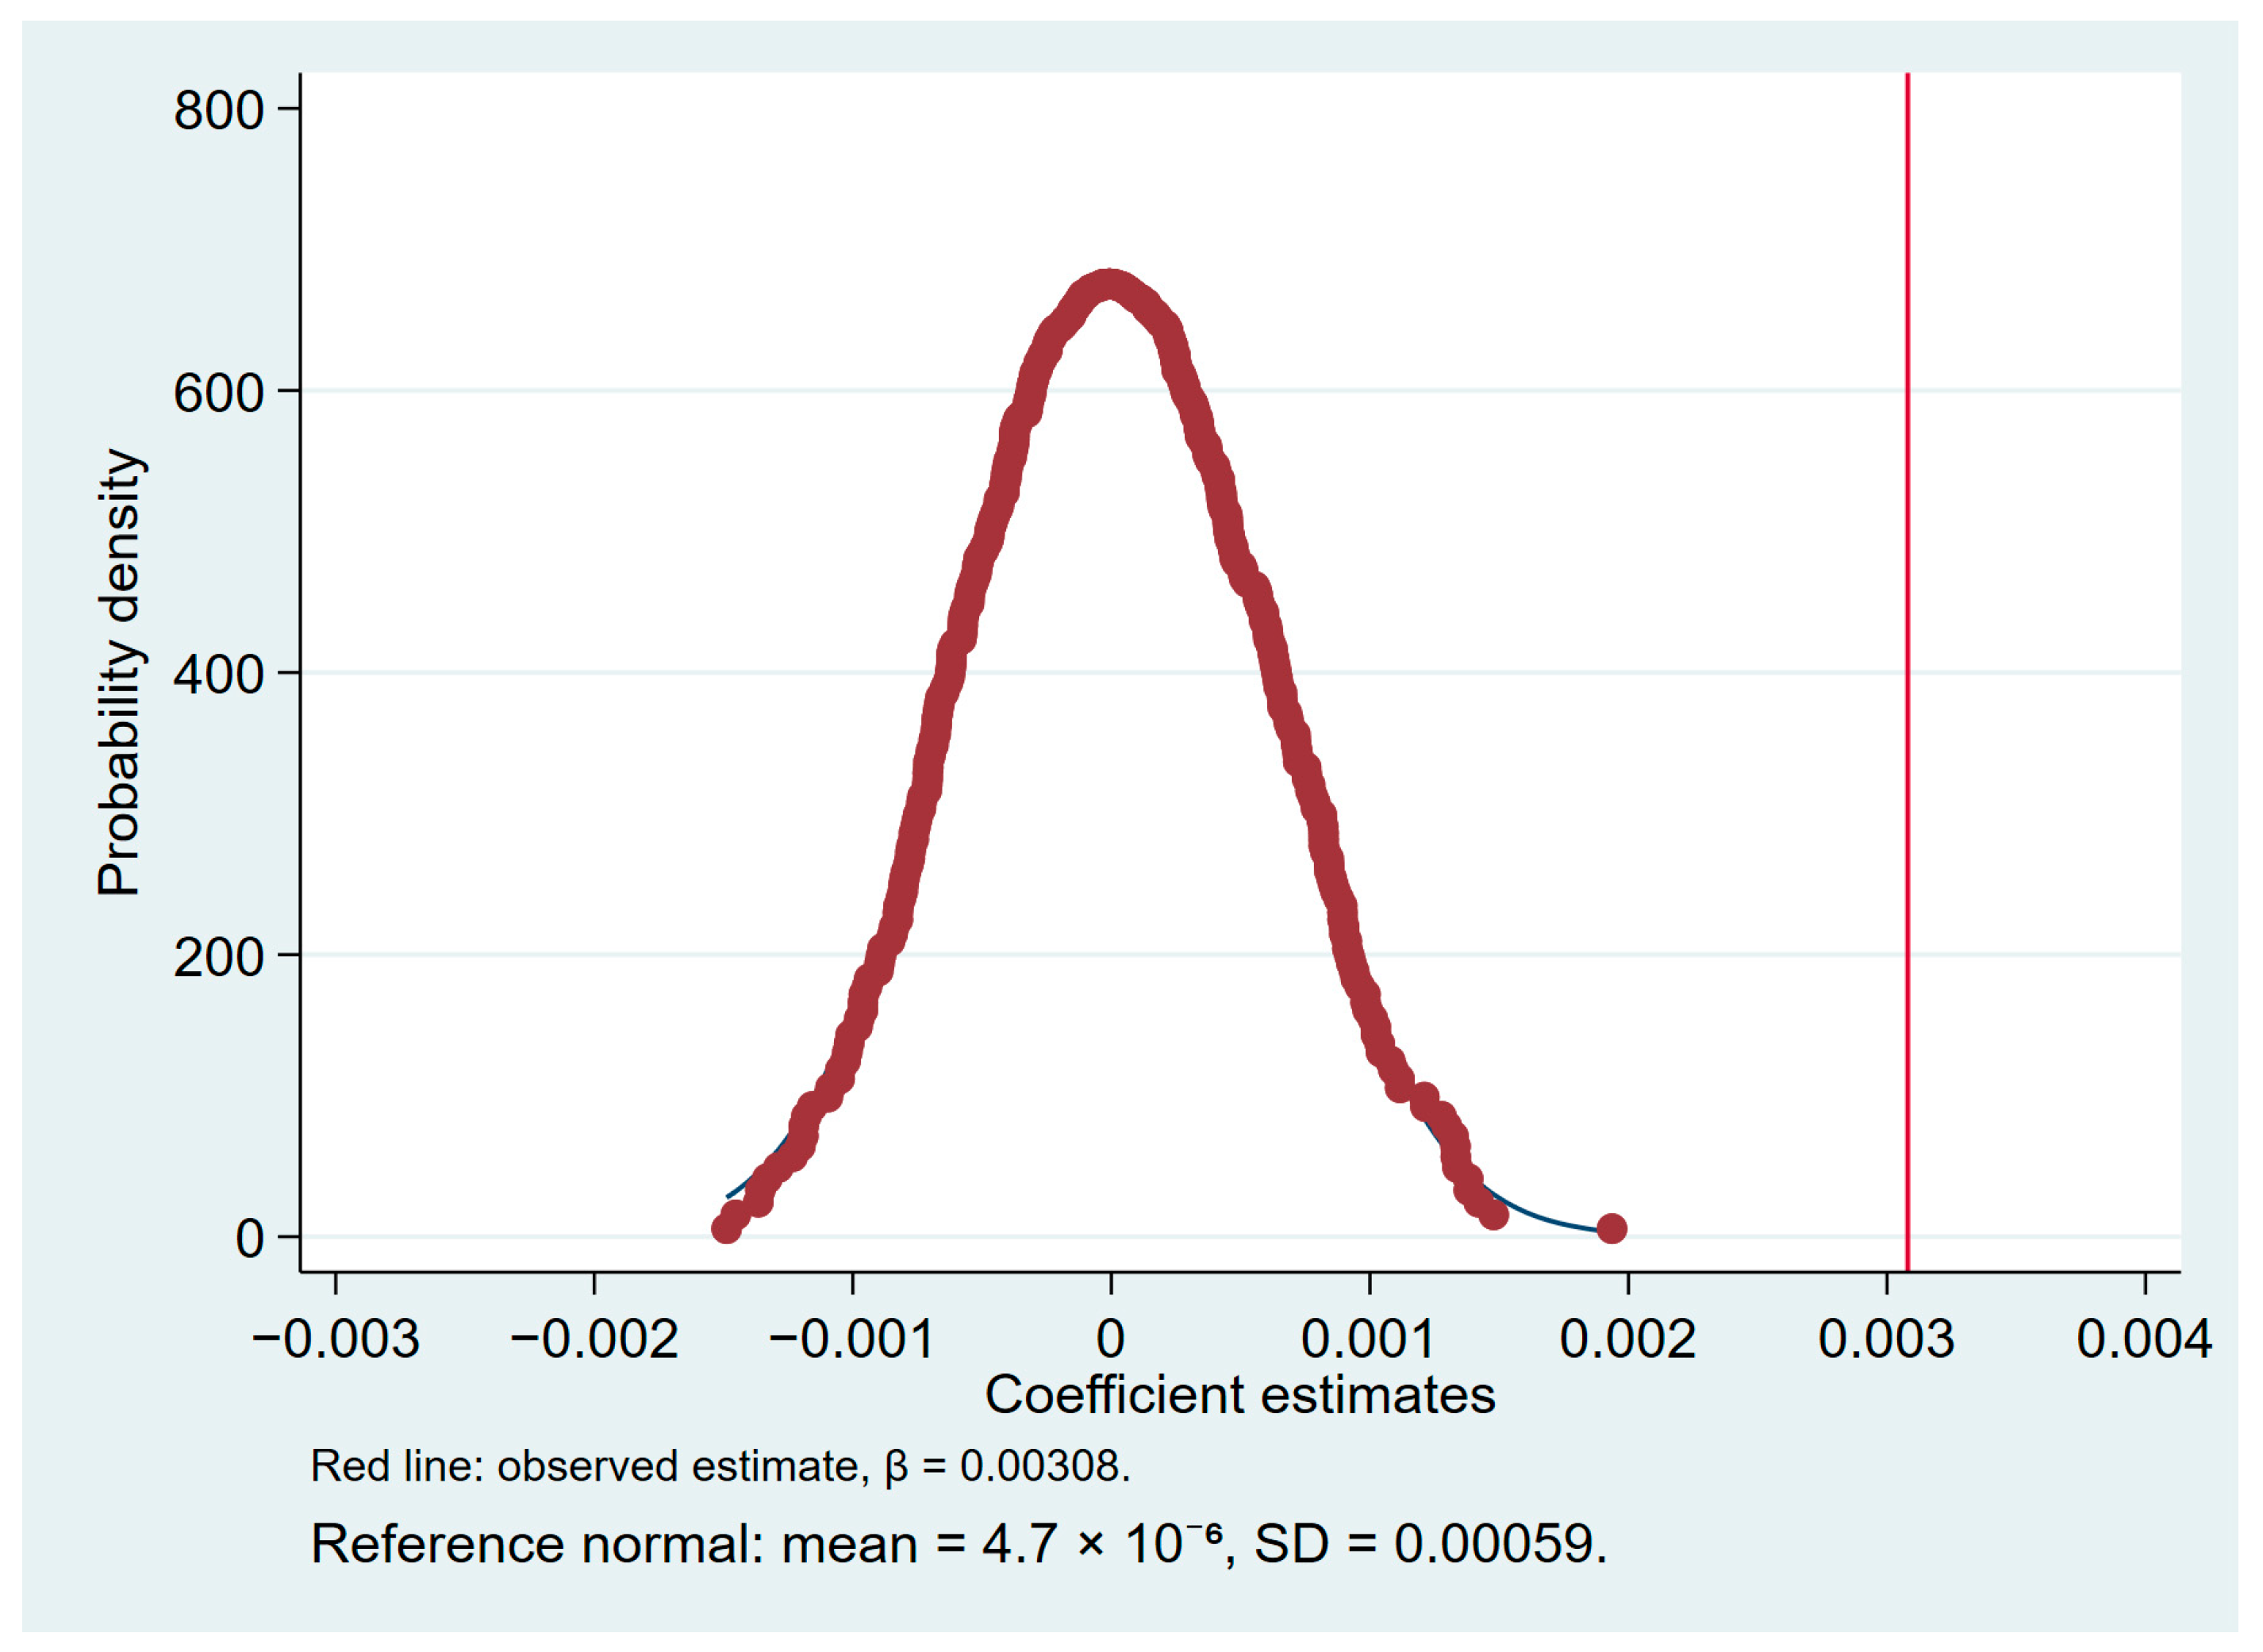
Columns (1) and (2) show the effects of procurement volume on procurement price volatility. In Column (1), with some control variables, the coefficient of gp is positive and significant at the 5% level. With all control variables in Column (2), the coefficient remains positive and becomes significant at the 1% level. This shows that higher procurement volume is consistently associated with greater procurement price volatility. The estimated coefficient for the grain procurement market is 0.00308, implying that a 1% increase in the volume of maize procured by SOGEs raises the absolute level of procurement price volatility by 0.0000308. Relative to the sample mean of procurement price volatility, which is 0.0464, this marginal change corresponds to 0.066% ((0.0000308/0.0464) × 100% = 0.066%). To more intuitively illustrate the actual impact of grain procurement on price volatility, this study uses market data from January to February 2023. In January 2023, the national maize procurement volume of SOGEs was 5.76 billion kg, which increased to 8.50 billion kg in February. Taking the January procurement volume as the baseline, the semi-log model estimates indicate that this procurement expansion increased procurement price volatility by 2.58% ([0.00308 × ln(8.50/5.76)/0.0464] × 100% = 2.58%).
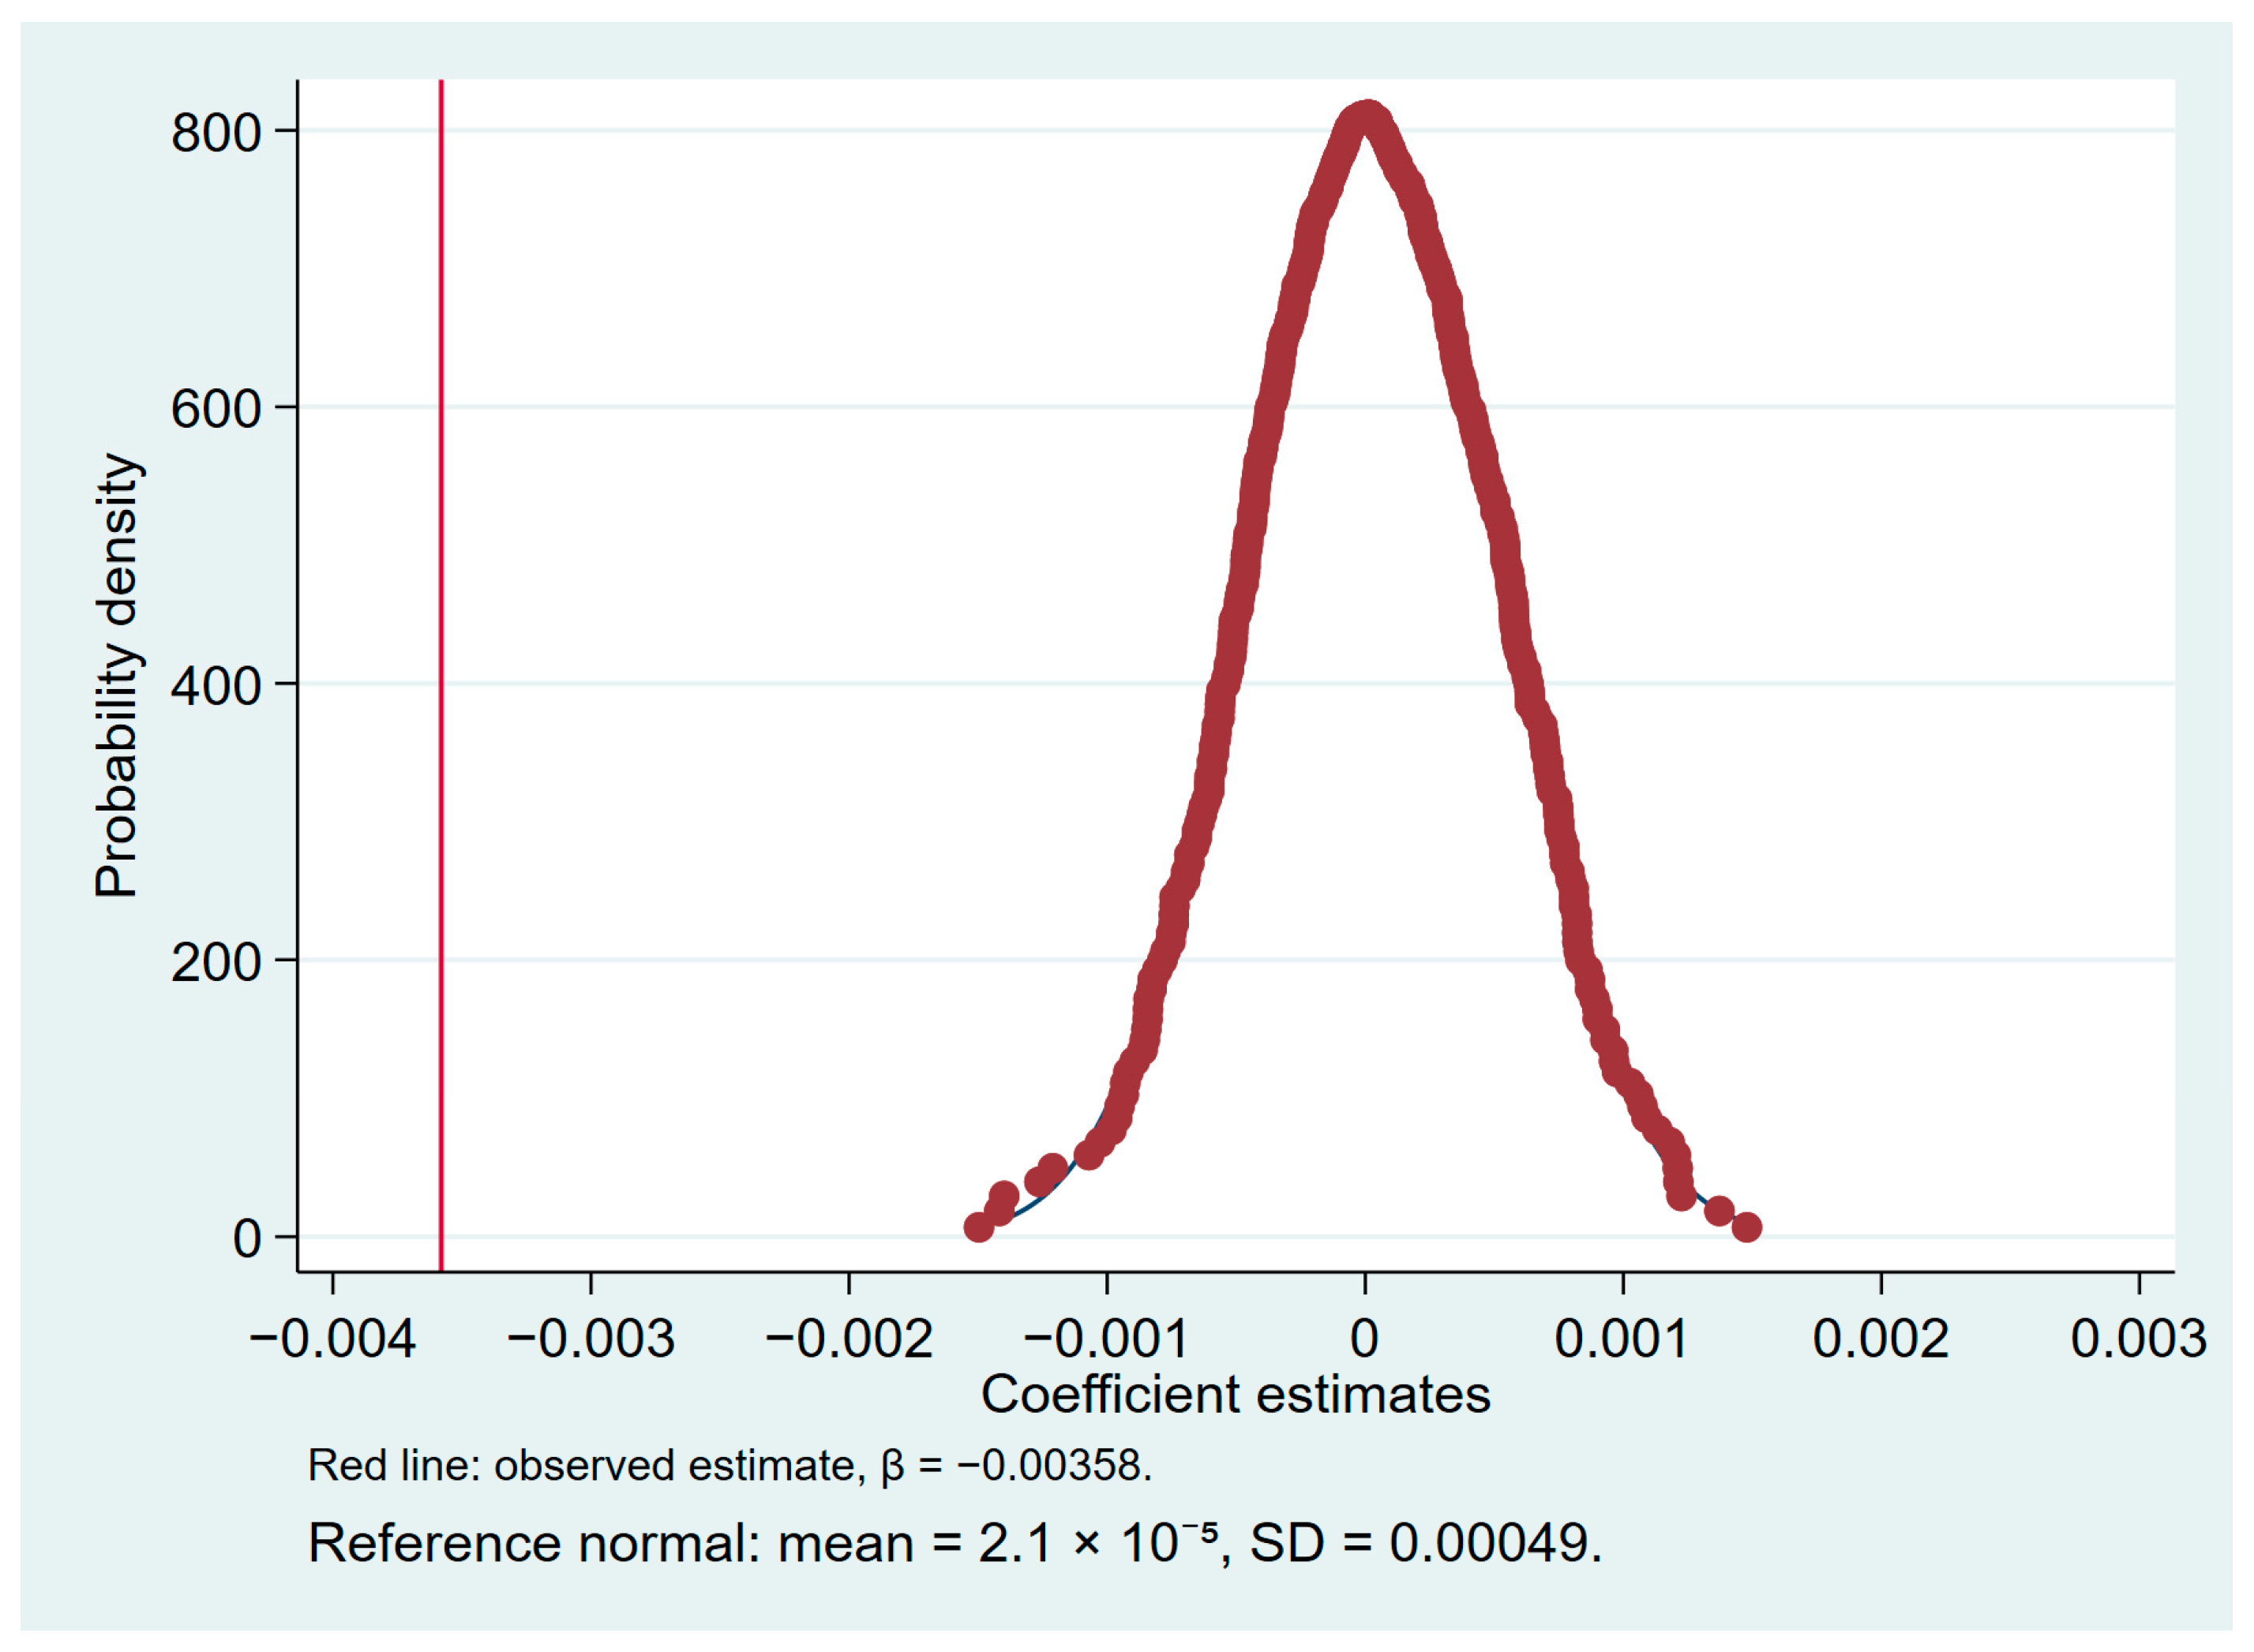
Columns (3) and (4) show the effects of sales volume on wholesale price volatility. With some control variables, Column (3) shows that the coefficient for gw is −0.00206, significant at the 10% level. With all control variables, the coefficient remains negative and significant. This suggests that grain sales volume reduces wholesale price volatility. The estimated coefficient for the grain wholesale market is −0.00358, implying that a 1% increase in the volume of maize sold by SOGEs reduces the absolute level of wholesale price volatility by 0.0000358. Relative to the sample mean of WP (0.0432), this reduction corresponds to 0.083% ((0.0000358/0.0432) × 100% = 0.083%). To further illustrate the cumulative effect using actual market data from January to February 2023, the maize sales volume of SOGEs was 6.91 billion kg in January 2023 and increased to 8.97 billion kg in February. Taking the January sales volume as the baseline, the semi-log model estimates indicate that this sales expansion reduced wholesale price volatility by 2.16% relative to its sample mean ([−0.00358 × ln(8.97/6.91)/0.0432] × 100% = −2.16%).
The above results validate H1. Specifically, SOGEs’ purchasing activity increases price volatility, while their selling moderates it. In terms of economic significance, the marginal effects are relatively limited, whereas the cumulative effects are of practical relevance in actual operations. Though these effects seem opposing, they in fact reflect the fundamental differences in policy objectives and constraints faced by SOGEs across markets. During grain procurement, supply is concentrated post-harvest, supply elasticity is limited, and procurement timing often induces short-term price shocks. Conversely, in the wholesale market, inventory releases exhibit distinct countercyclical properties, helping to smooth certain short-term fluctuations.
4.2. Robustness Checks
To verify the reliability of the results, this study conducts robustness checks from various perspectives, all of which yield findings consistent with the baseline regression results.
4.2.1. Exclusion of Endpoint Samples
When measuring grain price volatility, the HP filter suffers from a notable endpoint bias problem, which may lead to biased estimation of the volatility component at the end of the sample period. Therefore, this study removes the data most affected by endpoint bias, namely the 12 months of 2023, and re-estimates models (1) and (2) accordingly. Columns (1) and (5) of
Table 3 show that after excluding the full year of 2023, the impact of SOGEs’ purchasing and selling behaviors on grain price volatility remains significant, with the direction of effects consistent with the baseline regression.
4.2.2. Exclusion of Peak Harvest Months
The peak corn harvest months of September to November are excluded to test whether the results are driven by decomposition errors during the high-seasonality period. The results show that after removing September to November of each year, the impact of SOGEs on grain price volatility remains qualitatively unchanged in both the grain purchase market and the wholesale market, further confirming the robustness of the baseline regression results.
4.2.3. Lagged Explanatory Variables by One Period
Considering the inherent time lags in information transmission, physical turnover, and market expectation adjustments, the impact of SOGEs’ purchasing and selling behaviors on grain market prices may not be instantaneous but rather exhibit a degree of intertemporal persistence. Therefore, this study lags the core explanatory variables gp and gw by one period and re-estimates models (1) and (2) to test the robustness of the baseline findings. It should be noted that this test is not intended to reject the validity of the contemporaneous model, but rather to examine whether the effects of SOGEs’ purchasing and selling behaviors persist into the subsequent period, thereby providing additional empirical evidence for the baseline findings. Columns (3) and (7) of
Table 3 show that after lagging the explanatory variables by one period, procurement behavior still amplifies procurement price volatility, while sales behavior reduces wholesale price volatility. Both effects are significant, confirming the robustness of the baseline results. This indicates that the impact of SOGEs’ purchasing and selling behaviors on price volatility exhibits intertemporal persistence, confirming the robustness of the baseline regression results.
4.2.4. Change in Time Period
Due to the market-oriented procurement and storage reform in 2016, this study excludes data from 2013 to 2016. The model is re-examined using samples from 2017 to 2023. Columns (4) and (8) in
Table 3 show that the coefficients for gp and gw are 0.0072 and −0.0105, both statistically at the 1% level. These results are consistent with the main findings of this study.
4.3. Endogeneity Discussion
To address the potential bidirectional causality between the purchasing and selling behaviors of SOGEs and grain price volatility, this study addresses endogeneity concerns using instrumental variable methods and placebo tests.
In the grain procurement market, this study selects the regional financial development level as an instrumental variable. Large-scale grain procurement by SOGEs requires substantial financial support, and national regulations provide credit support for eligible grain procurement activities. Policy-oriented grain procurement funds are managed under a closed-loop system, ensuring that funds are used exclusively for their designated purpose. Following the approach of Sun et al. [
35], the balance of loans of financial institutions (loan) is used to reflect the regional financial development level.
Regarding the exclusion restriction, although credit funds may flow to private grain traders, warehouse construction, and transport logistics, under China’s current grain procurement and storage system, SOGEs bear the primary responsibility for policy-oriented procurement and reserve rotation. The market behavior of private grain operators is highly dependent on the procurement prices and the rhythm of reserve releases set by SOGEs. As for grain storage facilities and agricultural transport logistics, such projects are characterized by significant public goods attributes and policy orientation, with their planning and investment often coinciding with the layout of state-owned grain reserves. In practice, the majority of large-scale grain depots, dedicated railway lines, and grain-specific ports are invested in and constructed primarily by central and local SOGEs. The injection of credit funds first enhances the procurement capacity and logistics efficiency of SOGEs.
To further strengthen the exogeneity of the instrumental variable, this study employs a one-year lag of the regional credit balance, effectively avoiding contemporaneous endogeneity and better satisfying the exclusion restriction. Column (1) of
Table 4 reports the first-stage regression results. The coefficient of the instrumental variable L.lnloan is positive and significant, confirming that the selected instrument satisfies the relevance condition. The
p-value of the LM statistic is 0.00, leading to a clear rejection of the under-identification hypothesis. The F-statistic exceeds 16.38, rejecting the weak instrument concern. Column (2) of
Table 4 reports the second-stage regression results, where the estimated coefficient of the main explanatory variable remains consistent with the baseline findings.
In the grain wholesale market, this study selects the regional government–business relationship as an instrumental variable. As an indicator reflecting the extent of government corruption, the government–business relationship can affect corporate operations, entrepreneurship, enterprise efficiency and investment behavior [
36,
37]. SOGEs, acting as government agents, are exposed to moral hazard behaviors, such as fraudulent rotation schemes to embezzle subsidies. For example, Wang, the former Party Secretary of Shaanxi Grain and Agriculture Group, once arranged for the irregular rotation and sale of over 38,900 tons of provincial reserve rice. Following the approach of [
38], this study uses the legal institutional environment (IN) to reflect the quality of government–business relationship in a region. The data comes from the sub-indicator “Development of market intermediaries and legal institutional environment” within the China Marketization Index constructed by Fan et al. [
39].
Regarding the exclusion restriction, the legal and institutional environment may influence market competition. However, under the specific institutional arrangements of China’s grain market, SOGEs play a dominant role in grain circulation. Improvements in the legal and institutional environment first affect SOGEs as the core market participants, and are then transmitted to market prices through adjustments in their behavior. Columns (3) and (4) of
Table 4 show that the coefficient of the instrumental variable IN is negative and statistically significant, satisfying the relevance condition. The LM statistic rejects the null hypothesis at the 1% significance level, and the F-statistic is about 182.21, passing both the under-identification and weak instrumental tests. The estimated coefficient of gw remains negative and statistically significant, indicating that after addressing potential endogeneity concerns, the main findings of this study still hold.
To rule out the interference of other unobservable factors on the research findings, this study further conducts placebo tests on the results. Specifically, the values of the core explanatory variables gp and gw are randomly permuted within the sample, and the baseline model is re-estimated 500 times.
Figure 2 and
Figure 3 report the placebo test results for the purchase market and wholesale market, respectively. The results indicate that the findings of this study are not driven by random factors.
5. Mechanism Tests
The traditional three-step mediation approach is prone to serious endogeneity problems. When the impact of the mediator on the dependent variable is direct and self-evident, a two-step approach is sufficient for mechanism testing [
40]. Therefore, this study focuses on the first-stage test, a strategy that is cleaner in terms of identification and effectively avoids estimation bias caused by “bad controls” in empirical analysis [
41]. This approach has been applied and validated in relevant classic studies [
42,
43].
5.1. Market Power
Based on the earlier theoretical analysis, this study posits that SOGEs, by virtue of their advantages in grain sourcing organization and storage scale, possess market power in both the procurement and wholesale markets, thereby influencing grain price volatility. Following Wang et al. [
44], market competition is assessed using the ratio of SOGEs’ regional warehouse capacity to the national total for the procurement market (mp1), and the ratio of SOGEs in a region to the national total for the wholesale market (mp2). These measures test how SOGEs’ purchasing and selling behaviors affect grain price volatility via market power. Column (1) of
Table 5 shows a positive and significant regression coefficient of gp on mp1, indicating that procurement behavior enhances SOGEs’ structural advantage in the procurement market. Column (4) shows a positive, significant coefficient of gw on mp2 at the 1% level, indicating that sales behavior similarly strengthens SOGEs’ advantage in the wholesale market. These results confirm that SOGEs influence grain price volatility by enhancing their market power in both markets. H2 is validated.
5.2. Market Expectations
In the grain procurement market, SOGEs influence grain price volatility by shaping farmers’ expectations. Their policy-oriented purchasing signals a price floor, which raises farmers’ expected production returns [
45]. When farmers expect returns to exceed costs, they are more likely to transfer land [
46]. The farmland transfer rate can effectively capture the impact of SOGEs’ policy-driven procurement on farmers’ long-term expectations and indirectly reflect changes in market confidence. Thus, this study uses the farmland transfer rate to reflect farmers’ expectations. Following the approach of Qian et al. [
47], the farmland transfer rate (ltr) is measured as the ratio of the total area of contracted farmland transferred out to the total area of contracted farmland in a region. Column (2) of
Table 5 shows that the regression coefficient of procurement volume on ltr is positive and statistically significant at the 1% level. This indicates that SOGEs’ procurement promotes farmland transfer and increases the number of large-scale farm operators. The sales decisions of these large-scale farmers, in turn, amplify procurement price volatility, supporting the theoretical analysis presented earlier.
In the grain wholesale market, SOGEs’ sales behavior influences grain price volatility by shaping how processing enterprises and traders assess the market. The Entrepreneur Confidence Index is selected as the proxy for corporate expectations for the following reasons: The entrepreneur confidence index captures corporate decision-makers’ expectations about the macroeconomic environment and policy outlook [
48], and existing studies often use this index as a proxy for expectations [
49]. Although this indicator captures macroeconomic confidence rather than grain-market-specific expectations, the grain market, as a fundamental sector of the national economy, is closely intertwined with the macroeconomic environment. The confidence of processing enterprises and traders in the macroeconomy will, to some extent, be reflected in their expectations regarding the grain market. Therefore, this study uses the entrepreneur confidence index (eci) to represent the market expectations of processing enterprises and traders, and includes the Fan Gang Marketization Index to control for regional differences. Column (5) of
Table 5 shows that the regression coefficient of sales volume on eci is negative and statistically significant at the 1% level. Thus, when SOGEs increase sales, they signal ample supply and downward price pressure. This leads processing companies and traders to lower their expectations for future profitability, reflected as a decline in the entrepreneur confidence index. As a result, enterprises reduce speculative or panic-driven hoarding, which decreases price volatility. In sum, SOGEs affect grain price volatility through market expectations in both procurement and wholesale markets. H3 is validated.
5.3. Behavioral Responses of Private Enterprises
Private grain enterprises often observe and respond to the actions of SOGEs. They consider procurement rhythm, price adjustments, and inventory behavior to avoid a competitive disadvantage. However, due to data constraints, it is difficult to directly observe the procurement rhythm and inventory timing of private enterprises at the provincial level. Therefore, this study uses enterprise operational outcome variables instead. These variables help capture how private enterprises respond to shocks generated by SOGEs’ activities. In the procurement market, intensified competition is expected to increase operating costs per unit of expenditure. In the wholesale market, improved supply regulation through inventory releases is expected to enhance enterprise profit performance by reducing price uncertainty and transaction frictions.
This study selects representative listed private grain enterprises from each province as the analytical sample for the following main reasons. First, as key actors in agricultural supply chains, listed agribusinesses represent the advanced productive forces in the agricultural sector, and their operational decisions and behavioral patterns reflect, to a certain extent, the overall trends of the industry [
50]. Second, listed companies are subject to stricter disclosure requirements, resulting in higher data quality, which provides a reliable data foundation for mechanism testing. Tianjin, Shaanxi, and Guizhou are excluded due to severe data missingness and relatively small grain purchase and sales volumes, which have a limited impact on the overall results. The data are sourced from the CSMAR database.
Due to data limitations, small and medium-sized private grain enterprises are not included in the analysis. Listed companies, being larger and more responsive to the behaviors of SOGEs, may exhibit stronger estimated effects than the average private firm. However, the direction of the behavioral response is expected to be consistent across firm types, so the conclusions regarding the direction of effects remain valid.
In the grain procurement market, total operating cost (toc) measures enterprises’ expenses [
51]. Toc is an outcome indicator rather than a direct measure of the pace of procurement. The rationale is that if private enterprises indeed adopt a follow-the-leader purchasing strategy, their procurement costs will rise accordingly, which will subsequently be reflected in their operating costs. Therefore, toc can serve as indirect evidence of such follow-the-leader purchasing behavior. Column (3) of
Table 5 shows a positive and significant coefficient for gp, indicating that SOGEs procurement increases operating costs for private grain enterprises. This supports the earlier theory that private grain enterprises, prompted by price floors, accelerate procurement. In the grain wholesale market, net profit (np) reflects current performance [
52]. Similarly, np is an outcome indicator rather than a direct measure of procurement strategy. The rationale is that if the selling behavior of SOGEs indeed exerts a market-stabilizing effect, the operating environment for private enterprises will improve, which will subsequently be reflected in their net profits. Column (6) shows a positive and significant coefficient for gw at the 1% level, indicating SOGEs sales behavior boosts private grain enterprise profitability. This may stem from private enterprises free-riding on positive externalities from SOGEs’ counter-cyclical regulation. These results show that the SOGEs’ purchasing and selling behaviors influence grain price volatility by affecting private enterprises’ decisions. H4 is validated.
6. Heterogeneity Analysis
6.1. External Environment Shocks
Since 2020, the combined shocks of the COVID-19 pandemic and the Russia–Ukraine conflict have triggered turbulence in global grain markets. This study further explores the relationship between SOGEs’ purchasing and selling behaviors and grain price volatility under external shocks. Using the COVID-19 outbreak as a dividing point, the sample is split into two sub-periods: before December 2019 and after January 2020. The baseline model is then re-estimated for each sub-period. Columns (2) and (4) of
Table 6 show that, after 2020, the purchasing behavior of SOGEs has no significant impact on procurement price volatility. The moderating effect of sales behavior on wholesale price volatility is also significantly weakened. The results of the inter-group coefficient difference tests indicate that the differences in regression coefficients are statistically significant. The underlying reason is that, as price co-movement between domestic and international grain markets strengthens, uncertainty from external shocks amplifies domestic grain market volatility through industrial chain transmission. This also increases the difficulty of cross-sectoral policy coordination [
53]. As single-market participants, SOGEs’ market operations are unable to fully offset external shocks, resulting in a weakened counter-cyclical effect. During the pandemic period, regional lockdowns and road blockades caused market fragmentation. These factors impeded grain transportation and hindered inter-regional price transmission [
54].
6.2. Regional Development Disparities
Significant differences exist in regional development, policy objectives, and inventory structures across these areas. As a result, the impact on price volatility may also show heterogeneous effects. This study uses the provincial corn production–consumption gap (the difference between output and consumption) as the classification criterion to divide the sample into major corn producing areas and non-major producing areas, and conducts group regressions accordingly. (In the initial version, we classified regions based on provincial maize output. The empirical results under this classification are reported in
Appendix B. Given that the production–consumption gap better captures net supply/demand status and directly affects market balance and price transmission, we adopt the production–consumption gap as our core classification. To avoid concerns about specification search, the main text reports results using the new classification, while
Appendix B presents the heterogeneity analysis based on the original classification.) The rationale is that regions with a positive production–consumption gap have sufficient grain supply and constitute the core areas for policy-supported price floor procurement, where SOGEs exert stronger policy intervention intensity. In contrast, regions with a negative production–consumption gap have insufficient grain self-sufficiency and belong to major corn consumption areas, where the functional positioning of SOGEs and the logic of policy intervention differ significantly from those in major producing areas. The specific classification method is as follows: the total annual corn consumption of each province is calculated, and the provincial production–consumption gap is obtained by subtracting consumption from annual corn output. A positive gap indicates a major corn producing area, while a negative gap indicates a major corn consumption area. Based on this criterion, the major corn producing areas identified in this study include 12 provinces: Hebei, Shanxi, Inner Mongolia, Liaoning, Jilin, Heilongjiang, Shandong, Henan, Yunnan, Shaanxi, Gansu, and Xinjiang. The remaining provinces are uniformly classified as non-major producing areas.
Table 7 reports the group regression results based on the production–consumption gap classification. In the grain purchase market, for major producing areas, the coefficient of gp is 0.0026, which is positive and statistically significant at the 5% level. In non-major producing areas, the gp coefficient is not statistically significant, and the test for inter-group coefficient differences is significant. This result indicates that in major corn producing areas, the pro-cyclical concentrated purchasing behavior of SOGEs generates a short-term rigid demand shock, significantly amplifying purchase price volatility. In the grain wholesale market, for major producing areas, the gw coefficient is not statistically significant. In non-major producing areas, the gw coefficient is −0.00913, which is negative and statistically significant at the 1% level, with significant inter-group coefficient differences. This result shows that in non-major corn producing areas, the counter-cyclical selling behavior of SOGEs effectively dampens wholesale price volatility by increasing market supply. A possible explanation for the insignificance of gw in major producing areas is that, in these regions, the selling behavior of SOGEs is primarily oriented toward policy-driven reserve rotation rather than market-based counter-cyclical price regulation.
7. Conclusions and Policy Implications
Based on provincial panel data from January 2013 to December 2023, this study systematically examines the impact of SOGEs’ purchasing and selling behaviors on grain market price volatility. It also tests the underlying mechanisms from three perspectives: market power, price expectations, and the behavioral responses of private enterprises. The main findings are as follows.
First, the effects of SOGEs’ purchasing and selling behaviors on price volatility differ across market segments. In the procurement market, purchasing behavior is positively and significantly correlated with price volatility. In the wholesale market, sales behavior is negatively and significantly correlated with price volatility. Procurement behavior causes strong demand shocks during centralized arrival periods, increasing short-term price volatility. Sales behavior is counter-cyclical in the wholesale segment, curbing price deviations by regulating inventory and guiding volatility toward convergence.
Second, the mechanism analysis reveals that SOGEs influence price volatility through three channels: market power, price expectations, and the strategic behaviors of private enterprises. In the procurement segment, strong market presence and concentrated entry rhythm intensify demand shocks. Farmers’ grain sales decisions and the behaviors of downstream participants further amplify short-term volatility. In the wholesale segment, a stable inventory release rhythm enhances supply regulation capacity. The expectation anchoring effect is more prominent. The behavioral responses of private enterprises further strengthen the volatility-dampening effect.
Third, the heterogeneity analysis shows that SOGEs’ purchasing and selling effects depend heavily on specific market contexts. When external shocks occur, SOGEs’ regulatory capacity becomes significantly weaker. In non-major producing regions, the sales of SOGEs can quickly raise market supply and ease local supply–demand tensions. As a result, more pronounced market intervention effects are achieved.
Based on the above findings, this study offers the following policy implications.
(1) Reasonably manage the scale and rhythm of policy-oriented grain purchases and sales. The baseline regression reveals that policy-driven procurement may amplify price volatility. Therefore, during periods of centralized market arrivals, procurement timing should be spread out to mitigate short-term demand shocks. Fund allocation should be optimized and grassroots procurement stations coverage should be expanded. For non-seasonal factors price fluctuations, excessive intervention should be avoided. Policy restraint should be maintained so that regulation does not become a new source of volatility.
(2) Strengthen cross-regional circulation and market connectivity. The heterogeneity analysis reveals that, in non-major producing areas, the selling behavior of SOGEs effectively dampens wholesale price volatility. This implies that, in non-major producing areas, the selling behavior of SOGEs exerts a more pronounced cross-regional stabilizing effect. Therefore, efforts should be made to continuously advance the construction of dedicated railway lines, logistics corridors, and regional reserve infrastructure, thereby improving the efficiency of cross-regional grain circulation and promoting greater spatial price equilibrium. Furthermore, under the framework of building a unified national market, it is necessary to improve coordination mechanisms between key producing and consuming regions, strengthen information sharing and coordinated regulation, and enhance the market’s capacity to hedge against regional supply and demand shocks.
(3) Promote synergistic participation of state-owned and private enterprises. Mechanism tests indicate that private grain enterprises exhibit strategic responses to the behaviors of SOGEs. Therefore, a more open and transparent market environment should be fostered to encourage private entities to play a more active role in price formation and market regulation. Specifically, by improving the construction of trading platforms, enhancing information transparency, and strengthening the credit system, the pro-cyclical behavior of private enterprises arising from information asymmetry can be mitigated, thereby reducing the accumulation and amplification of short-term volatility in the market.
(4) Balance short-term stability with long-term efficiency. The findings indicate that the selling behavior of SOGEs performs a counter-cyclical regulatory function in the wholesale market. When implementing policy-oriented procurement and sales mandates, SOGEs are responsible for maintaining short-term price stability and ensuring long-term resource allocation efficiency. In times of intense price volatility or strong external shocks, necessary counter-cyclical regulatory functions should be used. It is also necessary to strengthen evaluation and ongoing monitoring of policy effects, including indicators such as price volatility, inventory structure changes, and transaction costs in assessments. This approach promotes an institutional arrangement that balances stability and efficiency.
8. Limitations and Outlook
This study has several limitations that future research could address:
(1) Although the HP filter is widely used in studies decomposing grain price cycles, it still has inherent limitations, mainly its sensitivity to the choice of the smoothing parameter λ and the endpoint bias problem. This study details the advantages of the HP filter over alternative methods for measuring grain price volatility and conducts a robustness check by excluding the endpoint year (2023). The results confirm that the core findings are not unduly affected by the aforementioned limitations. Nevertheless, future research could employ alternative filtering methods or structural time-series models to further validate and extend the conclusions of this study.
(2) A potential limitation of the decomposition method used in this study is the assumption that the monthly share of corn in total grain purchases and sales remains constant within a given province-year. Although the monthly aggregate grain purchase and sales data capture the seasonal peaks of corn marketing, the use of annual shares cannot precisely capture month-to-month variations in corn purchases and sales, potentially introducing measurement error that would attenuate the estimated coefficients toward zero. Consequently, the estimates obtained in this study are likely conservative. To assess the extent to which this measurement issue affects the research conclusions, robustness checks were performed by excluding the harvest season months, and the results remained robust. Future research could further refine these estimates if higher-frequency crop-specific grain purchase and sales data become available.
(3) Limitations of indirect measurement of mechanism variables. Due to data availability constraints, this study could not directly test farmers’ short-term grain selling behavior and only examined the long-term expectation channel. This constitutes an important limitation of the study, and future research could further validate the short-term mechanism using micro-level farmer survey data. Similarly, the Entrepreneur Confidence Index selected in this study is a relatively broad macroeconomic indicator rather than a measure specifically designed for grain market expectations. Although the grain market is closely related to the macroeconomy, this index can only capture indirect proxies of expectations rather than expectations themselves. Ideally, survey data specifically targeting grain market expectations would be used, but such data are not readily available. Furthermore, due to data availability constraints, this study could not directly observe the procurement pace and inventory replenishment timing of private grain enterprises at the provincial level, and instead used outcome variables such as operating costs and net profits as proxy indicators. The analysis of private grain enterprises in this study is based solely on a sample of listed companies, which represent only a small segment of the private grain sector and are superior to small and medium-sized private enterprises in terms of scale, financial strength, and information acquisition capacity. Therefore, the conclusions of this study are strictly limited to “listed private grain enterprises” and are not generalized to the entire private sector. Future research could further test and extend the findings of this study using more comprehensive enterprise survey data.
An unexpected finding is that, in the wholesale market, SOGE sales behavior amplifies short-term volatility (measured by rolling standard deviation), contrary to the stabilizing effect identified by the HP filter. This suggests time-dimension heterogeneity in SOGE sales behavior: smoothing fluctuations in the medium to long term but potentially causing policy overshooting in the short term. Due to data and methodological limitations, this study does not examine the underlying mechanisms. Future research could focus on (1) the short-term effects of the pace of reserve releases and (2) heterogeneity across different contexts.