1. Introduction
Heavy metal contamination remains a persistent environmental problem [
1]. These metals are toxic, persist in ecosystems, and accumulate along food chains [
1,
2]. These pollutants enter the soil environment via anthropogenic activities such as mining, smelting, improper waste disposal, as well as the application of chemical fertilizers and pesticides. Their primary migration pathways include atmospheric deposition, surface runoff and leaching [
3]. Among the most worrisome metals are Cd, Pb, and Cu. These metals are non-degradable and prone to long-term retention in soil [
4]. They impair plant growth, reducing both yield and ecological productivity [
5,
6]. Their bioaccumulation in the food chain poses serious risks to human health, underscoring the need for effective yet sustainable remediation technologies [
3].
Chelating agent-assisted soil extraction has gained attention as an efficient and easy-to-implement technique [
7]. Traditional chelators such as EDTA, DTPA, and NTA bind heavy metals strongly and are widely used [
8,
9]. However, EDDS biodegradation may release previously chelated metals back into the soil solution [
10], increasing their mobility and leachability. This not only brings risks of secondary contamination and groundwater pollution, but also compromises long-term remediation efficacy [
11].
EDDS has been proposed as a greener substitute for EDTA [
12]. It can remove up to 62% of Pb from contaminated soils. Yet its high cost and variable performance across metals limit its use [
13,
14]. Moreover, EDDS biodegradation may leave residual metals in the soil, which compromises long-term cleanup [
15]. Hence, better alternatives are still required.
Biodegradable low-molecular-weight organic acids (hereafter referred to as LMWOAs), such as citric acid (CA), malic acid (MA) and oxalic acid (OA), have recently attracted attention as natural chelators [
16,
17,
18]. They are biodegradable, non-toxic, and naturally produced by microbial metabolism and plant root exudates [
19,
20]. In addition, CA and OA are cheaper than EDTA. They also have good hydrolytic stability and low toxicity [
21,
22]. Their effectiveness in removing metals from wastewater and sludge is well documented [
23,
24,
25]. However, their use in soil remediation remains underexplored. Although previous studies have compared the heavy metal removal efficiency of two such organic acids (e.g., CA and OA), few have adopted response surface methodology (RSM) to systematically evaluate CA, MA, and OA in alkaline-contaminated farmland for optimizing the simultaneous removal of cadmium (Cd), lead (Pb), and copper (Cu), alongside a multi-indicator risk assessment (MRI) for ecological risk evaluation [
26]. This integrated strategy can not only determine optimal extraction parameters, but also quantitatively assess ecological risks after remediation, and it is an approach that has been seldom reported in existing research.
To the best of our knowledge, relatively few studies have simultaneously evaluated the Cd, Pb, and Cu removal potential of CA, MA, and OA in alkaline-contaminated agricultural soils using RSM combined with an MRI-based ecological risk assessment. This study focuses on the remediation of agricultural land, where the primary goal is not only to reduce total metal concentrations but also to restore soil fertility for safe crop production. Thus, the performance of biodegradable organic acids was evaluated with respect to both heavy metal removal efficiency and post-remediation soil health indicators such as nutrient retention, organic matter preservation, and cation exchange capacity.
2. Materials and Methods
2.1. Soil Sampling and Characterization
Within each 20 m × 20 m contaminated farmland plot, soil subsamples were collected at five sampling points using the grid sampling method with an interval of 10 m. All collected subsamples were fully homogenized to prepare a single composite soil sample. In total, three composite samples were obtained from different independent sites across the study area to eliminate the influence of spatial soil heterogeneity. These three composite samples were tested separately, and all experimental results are expressed as mean ± standard deviation. Surface soil (0–20 cm depth) was collected in October 2022 from a contaminated farmland near a copper mine in Huangshi City, Hubei Province, China (115°25′53″ E, 29°48′40″ N). Samples were air-dried, crushed, passed through a 2 mm nylon sieve, homogenized, and stored in sealed bags. After collection, the soil samples were immediately transported to the laboratory in sealed polyethylene bags. A portion of the fresh soil was stored at 4 °C for subsequent physicochemical analyses, and the remaining portion was air-dried at room temperature (25 ± 2 °C) under controlled humidity (50 ± 5%) for two weeks. The dried soil was then sieved and stored in sealed bags at room temperature until use. Total heavy metal concentrations were determined after digestion with a HNO
3-HCl-HClO
4 mixture (1:2:2
v/
v/
v) [
27], using atomic absorption spectrometry (AAS, SpectrAA 220FS, Varian, Santa Clara, CA, USA). Soil physicochemical properties were measured before and after extraction to assess the impact on fertility. Basic properties are listed in
Table 1, and detailed methods are given in
Supplementary Material S1.
2.2. Batch Extraction
Batch experiments were conducted from March to June 2023 to evaluate the removal efficiency of CA, MA, and OA for Cd, Pb, and Cu. The effects of concentration, pH, extraction time, liquid-to-soil ratio, and ionic strength were examined. Acid-washed polyethylene tubes were used for all experiments. The physicochemical properties and molecular structures of the organic acids are given in
Table S1.
For each run, 5 g of soil were mixed with 20.00 mL of organic acid solution in 50 mL tubes and shaken at 180 rpm. This corresponds to a solid-to-liquid ratio of 1:4 (w/v). First, the effect of organic acid concentration (1 to 100 mmol/L) was tested at pH 5.0 for 60 min. Next, the effect of pH (3 to 9) was examined at a fixed concentration of 50 mmol/L and 60 min. The pH was adjusted with dilute HNO3 or NaOH, and Milli-Q water was used as a blank control. For kinetic studies, samples were taken at various times (2 to 720 min) using 50 mmol/L organic acid at pH 5.0. The liquid-to-soil ratio and ionic strength were also investigated. Separate reactors were used for each time point in kinetic experiments to avoid volume reduction and equilibrium disturbance.
After extraction, the suspension was centrifuged at 4000 rpm for 10 min, and the supernatant was filtered through a 0.45 µm membrane. The heavy metal concentrations in the filtrate were determined by AAS.
We acknowledge that using HNO
3 for pH adjustment may introduce nitrate ions as weak competing ligands, and the potential impact of this limitation is discussed in
Supplementary Material S1.
2.3. Optimization of Heavy Metal Extraction Factors
A Box–Behnken design (BBD) with response surface methodology (RSM) was used to optimize the elution process.
Table S2 lists the experimental factors, ranges, and levels. A total of 17 runs were designed: 12 design points and 5 center-point replicates, to estimate error and assess model fit (
Table 2). All runs were randomized and performed in triplicate to minimize uncontrolled variation [
28]. Regression and plotting were performed with Design Expert (v. 13.0, Stat-Ease Inc., Minneapolis, MN, USA).
Table S3 shows the factor-level design. The quadratic polynomial model used for prediction and interaction analysis is
Here, Y represents the predicted response value; β0 denotes the constant term; βi, βii and βij denote the coefficients of the linear, quadratic, and interaction terms, respectively; n is the number of independent variables; and Xi and Xj denote the coded values of the independent variables.
2.4. Comparative Experiment
To compare CA, MA, and OA with conventional chelators (EDTA, EDDS, DTPA), extractions were performed under the optimal conditions identified above: 70 mmol/L, pH 5.0, solid-to-liquid ratio of 1:4 (w/v), and 100 min. After extraction, soil samples were air-dried, and the concentrations of Cd, Pb, Cu, and major mineral elements (Ca, Fe, Al, Mg, Mn) were determined. Some related soil fertility indicators were also assessed.
2.5. Sequential Extraction of Heavy Metals
A modified Tessier method (
Supplementary Table S4) [
22] was used to fractionate Cd, Pb, and Cu before and after extraction. Six fractions were obtained: water-soluble (F1), exchangeable (F2), carbonate-bound (F3), Fe-Mn oxide-bound (F4), organically bound (F5), and residual (F6). Mass balance closure ranged from 92% to 106% (
Table S4), indicating acceptable recovery. Slightly exceeding 100% (up to 106%) may result from analytical variability, incomplete total digestion, or matrix effects in sequential extraction. Nevertheless, the recovery is within the acceptable range (85–115%) commonly reported in sequential extraction studies [
22,
29].
The modified Potential Ecological Risk Index (
MRI) [
14,
29] was applied to evaluate the environmental risk after extraction. The
MRI is calculated as
2.6. Quality Control and Data Processing
Soil standard reference material (GBW07405a [
30]) was used for quality control. Spike recoveries for Cd, Pb, and Cu ranged from 96% to 105%, and the relative standard deviation (RSD) for triplicate samples (
n = 3) was below 5%. All labware was soaked overnight in 20% HNO
3 before use. Removal efficiency (
R, %) for each metal and total removal (
Rt, %) were calculated as
where
Cl represents the heavy metal concentration in the eluate (mg/L);
V denotes the eluent volume (mL);
M indicates the soil mass (kg); and
CT signifies the total amount of heavy metal in the soil (mg/kg).
Kinetic data were fitted to five models: pseudo-first-order (Equation (6)), pseudo-second-order (Equation (7)), two-constant (Equation (8)), Elovich (Equation (9)), and parabolic diffusion (Equation (10)) [
31]. Although pseudo-first-order and pseudo-second-order models are traditionally used for adsorption, they have been widely applied to describe desorption kinetics in soil washing studies as they provide empirical descriptions of rate-limiting steps [
31,
32]. The Elovich equation, originally developed for heterogeneous chemisorption, is used here empirically to describe multi-metal desorption from heterogeneous soil surfaces. Model selection was guided by both goodness-of-fit (
R2 and
RMSE) and mechanistic plausibility.
Statistical analysis was conducted using SPSS 22.0 (SPSS Inc., Chicago, IL, USA). Multiple comparisons were done with Duncan’s multiple range test (p < 0.05). Graphs were generated in Origin 2021 (OriginLab, Northampton, MA, USA). RSM was performed with Design Expert 13.0. Kinetic fitting was performed using 1stOpt 5.0 (Seven Dimensions High-Tech Co., Ltd., Beijing, China).
3. Results
3.1. Heavy Metals Extraction by Organic Acids
3.1.1. Effect of Organic Acid Concentration
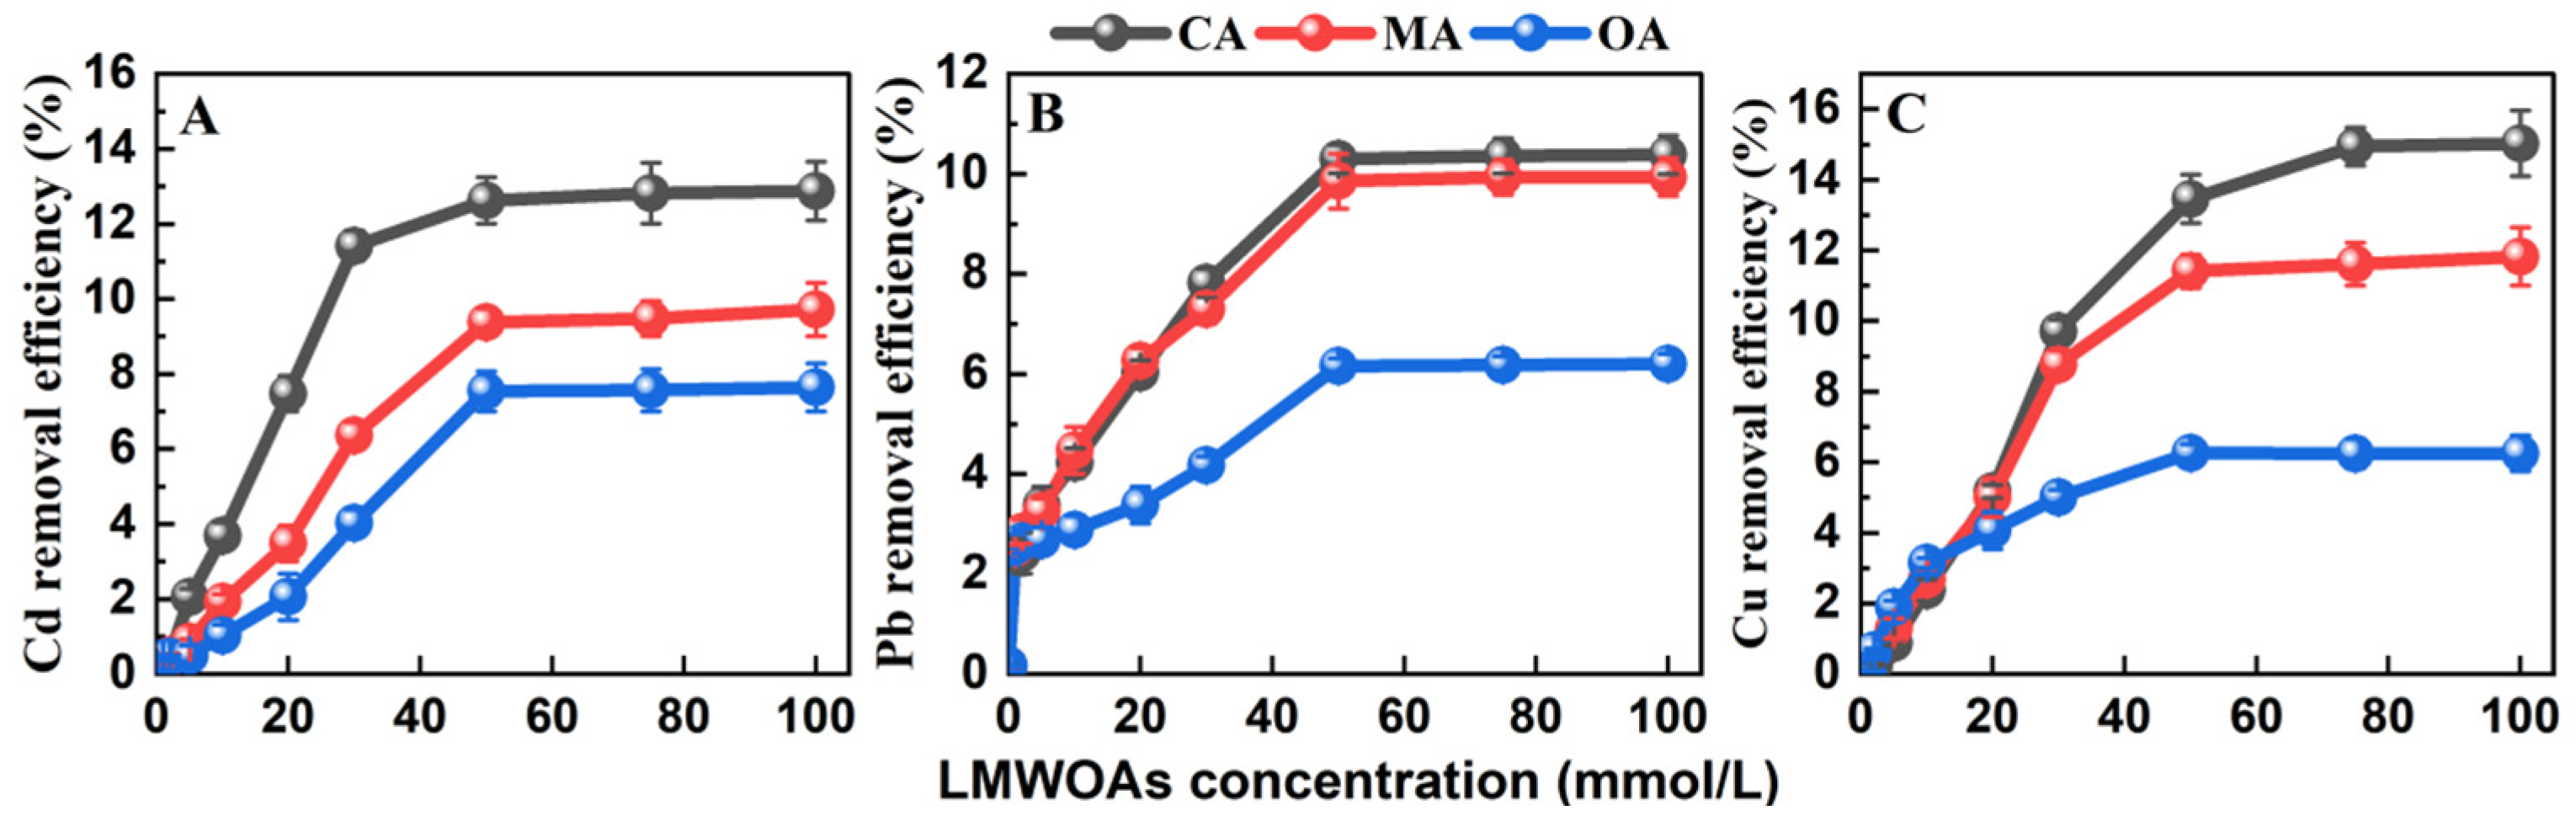
When the concentration of organic acids did not exceed 50 mmol/L, the removal rates of Cd, Pb, and Cu increased as the concentration increased (
p < 0.05) (
Figure 1). At 10 mmol/L, the removal efficiencies of CA, MA, and OA for Cd were only 3.68%, 1.93%, and 1.03%, respectively; for Pb, they were 4.22%, 4.47%, and 2.88%; and for Cu, they were 2.38%, 2.68%, and 3.14%. When the concentration was 50 mmol/L, the removal rates of CA, MA, and OA for Cd were 12.62%, 9.38%, and 7.54%; for Pb, 10.29%, 9.86%, and 6.16%; and for Cu, 13.46%, 11.41%, and 6.26%, respectively.
However, as the organic acid concentration increased from 50 mmol/L to 100 mmol/L, the increase in removal efficiency became slower, with changes of less than 5% (
Figure 1).
3.1.2. Effect of pH on Heavy Metal Extraction by Organic Acids
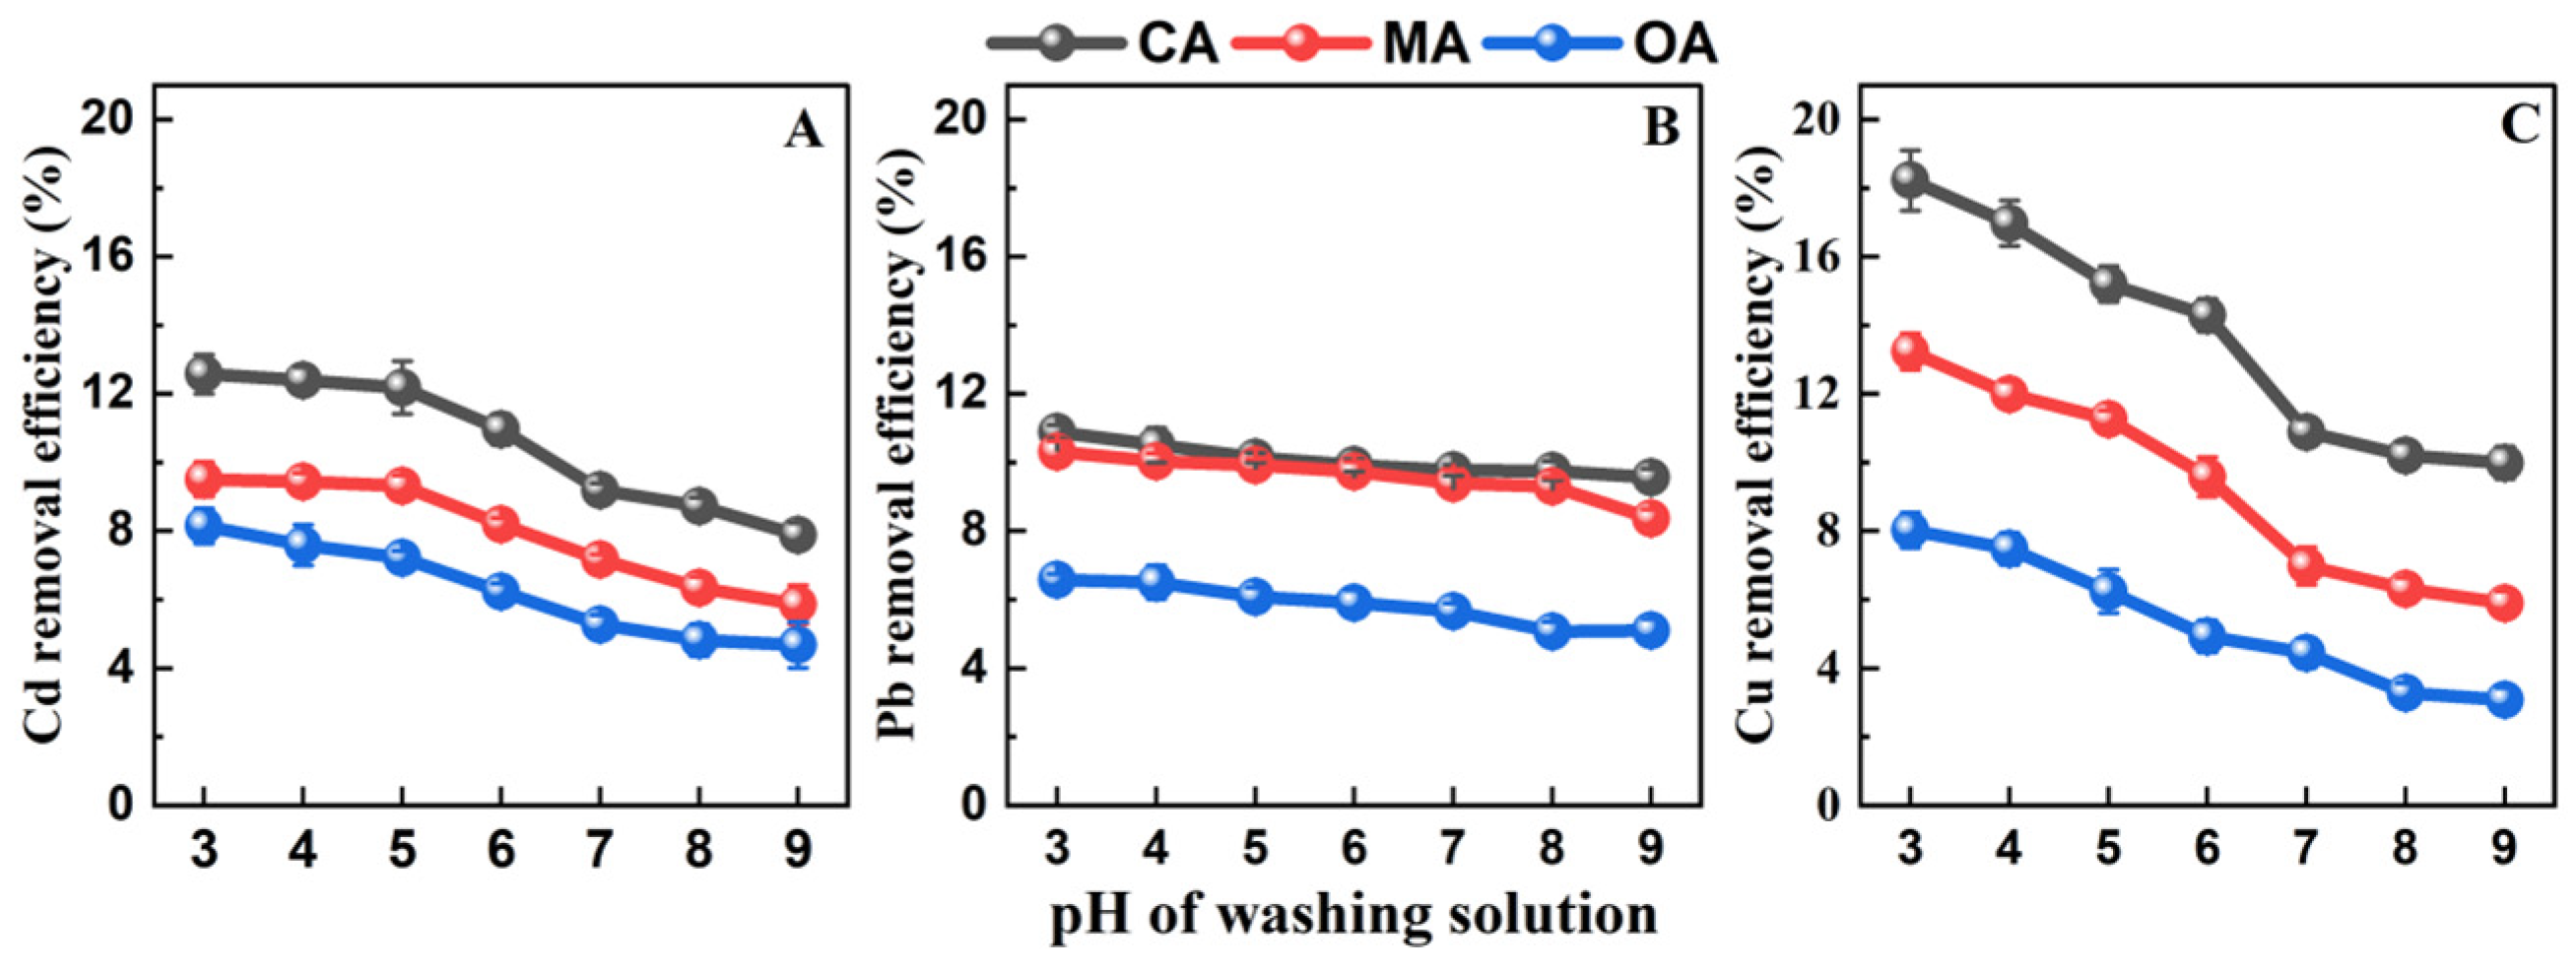
At an eluent pH of 3, all treatments exhibited an optimal extraction efficiency for all three metals (
Figure 2). In the presence of the three organic acids (CA, MA, OA), the removal efficiencies for Cd were 12.58%, 9.51%, and 8.15%, respectively; for Pb, 10.89%, 10.31%, and 6.58%; and for Cu, 18.22%, 13.24%, and 8.02%. The removal rates for Cd and Pb were lower than those for Cu, which can be largely attributed to the concentrations and speciation distributions of the three heavy metals in the soil.
When the pH increased from 3 to 6, the removal efficiencies of Cd by CA, MA, and OA were 10.96%, 8.19%, and 6.24%, respectively; those of Pb were 9.92%, 9.74%, and 5.90%; and those of Cu were 14.29%, 9.58%, and 4.93%, showing a gradual downward trend. At low pH, high concentrations of H+ can accelerate the dissolution of Fe-Mn oxide-bound heavy metals through acidification and displace adsorbed heavy metal ions via ion exchange.
3.1.3. Effect of Reaction Time
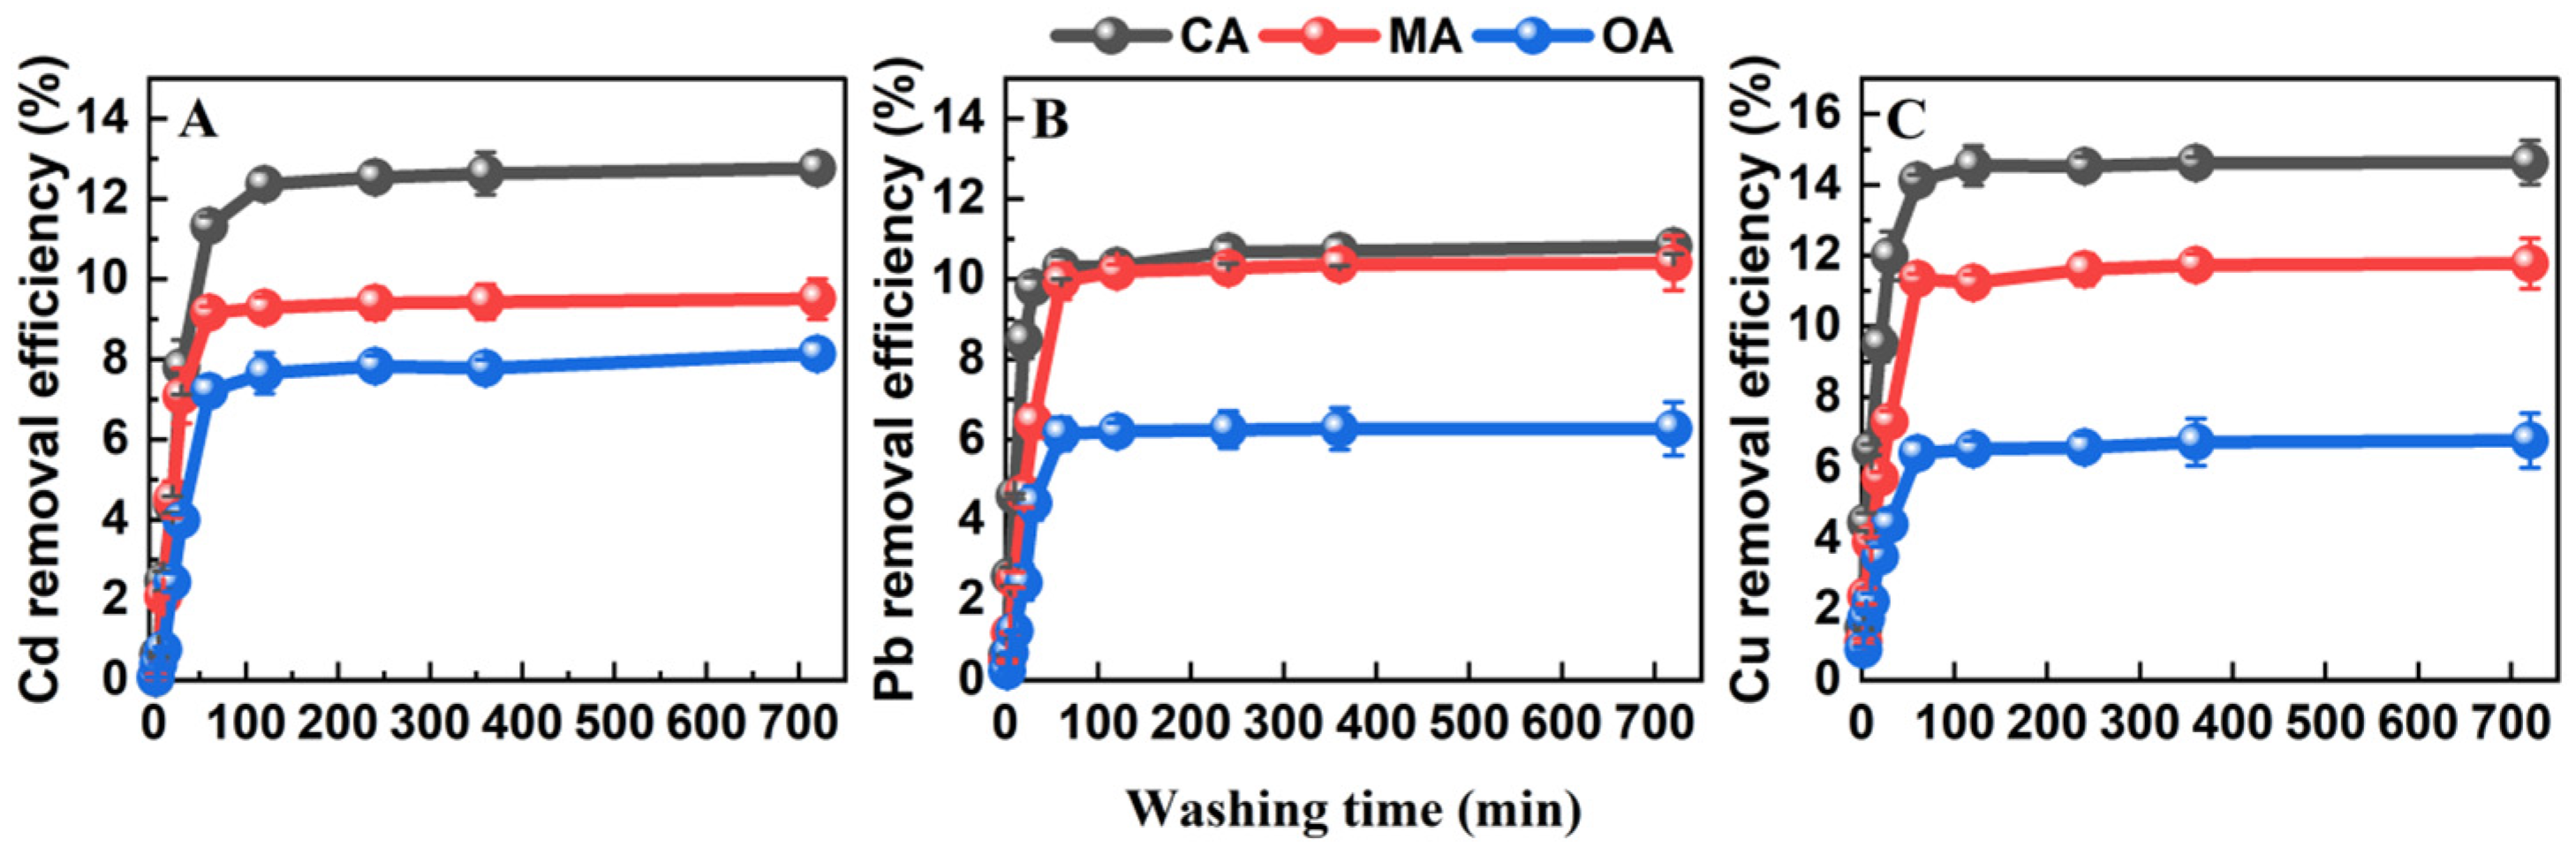
Reaction time had a significant effect on the removal efficiency of the three organic acids (
Figure 3). The removal efficiency of each experimental group exhibited a trend of initially rapid increase followed by stabilization. Between 2 and 120 min after the start of the reaction, the removal rates of Cd, Pb, and Cu all increased significantly as contact time increased. Among them, CA achieved higher removal rates in a shorter time, and the removal rate of Cu was consistently higher than those of Cd and Pb. After 120 min of elution, CA, MA, and OA removed 12.36%, 9.28%, and 7.65% of Cd; 10.32%, 10.19%, and 6.20% of Pb; and 14.55%, 11.23%, and 6.53% of Cu, respectively.
At the initial stage, the addition of exogenous organic acids raised the proton concentration in soil suspensions, allowing weakly bound heavy metals to rapidly combine with eluents through organic ligands. The removal rate decreased markedly after 120 min. This trend can be explained by two main reasons. On the one hand, eluents formed complexes with interfering metal ions such as Ca2+, Mg2+, and Fe3+, which occupied available chelating sites. On the other hand, organic acids were adsorbed onto soil particles, thereby lowering the effective concentration of eluents.
3.2. Optimization of Cd, Pb, and Cu Removal
Based on the single-factor results, a Box–Behnken design (BBD) was used to examine how three factors—organic acid concentration (
X1), solution pH (
X2), and reaction time (
X3)—interact to affect removal of Cd, Pb, and Cu.
Table 2 gives the coded levels for each factor. A total of 17 experiments were performed (results shown in
Table 2). Runs 13–17 served as center-point replicates, which were incorporated to evaluate experimental error and verify the goodness-of-fit of the model.
3.2.1. Model Fitting and Analysis of Variance
Using the removal rate of total heavy metals (Cd + Pb + Cu) as the response variable, Design Expert (version 13.0) was used to fit the 17 sets of data obtained from a Box–Behnken experimental design, establish a regression model, and systematically analyze the effects of organic acid leaching concentration (
X1), leaching solution pH (
X2), and reaction time (
X3). A simplified quadratic polynomial model was established as follows:
The coefficients for concentration (
X1) are positive, while those for pH (
X2) are negative, indicating that increasing concentration and lowering pH are beneficial for improving heavy metal removal efficiency, which is consistent with the single-factor experiments. The coefficients for reaction time (
X3) are small, indicating that within the time range set for this experiment, the influence of time on removal rate is relatively limited. The intercept of the MA model is negative, reflecting lower predicted values at the center point, which is consistent with the experimental observations (
Figure 4).
For all three organic acids, a full quadratic model was fitted to the experimental data. Analysis of variance (ANOVA) results (
Table 3) indicated that the main effects of concentration (
X1) and pH (
X2) were highly significant (
p < 0.001), whereas the main effect of time (
X3) was less pronounced (
p > 0.05 for MA). None of the two-way interactions (
X1X2,
X1X3,
X2X3) reached statistical significance at
p < 0.05, indicating the absence of synergistic effects between the three factors under the tested conditions. This simplification is further supported by the good agreement between the predicted and observed values (
Figure 5).
As shown in
Table 3, the
F values of the models for the three organic acids all exceed the critical value
F(1,9) = 38.39,
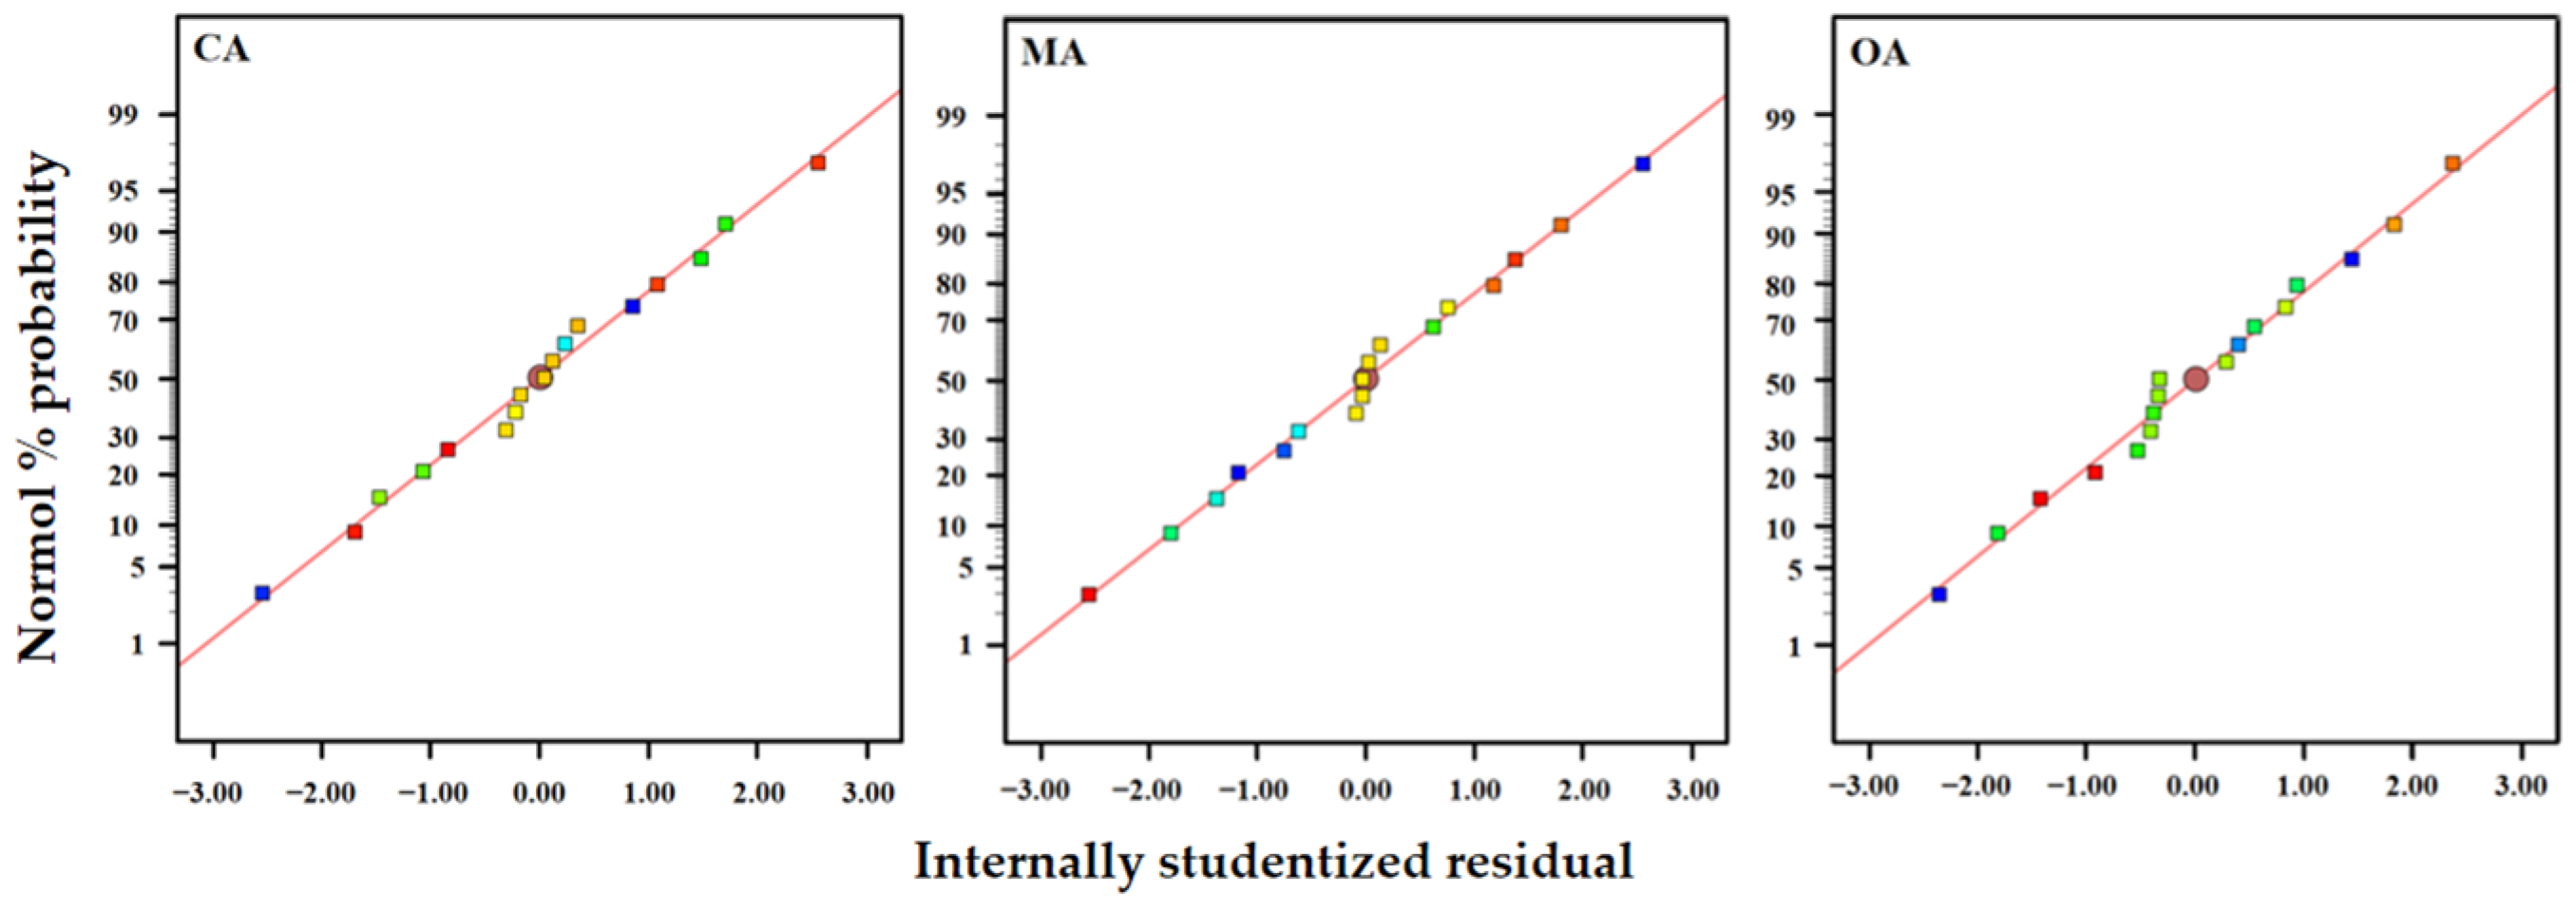
p < 0.001, indicating that all models are highly significant and suitable for optimizing the leaching process conditions. The normal probability plot in
Figure 6 shows that the residuals are distributed along a straight line, exhibiting a symmetrical pattern with a cluster in the middle and sparse points at both ends. This indicates that the residuals follow a normal distribution and that no systematic bias is present. In the scatter plot of predicted versus measured values, the data points are generally distributed on both sides of the fitted line, reflecting a good goodness of fit. The coefficients of determination (
R2) for all three organic acid models are above 0.98, and the adjusted
R2 (
Radj2) is close to 1, confirming that the model predictions are highly reliable.
It should be noted that the lack-of-fit test was significant for all three models (
Table 3,
p < 0.05), indicating that the quadratic models do not fully capture all systematic variation in the experimental data. Therefore, while the models provide a reasonable empirical description of the removal process under the tested conditions, predictions should be interpreted with caution, especially when extrapolating beyond the experimental domain.
3.2.2. Response Surface Analysis
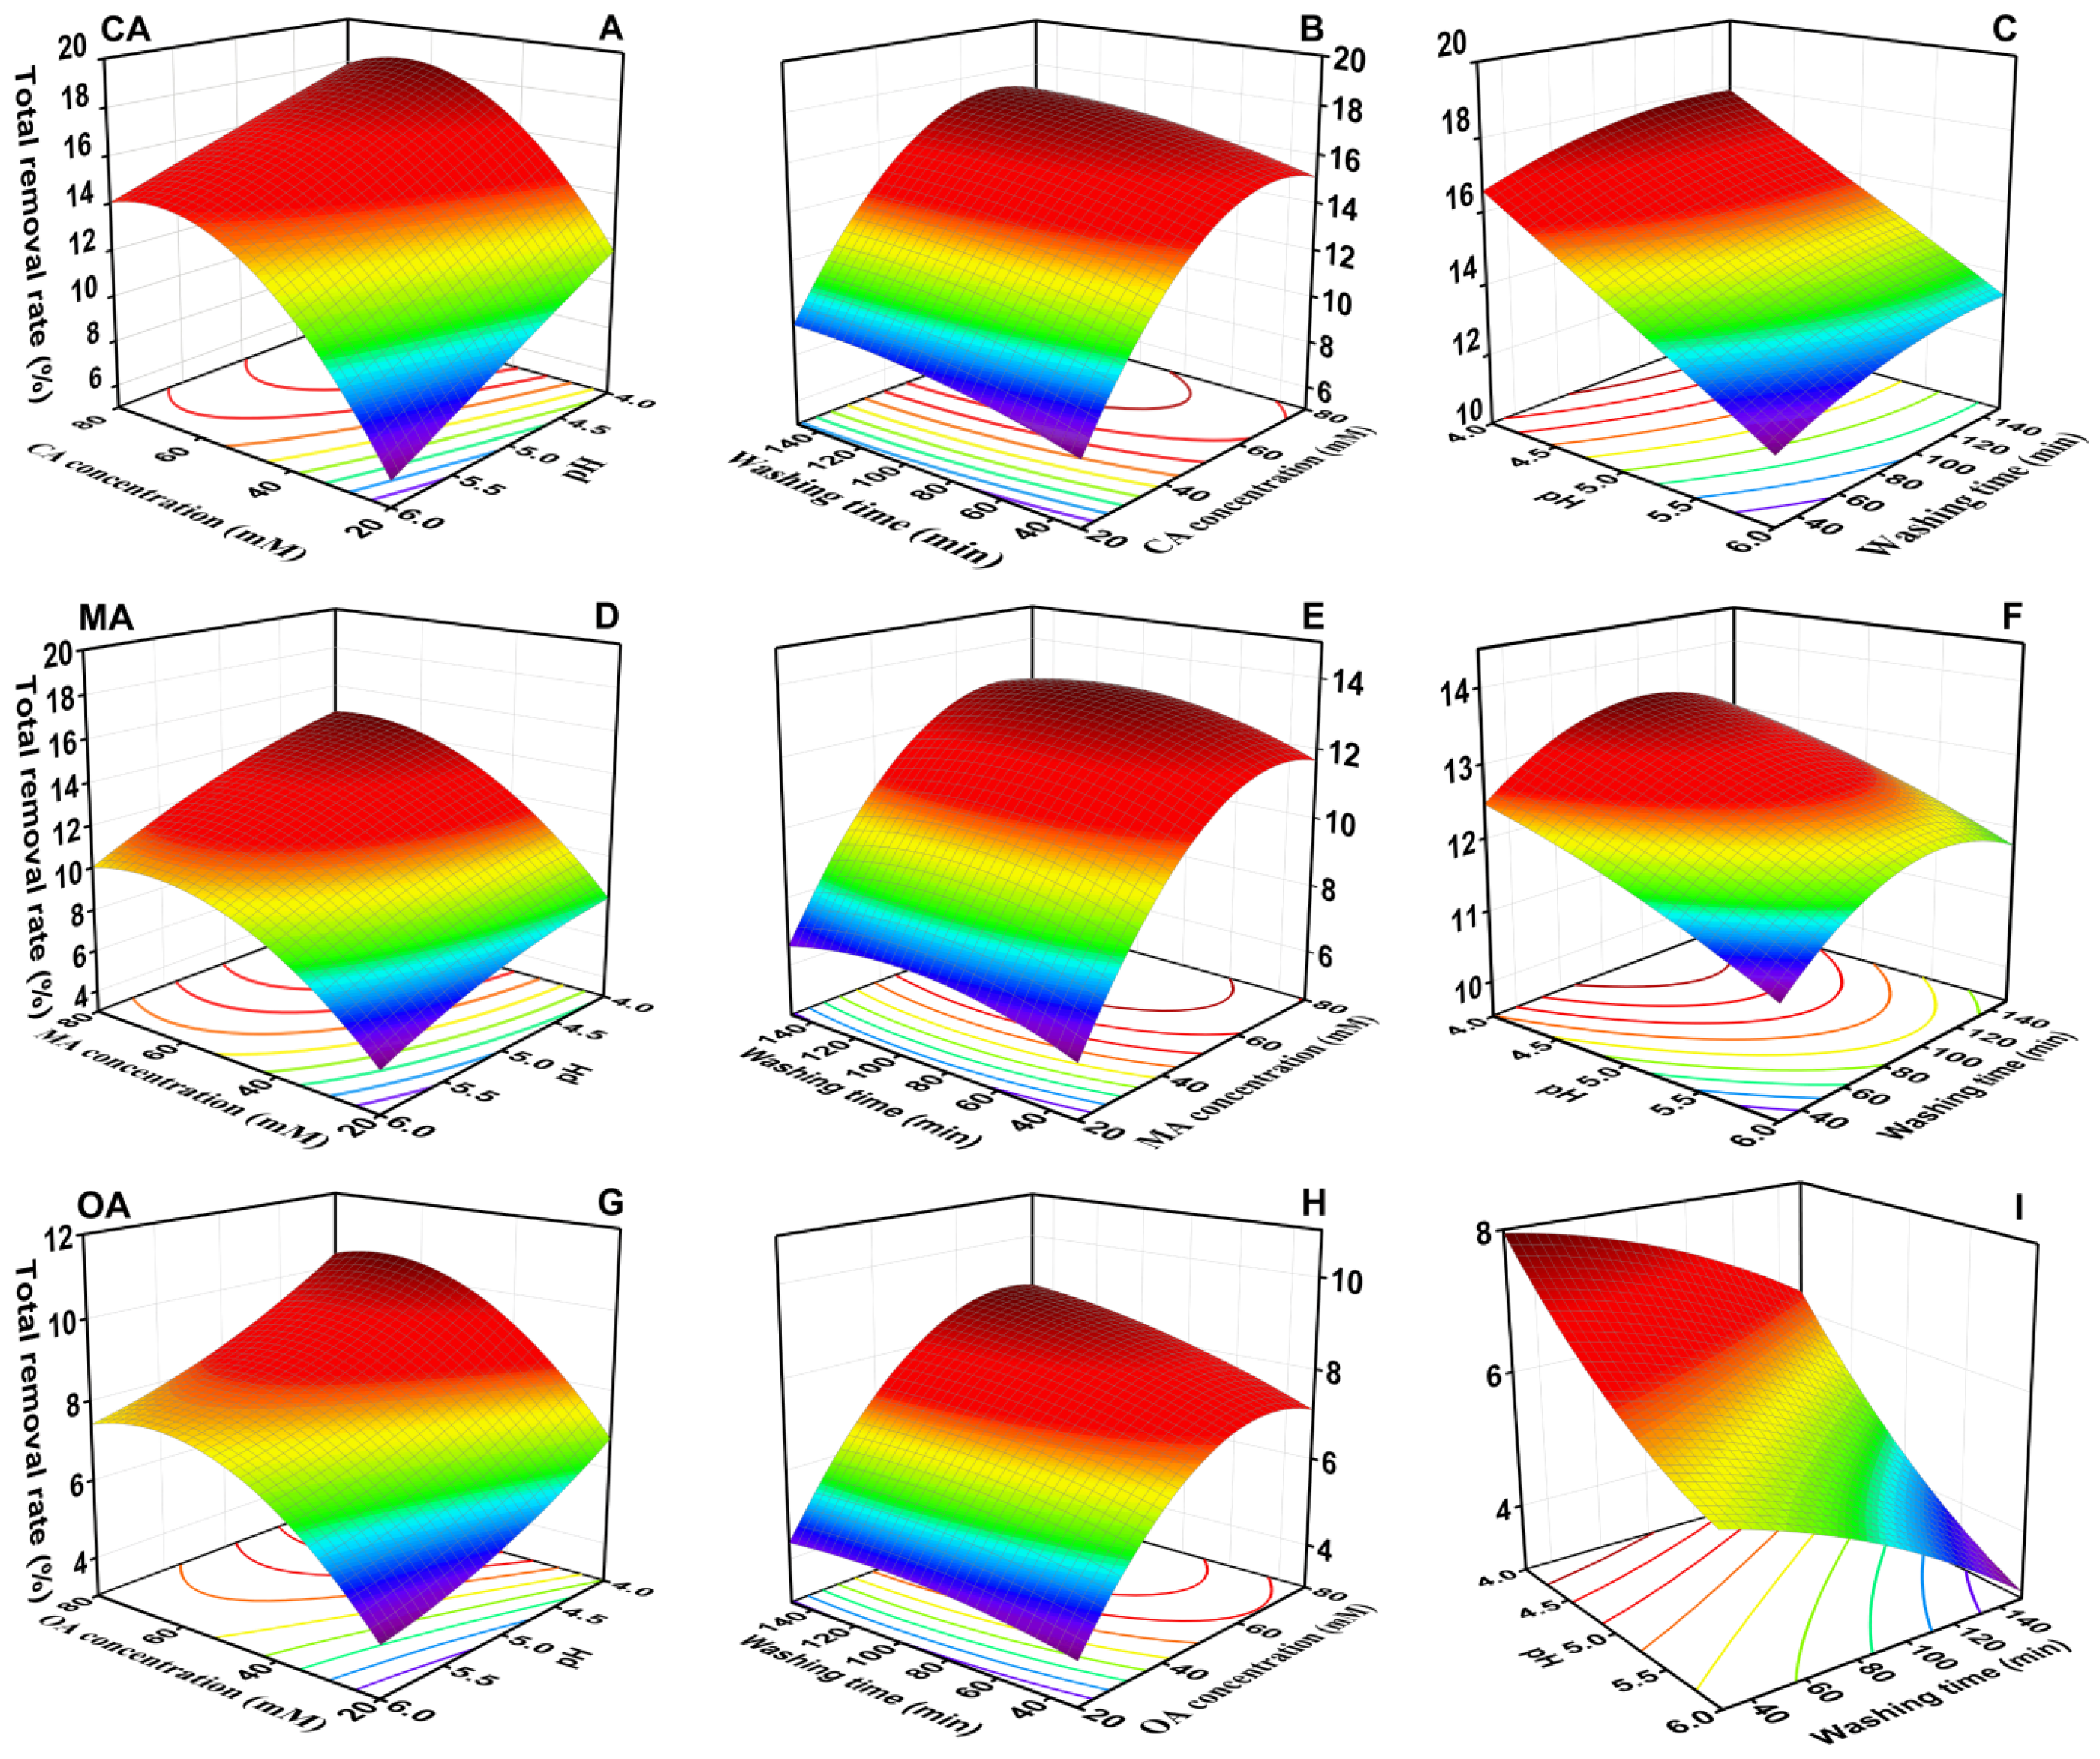
Figure 4 shows the three-dimensional response surface plots generated from the models.
Figure 4A,D,G indicate that the interaction between pH and organic acid concentration is not significant (
p > 0.05). The contour lines are denser along the concentration axis than along the pH axis, suggesting that organic acid concentration has a greater influence on removal efficiency than pH. In the pH range of 4–5, increasing the organic acid concentration steepens the response surface and substantially improves total heavy metal removal. In the pH range of 5–6, however, further increases in concentration cause only minor changes in removal efficiency. Under optimal pH conditions, raising the organic acid concentration from 20 to 80 mmol/L increased total heavy metal removal efficiency from 8.53% to 15.79% for CA, from 7.02% to 12.92% for MA, and from 4.97% to 8.30% for OA.
Figure 4B,E,H show a concentration–time interaction, but it was not statistically significant (
p > 0.05,
Table 3). Removal rates continued to rise with increasing concentration, peaking near 75 mmol/L. At 80 mmol/L and pH 5.0, extending the time from 30 to 120 min resulted in only a slight increase in removal efficiency: CA increased from 7.81% to 12.36%; MA increased from 7.09% to 9.28%; and OA increased from 3.99% to 7.65%.
Figure 4C,F,I show that the interaction between pH and time is not significant (
p > 0.05), and that pH has a greater influence than time. Within the 30–150 min range, removal rates decrease sharply with increasing pH, with the most significant decrease occurring in the pH 4–7 range.
3.2.3. Process Parameter Optimization and Model Validation
The experimental parameters were optimized using Design Expert 13.0 software. Based on the established response surface model, the optimal leaching conditions for the three organic acids (CA, MA, OA) were determined (
Table 4): approximately, a concentration of 70 mmol/L, a pH of 5.0, and an extraction time of 100 min. Under these conditions, the model predicted total removal rates (
Rt) of 13.85% for CA, 12.29% for MA, and 6.61% for OA. The satisfaction function (desirability) values for the optimized schemes were 0.64, 0.60, and 0.73 for CA, MA, and OA, respectively (
Table 4). The coefficients of determination (
R2) for all quadratic models were above 0.98 (
Table 3), indicating a good fit to the experimental data within the tested range [
29].
Experimental validation was conducted under the optimal conditions (70 mmol/L, pH 5.0, 100 min) to compare the predicted values from the quadratic models (Equations (11)–(13)) with the experimentally measured values. As shown in
Figure 5 and
Table 5, the predicted values agree well with the experimental values, with relative errors ranging from 0.45% to 4.20%. Thus, the quadratic polynomial regression model constructed using the Box–Behnken design exhibits excellent fitting accuracy and predictive reliability. This model is fully applicable to the optimization of process parameters, process forecasting, and efficacy prediction for the leaching remediation of heavy metal-contaminated soil using organic acids.
3.3. Distribution of Heavy Metals and Environmental Risks Before and After Organic Acid Extraction
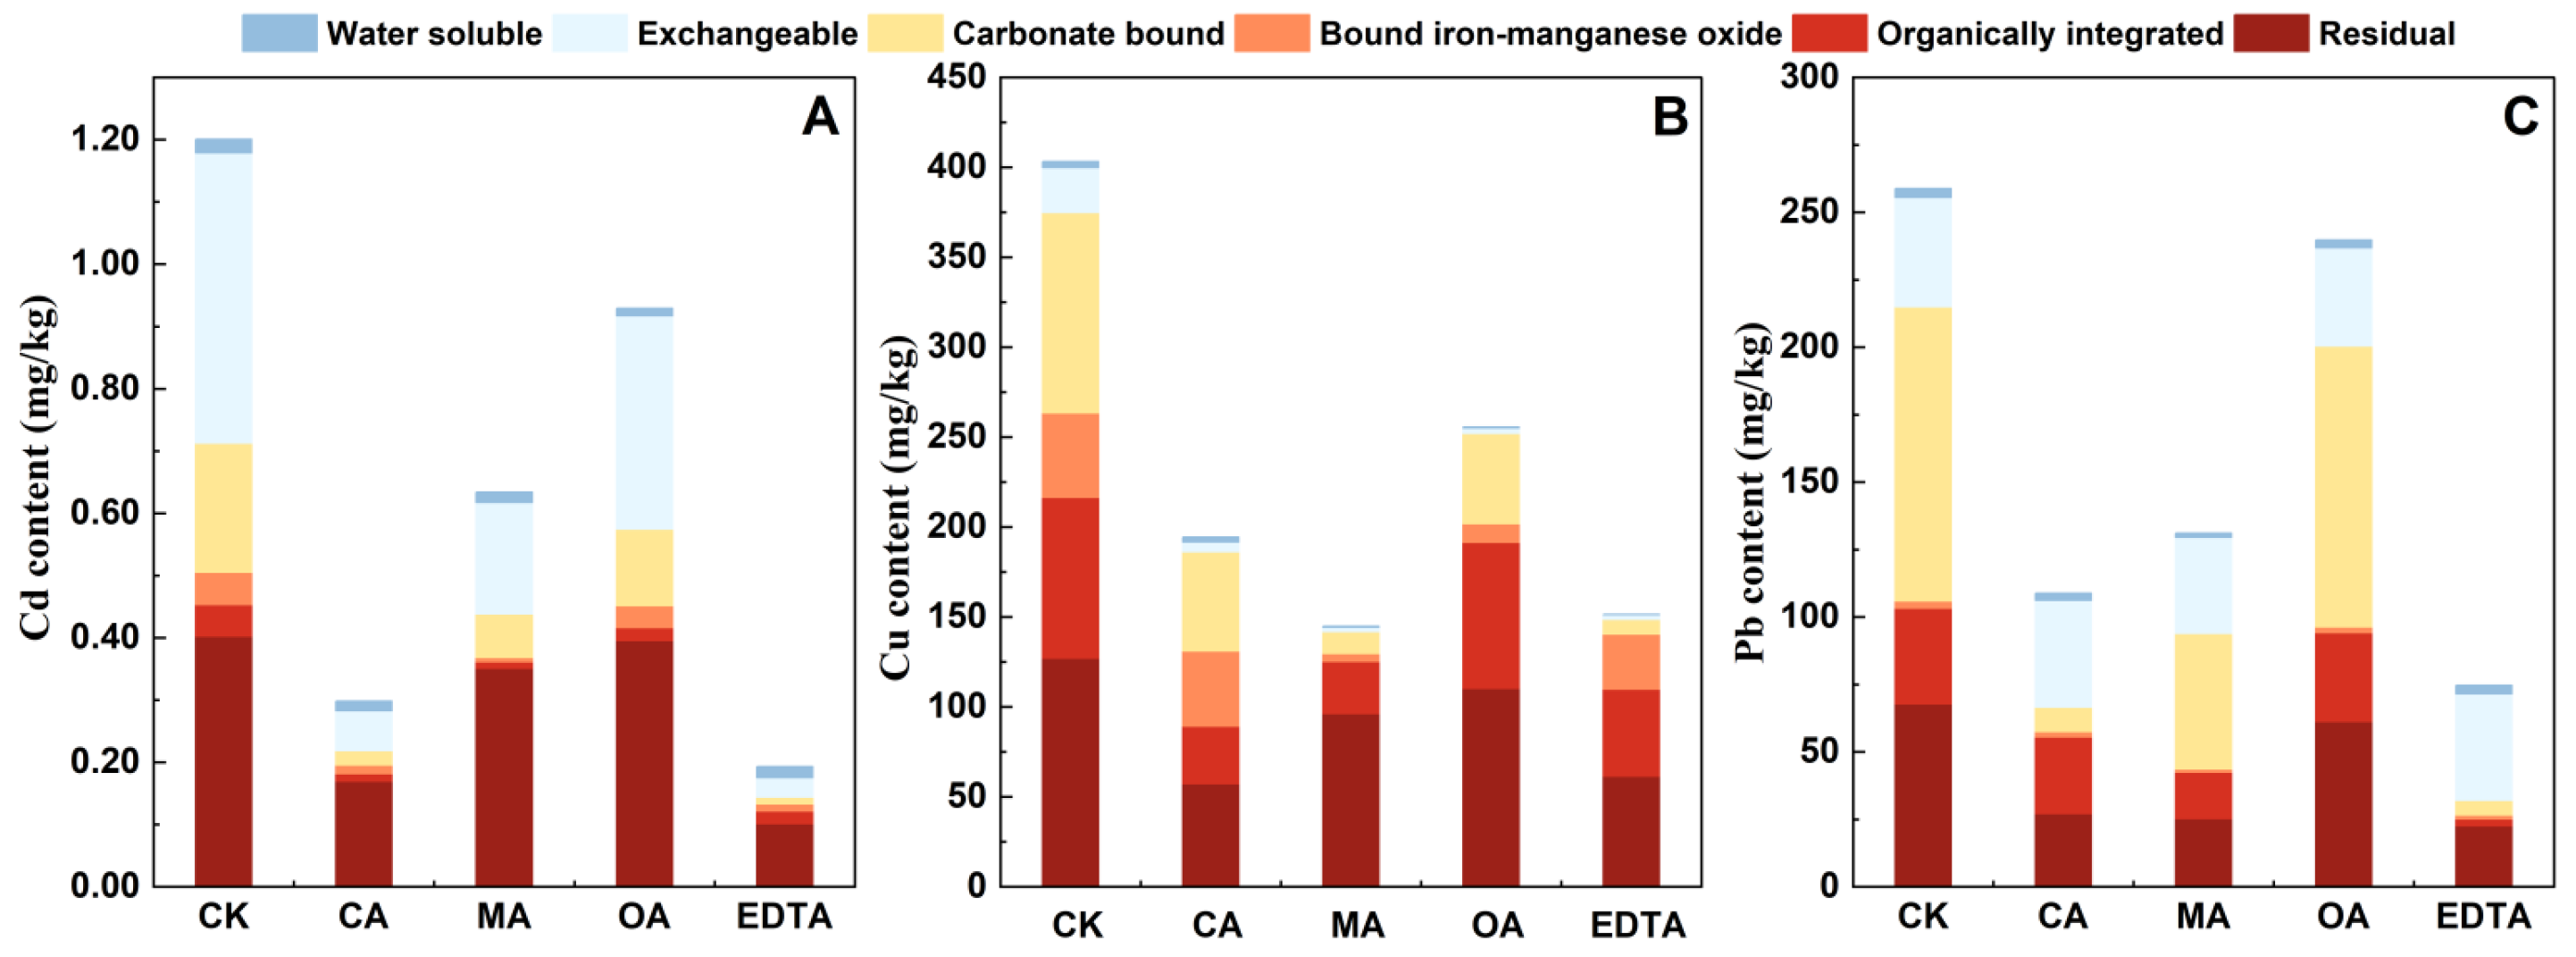
The modified Tessier sequential extraction procedure was employed to monitor the speciation changes in Cd, Pb, and Cu before and after organic acid intervention (
Figure 7). In the original soil, for Cd, the exchangeable (38.52%), residual (34.01%), and carbonate-bound (18.17%) fractions were the major contributors. Pb was mainly characterized by carbonate-bound (41.99%) and residual (26.15%) fractions. Cu was predominantly present in the residual (31.53%), carbonate-bound (27.51%), and organically bound (22.20%) phases.
After extraction, heavy metal speciation changed markedly. For Cd, CA removed 15.81% of the water-soluble fraction, 38.63% of exchangeable fraction, and 34.71% of Fe-Mn oxide-bound fraction. For Pb, CA mainly removed carbonate-bound (18.26%) and residual (18.34%) fractions. For Cu, CA effectively removed the water-soluble (33.72%) and residual (56.13%) fractions.
The MA treatment reduced Cd across all fractions, with notable decreases in exchangeable (from 0.46 to 0.37 mg/kg), carbonate-bound (0.22 to 0.17 mg/kg), Fe-Mn oxide-bound (0.05 to 0.04 mg/kg), and organically bound (0.05 to 0.03 mg/kg) fractions. Pb removal focused on the carbonate-bound, Fe-Mn oxide-bound, and residual forms. For Cu, all fractions except exchangeable and Fe-Mn oxide-bound decreased. The apparent decrease in the residual fraction may be influenced by the redistribution of metals among the less-mobile pools or by mass-balance effects, rather than by direct dissolution of mineral phases. Therefore, these results should be interpreted as changes in the relative metal distribution, not as absolute removal from the residual pool.
Although
MRI values declined after extraction (
Table 6), whether this translates to real biological effects remains unknown. Previous work suggests that
MRI captures risk changes during remediation [
33], but phytotoxicity assays would be needed to confirm the ecological benefit observed in this study.
Although the
MRI value decreased after organic acid extraction (
Table 6), this reduction primarily reflects a shift in metal distribution towards less bioavailable fractions. A decreased
MRI is an indicator of potentially lower ecological risk, but it does not substitute for direct biological assays. Phytotoxicity tests would be required to confirm the actual ecological benefit of the remediation. Nonetheless, the
MRI trends observed here are consistent with a decrease in the proportion of exchangeable and carbonate-bound metals (
Figure 7), which are the fractions most readily available to soil organisms.
It should be noted that oxalic acid may form insoluble precipitates with certain heavy metals, such as PbC
2O
4 (Ksp = 2.74 × 10
−11). This could potentially explain its lower removal efficiency for Pb compared to CA and MA, although direct evidence (e.g., eluate speciation, saturation index modeling, or solid-phase identification) is not available in this study. Therefore, this remains a hypothesis requiring further investigation. Initial risk indices (
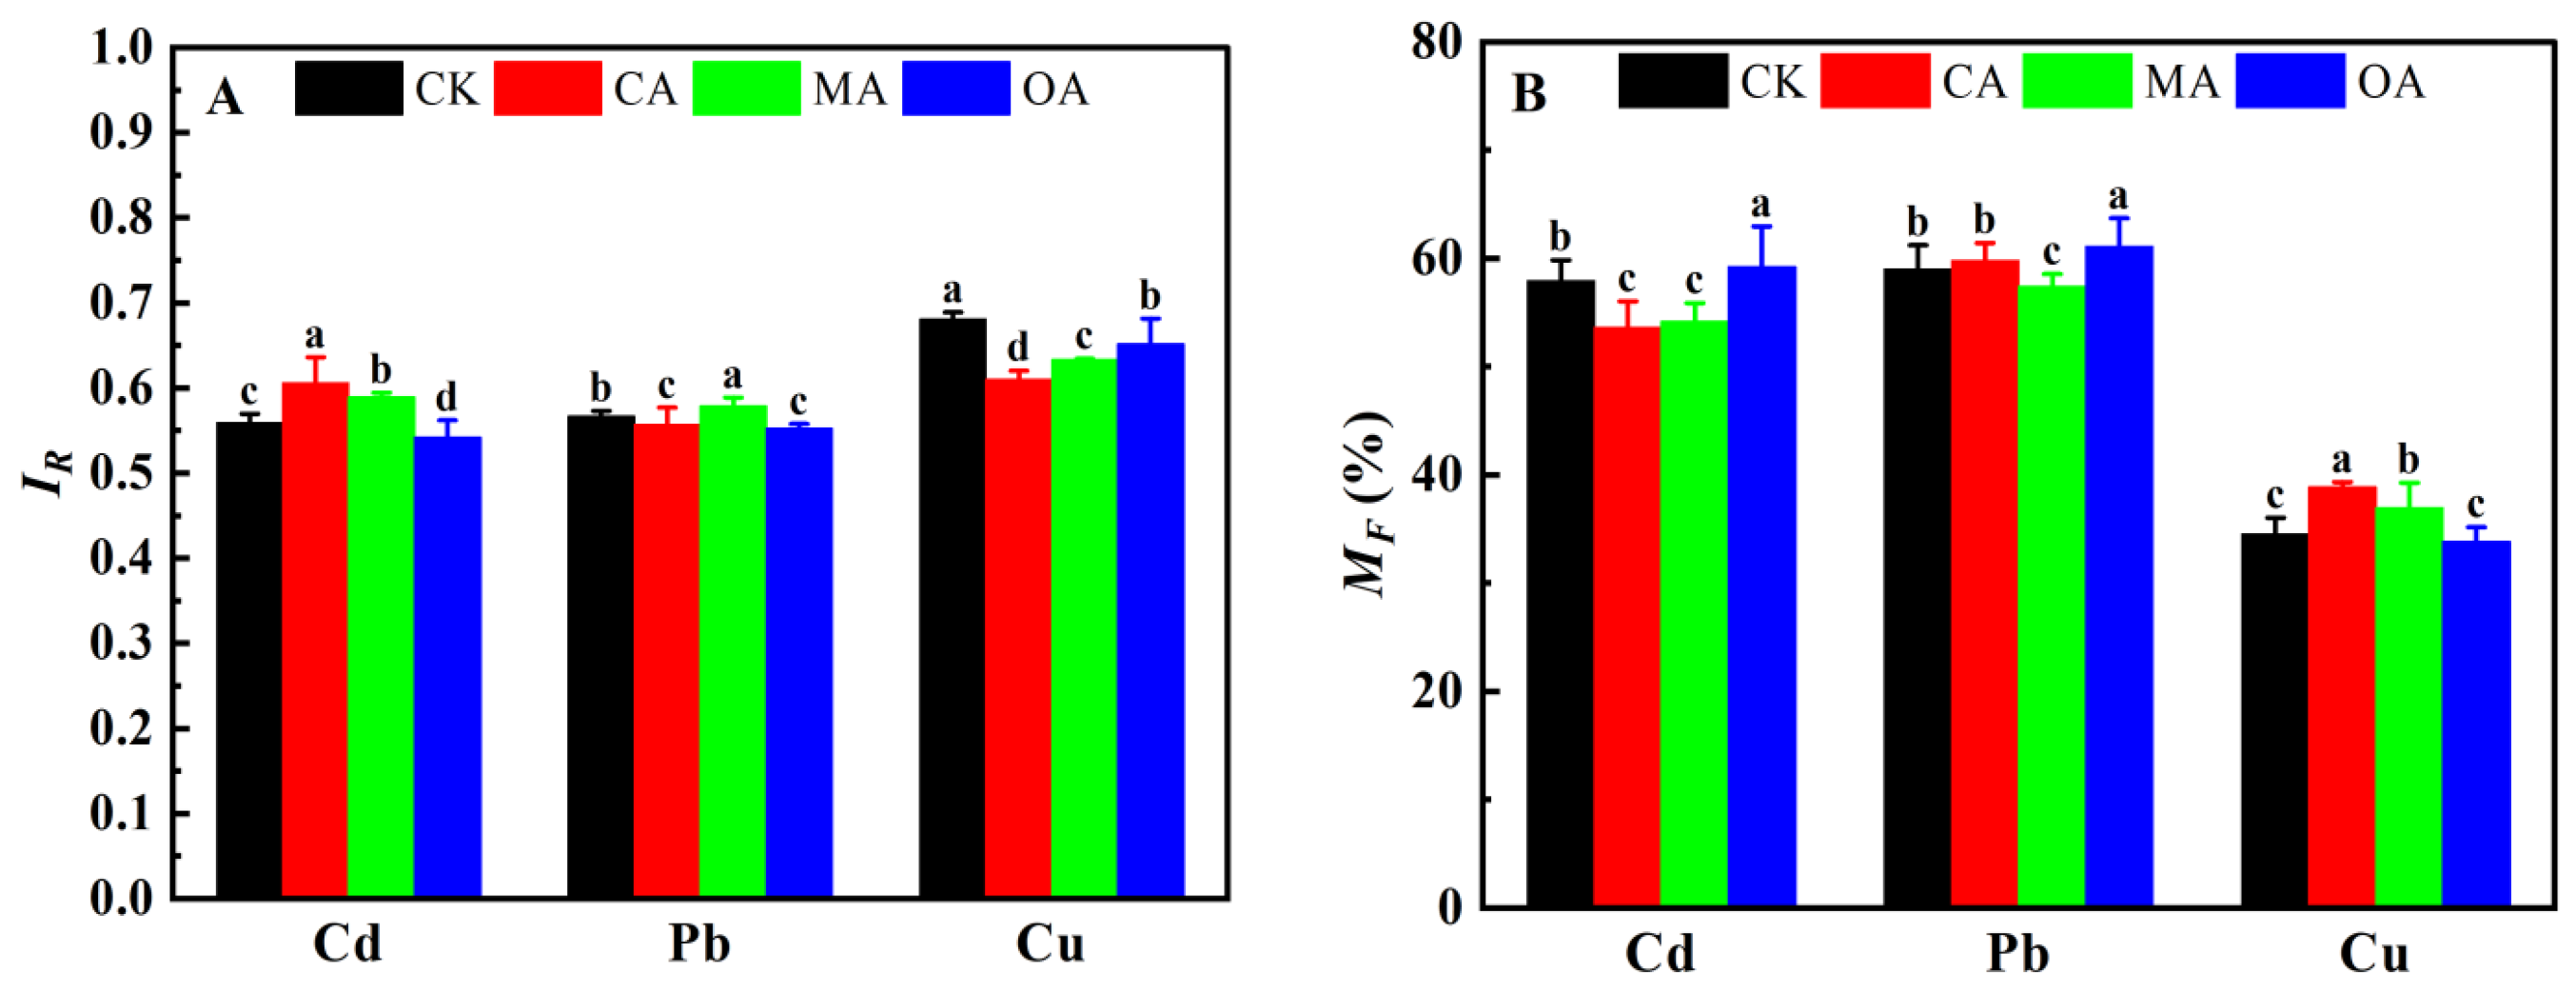
IR) for Cd, Pb, and Cu ranged from 0.54 to 0.68 (
Figure 8A), indicating the metals’ relatively strong binding to soil. After extraction,
IR changed little, but mobility factors (
MF) dropped significantly (
Figure 8B). Before extraction,
MF values were 59.03% (Cd), 57.94% (Pb), and 34.54% (Cu), with a mobility order Pb > Cd > Cu. After extraction, all decreased (
p < 0.05): CA cut the Cd-
MF by 7.42%, MA cut the Pb-
MF by 2.68%, and OA cut the Cu-
MF by 1.94%. Thus, organic acid treatments effectively reduced metal mobility and bioavailability, improving environmental stability.
3.4. Comparison of Heavy Metal Removal Efficiency Between Organic Acids and Several Chelating Agents
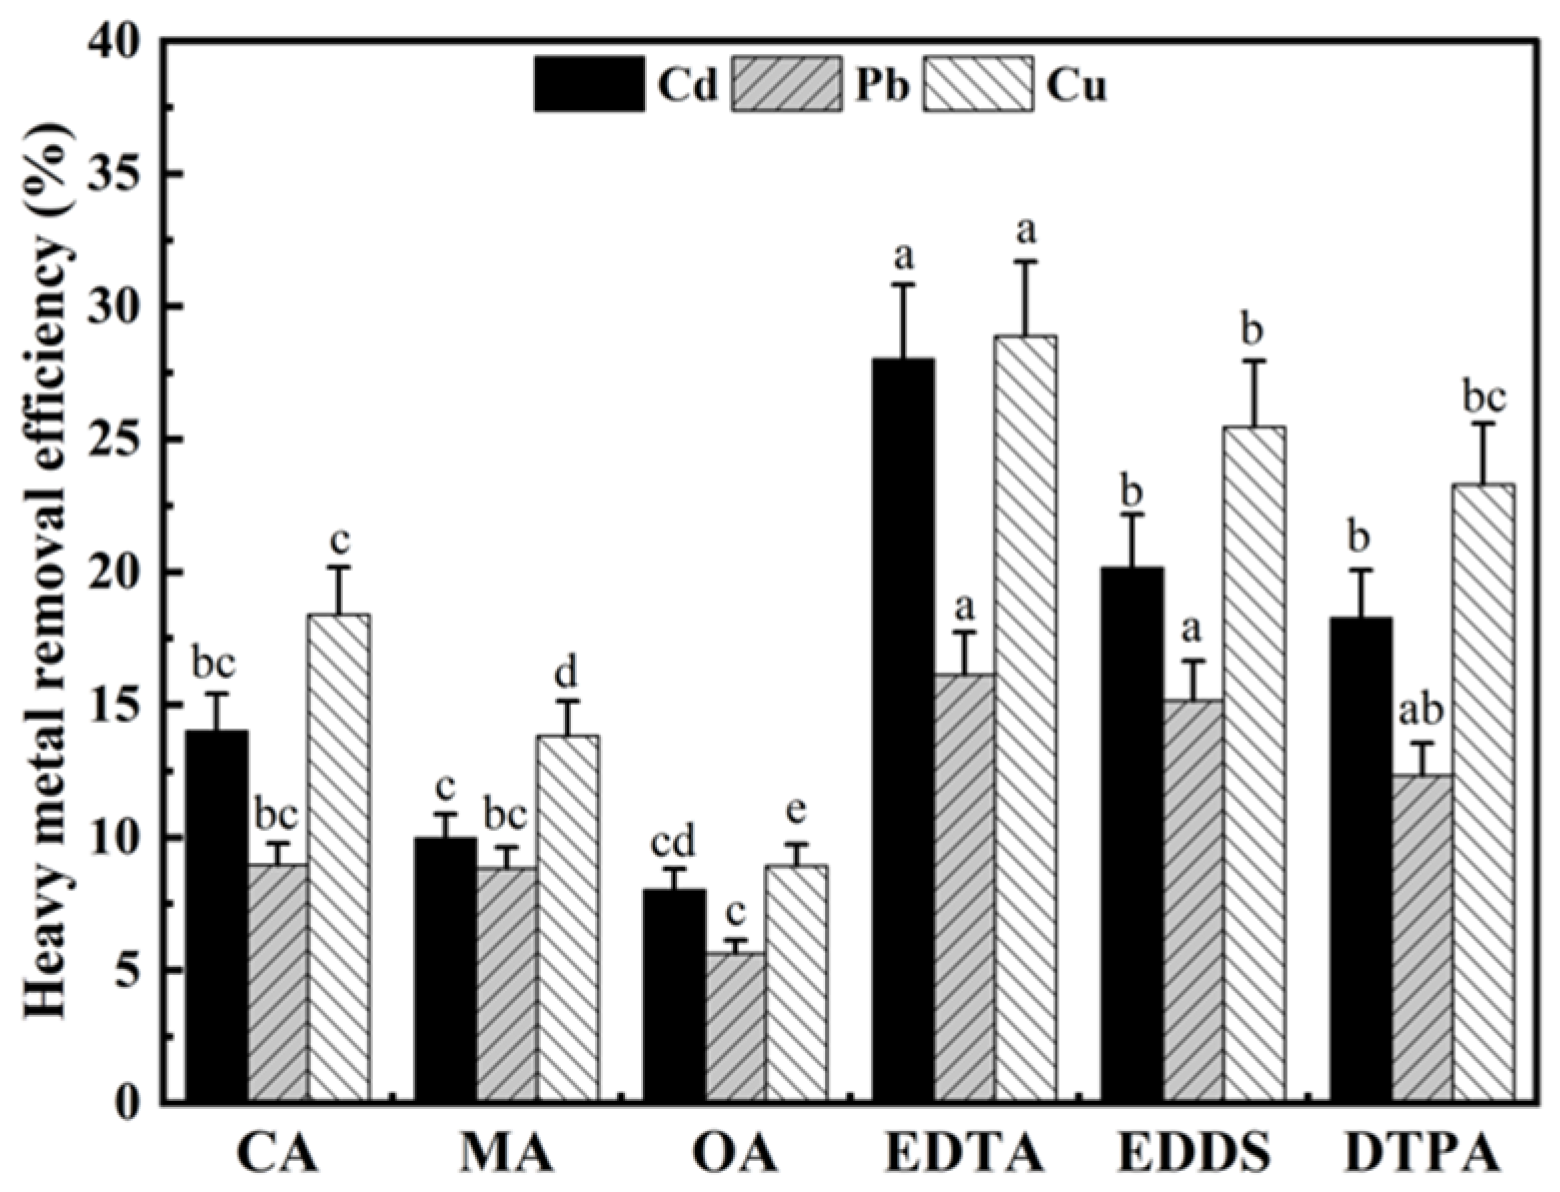
Under the optimal leaching conditions (70 mmol/L, pH 5.0, 100 min), different leaching agents exhibited significant differences in their removal efficiencies for Cd, Pb, and Cu from contaminated soil (
Figure 5). EDTA exhibited the strongest chelating capacity, with removal rates for Cd, Pb, and Cu of 28.02%, 16.12%, and 28.88%, respectively. The removal efficiencies of DTPA and EDDS were similar, at approximately 70–80% of those of EDTA.
Among the three biodegradable organic acids, CA exhibited the highest removal efficiencies for Cd, Pb, and Cu, followed by MA, while OA showed the lowest efficiencies. Compared with EDTA, the removal efficiencies of CA for Cd and Cu were approximately 50% and 64% of EDTA’s, respectively. However, the removal efficiency for Pb was significantly lower, at only 56% of EDTA’s. Overall, the removal efficiencies of biodegradable organic acids were lower than those of traditional chelating agents, but the gap for Cd and Cu was relatively smaller for CA.
Even under optimal conditions, removal rates for Cd, Pb, and Cu remained below 20% (
Figure 5). Therefore, for heavily contaminated soils, multi-step or combined approaches are needed. Still, CA, MA, and OA, though less efficient than EDTA, are biodegradable, low in ecotoxicity, and environmentally compatible. They are affordable and widely available, making them promising candidates for soil remediation.
3.5. Effects of Extraction Treatment on Mineral Element Content in Soil
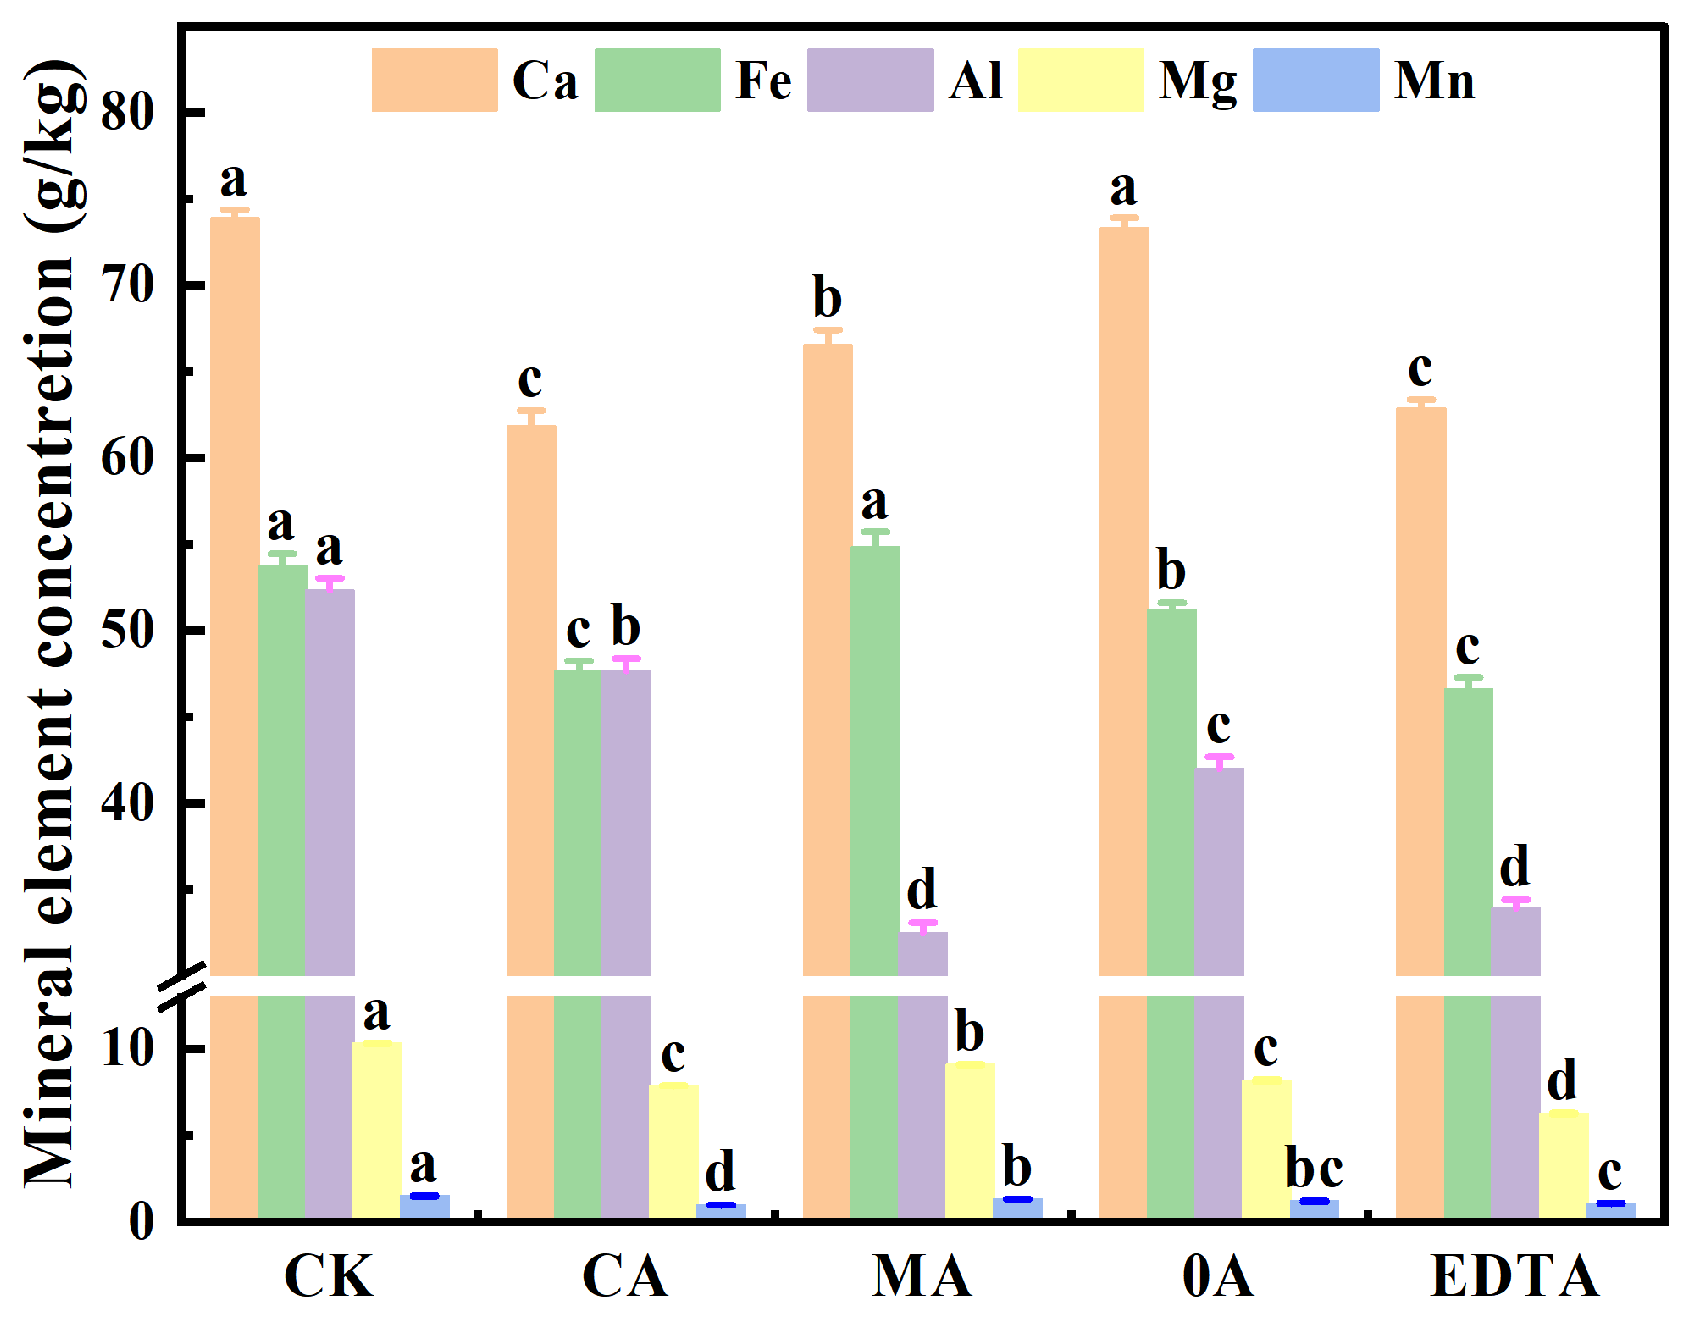
During the leaching process, while biodegradable organic acids complex with target heavy metals, they also competitively complex with major mineral nutrients in the soil, such as Ca, Fe, Mg, and Mn, leading to their simultaneous leaching.
Figure 9 shows the changes in soil Ca, Fe, Al, Mg, and Mn concentrations after leaching with EDTA and biodegradable organic acids under optimal conditions. After CA leaching, calcium decreased by 16.30%, iron by 12.35%, aluminum by 8.90%, magnesium by 23.75%, and manganese by 34.89%.
Citric acid, malic acid, and oxalic acid leach iron and manganese oxides, as well as carbonate-bound Cd, Pb, and Cu. They also leach substantial amounts of Ca, Fe, Mg, and Mn, plus trace Al, from the soil. Compared with EDTA, although the residual concentrations of Ca, Fe, Al, Mg, and Mn in the soil decreased to varying degrees after leaching with CA, MA, and OA, the extent of the decrease was significantly smaller than that observed with EDTA. Further analysis indicates that after leaching, there was little difference in the residual Fe and Al content among the three biodegradable organic acids treatments. However, CA exhibited a higher leaching effect on Ca and Mg than MA and OA, which may be related to differences in the complexation constants of the different organic acids for alkaline earth metal ions.
3.6. Effects of Extraction Treatment on Soil Fertility and Chemical Properties
The effects of the remediation treatments on soil physicochemical properties were evaluated by measuring pH, EC, CEC, organic matter, and nutrients before and after remediation (
Table 1).
Following treatment with a single organic acid leaching agent, soil pH generally showed a downward trend, with the magnitude of the pH decrease directly influenced by the type of leaching agent. Among the leaching agents tested, the EDTA treatment group exhibited the most significant decrease in soil pH, while the pH decreases in the CA, MA, and OA treatment groups were relatively milder. Soil EC decreased significantly (p < 0.05) after single leaching. After leaching with CA, MA, OA, and EDTA, soil EC decreased from 271 μS/cm in the control (CK) to 255, 243, 235, and 205 μS/cm, respectively. CEC also decreased after single leaching. The soil CEC after leaching with CA, MA, OA, and EDTA decreased from 6.71 cmol/kg in CK to 5.92, 4.57, 4.30, and 4.13 cmol/kg, respectively, with the extent of reduction depending on the type of leaching agent.
4. Discussion
The optimal extraction conditions obtained in this study (70 mmol/L, pH 5.0, 100 min,
Table 4) are generally consistent with earlier reports on organic acid washing of heavy metals [
34,
35]. Organic acids can form soluble complexes with heavy metal ions through their carboxyl and hydroxyl groups [
36]. However, in alkaline soils (pH 8.2,
Table 1), the deprotonation of organic acids is suppressed, lowering their complexing ability. Moreover, the tested soil contained abundant competing cations (Ca
2+, Mg
2+, Fe
3+, Fe
2+) that compete for limited chelation sites [
37,
38]. Therefore, the extraction agent concentration must exceed the total molar concentration of target metals to provide sufficient driving force for metal desorption [
39], which conforms to the well-established stoichiometric principle [
35]. Even so, the removal rates for Cd, Pb and Cu remained below 20% under the optimized conditions (
Table 4). This low efficiency is not a failure of the organic acids as chelators, but rather reflects two intrinsic constraints of the experimental system. Increasing the organic acid concentration beyond the plateau (
Figure 1) yields only marginal gains in removal efficiency (less than a 5% increase from 50 to 100 mmol/L) while significantly increasing reagent consumption, nutrient loss (
Table 1), and the burden of leachate treatment. Therefore, for practical applications, it is not recommended to exceed the optimal concentration of 70 mmol/L identified by RSM.
First, a large proportion of the metals in the alkaline soil were present in relatively stable forms (carbonate-bound and residual fractions) that are not readily extracted by a single mild washing step. The sequential extraction results (
Figure 7) showed that before washing, carbonate-bound Pb and Cu accounted for 41.99% and 27.51%, respectively, and residual fractions were also substantial (e.g., residual Cu 31.53%). Organic acids mainly attack water-soluble, exchangeable and Fe-Mn oxide-bound metals [
40]. Once these labile pools are leached, further increasing the organic acid concentration adds little to the total removal (
Figure 1). This plateau effect is consistent with the observations of Jiang et al. [
41] for Cu, Zn, and Cr up to 200 mmol/L. The presence of tightly bound forms thus sets an upper limit for a single-pass extraction.
Second, competitive complexation by non-target cations (Ca
2+, Mg
2+, Fe
3+) consumes a substantial part of the added organic acid. Based on the soil composition (
Table 1), the total concentration of competing cations was about 45.6 mmol/kg based on the exchangeable Ca, Mg, and Fe contents (
Table 1), almost six times that of the target metals (7.6 mmol/kg). At 50 mmol/L organic acid, the molar ratio of eluent to total cations was only 1.1:1, which inevitably leads to strong competition and reduces the efficiency for Cd, Pb and Cu [
38,
42]. This explains why the removal plateaued beyond 50 mmol/L (
Figure 1) and highlights the need to optimize dosage in cation-rich alkaline soils.
The tested soil is alkaline (pH 8.2,
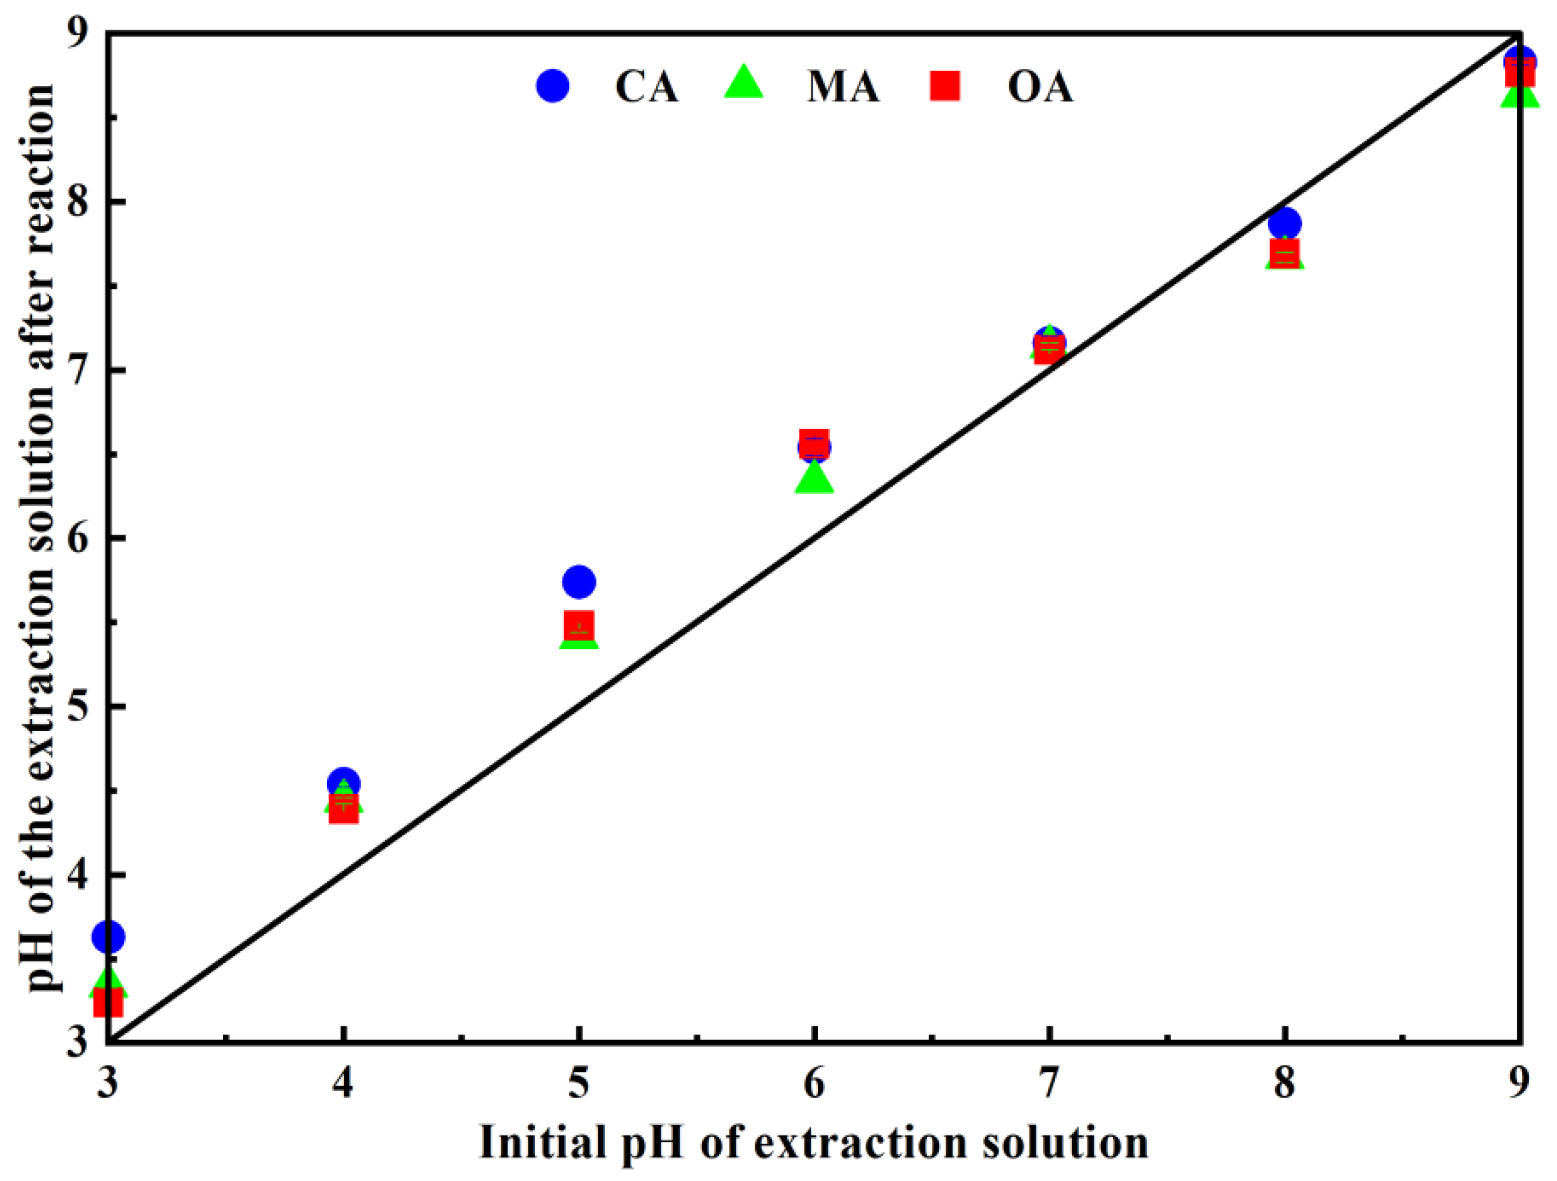
Table 1) and contains significant carbonate minerals (based on the carbonate-bound fraction in sequential extraction). The buffering capacity observed in
Figure 10 is primarily attributed to carbonate dissolution, which neutralizes added H
+. Exchangeable base saturation (Ca
2+, Mg
2+) also contributes to buffering via cation exchange. These pathways collectively suppress the deprotonation of organic acids, reducing their complexing ability.
Leachate pH is another critical factor. The removal efficiency peaked at pH 3.0 and then decreased sharply between pH 3 and 5, gradually declined from pH 5 to 7, and stabilized above pH 7 (
Figure 2). Above pH 7, the removal efficiency stabilizes because most metal ions have already precipitated as hydroxides, and further pH increase does not significantly affect the already low metal concentration in solution. This pH dependence is attributed to two concurrent mechanisms. At low pH, high H
+ concentration promotes metal desorption through ion exchange and dissolution of oxide/hydroxide-bound metals [
42]. As the pH increases, metal ions undergo hydrolysis, forming hydroxyl complexes (e.g., MeOH
+) and precipitates, which reduces the concentration of free metal ions available for complexation with organic acids. Simultaneously, the increasing negative charge on soil particle surfaces enhances metal adsorption, collectively lowering the removal efficiency. In practice, the waste solution pH rebounded due to soil buffering (
Figure 10). To balance removal efficiency and soil protection, an initial pH of 4.0–6.0 is recommended. This range also avoids excessive dissolution of soil minerals and nutrient losses that could occur at very low pH. The pH of the waste solution was measured after each extraction; the relationship between the initial pH of the eluent and the final pH of the waste solution is shown in
Figure 10.
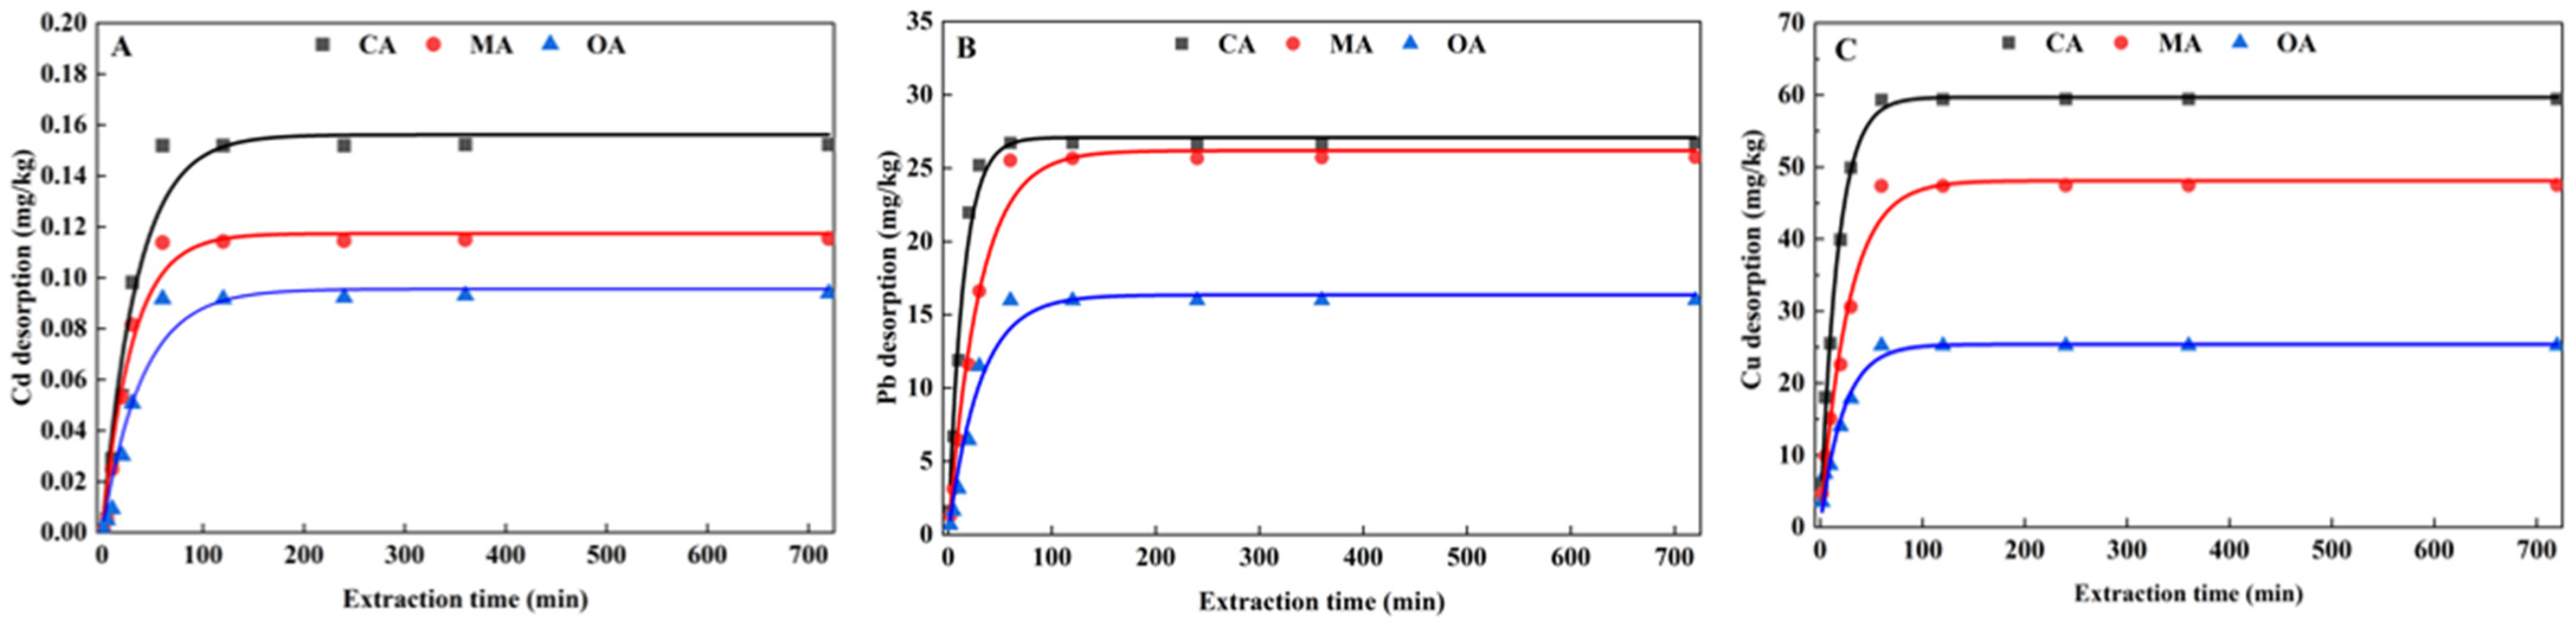
The extraction process was best described by pseudo-first-order kinetics (
Table 7 and
Figure 11, highest
R2 and lowest
RMSE for all metals), which confirmed a diffusion-limited desorption mechanism. Two stages were evident in
Figure 3 and
Figure 11: a rapid initial phase (2–120 min) during which organic acids removed water-soluble, exchangeable and weakly bound metals, and a much slower phase (>120 min) that involved the release of more tightly bound metals [
14,
43]. The good agreement between the pseudo-first-order predicted
qe and the experimental
qe (
Table 8) further supports this interpretation. However, for practical applications, extending the contact time beyond 120 min yields only minor gains in removal efficiency (
Figure 3) and would not be cost-effective.
Among the organic acids tested, CA performed better than MA and OA but was less effective than EDTA, EDDS or DTPA (
Figure 5). The higher efficiency of CA is attributable to its three carboxyl groups, which provide more ligand sites and higher complexation constants for Cd, Pb, and Cu (
Table S1) [
44,
45]. Nevertheless, even the best organic acid (CA) achieved only ~50% of the Cd removal and ~64% of the Cu removal of EDTA, and the Pb removal was only 56% of that of EDTA. These values are modest, but the trade-off is that CA, MA, and OA are biodegradable, low in ecotoxicity, and cause much less nutrient loss (
Table 1,
Figure 9) [
33]. The decreases in CEC (25–38%) and total N (15–34%) after organic acid washing were comparable to those after EDTA or EDDS washing [
33], but the loss of Ca, Mg, and K was significantly smaller for the organic acids (
Figure 9). Therefore, for the reuse of the remediated soil in agriculture, the green organic acids are clearly superior.
The low absolute removal efficiencies (<20%) have important practical implications. For moderately contaminated agricultural soils (e.g., where the total metal concentrations are only slightly above the regulatory thresholds), a single pass with CA may already bring the total metal levels below the acceptable limits while preserving soil fertility. For example, the Cd content after CA washing decreased from 1.20 to 1.03 mg/kg (
Table 1), which is still above the Chinese risk screening value for Cd (0.80 mg/kg), but Pb and Cu approached safer levels. For more heavily contaminated soils, single-pass washing is not sufficient. In such cases, the method should be used as a pre-treatment before phytoremediation or as part of a combined remediation strategy.
Possible improvements include: (i) sequential washing with two or three cycles of the same organic acid, which could cumulatively remove >40% of total Cd and Cu, albeit with higher water and reagent consumption [
14]; (ii) combining organic acid washing with stabilization amendments (e.g., biochar) to immobilize the remaining labile metals; and (iii) integrating the method with electrokinetic extraction for soils with low permeability. A full life-cycle assessment would be needed to judge the environmental trade-offs of such multi-step approaches [
46].
5. Conclusions
CA, MA, and OA concentrations, solution pH, and extraction time all significantly affect Cd, Pb, and Cu removal. Using Box–Behnken RSM, the optimal conditions were identified as 70 mmol/L, pH 5.0, and 100 min. Sequential fractionation showed that the three acids preferentially target bioavailable metal forms (water-soluble, exchangeable, carbonate-bound), thereby lowering the soil’s potential ecological risk. Compared with EDTA, CA, MA, and OA caused less disturbance to soil organic matter, nitrogen, and exchangeable cations, thus better preserving soil fertility.
In summary, the low single-pass extraction efficiency is an inherent consequence of the strong binding of metals in alkaline soil and the competition from abundant cations. It does not invalidate the use of biodegradable organic acids. Instead, it defines the appropriate application niche: as a green, low-impact pre-treatment for moderately contaminated agricultural land, or as a first step in a combined remediation train for more severe pollution. Future work should focus on field-scale validation, the optimization of multi-step washing, and the coupling of organic acid leaching with biochar stabilization or microbial immobilization to achieve both efficient removal and long-term safety.