Article

Life Cycle Assessment of Black Soldier Fly Technology for Sustainable Manure Management in Jing-Jin-Ji: Balancing Feed Protein Production and Carbon Mitigation

1
College of Agriculture, Hebei Agricultural University, 2596 Lekai South Street, Lianchi District, Baoding 071000, China
2
School of the Environment, Nanjing University, Nanjing 210023, China
3
College of Food Science and Biology, Hebei University of Science and Technology, 26 Yuxiang Street, Shijiazhuang 050018, China
4
Hebei Provincial Animal Husbandry Station, Shijiazhuang 050000, China
5
Center for Agricultural Resources Research, Institute of Genetics and Developmental Biology, Chinese Academy of Sciences, 286 Huaizhong Road, Shijiazhuang 050021, China
6
College of Land and Resources, Hebei Agricultural University, 2596 Lekai South Street, Lianchi District, Baoding 071000, China
*
Author to whom correspondence should be addressed.
Agriculture 2026, 16(11), 1177; https://doi.org/10.3390/agriculture16111177
Submission received: 19 April 2026 / Revised: 19 May 2026 / Accepted: 23 May 2026 / Published: 27 May 2026

Abstract

The Jing-Jin-Ji region in China has highly intensive agriculture but faces challenges of feed protein shortage and manure surplus, threatening environmental sustainability and industrial development. The black soldier fly (Hermetia illucens) is a promising sustainable feed protein source, capable of efficiently converting organic waste into high-quality insect protein to alleviate feed scarcity while mitigating waste pollution. Existing research on black soldier fly (BSF) treatment in this area is limited, lacking comprehensive benefit evaluations. This study, conducted in Hebei Province, integrated sub-county-scale manure resource mapping, life cycle assessment, and economic assessment to compare traditional composting with BSF-based manure management. Results show BSF treatment can produce 0.36 to 0.39 teragrams (Tg) of feed protein per year. Compared with conventional composting, BSF treatment reduced direct manure-treatment emissions, while additional mitigation benefits were obtained through feed-protein substitution, fertilizer substitution, and BECCS-related land-use savings. Overall, the BSF scenarios achieved a total GHG mitigation potential of 2.85–6.19 Tg CO2eq yr−1. Economically, low-technology BSF production is cost-competitive, with a total cost of $121 for treating 1 ton of fresh chicken manure. With its protein output roughly doubling the local soybean production capacity, BSF technology provides a viable, low-carbon solution to the dual challenges of feed security and waste management in intensive agricultural systems.

1. Introduction

The Jing-Jin-Ji region in China has highly intensive agriculture, with Beijing and Tianjin accounting for a significant share of the region’s poultry production and manure generation, while facing challenges of feed protein shortage and manure surplus, threatening environmental sustainability and industrial development. Hebei province, situated at the core of the Jing-Jin-Ji region, is a linchpin in China’s agricultural landscape, characterized by vast arable land and a robust livestock industry that underpin national food security [1]. In 2021, the province ranked among the nation’s top poultry producers, churning out substantial quantities of chicken meat and eggs—a testament to its role in sustaining the region’s food supply [2]. However, its unique geographical proximity to Beijing and Tianjin, combined with temperate climate conditions, has fostered a high-density poultry-farming environment that amplifies two critical challenges plaguing the entire Jing-Jin-Ji area: a stark imbalance between crop and livestock production, a heavy dependence on imported feed protein that exposes the sector to supply instability, and the resultant dual crises of feed protein shortage and manure surplus [3,4,5].
This imbalance is manifested in a severe decoupling of crop and livestock sectors. Hebei’s large-scale poultry farms alone generated 22 teragrams (Tg) of chicken manure (fresh weight) in 2021—an enormous volume that, unlike in regions with integrated agri-livestock systems, cannot be efficiently recycled into local croplands due to spatial and logistical disconnects. The consequence is twofold: On one hand, improper manure disposal leads to severe ecological degradation, water and soil pollution, and potential public health risks, with nitrogen and phosphorus runoff contaminating water bodies and soils across the Jing-Jin-Ji region; pathogen proliferation and odor nuisance further threaten environmental quality and human well-being. On the other hand, it represents a squandered opportunity to close the nutrient loop between livestock waste and crop fertilization. Concurrently, Hebei’s livestock industry struggles with a dearth of locally sourced protein-rich feeds, relying heavily on imported soybeans and other commodities [6,7]. Feed represents the largest cost component in poultry production, generally accounting for 65–70% of total production costs, while protein feed ingredients such as soybean meal are among the most expensive components and remain highly dependent on external supply [8,9]. This not only burdens producers with high costs but also renders the entire Jing-Jin-Ji livestock supply chain vulnerable to international market volatility, underscoring the region’s systemic dependence on external protein inputs.
Against this backdrop, the black soldier fly (Hermetia illucens L., BSF) emerges as a transformative solution tailored to Hebei’s role in perpetuating these regional challenges. As a saprophagous insect, BSF thrives in warm, humid environments rich in organic waste, poses no risk to humans or livestock, and does not transmit diseases. With high fecundity, a single female can lay over 500 eggs under favorable conditions, enabling rapid population growth. BSF larvae thrive on chicken manure, converting it into two valuable outputs: protein-rich insect biomass that can substitute imported feeds, and nutrient-dense frass that serves as organic fertilizer for local crops. Although recycling chicken manure as organic fertilizer is not new, BSF-based treatment goes beyond conventional manure recycling by producing both alternative feed protein and frass fertilizer, thereby linking manure management with feed substitution and greenhouse gas mitigation. The life cycle assessment (LCA) approach has been widely used in black soldier fly research to assess its environmental impacts at different life cycle stages, including resource consumption, greenhouse gas emissions, and protein replacement potential [10,11]. By integrating BSF treatment into Hebei’s poultry waste management, the technology has the potential to bridge the crop–livestock divide, transforming a regional liability—manure surplus—into an asset that addresses both feed insecurity and environmental contamination [12,13,14]. Specifically, BSF larvae reared on poultry manure produce biomass containing 40–60% crude protein, a level comparable to conventional soybean meal, offering a scientifically validated alternative feed source for the livestock industry.
Yet, while BSF shows promise in laboratory and small-scale settings, its large-scale application in Hebei’s complex agricultural ecosystem remains under-researched [15]. Recent BSF-LCA studies have evaluated insect-based feed production and agro-waste treatment at experimental or process scales, comparing BSF protein with soybean meal or fishmeal and BSF composting with conventional waste-treatment routes [16]. Unlike previous studies that mainly focused on laboratory-scale bioconversion experiments, nutrient composition analysis, or single-farm evaluations, this study integrates sub-county-scale manure resource mapping with life cycle assessment and economic assessment to evaluate the regional environmental, feed-protein, and cost implications of BSF-based chicken manure management [17]. Gaps persist in optimizing BSF breeding under local climatic conditions and assessing the economic viability of scaling up this technology within the Jing-Jin-Ji region’s industrial and policy framework. This study aims to evaluate the environmental and economic feasibility of BSF-based chicken manure management in Hebei Province. Specifically, we aim to: (1) quantify county-level chicken manure generation and treatment pathways; (2) estimate BSF-derived feed protein and frass production; (3) compare GHG emissions between conventional composting and BSF-based treatment scenarios; and (4) assess the economic costs and benefits of different manure management pathways.

2. Materials and Methods

The methodological framework consisted of five main steps. First, county-level poultry production, farm-scale distribution, and manure generation were quantified for Hebei Province in 2021. Second, BAU and BSF-based manure management scenarios were defined according to current composting practices and alternative BSF rearing systems. Third, life cycle assessment was used to calculate direct manure-treatment emissions and product-substitution benefits under each scenario. Fourth, BSF-derived product outputs, including insect protein and frass, were estimated using a mass-balance approach. Finally, the economic costs and benefits of conventional composting and BSF-based treatment pathways were assessed.

2.1. Study Region and Data Collection

This study focuses on layer and broiler chicken farms in Hebei Province, situated within the Jing-Jin-Ji region, to evaluate the environmental and economic performance of chicken manure management under different treatment scenarios in 2021. Data were systematically collected from multiple sources to ensure regional representativeness and analytical rigor. Annual agricultural and livestock data (e.g., number of farms, poultry inventory, manure treatment methods) were obtained from the Hebei Provincial Agricultural and Rural Statistical Yearbook (2022) and China Animal Husbandry and Veterinary Statistics Yearbook, disaggregated at the county level to capture spatial heterogeneity. Operational data from large-scale farms (defined as ≥10,000 layer birds or ≥50,000 broiler slaughterings annually) were sourced from the national livestock industry information platform, which detailed manure generation quantities and current treatment technologies (e.g., static composting, reactor composting). Parameters for black soldier fly (BSF) bioconversion, including feed conversion ratio (FCR), larval moisture content, and frass nutrient composition, were derived from experimental studies (Table A1) and validated against international datasets [18,19].
Based on these data sources, poultry farms were further grouped into large-, medium-, and small-scale systems according to China Animal Husbandry Statistics. Because county-level farm-scale data were incomplete, the proportion of large-scale poultry production in each county was estimated using a regression-based approach and then corrected to match the observed provincial total. Annual chicken manure production was calculated by multiplying poultry numbers, feeding duration, and manure excretion coefficients. Because farm-specific feed formulations were unavailable, manure composition parameters were assumed to represent conventional corn–soybean meal-based poultry diets commonly used in commercial layer and broiler production. The C/N ratio is closely related to manure composition, nitrogen transformation, and biological treatment performance; it was considered an important manure-quality factor in this study. However, farm-specific C/N measurements were not available at the regional scale. Therefore, the influence of C/N ratio was represented indirectly using literature-derived manure composition, nitrogen-loss parameters, composting emission factors, and BSF bioconversion parameters. These data and assumptions were used as inputs for the subsequent LCA, product-output estimation, and cost–benefit analysis. Detailed calculation procedures, correction methods, manure excretion coefficients, BSF bioconversion parameters, composting emission factors, and life cycle inventory data are provided in Appendix A.
GHG calculations followed an IPCC-based manure management framework. Technology-specific and regional parameters, such as composting N2O emission factors, were adjusted using the peer-reviewed literature where appropriate [20]. The life cycle inventory data were obtained from the built-in databases of SimaPro 9.0, including Ecoinvent and Agri-footprint. Transportation emissions were excluded due to inconsistent regional logistics data and because this study focused on farm-gate manure treatment and on-farm BSF bioconversion processes.

2.2. Scenario Definition and System Boundaries

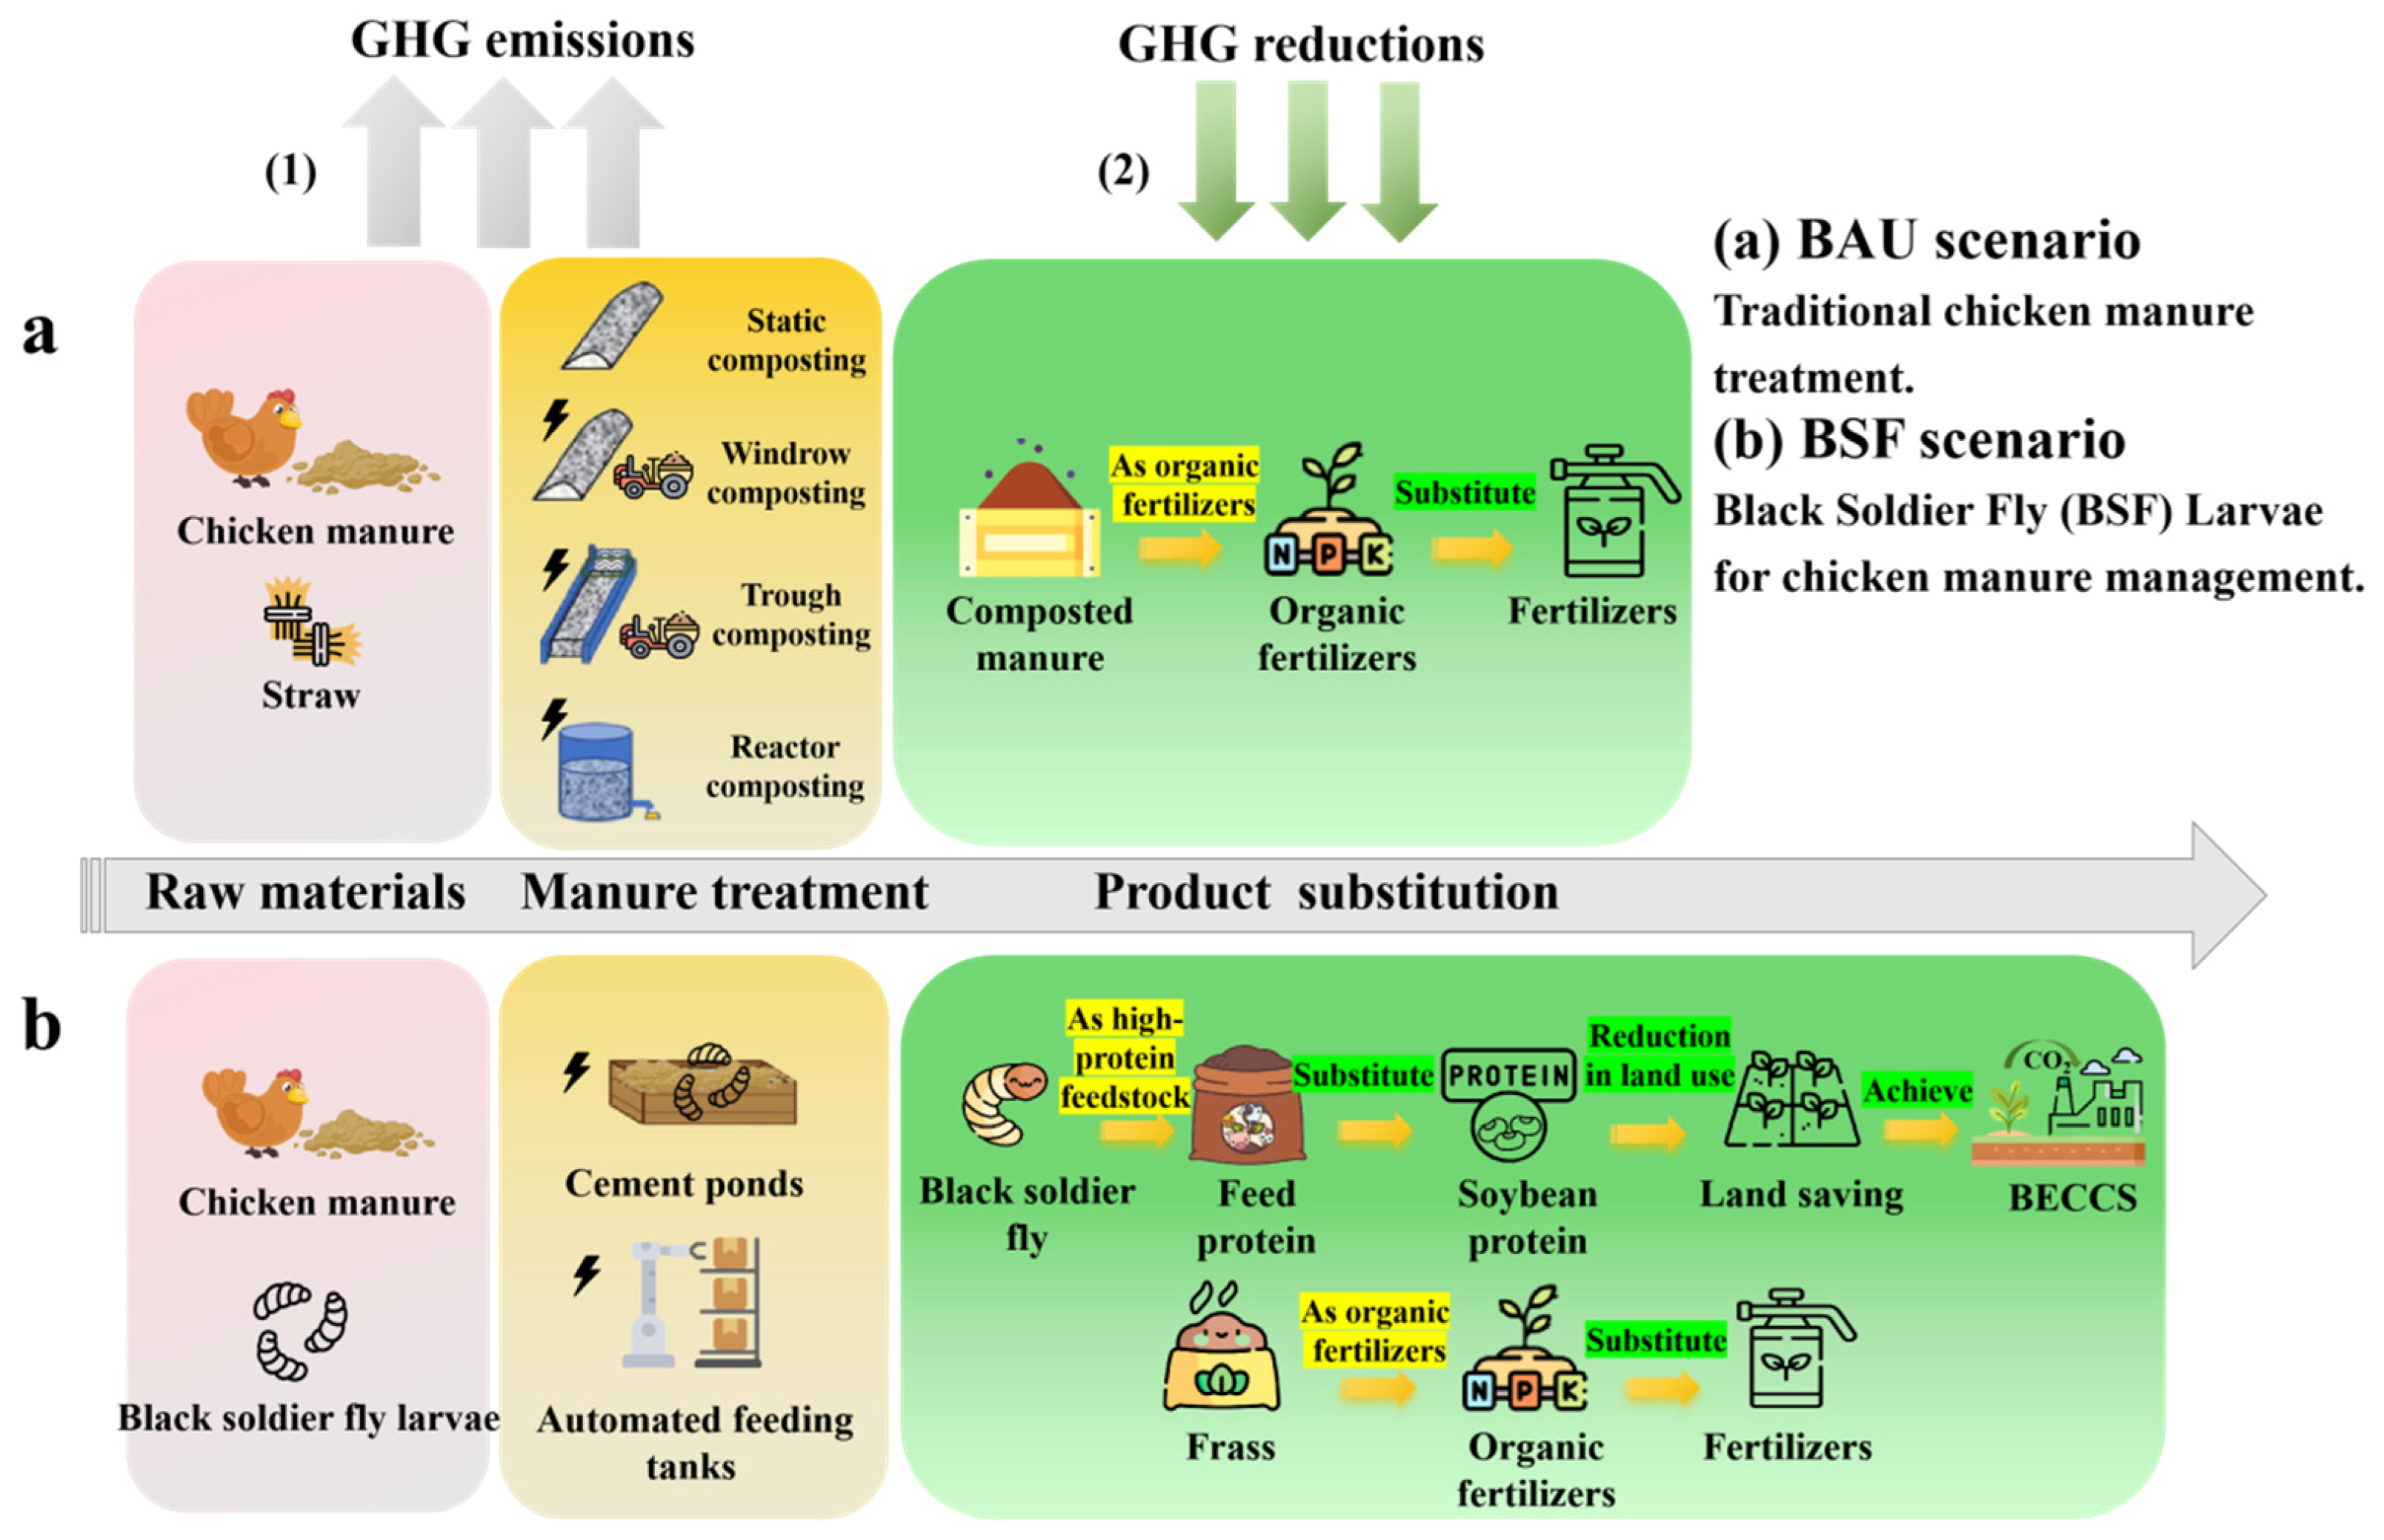
To ensure comparability, the BAU and BSF scenarios were defined under consistent system boundaries, including manure treatment processes and product-substitution benefits generated by each treatment pathway. Construction-related GHG emissions from treatment infrastructure and equipment, including composting facilities, cement ponds, and automated BSF rearing tanks, were also included in the life cycle boundary and quantified using material inventory data provided in Appendix A. Two contrasting scenarios were constructed to compare conventional practices with BSF-based innovation (Figure 1).

2.2.1. Business-As-Usual (BAU) Scenario

BAU scenario reflects the current practices of chicken manure management in Hebei. We distinguished in detail the differences across farm scales, between layer and broiler production, and among various manure management (Table A3, Table A4, Table A5 and Table A6). In Hebei, we differentiated manure treatment ways, including static composting (SC), windrow composting (WC), trough composting (TC), and reactor composting (RC). The distribution of manure treated by each pathway was derived from farm-scale manure management statistics and county-level poultry production data, with detailed calculation procedures and pathway-specific manure amounts provided in Appendix A. Static composting was treated as an open or semi-open system with limited mechanical aeration and turning. Windrow composting was considered a semi-open system with periodic turning and aeration. Trough composting was treated as a semi-enclosed system with structured composting channels, periodic turning, and aeration. Reactor composting was considered an enclosed and mechanically aerated system. Because this study conducted a regional-scale LCA based on statistical data rather than on-site composting process monitoring, farm-specific temperature and humidity data were not available. Therefore, the effects of composting conditions were represented using technology-specific emission factors and literature-based composting parameters following the IPCC-based manure management calculation framework.
Within the system boundaries of these traditional manure treatment, both GHG emission sources and indirect GHG reductions resulting from organic fertilizer substitution for chemical fertilizers were considered (Figure 1a). Specifically, emission sources include: GHG emissions from equipment construction (e.g., concrete pits for static composting), energy use (ventilation, machinery), and biological processes (CH4 from anaerobic pockets, N2O from nitrogen transformations, and indirect N2O via NH3 volatilization). Offset mechanisms include: emission reductions from substituting synthetic NPK fertilizers with composted manure (1:1 nutrient replacement ratio, based on local soil testing data).

2.2.2. Black Soldier Fly (BSF) Scenario

In the BSF scenario, chicken manure is used to rear BSF, converting chicken manure into insect biomass and frass. The system boundary includes three main stages: BSF larval hatching, chicken manure bioconversion, and product substitution (Figure 1).
Two technological pathways were designed according to the BSF rearing systems applied in the manure bioconversion stage: BSF-A adopts a low-input way, using traditional cement ponds with manual operation. This system requires minimal capital investment and has a longer larval processing cycle (14-day larval cycle). BSF-B represents a high-input alternative. It employs automated breeding tanks with controlled temperature and humidity. This system enables shorter larval cycles (12-day cycle) and improves resource efficiency. We considered the applicability of BSF systems for farms of different scales. Therefore, we developed scenarios in which farms of varying sizes adopt different BSF rearing systems. Details are provided in Appendix A.
In the product-substitution stage, BSF-derived protein meal was assumed to replace conventional soybean protein on a protein-equivalent basis, following previous studies on insect protein substitution and mini-livestock production in China [21,22]. BSF frass was assumed to substitute synthetic NPK fertilizers according to its nutrient-equivalent N, P, and K contents. Accordingly, two avoided-burden credits were included in the BSF scenario. First, the land theoretically saved from local soybean protein production was assumed to be reallocated to bioenergy production with carbon capture and storage (BECCS), representing a scenario-based carbon removal pathway rather than a guaranteed land-use outcome [23]. Second, avoided GHG emissions from synthetic NPK fertilizer production due to frass substitution were credited to the system.
To test the influence of land-use assumptions, an additional no-BECCS scenario was included, in which BSF-derived protein was still assumed to substitute soybean protein, but the theoretically saved cropland was not credited with BECCS-related carbon removal. This scenario was used to distinguish mitigation from manure treatment and product substitution from the additional land-based carbon mitigation benefit.

2.3. Manure Production

The chicken manure production (Q) was calculated as the product of feeding volume (N), feeding period (T, days), and the excretion coefficient (P). The detail calculation formula can be referred to Wang et al. (2006) [24].
Q i , j = N i , j × T j × P j
where Q: annual manure production; N: feeding volume (number of chickens); T: feeding period (days); P: excretion coefficient (Table A5); i: the county of Hebei province; and j: the type of chicken (layer and broiler). Equation (1) was used to calculate chicken manure production from poultry numbers, feeding duration, and daily excretion coefficients, following Wang et al. [24].

2.4. GHG Emissions Calculation

GHG emissions from manure management were calculated following the 2006 IPCC Guidelines for National Greenhouse Gas Inventories and the 2019 Refinement to the 2006 IPCC Guidelines [25,26], which provide methods for estimating CH4 and N2O emissions from livestock manure storage and treatment systems. Construction-related emissions from treatment infrastructure and equipment, energy-related emissions during operation, direct CH4 and N2O emissions from manure treatment, and indirect N2O emissions associated with NH3 volatilization were included in the life cycle GHG calculation. The 100-year global warming potentials of CH4 = 28 and N2O = 265 were adopted from the IPCC Fifth Assessment Report. GHG emissions were calculated for the BAU and BSF scenarios using Equations (2) and (3), respectively.
E B A U N e t = E E q u i p m e n t + E E n e r g y + E P r o c e s s C H 4 + E P r o c e s s N 2 O + E P r o c e s s N H 3 ( I n d i r e c t l y ) E O f
where EBAU-Net: net GHG emissions from chicken manure composting in the BAU scenario, Gg CO2eq year−1; EEquipment: GHG emissions from equipment construction, Gg CO2eq year−1; EEnergy: GHG emissions from energy consumption, Gg CO2eq year−1; EProcess-CH4: CH4 emissions from treatment processes, Gg CO2eq year−1; EProcess-N2O: N2O emissions from treatment processes, Gg CO2eq year−1; EProcess-NH3: NH3 (indirect) emissions from treatment processes, Gg CO2eq year−1; Eof: the GHG reductions from chicken manure compost products as organic fertilizers replacing chemical synthetic N, P, K fertilizers, Gg CO2eq year−1; and detailed parameters and calculations can be found in the Appendix A. Equation (2) was adapted from the IPCC manure-management emission accounting framework [25,26].
E B S F N e t = E E q u i p m e n t + E E n e r g y + E P r o c e s s C H 4 + E P r o c e s s N 2 O + E P r o c e s s N H 3 ( I n d i r e c t l y ) E O f E f e e d l a n d
where EBSF-Net: net GHG emissions from chicken manure composting in the BSF scenario, Gg CO2eq year−1; E E q u i p m e n t : GHG emissions from equipment construction, Gg CO2eq year−1; E E n e r g y : GHG emissions from energy consumption, Gg CO2eq year−1; E P r o c e s s C H 4 : CH4 emissions from treatment processes, Gg CO2eq year−1; EProcess-N2O: N2O emissions from treatment processes, Gg CO2eq year−1; E P r o c e s s N H 3 ( I n d i r e c t l y ) : NH3 (indirect) emissions from treatment processes, Gg CO2eq year−1; E O f : the GHG reductions from frass as organic fertilizers replacing chemical synthetic NPK fertilizers, Gg CO2eq year−1; and E f e e d l a n d : GHG reduction from using saved land for BECCS and avoiding soybean production, Gg CO2eq year−1. Detailed parameters and calculations can be found in Appendix A. Equation (3) extended the IPCC-based framework by incorporating BSF product-substitution and BECCS-related mitigation credits [22,23,24,25,26,27].

2.5. Analytical Methods for Cost–Benefit Analysis

In order to assess the potential for the bioconversion of chicken manure by black soldier fly and to evaluate the economic benefits and costs of the treatment process, the methodology and implications of the equations are presented in this section.

2.5.1. Estimation of Product Output

Product outputs from BSF treatment were estimated using a mass-balance approach based on published BSF bioconversion studies. Key parameters, including manure dry matter reduction, frass moisture content, larval moisture content, FCR, and larval crude protein content, were extracted from experimental studies and summarized as mean values in Appendix A (Table A1). The percentage of dry weight reduction of manure was 45.57% and 40.55% for layers and broilers, respectively, and the moisture content of insect sand was 30%, while the moisture content of insects was 75%, and the FCR was 6.43 and 6, respectively. According to (Table A1), we can use Equation (4) to estimate the production of feed protein yield (kg) from fresh chicken manure after its bioconversion by black soldier fly:
P R = W f r e s h   w e i g h t F C R 1 M C P r c
where PR: the production of black soldier fly protein after BSF bioconversion; Wfresh weight: the amount of chicken manure (fresh weight); FCR: feed conversion ratio of black soldier fly; MC: insect moisture content; and Prc: the protein content of BSF. Equation (4) was based on a mass-balance calculation using BSF feed conversion ratio, larval moisture content, and crude protein content [19,28].
Equation (5) was used to estimate the organic fertilizer yield after manure treatment:
O F = W f r e s h   w e i g h t 1 M C ( 1 R )  
where OF: amount of organic fertilizer (dry weight); W: the amount of chicken manure (fresh weight); MC: the moisture content of fresh chicken manure; and R: percentage reduction in dry weight of manure. Equation (5) was based on a mass-balance calculation using manure moisture content and dry matter reduction during BSF bioconversion [28].

2.5.2. Production Cost and Benefit Analysis

Manure treatment will incur costs for equipment construction, electrical energy consumption, composting materials, labor, and other costs. The cost of each manure treatment way consists of fundamental costs and operating costs [27]. Fundamental costs cover land cost, infrastructure investment and equipment cost. Operating costs consist of labor, energy, equipment maintenance, and auxiliary materials. Equipment maintenance is estimated at 3% of the equipment cost [29].
Data on production costs of chicken manure composting equipment in the BAU scenario were obtained [20]. Composted chicken manure can be returned to the field as organic fertilizer in BAU scenario [30]. Therefore, the BAU scenario cost mainly consists of the net cost of the four types of compost minus the benefit of the compost product as an organic fertilizer, with the following formula (Formulas (6) and (7)).
N e t   C o s t B A U = ( i , j , k C o s t l a n d , i , j , k P l a n d + x C o s t i n f r a s t r u c t u r e , x , i , j , k D F x + y C o s t e q u i p m e n t , y , i , j , k D F y + C o s t o p e r a t i n g , i , j , k P r i c e O r g a n i c   f e r t i l i z e r ) Q i , j , k
where Net CostBAU: BAU scenario net cost of manure treatment in Hebei province ($); Costland: the cost of land ($/t dry weight manure); Pland: the land-use period (year); Cost infrastructure: the cost of infrastructure ($/t manure); Q: annual manure production (t); DFx: the depreciation factor; Cost equipment: the cost of equipment ($/t manure); Cost operating: the cost of operating ($/t manure), including: labor, energy, equipment maintenance, and auxiliary materials; Price Organic fertilizer: price of the total amount of organic fertilizer derived from 1 ton of dry chicken manure ($/t manure); i: the county of Hebei province; j: the type of chicken (layer and broiler); k: the different ways of manure treatment (SH, WC, TC, RC); and x: the type of different infrastructure. Infrastructure includes pad construction, drainage and roof construction (excluding RC). y: the type of different equipment; equipment includes composting channel (TC), aeration equipment (WC, TC), turning machine (WC, TC), and composting reactor (RC). Equation (6) was adapted from cost-assessment methods for manure composting systems [20,29].
The BSF scenario mainly involves cement pool (BSF-A) and automated farming tanks (BSF-B). The cement pool data is from practical production research, and detailed information is in (Table A2), where the black soldier fly cement pool bioconversion takes into account the utilization of black soldier fly after chicken manure treatment, and, therefore, drying equipment is needed. The establishment of an automated modular system for organic waste using black soldier fly was performed, and the paper introduced the equipment process and economic benefits in detail [30]. In BSF scenario, the black soldier fly can be used as a substitute for soybean feeds, and the frass produced by the conversion of chicken manure can be used as organic fertilizer. Therefore, the net cost of the BSF scenario is the production cost minus the income from products, which is calculated as follows:
N e t   C o s t B S F = ( i , j C o s t l a n d , i , j , k P l a n d + x C o s t i n f r a s t r u c t u r e , x , i , j D F x + y C o s t e q u i p m e n t , y , i , j D F y + C o s t o p e r a t i n g , i , j P r i c e O r g a n i c   f e r t i l i z e r P r i c e B S F   p r o t e i n ) Q i , j , k
where Net CostBSF: BSF scenario net cost of manure treatment in Hebei province ($); Costland: the cost of land ($/t dry weight manure); Pland: the land-use period (year); Cost infrastructure: the cost of infrastructure ($/t manure); Q: annual manure production (t); DF: the depreciation factor; Cost equipment: the cost of equipment ($/t manure); Cost operating: the cost of operating ($/t manure), including: labor, energy, equipment maintenance, and auxiliary materials; Price Organic fertilizer: price of the total amount of organic fertilizer derived from 1 ton of dry chicken manure ($/t manure); Price BSF protein: total price of BSF protein derived from 1 ton of dry chicken manure ($/t manure); i: the county of Hebei province; j: the type of chicken (layer and broiler); and x: the type of different infrastructure. Infrastructure includes pad construction, drainage and roof construction (For the AU, infrastructure investment, equipment cost, and land cost were aggregated as total fundamental cost). y: the type of different equipment. Equipment includes drying equipment (CP) and automated breeding system equipment (For the AU, drying units, rearing equipment, conveyors, and control components were integrated, and their costs were included as fundamental cost). Equation (7) was adapted from techno-economic assessment methods for BSF-based organic-waste treatment systems [29,31].

2.6. Sensitivity Analysis

To evaluate the robustness of the results, a one-at-a-time sensitivity analysis was conducted for selected technical, environmental, and economic parameters. For the BSF scenarios, the tested parameters included FCR, larval crude protein content, and equipment cost. For the BAU composting scenario, direct GHG emission factors and unit operating costs were tested. Each parameter was varied by ±20% around the baseline value, while all other parameters were kept constant. The effects on BSF-derived protein production, GHG mitigation results, composting emissions, and economic costs were compared with the baseline results. Detailed results are provided in Appendix A.

3. Results

3.1. Chicken Manure Production and Treatment Rate

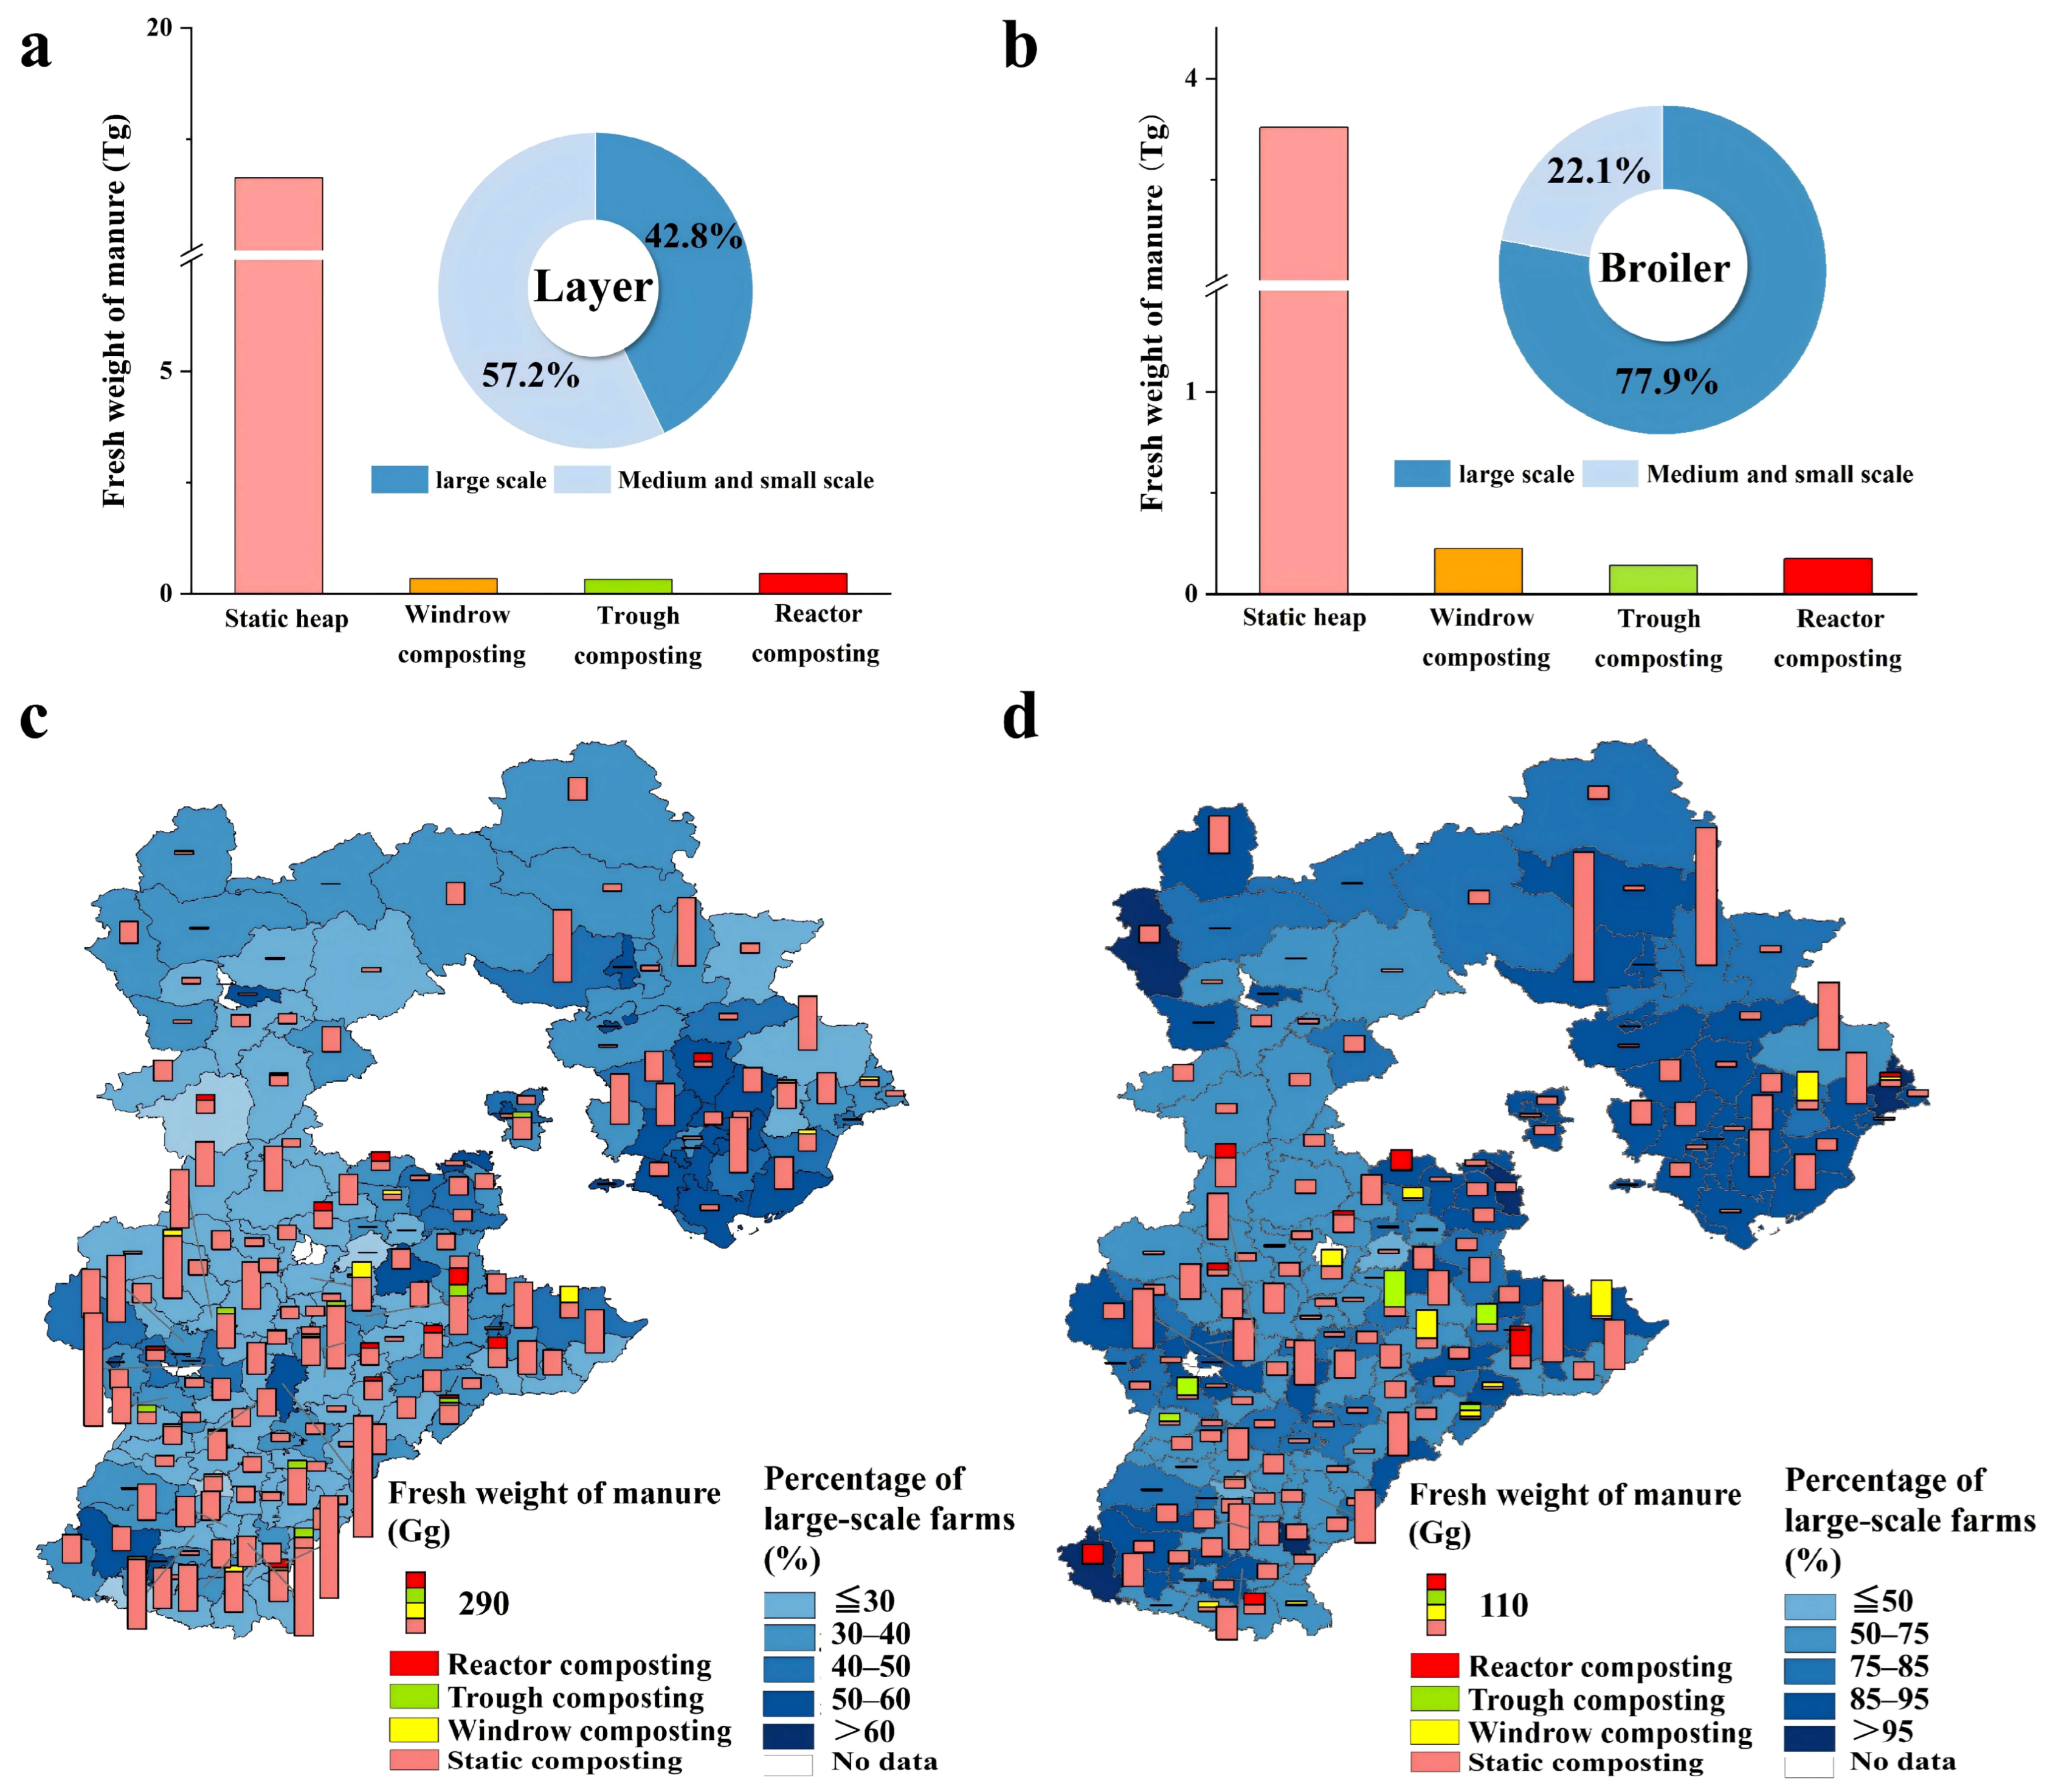
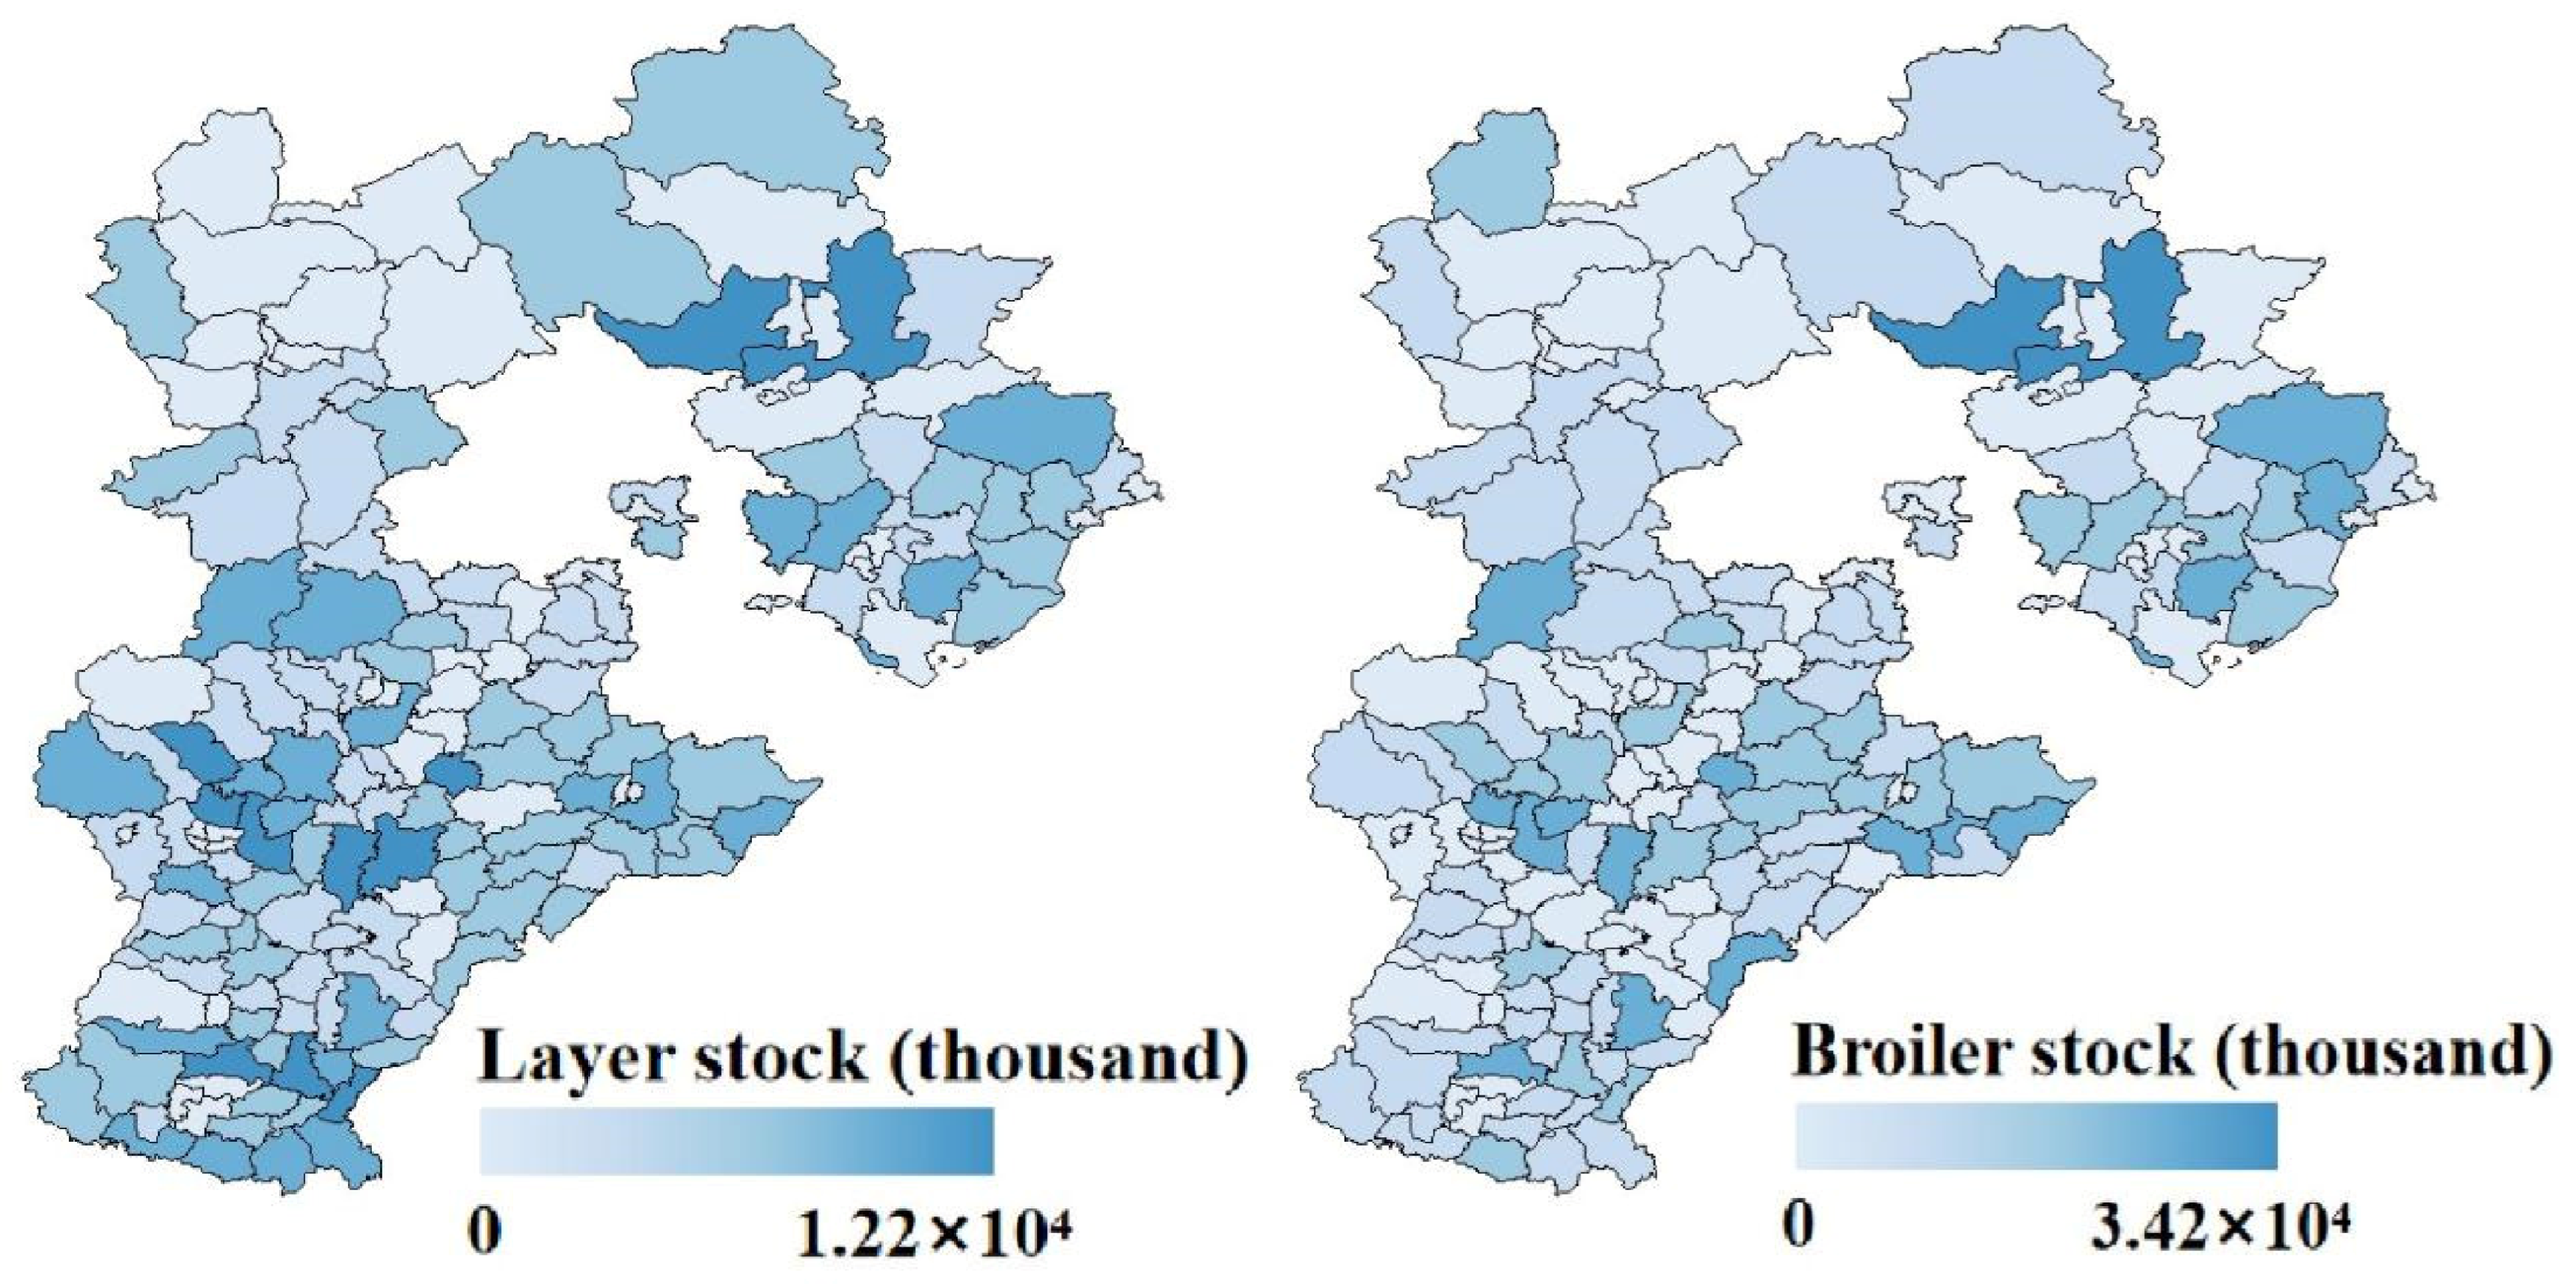
In 2021, the total production of chicken manure in Hebei province reached 22 Tg yr−1 (fresh weight), with layers contributing 81% and broilers contributing 19%. Among the 17.7 Tg yr−1 of layer manure produced, approximately 43% originated from large-scale industrial farms with a stock of over 10,000 birds per farm (Figure 2a). For broiler manure, large-scale farms with an annual slaughter of over 50,000 birds per farm accounted for 78% of the 4.3 Tg produced (Figure 2b). This distribution pattern is consistent with global trends, where large-scale poultry operations are increasingly dominant in manure production [31]. Generally, large-scale chicken farms are more likely to adopt new technologies, such as using black soldier fly to convert chicken manure into insect protein, compared to medium and traditional-scale farms. This is in line with international studies showing that larger farms have greater access to capital and expertise for technology adoption.
There were significant spatial variations in chicken manure production and the contributions of large farms at the county level in 2021 (Figure 2c,d). Similar spatial heterogeneities have been reported in other regions globally (e.g., in the Midwestern United States [32]). This complexity makes it challenging to estimate greenhouse gas (GHG) emissions from the entire chicken manure treatment and recycling chain. Firstly, chicken manure production varied among counties, as indicated by the bar lengths in Figure 2. Some counties in northeastern Hebei had notably higher broiler manure production; for instance, two out of 167 counties were responsible for 9.6% of broiler manure production (Figure 2d). In contrast, layer manure production was more concentrated in southern Hebei and was more evenly distributed among counties compared to broiler manure (Figure 2c,d). Secondly, counties with high layer and broiler production were not necessarily the ones where large-scale farms were the main contributors. For example, a few counties had an extremely high proportion of manure production from large-scale farms (over 90%), yet these counties accounted for only a small portion of the total chicken manure production, as shown by the dark-blue shading; darker areas indicate a higher proportion of large-scale farms (Figure 2c,d).
Currently, static composting is the dominant technology for treating chicken manure in Hebei province, accounting for 94% and 87% of layer and broiler manure treatment, respectively (Figure 2a,b). This is in contrast to some developed countries where more advanced composting technologies are more prevalent (e.g., in Europe, reactor composting is widely used in many regions [33,34]). Although more efficient but costly advanced composting technologies, like reactor composting, can significantly reduce nitrogen losses and GHG emissions compared to traditional static composting, they are less commonly adopted by farms, mainly due to the high initial investment in equipment (Table 1). Moreover, there were significant differences in chicken manure composting technologies at the county level. While static composting was dominant in most counties, especially for layer manure treatment, there were exceptions for broiler manure treatment, with some counties having a high proportion of manure treated by reactor composting and trough composting (Figure 2d). These findings emphasize the need for county-specific cost–benefit analyses of chicken manure treatment strategies, similar to the regional-based optimization approaches proposed in the international literature [28].

3.2. GHG Emissions Under the Business-As-Usual Scenario

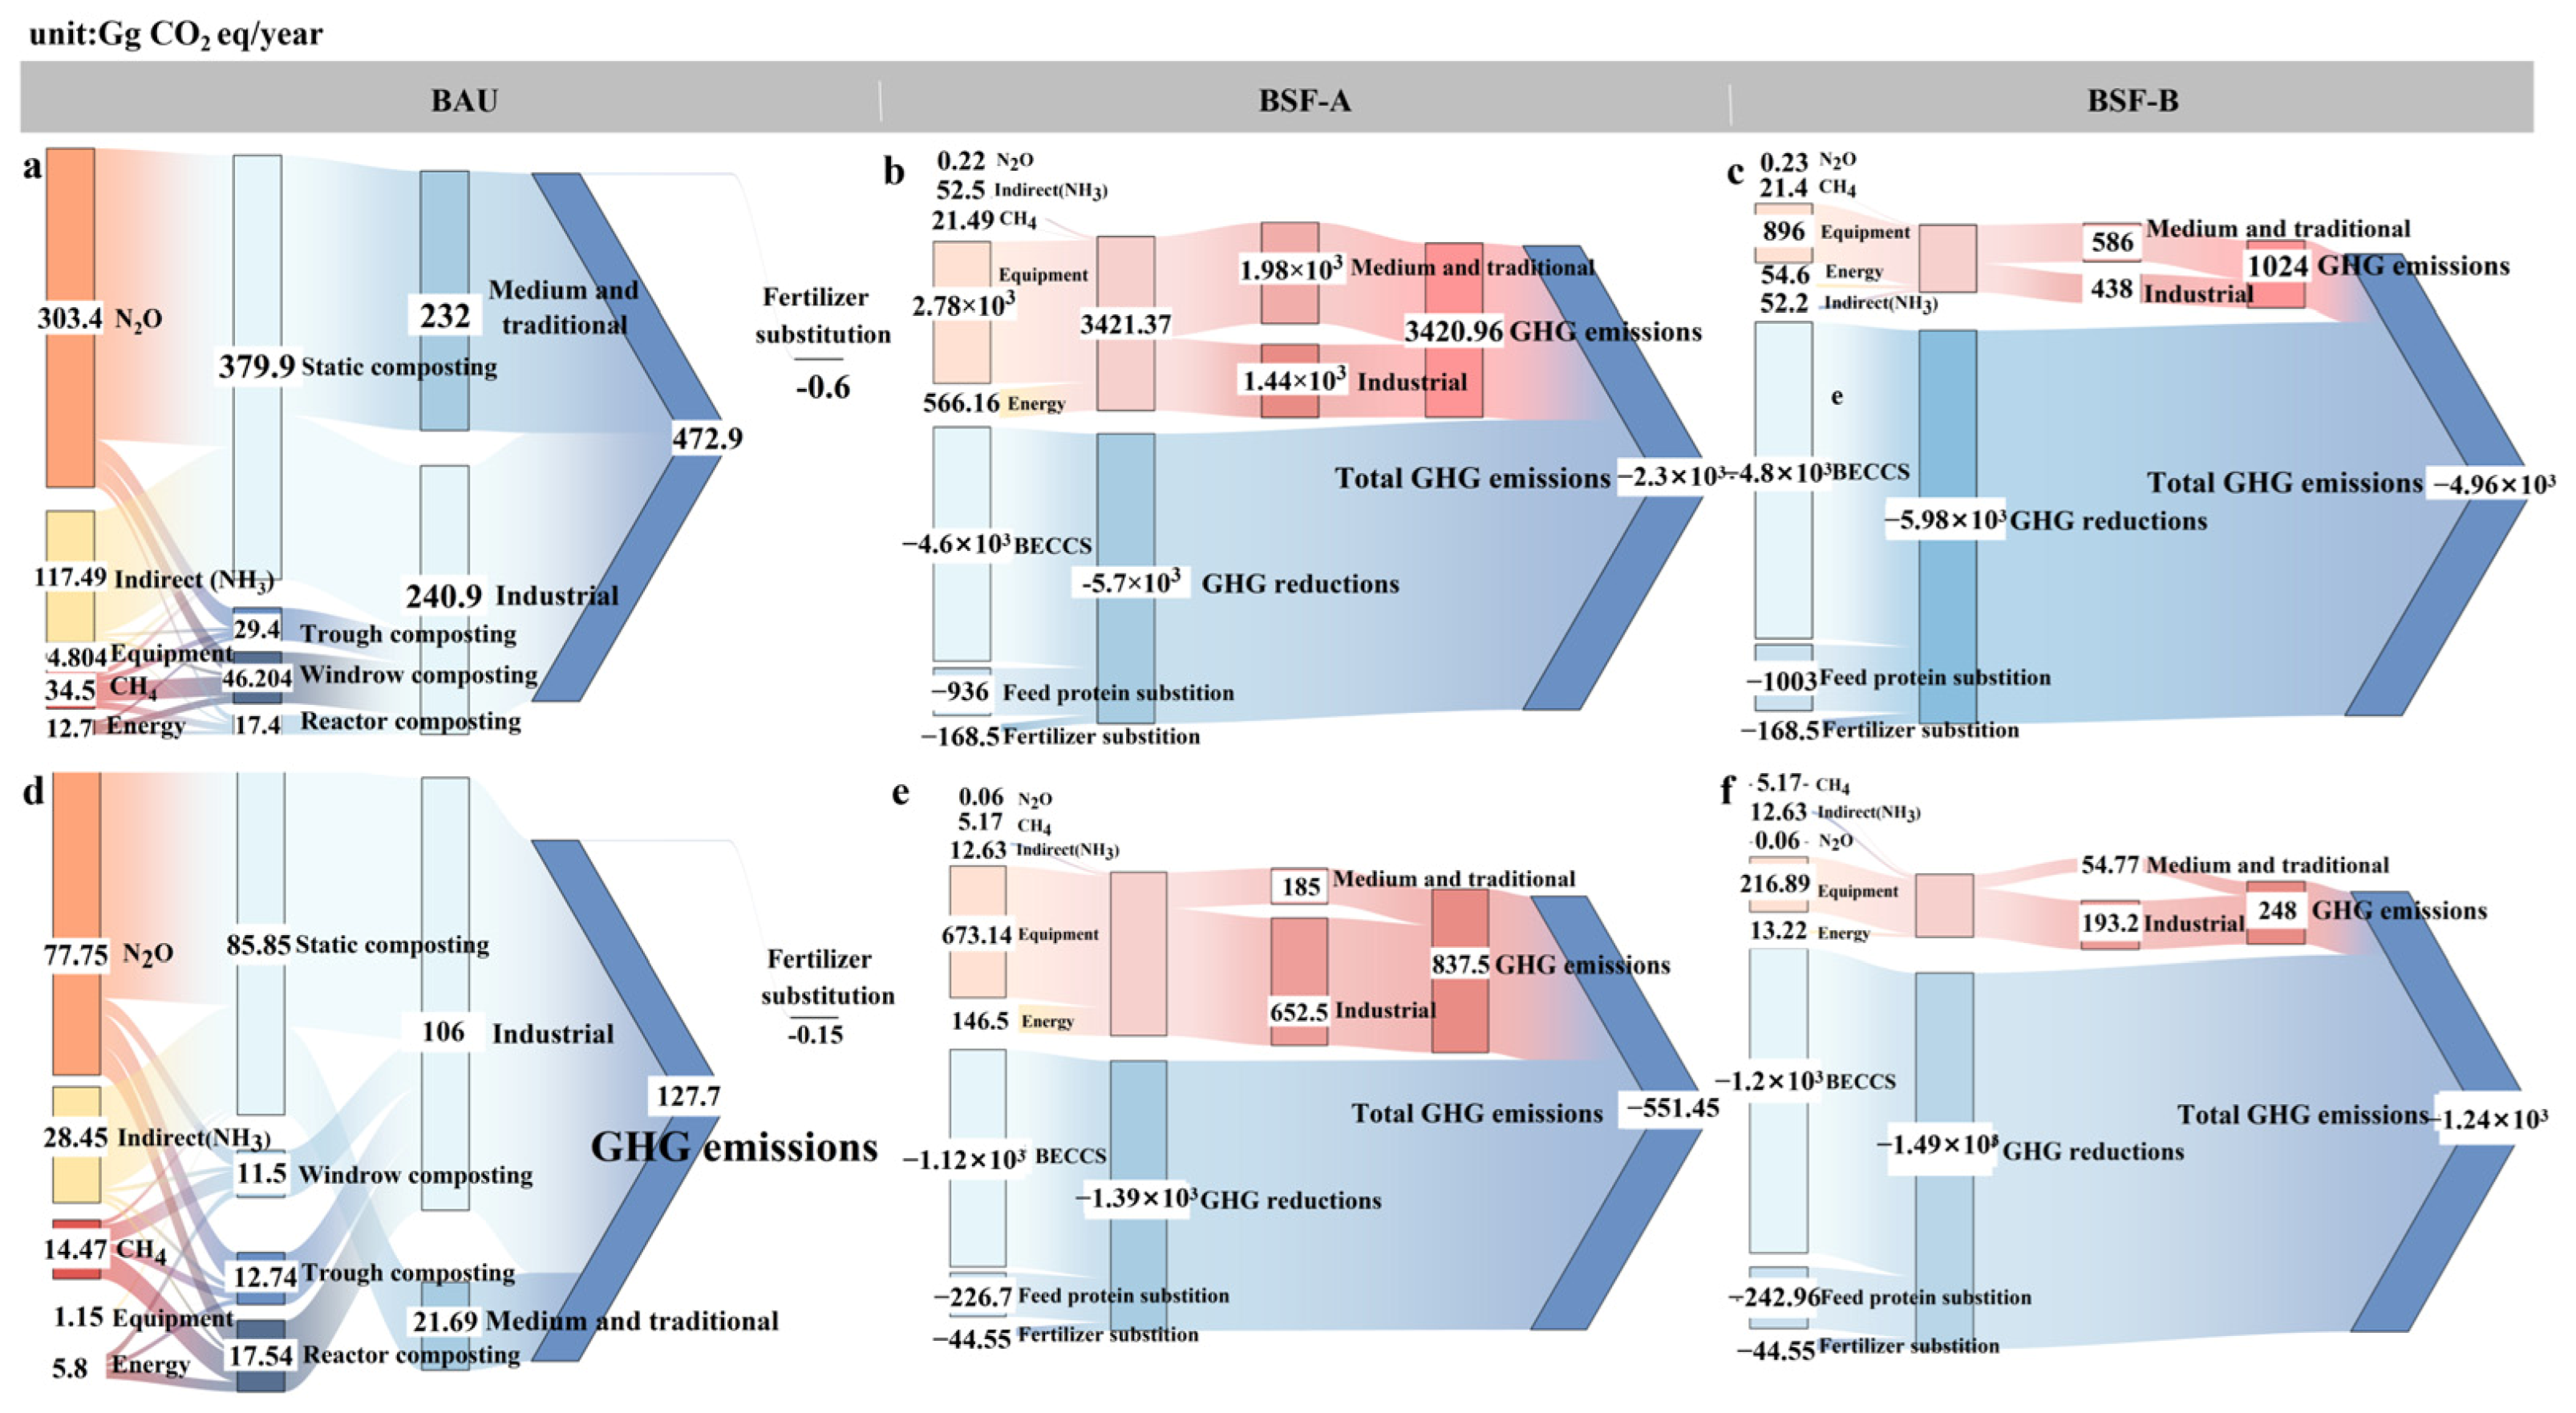
A life cycle assessment was employed to trace GHG emissions from chicken manure treatment at the provincial and county levels in Hebei. The boundaries of GHG emissions calculation are presented in Figure 1. In 2021, the total GHG emissions were estimated to be 0.6 Tg CO2 eq yr−1, with layer manure contributing 79% and broiler manure contributing 21% (Figure 3a,d). Large-scale farms contributed around 59% of the total emissions from all chicken manure, but this contribution varied from 51% for layer manure emissions to 85% for broiler manure emissions (Figure 3a,d).
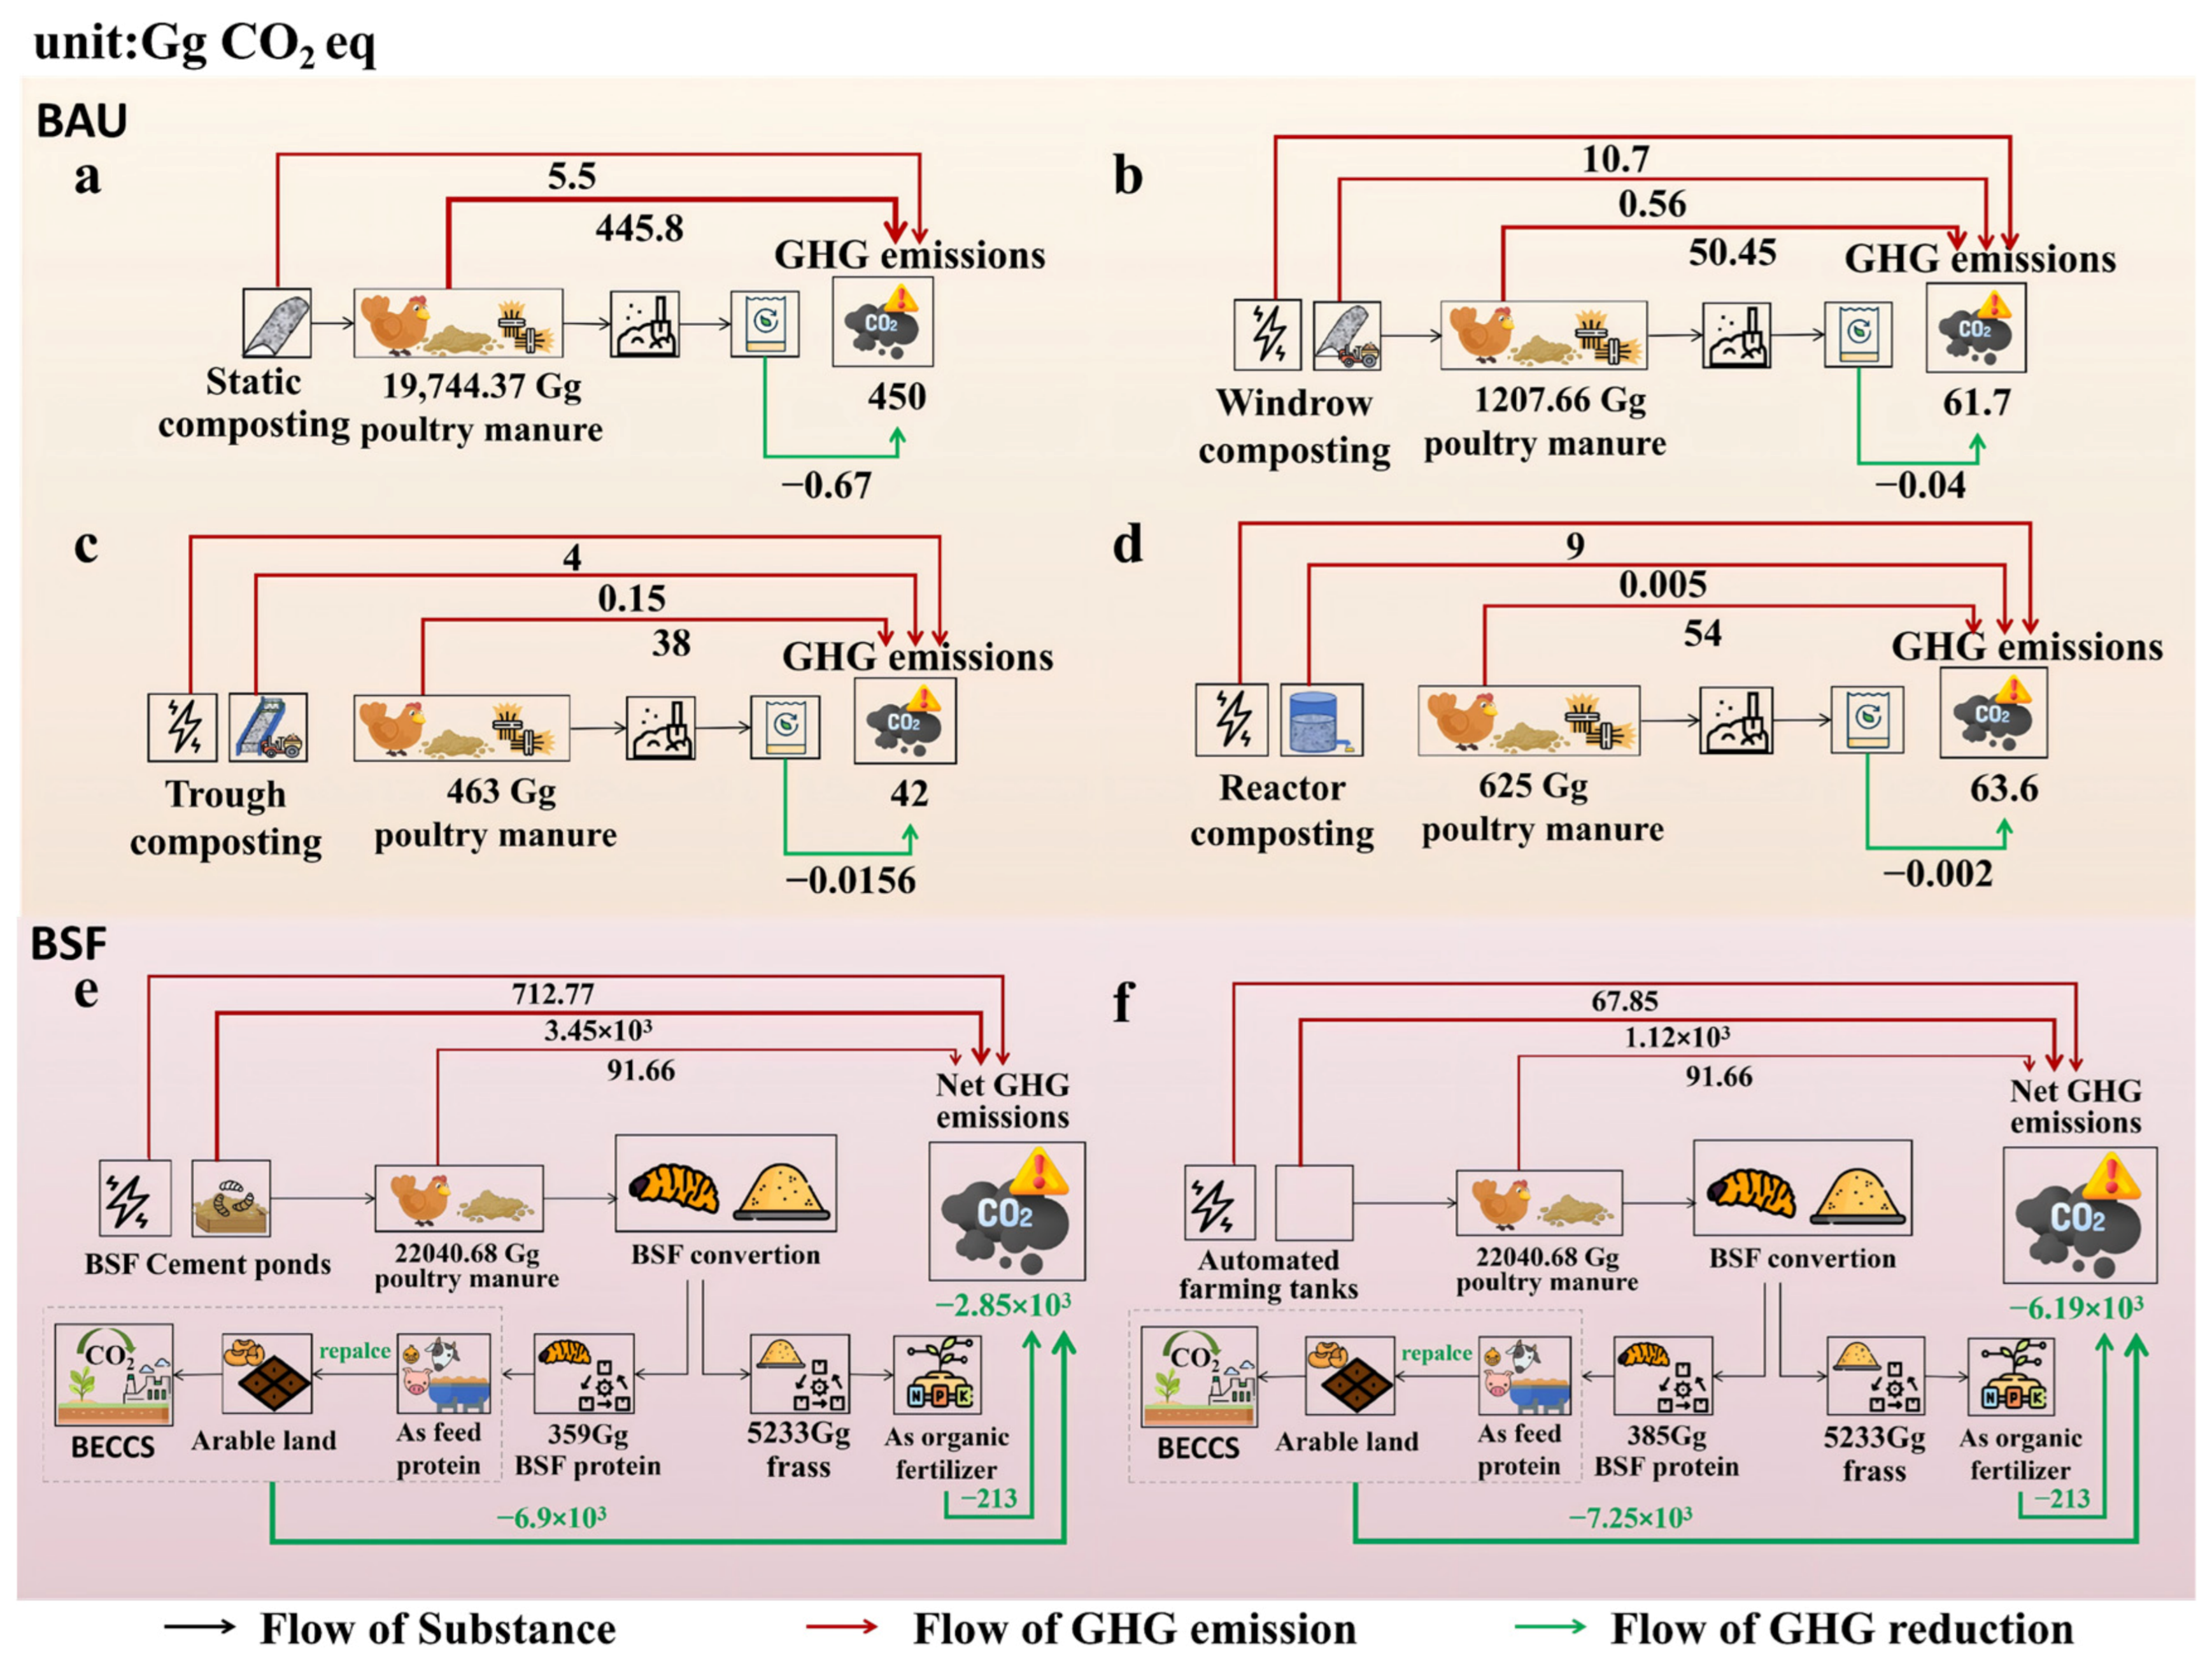
The detailed GHG emission flows and the contributions of different composting technologies were quite similar for layer and broiler manure treatment. This similarity is due to comparable emission factors and the dominance of static composting in chicken manure treatment (Figure 3a,d). The total emissions from static composting of all chicken manure were 466 Gg CO2eq yr−1, accounting for 75% of the total emissions. Reactor composting emissions were 35 Gg CO2eq yr−1, representing 6% of the total, while strip-stack composting and trough composting emissions were 58 Gg yr−1 and 42 Gg CO2eq yr−1, respectively (Figure 3a–d). These emission patterns are consistent with some previous studies on poultry manure treatment in Asia [28,35], but the overall emission levels in Hebei are relatively high compared to some regions with more advanced treatment technologies.
Most of the GHG emissions occurred during the composting period, with direct N2O emission being the main contributor. Although composting manure requires ventilation to supply oxygen for microbes, many studies have observed N2O emissions during composting [36]. This is partly because the cessation of ventilation can create anaerobic conditions, and in large composting piles, ventilation may not provide sufficient oxygen throughout. In total, N2O emissions accounted for 64% of the total GHG emissions from chicken manure treatment in Hebei in 2021 (Figure 3a,d). Indirect N2O emission, via NH3 emission, was the second-largest source, accounting for 24% of the total GHG emissions. Ammonia emission is a major issue in manure composting; high temperatures and forced ventilation during composting promote its release from the manure heap into the atmosphere, leading to indirect N2O emission in the environment. Higher nitrogen losses during composting also reduce the manure’s ability to replace synthetic nitrogen fertilizers. Additionally, anaerobic conditions during composting, even with a relatively low carbon-to-nitrogen ratio in chicken manure, favor the production of methane (CH4), which accounted for 8.1% of the total emissions (Figure 3a,d). The GHG emissions from energy use and other materials during chicken manure composting were relatively low compared to other emission sources. Composted manure can substitute synthetic nitrogen fertilizer, helping to reduce GHG emissions during fertilizer manufacturing, with a total reduction of 0.8 Gg CO2eq yr−1 (Figure 3a,d). The detailed GHG emission flows of different composting technologies were also dominated by direct and indirect N2O emissions during the composting process (Figure 3a–d).

3.3. GHG Mitigation Potential Under the BSF Scenario

Certain insects and worms, such as the BSF and earthworm, can thrive in harsh environments like chicken manure. After proper treatment, their larvae and bodies can be used as livestock feed. Rearing them in manure can significantly reduce manure stock and reconnect decoupled crop–livestock production. BSF-derived insect protein has the potential to replace feed proteins like soybean, saving land for BECCS, thus offering great potential for GHG mitigation [22]. The remaining substrate, frass, can be used as an organic fertilizer to replace synthetic NPK fertilizer [37,38]. This concept of using BSF for manure management and resource recovery has been widely explored in international research, with similar findings on its potential benefits [19,39].
Based on the current situation, two scenarios were developed, both using BSF to convert chicken manure into valuable insect protein but with different BSF production technologies. Scenario BSF-A involves producing BSF in traditional cement ponds, which have relatively low costs but a lower turnover rate. Scenario BSF-B uses advanced automated breeding tanks. These two technologies represent the two main methods of BSF-based insect protein production, and understanding the GHG emissions and costs associated with them is crucial.
In BSF-A, the dry BSF larva production is expected to be 857 Gg yr−1 (dry matter), with 690 Gg yr−1 from layer manure and 167 Gg yr−1 from broiler manure. In BSF-B, due to better management, the dry BSF larva production will increase to 918 Gg yr−1. Based on the 41.9% protein content of BSF larva, the produced insect protein is 359 Gg yr−1 in BSF-A and 385 Gg yr−1 in BSF–B (Figure 4e,f). For comparison, the total soybean production in Hebei province in 2022 was approximately 230 Gg yr−1 [39], which is over half of the insect protein produced from chicken manure, considering the similar protein content of dry BSF larva and soybean. This insect protein is expected to replace soybeans from the Chinese market, given China’s emphasis on food security. When corrected by the multiple-harvest index in China, this would save 0.37–0.40 Mha yr−1 of cropland [40]. If the saved cropland is used for BECCS, it could potentially reduce GHG emissions by 6.9 Tg CO2eq yr−1 in BSF-A and 7.25 Tg CO2eq yr−1 (Figure 4e,f). Meanwhile, the 5233 Gg yr−1 of frass produced, a high-quality organic material, could potentially substitute 24 Gg yr−1 of N fertilizer, 18 Gg yr−1 of P fertilizer, and 19 Gg yr−1 of K fertilizer. This substitution would reduce GHG emissions by 213 Gg CO2eq yr−1 due to reduced energy use and related N2O losses during fertilizer manufacturing. The significantly higher GHG emission reduction in BSF-A and BSF-B scenarios compared to the BAU scenario is mainly due to over-fertilization in the BAU scenario, where applied compost manure does not effectively replace synthetic fertilizers (Figure 4).
During BSF-A and BSF-B, the additional requirements for materials, basic structures (such as cement and steel), and energy consumption (for drying BSF larvae) result in GHG emissions of 4.17 Tg CO2eq yr−1 and 1.18 Tg CO2eq yr−1, respectively (Figure 4e,f). However, the GHG emissions during BSF-treated manure, including CH4, direct and indirect N2O, are much lower compared to traditional composting technologies (Figure 3 and Figure 4). Specifically, the total GHG emissions during BSF treatment are 92 Gg CO2eq, while in the BAU scenario, it is 576 Gg CO2eq yr−1 (Figure 3 and Figure 4). This indicates that BSF treatment directly reduced manure-treatment emissions by 484 Gg CO2eq yr−1 compared with conventional composting. The larger overall mitigation potential was mainly derived from additional system benefits, including soybean-protein substitution, fertilizer substitution by frass, and BECCS-related land-use savings. This difference may be attributed to the black soldier fly’s continuous peristaltic movement, which creates numerous holes and tunnels, enhancing the oxygen concentration in the waste and inhibiting the production of two greenhouse gases [41]. The application of BSF-A and BSF-B could reduce the overall GHG emissions from chicken manure by 7.11 Tg yr−1 and 7.47 Tg yr−1, respectively, compared to the current situation. These results are consistent with international studies on the superiority of BSF-based manure treatment in reducing GHG emissions [42].
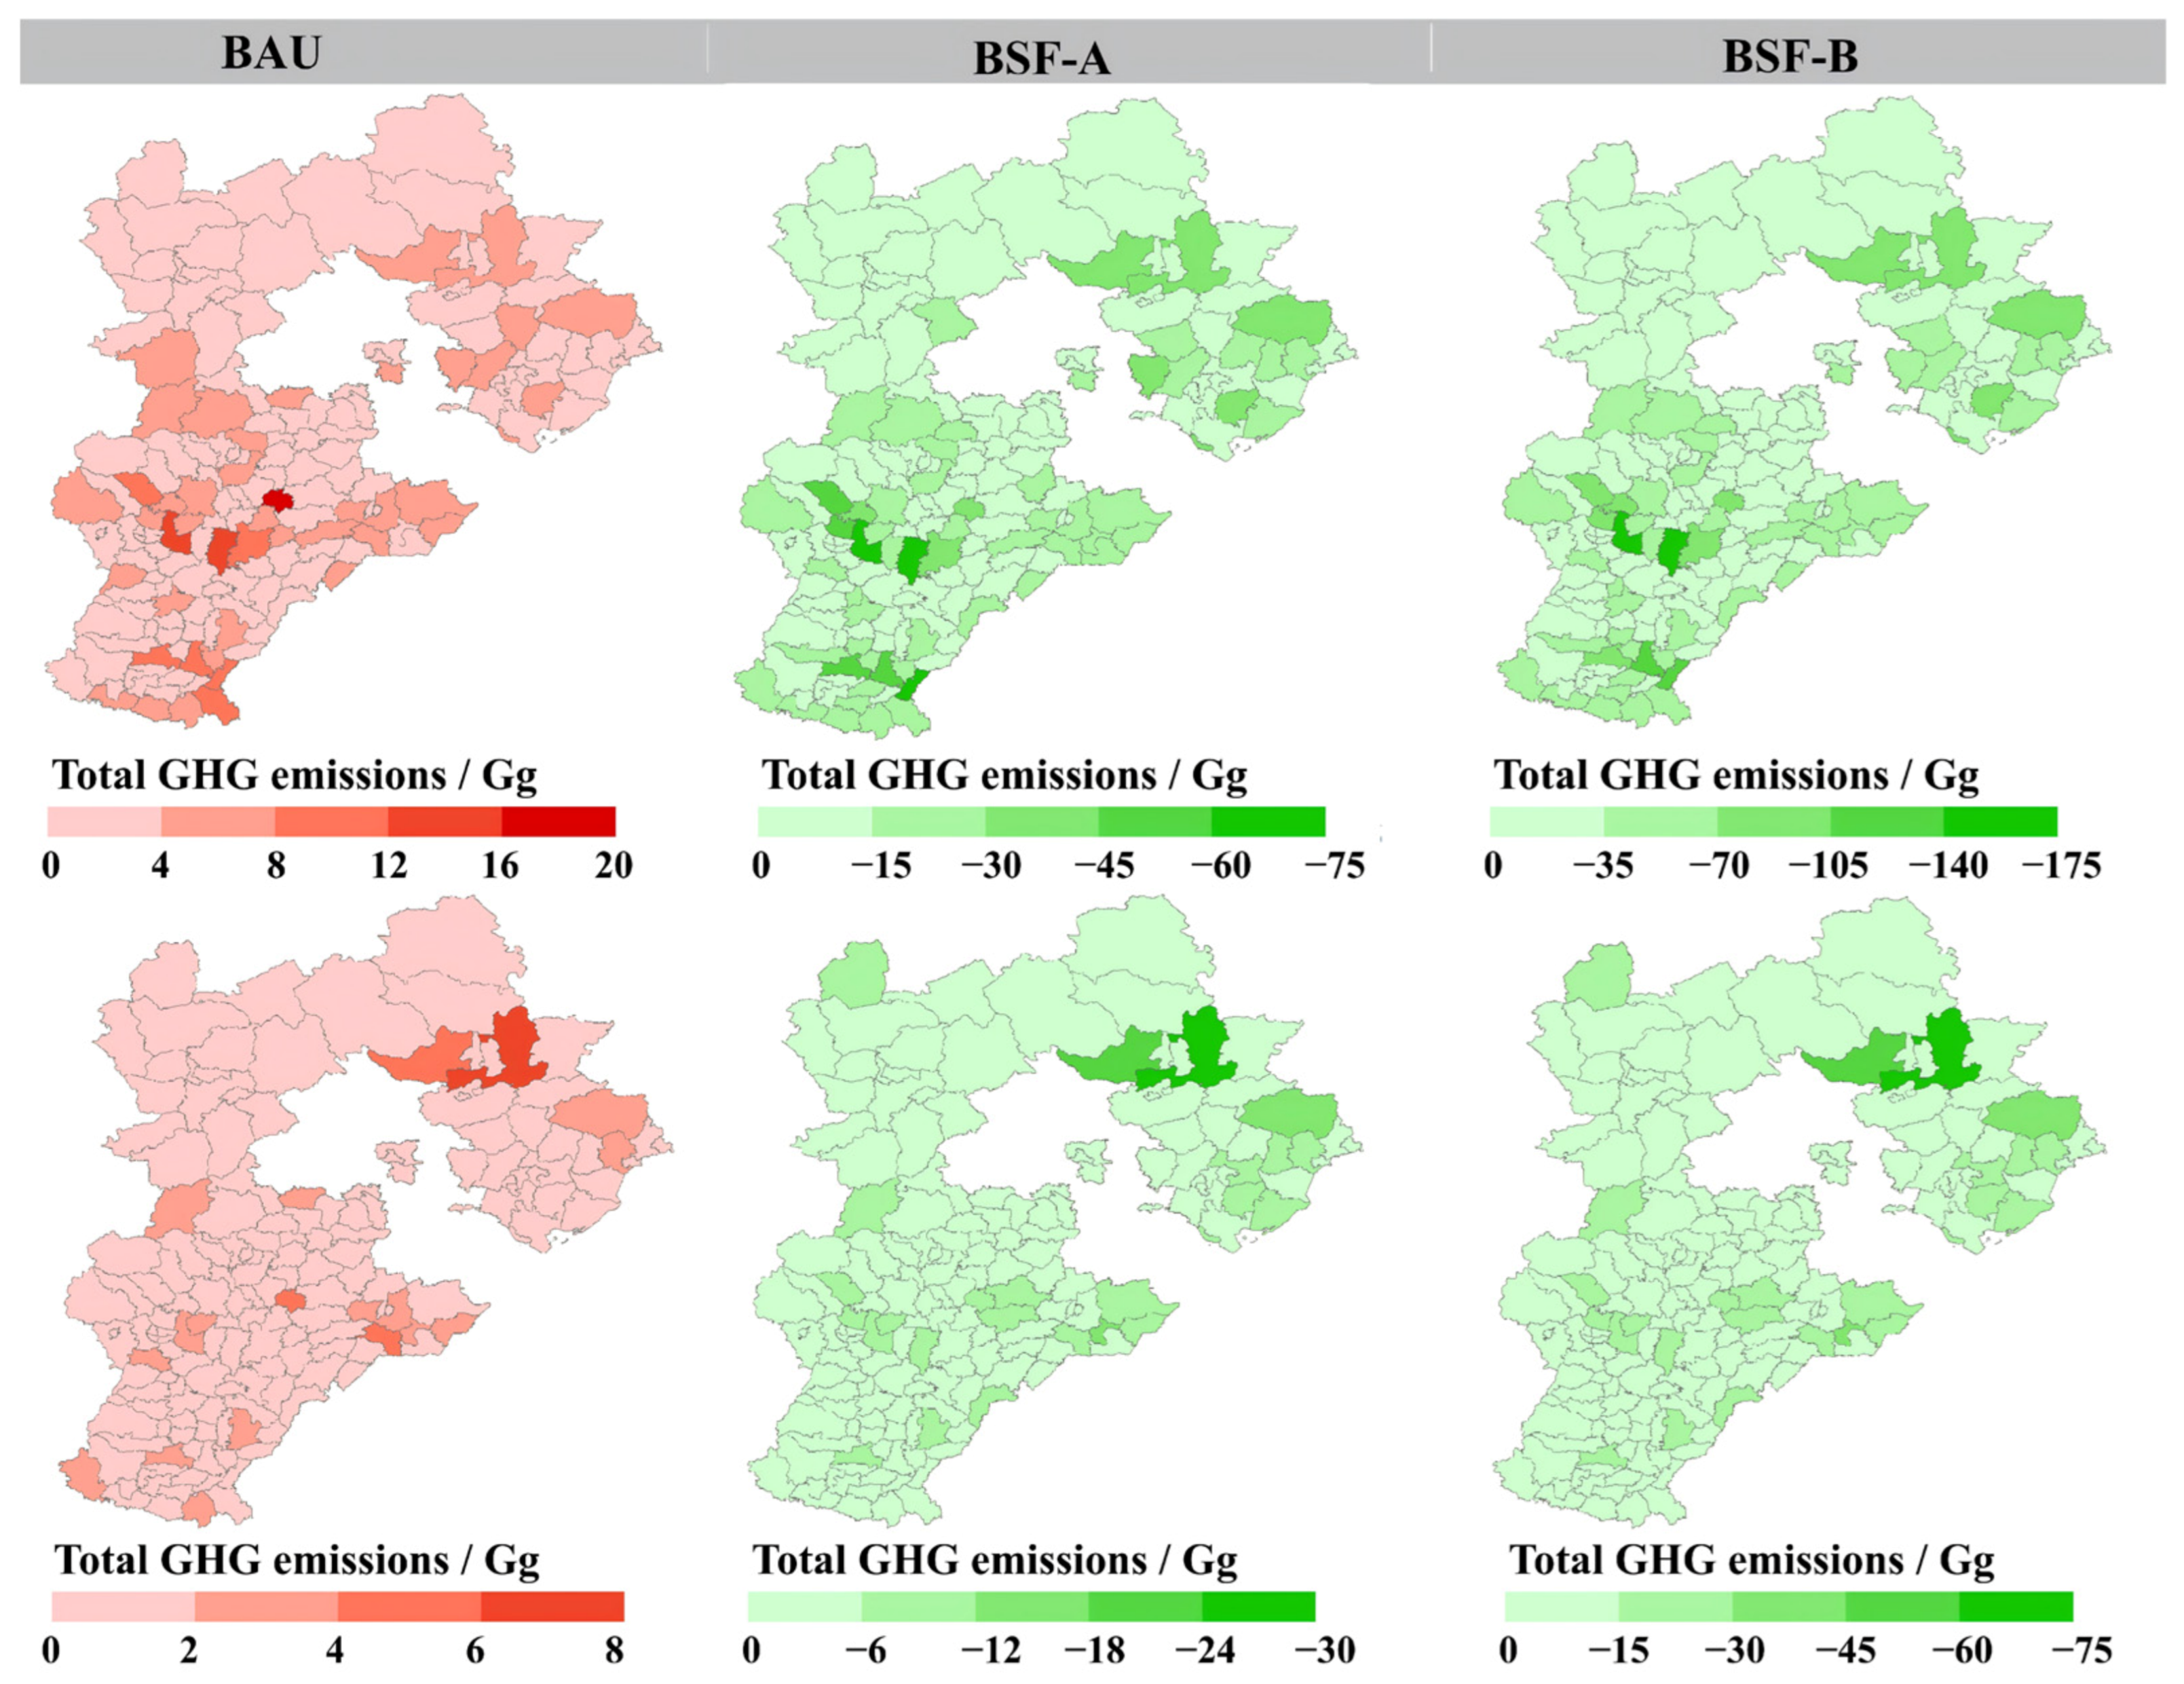
The spatial distribution of GHG emissions under the BAU scenario exhibited clear regional disparities, largely consistent with chicken manure production patterns (Figure 2c–d). Emissions were notably higher in central-southern and northeastern counties, particularly those dominated by layer production. Most counties showed layer manure emissions ranging from 1 to 4 Gg CO2eq yr−1, while only nine counties exceeded 8 Gg CO2eq yr−1 but contributed over 20% of total layer emissions. For broilers, emissions ranged from 0.1 to 1 Gg CO2eq yr−1, with just four counties exceeding 4 Gg CO2eq, accounting for 16% of broiler-related emissions. Under the BSF scenario, these high-manure regions also exhibited the greatest mitigation potential, especially for layer manure. In BSF-A, 20% of counties achieved GHG reductions exceeding 20 Gg CO2eq yr−1, while BSF-B increased this proportion to 54%, with mitigation hotspots concentrated in the northeastern and central-southern parts of the province. These results highlight a strong spatial convergence between emission hotspots and reduction opportunities.
Because the BECCS-related credit strongly influenced the overall mitigation results, we further evaluated a no-BECCS scenario. When BECCS-related carbon removal was excluded but soybean-protein and fertilizer substitution credits were retained, the GHG results changed from −2.85 to 2.88 Tg CO2eq yr−1 for BSF-A and from −6.19 to −0.19 Tg CO2eq yr−1 for BSF-B. This indicates that BECCS was a major driver of the negative GHG balance, while BSF treatment still reduced direct manure-treatment emissions and provided additional substitution benefits through insect protein and frass production.

3.4. Total Cost of Chicken Manure Treatment Under Two Scenarios

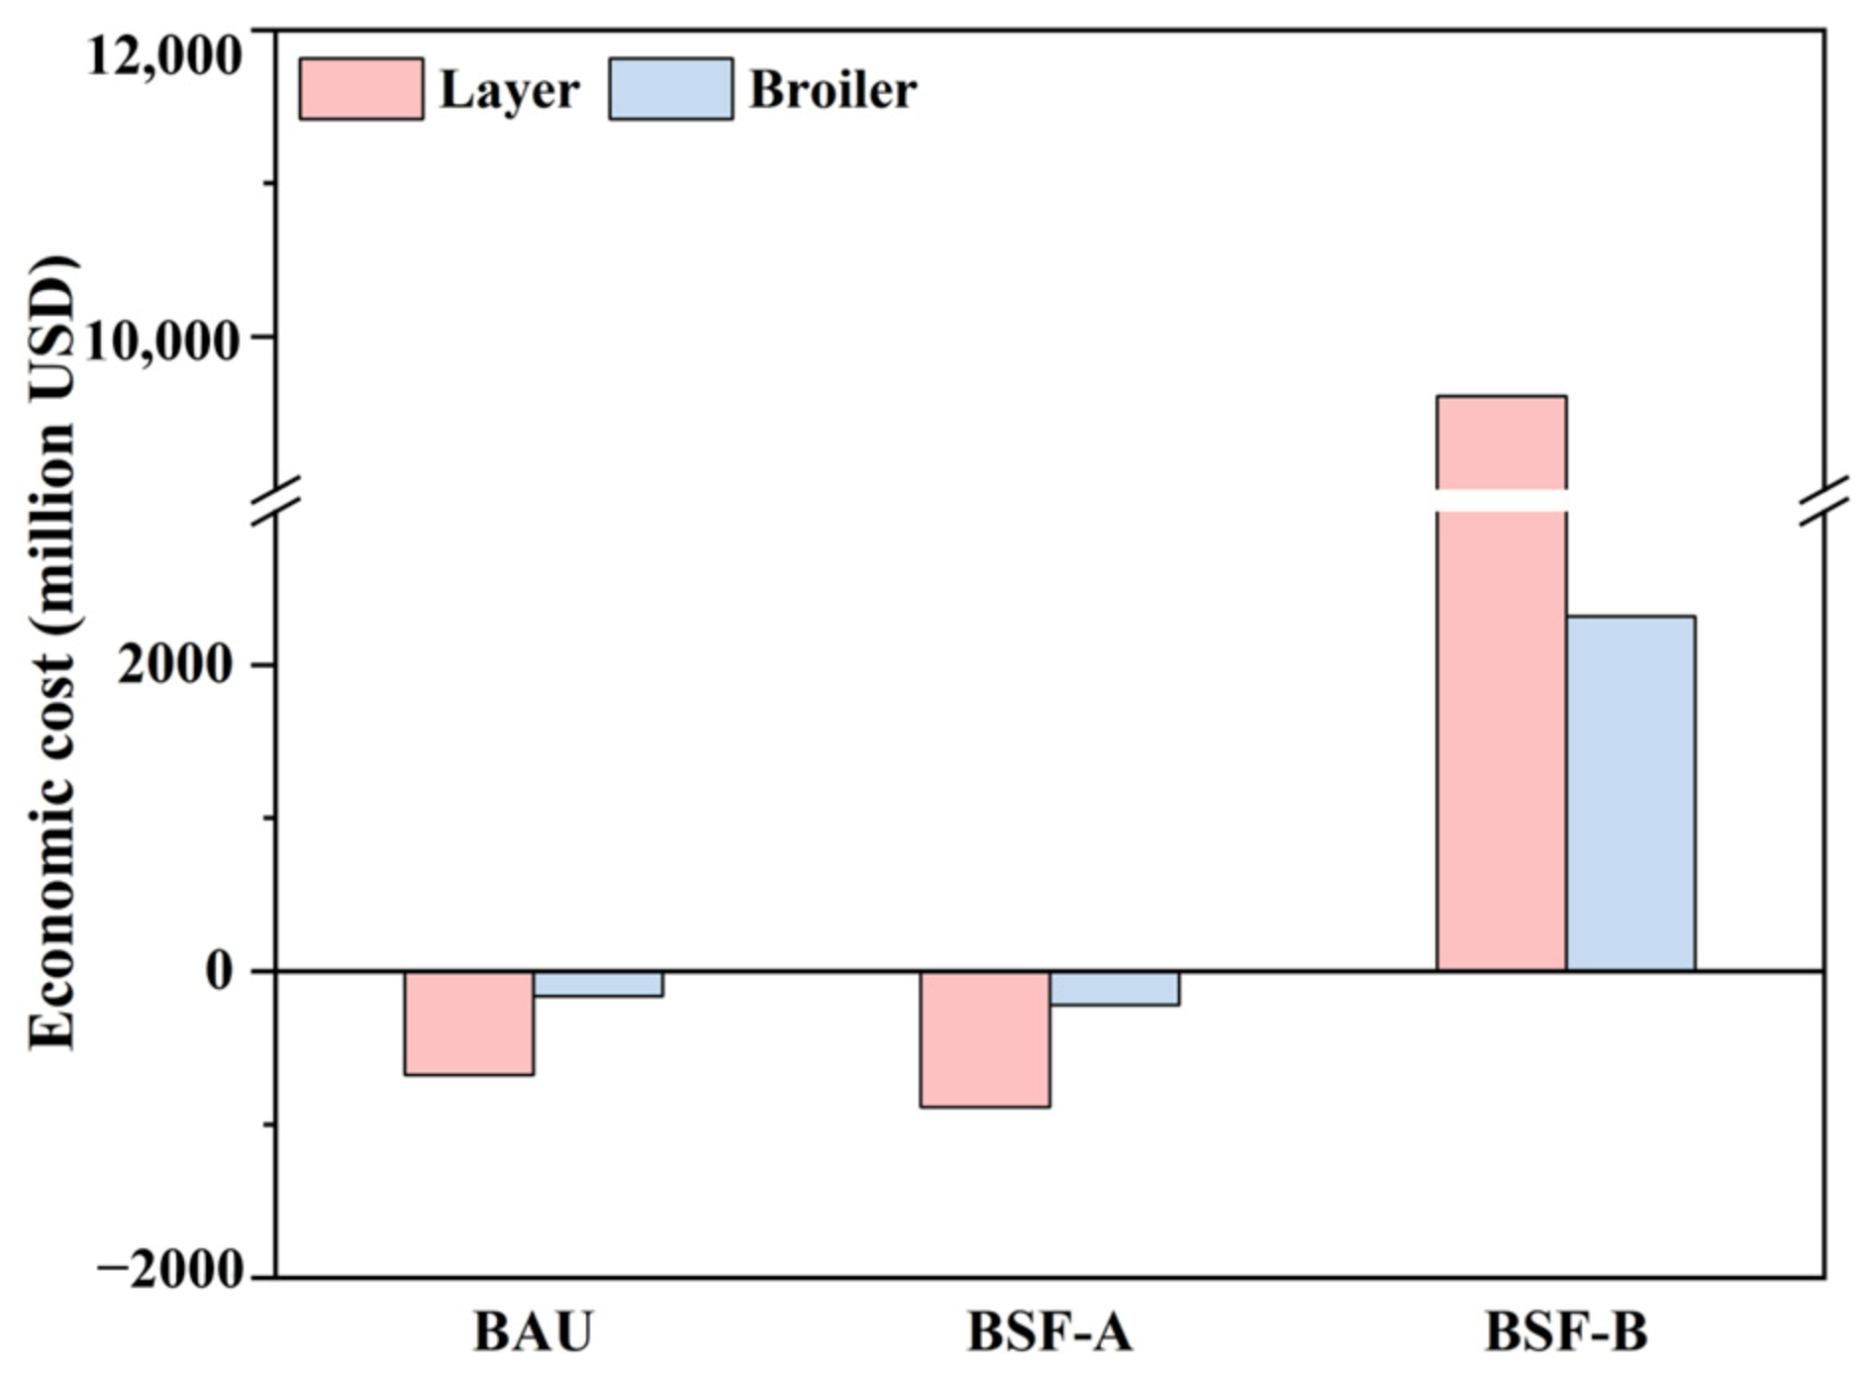
A comprehensive comparative analysis of the economic costs and benefits of the BAU scenario and the BSF scenario was conducted. The results indicate that the BSF scenario has significant economic advantages. In the BAU scenario, total treatment costs ranged from $26 to $46 per ton of dry manure, with SH being the most cost-effective and RC the most expensive (Table 1). The cost differences were primarily driven by equipment depreciation costs, especially in WC, TC and RC systems. Despite the operational expenses, all BAU composting methods generated net negative costs due to the sale of compost as organic fertilizer. This results in the net economic cost of treating chicken manure in Hebei Province to be −$838 million every year (Figure 5).
The BSF scenario also performs well in terms of revenues, despite having relatively high costs. BSF-A, based on cement pool systems, had a moderate treatment cost of $120/t. While BSF-B, involving automated rearing tanks, incurred an extremely high cost of $2109.6/t, largely due to the high depreciation and maintenance costs of precision equipment. However, the benefit from both frass and dried BSF larvae significantly offset these costs. In BSF-A, the net cost reached −$164.6/t for layer manure and −$172/t for broiler manure, indicating higher cost-effectiveness compared to traditional composting methods. If scaled across Hebei Province, cement pool-based BSF treatment could yield a total net economic benefit of $1160 million (Figure 5). In contrast, BSF-B incurred a much higher treatment cost of $1798–1805/t, primarily due to substantial capital and operational expenses associated with automated rearing systems. While BSF-B may be more suitable for large-scale farms with advanced infrastructure, further reductions in investment and operational costs are essential to enhance its broader applicability and economic feasibility [43,44].
These results are consistent with those of previous studies, which have shown that although BSF farming requires a high initial investment, its long-term economic benefits in resource recovery and recycling are significant [42]. Additionally, the high-value insect proteins and organic fertilizers produced during BSF farming can substitute external resources, reducing the overall environmental impact of the farming system [45].

3.5. Sensitivity Analysis

The one-at-a-time sensitivity analysis first showed that BSF-derived protein production was most sensitive to FCR and larval crude protein content. A 20% decrease in FCR increased protein production to 449 Gg and 481 Gg under the cement pond and automated systems, respectively, whereas a 20% increase in FCR reduced protein production to 299 Gg and 321 Gg. Larval crude protein content showed a proportional effect on protein output and substitution-related mitigation. For the BAU scenario, a ±20% change in direct GHG emission factors changed total composting emissions from 494 to 741 Gg CO2eq yr−1, compared with the baseline value of 618 Gg CO2eq yr−1, while static composting remained the dominant emission source. A ±20% change in unit operating cost altered BAU total operating costs from $271 million to $407 million, but did not change the overall economic interpretation because organic fertilizer revenue partly offset treatment costs. For the BSF scenarios, changes in FCR and larval protein content also affected the overall GHG mitigation results through feed-protein substitution and BECCS-related land-use savings. The baseline mitigation results of −2852 and −6193 Gg CO2eq yr−1 changed to −4576 and −8006 Gg CO2eq yr−1 when FCR decreased by 20%, and to −1702 and −4984 Gg CO2eq yr−1 when FCR increased by 20%, under the cement pond and automated systems, respectively. Equipment cost affected only the economic performance of BSF systems, with automated systems showing much higher sensitivity to capital cost uncertainty than cement pond systems. Overall, the sensitivity analysis indicates that the main conclusions are generally robust under the tested parameter ranges, although key technical, emission, and economic parameters should be further validated using region-specific data (Table A14).

3.6. Implications for Future Research and Policy

The findings of this study offer several important implications for both future research and policy-making. From a research perspective, further investigations are needed to optimize the BSF-based manure treatment technologies. Research could focus on improving the efficiency of BSF breeding in both cement ponds and automated tanks, reducing the associated GHG emissions during the production process, and enhancing the quality of the resulting insect protein and frass. Long-term field trials are also required to assess the sustainability of substituting synthetic fertilizers with BSF-derived frass and the potential impacts on soil health and crop yields. In addition, because composted manure and BSF-derived frass may be applied to agricultural soils, product quality and soil safety should be monitored before field application. In China, organic fertilizer products and agricultural soils are regulated by relevant standards, such as NY/T 525-2021 for organic fertilizers and GB 15618-2018 for soil contamination risk control of agricultural land. Therefore, future deployment of BSF-based manure management should include monitoring of nutrient composition, trace metals, and potential contaminants, as well as product tracking systems to ensure safe use in agricultural production. Additionally, although anaerobic digestion is an important alternative for chicken manure treatment and biogas production, it was not included as an independent scenario in this study because our analysis focused on comparing current composting practices with BSF-based manure bioconversion for feed protein and frass production. Future studies could further evaluate anaerobic digestion alone or its integration with BSF treatment in hybrid systems to develop more comprehensive manure management strategies.
The C/N ratio is an important manure-quality factor affecting microbial activity, organic matter decomposition, nitrogen transformation, BSF larval growth, and GHG emissions during manure bioconversion. In general, excessively low C/N ratios may increase NH3 volatilization and nitrogen losses, potentially inhibiting microbial activity and larval performance, whereas excessively high C/N ratios may limit nitrogen availability and slow organic matter degradation, thereby reducing composting efficiency and BSF bioconversion performance. In this study, the influence of C/N ratio was represented indirectly through literature-derived manure composition, composting emission parameters, and BSF bioconversion parameters. Therefore, we discuss the potential role of C/N ratio and related process-level factors as an important source of uncertainty in BSF-based manure treatment. Because this study was conducted as a regional-scale LCA based on statistical data and literature-derived parameters, farm-specific C/N ratios, complete manure chemical compositions, composting temperature and humidity, particle size, layer depth, and maturation time were not directly measured. Instead, representative manure composition and process parameters were adopted from published studies and summarized in Appendix A, including TC and TN contents, composting N2O-N, NH3-N, and CH4-C losses, and BSF bioconversion parameters such as manure dry matter reduction, frass moisture content, larval moisture content, and FCR. These parameters were used to represent the effects of manure quality and treatment conditions on composting emissions and BSF performance. Nevertheless, process-level factors may substantially influence composting efficiency, nitrogen losses, larval growth, substrate reduction, and frass quality. In addition, the mitigation benefits associated with soybean-protein substitution, land-use savings, and BECCS should be interpreted as scenario-based potential, and transportation emissions were excluded due to inconsistent regional logistics data and the farm-gate system boundary. Future studies should combine regional-scale LCA with farm-level monitoring and spatially explicit transport data to improve the accuracy of manure treatment and mitigation assessments.
In terms of policy, BSF-based manure treatment should be promoted through stepwise demonstration and region-specific deployment rather than immediate large-scale adoption. Policy support could include pilot subsidies for suitable farms, technical training, market certification for BSF-derived feed protein and frass, and product safety standards to ensure environmental and feed safety. Policy-makers should also encourage research and development in this area by funding relevant projects and facilitating knowledge-sharing between researchers and industry stakeholders. Before broader adoption, practical constraints, including investment capacity, product utilization, market demand, transportation logistics, and farm-level management capacity, should be carefully evaluated. Furthermore, given the significant spatial variations in chicken manure production and treatment, county-level policies should be tailored to the specific characteristics of each region to maximize the effectiveness of manure management strategies.

4. Conclusions

Using life cycle assessment, this study evaluated the environmental and economic performance of traditional composting in Hebei’s large-scale chicken manure management and the substantial potential of BSF technology to address feed protein shortage and manure surplus in Jing-Jin-Ji. The results suggest that BSF treatment has the potential to convert 22 Tg yr−1 of chicken manure into 359–385 Gg yr−1 of feed protein. BSF treatment reduced direct manure-treatment emissions compared with conventional composting and generated additional mitigation benefits through feed-protein substitution, fertilizer substitution, and BECCS-related land-use savings. Without BECCS-related carbon removal, the GHG results were substantially reduced, highlighting the importance of land-use assumptions in interpreting the mitigation potential. Under the scenario assumptions used in this study, the overall GHG mitigation potential was estimated at 2.85–6.19 Tg CO2eq yr−1. Low-technology BSF systems (e.g., cement ponds) are cost-competitive, while automated systems, despite higher upfront costs, offer significant long-term resource recovery benefits. Overall, BSF-based manure treatment shows promise as a potential option for improving manure management, feed-protein substitution, and GHG mitigation in intensive agricultural regions. Future research should strengthen regional parameter validation, field-scale monitoring, transport assessment, and market feasibility analysis before large-scale deployment.

Author Contributions

Conceptualization, Z.B.; methodology, R.Z.; software, Y.W. and P.H.; validation, P.H., X.W. (Xiaofei Wu) and S.L.; formal analysis, Y.W.; investigation, S.L.; resources, L.M.; data curation, Y.W.; writing—original draft preparation, Y.W.; writing—review and editing, Z.B. and X.W. (Xuan Wang); visualization, Y.W.; supervision, L.M. and R.Z.; project administration, Z.B.; funding acquisition, Z.B. and L.M. All authors have read and agreed to the published version of the manuscript.

Funding

Research was funded by the Hebei Meat Poultry Innovation Team of Hebei Agriculture Research System, grant number HBCT2024270203. The APC was funded by the Hebei Meat Poultry Innovation Team of Hebei Agriculture Research System.

Institutional Review Board Statement

Not applicable.

Data Availability Statement

Most data used in this study were obtained from publicly available statistical yearbooks, national guidelines, and published literature. Key processed data and parameters are provided in Appendix A. Some farm-level operational information was obtained from official livestock information platforms or field surveys and cannot be fully disclosed due to data-use restrictions, but the aggregated values and calculation parameters used in the analysis are reported in the manuscript and Appendix A. Requests to access the datasets should be directed to the corresponding author.

Acknowledgments

The authors would like to express their sincere gratitude to all institutions and individuals who provided help during the research process. No generative artificial intelligence tools were used in this study.

Conflicts of Interest

The authors declare no conflicts of interest.

Appendix A

Appendix A.1. Material and Methods

Appendix A.1.1. Calculation of the Proportion of Large-Scale Chicken Farms

The equations in this section were used to downscale provincial livestock statistics to county-level farm-scale distributions. They were developed for data harmonization in this study based on official livestock statistics, regression-based estimation, and correction to observed provincial totals. The manure accounting logic follows established livestock manure estimation methods, in which manure production is calculated from animal numbers, feeding duration, and daily excretion coefficients [24].
To simulate the number of poultry farms of different sizes at the sub-county scale in 2021, we collected provincial-level data across all years, including per capita GDP, poultry output (inventory), and the number of poultry farms (households), as well as the proportions of large-scale layer and broiler farms in Hebei Province. These data were obtained from provincial statistical yearbooks, the China Animal Husbandry and Veterinary Statistical Yearbook, and the Hebei Rural Statistical Yearbook.
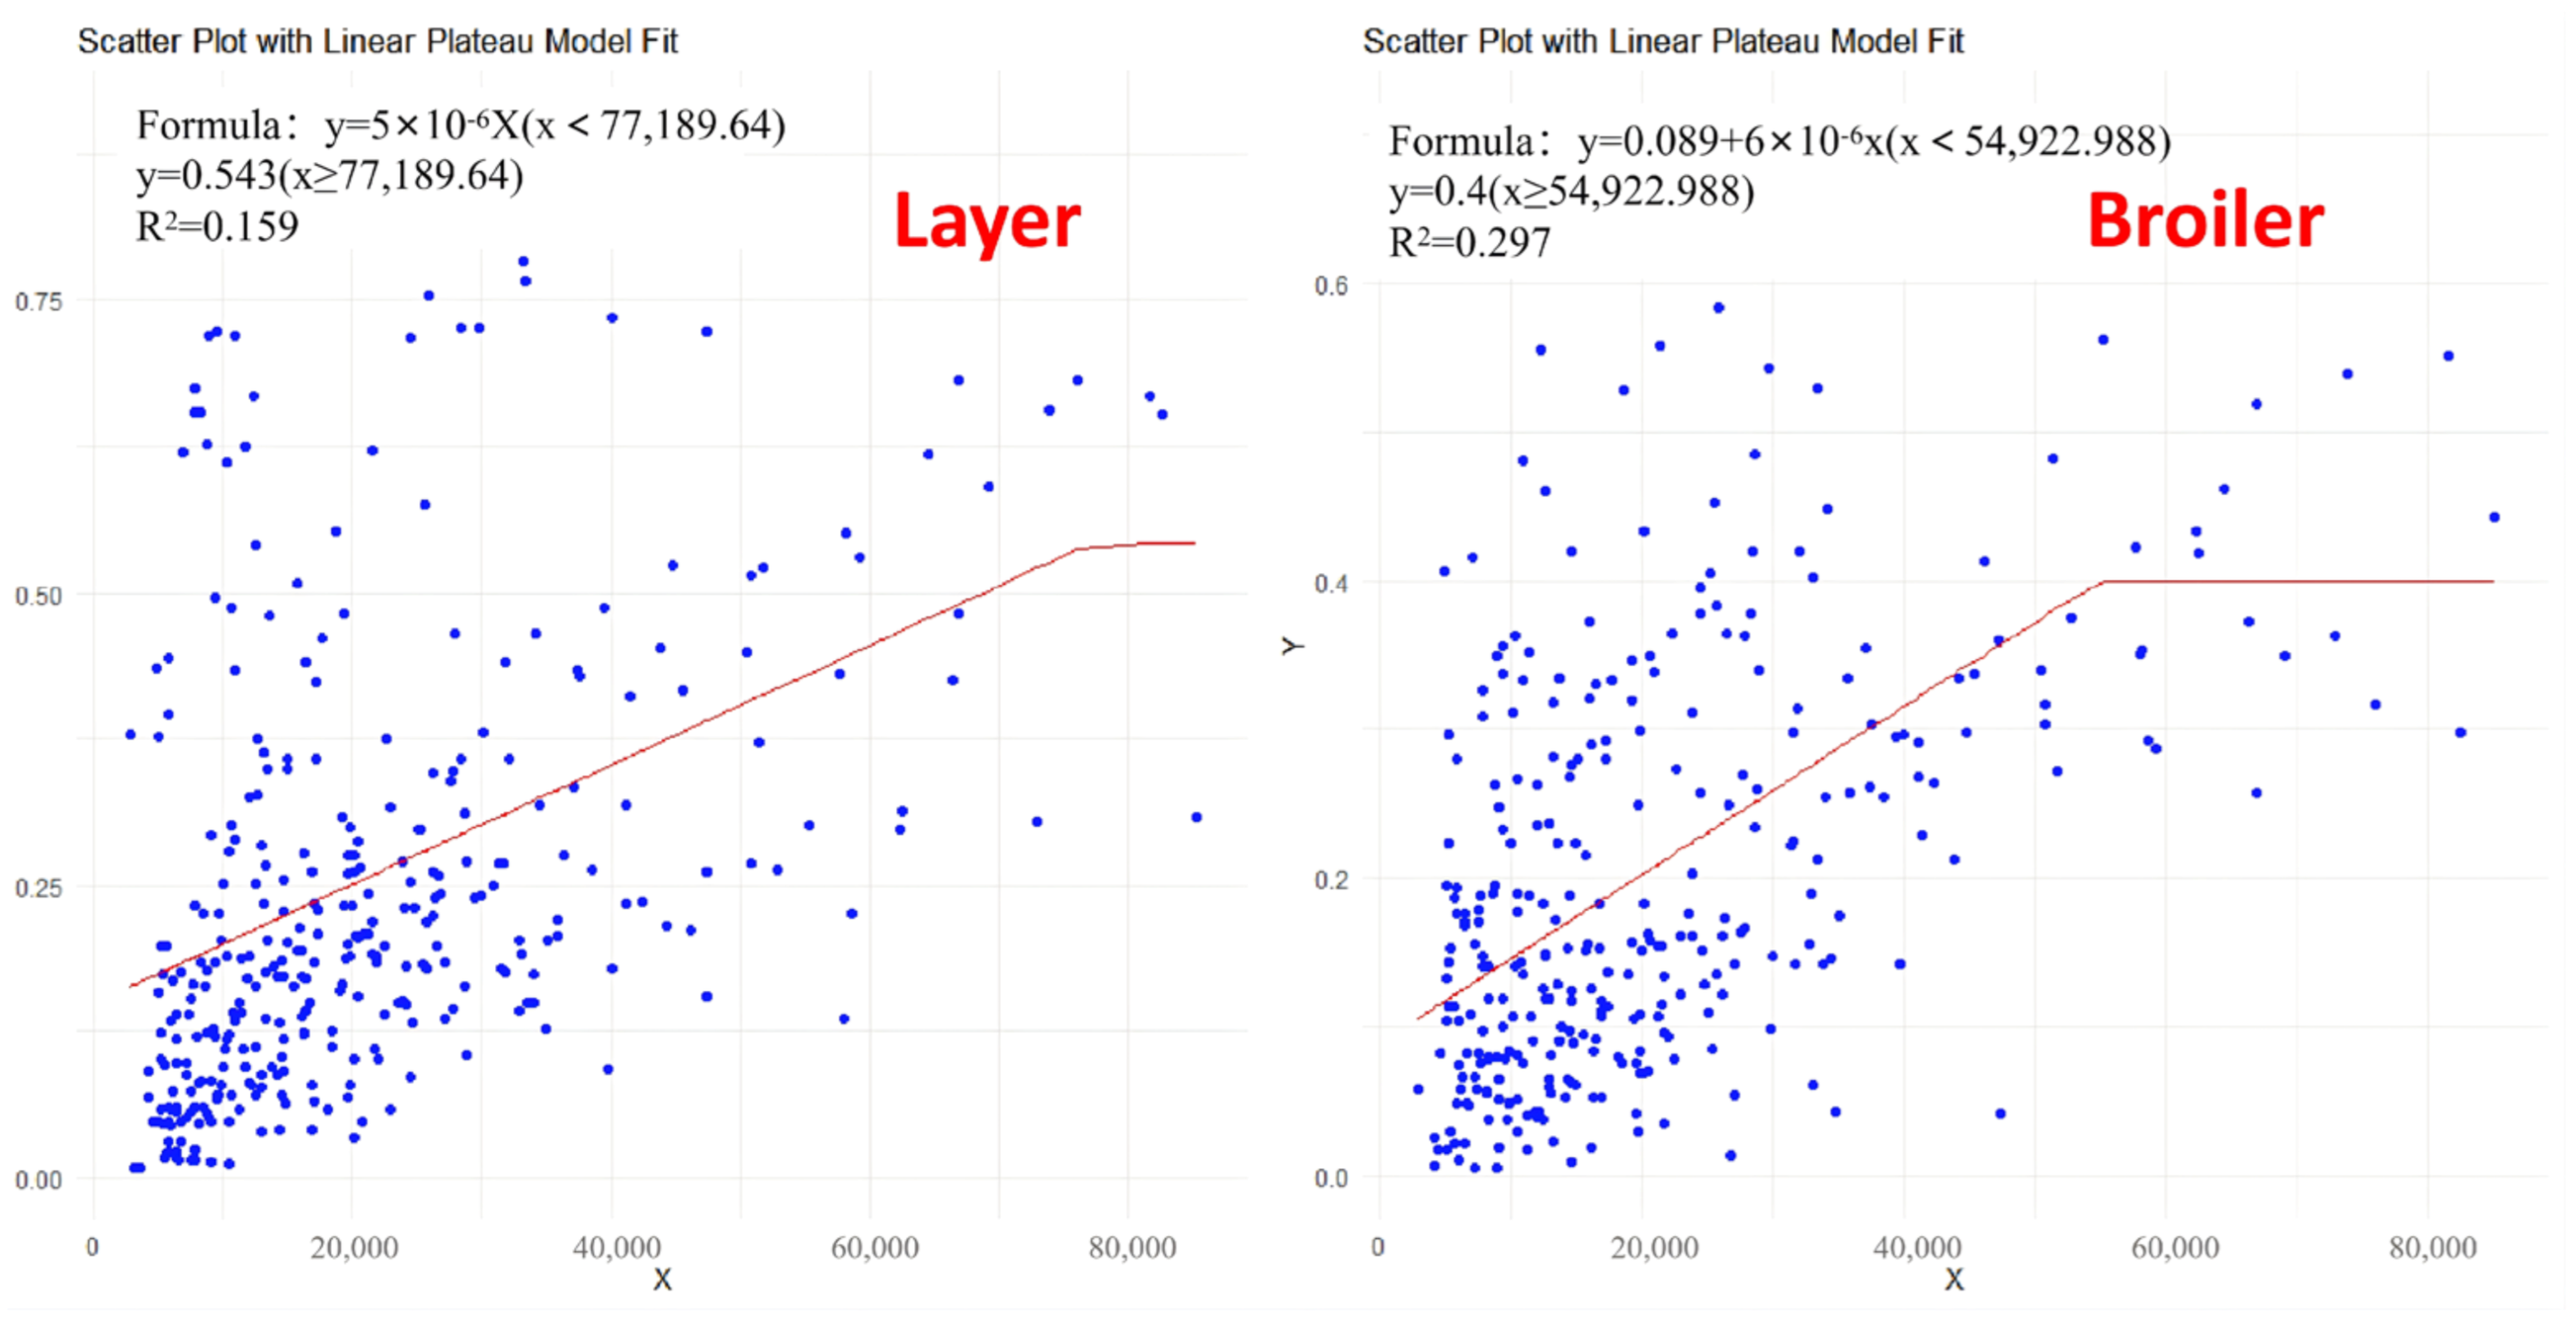
A linear regression was performed using the per capita GDP data of each province in China from 2001 to 2010 and the corresponding poultry stock and number of farms (households) in each province. The resulting fitting formula is shown in Figure A1.
Figure A1. Fitting Relationships Between Per Capita GDP and the Scale of Layer and Broiler Farming.
Agriculture 16 01177 g0a1
Data on the amount of large-scale farming in Hebei Province by county were obtained according to the fitting formula:
A m o u n t l a r g e   s c a l e , i , u n c o r r = P l a r g e s c a l e , u n c o r r T A B i
where Amountlarge scale,uncorr: the uncorrected amount of breeding in the large-scale farms; TAB: the total amount of breeding in the different county. Plarge-scale: uncorrected proportion of large-scale farming. See the calculation formula in Figure A1; i: the county of Hebei province.
The initially estimated proportions of large-scale farming were used to calculate the number of animals raised under large-scale systems at the county level. While the individual county-level estimates were generally within reasonable ranges, their sum exceeded the actual observed total at the provincial level. To correct for this overestimation, a uniform correction coefficient was introduced. This coefficient was calculated as the ratio of the observed provincial-level total of large-scale animals to the sum of the uncorrected county-level estimates. The correction coefficients were calculated as follows:
C F = A m o u n t l a r g e   s c a l e , p r o v i n c e A m o u n t l a r g e   s c a l e , i , u n c o r r
where CF: the correction factor; Amountlarge scale,uncorr: the uncorrected amount of breeding in the large-scale farms; Amountlarge scale,province: the amount of breeding in the large-scale farms in the whole province; and i: the county of Hebei province.
According to the correction factor, to obtain the proportion of poultry scale in Hebei province county:
P S = A m o u n t l a r g e   s c a l e , i , u n c o r r C F T A B i
where PS: the percentage of large-scale farming of layers (broilers); CF: the correction factor; TAB: the total amount of breeding in the different county; and i: the county of Hebei province.

Appendix A.1.2. Classification of Farming Scale

At the county-level, farm-scale distribution was determined by classifying farms into large (≥10 k layers/50 k broilers), medium, and traditional based on China Animal Husbandry Statistics.
Due to insufficient survey data, we were unable to differentiate manure treatment methods among small- and medium-scale operations. Consequently, we assumed that all small- and medium-scale facilities adopted static composting methods, while distinguishing four distinct composting approaches for large-scale operations.

Appendix A.1.3. BAU and BSF Treatment of Chicken Manure GHG Emissions

The construction- and energy-related GHG equations in this section follow standard life cycle inventory calculation procedures, in which material or energy inputs are multiplied by corresponding emission factors. Infrastructure and equipment material emission factors were obtained from SimaPro 9.0, Ecoinvent, and Agri-footprint, while electricity-related emissions were calculated using official electricity emission factors, as summarized in Table A5.
GHG emissions during equipment construction consist primarily of GHG emissions from the ground, the roof and the production of raw materials for the equipments. These emissions are calculated by multiplying the different types of feeds by an emission factor, as shown in Equation (A4).
  E E q u i p m e n t , k = ( F i , k × E F i , k   )
where E E q u i p m e n t : the total GHG emissions of the equipment for processing 1 ton of chicken manure (dry matter), kg CO2 eq; F: the quantity of the main materials of the equipment for processing 1 ton of chicken manure (dry matter), (kg or m2/t). Considering equipment depreciation, Table A5; EF: GHG emission factor per unit of equipment material, kg CO2 eq kg−1, Table A5; i: material type, Table A5; k: equipment type, Table A5.
  E E n e r g y = ( F × E F   )
where EEnergy: the total GHG emissions of energy consumption for processing 1 ton of chicken manure (dry matter), kg CO2 eq; F: electricity consumption for processing 1 ton of chicken manure (dry matter), kWh/t, Table A5. EF: GHG emission factor for electricity consumption for treating 1 ton of chicken manure (dry matter), kg CO2 eq kWh−1 (Table A5).
The CH4, direct N2O, and indirect N2O equations were adapted from the IPCC manure-management emission accounting framework [24,25]. Technology-specific composting parameters, including carbon loss, nitrogen loss, CH4-C loss, N2O-N loss, and NH3-N loss, were derived from composting studies and are summarized in Table A1, mainly following Liu et al. [20].
E p r o c e s s C H 4 = T C × C   ( l o s s ) × P C C H 4 × 16 12 × 28
where E p r o c e s s C H 4 : CH4 emissions from treatment of 1 kg of chicken manure (dry matter), kg CO2 eq; TC: percentage of TC content in composted chicken manure, %; C (loss): C loss from chicken manure composting, %; PC-CH4: the CH4-C content in C loss,%; 16 12 : the coefficient of CH4-C conversion to CH4; and 28: global warming potential of methane (Table A1).
E p r o c e s s N 2 O = T N × N ( l o s s ) × P N N 2 O × 44 28 × 265
where E p r o c e s s N 2 O : N2O emissions from treatment of 1 kg of chicken manure (dry matter), kg CO2 eq; TN: percentage of TN content in composted chicken manure, %; N (loss): N loss from chicken manure composting, %; PN-N2O: the N2O-N content in N loss,%; 44 28 : the coefficient of N2O-N conversion to N2O; and 265: global warming potential of nitrous oxide (Table A1).
E p r o c e s s N H 3 = T N × P N N H 3 × N   ( l o s s ) × 44 28 × 265 × 0.01
where E p r o c e s s N H 3 : NH3 emissions from treatment of 1 kg of chicken manure (dry matter), kg CO2 eq; TN: percentage of TN content in composted chicken manure, %; N (loss): NH3-N loss from chicken manure composting, %; PN-NH3: the NH3-N content in C loss,%; 44 28 : the coefficient of N2O-N conversion to N2O; 265: Global warming potential of N2O, Table A1; and 0.01: the conversion factor for NH3 volatilization to N2O.
Table A1. Nutrient losses during composting.
Co-SubstrateManure/Co-Substrate RatioTC (%)TN (%)N2O-N (Loss) (%)NH3-N (Loss) (%)CH4-C (Loss) (%)
SCStraw83:1732.32.420.4318.090.007
WCStraw83:1732.32.420.4714.380.445
TCStraw83:1732.32.421.5226.540.383
RCStraw83:1732.32.421.1518.090.879
The GHG reduction from organic fertilizer substitution was assessed by accounting for the avoided emissions associated with the production of synthetic N, P2O5 and K2O fertilizers. Emission factors for fertilizer production were derived from established life cycle inventory databases and literature sources. The total avoided GHG emissions were calculated by multiplying the amounts of N, P, and K nutrients replaced by organic sources with their respective production-related emission factors. The calculation can be found in the following formula:
E O f = E N + E P + E K
E N = F × E F N
E P = F × E F P × 0.436
E K = F × E F K × 0.831
where F: yield of organic fertilizer (NPK) that can be produced by treating 1 ton of chicken manure (dry matter), kg t−1 (Table A2 and Table A3); EF: GHG emission factor per unit of NPK fertilizer, kg CO2 eq kg−1 (Table A2 and Table A3); 0.436: coefficient of conversion of P to P2O5; and 0.831: coefficient of conversion of K to K2O.
Table A2. Nutrient production during composting (BAU).
FertilizerProduction Capacity (kg)Emission Factor (kg/kg)
N0.01247.76
P0.00992.33
K0.01080.66
Table A3. Nutrient production during bioconvertion (BSF).
FertilizerProduction Capacity (kg)Emission Factor (kg/kg)
LayerN3.537.76
P2.692.33
K2.750.66
BroilerN3.867.76
P2.942.33
K3.010.66
The equations for soybean-protein substitution, land saving, and BECCS-related mitigation were adapted from previous studies on insect-protein substitution, mini-livestock production, and protein-transition-related land sparing [22,23]. First, the substitution avoids emissions associated with soybean protein production. Second, the land that would otherwise be used for soybean cultivation is assumed to be spared and reallocated to bioenergy production with carbon capture and storage (BECCS), contributing to additional carbon removal. The total feed-substitution and land-use mitigation credit was calculated as the sum of avoided soybean-production emissions and BECCS-related carbon removal, using the following formulas:
E f e e d l a n d = E A v o i d   s o y b e a n s + E B E C C S r e m o v a l
E A v o i d   s o y b e a n s = F × E F s o y b e a n s
E B E C C S r e m o v a l = 13.9 1.34 × F × E F B E C C S r e m o v a l
where E f e e d l a n d is the total feed-substitution and land-use mitigation credit, kg CO2eq t−1 manure; E A v o i d   s o y b e a n is the avoided GHG emissions from soybean protein production, kg CO2eq t−1 manure; E B E C C S r e m o v a l is the carbon removal from reallocating theoretically saved cropland to BECCS, kg CO2eq t−1 manure; F is the insect protein produced by treating 1 ton of chicken manure dry matter, kg t−1; E F s o y b e a n is the GHG emission factor of soybean protein, kg CO2eq kg−1 protein; E F B E C C S is the BECCS carbon removal factor per unit land area, kg CO2eq m−2; 13.9 is the land requirement for soybean protein production in Asia, m2 kg−1 protein; and 1.34 is the multiple cropping index.
Table A4. BECCS parameters during bioconvertion (BSF).
Production Capacity UnitEmission Factor (kg/kg)
CPBSF protein65kg t−13.24
Saving land676m2 kg−11.54
AUBSF protein70kg t−13.24
Saving land724m2 kg−11.54
Table A5. (A) Business as usual (BAU) -total consumption and carbon emission factor for treating chicken manure (dry matter); (B) Black soldier fly (BSF) -total consumption and carbon emission factor for treating chicken manure (dry matter).
(A)
Composting MethodProjectRaw MaterialsConsumptionUnitEmission FactorUnitFactor Source
Static compostingGroundCement0.0041m2/t215kg CO2 eq/m2SimaPro 9.0-Ecoinvent and Agri-footprint
RoofPVC Plastic0.0128kg/t2kg CO2 eq/kgSimaPro 9.0-Ecoinvent and Agri-footprint
Windrow compostingGroundCement0.0043m2/t215kg CO2 eq/m2SimaPro 9.0-Ecoinvent and Agri-footprint
RoofPVC Plastic0.0135kg/t2kg CO2 eq/kgSimaPro 9.0-Ecoinvent and Agri-footprint
Aeration PumpAluminum alloy
(die-cast aluminum)
0.0034kg/t20kg CO2 eq/kgSimaPro 9.0-Ecoinvent and Agri-footprint
Aeration PipesSilica0.0015kg/t15.7kg CO2 eq/kgSimaPro 9.0-Ecoinvent and Agri-footprint
FlipperCarbon steel0.0426kg/t0.951kg CO2 eq/kgSimaPro 9.0-Ecoinvent and Agri-footprint
Electricity38kWh/t0.7901Kg CO2/kWhGovernment Official Website
Trough compostingGroundCement0.0043kg/t215kg CO2 eq/m2SimaPro 9.0-Ecoinvent and Agri-footprint
RoofPVC Plastic0.1855kg/t2kg CO2 eq/kgSimaPro 9.0-Ecoinvent and Agri-footprint
Composting aisleCement0.0021kg/t215kg CO2 eq/m2SimaPro 9.0-Ecoinvent and Agri-footprint
Aeration PumpAluminum alloy
(die-cast aluminum)
0.0034kg/t20kg CO2 eq/kgSimaPro 9.0-Ecoinvent and Agri-footprint
Aeration PipesSilica0.0015kg/t15.7kg CO2 eq/kgSimaPro 9.0-Ecoinvent and Agri-footprint
FlipperCarbon steel0.0426kg/t0.951kg CO2 eq/kgSimaPro 9.0-Ecoinvent and Agri-footprint
Electricity38kWh/t0.7901Kg CO2/kWhGovernment Official Website
Reactor compostingGroundCement0.0001kg/t215kg CO2 eq/m2SimaPro 9.0-Ecoinvent and Agri-footprint
CFCS-40Stainless steels0.1142kg/t0.00000188kg CO2 eq/kgSimaPro 9.0-Ecoinvent and Agri-footprint
Electricity63kWh0.7901Kg CO2/kWhGovernment Official Website
(B)
Composting MethodProcessProjectRaw MaterialsConsumptionUnitEmission FactorUnitFactor Source
Cement pool-GroundCement3.82m2/t215kg CO2 eq/m2SimaPro 9.0-Ecoinvent and Agri-footprint
RoofPolyethylene0.006kg/t2.19kg CO2 eq/kgSimaPro 9.0-Ecoinvent and Agri-footprint
Thermal Air
Drying System
Polypropylene0.046kg/t0.808kg CO2 eq/kgSimaPro 9.0-Ecoinvent and Agri-footprint
Stainless steels0.443kg/t1.88kg CO2 eq/kgSimaPro 9.0-Ecoinvent and Agri-footprint
Rock wool0.88kg/t1.14kg CO2 eq/kgSimaPro 9.0-Ecoinvent and Agri-footprint
Electricity0.66kWh/t0.7901Kg CO2/kWhGovernment Official Website
Automated breeding tanksTray cleaning-Chromium steel pipe0.372kg/t4.90 kg CO2 eq/m2SimaPro 9.0-Ecoinvent and Agri-footprint
Tap water1004.2kg/t0.0015 kg CO2 eq/kgSimaPro 9.0-Ecoinvent and Agri-footprint
Potassium
hydroxide
11.15kg/t2.52 kg CO2 eq/m2SimaPro 9.0-Ecoinvent and Agri-footprint
Sodium hydroxide, without water, in 50%55.79kg/t1.35 kg CO2 eq/kgSimaPro 9.0-Ecoinvent and Agri-footprint
Climate controlCarbon steelPolyethylene terephthalate0.0127 kg/t1.06 kg CO2 eq/kgSimaPro 9.0-Ecoinvent and Agri-footprint
Air conditionerSteel, low-alloyed, hot rolled0.2kg/t1.92 kg CO2 eq/kgSimaPro 9.0-Ecoinvent and Agri-footprint
Dry larvae and frass storagePaloxesPolyethylene, low density, granulate0.3kg/t3.24kg CO2 eq/kgSimaPro 9.0-Ecoinvent and Agri-footprint
Process control and lightsLampElectronics0.0014kg/t288kg CO2 eq/kgSimaPro 9.0-Ecoinvent and Agri-footprint
ComputerElectronics0.0055kg/t162kg CO2 eq/kgSimaPro 9.0-Ecoinvent and Agri-footprint
Grinding and feedingShredderChromium steel pipe0.44kg/t4.9kg CO2 eq/kgSimaPro 9.0-Ecoinvent and Agri-footprint
FeederChromium steel pipe0.18kg/t4.9kg CO2 eq/kgSimaPro 9.0-Ecoinvent and Agri-footprint
ReactorRollsChromium steel pipe2.76 kg/t4.90 kg CO2 eq/kgSimaPro 9.0-Ecoinvent and Agri-footprint
Steel table plateChromium steel pipe0.36 kg/t4.90 kg CO2 eq/kgSimaPro 9.0-Ecoinvent and Agri-footprint
Roller ballsChromium steel pipe0.73 kg/t4.88 kg CO2 eq/kgSimaPro 9.0-Ecoinvent and Agri-footprint
PusherChromium steel pipe1.18 kg/t4.90 kg CO2 eq/kgSimaPro 9.0-Ecoinvent and Agri-footprint
Pusher plateChromium steel pipe0.00 kg/t kg CO2 eq/kgSimaPro 9.0-Ecoinvent and Agri-footprint
Conveyor frameAluminium, primary, cast alloy slab from continuous casting0.10 kg/t4.90 kg CO2 eq/kgSimaPro 9.0-Ecoinvent and Agri-footprint
End table frameAluminium, primary, cast alloy slab from continuous casting0.84 kg/t17.45 kg CO2 eq/kgSimaPro 9.0-Ecoinvent and Agri-footprint
End table conveyorAluminium, primary, cast alloy slab from continuous casting0.12 kg/t17.46 kg CO2 eq/kgSimaPro 9.0-Ecoinvent and Agri-footprint
TraysPolyethylene, low density, granulate0.18 kg/t17.51 kg CO2 eq/kgSimaPro 9.0-Ecoinvent and Agri-footprint
40×40 end scaffoldsAluminium, primary, cast alloy slab from continuous casting2.21 kg/t2.19 kg CO2 eq/kgSimaPro 9.0-Ecoinvent and Agri-footprint
Main 40 × 80 scaffoldsAluminium, primary, cast alloy slab from continuous casting0.02 kg/t2.19 kg CO2 eq/kgSimaPro 9.0-Ecoinvent and Agri-footprint
BraceChromium steel pipe0.16 kg/t2.19 kg CO2 eq/kgSimaPro 9.0-Ecoinvent and Agri-footprint
Harvesting handlerHarvesting handlerAluminium, primary, cast alloy slab from continuous casting0.034 kg/t17.48 kg CO2 eq/kgSimaPro 9.0-Ecoinvent and Agri-footprint
Aluminium, primary, cast alloy slab from continuous casting0.005 kg/t11.89 kg CO2 eq/kgSimaPro 9.0-Ecoinvent and Agri-footprint
Steel, low-alloyed, hot rolled0.014 kg/t1.92 kg CO2 eq/kgSimaPro 9.0-Ecoinvent and Agri-footprint
Aluminium removed by drilling, computer numerical controlled0.012 kg/t11.90 kg CO2 eq/kgSimaPro 9.0-Ecoinvent and Agri-footprint
Sieving-Chromium steel pipe0.097kg/t4.9kg CO2 eq/kgSimaPro 9.0-Ecoinvent and Agri-footprint
BlanchingBlanchingChromium steel pipe0.01 kg/t4.91 kg CO2 eq/kgSimaPro 9.0-Ecoinvent and Agri-footprint
Tap water890.12 kg/t0.0015 kg CO2 eq/kgSimaPro 9.0-Ecoinvent and Agri-footprint
DryingDryerChromium steel pipe0.478 kg/t4.90 kg CO2 eq/kgSimaPro 9.0-Ecoinvent and Agri-footprint
Dried larvae conveyorAluminium, primary, cast alloy slab from continuous casting0.012 kg/t17.45 kg CO2 eq/kgSimaPro 9.0-Ecoinvent and Agri-footprint

Appendix A.1.4. Calculation of Insect Protein and Organic Fertilizer Output After Bioconversion of Black Soldier Fly

The equations for soybean-protein substitution, land saving, and BECCS-related mitigation were adapted from previous studies on insect-protein substitution, mini-livestock production, and protein-transition-related land sparing [22,23].
D M I n s e c t   f r a s s = D M M a n u r e × ( 1 45.57 % )
D M I n s e c t   f r a s s = D M M a n u r e × ( 1 40.55 % )
where D M I n s e c t   f r a s s : dry matter content of insect frass produced by treating one ton of chicken manure (DM), kg t−1; 45.57: percentage of manure reduction (DM) from black soldier fly treatment of chicken manure from layers, %; and 40.55: percentage of manure reduction (DM) from black soldier fly treatment of chicken manure from broilers, % (Table A6).
D M B S F = W 6.43 × ( 1 75 % )
D M B S F = W 6 × ( 1 75 % )
where DMBSF: dry matter content of black soldier fly larvae produced by treating one ton of chicken manure (DM), kg t−1; 6.43: FCR (Feed Conversion Ratio) of layers chicken manure treated by black soldier fly; 6: FCR (Feed Conversion Ratio) of briolers chicken manure treated by black soldier fly; and 75: water content of black soldier fly, % (Table A6).
P p r o t e i n = W f r e s h   w e i g h t × D M B S F × 41.9 %
where Pprotein: amount of protein produced by black soldier fly treatment of chicken manure, kg t−1; 41.9: protein content of black soldier fly larvae, %.
L U = 13.9 × P p r o t e i n 1.34
where Lu: land saved by black soldier fly treatment of chicken manure for protein production, m2; 13.9: land required for soybean protein production in Asia, m2 kg−1; and 1.34: multiple cropping index (Table A4).
O F T N = 1 + 17 83 × 1 0.19 × 0.013 × W f r e s h   w e i g h t
O F T P = 1 + 17 83 × 1 0.19 × 0.01 × W f r e s h   w e i g h t
O F T K = 1 + 17 83 × 1 0.19 × 0.011 × W f r e s h   w e i g h t
where
  • OFTN,TP,TK: BAU scenario NPK content from chicken manure compost, kg t−1.
  • 17 83 : Mixing ratio of chicken manure and straw, Table A1.
  • 0.19: Fertilizer yield from composting 1 ton of chicken manure (DM), kg t−1.
  • 0.013: TN content produced by composting 1 ton of chicken manure straw, kg t−1.
  • 0.01: TP content produced by composting 1 ton of chicken manure straw, kg t−1.
  • 0.011: TK content produced by composting 1 ton of chicken manure straw, kg t−1.
O F T N = D M I n s e c t   f r a s s × W f r e s h   w e i g h t × 0.22
O F T P = D M I n s e c t   f r a s s × W f r e s h   w e i g h t × 0.16
O F T K = D M I n s e c t   f r a s s × W f r e s h   w e i g h t × 0.17
where
  • OFTN,TP,TK: BSF scenario NPK content from chicken manure compost, kg t−1.
  • 0.22: TN content produced by composting 1 ton of chicken manure bioconvention, kg t−1.
  • 0.16: TP content produced by composting 1 ton of chicken manure bioconvention, kg t−1.
  • 0.17: TK content produced by composting 1 ton of chicken manure bioconvention, kg t−1.

Appendix A.2. Black Soldier Fly (BSF) C Scenario

BSF A-BAU: the large-scale portion is treated using traditional cement ponds (low-technology), while the traditional- and medium-scale portions are treated using static composting technology (BAU).
BSF B-BAU: the large-scale portion is treated using automated breeding tanks, while the small- and medium-scale portions are treated using traditional static composting techniques (BAU).
BSF C: combining the black soldier fly (BSF) biotransformation technology with traditional manure management techniques.
BSF-C accounts for farm-scale heterogeneity in black soldier fly rearing systems. Specifically, large-scale farms use automated breeding tanks with cement ponds, while medium and small-scale farms use conventional business-as-usual (BAU) treatment methods. The large-scale farms are assumed to adopt BSF technology preferentially due to higher capital and technical capacity.
In the quantitative analysis of the GHG emission reduction effects of the two treatment schemes, BSF A-BAU and BSF B-BAU, the results show that the BSF A-BAU scheme achieves a total of 1.2 Tg of GHG emission reduction, of which the emission reduction of the large-scale portion is 1.4 Gg, and this portion plays a key role in the overall emission reduction. In contrast, the BSF B-BAU program achieved a total reduction of 12 Tg, of which the reduction of the large-scale part was 12.6 Tg. It can be seen that the BSF B-BAU shows a certain advantage over the BSF A-BAU in terms of GHG emission reduction, and is able to reduce GHG emissions more effectively.
Further economic analysis showed that the BSF A-BAU program realized a total of $971 million in net benefits over the course of its implementation. However, the BSF B-BAU program ended up costing $5072 million due to higher cost inputs. This suggests that although BSF B-BAU performs better in terms of emission reduction, it still faces challenges in cost control and needs to be further optimized to improve its economic viability.
Figure A2. Distribution of Layer and Broiler Breeding in Hebei Province.
Agriculture 16 01177 g0a2
Figure A3. Greenhouse gas (GHG) emissions under different situations (current situation—BAU, traditional cement pool based black soldier fly treatment – BSF-A, and advanced automated feeding tanks based black soldier fly treatment—BSF-B) of chicken manure treatment for layer manure (upper panel) and broiler manure (bottom panel) at the county level in 2021.
Agriculture 16 01177 g0a3
Table A6. Mean data on the output of bioconversion of poultry manure by BSF in different studies.
ItemCement PondsAutomated Feeding Tanks
Percentage reduction in dry weight of manure (%)45.57 145.57 1
40.55 240.55 2
Moisture content of insect frass (%)3030
Insect moisture content (%)7575
FCR6.436
Note: 1 for layer manure, 2 for broiler manure.
The cost parameters in Table A7 and Table A8 were organized according to conventional techno-economic assessment frameworks for manure composting and BSF-based organic-waste treatment systems [20,27,30]. Total costs included land, infrastructure, equipment, depreciation, labor, energy, maintenance, and auxiliary materials, while revenues from organic fertilizer, BSF frass, and BSF protein were deducted in the net-cost calculations described in the main text.
Table A7. (A) Business as usual (BAU)-Static composting equipment-specific costs; (B) Business as usual (BAU)-Windrow composting equipment-specific costs; (C) Business as usual (BAU)-Trough composting equipment-specific costs.
(A)
CategoryProjectComposting Method
Static Composting
Coverage Area (m2)267
Fundamental cost Cost (×1000 $)Lifetime of Use (year)Raw materialsData source
Land area19.9550-Government Official Website
Ground19.815Concrete1688.com
Roof45PVC Plastic1688.com
Operation costAccessories materials10.7--[20]
Bio-microbial cost1.5--
Labor cost5.4--
Depreciation expense2.1--
(B)
CategoryProjectComposting Method
Windrow Composting
Coverage area (m2)141
Fundamental cost Cost (×1000 $)Lifetime of Use (year)Raw materialsData source
Land area10.550-Government Official Website
Ground25.115Concrete1688.com
Roof2.15PVC Plastic1688.com
Equipment34.6715Aeration Pump[20]
Aeration Pipes
Flipper
Operation costElectricity consumption2.4--
Accessories materials 10.7--
Bio-microbial cost1.5--
Labor cost5.4--
Depreciation expense11--
(C)
CategoryProjectComposting Method
Trough Composting
Coverage area (m2)141
Fundamental cost Cost (×1000 $)Lifetime of Use (year)Raw materialsData source
Land area10.550-Government Official Website
Ground25.115Concrete1688.com
Roof2.15PVC Plastic1688.com
Equipment35.615Composting Channel[20]
Aeration Pump
Aeration Pipes
Flipper
Operation costElectricity consumption2.4--
Accessories materials 10.7--
Bio-microbial cost1.5--
Labor cost5.4--
Depreciation expense11--
(D)
CategoryProjectComposting Method
Reactor Composting
Coverage area (m2)8.5
Fundamental cost Cost (×1000 $)Lifetime of Use (year)Raw materialsData source
Land area0.650-Government Official Website
Ground0.615Concrete1688.com
Equipment175.210Bottom Gas Supply of 4 kW Central Fan[20]
Flipper (once a day)
Operation costElectricity consumption4--
Accessories materials 3.6--
Labor cost5.4--
Depreciation expense17.6--
Table A8. Black soldier fly (BSF) cement pool bioconversion of chicken manure equipment use.
CategoryProjectMaterialEnergy Consumption (Kwh)Volume of Consumption (m2)Depreciation (Years)Data SourceCost ($)Data Source
Coverage Area (m2)20
Fundamental costLand area2050 1496.4Government Official Website
Cement pondcement-2.289615Farm survey941688.com
Shading netpolyethylene-405Farm survey0.11688.com
Hot-air dryingHigh temperature resistant plastic tray(polypropylene)12205Farm survey18431688.com
Stainless steels194
Rock wool386
Composting materialsWheat bran--2.25-Farm survey11688.com
Water--5.25-Farm survey0.041688.com
Egg of insect--30-Farm survey3.81688.com
Labor2 × 8 d-Farm survey368.5Farm survey
Table A9. Coefficient of excretion of poultry manure.
ItemUnitValue
Layerkg·d−10.125
Broilerkg·d−10.12
Chickenkg·d−10.12
Layerkg·d−10.15
Broilerkg·d−10.10
Table A10. Layers and broilers handled by different treatment methods.
SHWCTCRC
LayerAmount (Tg)16.630.340.320.45
Proportion93.71%1.92%1.82%2.55%
BroilerAmount (Tg)3.760.230.140.17
Proportion87.48%5.25%3.25%4.02%
Note: SH: static heap; WC: windrow composting; TC: Trough composting; RC: reactor composting.
Table A11. GHG emissions from BAU scenario.
SHWCTCRC
Amount of composted manure (Gg)20,385.87566.16463.33625.32
Equipment emissions (Gg)5.490.260.150.01
Energy consumption and emissions (Gg)_5.034.129.26
Treatment process emissions (Gg)CH46.2210.987.7323.95
N2O319.639.7025.6826.22
NH3 (indirectly)134.472.974.484.12
Fertilizer emission reductions (Gg)0.690.020.020.002
Total emissions (Gg)465.1228.9342.1563.57
Note: SH: static heap; WC: windrow composting; TC: Trough composting; RC: reactor composting.
Table A12. GHG emissions from BSF scenarios.
Cement PondAutomated Feeding Tank
Amount of composted manure (Gg)22,040.722,040.7
Equipment emissions (Gg)3454.151112.93
Energy consumption and emissions (Gg)712.7767.85
Treatment process emissions (Gg)CH426.6626.66
N2O0.280.28
NH3 (indirectly)65.1365.13
Replacement of soybean feed emissions reduction (Gg)1163.071246.73
Land Conservation (BECCS) Emission Reduction (Gg)5734.446005.34
Fertilizer emission reductions (Gg)213.05213.05
Total emissions (Gg)−2852−6193
Table A13. Total economic cost.
ProjectBAUBSF-ABSF-B
SCWCTCRCCPAU
Total cost (Million USD)127.8 13.97 13.77 16.34 1627.87 111202.19 1
28.88 22.62 21.63 22.42 2155.3 22711.5 2
Total profitability
(Million USD)
Organic fertilizer/frass−766 1−15.7 1−14.9 1−20.861−445 1−445 1
−173 2−10.38 2−6.45 2−7.95 2−117.64 2−117.64 2
BSF protein----−1068.75 1−1145.69 1
----−258.69 2−277 2
Net economic cost (Million USD)−638 1−11.73 1−11.13 1−14.52 1−885.88 19611.49 1
−144 2−7.76 2−4.82 2−5.53 2−221 22316.54 2
Notes: SC: static composting. WC: windrow composting. TC: trough composting. RC: reactor composting. CP: cement pool based black soldier fly treatment. AU: automated feeding tanks based black soldier fly treatment. 1 for layer manure, 2 for broiler manure. BAU including SH. WC. TC.RC. BSF-A: CP. BSF-B: AU. Organic fertilizer/frass: Price of the total amount of organic fertilizer derived from 1 ton of dry chicken manure ($/t manure). BSF protein: Total price of BSF protein derived from 1 ton of dry chicken manure ($/t manure).
Table A14. Sensitivity analysis of key parameters in BAU and BSF scenarios.
SystemParameterBaseline−20%20%Main Affected Output
BSFFCR6.43/6.005.14/4.807.72/7.20Protein output, GHG mitigation
BSFLarval crude protein content0.4190.3350.503Protein output, substitution benefits
BSFEquipment cost28.34/631.30 $ t−1−20%20%Economic cost
BAUDirect GHG emission factorbaseline−20%20%Composting GHG emissions
BAUUnit operating costbaseline−20%20%Economic cost

References

  1. Liu, H.Y.; Shen, Y.Y.; Zheng, J.L.; Zhang, L.H.; Yang, X.Y.; Qi, Y.B. Safety Assessment of Cultivated Land Production and Zoning of Potential Productivity Improvement in North China Plain. J. Agric. Sci. Technol. 2025, 27, 180–192. [Google Scholar]
  2. National Bureau of Statistics of China. China Rural Statistical Yearbook 2022; China Statistics Press: Beijing, China, 2022.
  3. Ru, S.H.; Su, D.C.; Zhang, Y.Z.; Zhang, G.Y.; Geng, N.; Sun, S.Y.; Wang, L. Contents and Characteristics of Heavy Metals in the Livestock and Poultry Manure from the Large-scale Farms in Hebei Province, China. J. Agric. Resour. Environ. 2016, 33, 533–539. [Google Scholar]
  4. Yu, T.; Gong, W.Y.; Zhang, L.Y.; Feng, M.S.; Niu, Y.B.; Ma, X.L.; Wang, L.Z.; Xing, G.Z.; Yang, L.; Song, D.; et al. Investigation on the Macro-element Contents of Feed Ingredients for Livestock and Poultry in Hebei Province. China Poult. 2020, 42, 115–120. [Google Scholar]
  5. Focusing on Industrial Objectives to Promote the High-Quality Development of Hebei’s Egg and Broiler Chicken (Poultry) Industry. Available online: https://nyncj.sjz.gov.cn/columns/dae71eb4-0230-414d-ace1-e486318fa45c/202401/29/8af7321d-1383-4b5a-ad32-fa978161e9bd.html (accessed on 29 January 2024).
  6. Qi, J.M.; Yang, H.; Wang, X.Y.; Zhu, H.X.; Wang, Z.X.; Zhao, C.Z.; Li, B.; Liu, Z.W. State-of-the-art on animal manure pollution control and resource utilization. J. Environ. Chem. Eng. 2023, 11, 110462. [Google Scholar] [CrossRef]
  7. Zhang, L.L.; E, R.H.; Ali, M.; Lin, H.J.; Zhang, S.; Jin, S.Z.; Hu, J.J.; Yao, Y.Q.; Sun, Y.; Yan, S.P.; et al. Livestock and Poultry Manure Management from the Perspective of Carbon Neutrality in China. Eng. Agric. 2023, 10, 341–362. [Google Scholar]
  8. Buccaro, M.; Toscano, A.; Balzarotti, M.; Re, I.; Bosco, D.; Bettiga, M. Techno-Economic Assessment of APS-Based Poultry Feed Production with a Circular Biorefinery Process. Sustainability 2023, 15, 2195. [Google Scholar] [CrossRef]
  9. Ravindran, V. Poultry Feed Availability and Nutrition in Developing Countries. In Poultry Development Review. Food and Agriculture Organization of the United Nations; FAO: Rome, Italy, 2013; pp. 60–63. [Google Scholar]
  10. Salahuddin, M.D.; Abdel-Wareth, A.A.A.; Hiramatsu, K.; Tomberlin, J.K.; Luza, D.; Lohakare, J. Flight toward Sustainability in Poultry Nutrition with Black Soldier fly Larvae. Animals 2024, 14, 510. [Google Scholar] [CrossRef] [PubMed]
  11. Ferronato, N.; Paoli, R.; Romagnoli, F.; Tettamanti, G.L.; Torretta, V. Environmental impact scenarios of organic fraction municipal solid waste treatment with Black Soldier fly larvae based on a life cycle assessment. Environ. Sci. Pollut. Res. 2024, 31, 17651–17669. [Google Scholar] [CrossRef]
  12. Ee, K.Y.; Lam, M.Q.; Mah, J.K.; Mearnam, A. Black soldier fly (Hermetia illucens L.) larvae in degrading agricultural waste as a sustainable protein production: Feedstock modification and challenges. Int. J. Trop. Insect Sci. 2022, 42, 3847–3854. [Google Scholar] [CrossRef]
  13. Lu, S.Y.; Taethaisong, N.; Meethip, W.; Surakhunthod, J.; Simpoo, B.; Sroichak, T.; Archa, P.; Thongpea, S.; Paengkoum, S.; Purba, R.A.P.; et al. Nutritional Composition of Black Soldier fly Larvae (Hermetia illucens L.) and Its Potential Uses as Alternative Protein Sources in Animal Diets: A Review. Insects 2022, 13, 831. [Google Scholar] [CrossRef]
  14. Wang, X.B.; Ma, Y.; Cao, Y.J.; Wang, Q.; Wu, N.; Wang, X.M. Fertilizing Effects of Black Soldier fly Larval Frass Composts Sourced from Pig and Chicken Manure on Soil Microbial Community and Maize Seedling Growth. J. Soil Sci. Plant Nutr. 2025, 25, 27–39. [Google Scholar] [CrossRef]
  15. Cattaneo, A.; Belperio, S.; Sardi, L.; Martelli, G.; Ncai, E.; Dabbou, S.; Meneguz, M. Black Soldier fly Larvae’s Optimal Feed Intake and Rearing Density: A Welfare Perspective (Part II). Insects 2025, 16, 5. [Google Scholar] [CrossRef]
  16. Beyers, M.; Coudron, C.; Ravi, R.; Meers, E.; Bruun, S. Black Soldier Fly Larvae as an Alternative Feed Source and Agro-Waste Disposal Route: A Life Cycle Perspective. Resour. Conserv. Recycl. 2023, 192, 106917. [Google Scholar] [CrossRef]
  17. Salomone, R.; Saija, G.; Mondello, G.; Giannetto, A.; Fasulo, S.; Savastano, D. Environmental Impact of Food Waste Bioconversion by Insects: Application of Life Cycle Assessment to Process Using Hermetia illucens. J. Clean. Prod. 2017, 140, 890–905. [Google Scholar] [CrossRef]
  18. National Accounts of Well-Being. In Encyclopedia of Quality of Life and Well-Being Research; Springer International Publishing: Cham, Switzerland, 2023; pp. 4571–4577.
  19. Makkar, H.P.S.; Tran, G.; Meuzé, V.; Anark, P. State-of-the-art on use of insects as animal feed. Anim. Feed. Sci. Technol. 2014, 197, 1–33. [Google Scholar] [CrossRef]
  20. Liu, Z.L.; Wang, X.; Wang, F.H.; Bai, Z.H.; Chuck, D.; Misselbrook, T.; Ma, L. The progress of composting technologies from static heap to intelligent reactor: Benefits and limitations. J. Clean. Prod. 2020, 270, 122328. [Google Scholar] [CrossRef]
  21. Hao, P.X.; Wu, X.F.; Liu, Z.L.; Tian, L.J.; Zhang, X.H.; Wang, L.; Bai, Z.H.; Ma, L. Integrating traditional and biotechnological innovations for mitigating greenhouse gas emissions in dairy farming in China. J. Clean. Prod. 2025, 486, 144457. [Google Scholar] [CrossRef]
  22. Bai, Z.H.; Wu, X.F.; Lassaletta, L.; Haverkamp, A.; Li, W.; Yuan, Z.W.; Mailafiya, E.; Uwizeye, A.; Sanz-Cobena, A.; Zhang, N.; et al. Investing in mini-livestock production for food security and carbon neutrality in China. Proc. Natl. Acad. Sci. USA 2023, 120, e2304826120. [Google Scholar] [CrossRef]
  23. Rueda, O.; Mogollón, J.M.; Tukker, A.; Scherer, L. A Protein Transition Can Free Up Land to Tap Vast Energy and Negative Emission Potentials. Cell Rep. Sustain. 2024, 1, 100021. [Google Scholar] [CrossRef]
  24. Wang, F.H.; Ma, W.Q.; Dou, Z.X.; Ma, L.; Liu, X.L.; Xu, J.X.; Zhang, F.S. The estimation of the production amount of animal manure and its environmental effect in China. China Environ. Sci. 2006, 26, 614–617. [Google Scholar]
  25. IPCC. 2006 IPCC Guidelines for National Greenhouse Gas Inventories. Volume 4: Agriculture, Forestry and Other Land Use, Chapter 10: Emissions from Livestock and Manure Management; Intergovernmental Panel on Climate Change: Geneva, Switzerland, 2006.
  26. IPCC. 2019 Refinement to the 2006 IPCC Guidelines for National Greenhouse Gas Inventories. Volume 4: Agriculture, Forestry and Other Land Use, Chapter 10: Emissions from Livestock and Manure Management; Intergovernmental Panel on Climate Change: Geneva, Switzerland, 2019.
  27. Liu, Y.; Tang, R.L.; Li, L.Q.; Zheng, G.M.; Wang, J.M.; Wang, G.Y.; Bao, Z.Y.; Yin, Z.M.; Li, G.X.; Yuan, J. A global meta-analysis of greenhouse gas emissions and carbon and nitrogen losses during livestock manure composting: Influencing factors and mitigation strategies. Sci. Total Environ. 2023, 885, 163900. [Google Scholar] [CrossRef]
  28. Pan, F.; Peng, S.J.; Yu, C.Y.; Zhu, X.T.; Li, S.H.; Liu, Y. Effects of chicken manure on Hermetia illucens larvae and accumulation of fatty acids, proteins and other nutrients. Chin. J. Appl. Entomol. 2024, 61, 358–369. [Google Scholar]
  29. Alege, F.P.; Gu, X.Y.; Tao, H.Y.; Mino, G.J.; Ndegwa, P.M. Dairy manure compost pelleting process: A techno-economic analysis. J. Clean. Prod. 2021, 310, 127481. [Google Scholar] [CrossRef]
  30. Semenov, M.V.; Zhelezova, A.; Ksenofontova, N.A.; Ivanova, E.A.; Nikitin, D. Chicken manure as an organic fertilizer: Composting technologies and impact on soil properties (a review). Dokuchaev Soil Bull. 2023, 160–198. [Google Scholar] [CrossRef]
  31. Pahmeyer, M.J.; Siddiqui, S.A.; Pleissner, D.; Gołaszewski, J.; Heinz, V.; Smetana, S. An automated, modular system for organic waste utilization using Hermetia illucens larvae: Design, sustainability, and economics. J. Clean. Prod. 2022, 379, 134727. [Google Scholar] [CrossRef]
  32. Foelske, L.; van Riper, C.J. Assessing spatial preference heterogeneity in a mixed-use landscape. Appl. Geogr. 2020, 125, 102355. [Google Scholar] [CrossRef]
  33. Stipniece, A.A.; Vladinovskis, V.; Daugulis, P.; Zemite, M.; Mezule, L. Advantages and Challenges of Composting Reactors for Household Use: Smart Reactor Concept. Sustainability 2022, 14, 10030. [Google Scholar] [CrossRef]
  34. Xu, Y.X.; Ma, T.; Yuan, Z.; Tian, J.X.; Zhao, N. Spatial patterns in pollution discharges from livestock and poultry farm and the linkage between manure nutrients load and the carrying capacity of croplands in China. Sci. Total Environ. 2023, 901, 166006. [Google Scholar] [CrossRef]
  35. Zhang, L.; Ren, J.; Bai, W. A Review of Poultry Waste-to-Wealth: Technological Progress, Modeling and Simulation Studies, and Economic- Environmental and Social Sustainability. Sustainability 2023, 15, 5620. [Google Scholar] [CrossRef]
  36. He, Z.L.; Xia, Z.Q.; Zhang, Y.; Liu, X.J.; Oenema, O.; Ros, G.H.; de Vries, W.; Xu, W.; Hou, Y.; Wang, H.L.; et al. Ammonia mitigation measures reduce greenhouse gas emissions from an integrated manure-cropland system. J. Clean. Prod. 2023, 422, 138561. [Google Scholar] [CrossRef]
  37. Cao, Y.J.; Wu, N.; Shi, L.J.; Xu, X.Y.; Wang, X.B. Effects of nitrogen fertilizer replacement with different sourced-black soldier fly frass on rice growth, physiological characteristics and soil properties. Appl. Soil Ecol. 2025, 208, 105975. [Google Scholar] [CrossRef]
  38. Lomonaco, G.; Franco, A.; De Smet, J.; Scieuzo, C.; Salvia, R.; Falabella, P. Larval Frass of Hermetia illucens as Organic Fertilizer: Composition and Beneficial Effects on Different Crops. Insects 2024, 15, 293. [Google Scholar] [CrossRef] [PubMed]
  39. Diener, S.; Zurbrügg, C.; Tockner, K. Bioaccumulation of heavy metals in the black soldier fly, Hermetia illucens and effects on its life cycle. J. Insects Food Feed. 2015, 1, 1–10. [Google Scholar] [CrossRef]
  40. Han, X.X.; Han, J.W.; Dong, S.Q.; He, H.T. Present Situation, Problems and Countermeasure of Soybean Production in Hebei Province. China Seed Ind. 2025, 5–9. [Google Scholar]
  41. FAO. OECD-FAO Agricultural Outlook 2024–2033; FAO: Rome, Italy; Paris, France, 2024.
  42. van Huis, A.; Oonincx, D.G.A.B. The environmental sustainability of insects as food and feed. A review. Agron. Sustain. Dev. 2017, 37, 43. [Google Scholar] [CrossRef]
  43. Li, Q.; Qin, W.J.; Cao, X.F.; Hou, D.J.; Jiang, H. Research progress on resource utilization of livestock and poultry manure based on transformation by black soldier fly. J. Huazhong Agric. Univ. 2022, 41, 169–175. [Google Scholar]
  44. Huis, A. Potential of Insects as Food and Feed in Assuring Food Security. Annu. Rev. Entomol. 2012, 58, 563–583. [Google Scholar] [CrossRef]
  45. Leipartz, M.; Hogeveen, H.; Sattler, H. Economic impact of inclusion of black soldier fly products in broiler diets: A comparison between conventional and higher animal welfare production systems in the Netherlands. Poult. Sci. 2024, 103, 104411. [Google Scholar] [CrossRef]
Figure 1. The boundaries of greenhouse gas (GHG) emissions of the studied chicken manure treatment and reuse system under the current situation (a) and black soldier fly improved scenarios (b). The GHG emissions including: (1) GHG emissions including the input of raw materials, equipment, constructions, and manure treatment processes (Business as usual—BAU, (the left panel)); (2) GHG emissions reduction through use of organic fertilizers to substitute synthetic fertilizer, and use produced insect protein to substitute imported soybean, and use the saved agricultural land for bio-energy and carbon capture and storage (BECCS) (The right panel).
Agriculture 16 01177 g001
Figure 2. Layer and broiler manure production by large and medium and traditional scale farms, their treatment by different types of technologies for the entire Hebei Province (a,b), and distribution of manure production and treatment rate by different types of technologies at the county level (c,d). Note: Large-scale farms were referring to the stock number of layers >10,000 head per farm, while the slaughter number of broilers >50,000 head per farm.
Agriculture 16 01177 g002
Figure 3. The detailed flow of greenhouse gas (GHG) emissions from layer (upper panel) and broiler (bottom panel) manure treatment under the current situation (BAU, (a,d)), the traditional black soldier fly treatment technology (b,e), and the advanced black soldier fly treatment technology (c,f) in 2021, of which, BSF-A is referring to the traditional black soldier fly treatment technology, and BSF-B is referring to the advanced black soldier fly treatment technology. Unit, Gg CO2 equivalent yr−1 (CO2eq yr−1).
Agriculture 16 01177 g003
Figure 4. Greenhouse gas (GHG) emissions from different types of chicken manure treatment technology (static composting—(a), windrow composting—(b), through composting—(c), and reactor composting—(d)) in the business as usual (BAU) in 2021, and GHG emissions from different types of manure treatment scenarios developed based on BAU (e,f), of which BSF-A is referring to the traditional black soldier fly treatment technology, and BSF-B is referring to the advanced black soldier fly treatment technology. Unit, Gg CO2 equivalent yr−1 (CO2eq yr−1).
Agriculture 16 01177 g004
Figure 5. The total economic cost of chicken manure treatment under the current situation (BAU) and different scenarios, of which BSF-A is referring to the traditional black soldier fly treatment technology, and BSF-B is referring to the advanced black soldier fly treatment technology.
Agriculture 16 01177 g005
Table 1. The detailed costs of different types of composting equipment and black soldier fly treatment technologies, and related benefits.
BAUBSF-ABSF-B
CategoryProjectSCWCTCRCCPAU
Coverage area (m2)2671411418.5202.5
Fundamental costInfrastructure investment ($/t)2.422.392.390.050.75453
Equipment cost ($/t)-9.9102014
Land cost ($/t)0.460.240.240.0111.40
Operation costElectricity consumption ($/t)-2.742.744.57121657
Labor cost ($/t)6.26.26.26.264
Maintenance costs ($/t)0.070.370.380.600.42
Accessories materials expense ($/t)1717171517
Depreciation cost($/t)2.8813132026453
Total cost per ton dry weight of manure ($)263939461202110
PriceOrganic fertilizer/frass ($/t)154154154154841841
912912
BSF protein ($/t)----201215
Net economic cost per ton dry weight ($/t)−128−115−115−108−165 11811 1
−172 21804 2
Notes: SC: static composting. WC: windrow composting. TC: trough composting. RC: reactor composting. CP: cement pool based black soldier fly treatment. AU: automated feeding tanks based on black soldier fly treatment. 1 for layer manure, 2 for broiler manure. BAU including SH. WC. TC. RC. BSF-A: CP. BSF-B: AU. Organic fertilizer/frass: price of the total amount of organic fertilizer derived from 1 ton of dry chicken manure ($/t manure). BSF protein: total price of BSF protein derived from 1 ton of dry chicken manure ($/t manure).
Disclaimer/Publisher’s Note: The statements, opinions and data contained in all publications are solely those of the individual author(s) and contributor(s) and not of MDPI and/or the editor(s). MDPI and/or the editor(s) disclaim responsibility for any injury to people or property resulting from any ideas, methods, instructions or products referred to in the content.