Article

Assessment of Greenhouse Gas Emissions, Economic Benefits, and Emergy-Based Sustainability in Ratoon Rice–Duck Coculture in the Jianghan Plain

1
Hubei Key Laboratory of Resource Utilization and Quality Control of Characteristic Crops, College of Life Science and Technology, Hubei Engineering University, Xiaogan 432000, China
2
Xiangyang Agricultural Technology Extension Center, Xiangyang 441021, China
3
Hubei Key Laboratory of Food Crop Germplasm and Genetic Improvement, Institute of Food Crops, Hubei Academy of Agricultural Sciences, Wuhan 430064, China
4
Yidu Agricultural Ecological Environmental Protection Center, Yidu 443300, China
5
Engineering Research Center of Ecology and Agricultural Use of Wetland, Ministry of Education, College of Agriculture, Yangtze University, Jingzhou 434025, China
*
Author to whom correspondence should be addressed.
Agriculture 2026, 16(11), 1172; https://doi.org/10.3390/agriculture16111172
Submission received: 26 April 2026 / Revised: 23 May 2026 / Accepted: 25 May 2026 / Published: 27 May 2026

Abstract

Ratoon rice monoculture system (RR) is a labor-efficient and high-yielding cropping system in southern China. The rice–duck coculture system has been increasingly recognized as a mutually beneficial agricultural practice. However, the environmental impacts, economic performance, and sustainability of transitioning from a RR monoculture to a ratoon rice–duck system (RR-D) coculture remain unclear. A three-year (2022–2024) field experiment with three replications was therefore conducted in the Jianghan Plain, China (29°41′ N, 112°25′ E), to compare greenhouse gas (GHG) emissions, economic benefits, and emergy-based sustainability indicators between the RR and RR-D systems at a significant level of p < 0.05. The results showed that the RR-D significantly reduced CH4 emissions by 25.7–39.5% but increased N2O emissions by 18.7–122.2%. The average global warming potential (GWP) and GHG intensity decreased by 27.8% and 30.7%, respectively. Meanwhile, RR-D increased economic benefits by 131.0–167.1%, but lowered the unit emergy value per economic benefit (UEVBenefits), renewable emergy ratio (%R), emergy yield ratio (EYR), and emergy sustainability index (ESI), and increased the environmental loading ratio (ELR). Overall, RR-D may improve economic returns and GHG mitigation, but its emergy-based sustainability requires optimization of feed, labor, and duck stocking density.

1. Introduction

Nearly half of the global population relies on rice as a staple food source. With rapid urbanization, further increases in rice production depend on higher yields per unit area rather than expanding cultivated land [1]. The ratoon rice monoculture system (RR) is an important cropping system that increases total grain yield per unit land area through a “one planting, two harvests” strategy. In recent years, the RR cultivation area has exceeded 1.24 million hectares in China [2,3]. Methane (CH4) and nitrous oxide (N2O) emissions from rice paddies account for approximately 40.1% and 11.4% of the total agricultural CH4 and N2O emissions in China, respectively [2]. Studies have shown that replacing double-cropping rice with the RR can reduce greenhouse gas (GHG) emissions by 41.2% [2,4]. However, the longer growing period of the RR leads to prolonged land occupation, posing a major challenge to improving resource use efficiency while ensuring food security and environmental sustainability.
Rice–animal coculture systems have emerged as a promising strategy to improve the sustainability of rice production [5,6]. This is largely attributed to the shallow water conditions of paddy fields, which provide suitable habitats for aquatic animals. For example, the rice–duck coculture system has attracted considerable attention for its combined economic, environmental, and ecological advantages [7,8,9]. Du et al. [10] showed that the rice–duck system significantly reduced weed species richness and biomass while increasing rice yield. The ratoon rice–duck coculture system (RR-D) can reduce GHG emissions by 19–25% [8]. Additionally, the rice–duck coculture system improves duck welfare and meat quality, and enhances economic returns [11,12,13]. However, most existing evaluations focus on single production indicators (e.g., yield and economic returns) or a limited set of environmental indicators (e.g., GHG emissions), which are insufficient for a comprehensive assessment of resource use efficiency and ecological performance of the RR-D.
Emergy analysis (EMA) provides a comprehensive framework for evaluating agricultural sustainability by converting various incomparable forms of energy and materials into a unified unit of solar emergy (sej). In agricultural systems, the solar emergy value of diverse resources (e.g., inputs, labor) is obtained by multiplying their quantities with the corresponding unit emergy value (UEV) or transformity coefficients [14,15,16]. This approach enables an integrated assessment of resource use efficiency, environmental load, and the sustainability of agricultural systems [17,18]. To date, it has been widely applied to evaluate the ecological benefits of diverse sustainable agricultural systems. For example, Xu et al. [5] conducted an EMA on the rice–crab coculture system in the Liaohe River Basin, China, showing that the rice–crab coculture system presented higher energy yield efficiency and lower environmental impact than the monoculture system. Zhou et al. [19] compared the emergy indices of double rice, ratoon rice, and the rice–crawfish system, pointing out that the rice–crawfish coculture system had a higher emergy yield ratio, sustainability index, and lower environmental pressure. Nevertheless, the Jianghan Plain in Hubei Province is dominated by the rice–crawfish system (about 90% of local paddy eco-aquaculture models, 2022), while the RR-D is a newly developed practice that has not been widely promoted. As such, few sustainability studies have focused on this specific system in the Jianghan Plain. With the increasing adoption of the RR, it remains unclear whether integrating ducks into the ratoon rice production system can enhance sustainability without compromising rice yield while simultaneously reducing GHG emissions [20,21]. Therefore, a comprehensive evaluation of the ecological and environmental performance of the RR-D is of great significance for promoting sustainable agricultural production and development.
To address this knowledge gap, a three-year field experiment was conducted to comprehensively evaluate the RR and RR-D systems. The objectives of this study were to (1) compare the yield and GHG emissions performance of the RR and RR-D systems using conventional analytical methods, (2) further evaluate the integrated resource efficiency and system sustainability of the two systems using the EMA method, and (3) assess the economic benefits and emergy efficiency per unit economic benefit of the two cropping systems.

2. Materials and Methods

2.1. Experimental Site

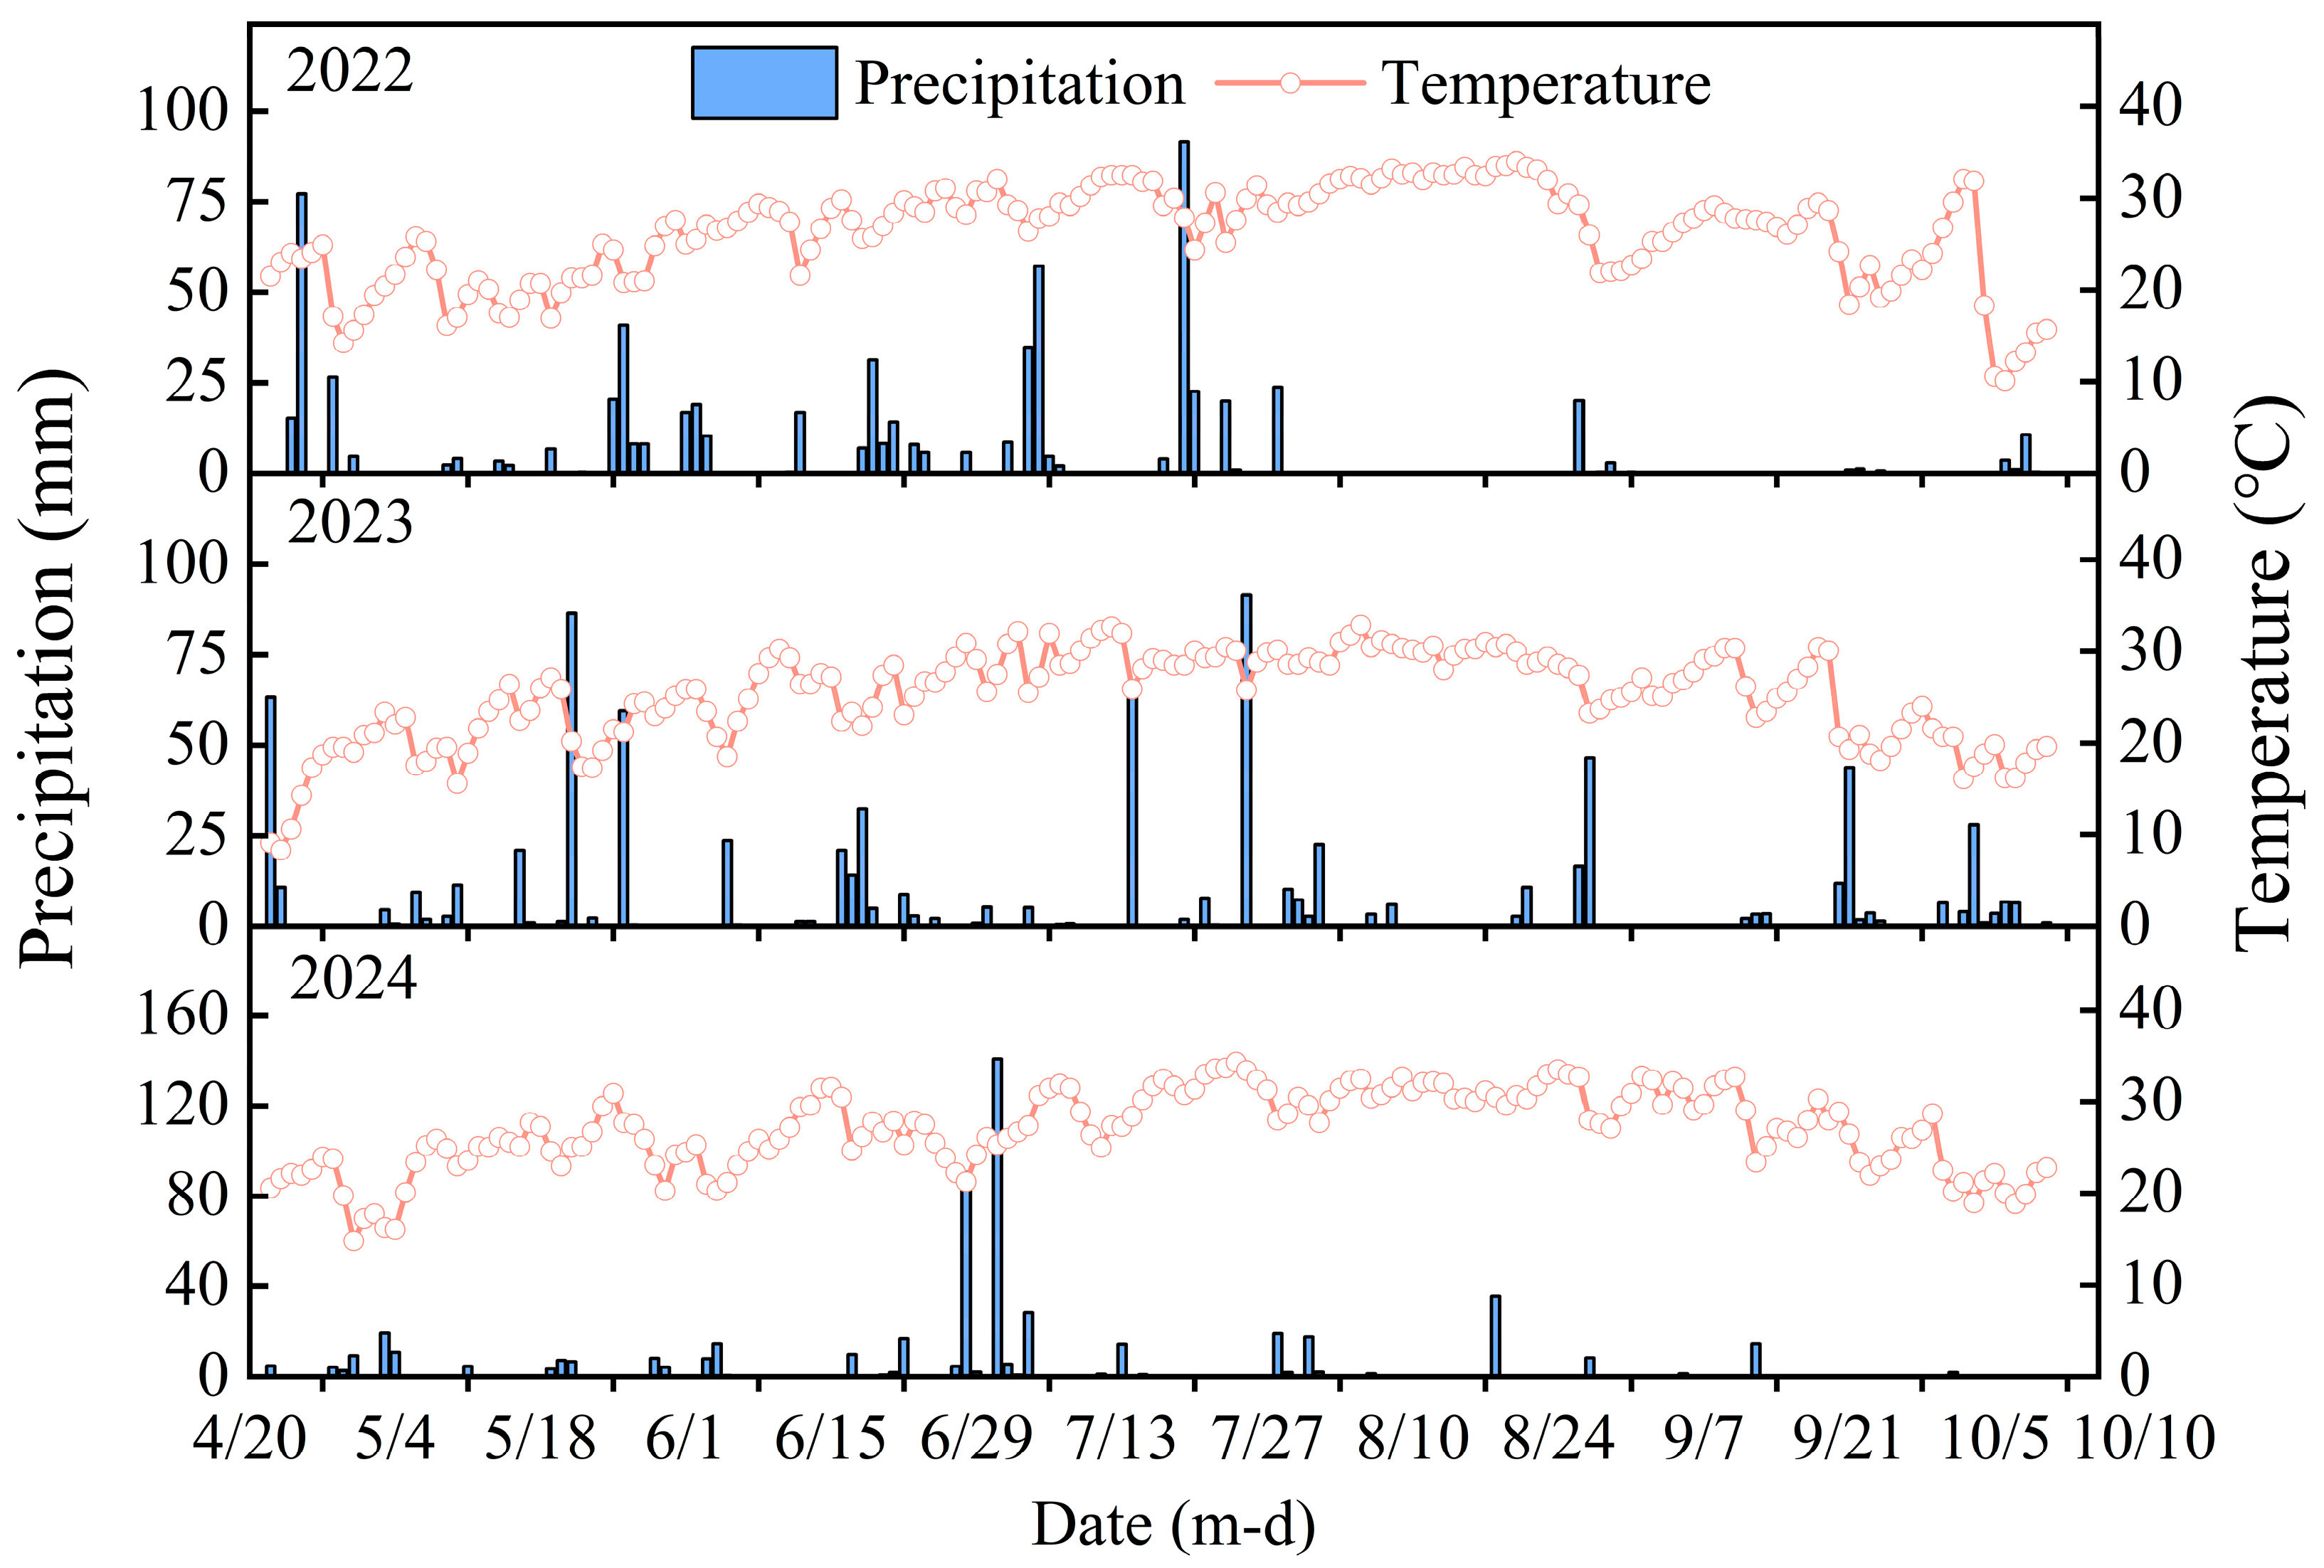
The field experiment was conducted from 2022 to 2024 at the Baizian Village, Gaojimiao Town, Shishou City, Hubei Province, China (29°41′ N, 112°25′ E). The region has a subtropical monsoon climate. The precipitation and temperature during the ratoon rice growing season (from transplanting to harvest) across 2022–2024 are shown in Figure 1. The mean temperatures during the ratoon rice growing seasons in 2022, 2023, and 2024 were 26.2, 25.2, and 27.0 °C, respectively, with a total precipitation of 675.1, 826.6, and 533.8 mm. The initial physicochemical properties of the soil (0–20 cm) were determined using standard agricultural soil analysis methods: pH was measured with a glass electrode pH meter (soil/water = 1:2.5); total nitrogen (TN) by the Kjeldahl method; total phosphorus (TP) by NaOH melting Mo–Sb colorimetry; total potassium (TK) by NaOH melting flame photometry; available phosphorus (AP) by NaHCO3 extraction Mo–Sb colorimetry; available potassium (AK) by NH4OAc extraction flame photometry; and soil organic matter (SOM) by the Walkley–Black wet digestion method. Soil samples were collected from 5 subsamples per plot and mixed into one composite sample, with 3 analytical replicates for each index. The values were as follows: pH 7.2, total nitrogen (TN) 1.5 g kg−1, total phosphorus (TP) 0.6 g kg−1, total potassium (TK) 10.4 g kg−1, available phosphorus (AP) 25.1 mg kg−1, available potassium (AK) 123.6 mg kg−1, and soil organic matter (SOM) 18.5 g kg−1.

2.2. Experimental Design

The experiment was arranged in a randomized complete block design with three replicates. Adjacent blocks were separated by a 1.0 m wide buffer zone, and each plot was isolated by 0.9 m high waterproof ridges to prevent water and fertilizer cross-contamination. A 0.5 m wide border row was set around each plot to reduce edge effects. Each plot was equipped with independent irrigation and drainage pipes to achieve fully independent water management. Two cultivation systems were established: RR and RR-D. The ratoon rice was transplanted on 22 April 2022, 23 April 2023, and 22 April 2024. The main crop was harvested on 10 August 2022, 7 August 2023, and 8 August 2024, while the ratoon crop was harvested on 10 October 2022, 8 October 2023, and 10 October 2024. At the main crop harvest, the stubble height was maintained at 30 cm. Both systems received identical conventional field management throughout the growing season, including water management (shallow irrigation and proper mid-season drainage), unified tillage practices, no chemical pesticides or herbicides, and consistent straw retention, following local standard agronomic protocols for organic ratoon rice production. Each plot covered an area of 165 m2.
Ratoon rice was mechanically transplanted at a spacing of 16 cm × 30 cm. No chemical fertilizers, pesticides, or herbicides were applied in either mode. Organic fertilizer (total N 2.0%, P2O5 3.0%, K2O 3.0%, organic matter ≥ 30%) was applied once as a basal fertilizer 3 days before rice transplanting and fully incorporated into the 0–15 cm soil. The application rate was 3000 kg ha−1, equivalent to 60 kg N ha−1. In the RR-D, ducks were released into the paddy fields 15 days after rice transplanting. The ducks were 15–20 days old at the time of release, with an initial body weight of 150–200 g and a stocking density of approximately 303 ducks ha−1. Female ducks accounted for approximately 70% of the flock. The ducks were removed from the fields at the full heading stage of rice. During the experimental period, the survival rate of the ducks exceeded 95%. After removal from the fields, the ducks were moved to a duck shelter facility for fattening and continued egg production. Eggs were collected daily from the onset of laying until the end of the centralized rearing period. Total egg income was calculated based on the cumulative egg production throughout both the field-based and off-field rearing periods. The ducks were then sold directly. Each RR-D plot was equipped with one duck shelter and one water pond (2–4 m2), with a shading canopy installed above the pond. The plots were separated by 90 cm high mesh fences to prevent duck escape. Ducks were fed with a commercial compound feed purchased from a local feed company. The feed mainly consisted of corn, soybean meal, bran, and mineral supplements, with a crude protein content of ≥16.0%, corresponding to a N content of approximately 2.6% and a metabolic energy content of ≥11.5 MJ kg−1. During the first week after release, ducks were fed twice daily (morning and evening) at 50–80 g duck−1 day−1. Thereafter, ducks were fed once daily in the evening at approximately 100 g duck−1 day−1 according to the growth conditions. The total feed input during the rice–duck coculture period was approximately 2.1 t ha−1. Feed residues in the field were minimal and were rapidly consumed by the ducks. The total feed cost was 7611.58 CNY ha−1. Any dead or missing ducks were replaced promptly to maintain a constant stocking density. The ratoon rice cultivar used in this study was Quanyou 822, and the duck breed was Jingjiang Ma duck.

2.3. Yield Measurement

Before harvesting the main and ratoon crops, the number of productive panicles was counted for each plot. A randomized sampling method was applied to select three independent 1 m2 quadrats (total sampling area = 3 m2) without subjective preference from each 165 m2 plot to avoid selection bias and fully reflect within-plot yield variability. Additionally, at the maturity of main and ratoon crops, 10 rice plants were randomly selected to measure yield components (Table S1). All sampling quadrats were strictly located within the actual rice-growing area; boundary margins, duck activity zones, duck shelters, water ponds, and non-rice vegetated areas (e.g., weeds) were completely excluded from sampling (the same rule was applied for greenhouse gas sampling). Panicles collected from the sampling area were processed by threshing, followed by natural drying and impurity removal. The cleaned grains were then used to determine weight, and yield values were converted to a standard 14% moisture level.

2.4. Gas Collection and Analysis

Fluxes of CH4 and N2O were monitored using the static chamber gas chromatography method. Gas sampling was performed with a custom-made stainless-steel chamber comprising a detachable chamber section (45 cm × 45 cm × 100 cm) and a permanently installed base frame (45 cm × 45 cm × 20 cm). The chamber height was sufficient to accommodate rice growth throughout the entire growing season. To minimize temperature fluctuations caused by direct solar exposure, the outer surface of the chamber was covered with insulating material. A small internal fan was mounted inside the chamber to maintain homogeneous gas distribution during sampling. Following rice transplanting, the chamber base was inserted into the center of each experimental plot. Each chamber base enclosed two rice plants and was inserted into the soil with its upper edge nearly flush with the soil surface. The upper edge of the base was designed with a 2 cm water-sealing groove, which was filled with water immediately before sampling to ensure airtight closure. During the entire experimental period, the presence of the chamber bases did not noticeably restrict duck movement or behavior. Gas sampling was conducted every 7–10 days throughout the rice growing season, covering key stages, including transplanting, tillering, booting, heading, filling, and maturity, as well as 3, 7, and 15 days after fertilization events. In total, approximately 18–22 sets of gas measurements were performed per plot per year for both CH4 and N2O. After placing the chamber onto the base, gas samples were withdrawn at 0, 10, 20, and 30 min using a 100 mL gas-tight syringe (Jiangsu Zhiyu Medical Technology Co., Ltd., Taixing, China). All sampling events were conducted between 09:00 and 11:00, and the air temperature inside the chamber was simultaneously monitored with a digital thermometer.
Collected samples were immediately transferred to the laboratory for concentration analysis of CH4 and N2O using a gas chromatograph (Agilent 7890B, Agilent Technologies, Palo Alto, CA, USA). Methane (CH4) was analyzed using a flame ionization detector (FID) operating at 250 °C, while nitrous oxide (N2O) was analyzed using an electron capture detector (ECD) at 350 °C. High-purity N2 (99.999%) was used as the carrier gas at a flow rate of 30 mL min−1. Standard gases (CH4: 2, 5, 10, 20, 50 ppm; N2O: 0.2, 0.5, 1, 2, 5 ppm) were used for external calibration. A five-point calibration curve (each level injected in triplicate) was constructed by plotting peak area against standard gas concentration using a linear regression forced through the origin. The instrument detection limit (IDL) was defined as a signal-to-noise ratio (S/N) of 3, corresponding to 0.1 ppm for CH4 and 0.02 ppm for N2O; the method detection limit (MDL) was calculated as three times the standard deviation of seven replicate measurements of a low-concentration standard (0.5 ppm for CH4 and 0.05 ppm for N2O), giving 0.15 ppm (CH4) and 0.03 ppm (N2O). Only calibration curves with a coefficient of determination (R2) ≥ 0.995 were accepted for flux calculation. Negative gas fluxes (net uptake) were treated as follows: when the calculated flux was negative but within the range of the method detection limit (i.e., absolute value < MDL), it was considered as below the detection limit and set to zero for cumulative emission calculations; when the absolute value exceeded the MDL, the negative flux was retained and interpreted as a net sink, and its absolute value was included in the calculation of global warming potential (GWP) with a negative sign. The detailed calculation process for gas emission flux, cumulative emissions, GWP, and GHG emission intensity (GHGI) is described in Text S1. The global warming potential (GWP) of CH4 and N2O was calculated according to the IPCC Sixth Assessment Report (AR6) methodology over a 100-year time horizon using conversion coefficients of 27 for CH4 and 273 for N2O [22].

2.5. Emergy Analysis

Based on the emergy methodology proposed by Odum [23], emergy analysis (EMA) converts diverse and incomparable energy and material inputs in agricultural systems into a unified unit of solar emergy (sej) using emergy transformity to achieve a comprehensive assessment of resource use efficiency, environmental load, and system sustainability. To ensure methodological transparency and operational rigor, all emergy parameters are explicitly defined and calculated from field-measured data rather than hypothetical values. In this study, the emergy flow diagrams of the RR and RR-D systems are presented in Figure S1.
According to the classification standard of Xu et al. [5], all emergy inputs and core parameters are operationally defined as follows, with data sources from the 3-year field experiment:
  • Free local renewable resources (LR), including solar radiation, wind energy, rain chemical energy, and river water irrigation (chemical energy). Solar radiation, wind energy, and rain chemical energy data were obtained from the local meteorological station adjacent to the experimental site. Total irrigation water was diverted from external rivers and measured by volumetric water meters, with no overlapping calculation with the chemical energy of rainfall. All parameters were calculated according to the formulae specified in the EMA (Emergy Analysis) methodology.
  • Free local non-renewable resources (LN), mainly referring to net soil loss.
  • Economic imported resources (F), including organic fertilizer, machines and tools, electricity, diesel, labor, rice seeds, juvenile duck, forage, and duck house (wood). All input quantities are derived from 3-year field management records.
  • Renewable economic imported resources (FR) refers to the renewable proportion of economic imported resources (F). It is calculated via standardized renewable natural factors (RNF) summarized from published literature [16,18,19], which are universally acknowledged standard parameters for emergy research in rice agroecosystems.
  • Non-renewable fraction of economic imported resources (FN): Non-renewable proportion of economic imported resources (F).
  • Total emergy input (U): Sum of LR, LN, and F, representing the total emergy input of the agricultural system. U is directly computed from measured field inputs without hypothetical assumptions.
Detailed information on the input quantities and emergy calculation processes for each component in both systems is provided in Tables S2–S7 of the Supplementary Information. Input data for purchased resources, such as fertilizers, machinery, diesel, labor, seeds, juvenile ducks, forage, and wood, were obtained from detailed field records during the three-year experimental period. Meteorological data, including solar radiation, wind speed, and precipitation, were collected from a local automatic weather station near the experimental site. All machinery and infrastructure inputs, including the duck house, were converted into annual emergy flows according to their expected service life. Both the machinery and the duck house were annualized, assuming a service life of 10 years. The emergy transformity values for each input item were adopted from widely used coefficients reported in previous emergy studies of rice agroecosystems [5] to ensure consistency and comparability with previous studies.
To quantitatively evaluate the sustainability characteristics of the two cropping systems, five core emergy indices were calculated as follows:
  • Renewable emergy ratio (%R)
%R = 100 × (LR + FR)/U, where LR = free local renewable emergy; FR = the renewable fraction of purchased inputs; U = the total emergy input. This index reflects the proportion of renewable emergy in the total system input.
2.
Emergy yield ratio (EYR)
EYR = U/F, where U = the total emergy input; F = the economic imported emergy. EYR indicates the ability of the system to exploit local free resources by investing external purchased resources; higher values represent stronger efficiency.
3.
Environmental loading ratio (ELR)
ELR = (LN + FN)/(LR + FR), where LN = free local non-renewable emergy; FN = the non-renewable fraction of purchased inputs. ELR measures the environmental pressure caused by non-renewable resource use.
4.
Emergy sustainability index (ESI)
ESI = EYR/ELR. ESI integrates system output efficiency and environmental load; a higher value indicates better overall sustainability.
5.
Unit emergy value per economic benefit (UEVBenefits)
UEVBenefits = Total emergy input (U)/Net income. This index represents the emergy input required to obtain a unit of net economic return; lower values indicate higher resource economic efficiency.

2.6. Statistical Analysis

Data collation was conducted using Microsoft Excel 2021 (Redmond, WA, USA). All statistical analyses were conducted using SPSS 22.0 (IBM, Inc.; Armonk, NY, USA). Differences between the two systems were evaluated using the least significant difference (LSD) test at a significant level of p < 0.05. The LSD test was only applied to grain yield, GHG emissions, global warming potential, GHG intensity; economic benefits and emergy indices were not included in this statistical comparison. A two-way factorial analysis of ANOVA using SPSS 22.0 (IBM, Inc., Armonk, NY, USA) was used to test the effect of treatment (T) and year (Y), and these interactions on GHG emissions. All figures were generated using Origin 2024 (OriginLab Corp.; Northampton, MA, USA).

3. Results

3.1. Yield

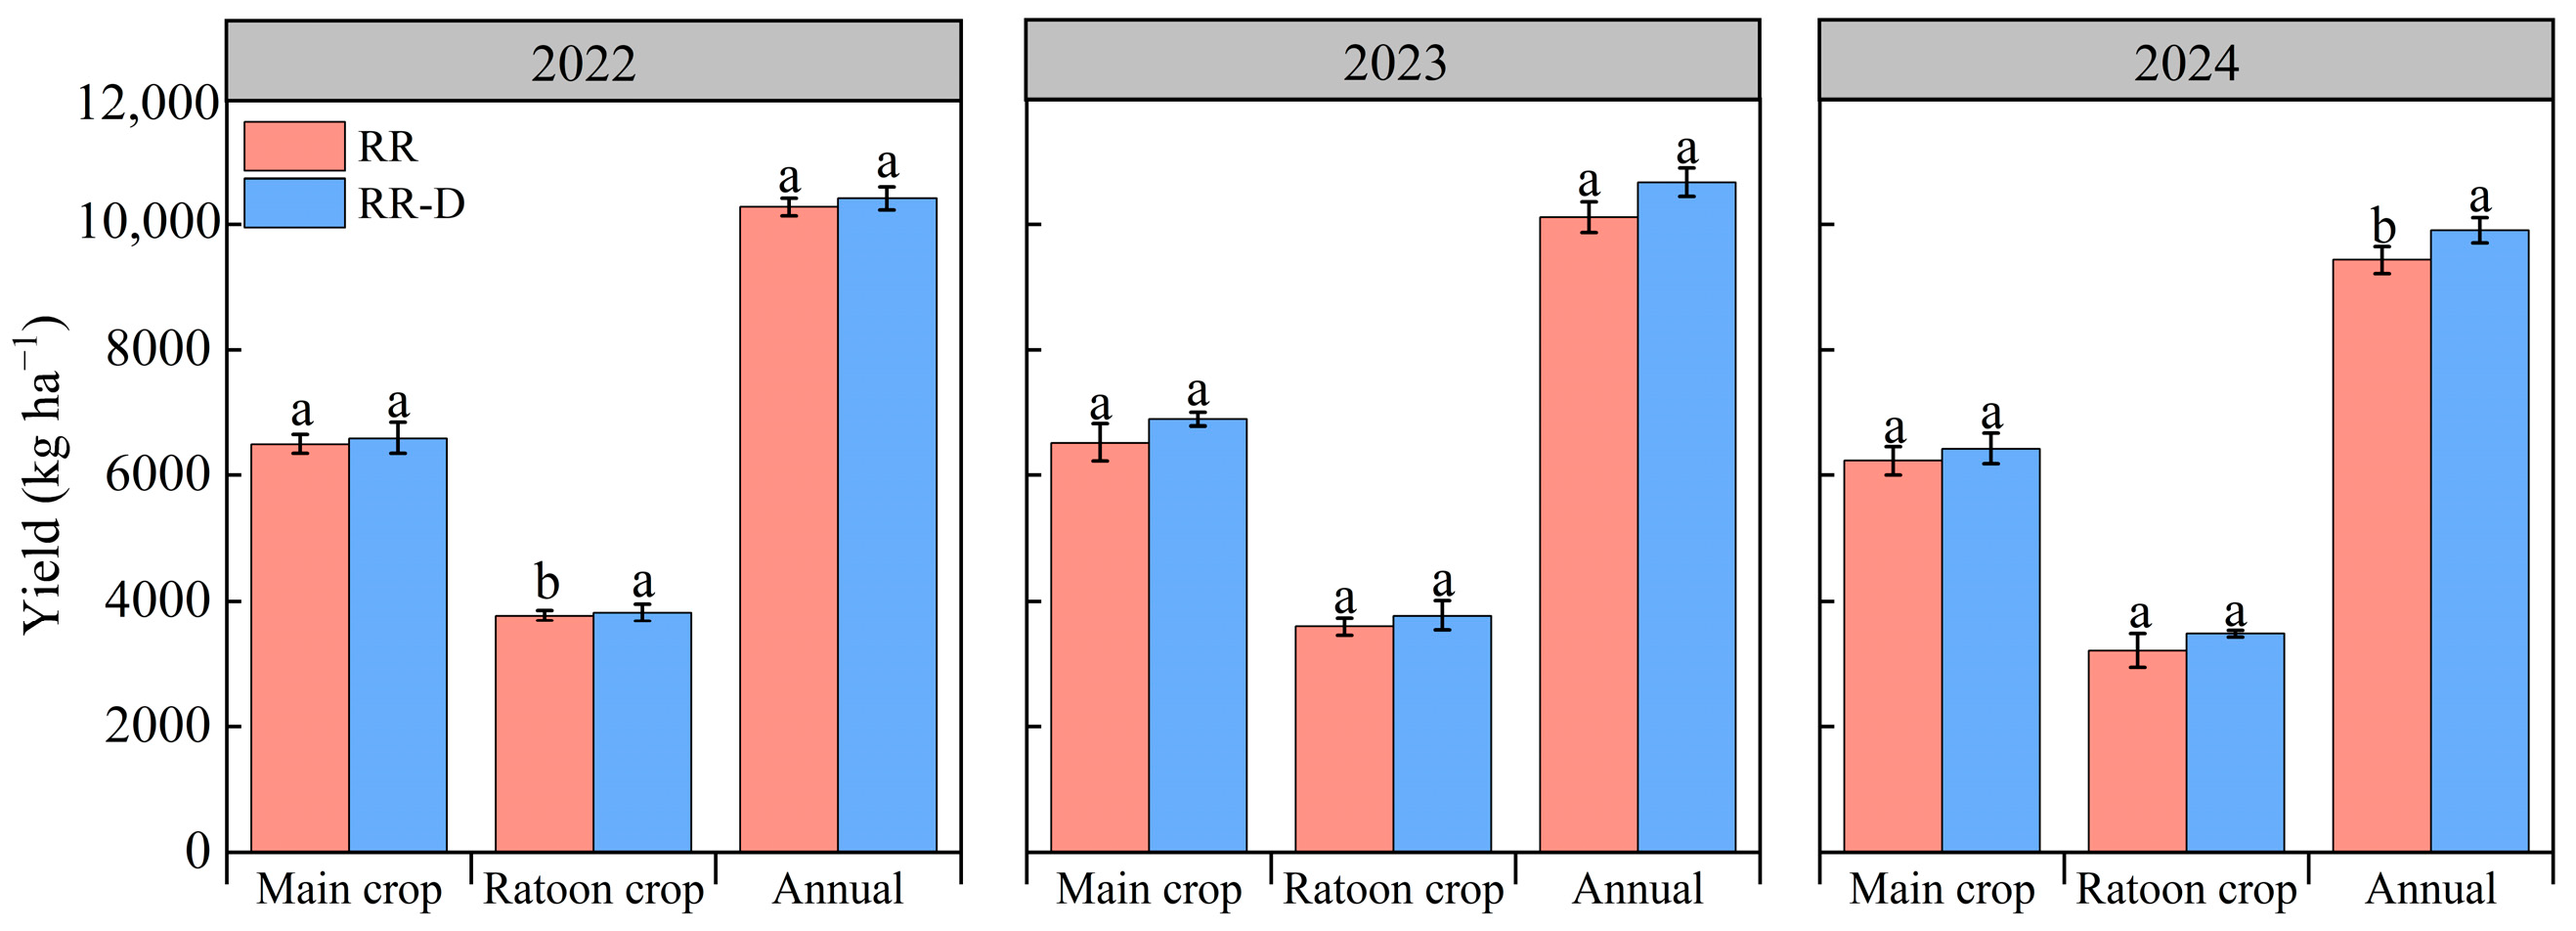
As shown in Figure 2, grain yield ranged from 6233 ± 230.9 to 6898 ± 106.08 kg ha−1 for the main crop and from 3203 ± 270.2 to 3819 ± 138.9 kg ha−1 for the ratoon crop, with total annual yield ranging from 9437 ± 212.21 to 10,671 ± 223.2 kg ha−1. No significant difference was observed in the main crop yield between the two systems. However, compared with the RR, the RR-D increased the ratoon crop yield in 2022. In addition, the RR-D increased the annual yield by 5.0% in 2024 (p < 0.05). Overall, yield remained comparable between treatments, with the RR-D presenting a mild fluctuating growth tendency.

3.2. Greenhouse Gas Cumulative Emissions

The cumulative CH4 and N2O emissions from ratoon rice fields under the RR and RR-D systems are shown in Table 1. Compared with the RR, the RR-D significantly reduced CH4 cumulative emissions in the main crop, ratoon crop, and annual total by 39.1%, 40.8%, and 39.5% in 2022, respectively (p < 0.05). The corresponding reductions were 30.4%, 8.4%, and 27.0% in 2023, and 24.3%, 28.6%, and 25.7% in 2024 (p < 0.05). Compared with the RR, the RR-D significantly increased N2O cumulative emissions. Specifically, N2O emissions from the main crop, ratoon crop, and annual total increased by 42.6%, 65.2%, and 50.0% in 2022, respectively (p < 0.05). The corresponding increases were 12.9%, 35.3%, and 18.7% in 2023, and 157.4%, 73.5%, and 122.2% in 2024 (p < 0.05).

3.3. Global Warming Potential and Greenhouse Gas Emission Intensity

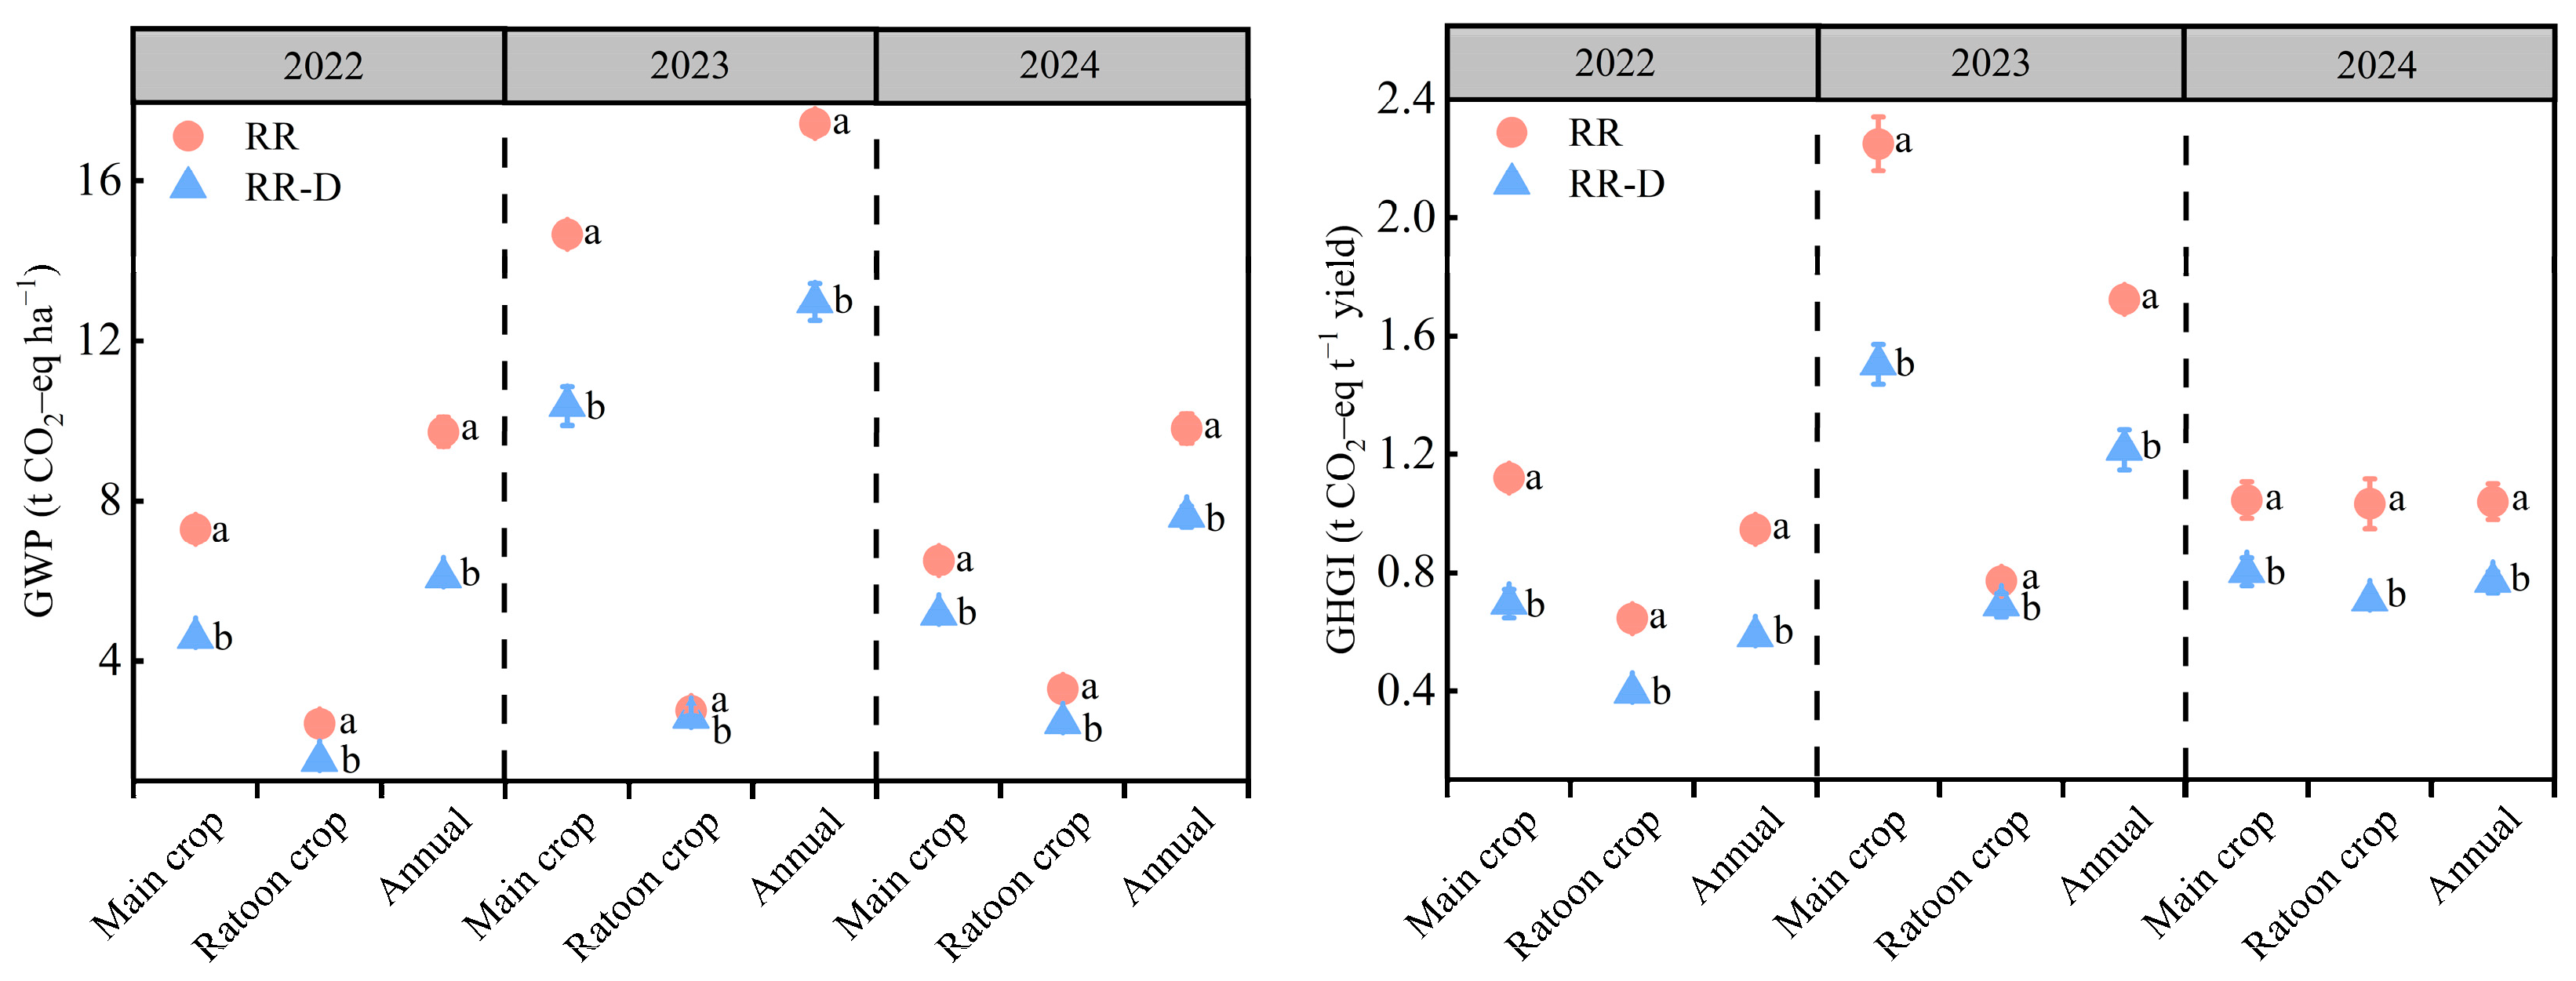
Over the three-year experimental period, compared with the RR, the RR-D consistently and significantly reduced both GWP and GHGI in the main crop, ratoon crop, and annual total (Figure 3). On average, the RR-D reduced GWP by 29.3%, 22.9%, and 27.8% in the main crop, ratoon crop, and annual total, respectively (p < 0.05). Correspondingly, the GHGI was reduced by 32.0%, 26.9%, and 30.7% in the main crop, ratoon crop, and annual total, respectively (p < 0.05). These results indicate that the RR-D effectively mitigates climate-related impacts while maintaining a stable grain yield.

3.4. Economic Benefits

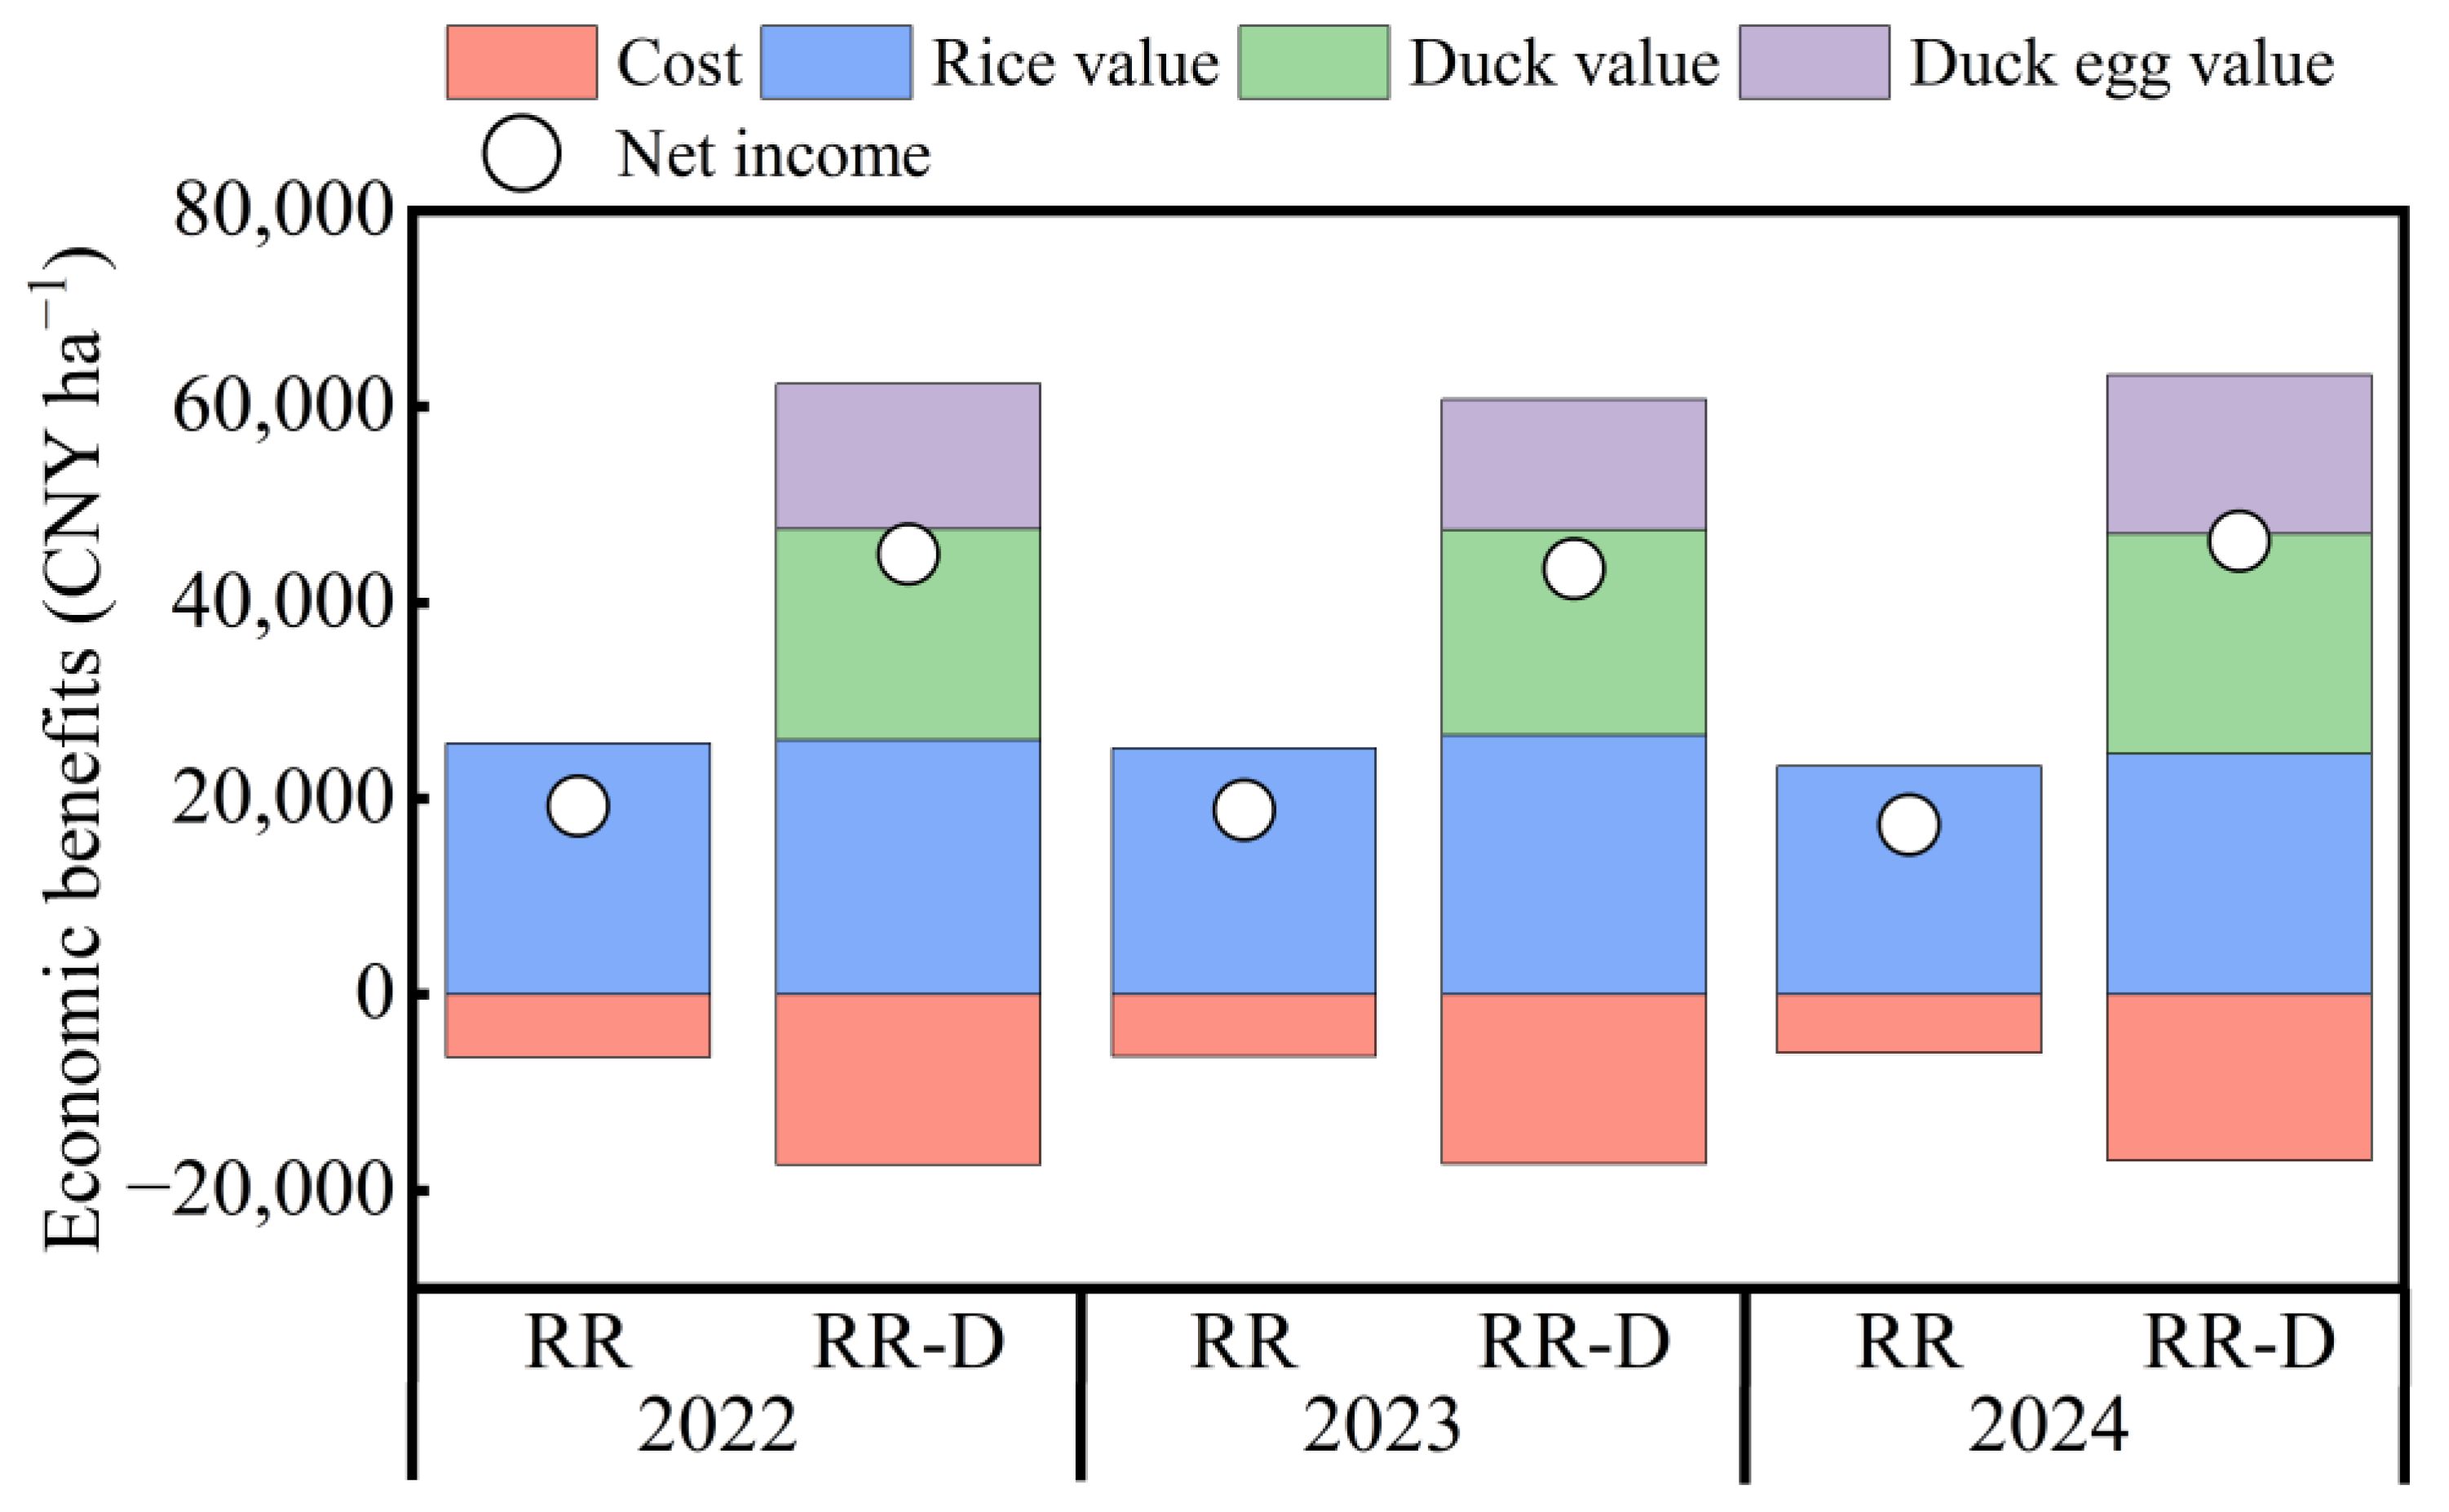
As shown in Figure 4, compared with the RR, the RR-D increased net income by 133.2%, 131.0%, and 167.1% in 2022, 2023, and 2024, respectively. The rice production value was comparable between the two systems, whereas the higher net income under the RR-D was mainly attributed to additional income from duck sales and egg production. Over the three-year period, duck income under the RR-D ranged from 21,000–22,500 CNY ha−1, while egg income ranged from 13,275–16,225 CNY ha−1 (Table 2).

3.5. Emergy Input Structure

Table 3 presents the emergy input composition and total emergy flows of the RR and RR-D systems during 2022–2024. The emergy analysis was conducted by quantifying renewable, non-renewable, and purchased input inventories, then converting each item into solar emergy using corresponding unit emergy values (UEV); detailed calculation processes based on raw data are listed in Tables S2–S7.
Across the three experimental years, the RR-D consistently showed a higher total emergy input (U) than the RR. Specifically, total emergy inputs under the RR-D were 1.70 × 10¹⁶, 1.54 × 10¹⁶, and 1.66 × 10¹⁶ sej ha−1 in 2022, 2023, and 2024, respectively, whereas those under the RR were only 7.93 × 10¹⁵, 6.80 × 10¹⁵, and 7.51 × 10¹⁵ sej ha−1.
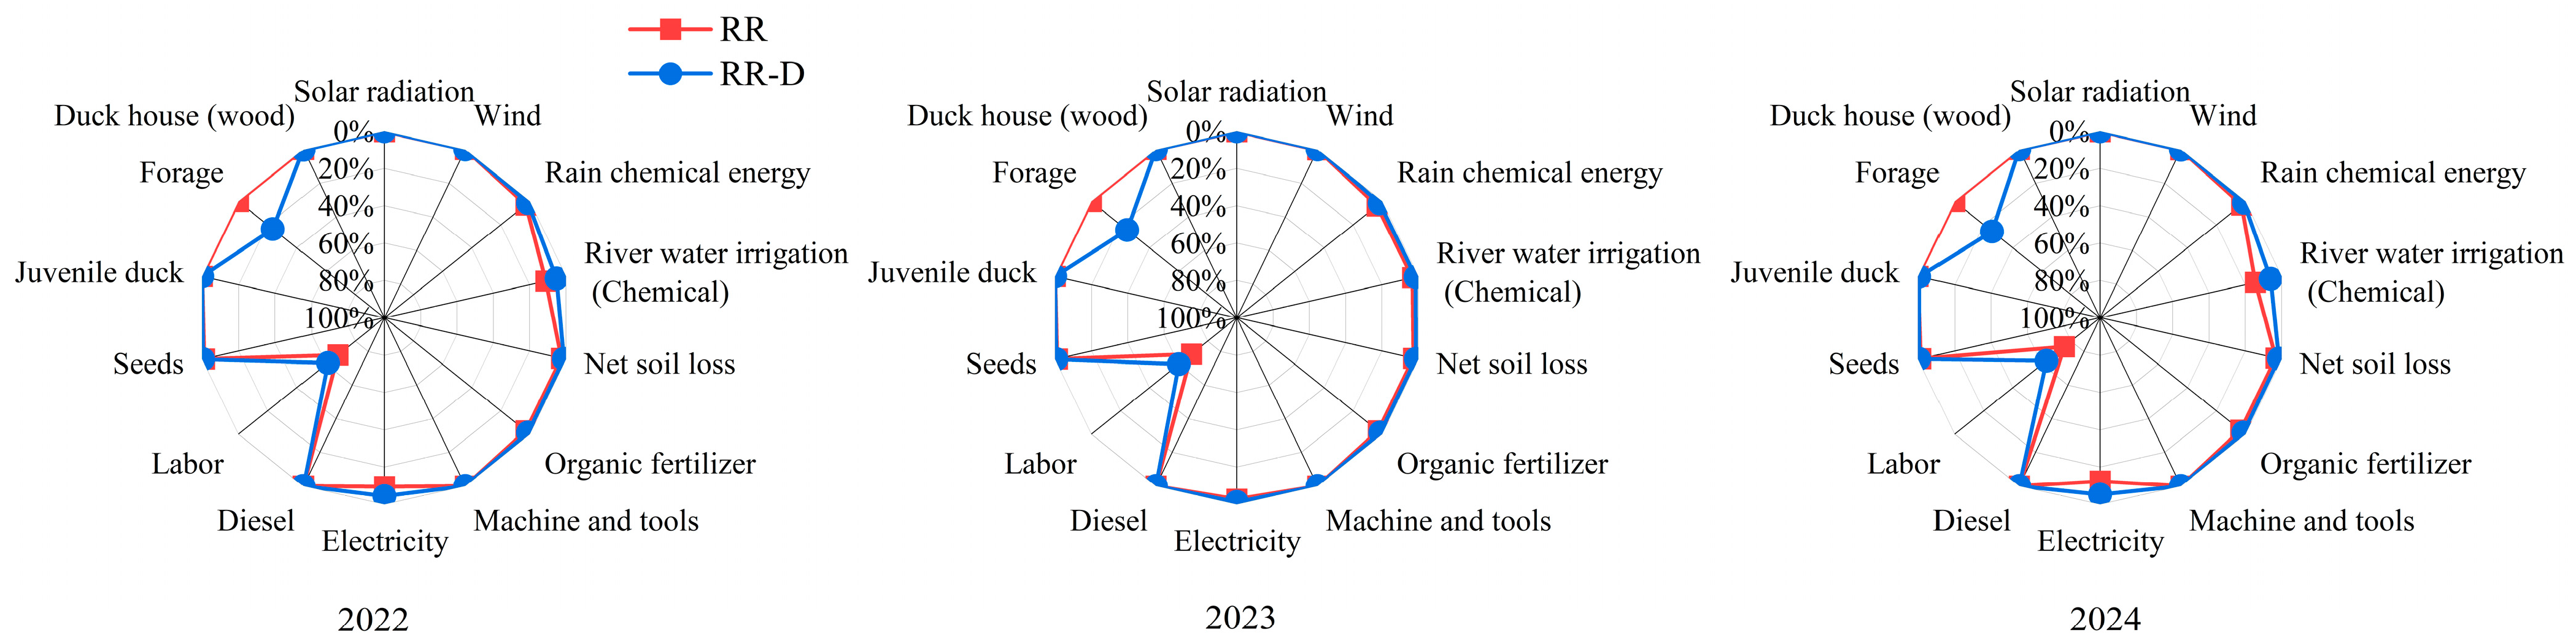
The two systems used the same free local renewable resources (LR), with values of 1.14 × 10¹⁵, 5.59 × 10¹⁴, and 1.17 × 10¹⁵ sej ha−1 in 2022, 2023, and 2024, respectively (Table 3). Due to changes in soil organic matter, differences in free local non-renewable resources (LN) were observed between the RR and RR-D systems in 2023 and 2024. LN values under the RR were 2.11 × 10¹⁴ sej ha−1 in 2023 and 2.14 × 10¹⁴ sej ha−1 in 2024, respectively, whereas the corresponding values under the RR-D were 2.16 × 10¹⁴ sej ha−1 in 2023 and 2.27 × 10¹⁴ sej ha−1 in 2024 (Table 3). Free local resources (LR and LN) account for a relatively low proportion of the total emergy value, ranging from 9.7–20.9% in the RR and 4.7–8.9% in the RR-D (Figure 5). Compared with the RR, the RR-D showed higher economic imported resources (F), with values of 1.57 × 10¹⁶, 1.46 × 10¹⁶, and 1.52 × 10¹⁶ sej ha−1 in 2022, 2023, and 2024, respectively, whereas the corresponding values under the RR were 6.58 × 10¹⁵, 6.03 × 10¹⁵, and 6.13 × 10¹⁵ sej ha−1 (Table 3). Among the economic imported resources, labor accounted for the largest proportion of the total emergy value, ranging from 68.1–68.8% under the RR and from 60.3–61.2% under the RR-D (Figure 5). The higher labor input in the RR-D was primarily attributed to the additional workforce required for duck house construction and duck rearing.

3.6. Emergy Sustainability Indices

As shown in Table 4, The UEVBenefits of the RR-D were 3.79 × 10¹¹, 3.54 × 10¹¹, and 3.58 × 10¹¹ sej CNY−1 in 2022, 2023, and 2024, respectively, which were lower than those of the RR. This result demonstrates that the RR-D achieved higher emergy efficiency per unit economic benefit.
The renewable emergy ratio (%R) of RR-D (43.37–44.76) was 22.8–25.5% lower than that of the RR (57.56–58.26), indicating a reduced share of renewable resources caused by increased purchased inputs such as labor and forage.
The EYR values of the RR (1.13–1.23) were consistently higher than those of the RR-D (1.05–1.09), suggesting that the monoculture system used external inputs more efficiently to exploit local natural resources.
According to the classification of Brown and Ulgiati [24], ELR < 2 represents low environmental impact, 2–10 represents moderate impact, and >10 represents high pressure. In this study, the ELR values of both systems ranged from 0.72 to 1.31, indicating a low environmental loading. The RR-D exhibited a higher ELR, implying greater environmental pressure from non-renewable inputs.
The ESI of the RR-D was 47.0–48.7% lower than that of the RR. The RR-D had an ESI < 1, indicating production depended on considerable environmental pressure. The RR-D achieved higher economic returns and lower GWP-related impacts, but showed lower emergy sustainability indicators (e.g., %R, EYR, and ESI) and a higher ELR under the current management conditions.

4. Discussion

4.1. Effects of Two Systems on Greenhouse Gas Emissions

In this study, the RR-D significantly reduced annual CH4 emissions from ratoon rice fields by 25.7–39.5% (Table 1), which is consistent with previous findings [8]. Rice coculture systems have been widely reported to exert substantial GHG mitigation effects. A meta-analysis by Yu et al. [7] showed that, compared with rice monoculture, coculture systems reduce CH4 emissions by an average of 14.8%. CH4 emissions from paddy fields are primarily regulated by the abundance and activity of methanogens and methanotrophs in the rice rhizosphere. Approximately 90% of CH4 is transported to the atmosphere through the rice aerenchyma, while the remainder is released via ebullition and diffusion [25]. Previous studies have shown that, in rice–animal coculture systems, aquatic animals (e.g., ducks, fish, and shrimp) consume weeds and plankton and disturb the soil structure, thereby enhancing oxygen exchange at the soil–water interface and increasing soil redox potential and dissolved oxygen levels [8]. This process promotes methanotrophic activity and CH4 oxidation, ultimately suppressing CH4 emissions [26,27]. In addition, Wei et al. [28] showed that ducks can reduce CH4 production by consuming senescent rice leaves, thereby limiting organic matter decomposition. They also suppress weed growth, which reduces CH4 emissions transported to the atmosphere through weed aerenchyma [26].
In contrast, the RR-D significantly increased annual N2O emissions from ratoon rice fields compared with the RR (Table 1). Several possible explanations for this pattern have been suggested in previous studies. Firstly, duck activities such as resting and foraging can elevate dissolved oxygen concentrations in floodwater, and higher oxygen availability may suppress N2O reduction, thereby increasing net N2O accumulation [27]. Secondly, ducks enhance gas exchange among soil, water, and the atmosphere, which improves soil redox conditions and stimulates nitrification mediated by nitrifying microorganisms, ultimately promoting N2O emissions [27,29]. Thirdly, duck excreta provide abundant nitrogen inputs, supplying substrates and energy for denitrifying microbes, which further contribute to increased N2O production [30,31].
In this study, the RR-D reduced the GWP compared with the RR by 27.8%, which is consistent with previous findings [27]. The GHGI links GWP with crop yield [32], providing an effective indicator to evaluate whether agricultural practices can enhance productivity without increasing GHG emissions. In the present study, the GHGI under the RR-D treatment (0.58–1.22 t CO2-eq t−1 yield) was lower than that under the RR treatment (0.95–1.72 t CO2-eq t−1 yield), which can be attributed to the combined effect of lower a GWP and relatively higher rice yield under the RR-D (Figure 3). However, it should be noted that the RR-D significantly increased N2O emissions, although the substantial reduction in CH4 emissions offset this negative effect, resulting in an overall decrease in both GWP and GHGI. The RR-D tended to increase the ratoon rice yield, although the effect was not significant, which is consistent with the meta-analysis by Yu et al. [7]. The physical disturbance caused by ducks in the paddy field can stimulate tillering, improve root vigor, and increase both panicle number and grain filling rate [27]. In addition, ducks suppress weed growth through foraging and disturbance, thereby reducing competition for resources between weeds and rice plants and ultimately contributing to yield improvement [33].

4.2. Effects of Two Systems on Economic Benefits

Economic return is a key determinant influencing farmers’ adoption of specific production systems [34]. In this study, the RR-D increased the economic benefits by 131.0–167.1% compared with the RR (Figure 4). Although the rice–duck coculture mode requires higher inputs due to additional costs associated with field infrastructure, labor, ducklings, and forage, these investments can be offset by additional income from poultry production, resulting in substantially improved overall profitability [34]. In our study, the higher economic return of the RR-D was mainly derived from the income generated by ducks and duck eggs, while rice yield revenue did not differ from that of the RR. The price data for ducks and duck eggs were obtained from actual farm transactions. The average market price of ducks was approximately 60 CNY kg−1, while the average market price of duck eggs was approximately 1 CNY per egg. These findings indicate that coculture systems can achieve greater output through increased labor and management inputs [7], thereby compensating for higher initial costs and ultimately generating higher net returns than monocropping systems [35]. Furthermore, previous studies have shown that rice yield tends to increase with the duration of coculture practices [7]. Therefore, from a long-term perspective, the RR-D features lower GWP and higher economic benefits compared with monocropping patterns.

4.3. Effects of Two Systems on Sustainability and Future Development Strategy

Although emergy analysis (EMA) is conventionally applied at larger agroecosystem scales, its application in the present short-term, small-plot (165 m2) experiment is methodologically justified. All material inputs, labor, energy consumption, and economic outputs were accurately quantified based on standardized field management and three replications, ensuring reliable emergy accounting at the plot scale. Short-term observations can effectively reflect the relative differences in system structure, resource efficiency, and environmental load between cultivation systems, which has been widely adopted in previous field-scale emergy studies. Therefore, the emergy indices used in this study are suitable for comparing the relative sustainability performance of RR and RR-D systems rather than assessing absolute long-term sustainability at a regional scale.
This study evaluated the ecosystem sustainability of the RR-D using a suite of emergy-based indicators. The results showed that the %R of the RR-D was lower than that of the RR, primarily due to its greater reliance on external inputs, which reduced the proportion of renewable resources within the system. A higher EYR generally indicates lower dependence on external inputs and greater utilization of local renewable resources [36]. However, in this study, the RR-D exhibited a lower EYR than the RR, mainly because duck rearing requires additional inputs of forage and labor, thereby increasing dependence on purchased resources. In terms of environmental pressure, the ELR values of both systems were lower than 2, indicating low environmental stress. The ESI values for the RR-D ranged from 0.81 to 0.88, suggesting that the RR-D exerts considerable pressure on the environment under current management practices and that its overall sustainability remains limited. In this study, the RR exhibited a higher ESI than the RR-D. In contrast to our findings, Xi and Qin [37] reported that the ESI of a rice–duck coculture system was 8.7 times higher than that of a conventional rice–wheat rotation system. This discrepancy is likely related to the different baseline systems used for comparison. Compared with intensive, high-input rice–wheat rotation systems, rice–duck coculture can demonstrate clear ecological advantages through reduced dependence on synthetic fertilizers and pesticides. However, the RR evaluated in the present study is itself a relatively simplified and low-input production system. Under this context, the additional forage and labor inputs associated with duck production markedly increased the total emergy inputs in the RR-D, thereby resulting in a lower ESI compared with the RR [34]. Despite the higher emergy inputs, the RR-D achieved greater economic returns [20]. A positive effect was also observed, with a lower unit emergy value of benefits (UEVBenefits) in the RR-D compared with the RR, indicating higher emergy efficiency in economic output. Overall, these results suggest that the RR-D in the Jianghan Plain of China has certain sustainability potential, although further optimization is still required to achieve higher efficiency.
In this study, field management practices were generally consistent between the RR-D and RR systems. However, duck activities can return organic nutrients to the system through manure deposition. Therefore, future management of the RR-D could reduce the input of external organic fertilizers to lower emergy inputs. In addition, this study did not address the optimization of duck stocking density, although appropriate stocking density is likely a key factor influencing system sustainability. Future research should therefore focus on identifying the optimal balance between system productivity and resource use efficiency under different duck density conditions. Emergy analysis indicated that forage and labor were major contributors to the total emergy inputs in the RR-D. Therefore, future optimization strategies should prioritize reducing these inputs, for example, by optimizing forage formulations, developing low-energy and low-cost feed resources, and improving labor efficiency through better management practices. Appropriate subsidy policies (e.g., provision of ducklings) could also facilitate the wider adoption and application of this coculture mode.

5. Conclusions

This study comprehensively evaluated the effects of the RR and RR-D on GHG emissions, economic benefits, and emergy-based sustainability in ratoon rice systems. The results showed that, while maintaining stable rice production, the RR-D reduced CH4 emissions by 25.7–39.5% but increased N2O emissions by 18.7–122.2%. The RR-D decreased the GWP and GHGI by 27.8% and 30.7%, respectively. Emergy analysis indicated that the RR-D increased the ELR and dependence on external inputs, in addition to reducing the ESI. Nevertheless, the RR-D achieved substantially higher economic returns, with the net income increasing by 131.0–167.1%. The RR-D can provide greater benefits to farmers while exerting a lower climate impact, as indicated by the GWP and GHGI. However, emergy-based indicators suggest that it increases environmental pressure under current management conditions. Future optimization of duck stocking density and a reduction of dependence on external inputs are important strategies to further improve the sustainability of the RR-D, but these approaches should be tested experimentally to determine their effectiveness. Overall, this study provides valuable insights into the potential of the region-specific RR-D to maximize both ecological and economic benefits in paddy fields.

Supplementary Materials

The following supporting information can be downloaded at: https://www.mdpi.com/article/10.3390/agriculture16111172/s1.

Author Contributions

Y.Z.: Formal analysis, Writing—original draft, and Writing—review and editing. C.L., W.W., Z.Z. and Q.L.: Formal analysis, Validation, and Writing—review and editing. J.N.: Data curation, Formal analysis, and Investigation. Z.L. and B.Z.: Methodology, Supervision, and Validation. Z.D.: Formal analysis, Methodology, Software, Visualization, and Writing—review and editing. All authors have read and agreed to the published version of the manuscript.

Funding

This work was supported by the Key Research Project of Scientific Research Plan of Hubei Provincial Department of Education (D20232704), the Central Guidance for Local Science and Technology Development Fund Project (2025CSA127), and the Xiaogan Intellectual Property Investigation and Research & Soft Science Research Project (200301042541), the Hubei Provincial Natural Science Foundation Innovation Development Joint Fund Project (2026AFC0683).

Data Availability Statement

The original contributions presented in this study are included in the article/Supplementary Material. Further inquiries can be directed to the corresponding author.

Conflicts of Interest

The authors declare no conflicts of interest.

References

  1. He, A.B.; Wang, W.Q.; Jiang, G.L.; Sun, H.J.; Jiang, M.; Man, J.G.; Gui, K.H.; Huang, J.L.; Peng, S.B.; Nie, L.X. Source-sink regulation and its effects on the regeneration ability of ratoon rice. Field Crops Res. 2019, 236, 155–164. [Google Scholar] [CrossRef]
  2. Zhou, Y.J.; Ji, Y.L.; Zhang, M.; Xu, Y.Z.; Li, Z.; Tu, D.B.; Wu, W.G. Exploring a sustainable rice-cropping system to balance grain yield, environmental footprint and economic benefits in the middle and lower reaches of the Yangtze River in China. J. Clean. Prod. 2023, 404, 136988. [Google Scholar] [CrossRef]
  3. Ding, Z.J.; Hu, R.; Cao, Y.X.; Li, J.T.; Xiao, D.K.; Hou, J.; Wang, X.X. Integrated assessment of yield, nitrogen use efficiency and ecosystem economic benefits of use of controlled-release and common urea in ratoon rice production. J. Integr. Agric. 2024, 23, 3186–3199. [Google Scholar] [CrossRef]
  4. Zhou, Y.; Liu, K.; Harrison, M.T.; Fahad, S.; Gong, S.L.; Zhu, B.; Liu, Z.Y. Shifting rice cropping systems mitigates ecological footprints and enhances grain yield in central China. Front. Plant Sci. 2022, 13, 895402. [Google Scholar] [CrossRef] [PubMed]
  5. Xu, Q.; Wang, X.L.; Xiao, B.; Hu, K.L. Rice-crab coculture to sustain cleaner food production in Liaohe River Basin, China: An economic and environmental assessment. J. Clean. Prod. 2019, 208, 188–198. [Google Scholar] [CrossRef]
  6. Zhou, Y.; Harrison, M.T.; Liu, K.; Xiao, L.; Zhu, J.; Wang, M.; Li, H.X.; Yao, G.X.; Liu, J.; Zhu, B.; et al. Field distribution characteristics and influencing factors of crayfish in ricecrayfish integrative system. Aquaculture 2023, 571, 739456. [Google Scholar] [CrossRef]
  7. Yu, H.Y.; Zhang, X.C.; Shen, W.Y.; Yao, H.Y.; Meng, X.T.; Zeng, J.Y.; Zhang, G.B.; Zamanien, K. A meta-analysis of ecological functions and economic benefits of co-culture models in paddy fields. Agric. Ecosyst. Environ. 2023, 341, 108195. [Google Scholar] [CrossRef]
  8. Du, C.C.; Hu, L.L.; Yuan, S.; Xu, L.; Wang, W.B.; Cui, K.H.; Peng, S.B.; Huang, J.L. Ratoon rice-duck co-culture maintains rice grain yield and decreases greenhouse gas emissions in central China. Eur. J. Agron. 2023, 149, 126911. [Google Scholar] [CrossRef]
  9. Gao, P.L.; Wang, H.Y.; Sun, G.J.; Xu, Q.; Dou, Z.; Dong, E.J.; Wu, W.G.; Dai, Q.G. Integrated emergy and economic evaluation of the dominant organic rice production systems in Jiangsu province, China. Front. Plant Sci. 2023, 14, 1107880. [Google Scholar] [CrossRef]
  10. Du, C.C.; Yang, D.S.; Hu, L.L.; Zhu, J.J.; Wang, W.B.; Zhao, W.L.; Peng, S.B.; Yuan, S.; Huang, J.L. Feeding ducks in ratoon rice field reduces weed competition with ratoon rice in central China. Field Crops Res. 2025, 334, 110147. [Google Scholar] [CrossRef]
  11. Huo, W.R.; Weng, K.Q.; Gu, T.T.; Luo, X.; Zhang, Y.; Zhang, Y.; Xu, Q.; Chen, G.H. Effects of integrated rice-duck farming system on duck carcass traits, meat quality, amino acid, and fatty acid composition. Poult. Sci. 2021, 100, 101107. [Google Scholar] [CrossRef]
  12. Suh, J. Theory and reality of integrated rice–duck farming in Asian developing countries: A systematic review and SWOT analysis. Agric. Syst. 2014, 125, 74–81. [Google Scholar] [CrossRef]
  13. Yang, C.R.; Han, N.; Liu, M.T.; Wei, C.H.; Mao, R.L.; Chen, C.Q. Effects of long-term different-scale rice-duck farming on the growth and yield of paddy rice. J. Sci. Food Agric. 2024, 104, 3729–3735. [Google Scholar] [CrossRef]
  14. Fonseca, A.M.P.; Marques, C.A.F.; Pinto-Correia, T.; Guiomar, N.; Campbell, D.E. Emergy evaluation for decision-making in complex multifunctional farming systems. Agric. Syst. 2019, 171, 1–12. [Google Scholar] [CrossRef] [PubMed]
  15. Kim, Y.; Lee, M.; Hong, J.; Lee, Y.S.; Wee, J.; Lee, W.K.; Kraxner, F.; Cho, K. Emergy-based sustainability assessment of the rice cropping system under scaled-down intensification: Insights from a case study on South Korea (2003–2021). J. Clean. Prod. 2025, 525, 146553. [Google Scholar] [CrossRef]
  16. Ding, Z.J.; Hu, R.; Styles, D.; Wang, X.L.; Tian, Y.B.; Cao, Y.X.; Hou, J. Optimized ratoon rice system to sustain cleaner food production in Jianghan Plain, China: A comprehensive emergy assessment. Environ. Sci. Pollut. Res. 2022, 29, 24639–24650. [Google Scholar] [CrossRef] [PubMed]
  17. Jin, Z.Q.; Zhang, B.Y.; Chen, Q.Q.; Chen, M.L.; Duan, S.F.; Luo, Y.Y.; Yan, S.B.; Li, X.S.; Matthew, T.H.; Shi, S.J.; et al. Comprehensive evaluation of sustainability of dry direct-seeded, wet direct-seeded, and transplanted rice-wheat rotation systems in the middle and lower reaches of the Yangtze river based on emergy analysis. Field Crops Res. 2026, 337, 110260. [Google Scholar] [CrossRef]
  18. Ulgiati, S.; Brown, M.T. Emergy and ecosystem complexity. Commun. Nonlinear Sci. Numer. Simul. 2009, 14, 310–321. [Google Scholar] [CrossRef]
  19. Zhou, Y.; Yan, X.Y.; Gong, S.L.; Li, C.W.; Zhu, R.; Zhu, B.; Liu, Z.Y.; Wang, X.L.; Cao, P. Changes in paddy cropping system enhanced economic profit and ecological sustainability in central China. J. Integr. Agric. 2022, 21, 566–577. [Google Scholar] [CrossRef]
  20. Li, J.; Liu, H.M.; Yang, D.L.; Zhang, G.L. Emergy Evaluation of three Rice Wetland Farming Systems in the Taihu Lake Catchment of China. Wetlands 2017, 38, 1121–1132. [Google Scholar] [CrossRef]
  21. Thavaprakaash, N. Rice-duck integrated systems enhanced production of organic rice and ducks, and improved soil and plant nutrient dynamics. Biol. Agric. Hortic. 2026, 42, 68–86. [Google Scholar] [CrossRef]
  22. IPCC. Climate Change 2021: The Physical Science Basis. Contribution of Working Group I to the Sixth Assessment Report of the Intergovernmental Panel on Climate Change; Masson-Delmotte, V., Zhai, P., Pirani, A., Connors, S.L., Péan, C., Berger, S., Caud, N., Chen, Y., Goldfarb, L., Gomis, M.I., et al., Eds.; Cambridge University Press: Cambridge, UK; New York, NY, USA, 2021. [Google Scholar] [CrossRef]
  23. Odum, H.T. Emergy in ecosystems. In Ecosystem Theory and Application; Polunin, N., Ed.; John Wiley and Sons: New York, NY, USA, 1986. [Google Scholar]
  24. Brown, M.T.; Ulgiati, S. Energy quality, emergy, and transformity: H.T. Odum’s contributions to quantifying and understanding systems. Ecol. Model. 2004, 178, 201–213. [Google Scholar] [CrossRef]
  25. Aulakh, M.S.; Bodenbender, J.; Wassmann, R.; Rennenberg, H. Methane transport capacity of rice plants. II. Variations among different rice cultivars and relationship with morphological characteristics. Nutr. Cycl. Agroecosyst. 2000, 58, 367–375. [Google Scholar] [CrossRef]
  26. Xu, G.; Liu, X.; Wang, Q.; Yu, X.; Hang, Y. Integrated rice-duck farming mitigates the global warming potential in rice season. Sci. Total Environ. 2017, 575, 58–66. [Google Scholar] [CrossRef]
  27. Sheng, F.; Cao, C.; Li, C. Integrated rice-duck farming decreases global warming potential and increases net ecosystem economic budget in central China. Environ. Sci. Pollut. Res. 2018, 25, 22744–22753. [Google Scholar] [CrossRef]
  28. Wei, H.; Bai, W.; Zhang, J.; Chen, R.; Xiang, H.; Quan, G. Integrated rice-duck farming decreases soil seed bank and weed density in a paddy field. Agronomy 2019, 9, 259. [Google Scholar] [CrossRef]
  29. Sun, G.; Sun, M.; Du, L.; Zhang, Z.; Wang, Z.; Zhang, G.; Nie, S.; Xu, H.; Wang, H. Ecological rice-cropping systems mitigate global warming–a meta-analysis. Sci. Total Environ. 2021, 789, 147900. [Google Scholar] [CrossRef]
  30. Das, S.; Adhya, T.K. Effect of combine application of organic manure and inorganic fertilizer on methane and nitrous oxide emissions from a tropical flooded soil planted to rice. Geoderma 2014, 213, 185–192. [Google Scholar] [CrossRef]
  31. Yang, B.; Ma, Y.; Zhang, C.; Jia, Y.; Li, B.; Zheng, X. Cleaner production technologies increased economic benefits and greenhouse gas intensity in an eco-rice system in China. Sustainability 2019, 11, 7090. [Google Scholar] [CrossRef]
  32. Mosier, A.R.; Halvorson, A.D.; Reule, C.A.; Liu, X.J. Net Global Warming Potential and Greenhouse Gas Intensity in Irrigated Cropping Systems in Northeastern Colorado. J. Environ. Qual. 2006, 35, 1584–1598. [Google Scholar] [CrossRef]
  33. Khumairoh, U.; Lantinga, E.A.; Handriyadi, I.; Schulte, R.P.O.; Groot, J.C.J. Agro-ecological mechanisms for weed and pest suppression and nutrient recycling in high yielding complex rice systems. Agric. Ecosyst. Environ. 2021, 313, 107385. [Google Scholar] [CrossRef]
  34. Fu, H.; Li, N.; Cheng, Q.Y.; Liao, Q.; Nie, J.X.; Yin, H.L.; Shu, C.H.; Li, L.L.; Wang, Z.L.; Sun, Y.J.; et al. Energy, environmental, and economic benefits of integrated paddy field farming. Energy 2024, 297, 131251. [Google Scholar] [CrossRef]
  35. Bhattacharyya, P.; Sinhababu, D.P.; Roy, K.S.; Dash, P.K.; Sahu, P.K.; Dandapat, R.; Neogi, S.; Mohanty, S. Effect of fish species on methane and nitrous oxide emission in relation to soil C, N pools and enzymatic activities in minted shallow lowland rice-fish farming system. Agric. Ecosyst. Environ. 2013, 176, 53–62. [Google Scholar] [CrossRef]
  36. Zhang, L.X.; Ulgiati, S.; Yang, Z.F.; Chen, B. Emergy evaluation and economic analysis of three wetland fish farming systems in Nansi Lake area, China. J. Environ. Manag. 2011, 92, 683–694. [Google Scholar] [CrossRef] [PubMed]
  37. Xi, Y.G.; Qin, P. Emergy evaluation of organic rice-duck mutualism system. Ecol. Eng. 2009, 32, 1677–1683. [Google Scholar] [CrossRef]
Figure 1. Daily precipitation and temperature from transplanting to harvest of ratoon rice during 2022–2024.
Agriculture 16 01172 g001
Figure 2. Grain yield under ratoon rice monoculture system (RR) and ratoon rice–duck coculture system (RR-D) during 2022–2024. Different lowercase letters indicate significant differences between treatments at p < 0.05 by LSD test. Error bars show standard error (n = 3).
Agriculture 16 01172 g002
Figure 3. Global warming potential (GWP) and greenhouse gas emission intensity (GHGI) under ratoon rice monoculture system (RR) and ratoon rice–duck coculture system (RR-D) during 2022–2024. Different lowercase letters indicate significant differences between treatments at p < 0.05 by LSD test. Error bars show standard error (n = 3). The global warming potential (GWP) of CH4 and N2O was calculated according to the IPCC Sixth Assessment Report (AR6) methodology over a 100-year time horizon using conversion coefficients of 27 for CH4 and 273 for N2O [22].
Agriculture 16 01172 g003
Figure 4. Economic benefits of ratoon rice monoculture system (RR) and ratoon rice–duck coculture system (RR-D) during 2022–2024. Net income = output value − cost. All values were calculated on a per-hectare basis using fixed unit prices rather than being derived from replicated plot-level statistical averages.
Agriculture 16 01172 g004
Figure 5. Detailed emergy inputs of ratoon rice monoculture system (RR) and ratoon rice–duck coculture system (RR-D) during 2022–2024.
Agriculture 16 01172 g005
Table 1. Cumulative CH4 (kg CH4 ha−1) and N2O (kg N2O ha−1) emissions under ratoon rice monoculture system (RR) and ratoon rice–duck coculture system (RR-D) during 2022–2024.
YearTreatmentMain CropRatoon CropAnnual Total
CH4N2OCH4N2OCH4N2O
2022RR263.80 ± 11.52 a0.61 ± 0.03 b87.83 ± 3.09 a0.23 ± 0.01 b351.62 ± 13.63 a0.84 ± 0.04 b
RR-D160.71 ± 5.90 b0.87 ± 0.02 a52.03 ± 2.86 b0.38 ± 0.02 a212.74 ± 4.01 b1.26 ± 0.04 a
2023RR528.41 ± 3.23 a1.47 ± 0.09 b97.37 ± 2.52 a0.51 ± 0.02 b625.78 ± 0.71 a1.98 ± 0.10 b
RR-D367.63 ± 17.89 b1.66 ± 0.02 a89.17 ± 1.17 b0.69 ± 0.01 a456.80 ± 17.23 b2.35 ± 0.04 a
2024RR236.20 ± 7.64 a0.47 ± 0.00 b118.73 ± 6.44 a0.34 ± 0.01 b354.92 ± 13.40 a0.81 ± 0.01 b
RR-D178.79 ± 6.32 b1.21 ± 0.00 a84.83 ± 3.58 b0.59 ± 0.01 a263.62 ± 9.65 b1.80 ± 0.01 a
F valueTreatment (T)1141.43 ***775.82 ***122.84 ***580.49 ***945.98 ***881.12 ***
Year (Y)519.17 ***445.04 ***228.40 ***779.60 ***619.24 ***670.90 ***
T × Y40.50 ***83.11 ***26.82 ***17.53 ***17.89 ***75.20 ***
Note: The data in each column for a given year are presented as mean ± standard error (n = 3). Different lowercase letters following the values in the same column indicate significant differences among treatments (p < 0.05). For F values, an asterisk denotes significant effects of treatment, year, or their interaction: *** p < 0.001.
Table 2. Composition of economic benefits of ratoon rice monoculture system (RR) and ratoon rice–duck coculture system (RR-D) during 2022–2024.
YearTreatmentOutput ValueCost
Rice ValueDuck ValueDuck Egg ValueJuvenile Duck CostSeedling CostFertilization LaborDaily Field ManagementDuck Farming LaborOrganic FertilizerForageElectricity
2022RR25,630---3300750300-1800-181
RR-D25,97221,60014,7508333300750500234118007612181
2023RR25,125---3300750280-1800-169
RR-D26,49521,00013,2758333300750480234118007612169
2024RR23,323---330075080-1800-48
RR-D24,57322,50016,225833330075028023411800761248
Note: Rice grain price for main crop and ratoon crop is 2.2 and 3.0 CNY kg−1, respectively. The selling price of ducks is 60 CNY kg−1, and the price of duck eggs is 1 CNY per egg. Egg production occurred throughout the entire ratoon rice growing season. Organic fertilizer price is 0.6 CNY kg−1. Net income = output value − cost.
Table 3. Emergy input structure of ratoon rice monoculture system (RR) and ratoon rice–duck coculture system (RR-D) during 2022–2024. a, RNF is the abbreviation of renewable factors [16,18,19]. It is used to define the natural, renewable attribute of each input resource and serves as the basic criterion for the calculation of emergy indices.
ItemRNF a2022 Emergy (sej ha−1)2023 Emergy (sej ha−1)2024 Emergy (sej ha−1)
RRRR-DRRRR-DRRRR-D
Free local renewable resources (LR)
1. Solar radiation11.15 × 10131.15 × 10139.37 × 10129.37 × 10121.14 × 10131.14 × 1013
2. Wind12.71 × 10122.71 × 10127.01 × 10127.01 × 10121.06 × 10131.06 × 1013
3. Rain chemical energy12.33 × 10142.33 × 10142.86 × 10142.86 × 10141.85 × 10141.85 × 1014
4. River water irrigation (Chemical)18.97 × 10148.97 × 10142.57 × 10142.57 × 10149.62 × 10149.62 × 1014
Free local non-renewable resources (LN)
5. Net soil loss02.07 × 10142.07 × 10142.11 × 10142.16 × 10142.14 × 10142.14 × 1014
Economic imported resources (F)
6. Organic fertilizer02.32 × 10142.32 × 10142.32 × 10142.32 × 10142.32 × 10142.32 × 1014
7. Machine and tools02.81 × 10122.81 × 10122.81 × 10122.81 × 10122.81 × 10122.81 × 1012
8. Electricity0.097.69 × 10147.69 × 10142.20 × 10142.20 × 10148.22 × 10148.22 × 1014
9. Diesel02.75 × 1092.75 × 1092.75 × 1092.75 × 1092.75 × 1092.75 × 109
10. Labor0.65.48 × 10151.05 × 10165.48 × 10159.96 × 10154.98 × 10159.96 × 1015
11. Seeds19.33 × 10139.33 × 10139.33 × 10139.33 × 10139.33 × 10139.33 × 1013
12. Juvenile duck04.46 × 10114.46 × 10114.46 × 1011
13. Forage04.07 × 10154.07 × 10154.07 × 1015
14. Duck house (wood)11.93 × 10131.93 × 10131.93 × 1013
Emergy flows
Free local renewable resources (LR)1.14 × 10151.14 × 10155.59 × 10145.59 × 10141.17 × 10151.17 × 1015
Free local non-renewable resources (LN)2.07 × 10142.07 × 10142.11 × 10142.16 × 10142.14 × 10142.27 × 1014
Economic imported resources (F)6.58 × 10151.57 × 10166.03 × 10151.46 × 10166.13 × 10151.52 × 1016
Renewable fraction of purchased inputs (FR)3.45 × 10156.48 × 10153.40 × 10156.11 × 10153.16 × 10156.16 × 1015
Non-renewable fraction of purchased inputs (FN)3.13 × 10159.21 × 10152.63 × 10158.49 × 10152.97 × 10159.04 × 1015
Renewable emergy flows (LR + FR)4.59 × 10157.63 × 10153.96 × 10156.67 × 10154.32 × 10157.33 × 1015
Non-renewable emergy flows (LN + FN)3.33 × 10159.41 × 10152.84 × 10158.71 × 10153.19 × 10159.26 × 1015
Total emergy input (U)7.93 × 10151.70 × 10166.80 × 10151.54 × 10167.51 × 10151.66 × 1016
Table 4. Emergy indices of ratoon rice monoculture system (RR) and ratoon rice–duck coculture system (RR-D) during 2022–2024.
Index202220232024
RRRR-DRRRR-DRRRR-D
UEVBenefits4.11 × 10113.79 × 10113.61 × 10113.54× 10114.33 × 10113.58 × 1011
%R57.95 44.7658.26 43.37 57.5644.18
EYR1.21 1.09 1.13 1.05 1.23 1.09
ELR0.73 1.23 0.72 1.31 0.74 1.26
ESI1.66 0.88 1.57 0.81 1.66 0.86
Note: UEVBenefits = total emergy input/net income; %R = 100 × (LR + FR)/U; EYR = U/F; ELR = (LN + FN)/(LR + FR); ESI = EYR/ELR.
Disclaimer/Publisher’s Note: The statements, opinions and data contained in all publications are solely those of the individual author(s) and contributor(s) and not of MDPI and/or the editor(s). MDPI and/or the editor(s) disclaim responsibility for any injury to people or property resulting from any ideas, methods, instructions or products referred to in the content.