Article

Integrated Application of Biochar and Polyacrylamide with Conservation Tillage Promotes Fertilizer-N Recovery in the Short Term

1
Institute of Agricultural Resources and Environment, Jiangsu Academy of Agricultural Sciences, Nanjing 210014, China
2
Key Laboratory of Saline-Alkali Soil Improvement and Utilization (Coastal Saline-Alkali Lands), Ministry of Agriculture and Rural Affairs, Nanjing 210014, China
3
School of the Environment and Safety Engineering, Jiangsu University, Zhenjiang 212013, China
4
College of Resources and Environmental Sciences, Nanjing Agricultural University, Nanjing 210095, China
5
School of Ecology and Applied Meteorology, Nanjing University of Information Science & Technology, Nanjing 210044, China
6
School of Agriculture and Environment, The University of Western Australia, Crawley, WA 6009, Australia
*
Author to whom correspondence should be addressed.
Agriculture 2026, 16(11), 1171; https://doi.org/10.3390/agriculture16111171
Submission received: 17 April 2026 / Revised: 15 May 2026 / Accepted: 25 May 2026 / Published: 27 May 2026
(This article belongs to the Section Agricultural Soils)

Abstract

Although conservation tillage (CT), polyacrylamide (PAM), and biochar (BC) are each known to enhance soil organic carbon (SOC), their combined short-term effects on SOC sequestration and fertilizer-nitrogen (N) recovery remain unclear. A 15N-tracing study involving two tillage regimes (rotary tillage (RT) and CT) and four amendments (no amendment (CK), PAM, BC, and PAM + BC (PMC)) was conducted across two seasons from a wheat–maize rotation in an infertile soil. Compared with RT, the crop-recovered fertilizer-N under CT was significantly increased by 15.2%. Relative to CK, the SOC stock, non-labile SOC (NLOC) stock, and total fertilizer-N recovery were increased by 15.9–28.7%, 19.5–48.5%, and 10.10–57.37 kg N ha−1, respectively, in BC amendment under both RT and CT. Soil aggregate stability was significantly improved in PAM amendment, particularly under CT and in the maize season, thereby reducing SOC lability. The structural equation model indicated that the short-term promotion of fertilizer-N recovery was driven by the increase in total SOC and NLOC. The adoption of PMC under CT exhibited the lowest SOC lability and the highest total fertilizer-N recovery at the end of the trial. These findings demonstrated the short-term effectiveness of integrating CT, PAM, and BC to enhance fertilizer-N recovery by promoting crop N utilization and increasing the quantity and quality of SOC.

1. Introduction

The extensive use of chemical nitrogen (N) fertilizer has been fundamental to global yield gains and food security, but it has also imposed substantial negative environmental impacts, such as nitrate leaching and runoff, ammonia volatilization, and N2O emission [1,2,3,4]. Previous inventory shows that conventional “high-input and high-output” systems often lead to N recovered in crops and soil less than 60% [5], with substantial N losses occurring. Developing management practices that improve fertilizer-N recovery efficiency are, therefore, central solutions for sustainable intensification of agriculture [6,7].
Fertilizer-N recovery is strongly linked to soil organic carbon (SOC), with greater N losses generally occurring in low-SOC soils [8,9]. Increasing SOC can enhance cation exchange capacity, water retention, and microbial activity, thereby strengthening the retention of fertilizer-N [10]. Our previous global analysis indicated that improving SOC levels could potentially mitigate over 34% of N losses without compromising crop yields [11]. However, sequestering substantial amounts of SOC in the short term remains a major challenge. It has been estimated that SOC stock increases under conventional management are only about 0.14–0.30 Mg C ha−1 yr−1, even when straw is returned to the field [12,13]. In soils with low fertilizer-N use efficiency, reducing N application rates outright is unfeasible without SOC-enhancing practices, as excessive N losses would jeopardize crop yields [14,15]. Thus, there is an urgent need for strategies that simultaneously promote soil aggregation, accelerate SOC sequestration, and enhance N retention over relatively short timeframes.
Adopting improved soil management technologies offers promising pathways to enhance SOC efficiently [16]. Biochar application directly supplies a concentrated and relatively recalcitrant C source to soil and has been widely used to increase SOC stocks [17]. Besides, conservation tillage (CT; reduced or no tillage) reduces soil disturbance and thereby limits erosion and promotes soil aggregation, leading to improved physical protection of SOC [18,19]. In addition, polyacrylamide (PAM), a high-molecular-weight soil conditioner, can quickly promote the formation and stabilization of soil aggregates, particularly in structurally weak or erosion-prone soils [20]. The promotion of soil aggregation would subsequently increase N retention by physically occluding organic and microbial N, chemically binding N to mineral surfaces, and facilitating root growth and N uptake [21,22]. Beyond these aggregation effects, PAM also modulates water-N availability by minimizing hydrologic N losses, which may also facilitate N retention [23]. Previous studies reported that PAM application increased soil aggregate stability and SOC content by 16.5% and 32.9%, respectively [24]. Increasing evidence indicates that combining multiple soil-improving practices can generate synergistic benefits for short-term soil amelioration [25,26]. However, two critical knowledge gaps remain: (1) most existing studies focus on pairwise combinations (e.g., biochar + CT or biochar + PAM) rather than the triple integration of biochar, CT, and PAM, leaving the short-term synergistic potential for SOC sequestration and fertilizer-N recovery unclear, and (2) the linkage between SOC sequestration, soil aggregation, and fertilizer-N recovery, as influenced by the integrated practices, especially with the addition of PAM, has not been well elucidated.
The ancient Yellow River alluvial plain, part of the Huang-Huai-Hai Plain in China, is an important cereal wheat–maize production region and is characterized by light-textured, low-SOC soils and high fertilizer inputs [27,28]. These conditions create a high risk of hydrologic and gaseous N losses. Improving N use efficiency (NUE) without sacrificing crop yields is, therefore, essential for both environmental protection and agricultural sustainability. Yet, the region-specific strategies that can simultaneously and rapidly build SOC and enhance fertilizer-N recovery are still limited.
To address these gaps, this study conducted an in situ 15N-tracing experiment in the ancient Yellow River alluvial plain to evaluate the combined effects of biochar, PAM, and CT on SOC accumulation, soil aggregate distribution and stability, and fertilizer-N recovery in crops and across the soil profile. A further aim was to clarify the linkages between SOC, soil aggregates, and fertilizer-N recovery under integrative management regimes. The central hypothesis was that enhancing soil structure and C inputs through integrated practices would accelerate SOC accumulation, strengthen physical protection of soil organic matter, and thereby increase fertilizer-N recovery compared with conventional management.

2. Materials and Methods

2.1. Study Site

The field experiment was conducted in Binhai County, Jiangsu Province, China (34.020449° N, 119.798872° E), a representative region of the ancient Yellow River alluvial plain. Prior to the experiment, the study site had been under a winter wheat (Triticum aestivum L.)–summer maize (Zea mays L.) rotation system for over 30 years. Wheat and maize were sown in October and June, and harvested in June and October, respectively. The study area features a warm-temperate monsoon climate. The mean annual precipitation and mean annual air temperature of this area are 942.6 mm and 14.1 °C, respectively. The average cumulative precipitation during the experiment was 994 mm yr−1, with the maize season accounting for about 74% of the annual precipitation (Figure S1). The soil is classified as Aquic Inceptisol, and the topsoil (0–20 cm) has the following basic physicochemical properties before the experiment: pH 8.60, SOC content 9.47 g kg−1, alkaline hydrolysable N content 64.43 mg kg−1, available phosphorus (P) content 213 mg kg−1, and rapidly available potassium (K) content 213 mg kg−1.

2.2. Field Experiment Design and Setup

The field experiment was established in October 2020, using a two-factor split-plot design. The main plot factor was tillage regime, with conventional rotary tillage (RT) and CT treatments. The sub-plot treatments were no amendment control (CK), PAM application only (PM), biochar application only (BC), and combined PAM and biochar application (PMC). In total, eight treatment combinations were established (Table S1). Each treatment was replicated 3 times, giving 24 plots in total, and each plot had an area of 25 m2.
Under RT, the field was subjected to rotary tillage to a depth of 20 cm before sowing wheat and maize each season. Under CT, tillage was conducted only before wheat sowing, with a reduced tillage depth of 10 cm, and no tillage was performed during the maize season. The PAM used in this experiment was an anionic polymer with a molecular weight of 10–12 million, and the content of residual monomers was less than 0.05%. The environmental safety of using PAM in agricultural soils has been demonstrated in previous reports [29]. PAM was applied seasonally before sowing at a rate of 30 kg ha−1. To ensure uniform application, PAM was first mixed with 2 mm-sieved surface soil (0–10 cm) collected from the corresponding field plots at a mass ratio of 1:20, and the mixture was then broadcast onto the soil surface. Biochar was supplied by Beizeng Biotechnology Co., Ltd. It had a pH of 7.12, TN, total P, total K, and total C contents of 7.13, 1.61, 35.02, and 65.60 g kg−1, respectively, and a specific surface area of 89.16 m2 g−1. Biochar was applied annually before wheat sowing at a rate of 15 Mg ha−1. Both the application rates of PAM [20,30] and biochar [28,31] were selected based on previous studies, and all amendments were applied prior to tillage operations.
All plots received the same amounts of mineral fertilizers. For wheat, 270 kg N ha−1, 75 kg P2O5 ha−1 season−1, and 37.5 kg K2O ha−1 season−1 were applied. For maize, 270 kg N ha−1, 72 kg P2O5 ha−1 season−1, and 45 kg K2O ha−1 season−1 were applied. These rates followed crop-specific fertilization guidelines issued by the local agricultural authority. N, P, and K were supplied as urea, superphosphate, and potassium sulfate, respectively. In each cropping season, N fertilizer was split into a basal application before sowing and a topdressing at the jointing stage of wheat or maize, at a ratio of 4:6. P and K fertilizers were applied entirely as a basal dressing. Residual straw from the previous crop season was returned to all plots.

2.3. 15N-Microplot Setup

During the second crop rotation after experiment establishment, 15N microplots were established to trace the fate of fertilizer-N within the soil–crop system. Separate sets of 15N microplots were established for the wheat and maize seasons. After completion of the wheat season microplot measurements, a new set of microplots was installed in each field plot for the subsequent maize season. This design enabled the fertilizer-N fate to be quantified for each crop season independently. For each microplot, PVC cylinders (25 cm inner diameter × 40 cm length) were inserted to a soil depth of 30 cm with 10 cm remaining above the ground. All N fertilizer applied within the cylinders was 15N-labeled urea (10.05 atom%; Shanghai Chem-Industry Institute, Shanghai, China). The labeled urea (a total rate of 2.88 g plot−1 season−1) was dissolved in deionized water and evenly applied to the soil surface within each cylinder. Except for using 15N-urea as the N source, all other management practices in the microplots were identical to those in the surrounding field plots. The distance between the two seasonal microplots (wheat and maize) within a given field plot exceeded 4 m. Soils sampled from 0 to 40 cm depth outside the cylinders showed nearly natural 15N abundances, indicating that the PVC walls effectively prevented lateral N movement across the microplot boundaries. In the wheat season, seeding density in the microplots was consistent with that in the corresponding field plots, whereas in the maize season, one maize plant was grown per microplot.

2.4. Plant and Soil Sampling and Analysis

Wheat and maize were harvested separately in June and October. At harvest, grain and straw samples from each microplot were comprehensively collected, then oven-dried at 65 °C, weighed accurately, and finely ground to determine N concentration and 15N abundance. Besides, crop yields were determined for the field plots. Wheat yield was assessed by harvesting three randomly chosen, undisturbed 1 m2 quadrats per plot, while maize yield was quantified by harvesting the entire plot area.
Subsequent to crop harvesting, two duplicate soil cores (2.0 cm in diameter) were sampled from each microplot. During the wheat season, soil samples were collected from the 0–10, 10–20, and 20–40 cm soil layers, whereas in the maize season, samples were obtained from the 0–10, 10–20, 20–40, and 40–60 cm layers. All soil samples were air-dried and ground to analyze SOC, labile organic C (LOC; easily oxidizable fraction), total N (TN), and 15N abundance. Additionally, undisturbed soil samples from the 0–10 cm layer were collected using a shovel for soil aggregate fractionation.
Soil aggregate fractionation was performed via the wet sieving method [32]. Briefly, 50 g of air-dried soil was placed on a set of stacked sieves with mesh sizes of 2, 0.25, and 0.053 mm. A soil aggregate analyzer was used to oscillate the sieves vertically in a water-containing drum at a frequency of 45 cycles per minute for 5 min. Post-sieving, soil aggregates were divided into four size fractions: >2 mm (large macroaggregates), 0.25–2 mm (small macroaggregates), 0.053–0.25 mm (microaggregates), and <0.053 mm (silt and clay fractions). Each size fraction was oven-dried at 40 °C, weighed precisely, and utilized for the determination of aggregate-associated SOC.
Soil bulk density was determined by the 100 cm3 standard stainless-steel cutting ring method [33]. To prevent soil structure disturbance caused by repeated profile excavation within experimental plots, bulk density below 20 cm was randomly sampled at the beginning of the experiment when soil properties were uniformly distributed across all plots. During the experimental period, only topsoil (0–20 cm) bulk density was measured at harvest, and subsoil bulk density below 20 cm was assumed to remain stable over the short term because all tillage and amendment treatments were confined to the topsoil layer.
TN in plant and soil samples and SOC in bulk soils and aggregate fractions were measured using an elemental analyzer (Vario Macro Cube, Elementar, Langenselbold, Germany). For isotopic determination, 15N abundance was analyzed with an isotope ratio mass spectrometer (Isoprime 100, Elementar, Germany). LOC was quantified via the 333 mM potassium permanganate (KMnO4) oxidation method [34]. Nonlabile organic C (NLOC) was defined as the organic C fraction not oxidized by KMnO4, and its content was calculated as the difference between SOC and LOC.

2.5. Calculations

The mean weight diameter (MWD) of soil aggregates (mm) was quantified by employing the subsequent mathematical expressions [35]:
M W D = i = 1 n D i / i = 1 n W i ,
where Di is the mean diameter (mm) of the aggregates for each size fraction, and Wi is the weight proportion of each size fraction to the total weight of the aggregates.
The magnitude of the contributions (contribution; g kg−1) of aggregate-associated SOC to the bulk soil was calculated by the following equation:
C o n t r i b u t i o n = C a g g r e g a t e × W i ,
where Caggregate is the aggregate-associated SOC content (g kg−1).
The percentage distribution of SOC in different aggregate fractions was quantified as the ratio of the contribution magnitude of aggregate-associated SOC to the total SOC content of the bulk soil (0−10 cm layer).
The lability of SOC was determined as the ratio between LOC and NLOC contents [34].
The stocks (Stock) of SOC, LOC, NLOC, and total N in each soil layer (Mg ha−1) were computed as follows:
S t o c k = C o n t e n t × B D × H × 10 ,
where Content is the content of TN, SOC, or its fractions (g kg−1), BD is the soil bulk density (Mg m−3), and H is the thickness of the sampled soil layer (m). The coefficient of 10 is derived from combined unit conversions to express the final stock in Mg ha−1.
The cumulative C stocks across the soil profile were calculated by summing the stocks from each soil layer.
The 15N recovery amount (kg N ha−1) in various soil and plant N pools was determined using the following equations:
N 15   r e c o v e r y   a m o u n t = % N d f f p o o l × N m a s s ,
% N d f f = ( N a p 15 / N 15 a p   f e r t i l i z e r ) × 100 ,
where %Ndffpool denotes the percentage of N derived from fertilizer in the respective soil and plant N pools (%), Nmass (kg N ha−1) represents the absolute N stock contained within a specific soil-N pool or the magnitude of N uptake in a specific plant part, and 15Nap refers to the atom percent excess value derived from the isotopic analysis of the sample.

2.6. Statistical Analysis

Two-way ANOVA was performed using a split-plot design. The assumptions of normality and homogeneity of variances were assessed with the Shapiro–Wilk and Levene’s tests, respectively. Treatment effects were evaluated using the least significant difference (LSD) test. Pearson correlation analysis combined with Mantel tests was used to assess relationships between management practices and soil properties, fertilizer-N recovery, and crop yield. Structural equation modeling (SEM) was applied to quantify the pathways linking SOC and soil aggregates to fertilizer-N recovery and crop yield. The relative contributions to total fertilizer-N recovery were inferred from the standardized total effects (sum of direct and indirect effects) obtained from the SEM. All statistical analyses were conducted in R software (4.5.1).

3. Results

3.1. Soil Organic Carbon Contents in the Soil Profile

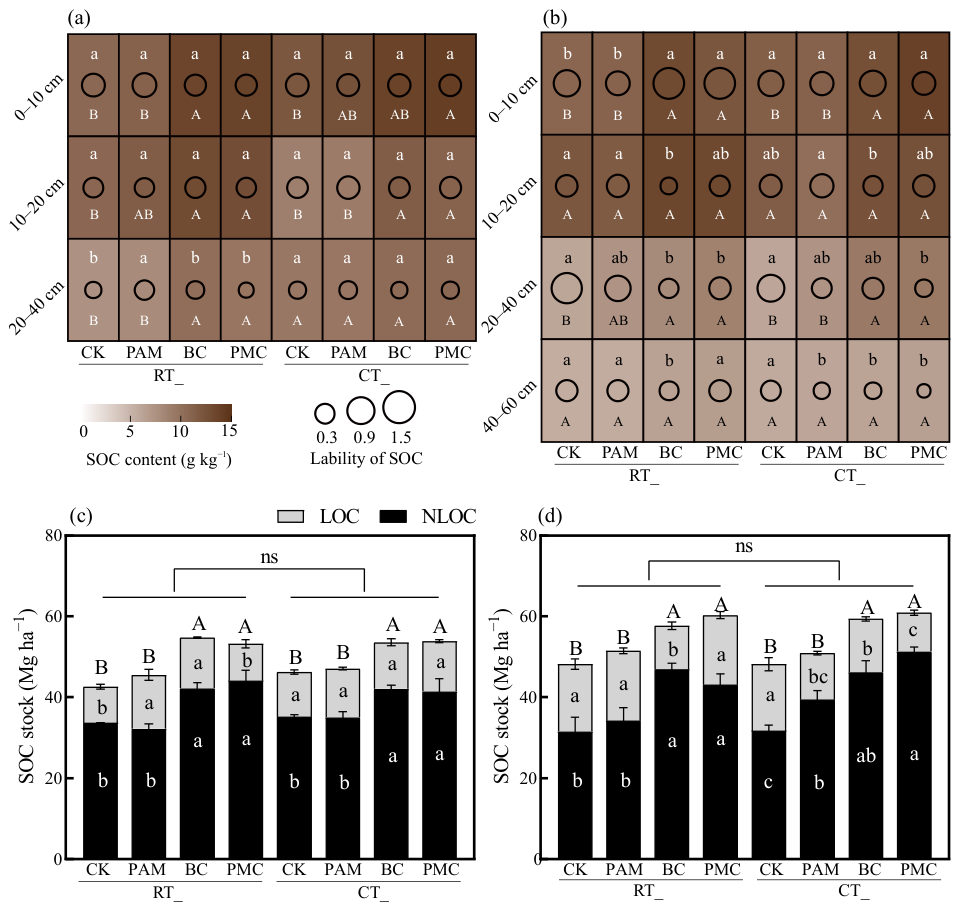
SOC content was highest in the surface soil and decreased with depth (Figure 1). No statistically significant differences in SOC content were detected between CK and PAM across tillage regimes, soil layers, or cropping seasons. In the wheat season, BC and PMC significantly increased SOC content by 13.2–29.9% relative to CK in the 0–20 cm layer (p < 0.05; Figure 1a). In the maize season, their positive effects were confined to the 0–10 and 20–40 cm layers, where SOC increased by 11.8–54.6% compared with CK (p < 0.05; Figure 1b). SOC contents did not differ significantly between BC and PMC. Tillage effects were only significant in the 10–20 cm layer during the wheat season, where CT showed 12.27% lower SOC content than RT.
In the wheat season, amendment-induced variation in SOC lability was only significant in the 20–40 cm layer under RT, where lability under PAM was significantly higher than under the other treatments (Figure 1a). In the maize season, no significant differences in SOC lability were observed between CK and PAM. In contrast, BC and PMC reduced SOC lability relative to both CK and PAM below 10 cm (p < 0.05; Figure 1b). CT generally reduced SOC lability; however, in the 10–20 cm layer, SOC lability under CT was higher than under RT (p < 0.05).
Biochar-amended treatments increased SOC stock by 15.9–28.7% compared with CK (Figure 1c,d). This biochar-induced increase in SOC stock was mainly driven by higher NLOC stock (increased by 19.5–48.5% compared with CK; p < 0.05). Biochar application also reduced SOC lability, particularly in the maize season, where BC decreased SOC lability by 17.9–54.4% compared with non-biochar application (p < 0.05; Figure S2). Although CT and PAM alone did not significantly affect SOC or its fraction stocks compared with CK (p > 0.05), the interactions between tillage and amendments significantly affected LOC stock in both seasons and SOC lability in the maize seasons (Table 1). Overall, the CT_PMC treatment produced the highest SOC stocks (25.8% higher than CK) and lowest SOC lability (62.8% lower than CK) at the end of the experiment (Figure 1d).

3.2. Aggregate Composition and Its Associated Soil Organic Carbon

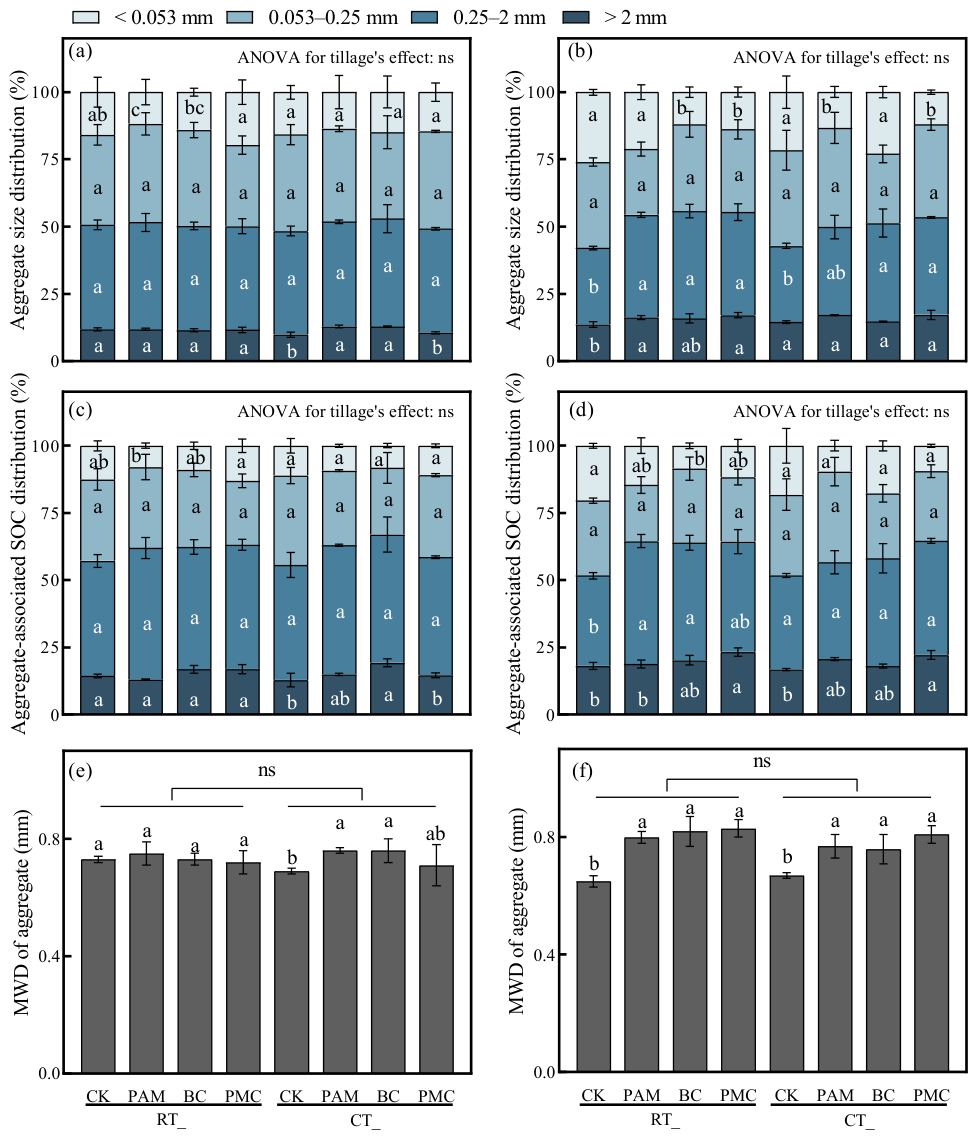
In the wheat season, the proportion of macroaggregates (>0.25 mm) remained relatively stable across all treatments, averaging approximately 50% (Figure 2a). In contrast, distinct differences emerged during the maize season (Figure 2b), where macroaggregates accounted for only 42.0–42.8% of the bulk soil under CK. The application of PAM, BC, and PMC significantly increased this proportion by 16.4–32.6%, although no significant discrepancy was detected among these three amendment practices.
The SOC content associated with macroaggregates (mean 15.00 g kg−1) was 46.8% and 71.3% higher than that associated with microaggregates (0.053–0.25 mm; mean 10.22 g kg−1) and silt and clay (<0.053 mm; mean 8.75 g kg−1), respectively (Table 2). CT significantly affected SOC only in the microaggregate fraction during the wheat season, where SOC increased by 7.73% compared with RT. Biochar application generally increased aggregate-associated SOC, with the largest increases observed in macroaggregates, particularly in the wheat season (28.4–60.1% higher than without biochar). PAM application did not significantly affect aggregate-associated SOC in most cases, except for microaggregates in the maize season. However, significant interactive effects occurred in the microaggregate and silt and clay fractions between PAM and biochar application. Overall, aggregate-associated SOC contents did not differ significantly between CK and PAM in most cases, whereas BC and PMC consistently increased that by 3.5–57.4% across all aggregate size fractions.
Regarding the distribution of SOC in aggregates, the macroaggregate-associated fraction contributed more than 50% of the SOC in both the wheat (Figure 2c) and maize (Figure 2d) seasons. Mirroring the aggregate distribution patterns, macroaggregate-associated SOC exhibited significant increases in the maize season, rising by 9.70–24.9% with PAM, BC, and PMC application, which correspondingly caused a decrease in the proportion of microaggregate- and silt- and clay-associated SOC.
The MWD responded significantly to the amendments mainly in the maize season (Figure 2f), with PAM, BC, and PMC increasing MWD by 12.2–26.3% relative to CK (Figure 2f). In contrast, during the wheat season, significant differences in MWD were detected only under CT (Figure 2e). Overall, the tillage regime alone had no significant effect on soil aggregate size distribution or aggregate MWD in either wheat or maize seasons (Table 1; Figure 2).

3.3. Total Fertilizer-N Recovery

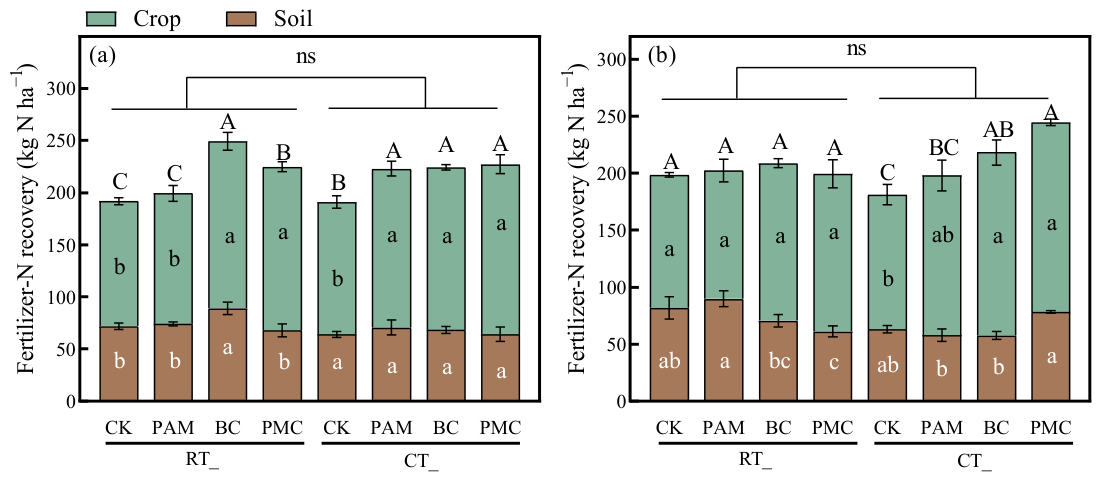
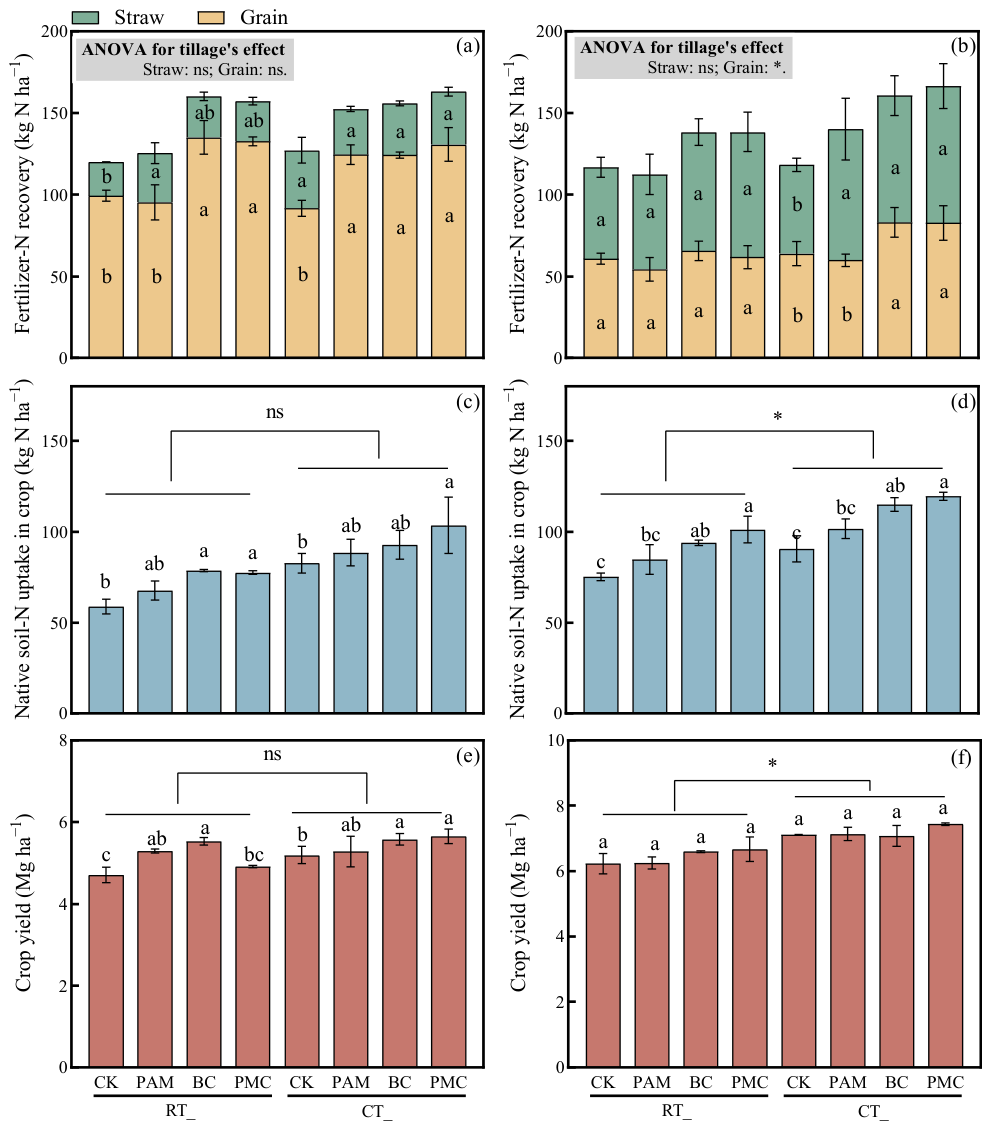
The proportion of fertilizer-N recovered in crops was generally higher than that recovered in the 0–40 cm (Figure 3a) and 0–60 cm (Figure 3b) soil profiles. BC increased total fertilizer-N recovery by 10.10–57.37 kg N ha−1 compared with CK under both RT and CT (p < 0.05; Figure 3). Although tillage regime did not significantly affect total fertilizer-N recovery (Table 1), CT resulted in 15.3% lower cumulative fertilizer-N recovery in the soil profile but 6.34% higher crop-recovered fertilizer-N in the maize season (p < 0.05; Figure 3b).
In the wheat season, CK showed the lowest total fertilizer-N recovery under both RT and CT, whereas BC and PMC significantly increased total recovery by 17.3–29.9% (i.e., 33.18–57.37 kg N ha−1; Figure 3a). Under RT_BC, this increase was driven by higher fertilizer-N recovery in both soil and crop (p < 0.05). In contrast, for the other BC- and PMC-involved treatments, the increase in total recovery was mainly attributable to a higher crop-recovered proportion.
In the maize season, RT_BC and RT_PMC decreased soil-recovered fertilizer-N by an average of 23.4% (20.06 kg N ha−1) relative to RT_CK and RT_PAM, while concurrently increasing crop-recovered fertilizer-N by an average of 26.6% (23.65 kg N ha−1). These opposite changes resulted in similar total fertilizer-N recovery among the four RT treatments (p > 0.05; Figure 3b). Under CT, however, total fertilizer-N recovery followed the order PMC > BC > PAM > CK, with the increases primarily due to enhanced crop N recovery.

3.4. Fertilizer-N Recovered in Soil Profile

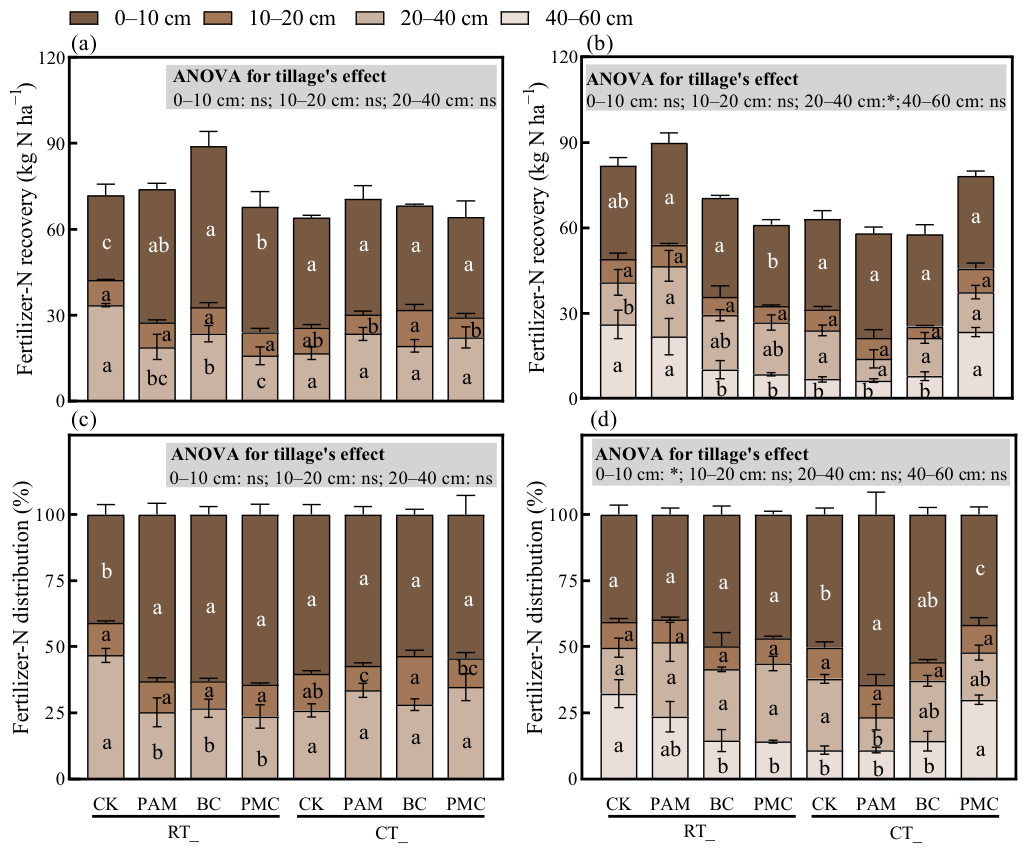
Except for CK, fertilizer-N recovery and its vertical distribution generally peaked in the 0–10 cm layer and were lowest in the 10–20 cm layer across treatments (Figure 4). The fertilizer-N recovered in the 0–40 cm layer during the wheat season was on average 26.9% higher than that during the maize season (71.24 vs. 56.14 kg N ha−1; Figure 4a,b). Significant effects of tillage regime on both the amount and distribution of fertilizer-N recovery were only detected in the maize season. Compared with RT, CT significantly reduced the fertilizer-N recovery amount in the 20–40 cm soil layer by 32.3% (Figure 4b), while increasing the proportional distribution of fertilizer-N in the 0–10 cm layer by 19.72% (p < 0.05; Figure 4d).
Overall, amendments induced greater variation in fertilizer-N recovery and distribution among soil layers in the maize season than in the wheat season. In the wheat season under RT, PAM, BC, and PMC increased fertilizer-N recovery in the 0–10 cm layer by 47.0–88.8%, accompanied by a corresponding decline of 29.5–52.7% in the 20–40 cm layer (p < 0.05). Under CT, amendment-induced differences in soil fertilizer-N recovery were only evident in the 10–20 cm layer, with CT_BC showing the highest recovery (p < 0.05; Figure 4a,c).
In the maize season, PAM resulted in the highest fertilizer-N recovery across soil layers under RT, whereas under CT, PMC led to the greatest cumulative soil-recovered fertilizer-N, mainly due to its 2.94–3.76-fold increase in fertilizer-N recovery in the 40–60 cm layer (p < 0.05; Figure 4b). Under RT, amendments primarily modified fertilizer-N distribution in the 40–60 cm layer, where they tended to reduce fertilizer-N recovery relative to CK. In contrast, under CT, amendments tended to increase fertilizer-N recovery in the 40–60 cm layer. The most pronounced effect occurred under CT_PMC, which decreased fertilizer-N recovery in the 0–10 cm layer while increasing it in the 40–60 cm layer (p < 0.05; Figure 4d).

3.5. Crop-Recovered N and Crop Yield

In general, application of amendments increased crop-recovered fertilizer-N, with BC and PMC showing the strongest effects (18.4–35.8% and 18.5–40.8% increases relative to CK, respectively) across both seasons (Figure 3 and Figure 5a,b). However, the plant parts contributing to this increase differed between wheat and maize. In the wheat season, the BC- and PMC-induced increase in fertilizer-N recovery was almost entirely attributable to greater grain N uptake (accounting for more than 90% of the total increment; Figure 5a). In contrast, in the maize season, the additional fertilizer-N recovered under BC and PMC was derived from both straw and grain (Figure 5b).
Tillage regime significantly affected crop-recovered fertilizer-N, especially in maize grain (p < 0.05; Table 1), where CT increased fertilizer-N recovery by an average of 15.2% compared with RT. Consistently, tillage significantly influenced soil-derived N uptake by crops only in the maize season, with CT increasing native soil-N uptake by 20.2% on average (Figure 5b,c). Across both crops, amendments tended to enhance native soil-N uptake in plants by 8.79–83.54 kg N ha−1 relative to CK, and the CT_PMC treatment produced the highest native soil-N uptake in both wheat and maize.
The yield response to soil amendments was season dependent. Significant yield increases were observed only in the wheat season (Figure 5e,f; Table 1; p < 0.05). Under RT, the addition of PAM and BC elevated wheat yield by 12.7% and 17.5%, respectively, compared with the CK. Under CT, BC and PMC applications resulted in wheat yield increments of 7.40% and 13.5% relative to CK. In the maize season, none of the amendments produced a significant difference in crop yield. Nevertheless, the adoption of CT markedly improved maize yield by 11.7% on average, regardless of amendment treatment.

3.6. Relationships Between Fertilizer-N Recoveries, Soil Physical and Chemical Properties, and Crop Yield

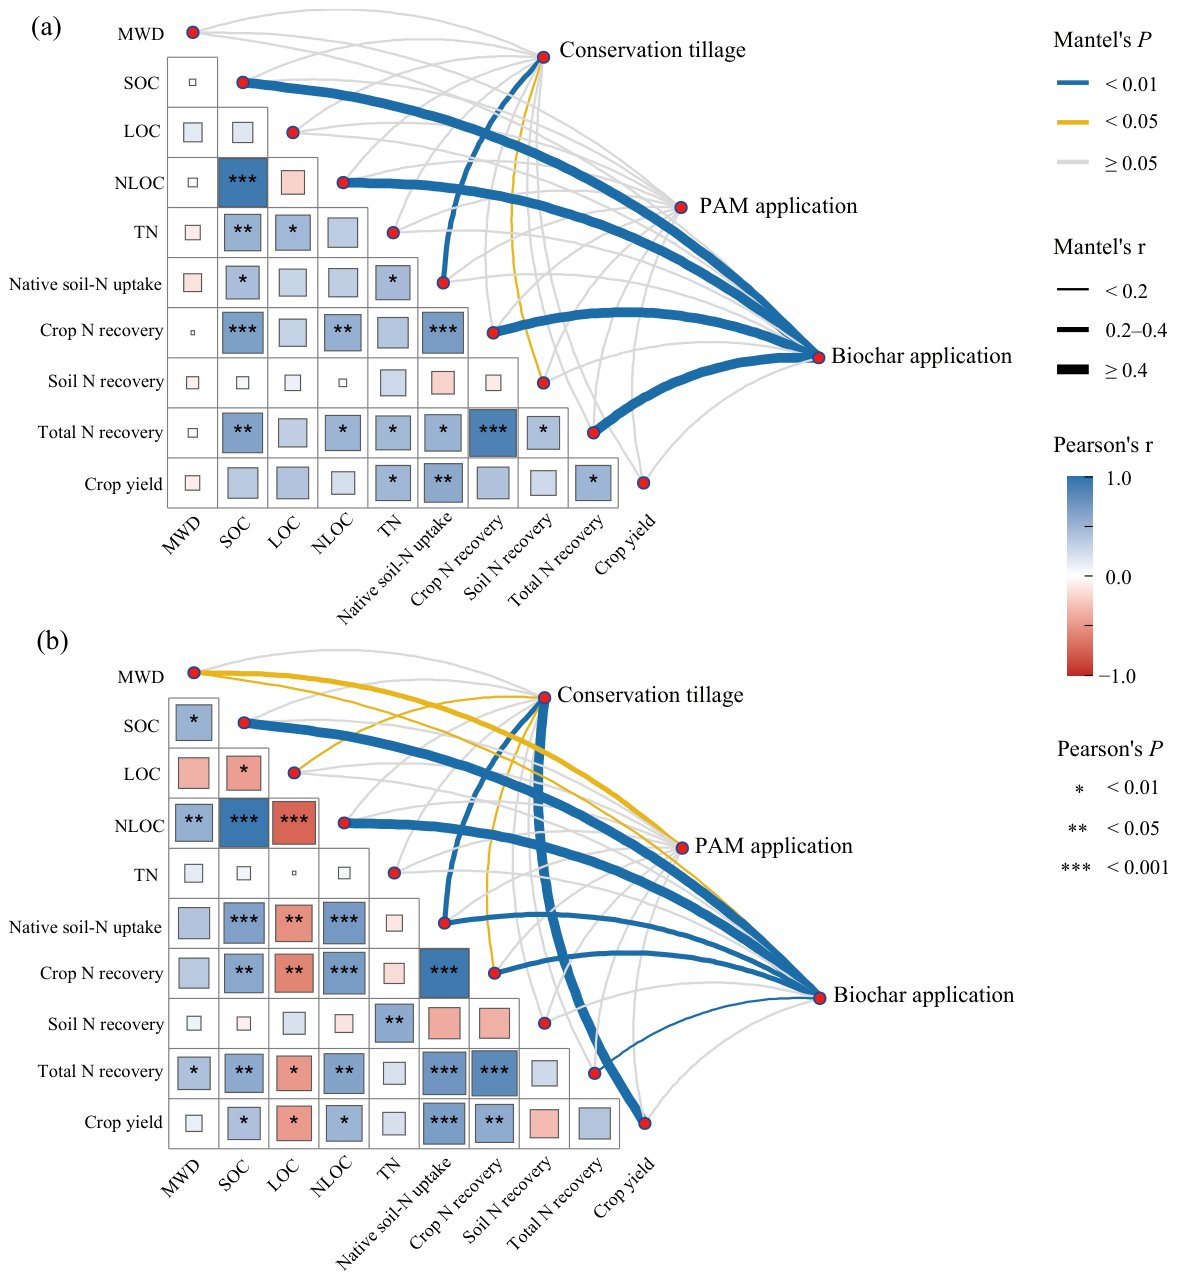
Pearson correlation analysis combined with Mantel tests revealed season-dependent relationships among management practices, soil aggregate stability, SOC, and fertilizer-N recoveries (Figure 6). In the wheat season, both total fertilizer-N recovery and crop-recovered portion were significantly and positively correlated with SOC and NLOC contents, and native soil-N uptake by crops (Figure 6a). Wheat yield was positively associated with soil TN content, native soil-N uptake in crops, and total fertilizer-N recovery. CT was significantly related to native soil-N uptake in crops and soil-recovered fertilizer-N. Biochar application significantly affected SOC and NLOC contents, crop-recovered fertilizer-N, and total fertilizer-N recovery. In contrast, the PAM application showed no significant relationships with soil parameters or N recovery variables in the wheat season.
In the maize season, total fertilizer-N recovery, crop N recovery, and crop yield were positively correlated with SOC and NLOC contents and native soil-N uptake in crops but negatively correlated with LOC content (Figure 6b). Soil-recovered fertilizer-N was positively correlated with soil TN content. Adoption of CT was significantly associated with variation in crop yield, native soil-N uptake in crops, LOC content, and crop-recovered fertilizer-N. PAM application primarily influenced the MWD of aggregates (p < 0.05). Biochar application significantly regulated SOC and NLOC contents, native soil-N uptake in crops, plant-recovered fertilizer-N, total fertilizer-N recovery, and aggregate MWD.
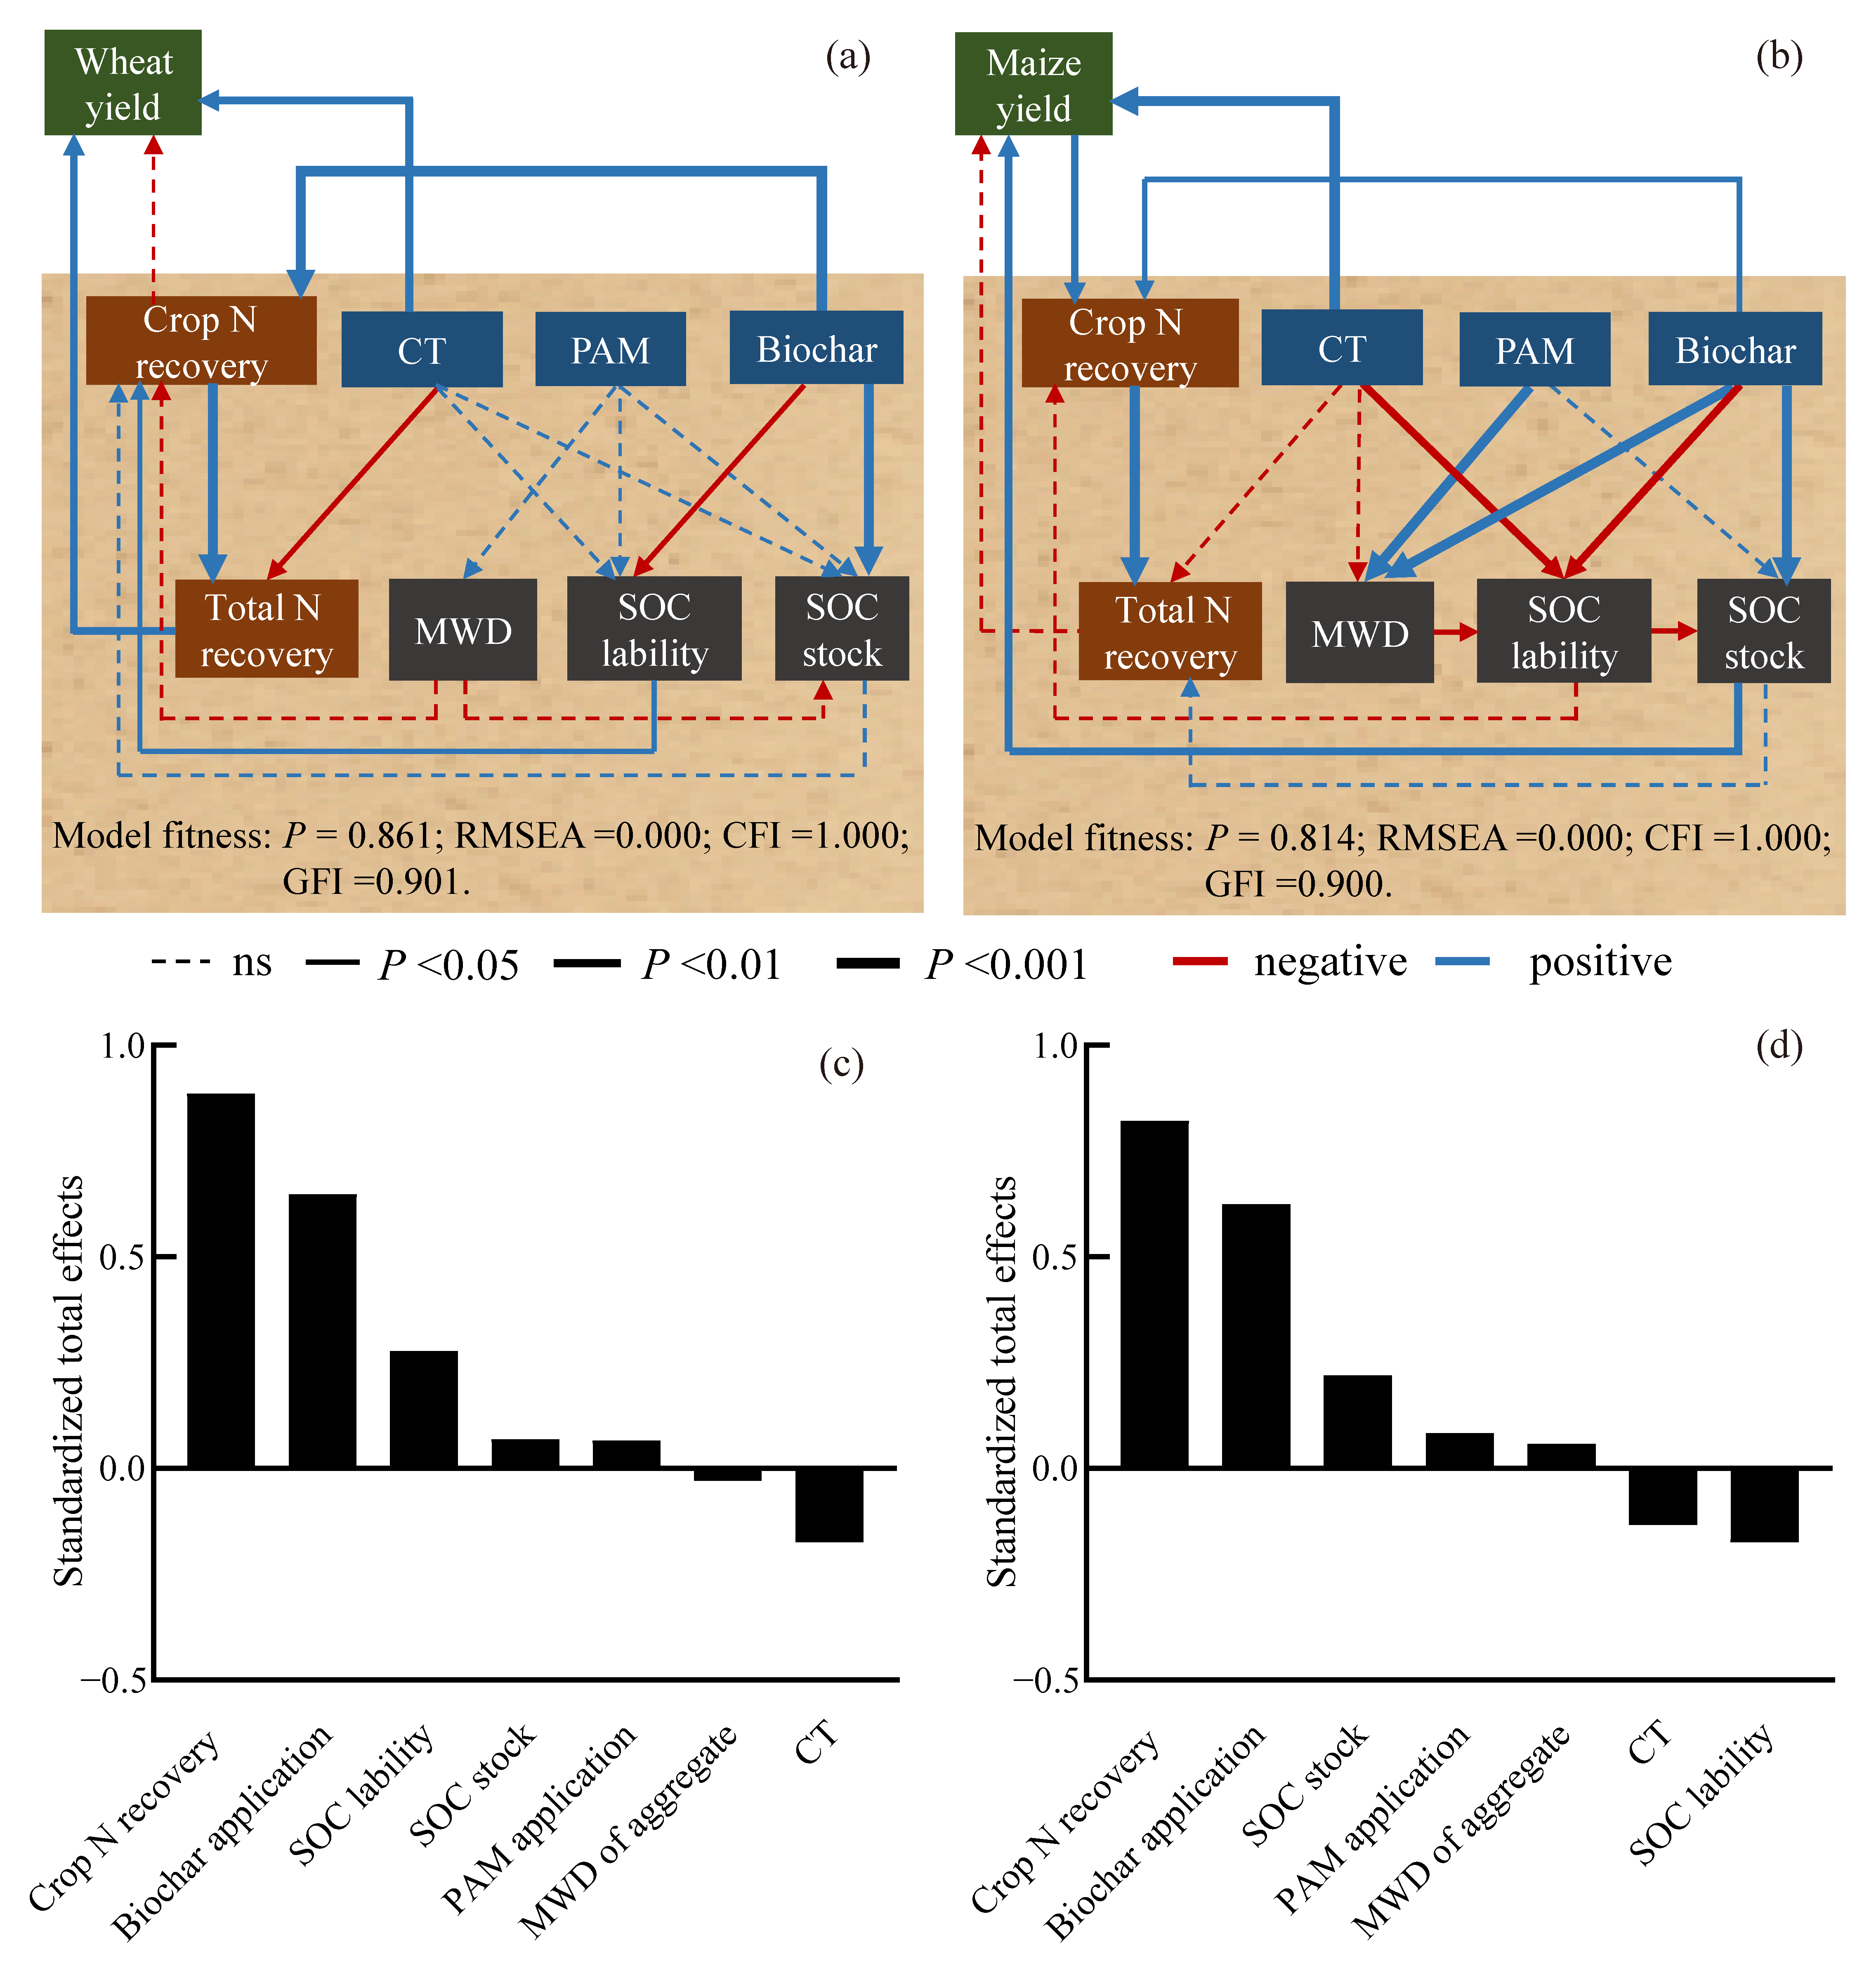
SEM revealed that management practices influenced SOC, aggregates, fertilizer-N recovery, and crop yield through distinct pathways (Figure 7). In the wheat season, biochar application positively affected crop N recovery and SOC stock, but reduced SOC lability (p < 0.05; Figure 7a). SOC lability, in turn, positively affected plant N recovery, thereby enhancing total fertilizer-N recovery. Overall, crop N recovery, biochar application, and SOC lability exerted positive total effects on total fertilizer-N recovery, whereas CT had a negative total effect (Figure 7c).
In the maize season, biochar application directly increased SOC stock, while CT and PAM increased SOC stock by enhancing the MWD of aggregates or decreasing SOC lability (p < 0.05; Figure 7b). The increase in SOC stock under CT improved maize yield, which subsequently promoted crop N recovery and total N recovery. Overall, crop-recovered fertilizer-N, biochar application, and SOC stock had positive total effects on total fertilizer-N recovery, whereas SOC lability and CT had negative total effects (Figure 7d).

4. Discussion

4.1. Effects of Soil Management Practices on SOC and Aggregates

A number of studies have reported significantly positive effects of CT on SOC accumulation compared with RT [36,37]. In contrast, our study found that CT did not significantly affect total SOC stocks across seasons (Figure 1). The commonly reported benefit of CT for SOC sequestration is largely attributed to improved soil aggregation and the associated physical protection of SOC under reduced soil disturbance [38]. However, likely because CT had been implemented for only a short period in our experiment [39], we observed no significant differences in aggregate composition, MWD, or the distribution of aggregate-associated SOC between CT and RT (Figure 2). Moreover, a decline in SOC content under CT was even observed in the 10–20 cm layer during the wheat season (Figure 1). A previous meta-analysis also detected short-term SOC reductions under CT in the subsoil [40], which could have resulted from (1) slower incorporation of organic amendments into deeper soil layers [41] and (2) reduced root-C distribution in subsoils due to soil compaction and stratification [42]. Nevertheless, our study found that CT could interact with biochar and PAM to regulate SOC lability in the maize season (Table 1), and the adoption of CT generally reduced SOC lability throughout the soil profile (Figure 1 and Figure 7). This suggests that CT favors the transformation and retention of SOC in more stable fractions, thereby enhancing SOC stabilization and potentially mitigating its decomposition. It has been demonstrated that CT increases the contribution of microbial necromass to SOC [18,43]. This C fraction is highly stable and is expected to persist in soil for extended periods [44]. Thus, even though CT showed no promotion of total SOC in the short term, its fractions had already been modified during this period, which could potentially benefit future SOC sequestration.
Biochar application significantly increased SOC stocks in both RT and CT (21.1–45.4% increase; Figure 1) and was identified as the management practice most strongly associated with SOC enhancement (Figure 6), underscoring its short-term effectiveness in promoting soil C sequestration. These increment effects were consistent with previous studies conducted for 1–3 years [45,46,47]. The polyaromatic structure of biochar resists microbial decomposition, thus providing direct input of stable C in the short term [48]. Similarly, our results showed that biochar application significantly reduced SOC lability, and the biochar-induced increase in total SOC was mainly driven by an increase in NLOC (Figure 1). This pattern suggests that biochar facilitates C sequestration by promoting the accumulation of more recalcitrant SOC fractions. Additionally, biochar application is suggested to benefit soil aggregation and improve aggregate stability, thereby enhancing the physical protection of both newly added and native SOC [17,49]. Consistent with previous findings, biochar application enhanced MWD of aggregates (Figure 2 and Figure 7), and increased the contribution of macroaggregate-associated SOC to bulk soil by 5.17–12.18% compared with non-biochar application (Figure 2). The short-term positive effects of BC on soil aggregation could have been attributed to biochar’s highly porous structure, which provides numerous sites for physical entanglement with soil particles, fungal hyphae, and plant roots to form macroaggregates [50], as well as its interaction with soil minerals via cation bridges [51]. These findings underscore the high efficiency of BC in enhancing SOC through both substantial input of recalcitrant C and provision of physical protection for SOC.
PAM application was reported to increase aggregate stability by 180–300% relative to the control [20,52,53], mainly owing to its binding effect on soil particles and ready adsorption onto soil aggregates [30,54]. In line with previous studies, PAM-added treatments increased both the proportion of macroaggregates and the MWD of soil aggregates compared with CK under CT in wheat season and under both tillage regimes during the maize season (Figure 2 and Figure 7). PAM’s adsorption onto soil particles was highly related to hydration and molecular expansion in aqueous solutions [55,56]. The lack of significant effects of PAM on soil aggregates under RT in the wheat season might have resulted from the limited precipitation in that season and the relatively low moisture conservation ability of RT-treated soils. Higher soil water content is typically maintained under CT [23], which ensures continuous pore–water connectivity and enhances the combined effects between PAM and soil solution. In correspondence with the aggregate stability, PAM application increased the contribution of macroaggregate-associated SOC to bulk soil (Figure 2). Nevertheless, the increase in SOC content under PAM was very limited throughout the soil profile (Figure 1). A similar pattern was reported by Abulaiti et al. [57], who found no significant difference in SOC content between sole PAM application and the control. This suggests that the PAM mainly played a crucial role in regulating soil physical structure but showed only marginal promotion effects on SOC sequestration in the short term, especially under its mere application.
The combined application of PAM and biochar (PMC) resulted in the highest SOC stocks under both RT and CT at the end of the experiment. This finding is consistent with previous studies [26] and is likely attributable to enhanced protection of both biochar-derived C and native SOC under the combined amendment regime [58]. Although integrating different tillage regimes with PMC did not further increase SOC within the short experimental period, which is probably owing to the dominant effect of biochar on SOC overshadowing the relatively smaller influence of tillage, this combination may still contribute to sustaining SOC stocks over the long term by improving the persistence of sequestered C. This is particularly relevant given that the high cost of biochar constrains its continuous application [59].

4.2. Patterns of N Recovery Under Soil Amendment Practices

The fertilizer-N recovered in the 0–40 cm soil layer during the wheat season was on average 26.9% higher than that during the maize season (71.24 vs. 56.14 kg N ha−1; Figure 3), whereas crop-recovered fertilizer-N was similar between the two seasons (145.17 vs. 136.39 kg N ha−1; Figure 4). Correspondingly, the wheat season achieved higher total fertilizer-N recovery than the maize season. This likely reflects greater fertilizer-N losses in the maize season, which was driven by higher precipitation (Figure S2) and air temperature. Consistent with these results, previous 15N-tracing studies have shown that over 78% of fertilizer-N was concentrated in topsoil layers (0–40 cm) in wheat season [60], while maize seasons are associated with substantially larger N losses via gaseous and hydrological pathways than wheat seasons [61,62]. Together, these findings underscore the particular importance of implementing N-retention strategies in the maize season [63].
Under both RT and CT, biochar application tended to increase the proportion of fertilizer-N retained in the surface soil (0–10 cm), but it did not significantly affect cumulative fertilizer-N recovery throughout the whole profile (Figure 4). Despite this limited impact at the profile scale, biochar consistently enhanced crop uptake of fertilizer-N by 18.4–35.8% relative to CK, thereby increasing total fertilizer-N recovery (Figure 3). This pattern agrees with evidence from a meta-analysis showing that biochar generally enhances plant N uptake and improves NUE [64]. One mechanism by which biochar achieves these effects is its ability to increase soil cation exchange capacity [65] and aggregate stability (Figure 2). These changes lead to reduced N leaching and gaseous losses while simultaneously enhancing the retention of fertilizer-N in the soil [66]. Furthermore, as reported in existing studies [67,68], biochar’s porous microstructure offers plentiful microsites to promote microbial immobilization of fertilizer-N, which might temporarily lower N-loss risk and retain available N for subsequent crop absorption. It is noteworthy that the positive effect of biochar on total fertilizer-N retention was more pronounced in the wheat season (Figure 3). This likely reflects the timing of biochar application before wheat sowing, when freshly exposed biochar surfaces and their interaction with fertilizer most strongly promoted soil-N retention and crop N uptake. Consistently, a previous 15N-tracing study reported a greater impact of biochar on fertilizer-N retention in the first application season than in subsequent seasons [69].
PAM application did not significantly alter cumulative fertilizer-N recovery at the soil profile scale, but it generally increased plant N uptake and total fertilizer-N recovery compared with CK, especially under CT (Figure 4). This pattern may be explained by the behavior of dissolved PAM, which increases the viscosity of the soil solution and partially blocks larger pores, thereby slowing water flow and reducing hydrologic N losses [70]. In addition, the increased soil aggregate stability induced by the combined effects of PAM and CT during the maize season (p < 0.05; Figure 2) may have reduced particulate-bound N losses in runoff during intense rainfall events [23,71]. These interpretations are supported by a previous field study under a wheat–maize rotation, in which PAM application reduced nitrate leaching by 27%, NH3 volatilization by 38%, and soil-N surplus by 31%, while simultaneously increasing yields [72].
In addition, although CT did not significantly affect total fertilizer-N recovery (Figure 3), it significantly increased the crop-recovered fertilizer-N compared with RT (p < 0.05; Table 1). This pattern suggests a trade-off between fertilizer-N retained in the soil and fertilizer-N taken up by the crop. Previous studies have shown that CT can enhance soil enzyme activities and soil water storage, thereby increasing crop yield and plant N acquisition [73,74,75]. Consistent with our results, a 15N-tracing study also reported consistently higher crop NUE under no-till than under conventional tillage [76]. Taken together, CT_PMC exhibited the highest total fertilizer-N recovery among all treatments during the maize season. This result could have been attributed to the combined effects of CT and soil amendments (Table 1), which likely mitigated fertilizer-N leaching and other N-loss pathways, while simultaneously improving crop yield and N uptake (Figure 7). However, it should be noted that the yield response to CT was only evident in the maize season, while wheat yield was primarily regulated by soil amendments. This inconsistency likely stems from distinct climatic conditions during the two growing seasons and crop-specific responses to changes in the soil hydrothermal regime and nutrient fertility, rather than being controlled by a single dominant factor [11].

4.3. Roles of SOC and Soil Aggregation in Regulating Fertilizer-N Recovery

It is well documented that higher SOC levels generally enhance fertilizer-N retention and thereby increase total fertilizer-N recovery [11,77]. Similarly, our results showed statistically significant positive relationships between SOC stock and total fertilizer-N recovery in both the wheat and maize seasons (Figure 6). This pattern is likely driven by the stabilization of C–N in mineral-associated forms [44,78] and by enhanced microbial N immobilization [79]. Notably, NLOC exhibited a consistently significant positive relationship with total N recovery, whereas LOC showed insignificant or even negative relationships with total N recovery (Figure 6). Consistent with these findings, the SEM indicated that SOC lability exerted a stronger influence on total fertilizer-N recovery than total SOC stock (Figure 7). The finding is consistent with the trend in our previous 15N-tracing study [80] and suggests that the more stable SOC fractions may contribute more to fertilizer-N retention, even in maize seasons with high N-loss risk [81]. A recent study further traced 15N among SOC fractions and demonstrated that fertilizer-N was preferentially retained in mineral-associated organic matter (MAOM) under straw application, whereas it was preferentially retained in particulate organic matter (POM) in biochar-amended soils [82]. Although that study highlighted the role of relatively labile POM in fertilizer-N retention, its results were based on a 12-day incubation. It has been reported that under field conditions, POM-associated fertilizer-N could subsequently be immobilized within microbial necromass and then stabilized in MAOM over longer timescales [44,78]. This mechanism is also consistent with our previous finding that the potential for SOC conversion among aggregate fractions was strongly associated with fertilizer-N recovery [80]. Therefore, the results highlight the critical role of both SOC quantity and quality in fertilizer-N retention.
The MWD of aggregates showed a positive relationship with total N recovery, but this relationship was statistically significant only in the maize season (Figure 6). This seasonal contrast is likely linked to differences in erosive forces [83,84]: in the relatively rainless wheat season, lower erosion pressure may mask the benefits of the integrative practices for improving aggregation, whereas in the maize season, enhanced aggregate stability more directly translates into reduced N loss. The SEM further indicated that increases in the MWD enhanced total fertilizer-N recovery mainly by reducing SOC lability (Figure 7). Greater aggregate stability enhances the physical protection of both organic C and N within the soil structure, favoring the sequestration of organic matter and microbial products, restricting decomposer access, and limiting oxygen diffusion, thereby promoting microbially driven stabilization processes [85,86]. Consequently, these findings suggest that integrative practices that foster macroaggregate formation and increase the MWD can simultaneously strengthen SOC stabilization and fertilizer-N retention.
Moreover, our results found that soil amendment practices not only influenced the contribution of fertilizer-N to crop N utilization but also increased the contribution of native soil-N to crop N uptake by 8.79–83.54 kg N ha−1 (Figure 5). Previous investigations reported that the native soil-N could contribute 59–77% to total crop N uptake [87,88], which represents a considerable source of N supply. Specifically, the increment in the contribution of native soil-N to crop N uptake was highly related to the enhancement of SOC stock (Figure 6), indicating that the sequestration of SOC would also benefit the supply of native soil-N to the crop. Consistently, long-term organic amendments and diversified systems have been shown to enhance SOC and total N mineralization, thereby increasing crop N uptake from soil rather than fertilizer [89,90]. Therefore, it is likely that the integrated soil amendment practices promoted a more efficient coupling among SOC sequestration, fertilizer utilization, and native soil-N mineralization, thereby enhancing the contribution of native soil-N to crop N uptake and ultimately improving overall N use efficiency in the agroecosystem.

4.4. Limitations and Implications

It should be acknowledged that this work is subject to several limitations. First, although the total fertilizer-N recovery efficiency reached 71–92% in our study, the restricted soil sampling depth (up to 60 cm) likely led to an underestimation of fertilizer-N recovery, as fertilizer-derived N remaining in the soil profile down to 100 cm can still be regarded as recoverable N that may be taken up by crop roots [5]. Second, the fertilizer-N retention was not quantified within different aggregate classes and SOC fractions, which prevented assessing SOC–fertilizer-N interactions at finer spatial and physicochemical scales. Third, the absence of in-season dynamic analysis and microbial measurements limited our ability to elucidate the microbial processes driving SOC stabilization and N retention. In addition, while the safety of PAM use has been documented [29], we did not directly evaluate the environmental risks of seasonal PAM application in this study, which requires further investigation.
Despite these limitations, this study provided in situ evidence of the short-term, combined effects of CT, PAM application, and biochar addition on SOC sequestration and fertilizer-N recovery. The results demonstrated that the use of CT, PAM, and biochar could, in combination or individually, increase SOC stocks, with the greatest effect under CT_PMC. Further research should aim to elucidate the underlying mechanisms, such as aggregate-scale C–N dynamics and microbial regulatory processes, and evaluate the overall eco-economic performance of these integrated management strategies over longer timescales and across diverse biochar types and cropping systems.

5. Conclusions

The study demonstrated the short-term effectiveness of integrating CT, biochar, and PAM to simultaneously promote SOC sequestration and fertilizer-N recovery in an infertile soil. Fertilizer-N recovery was positively correlated with SOC stock, especially the non-labile fraction (evidenced by high NLOC and low SOC lability), underscoring the critical role of both SOC quantity and quality in fertilizer-N retention. The crop-recovered fertilizer-N was significantly increased under CT compared with those under RT, but SOC stocks were not significantly affected by tillage regimes. Biochar consistently enhanced fertilizer-N recovery relative to CK under both RT and CT, which was related to an increase in SOC stock and soil aggregation, and a decrease in SOC lability. PAM mainly contributed to the promotion of soil aggregate stability, especially under CT and in the maize season, which facilitated the reduction of SOC lability, while its direct effects on SOC accumulation and fertilizer-N recovery remained limited. Overall, the tillage regimes and amendments exhibited significant interactive effects on total fertilizer-N recovery in the short term, in which PMC achieved the highest SOC sequestration and fertilizer-N recovery under CT treatment, likely due to combined improvements in SOC quantity, quality, soil structure, and crop N utilization. Future studies should elucidate underlying mechanisms and evaluate long-term eco-economic performance across diverse cropping systems among various infertile soils.

Supplementary Materials

The following supporting information can be downloaded at: https://www.mdpi.com/article/10.3390/agriculture16111171/s1, Table S1: Details of the treatments in this study; Figure S1: Daily precipitation over the experimental period for the (a) 2020–2021 and (b) 2021–2022 crop rotations. Values in parentheses indicate the proportion of seasonal precipitation relative to annual precipitation, with the maize-growing season contributing approximately 74% of the total annual precipitation; Figure S2: Average lability soil organic carbon (SOC) stock within the soil profile in (a) wheat and (b) maize seasons. Different letters indicate significant differences among treatments within the same tillage regime (p < 0.05). Error bars represent standard errors. ns denotes no significant difference. CK, without amendments’ application; PAM, application of polyacrylamide; BC, application of biochar; PMC, combined application of polyacrylamide and biochar; RT, rotary tillage; CT, conservation tillage.

Author Contributions

Conceptualization, C.X., J.W. (Jidong Wang) and Z.Z.; methodology, C.X., W.L., H.L., X.Q. and J.W. (Junzhe Wang); software, C.J., J.Y., W.L. and X.Q.; validation, J.W. (Jidong Wang) and Y.Z.; formal analysis, J.W. (Junzhe Wang), W.L. and X.Q.; investigation, H.L. and C.X.; resources, Y.Z., J.W. (Jidong Wang), Z.Z., C.X. and Y.A.; data curation, C.J., J.Y., H.L., X.Q., C.X. and W.L.; writing—original draft preparation, C.X. and W.L.; writing—review and editing, J.W. (Jidong Wang), Z.Z. and Y.Z.; visualization, W.L. and C.X.; supervision, Y.Z., J.W. (Jidong Wang) and Y.A.; project administration, C.X., J.W. (Jidong Wang) and Y.Z.; funding acquisition, C.X., J.W. (Jidong Wang), C.J. and Y.Z. All authors have read and agreed to the published version of the manuscript.

Funding

This research was funded by the National Key R&D Program of China (2023YFD1901102-04), the Basic Research Program of Jiangsu (BK20230076), the National Natural Science Foundation of China (42477314, 42377338, and 42577335), the Jiangsu Agriculture Science and Technology Innovation Fund (CX(23)1019), the China Agriculture Research System (CARS−10-Sweetpotato), and the Key Research and Development Project of Jiangsu Province (BE2021378).

Institutional Review Board Statement

Not applicable.

Data Availability Statement

The original contributions presented in this study are included in the article. Further inquiries can be directed to the corresponding author.

Acknowledgments

We acknowledge the anonymous reviewers for their helpful comments that significantly improved the manuscript.

Conflicts of Interest

The authors declare no conflicts of interest. The funders had no role in the design of the study, in the collection, analyses, or interpretation of data, in the writing of the manuscript, or in the decision to publish the results. The supporting sources had no involvement in the submission of the report for publication.

Abbreviations

The following abbreviations are used in this manuscript:
NLOCNonlabile soil organic carbon
SOCSoil organic carbon
LOCLabile soil organic carbon
MWDMean weight diameter of soil aggregates
PAMApplication of polyacrylamide
PMCCombined application of polyacrylamide and biochar
NUENitrogen use efficiency
SEMStructural equation modeling
BCApplication of biochar
RTRotary tillage
CTConservation tillage
TNSoil total nitrogen
CCarbon
NNitrogen

References

  1. Sutton, M.A.; Howard, C.M.; Kanter, D.R.; Lassaletta, L.; Móring, A.; Raghuram, N.; Read, N. The nitrogen decade: Mobilizing global action on nitrogen to 2030 and beyond. One Earth 2021, 4, 10–14. [Google Scholar] [CrossRef]
  2. You, L.; Ros, G.H.; Chen, Y.; Zhang, F.; de Vries, W. Optimized agricultural management reduces global cropland nitrogen losses to air and water. Nat. Food 2024, 5, 995–1004. [Google Scholar] [CrossRef]
  3. Wang, C.; Shen, Y.; Fang, X.; Xiao, S.; Liu, G.; Wang, L.; Gu, B.; Zhou, F.; Chen, D.; Tian, H.; et al. Reducing soil nitrogen losses from fertilizer use in global maize and wheat production. Nat. Geosci. 2024, 17, 1008–1015. [Google Scholar] [CrossRef]
  4. Uwiragiye, Y.; Wang, J.; Huang, Y.; Wu, L.; Zhou, J.; Zhang, Y.; Chen, M.; Jing, H.; Qian, Y.; Elrys, A.S.; et al. Global ecosystem nitrogen cycling reciprocates between land-use conversion and its reversal. Glob. Change Biol. 2024, 30, e17537. [Google Scholar] [CrossRef] [PubMed]
  5. Ju, X.T.; Xing, G.X.; Chen, X.P.; Zhang, S.L.; Zhang, L.J.; Liu, X.J.; Cui, Z.L.; Yin, B.; Christie, P.; Zhu, Z.L.; et al. Reducing environmental risk by improving N management in intensive Chinese agricultural systems. PLoS ONE 2009, 106, 3041–3046. [Google Scholar] [CrossRef]
  6. Houlton, B.Z.; Almaraz, M.; Aneja, V.; Austin, A.T.; Bai, E.; Cassman, K.G.; Compton, J.E.; Davidson, E.A.; Erisman, J.W.; Galloway, J.N.; et al. A world of co-benefits: Solving the global nitrogen challenge. Earth’s Future 2019, 7, 865–872. [Google Scholar] [CrossRef]
  7. Duan, J.; Liu, H.; Zhang, X.; Ren, C.; Wang, C.; Cheng, L.; Xu, J.; Gu, B. Agricultural management practices in China enhance nitrogen sustainability and benefit human health. Nat. Food 2024, 5, 378–389. [Google Scholar] [CrossRef] [PubMed]
  8. Dhawan, G.; Dheri, G.; Gill, A. Long-term use of balanced fertilization decreases nitrogen losses in a maize-wheat system on Inceptisol of north India. Arch. Agron. Soil Sci. 2020, 68, 395–412. [Google Scholar] [CrossRef]
  9. Quan, Z.; Zhang, X.; Davidson, E.A.; Zhu, F.; Li, S.; Zhao, X.; Chen, X.; Zhang, L.M.; He, J.Z.; Wei, W.; et al. Fates and use efficiency of nitrogen fertilizer in maize cropping systems and their responses to technologies and management practices: A global analysis on field 15N tracer studies. Earth’s Future 2021, 9, e2020EF001514. [Google Scholar] [CrossRef]
  10. Kelley, L.A.; Zhang, Z.; Tamagno, S.; Lundy, M.E.; Mitchell, J.P.; Gaudin, A.C.M.; Pittelkow, C.M. Changes in soil N2O emissions and nitrogen use efficiency following long-term soil carbon storage: Evidence from a mesocosm experiment. Agric. Ecosyst. Environ. 2024, 370, 109054. [Google Scholar] [CrossRef]
  11. Xu, C.; Zhu, H.; Liu, H.; Ji, C.; Yuan, J.; Li, G.; Wang, J.; Zhang, Y. Patterns of crop-specific fertilizer-nitrogen losses and opportunities for sustainable mitigation: A quantitative overview of 15N-tracing studies. Soil Ecol. Lett. 2024, 6, 230206. [Google Scholar] [CrossRef]
  12. Petersson, T.; Antoniella, G.; Perugini, L.; Chiriacò, M.V.; Chiti, T. Carbon farming practices for European cropland: A review on the effect on soil organic carbon. Soil Tillage Res. 2025, 247, 106353. [Google Scholar] [CrossRef]
  13. Han, X.; Xu, C.; Dungait, J.A.J.; Bol, R.; Wang, X.; Wu, W.; Meng, F. Straw incorporation increases crop yield and soil organic carbon sequestration but varies under different natural conditions and farming practices in China: A system analysis. Biogeosciences 2018, 15, 1933–1946. [Google Scholar] [CrossRef]
  14. Liu, M.; Song, F.; Yin, Z.; Chen, P.; Zhang, Z.; Qi, Z.; Wang, B.; Zheng, E. Effects of reduced nitrogen fertilizer rates on its fate in maize fields in mollisols in northeast China: A 15N tracing study. Agronomy 2022, 12, 3030. [Google Scholar] [CrossRef]
  15. van Grinsven, H.J.M.; Ebanyat, P.; Glendining, M.; Gu, B.; Hijbeek, R.; Lam, S.K.; Lassaletta, L.; Mueller, N.D.; Pacheco, F.S.; Quemada, M.; et al. Establishing long-term nitrogen response of global cereals to assess sustainable fertilizer rates. Nat. Food 2022, 3, 122–132. [Google Scholar] [CrossRef]
  16. Lessmann, M.; Ros, G.H.; Young, M.D.; de Vries, W. Global variation in soil carbon sequestration potential through improved cropland management. Glob. Change Biol. 2022, 28, 1162–1177. [Google Scholar] [CrossRef]
  17. Schmidt, H.P.; Kammann, C.; Hagemann, N.; Leifeld, J.; Bucheli, T.D.; Sánchez Monedero, M.A.; Cayuela, M.L. Biochar in agriculture—A systematic review of 26 global meta-analyses. GCB Bioenergy 2021, 13, 1708–1730. [Google Scholar] [CrossRef]
  18. Fernandez-Ortega, J.; Alvaro-Fuentes, J.; Delgado, A.; García-López, A.M.; Cantero-Martínez, C. Assessing management strategies for carbon storage in Mediterranean soils: Double-cropping, no-tillage, and nitrogen fertilization reduction. Soil Tillage Res. 2025, 249, 106496. [Google Scholar] [CrossRef]
  19. Kassam, A.; Friedrich, T.; Derpsch, R. Global spread of conservation agriculture. Int. J. Environ. Stud. 2018, 76, 29–51. [Google Scholar] [CrossRef]
  20. Roshanizarmehri, M.; Fotovat, A.; Emami, H.; Kehl, M.; Hirmas, D.R.; Hosseinalizadeh, M.; Ramezanian, N. Combined effects of polyacrylamide and nanomagnetite amendment on soil and water quality, Khorasan Razavi, Iran. J. Environ. Manag. 2018, 223, 703–712. [Google Scholar] [CrossRef] [PubMed]
  21. Wang, J.; Sha, Z.; Qin, Q.; Sun, L.; Sun, Y.-F.; Yang, S.; Xue, Y.; Cao, L. Soil aggregate-associated organic nitrogen pools, enzyme activities, and microbial community fertilized with food waste-derived organic fertilizer. Appl. Soil Ecol. 2024, 202, 105580. [Google Scholar] [CrossRef]
  22. Mustafa, A.; Minggang, X.; Shah, S.A.A.; Abrar, M.; Nan, S.; Baoren, W.; Zejiang, C.; Saeed, Q.; Naveed, M.; Mehmood, K.; et al. Soil aggregation and soil aggregate stability regulate organic carbon and nitrogen storage in a red soil of southern China. J. Environ. Manag. 2020, 270, 110894. [Google Scholar] [CrossRef]
  23. Ao, C.; Yang, P.; Zeng, W.; Chen, W.; Xu, Y.; Xu, H.; Zha, Y.; Wu, J.; Huang, J.-S. Impact of raindrop diameter and polyacrylamide application on runoff, soil and nitrogen loss via raindrop splashing. Geoderma 2019, 353, 372–381. [Google Scholar] [CrossRef]
  24. Tian, X.; Fan, H.; Wang, J.; Ippolito, J.; Li, Y.; Feng, S.; An, M.; Zhang, F.; Wang, K. Effect of polymer materials on soil structure and organic carbon under drip irrigation. Geoderma 2019, 340, 94–103. [Google Scholar] [CrossRef]
  25. Ding, X.; Li, G.; Zhao, X.; Lin, Q.; Wang, X. Biochar application significantly increases soil organic carbon under conservation tillage: An 11-year field experiment. Biochar 2023, 5, 28. [Google Scholar] [CrossRef]
  26. Mulualem, T.; Adgo, E.; Meshesha, D.; Tsunekawa, A.; Haregeweyn, N.; Tsubo, M.; Kebede, B.; Mamedov, A.; Masunaga, T.; Berihun, M. Examining the impact of polyacrylamide and other soil amendments on soil fertility and crop yield in contrasting agroecological environments. J. Soil Sci. Plant Nut. 2021, 21, 1817–1830. [Google Scholar] [CrossRef]
  27. Xu, C.; Wang, J.; Wu, D.; Li, C.; Wang, L.; Ji, C.; Zhang, Y.; Ai, Y. Optimizing organic amendment applications to enhance carbon sequestration and economic benefits in an infertile sandy soil. J. Environ. Manag. 2022, 303, 114129. [Google Scholar] [CrossRef]
  28. Dong, L.; Wang, J.; Shen, M.; Zhang, H.; Wang, L.; Li, C.; Lu, C. Biochar combined with nitrogen fertilizer affects soil properties and wheat yield in medium-low-yield farmland. Soil Use Manag. 2021, 38, 584–595. [Google Scholar] [CrossRef]
  29. Hennecke, D.; Bauer, A.; Herrchen, M.; Wischerhoff, E.; Gores, F. Cationic polyacrylamide copolymers (PAMs): Environmental half life determination in sludge-treated soil. Environ. Sci. Eur. 2018, 30, 16. [Google Scholar] [CrossRef]
  30. Caesar-TonThat, T.C.; Busscher, W.J.; Novak, J.M.; Gaskin, J.F.; Kim, Y. Effects of polyacrylamide and organic matter on microbes associated to soil aggregation of Norfolk loamy sand. Appl. Soil Ecol. 2008, 40, 240–249. [Google Scholar] [CrossRef]
  31. He, T.; Yuan, J.; Xiang, J.; Lin, Y.; Luo, J.; Lindsey, S.; Liao, X.; Liu, D.; Ding, W. Combined biochar and double inhibitor application offsets NH3 and N2O emissions and mitigates N leaching in paddy fields. Environ. Pollut. 2022, 292, 118344. [Google Scholar] [CrossRef]
  32. Shahbaz, M.; Kuzyakov, Y.; Heitkamp, F. Decrease of soil organic matter stabilization with increasing inputs: Mechanisms and controls. Geoderma 2016, 304, 76–82. [Google Scholar] [CrossRef]
  33. Walter, K.; Don, A.; Tiemeyer, B.; Freibauer, A. Determining soil bulk density for carbon stock calculations: A systematic method comparison. Soil Sci. Soc. Am. J. 2016, 80, 579–591. [Google Scholar] [CrossRef]
  34. Blair, G.; Lefroy, R.; Lisle, L. Soil carbon fractions based on their degree of oxidation, and the development of a carbon management index for agricultural systems. Eur. J. Agric. Res. 1995, 46, 393–406. [Google Scholar] [CrossRef]
  35. van Bavel, C.H.M. Mean weight-diameter of soil aggregates as a statistical index of aggregation. Soil Sci. Soc. Am. J. 1950, 14, 20–23. [Google Scholar] [CrossRef]
  36. Qi, J.Y.; Han, S.W.; Lin, B.J.; Xiao, X.P.; Jensen, J.L.; Munkholm, L.J.; Zhang, H.L. Improved soil structural stability under no-tillage is related to increased soil carbon in rice paddies: Evidence from literature review and field experiment. Environ. Technol. Innov. 2022, 26, 102248. [Google Scholar] [CrossRef]
  37. Camarotto, C.; Piccoli, I.; Dal Ferro, N.; Polese, R.; Chiarini, F.; Furlan, L.; Morari, F. Have we reached the turning point? Looking for evidence of SOC increase under conservation agriculture and cover crop practices. Eur. J. Soil Sci. 2020, 71, 1050–1063. [Google Scholar] [CrossRef]
  38. Yang, H.B.; Wang, G.S.; Wang, J.; Xiao, Q.; Li, Z.Y.; De Clerck, C.; Meersmans, J.; Colinet, G.; Zhang, W.J. No-tillage facilitates soil organic carbon sequestration by enhancing arbuscular mycorrhizal fungi-related soil proteins accumulation and aggregation. CATENA 2024, 245, 108323. [Google Scholar] [CrossRef]
  39. Kan, Z.-R.; Liu, Q.-Y.; Virk, A.L.; He, C.; Qi, J.-Y.; Dang, Y.P.; Zhao, X.; Zhang, H.-L. Effects of experiment duration on carbon mineralization and accumulation under no-till. Soil Tillage Res. 2021, 209, 104939. [Google Scholar] [CrossRef]
  40. Cai, A.D.; Han, T.F.; Ren, T.J.; Sanderman, J.; Rui, Y.C.; Wang, B.; Smith, P.; Xu, M.G.; Li, Y.E. Declines in soil carbon storage under no tillage can be alleviated in the long run. Geoderma 2022, 425, 116028. [Google Scholar] [CrossRef]
  41. Six, J.; Ogle, S.M.; Conant, R.T.; Mosier, A.R.; Paustian, K. The potential to mitigate global warming with no-tillage management is only realized when practised in the long term. Glob. Change Biol. 2004, 10, 155–160. [Google Scholar] [CrossRef]
  42. Wardak, D.L.R.; Padia, F.N.; de Heer, M.I.; Sturrock, C.J.; Mooney, S.J. Zero tillage has important consequences for soil pore architecture and hydraulic transport: A review. Geoderma 2022, 422, 115927. [Google Scholar] [CrossRef]
  43. Ma, L.; Wang, X.; Fang, Y.; Vancov, T.; Jin, X.; Gao, Q.; Dong, W.; Du, Z. No-tillage farming for two decades increases plant- and microbial-biomolecules in the topsoil rather than soil profile in temperate agroecosystem. Soil Tillage Res. 2024, 241, 106108. [Google Scholar] [CrossRef]
  44. Shoumik, B.A.A.; Khan, M.Z.; Błońska, E.; Lasota, J. Dynamics of soil organic carbon and total nitrogen in particulate and mineral-associated organic matter fractions under different continuous land use patterns across Europe. Agric. Ecosyst. Environ. 2025, 381, 109411. [Google Scholar] [CrossRef]
  45. Zhang, Q.; Du, Z.; Lou, Y.; He, X. A one-year short-term biochar application improved carbon accumulation in large macroaggregate fractions. CATENA 2015, 127, 26–31. [Google Scholar] [CrossRef]
  46. Yang, X.; Xie, Z.; Hu, Z.; Wen, G.; Li, S.; Ke, X.; Sun, X.; Tao, M.; Jiang, X. Effects of 3-year biochar application on carbon sequestration, nitrogen retention and nitrate leaching of fluvo-aquic soil profiles in vegetable rotation fields. Agric. Ecosyst. Environ. 2024, 367, 108989. [Google Scholar] [CrossRef]
  47. Bai, X.; Tang, J.; Lin, Q. Biochar affects soil properties over 1 m depth in an alkaline soil of north China Plain. J. Environ. Manag. 2024, 370, 123097. [Google Scholar] [CrossRef] [PubMed]
  48. Ventura, M.; Alberti, G.; Panzacchi, P.; Vedove, G.D.; Miglietta, F.; Tonon, G. Biochar mineralization and priming effect in a poplar short rotation coppice from a 3-year field experiment. Biol. Fert. Soils 2018, 55, 67–78. [Google Scholar] [CrossRef]
  49. Ji, D.; Ge, L.; Van Zwieten, L.; An, T.; Li, S.; Kuzyakov, Y.; Ding, F.; Wang, J. Contrasting effects of maize straw and its biochar on aggregation and soil organic matter stabilization. Plant Soil 2023, 495, 221–233. [Google Scholar] [CrossRef]
  50. Yuan, X.; Ban, G.; Luo, Y.; Wang, J.; Peng, D.; Liang, R.; He, T.; Wang, Z. Biochar effects on aggregation and carbon-nitrogen retention in different-sized aggregates of clay and loam soils: A meta-analysis. Soil Tillage Res. 2025, 247, 106365. [Google Scholar] [CrossRef]
  51. Burrell, L.D.; Zehetner, F.; Rampazzo, N.; Wimmer, B.; Soja, G. Long-term effects of biochar on soil physical properties. Geoderma 2016, 282, 96–102. [Google Scholar] [CrossRef]
  52. Albalasmeh, A.A.; Hamdan, E.H.; Gharaibeh, M.A.; Hanandeh, A.E. Improving aggregate stability and hydraulic properties of Sandy loam soil by applying polyacrylamide polymer. Soil Tillage Res. 2021, 206, 104821. [Google Scholar] [CrossRef]
  53. Kang, M.W.; Yibeltal, M.; Kim, Y.H.; Oh, S.J.; Lee, J.C.; Kwon, E.E.; Lee, S.S. Enhancement of soil physical properties and soil water retention with biochar-based soil amendments. Sci. Total Environ. 2022, 836, 155746. [Google Scholar] [CrossRef]
  54. Miller, W.P.; Willis, R.L.; Levy, G.J. Aggregate stabilization in kaolinitic soils by low rates of anionic polyacrylamide. Soil Use Manag. 2007, 14, 101–105. [Google Scholar] [CrossRef]
  55. Mamedov, A.I.; Beckmann, S.; Huang, C.; Levy, G.J. Aggregate stability as affected by polyacrylamide molecular weight, soil texture, and water quality. Soil Sci. Soc. Am. J. 2007, 71, 1909–1918. [Google Scholar] [CrossRef]
  56. Seybold, C.A. Polyacrylamide review: Soil conditioning and environmental fate. Commun. Soil Sci. Plant Anal. 2008, 25, 2171–2185. [Google Scholar] [CrossRef]
  57. Abulaiti, A.; She, D.; Liu, Z.; Sun, X.; Wang, H. Application of biochar and polyacrylamide to revitalize coastal saline soil quality to improve rice growth. Environ. Sci. Pollut. Res. 2022, 30, 18731–18747. [Google Scholar] [CrossRef] [PubMed]
  58. Fekadu, G.; Adgo, E.; Meshesha, D.; Tsunekawa, A.; Haregeweyn, N.; Peng, F.; Tsubo, M.; Mulualem, T.; Demissie, S.; Kebede, B.; et al. Effect of soil amendments on soil respiration in the midland agroecological environment, Ethiopia. Environ. Earth Sci. 2024, 83, 216. [Google Scholar] [CrossRef]
  59. Qiu, X.; Xu, C.; Yan, D.; Li, W.; Wang, J.; Yang, Z.; Yuan, J.; Ji, C.; Wang, J.; Zhang, Y. Diversified cropping combined with biochar application enhances soil fertility, biodiversity, and crop productivity in a coastal saline–alkali soil. Agriculture 2025, 15, 2492. [Google Scholar] [CrossRef]
  60. Fan, M.; Lu, S.; Jiang, R.; Liu, X.; Zeng, X.; Goulding, K.W.T.; Zhang, F. Nitrogen input, 15N balance and mineral N dynamics in a rice–wheat rotation in southwest China. Nutr. Cycl. Agroecosyst. 2007, 79, 255–265. [Google Scholar] [CrossRef]
  61. Zhou, M.; Zhu, B.; Brüggemann, N.; Dannenmann, M.; Wang, Y.; Butterbach-Bahl, K. Sustaining crop productivity while reducing environmental nitrogen losses in the subtropical wheat-maize cropping systems: A comprehensive case study of nitrogen cycling and balance. Agric. Ecosyst. Environ. 2016, 231, 1–14. [Google Scholar] [CrossRef]
  62. Liang, H.Y.; Shen, P.F.; Kong, X.Z.; Liao, Y.C.; Liu, Y.; Wen, X.X. Optimal nitrogen practice in winter wheat-summer maize rotation affecting the fates of 15N-labeled fertilizer. Agronomy 2020, 10, 521. [Google Scholar] [CrossRef]
  63. Zhou, X.; Du, C.; Li, H.; Sun, Z.; Chen, Y.; Gao, Z.; Zhao, Z.; Zhang, Y.; Wang, Z.; Liu, Y. Optimization of inter-seasonal nitrogen allocation increases yield and resource-use efficiency in a water-limited wheat–maize cropping system in the North China Plain. Crop J. 2024, 12, 907–914. [Google Scholar] [CrossRef]
  64. Zhang, L.; Jing, Y.; Chen, C.; Xiang, Y.; Rashti, M.R.; Li, Y.; Deng, Q.; Zhang, R. Effects of biochar application on soil nitrogen transformation, microbial functional genes, enzyme activity, and plant nitrogen uptake: A meta-analysis of field studies. GCB Bioenergy 2021, 13, 1859–1873. [Google Scholar] [CrossRef]
  65. Sun, Q.; Meng, J.; Lan, Y.; Shi, G.; Yang, X.; Cao, D.; Chen, W.; Han, X. Long-term effects of biochar amendment on soil aggregate stability and biological binding agents in brown earth. CATENA 2021, 205, 105460. [Google Scholar] [CrossRef]
  66. Gao, Y.; Fang, Z.; Van Zwieten, L.; Bolan, N.; Dong, D.; Quin, B.; Meng, J.; Li, F.; Wu, F.; Wang, H.; et al. A critical review of biochar-based nitrogen fertilizers and their effects on crop production and the environment. Biochar 2022, 4, 36. [Google Scholar] [CrossRef]
  67. Zhang, J.; Zhang, L.; Qiu, S. Biochar amendment benefits 15N fertilizer retention and rhizosphere N enrichment in a maize-soil system. Geoderma 2022, 412, 115713. [Google Scholar] [CrossRef]
  68. Samson, V.M.; Yang, X.; Li, Z.; Yu, Y.; Tu, W.; Mao, Y. Mechanistic insights into enhanced nitrogen retention and microbial nitrogen cycling in soil–plant systems mediated by hydrogen peroxide-modified biochar. Geoderma 2025, 464, 117614. [Google Scholar] [CrossRef]
  69. Wang, Z.; Wang, Z.; Luo, Y.; Zhan, Y.-N.; Meng, Y.-L.; Zhou, Z.-G. Biochar increases 15N fertilizer retention and indigenous soil N uptake in a cotton-barley rotation system. Geoderma 2020, 357, 113944. [Google Scholar] [CrossRef]
  70. Yang, K.; Tang, Z.; Feng, J. Coal fly ash and polyacrylamide influence transport and redistribution of soil nitrogen in a sandy sloping land. Agriculture 2021, 11, 47. [Google Scholar] [CrossRef]
  71. Li, S.; Xu, H.; Ao, C. Polyacrylamide and rill flow rate effects on erosion and ammonium nitrogen losses. Water Air Soil Pollut. 2019, 230, 11. [Google Scholar] [CrossRef]
  72. Wu, Y.; Li, F.; Zheng, H.; Hong, M.; Hu, Y.; Zhao, B.; De, H. Effects of three types of soil amendments on yield and soil nitrogen balance of maize-wheat rotation system in the Hetao Irrigation Area, China. J. Arid Land 2019, 11, 904–915. [Google Scholar] [CrossRef]
  73. Wen, L.; Peng, Y.; Lin, Y.; Zhou, Y.; Cai, G.; Li, B.; Chen, B. Conservation tillage increases nutrient accumulation by promoting soil enzyme activity: A meta-analysis. Plant Soil 2024, 508, 531–546. [Google Scholar] [CrossRef]
  74. Kader, M.; Jahangir, M.; Islam, M.; Begum, R.; Nasreen, S.; Islam, M.; Mahmud, A.; Haque, M.; Bell, R.; Jahiruddin, M. Long-term conservation agriculture increases nitrogen use efficiency by crops, land equivalent ratio and soil carbon stock in a subtropical rice-based cropping system. Field Crops Res. 2022, 287, 108636. [Google Scholar] [CrossRef]
  75. Shi, X.; Liu, X.; Jing, J.; Zhang, Y.; Li, P.; Zong, Y.; Zhang, D.; Hao, X. Long-term no tillage straw mulching increased soil water and nitrogen storage in dryland wheat on the Loess Plateau, but may increase dissolved organic nitrogen leaching. Field Crops Res. 2025, 322, 109705. [Google Scholar] [CrossRef]
  76. Maher, H.; Moussadek, R.; Zouahri, A.; Douaik, A.; Amenzou, N.E.; Benmansour, M.; Iaaich, H.; Dakak, H.; Mouridi, Z.E.; Bellaouchou, A.; et al. Nitrogen use efficiency using the 15N dilution technique for wheat yield under conservation agriculture and nitrogen fertilizer. Nitrogen 2023, 4, 369–381. [Google Scholar] [CrossRef]
  77. Quan, Z.; Zhang, X.; Fang, Y. The undefined N source might be overestimated by 15N tracer trials. Glob. Change Biol. 2020, 27, 467–468. [Google Scholar] [CrossRef]
  78. Bramble, S.E.; Ulrich, S.; Schoning, I.; Mikutta, R.; Brandt, L.; Poll, C.; Kandeler, E.; Mikutta, C.; Konrad, A.; Siemens, J.; et al. Formation of mineral-associated organic matter in temperate soils is primarily controlled by mineral type and modified by land use and management intensity. Glob. Change Biol. 2023, 30, e17024. [Google Scholar] [CrossRef]
  79. Elrys, A.S.; Uwiragiye, Y.; Zhang, Y.; Abdel-Fattah, M.K.; Chen, Z.-X.; Zhang, H.-M.; Meng, L.; Wang, J.; Zhu, T.-B.; Cheng, Y.; et al. Expanding agroforestry can increase nitrate retention and mitigate the global impact of a leaky nitrogen cycle in croplands. Nat. Food 2023, 4, 109–121. [Google Scholar] [CrossRef] [PubMed]
  80. Xu, C.; Yang, Z.; Wang, J.; Bol, R.; Li, W.; Ji, C.; Yuan, J.; Wang, L.; Liang, D.; Zhu, H.; et al. Fertilizer-N recovery links to SOC stabilization and fractionation in straw-mulched soil: Insights from 15N-tracing and 13C natural abundance. J. Integr. Agric. 2025; in press. [CrossRef]
  81. Devêvre, O.C.; Horwáth, W.R. Stabilization of fertilizer nitrogen-15 into humic substances in aerobic vs. waterlogged soil following straw incorporation. Soil Sci. Soc. Am. J. 2001, 65, 499–510. [Google Scholar] [CrossRef]
  82. Tang, Q.; Li, Q.; Wang, X.; Huang, Y.; Daniell, T.J.; Wu, E.; Wang, J.; Zhang, F.; Li, Z.; Chang, S.X.; et al. Building soil organic matter differing in physical fractions for fertilizer nitrogen retention. Soil Biol. Biochem. 2026, 217, 110136. [Google Scholar] [CrossRef]
  83. Martínez-Mena, M.; Carrillo-López, E.; Boix-Fayos, C.; Almagro, M.; Franco, N.; Díaz-Pereira, E.; Montoya, I.; Vente, J. Long-term effectiveness of sustainable land management practices to control runoff, soil erosion, and nutrient loss and the role of rainfall intensity in Mediterranean rainfed agroecosystems. CATENA 2020, 187, 104352. [Google Scholar] [CrossRef]
  84. Yan, L.; Xue, L.; Petropoulos, E.; Qian, C.; Hou, P.; Xu, D.-F.; Yang, L.-Z. Nutrient loss by runoff from rice-wheat rotation during the wheat season is dictated by rainfall duration. Environ. Pollut. 2021, 285, 117382. [Google Scholar] [CrossRef] [PubMed]
  85. Kan, Z.-R.; Liu, W.-X.; Liu, W.-S.; Lal, R.; Dang, Y.P.; Zhao, X.; Zhang, H.-L. Mechanisms of soil organic carbon stability and its response to no-till: A global synthesis and perspective. Glob. Change Biol. 2022, 28, 693–710. [Google Scholar] [CrossRef]
  86. de Goede, S.P.C.; Hannula, S.E.; Jansen, B.; Morrien, E. Fungal-mediated soil aggregation as a mechanism for carbon stabilization. ISME J. 2025, 19, wraf074. [Google Scholar] [CrossRef] [PubMed]
  87. Takeda, N.; Friedl, J.; Kirkby, R.; Rowlings, D.; De Rosa, D.; Scheer, C.; Grace, P. Interaction between soil and fertiliser nitrogen drives plant nitrogen uptake and nitrous oxide (N2O) emissions in tropical sugarcane systems. Plant Soil 2022, 477, 647–663. [Google Scholar] [CrossRef]
  88. Yan, M.; Pan, G.; Lavallee, J.M.; Conant, R.T. Rethinking sources of nitrogen to cereal crops. Glob. Change Biol. 2020, 26, 191–199. [Google Scholar] [CrossRef]
  89. Wang, J.; Duan, Y.; Li, G.; Zhang, L.; Li, D.; Liu, K.; Cui, X.A.; Zhou, B.; Gao, H.; Han, X.; et al. Response of soil gross nitrogen mineralization to fertilization practices in China’s uplands. J. Clean. Prod. 2024, 480, 144123. [Google Scholar] [CrossRef]
  90. Lu, C.; Chen, H.; Teng, Z.; Yuan, L.; Ma, J.; He, H.; Chen, X.; Zhang, X.; Shi, Y. Effects of N fertilization and maize straw on the dynamics of soil organic N and amino acid N derived from fertilizer N as indicated by 15N labeling. Geoderma 2018, 321, 118–126. [Google Scholar] [CrossRef]
Figure 1. (a,b) Soil organic carbon (SOC) content and its lability in soil profiles, and (c,d) SOC stocks partitioned into labile organic carbon (LOC) and non-labile organic carbon (NLOC) fractions in (a,c) wheat and (b,d) maize seasons. Different uppercase and lowercase letters in (a,b) indicate significant differences in SOC content and SOC lability among treatments within the same tillage regime, respectively (p < 0.05). Different uppercase and lowercase letters in (c,d) indicate significant differences in cumulative SOC stock and its fractions among treatments within the same tillage regime, respectively (p < 0.05). Error bars represent standard errors. ns denotes no significant difference. CK, without amendments’ application; PAM, application of polyacrylamide; BC, application of biochar; PMC, combined application of polyacrylamide and biochar; RT, rotary tillage; CT, conservation tillage.
Agriculture 16 01171 g001
Figure 2. (a,b) Soil aggregate size distribution, (c,d) aggregate-associated soil organic carbon (SOC) distribution, and (e,f) mean weight diameter (MWD) of aggregates in the (a,c,e) wheat and (b,d,f) maize seasons. Different letters indicate significant differences among treatments within the same tillage regime and aggregate size fraction (p < 0.05). ns denotes no significant difference. CK, without amendments’ application; PAM, application of polyacrylamide; BC, application of biochar; PMC, combined application of polyacrylamide and biochar; RT, rotary tillage; CT, conservation tillage.
Agriculture 16 01171 g002
Figure 3. Total fertilizer-N recovery partitioned into crop- and soil-recovered portions in the (a) wheat and (b) maize seasons. Different uppercase and lowercase letters indicate significant differences in total fertilizer-N recovery and in crop- or soil-recovered fertilizer-N within the same portion and tillage regime, respectively (p < 0.05). Error bars represent standard errors. ns denotes no significant difference. CK, without amendments’ application; PAM, application of polyacrylamide; BC, application of biochar; PMC, combined application of polyacrylamide and biochar; RT, rotary tillage; CT, conservation tillage.
Agriculture 16 01171 g003
Figure 4. (a,b) Fertilizer-N recovery and (c,d) the distribution of fertilizer-N across soil layers during the (a,c) wheat and (b,d) maize seasons. Different letters indicate significant differences among treatments within the same soil layer and tillage regime (p < 0.05). Error bars represent standard errors. * Indicates significance at p < 0.05. ns denotes no significant difference. CK, without amendments’ application; PAM, application of polyacrylamide; BC, application of biochar; PMC, combined application of polyacrylamide and biochar; RT, rotary tillage; CT, conservation tillage.
Agriculture 16 01171 g004
Figure 5. (a,b) Fertilizer-N recovery in crop partitioned into straw and grain portions, (c,d) native soil-N uptake in crop, and (e,f) crop yield in the (a) wheat and (b) maize seasons. Different letters indicate significant differences within the same portion and tillage regime (p < 0.05). Error bars represent standard errors. * Indicates significance at p < 0.05. ns denotes no significant difference. CK, without amendments’ application; PAM, application of polyacrylamide; BC, application of biochar; PMC, combined application of polyacrylamide and biochar; RT, rotary tillage; CT, conservation tillage.
Agriculture 16 01171 g005
Figure 6. Pearson correlation and Mantel test results illustrating the relationships among management practices, soil parameters, and fertilizer-N recovery in the (a) wheat and (b) maize seasons. PAM, polyacrylamide; MWD, mean weight diameter of soil aggregates; SOC, soil organic carbon content; LOC, soil labile organic carbon content; NLOC, soil non-labile organic carbon content; TN, soil total nitrogen content.
Agriculture 16 01171 g006
Figure 7. (a,b) Structural equation modeling (SEM) results showing the path model of the effects of conservation tillage (CT), polyacrylamide (PAM), and biochar (BC) on the mean weight diameter of aggregates (MWD), soil organic carbon (SOC) stock and its lability, fertilizer-N recovered in crop and soil, and crop yield, and (c,d) the standardized total effects of these parameters on total fertilizer-N recovery during the (a,c) wheat and (b,d) maize seasons. The significance of paths in SEM may differ from that of main effects in ANOVA. This is because ANOVA tests the uncontrolled main effect, whereas SEM estimates the pure direct effect after statistically controlling for confounding covariates.
Agriculture 16 01171 g007
Table 1. Results of two-way ANOVA for various parameters, as affected by tillage regimes (rotary tillage and conservation tillage) and amendments (polyacrylamide and biochar applications).
Parameter 1Cropping SeasonANOVA F-Value 2
TillageAmendmentTillage × Amendment
SOC stockWheat1.31621.71 ***0.898
Maize0.0623.2 ***0.144
LOC stockWheat10.3074.301 *3.76 *
Maize5.8519.763 **14.849 ***
NLOC stockWheat0.1414.272 ***0.843
Maize1.5421.884 ***1.694
SOC labilityWheat1.7495.499 *2.491
Maize3.78914.977 ***5.781 *
MWD of aggregateWheat0.0042.3461.624
Maize0.42810.6 **0.718
Total fertilizer-N recoveryWheat026.728 ***7.182 **
Maize1.3974.482 *4.009 *
Crop-recovered fertilizer-NWheat74.837 *11.134 ***1.586
Maize54.906 *16.338 ***2.168
Soil-recovered fertilizer-NWheat15.8262.1911.156
Maize19.146 *1.0426.063 **
Native soil-N uptake in cropWheat5.5294.323 *0.388
Maize77.19 *20.793 ***0.184
Crop yieldWheat1.2497.983 **4.132 *
Maize19.056 *1.1480.371
1 SOC, soil organic carbon content; LOC, soil labile organic carbon content; NLOC, soil non-labile organic carbon content; MWD, mean weight diameter of soil aggregates. 2 *, **, and *** indicate significance at p < 0.05, p < 0.01, and p < 0.001, respectively.
Table 2. Aggregate-associated soil organic carbon (SOC) content (g kg−1) under different treatments and aggregate size classes.
TillageAmendment 1Wheat SeasonMaize Season
>2 mm0.25–2 mm0.053–0.25 mm<0.053 mm>2 mm0.25–2 mm0.053–0.25 mm<0.053 mm
RT_CK13.01 ± 0.14 b 211.63 ± 0.31 b9.54 ± 0.21 ab8.34 ± 0.14 a14.18 ± 0.23 b12.64 ± 0.24 a9.31 ± 0.24 a8.42 ± 0.23 ab
PAM12.28 ± 0.44 b13.67 ± 0.90 ab8.99 ± 0.10 b7.50 ± 0.44 a12.67 ± 0.51 c13.17 ± 1.08 a9.24 ± 0.25 b7.51 ± 0.51 b
BC20.16 ± 3.93 a15.66 ± 1.73 a10.63 ± 0.52 a8.32 ± 3.93 a16.59 ± 0.41 a14.18 ± 0.64 a11.06 ± 0.42 a9.24 ± 0.41 ab
PMC19.66 ± 0.70 a16.27 ± 0.49 a10.68 ± 0.17 a8.87 ± 0.70 a16.39 ± 0.12 a12.81 ± 0.71 a9.32 ± 0.28 b9.99 ± 0.12 a
CT_CK15.54 ± 2.75 a13.28 ± 1.19 a11.15 ± 0.25 ab8.19 ± 2.75 b13.07 ± 0.63 c13.96 ± 0.62 ab9.64 ± 0.29 b9.20 ± 0.63 ab
PAM14.53 ± 1.19 a15.26 ± 0.43 a9.95 ± 0.38 b8.45 ± 1.19 b13.30 ± 0.42 c12.29 ± 0.62 b10.10 ± 0.18 b7.84 ± 0.42 b
BC19.96 ± 0.46 a15.67 ± 0.60 a10.05 ± 0.42 b7.28 ± 0.46 b15.45 ± 0.27 b13.85 ± 0.44 b11.80 ± 0.33 a9.69 ± 0.27 a
PMC19.45 ± 0.67 a15.87 ± 0.72 a11.79 ± 0.89 a10.52 ± 0.67 a17.63 ± 0.33 a15.95 ± 0.25 a10.22 ± 0.24 b10.69 ± 0.33 a
ANOVA 3
Tillagensns**nsnsnsnsns
Amendment********ns****
Tillage × amendment nsnsnsns**nsns
1 CK, without amendments’ application; PAM, application of polyacrylamide; BC, application of biochar; PMC, combined application of polyacrylamide and biochar; RT, rotary tillage; CT, conservation tillage. 2 Values are means ± standard error. Different letters indicate significant differences among treatments within the same tillage regime and aggregate size class. 3 *, **, and *** indicate significance at p < 0.05, p < 0.01, and p < 0.001, respectively. ns denotes no significant difference.
Disclaimer/Publisher’s Note: The statements, opinions and data contained in all publications are solely those of the individual author(s) and contributor(s) and not of MDPI and/or the editor(s). MDPI and/or the editor(s) disclaim responsibility for any injury to people or property resulting from any ideas, methods, instructions or products referred to in the content.