Article

Economic Resilience and Pesticide Use Practices Among GAP Certified and Non-Certified Mango Farmers in Northern Thailand

1
College of International Relations, Ritsumeikan University, Kyoto 603-8577, Japan
2
School of Health Sciences Research, Research Institute for Health Sciences, Chiang Mai University, Chiang Mai 50200, Thailand
3
Environmental, Occupational Health Sciences and Non-Communicable Diseases Center of Excellence, Research Institute for Health Sciences, Chiang Mai University, Chiang Mai 50200, Thailand
4
Faculty of Agriculture, Kasetsart University, Bangkok 20900, Thailand
5
Office of the University, Chiang Mai University, Chiang Mai 50200, Thailand
*
Authors to whom correspondence should be addressed.
Agriculture 2026, 16(11), 1167; https://doi.org/10.3390/agriculture16111167 (registering DOI)
Submission received: 1 May 2026 / Revised: 20 May 2026 / Accepted: 21 May 2026 / Published: 26 May 2026
(This article belongs to the Section Agricultural Economics, Policies and Rural Management)

Abstract

This multi-level study investigates the economic resilience of mango farmers during the COVID-19 pandemic and their pesticide management practices under Thailand’s Q-GAP (Quality Good Agricultural Practices) certification standard. Field surveys compared the economic outcomes of 104 certified and 151 non-certified farmers from 2019 to 2023, together with pesticide use practices during the year preceding the 2024 survey. The sample was drawn from three provinces in northern Thailand: Phitsanulok, Phetchabun, and Phichit. The statistical analysis of the collected information produced several key findings. Certified farms achieved significantly higher production and sales than non-certified farms over the five-year period, mainly due to larger farm size and higher prices obtained from premium export market sales. Certified farmers also adopted a wider range of coping strategies during the pandemic, whereas non-certified farmers mainly reduced mango investments related to mango cultivation. Certified farmers reported significantly higher rates of insecticide and fungicide adoption, as well as significantly higher annual pesticide application frequencies across all three pesticide categories. Residue analysis showed no significant difference in organophosphate (OP) residues between the two groups; however, pyrethroid (PY) residues were significantly higher among certified farms. This pattern suggests that certified farmers may apply pesticides more intensively to satisfy the aesthetic requirements of premium export markets. Regression results further showed that herbicide application frequency was the only factor marginally associated with PY-type residue levels among certified farmers, although this finding should be interpreted cautiously because of the weak model fit.

1. Introduction

Often referred to as the “king of fruits,” mango (Mangifera indica Linn.) has been cultivated in Thailand for centuries and plays a sizeable role in the country’s agricultural economy [1]. Thailand is among the world’s leading mango producers, alongside India, China, Indonesia, and Pakistan [2]. Areas of production are stretched across diverse regions, with harvesting patterns shifting geographically from central to northern and southern areas [3]. Commercial production is concentrated in about ten varieties out of more than 170 identified cultivars [1], with ‘Nam Dok Mai’ dominating premium export markets such as Japan and Korea under Good Agricultural Practices (GAP) and phytosanitary requirements. By contrast, non-certified farmers mainly supply domestic markets and, to a lesser extent, foreign markets where GAP certification is not required. This dual structure reflects divergences in market access and price opportunities, and farming practices such as pesticide management, which may in turn influence farmers’ economic resilience under market disruptions.
The COVID-19 pandemic posed an unprecedented challenge in recent history to agricultural producers worldwide, as labor shortages, transport disruptions, and fluctuations in demand adversely affected production and livelihoods [4]. In Thailand, the effects on fruit farmers were not uniform. Export-oriented GAP-certified farmers, for instance, faced a set of risks related to international logistics and market volatility. When the pandemic sharply reduced international flights, shipping space became scarce and many exports were pushed to rely on sea freight instead. This shift prolonged lead times and heightened the likelihood of price deterioration upon arrival—a critical condition for fresh fruits whose market value depends on timely delivery and maintained quality. Even after flight availability recovered, shipping costs remained high, and some exporters responded by renegotiating purchase prices with farmers. These developments exposed farmers to the dual risks of uncertainty in market access and deteriorating profit margins, highlighting the vulnerability of export-oriented fruit production.
Meanwhile, non-certified farmers tend to focus on supplying domestic markets. Accordingly, stagnant tourism demand and the slowdown of the restaurant industry caused disruptions in their access to conventional outlets. Competition among seasonal fruits also intensified, reducing the stability of farm profitability. In response, many non-certified farmers sought alternative marketing channels, such as local markets or home delivery.
In many tropical countries, export-oriented horticultural commodities account for a sizeable share of the agribusiness sector. In particular, major fruits such as mango are closely linked to international market demand. However, systematic research comparing the impacts of the COVID pandemic on GAP-certified and non-certified farmers, and how they coped with them, remains limited.
Aside from the issues related to the pandemic, a challenge persists regarding the credibility of safety associated with pesticide use in Thai mango production. For instance, in Japan—a premium market for Thai mango—cases exceeding maximum residue limits (MRLs) have occasionally been identified through regular monitoring, raising concerns among regulators, importers, and consumers.
Q-GAP, Thailand’s national public GAP certification scheme, was originally developed with reference to the Codex Alimentarius and subsequently harmonized with ASEAN G.A.P. as regional standards evolved. It aims to promote safer and more sustainable agricultural practices through farmer training, regular audits, and technical assistance. There has been a growing literature assessing the adoption and marketing implications of national public GAP standards in ASEAN nations [5,6,7,8,9,10,11,12,13,14,15,16,17,18]. Yet the empirical literature assessing the effectiveness of public GAP standards in reducing pesticide use has been limited, with mixed results.
For example, a study on Malaysia’s MyGAP certification for durian production found significantly lower pesticide use among certified farmers [19]. Similarly, a study on Vietnam’s VietGAP reported significantly fewer pesticide-related health problems among certified farmers compared with their non-certified counterparts [20].
Studies on Thailand’s Q-GAP focusing on domestically oriented crops such as cabbage and chili pepper, as well as durians destined for non-premium export markets, have shown that while certification can significantly improve farmers’ knowledge and farming practices, the actual quantities of pesticides used and the levels of pesticide residues detected vary across cases [21,22,23]. These variations are significantly influenced by regional contexts, crop characteristics, and the quality of extension services.
Against this backdrop, this study has two main objectives.
First, it aims to examine the economic impacts of COVID-19 on mango farmers in Thailand. It compares the adaptation strategies employed by GAP-certified farmers selling to premium markets such as Japan and Korea with those of non-certified farmers who mainly sell at domestic markets. The analysis identifies significant differences in the experiences of certified and non-certified farmers, as well as shifts in the relative economic performance of larger and smaller farms within each group over the pandemic period. This analytical approach provides valuable insights into the economic resilience of farmers with differing attributes under the pandemic shocks.
This study intentionally focuses on export-oriented GAP-certified mango farmers supplying premium overseas markets such as Japan and Korea, rather than attempting to construct a statistically representative sample of all certified mango farmers in Thailand. This focus was adopted for two main reasons. First, previous studies on GAP-certified farmers in Thailand mainly examined farmers supplying domestic markets [19,21,22]. By focusing on export-oriented certified farmers linked to premium overseas supply chains, the study aimed to explore the internal diversity and heterogeneity that exist within the certified farmer sector itself. Second, because the COVID-19 pandemic generated severe disruptions in international logistics, airfreight transport, and export-market access, export-oriented certified farmers were expected to experience some of the most direct and intense economic impacts of the pandemic within the horticultural sector.
In this study, the term ‘economic resilience’ is used in a limited empirical sense to refer to farmers’ economic coping and adaptive capacity under prolonged COVID-19-related disruptions, particularly regarding the maintenance of production, sales activities, export participation, and livelihood-related farming activities. These indicators were selected because they directly reflect farmers’ capacity to maintain economic continuity and adapt marketing and livelihood strategies under prolonged crisis conditions. In particular, differences in market access and marketing channels are important because diversified sales opportunities and marketing flexibility may provide buffering capacity against market disruptions. The study therefore does not attempt to measure resilience as a comprehensive multidimensional social-ecological transformation framework involving various dimensions such as resistance, recovery, adaptation, and transformation, but rather as a more limited empirical concept related to economic continuity and adaptive responses during crisis conditions.
Second, the study seeks to compare GAP-certified and non-certified farmers in terms of their annual patterns of pesticide use and pesticide residue levels. This involves identifying the frequency of pesticide spraying and conducting laboratory tests on mango samples for pesticide residues. By integrating survey data with residue testing results, the study assesses the extent to which Q-GAP certification contributes to improved pesticide management and food safety assurance, while identifying factors influencing the occurrence of pesticide residues.
It is worth noting that these two analyses are closely interconnected. Farmers’ resilience to external shocks such as COVID-19 cannot be understood independently of their market orientation and compliance with institutional standards like GAP. GAP-certified farmers not only gain better income opportunities through access to premium markets but are also compelled to bear additional liabilities and risks, including those associated with logistics, pesticide use, and other costs related to accessing foreign markets. In contrast, non-certified farmers lack access to premium markets and are often more vulnerable to domestic market fluctuations, although the official requirements for their farming practices are minimal.
Rather than proposing a unified causal mechanism linking market shocks and pesticide residues, the study comparatively examines two interconnected dimensions of sustainability challenges faced by mango farmers under COVID-19 and GAP-related production system. By examining farmers’ economic coping capacity under prolonged market disruptions and pesticide management and residue-related ecological concerns, this study highlights important issues related to economic resilience and pesticide-related ecological concerns in mango farming.
The finding raises the possibility that the economic advantages and adaptation patterns observed among export-oriented GAP-certified farmers during the COVID-19 disruptions may not be independent from the ecological pressures associated with pesticide management practices. Rather, both outcomes appear to be linked to the same export-oriented production structure, in which integration into premium overseas markets simultaneously creates economic advantages and stronger quality-control pressures related to pesticide use and food safety management. In this sense, the study explores whether Q-GAP certification may operate not only as a food safety and export governance mechanism, but also as an institutional arrangement shaping both the economic opportunities and ecological pressures associated with premium export-oriented agriculture.
This paper is structured as follows. Section 2 outlines the materials and methods, including the field survey, pesticide residue analysis, and statistical procedures. Section 3 presents the results, while Section 4 provides the discussion and conclusions.

2. Materials and Methods

2.1. Sampling Procedures

The Q-GAP-certified farmers supplying mangoes for export markets were identified through two exporter companies that we had interviewed during the exporter survey in August 2023. Based in Central Thailand, both companies export mangoes—mainly the Nam Dok Mai variety—to high-value markets such as Japan and Korea. However, the company managers were unaware of the exact number of mango farmers under contract.
Since the certified farmers were identified through the two export companies sup-plying premium overseas markets, the sample should be understood as a purposive sam-ple of export-oriented Q-GAP-certified mango farmers rather than a statistically repre-sentative sample of all Q-GAP-certified mango farmers in Thailand. This focus on Q-GAP-certified farmers supplying premium export markets was intentional, as previous studies comparing Q-GAP-certified and non-certified farms in terms of economic outcomes, pesticide use practices, and residue levels focused primarily on certified farms supplying domestic markets. Additionally, given the severe logistical disruptions in airfreight delivery within the horticultural export sector during the COVID-19 pandemic, farms linked to premium export supply chains represented a particularly important target for investigation. However, because other exporters serving premium markets were not included in the study, some degree of sampling bias and limited external generalizability remains possible.
As part of the preparation for the main survey, two authors conducted preliminary field research in mid-February 2024 in Phichit and Phitsanulok provinces, interviewing managers of three local mango producer groups supplying these exporters. This fieldwork helped refine and develop the survey questionnaires. Following the preliminary research, and taking into account budget constraints for fieldwork and pesticide residue analyses, we determined that the total farm sample size should be approximately 250.
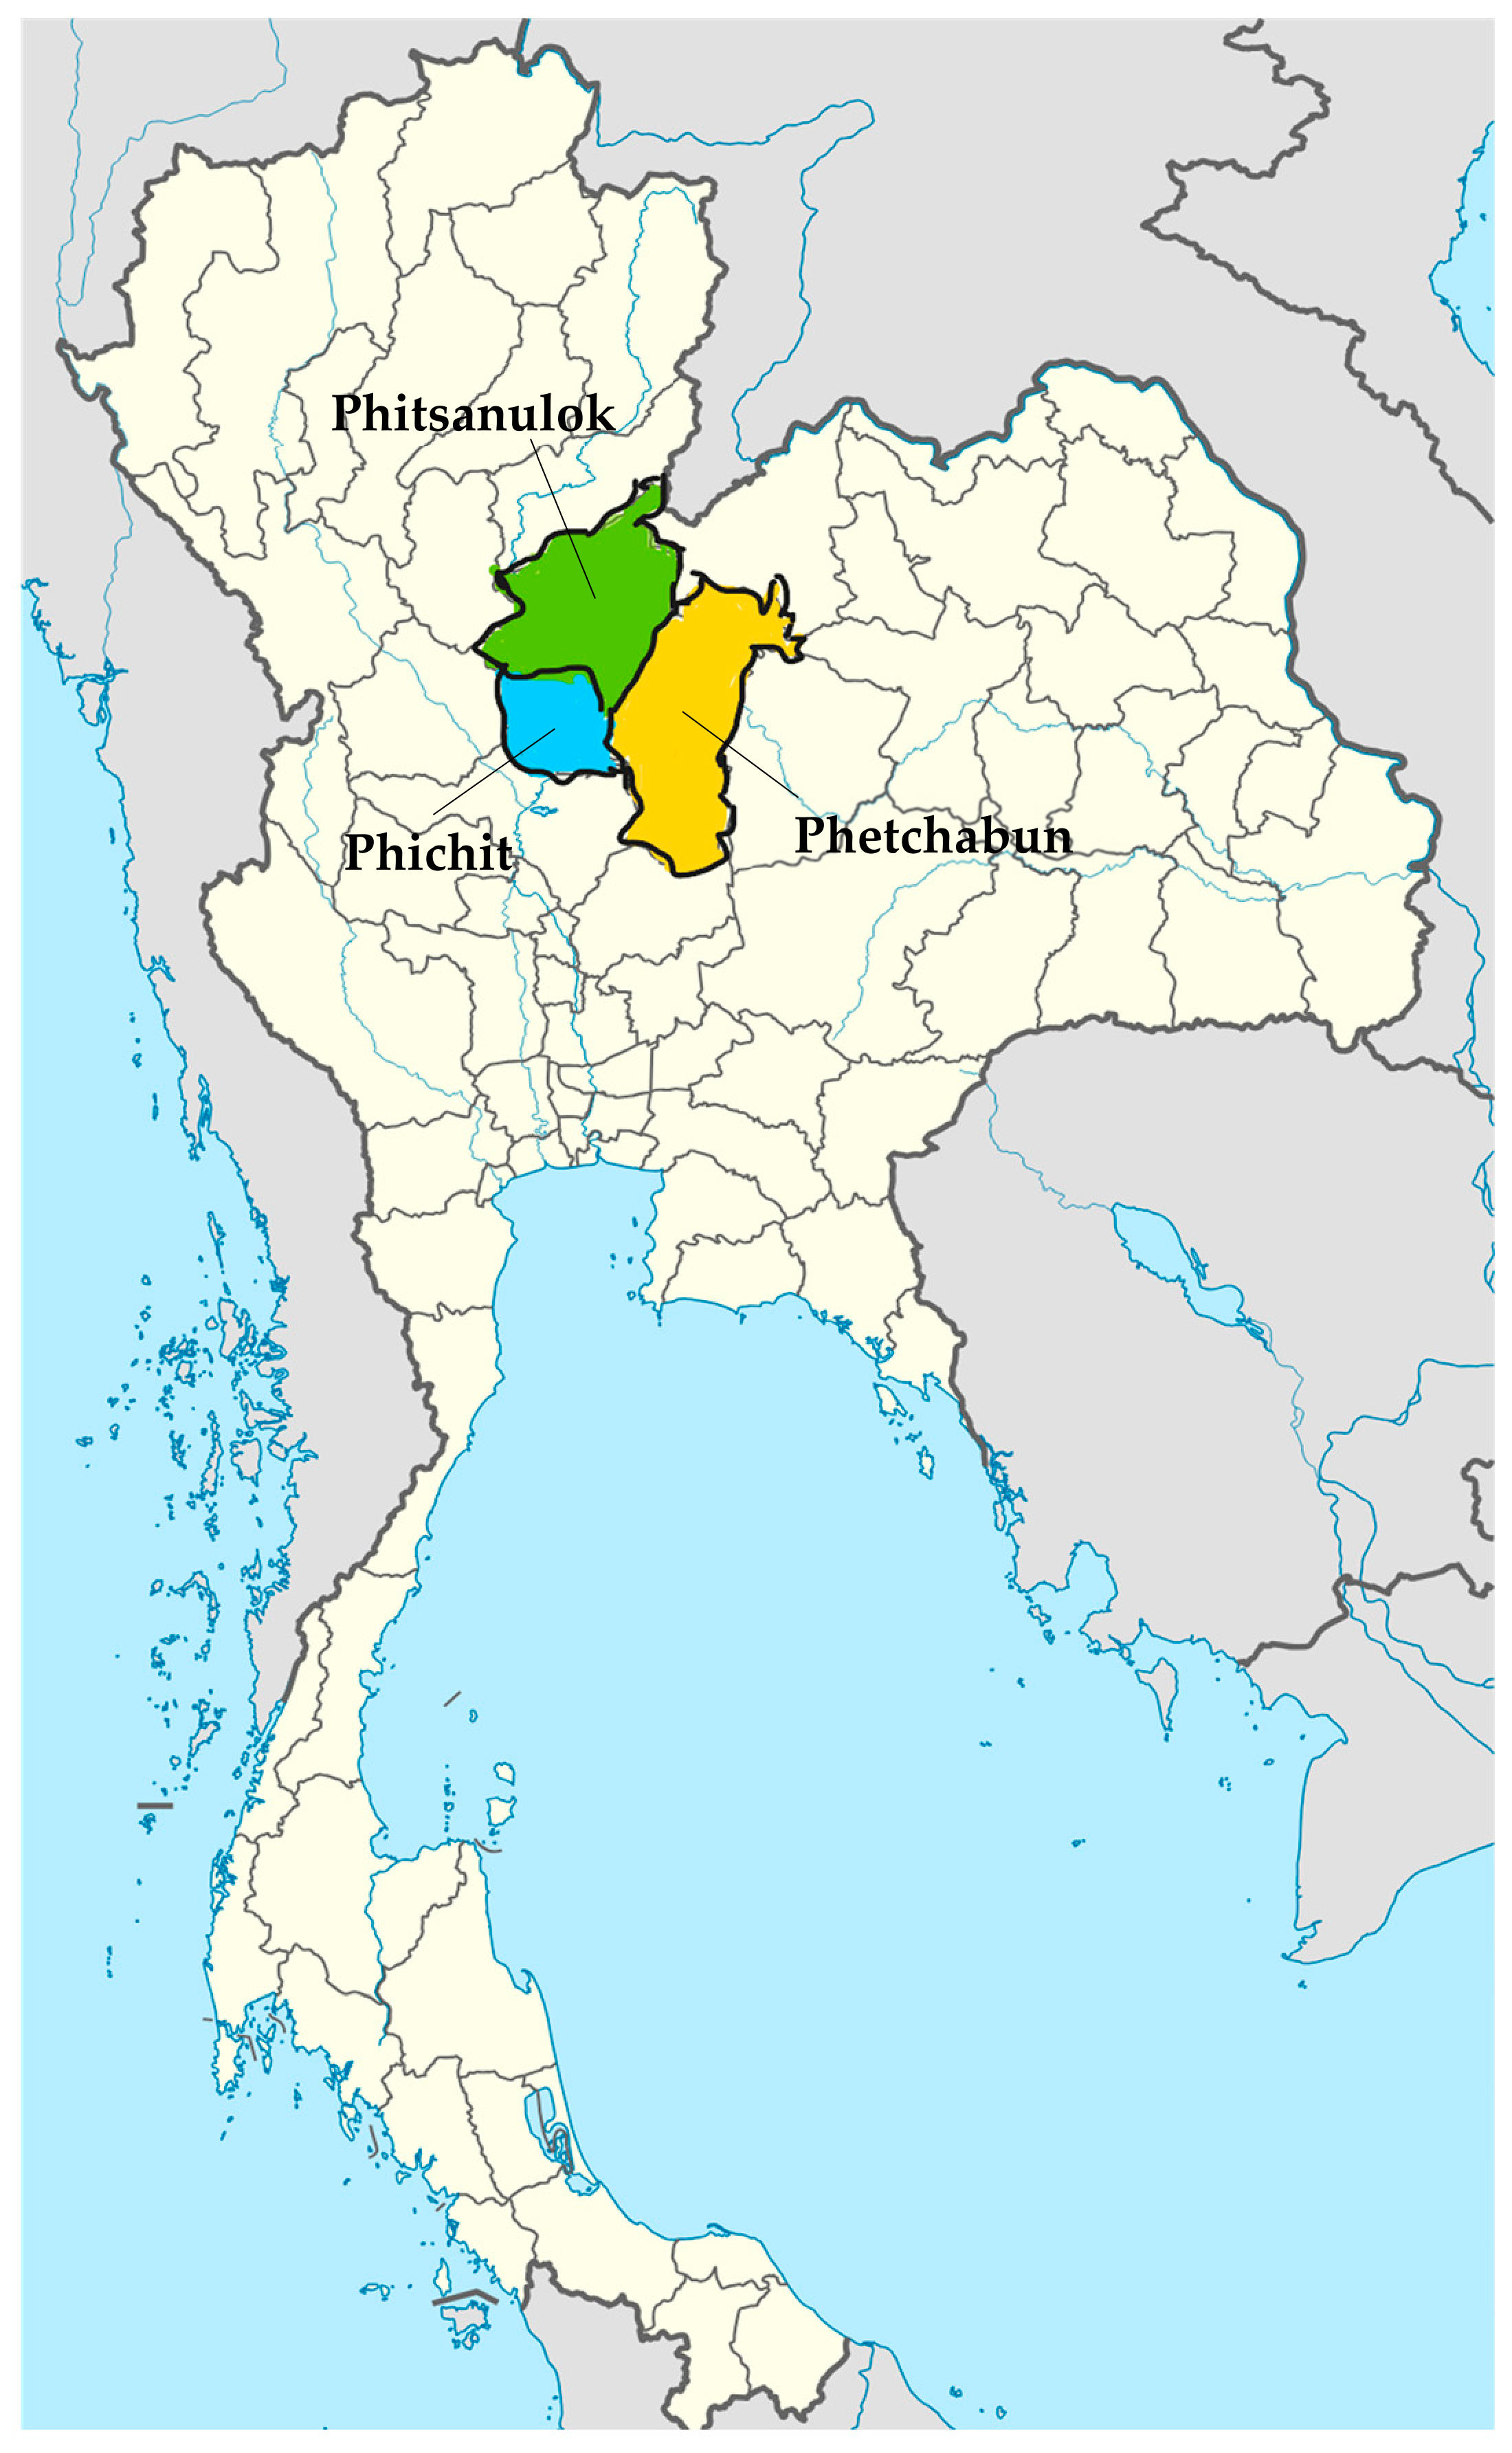
From March to December 2024, three researchers and four research assistants from Chiang Mai University conducted a questionnaire survey and fruit sample collection for pesticide residue analysis in three provinces of Thailand—Phichit, Phetchabun, and Phitsanulok (see the map in Figure 1).
Initially, we expected that roughly half of the planned 250 respondent samples would be certified farmers. However, not all farmers selling to the exporter companies were available to participate, as many declined due to their heavy workloads during the peak harvest season. As a result, we interviewed 104 certified farmers (Table 1).
We originally planned to identify all GAP-certified farmers through one export company. However, because the number of available farmers was smaller than expected, additional certified farmers selling to a second export company were also included in the survey sample. According to the interview with the export company purchasing mangoes from the majority of the surveyed certified farmers, the COVID-19 pandemic caused substantial disruptions in export operations, particularly in 2021. While the company experienced only limited impacts in 2020 because many export orders had already been arranged before the pandemic, it later faced declining export demand, logistical uncertainty, and increased dependence on alternative shipment arrangements such as charter and cargo flights. The company also expanded its domestic sales channels during the pandemic period. However, these company-level trends do not necessarily correspond directly to the export sales trends observed among the surveyed farmers, because the exporter handled multiple product lines and sourcing arrangements beyond the sampled mango farmers.
Additionally, we sought to interview one to two non-certified farmers near each certified farm, depending on local availability. The selection criteria for non-certified farmers were:
  • Cultivating a mango orchard of at least 5 rai (0.8 hectares)
  • Growing the Nam Dok Mai variety, which accounted for the highest annual harvested volume on the farm
  • Having a mango harvest history of at least five years at the time of the interview.
However, the geographic distribution of certified and non-certified farmers was not strictly even across the surveyed districts because export-oriented Q-GAP-certified farmers were concentrated around specific producer organizations and export-company networks supplying premium overseas markets. For example, Wang Sai and Wang Thong districts included only certified farmers linked to export-oriented producer groups, with no non-certified farmers identified in these districts. Meanwhile, Mueang district included only non-certified farmers. Consequently, it was not feasible to construct perfectly matched or proportionally balanced certified and non-certified samples within each district, and this limitation was addressed by collecting samples from the most geographically proximate districts and surrounding farming areas available within the study region.
Consequently, we interviewed 151 non-certified mango farmers, bringing the total sample to 255 farmers across the three provinces. Each farmer was interviewed for approximately 15 to 20 min using a structured questionnaire and voice recorders. Since non-certified farmers lack GAP certification, they cannot access high-value export markets such as Japan and Korea. Therefore, the majority of them focus on domestic markets for sales, while some also export to Malaysia—through middlemen brokerage—where GAP certification is not required.The peak mango production and harvest season in March and April is a labor-intensive period for farmers. Ideally, we would have visited each farm, selected mango samples using a standardized methodology, and conducted face-to-face interviews with the farmers. However, due to time constraints affecting both the farmers and our research team during the harvest season, we prioritized mango sample collection in March and April 2024 and conducted farmer interviews from May to December 2024 through follow-up visits.
Variables related to farmers’ coping strategies during COVID-19 disruptions were derived from structured interviews based on response categories developed through preliminary field investigations and pilot interviews conducted prior to the main survey. During the interviews, respondents were individually asked whether each coping strategy applied to their farming household, and multiple responses were permitted simultaneously. The categories were therefore not mutually exclusive, and the results do not represent spontaneous open-ended responses.
In mango sample collection for pesticide residue analysis, farmers were instructed to randomly collect five mango samples from five different locations within their fields, ensuring that each sampling point was approximately equidistant from the others. Farmers then brought the collected samples to designated gathering points for collection. Although on-site sample collection by our team would have been preferable, the wide geographic distribution of mango orchards and time limitations during the peak harvest season made direct collection from each farm impractical. While farmers were instructed to follow the sampling procedure as closely as possible, the possibility cannot be completely excluded that some samples were collected from more convenient locations within orchards or from trees perceived to have lower pesticide exposure or better fruit quality. Accordingly, some degree of unintentional selection effects cannot be entirely excluded.
Upon receipt, each sample was immediately assigned a unique identification code to ensure traceability and anonymity during laboratory analysis (blind testing). The samples were individually sealed in airtight Ziploc bags to minimize contamination and maintain sample integrity. To reduce thermal and photo-chemical degradation of pesticide residues during transportation, all sealed samples were stored in insulated cool boxes maintained at approximately 4 °C and transported to the laboratory within 24 h. Upon arrival, samples were either immediately homogenized or stored at −20 °C until extraction and analysis. In addition, mango peel and pulp were homogenized together to represent consumer exposure from whole-fruit consumption, and all samples were collected during the unripe stage of mango development to ensure consistency in sampling conditions. Furthermore, mango fruits had been protected using carbon bag coverings prior to harvest, which were typically applied approximately 5–6 days after the final pesticide application to ensure that pesticide residues on leaves and fruit surfaces had completely dried before bagging.
The collected data on farmers’ mango farm size (measured by planted area rather than harvested area) were used to calculate yields, which differs from the national yield data that are based on harvested area. Information related to economic outcomes to check the effects of and responses to COVID-19 was taken for 2019 to 2023. To compare the trend of our sample farms with the national trend, national-level economic data on mango production and export were also collected from available online sources. Meanwhile, data on farmers’ basic profiles as well as their perceptions and practices related to Q-GAP certification were obtained at the time of the survey interviews. Information regarding their annual pesticide use practices was collected for the one-year period preceding the interview conducted in 2024.
Accordingly, the pesticide-use and residue-related findings should be interpreted as reflecting conditions observed at the time of the 2024 survey rather than fully representing pesticide management practices throughout the entire 2019–2023 period. Nevertheless, these observed conditions may partly reflect path-dependent farming practices and management patterns that had developed over preceding years under different market orientations and GAP-related production systems. This temporal asymmetry partly reflects the practical difficulty of retrospectively obtaining reliable multi-year pesticide-use information from smallholder farmers, many of whom did not maintain detailed pesticide application records. In addition, pesticide residue analysis necessarily required contemporaneous mango sample collection during the 2024 harvest season.

2.2. Pesticide Residue Analysis

Following the collection of one mango fruit from each of five equidistant points within each grower’s field, the five collected fruits were left unwashed, coarsely chopped into small pieces, and pooled. A 500 g subsample was then selected for residue analysis. Sample preparation followed the Codex Alimentarius protocols [24] and was completed within 24 h of collection. Each 500 g portion was sealed in a zip-lock bag and stored at –20 °C in the Laboratory of Environmental and Occupational Health Sciences, Research Institute for Health Sciences, Chiang Mai University.
On the day of analysis, frozen mango samples were thawed and extracted for both organophosphate (OP) and pyrethroid (PY) pesticides. Briefly, each sample underwent solvent extraction and cleanup, yielding a final concentrated extract for chromatographic analysis.
The analytical procedure for detecting OP and PY residues followed previously established GC-FPD/ECD methods commonly applied in pesticide residue analysis. A 5 g sample was placed into a 50 mL centrifuge tube, and 15 mL of acetonitrile:dichloromethane (1:1, v/v) was added for extraction. The container was shaken for approximately five min, with two extractions performed. The extracted solutions were combined with 3 g of sodium chloride and magnesium sulfate to remove water. The resulting solution was filtered through filter paper containing 2 g of anhydrous sodium sulfate into an evaporating flask. Drying was carried out using a rotary evaporator in a water bath at 40 °C. Subsequently, the solution was dissolved in 1 mL of ethyl acetate and transferred to a GCB tube. It was then filtered using a syringe filter with a pore size of 0.45 μm before being injected into the GC-FPD/ECD.
For OP determination, 1 µL of the extract was injected (splitless) into an Agilent 7890B gas chromatograph (Agilent Technologies, Santa Clara, CA, USA) equipped with a flame photometric detector (GC–FPD). Separation employed a DB-1701 capillary column (30 m × 0.25 mm i.d., 0.25 µm film; Agilent J&W, Agilent Technologies, Santa Clara, CA, USA). The inlet was operated at 250 °C with a constant carrier-gas flow of 1.5 mL/min. The oven was held at 100 °C (initial), and the FPD was maintained at 250 °C with air, H2, and N2 makeup flows each set to 60 mL/min. These conditions provided sensitive, selective detection of OP residues against the mango matrix.
For the PY analysis, the same GC system was equipped with an electron capture detector (GC–ECD). A 1 µL aliquot was injected into an HP-5 column (30 m × 0.25 mm i.d., 0.25 µm film; Agilent J&W). The ECD was set to 300 °C with a nitrogen makeup flow of 30 mL/min. The oven temperature program was: 100 °C for 1 min; ramp to 180 °C at 5 °C/min; then to 200 °C at 15 °C/min; and finally to 280 °C at 5 °C/min, held for 4 min. The total runtime was 50 min, which allowed baseline separation of the OP and PY congeners.
All analyses were performed in triplicate using three independent replicates (n = 3) under the same experimental conditions in order to evaluate analytical reproducibility and calculate mean recovery percentages. Quality control included matrix-matched calibration standards and procedural blanks to verify analytical accuracy and precision. The analytical performance characteristics of the GC-based pesticide residue method, including linearity, limits of detection (LOD), limits of quantification (LOQ), and correlation coefficients (r2), are presented in Table A13 in Appendix A.5, while the precision and recovery performance under intra-batch and inter-batch conditions are summarized in Table A14.

2.3. Statistical Data Processing

Statistical analyses were conducted using Stata/IC 16.1 (StataCorp LLC, College Station, TX, USA). Differences in continuous variables were assessed using one-way ANOVA, and categorical variables were compared using chi-square tests. The comparative analysis of economic resilience between GAP-certified and non-certified farms during the 2019–2023 period relied primarily on year-by-year comparative statistics rather than formal panel-data modeling. Accordingly, the findings should be interpreted as descriptive longitudinal patterns rather than rigorous causal estimates of dynamic adaptation and resilience processes. Additionally, given the relatively large number of statistical comparisons conducted across multiple dimensions, findings significant at the 10% level were interpreted cautiously and treated as suggestive rather than conclusive evidence.
To examine the determinants of pesticide residue levels, we estimated multiple linear regression (MLR) models of the following general form:
Yi = β0 + β1Xi,1 + ⋯ + βkXi,k + εi
where Yi denotes the residue concentration (mg/kg of active ingredients), Xi,j represents the explanatory variables, and εi is the error term. The MLR framework was used to quantify the contribution of each predictor while controlling for covariates.
We report results only for PY residues because more than 90% of the OP residue observations were zero, creating severe zero inflation that violates key regression assumptions (linearity and homoscedasticity) and yields unreliable Ordinary Least Squares (OLS) estimates. Log-transformations would also require arbitrary adjustments for zeros (e.g., l o g   ( y + 1 ) ), further distorting inference. MLR was therefore unsuitable for OP residues and is not presented. Moreover, because the PY residue data also included a substantial proportion of undetected or near-zero observations, the regression results may have been affected by left censoring, skewed distributions, and heteroscedasticity. Accordingly, the regression analysis should be interpreted as exploratory rather than as a rigorous causal estimation framework.
For the MLR analysis for PY residues, we initially prepared 23 candidate explanatory variables (see Table A1 in Appendix A.2). These variables represent the items examined in the analysis of socioeconomic outcomes, farmers’ perceptions of GAP and training experience, and pesticide-use behavior, as presented in the Section 3. Following the model selection process in Steps 1–8 (see Appendix A.2), we estimated the final regressions separately by farm type. For certified farms (Farm type = 1), pesticide use was modeled using two frequency components: combined insecticide–fungicide applications (freq_insectfung) and herbicide applications (freq_herb). For non-certified farms (Farm type = 0), a single aggregate pesticide frequency index (freq_total) was used. Both models included the same core controls—age, education, mango farm size, mango yield, and per-hectare mango sales—and were estimated using OLS.
To assess the robustness of the estimates, we conducted a series of post-estimation diagnostics. First, we re-estimated the final models using alternative heteroskedasticity-consistent variance estimators (HC1 = standard robust and HC3 = strong robust) to confirm that the statistical inference was not sensitive to the choice of robust standard errors. Second, we computed standard influence diagnostics (studentized residuals, leverage values, and Cook’s distance) to identify high-influence observations. All robustness checks confirmed that our main findings were not sensitive to estimator choice or influential observations (see Appendix A.2, Step 9).

3. Results

3.1. Socio-Economic Profile of the Farmers Surveyed

Information on the basic profile of the respondent farmers reflects their status at the time of the survey in 2024 (Table 2). The certified farmers had a significantly larger mean total farm size and mango farm size, as well as a higher total number of mango trees compared with the non-certified farmers (p < 0.01). The mean mango farm size of certified farmers (5.76 ha) is larger than the national average of 4.64 ha in 2023 (see Figure A1 in Appendix A.3), although the statistical significance of this difference could not be assessed. A significantly higher proportion of certified farmers cultivated certified crops other than mango and rice; however, this proportion was still very low, at less than five percent.
Meanwhile, no significant differences were observed between the two groups in terms of age, education level, the number of mango trees per hectare, the number of crops grown other than mango and rice, the percentage of farms employing permanent workers for mango farming, or the number of permanently employed workers dedicated to mango production.

3.2. Respondent Farmers’ Marketing Platforms

At the time of the 2024 survey, certified farmers sold mangoes either to exporter companies A or B, which target premium destinations such as Japan and Korea. No non-certified farmers sold to these companies, as GAP certification is a prerequisite for accessing such markets (Table 3). All certified farmers also sold mangoes domestically through middlemen and directly to local outlets such as neighborhood stores and community markets, with a significant difference compared to non-certified farmers (p < 0.01). About 57.7% of certified farmers additionally engaged in online sales through five producer-operated online outlet groups, while none of the non-certified farmers participated in online sales, with a significant difference (p < 0.01).
In contrast, 5.3% of non-certified farmers sold to lower-value export destinations in Malaysia via middlemen, where GAP certification is not required. None of the certified farmers participated in this channel, with a significant difference (p < 0.05). Approximately 40.4% of non-certified farmers sold directly to wholesale markets, whereas no certified farmers did, also showing a significant difference (p < 0.01). No significant difference was observed in sales through the Department of International Trade (DIT), which involved only 0.7% of non-certified farmers.

3.3. Annual Economic Outcomes of Mango Farming from 2019 to 2023

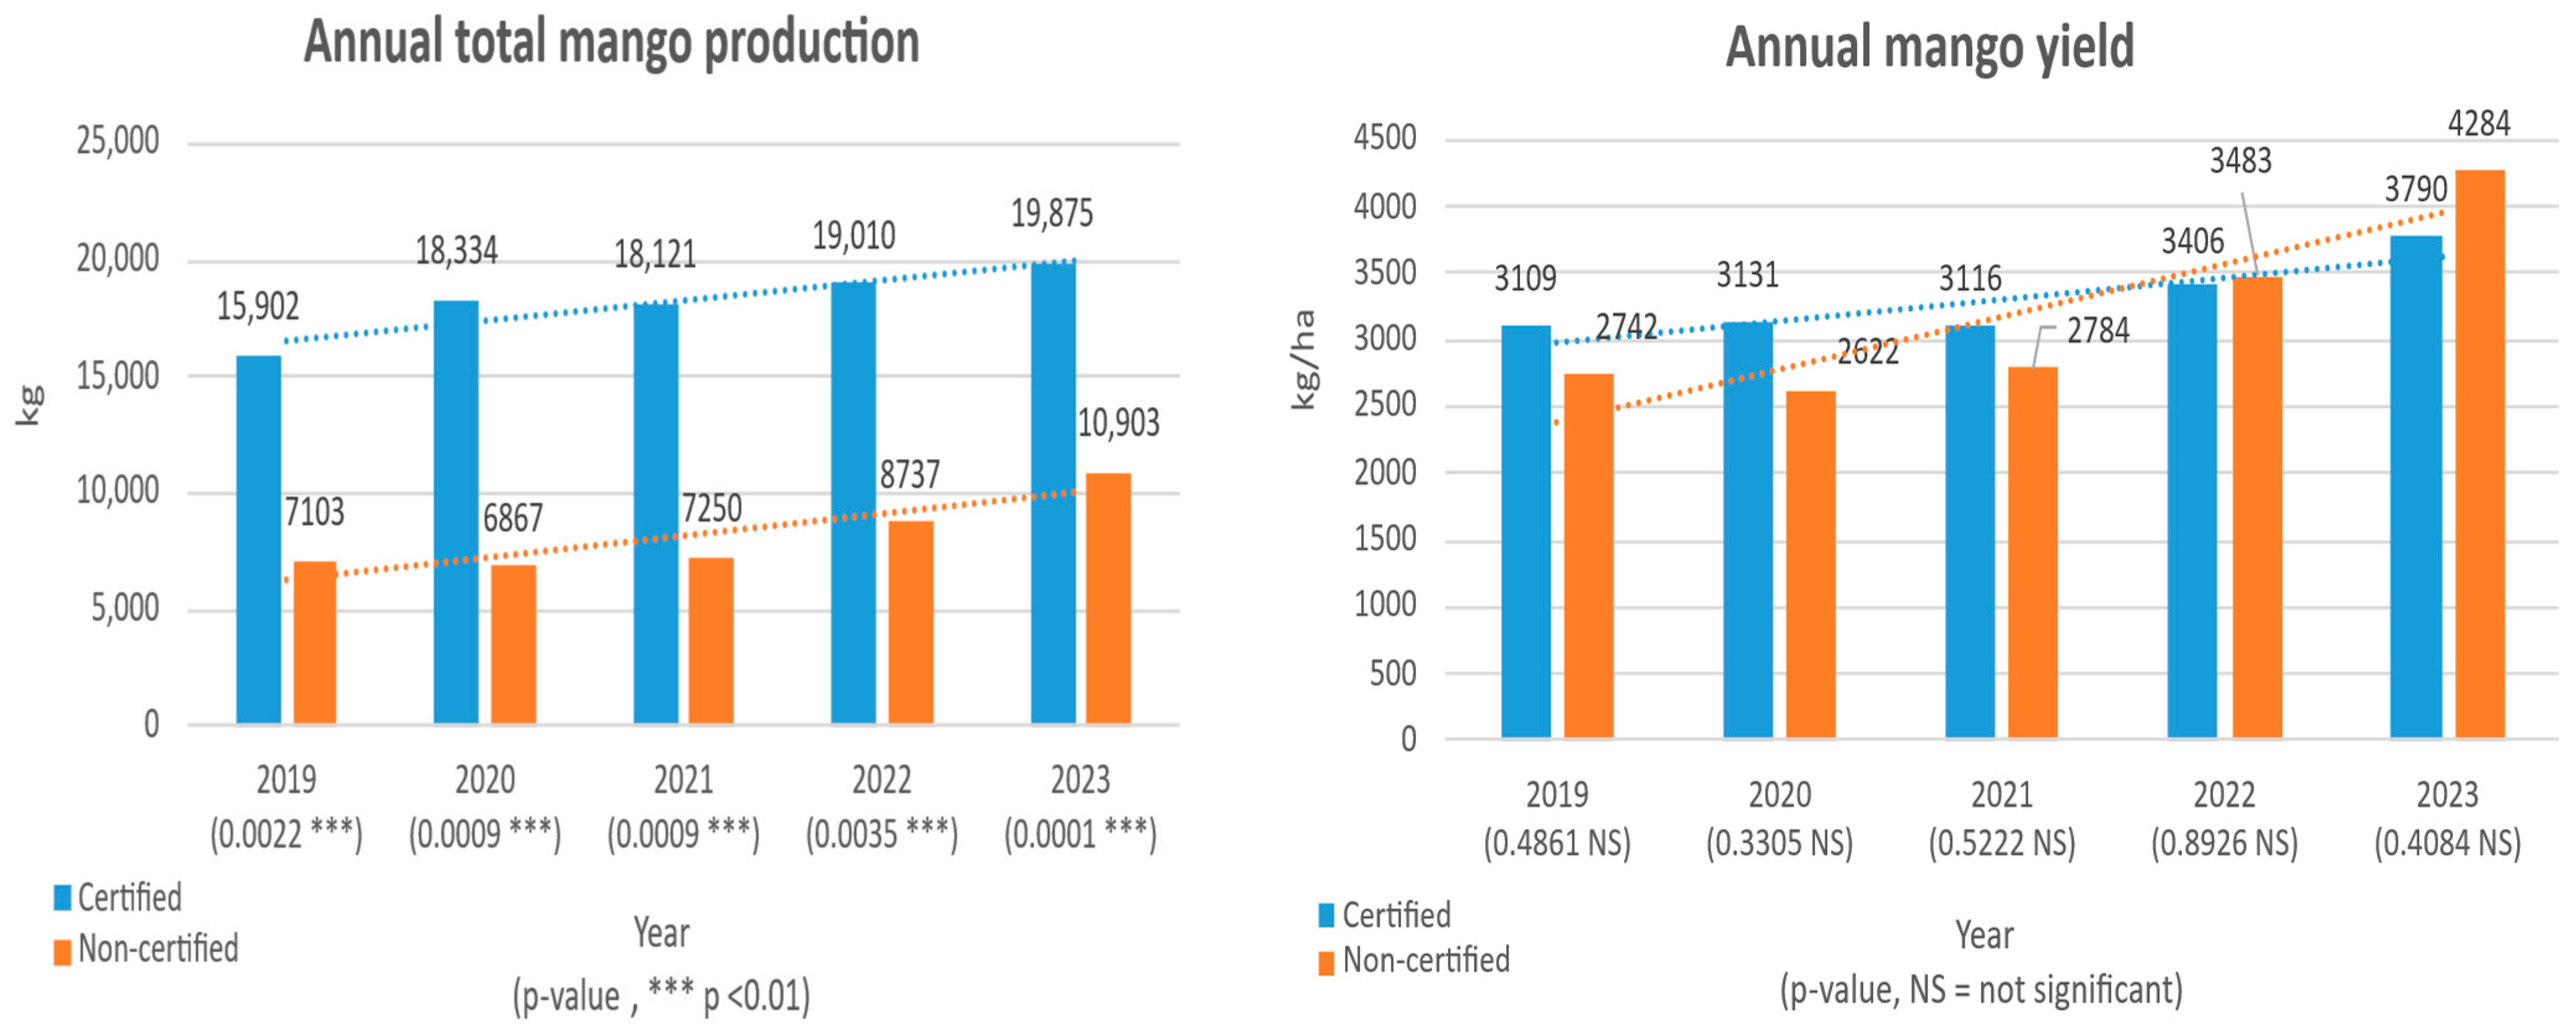
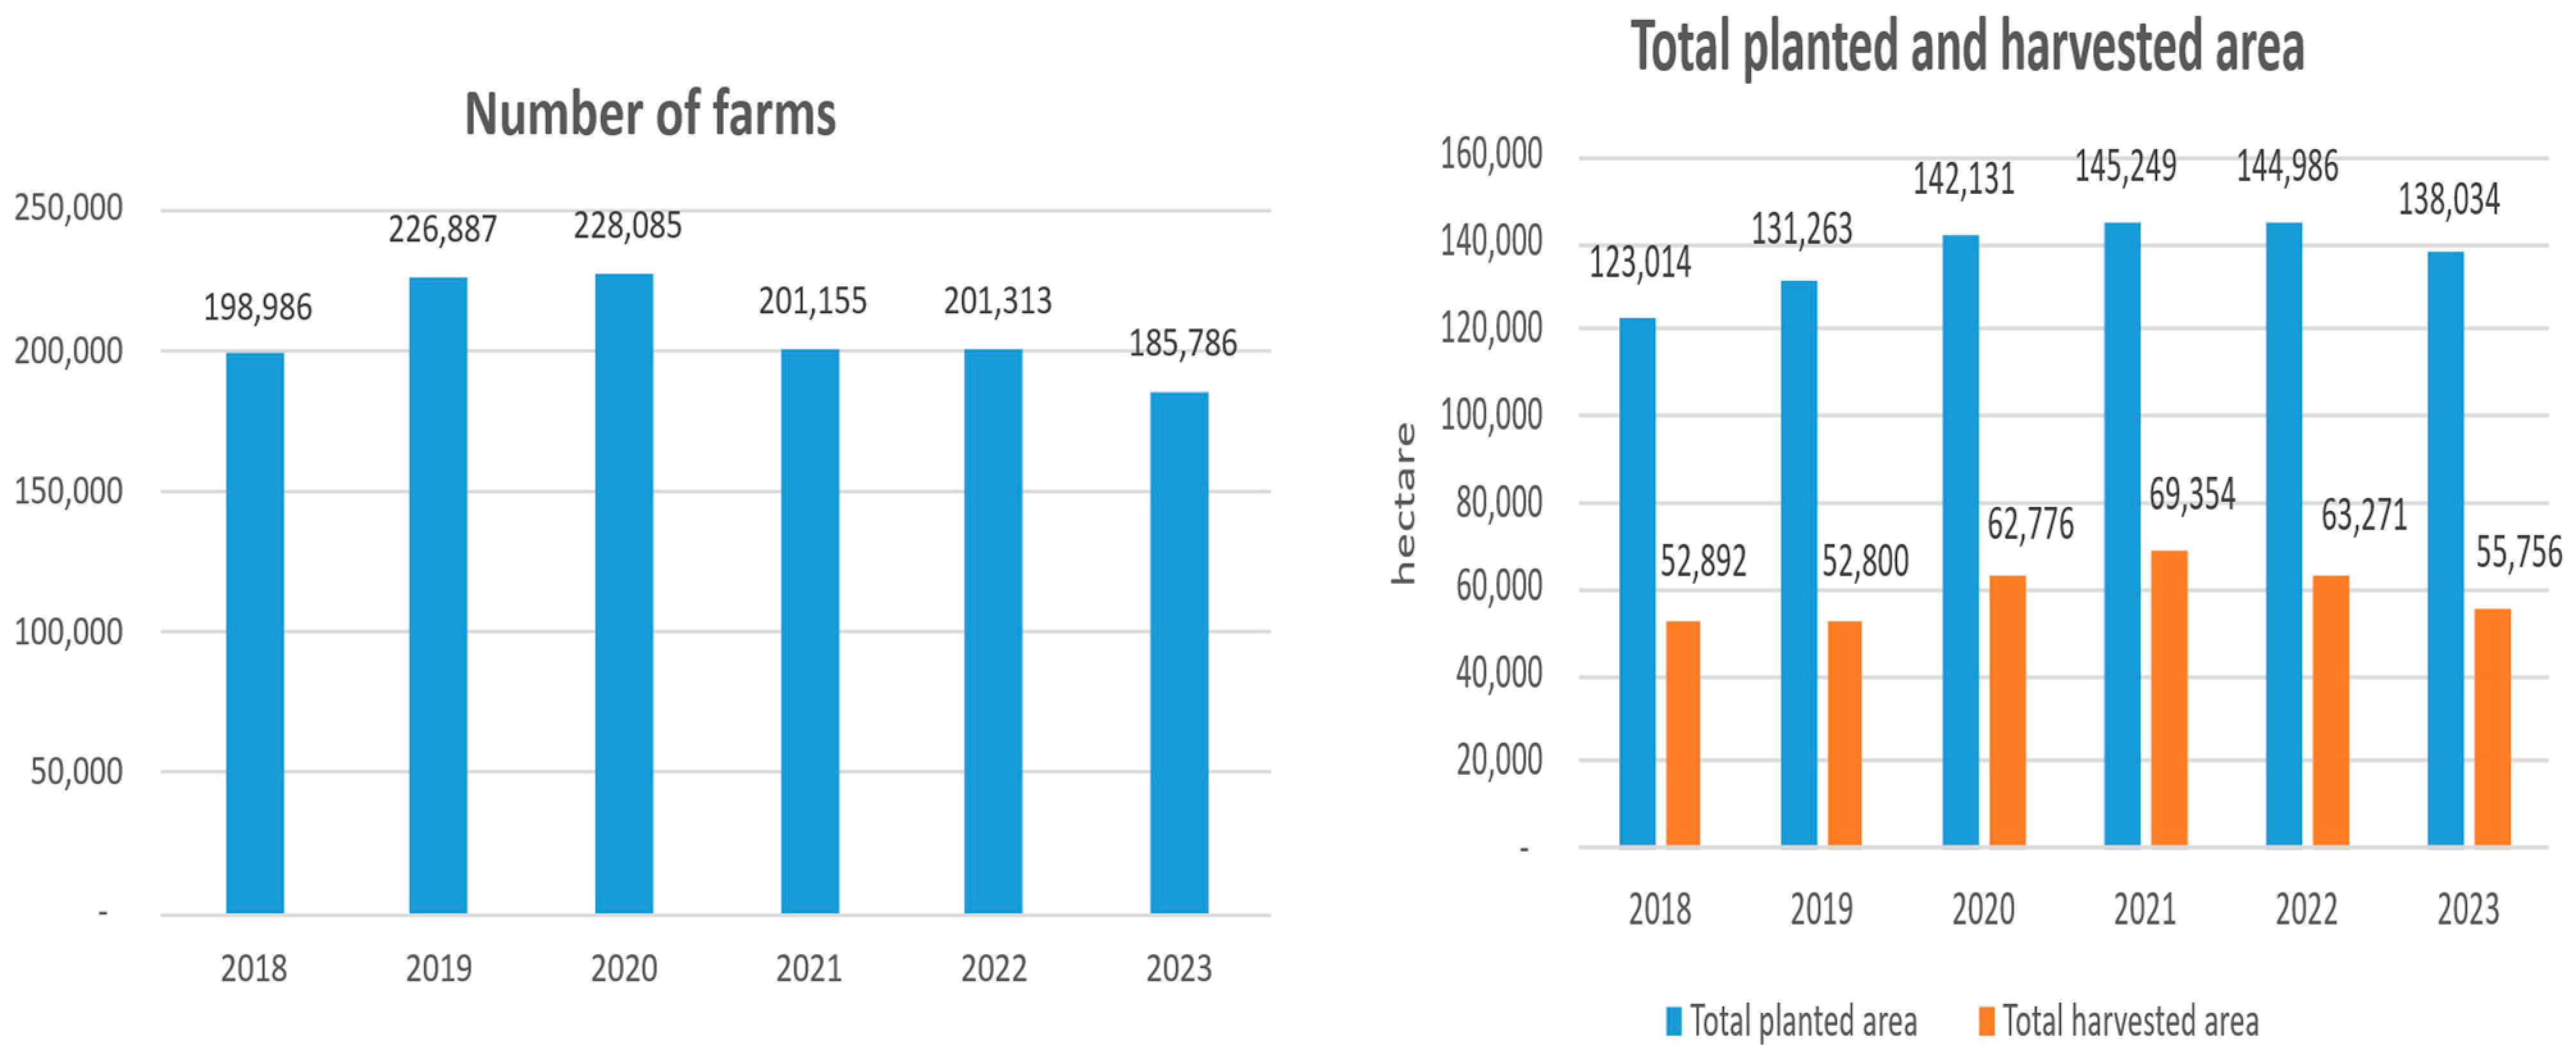
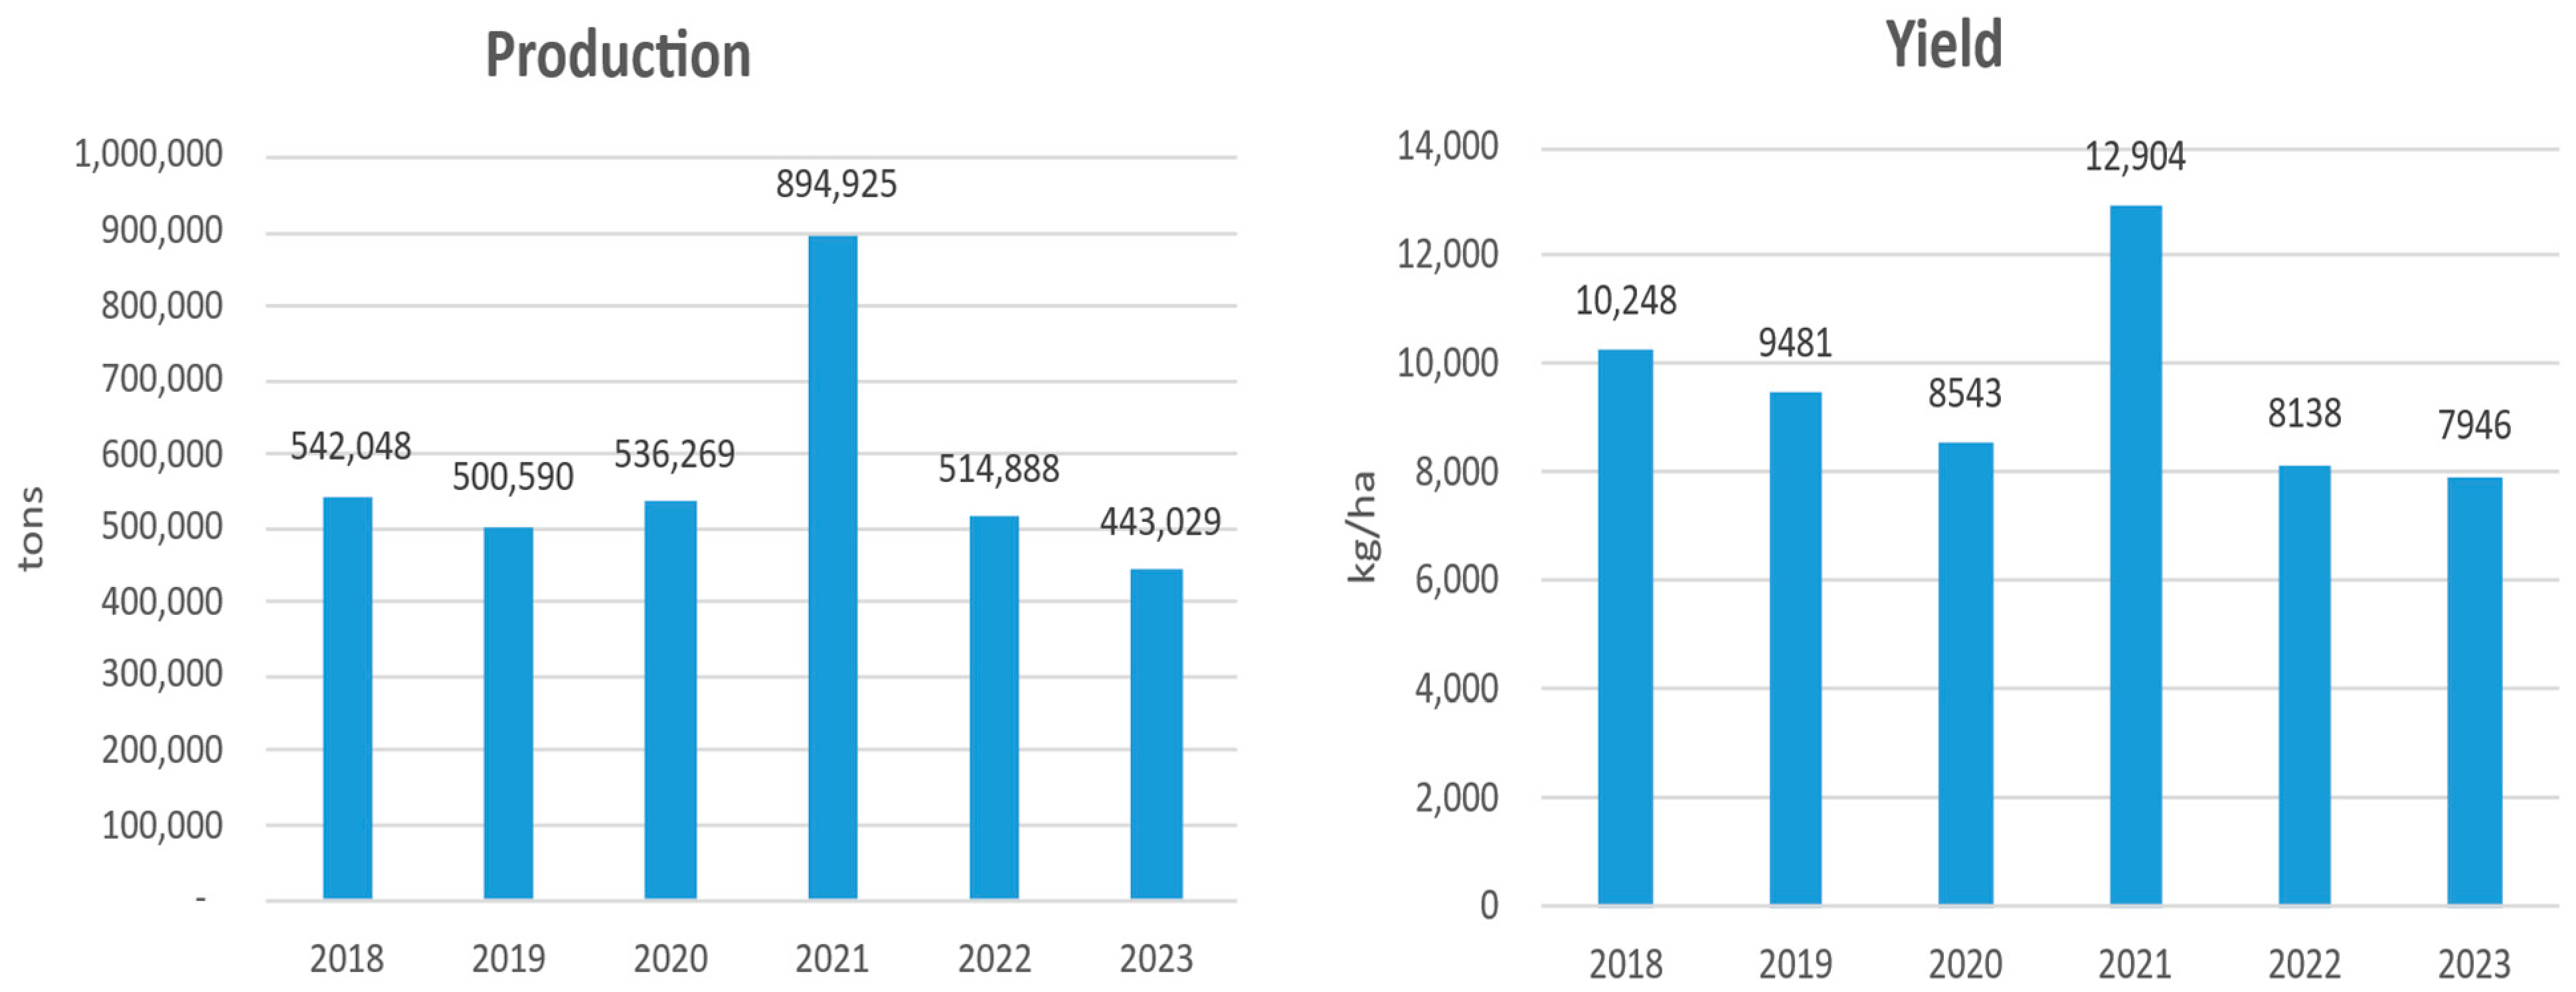
Certified farmers consistently exhibited significantly higher mean annual total mango production than non-certified farmers throughout the observed period (p < 0.01) (Figure 2). By contrast, no significant difference was found in annual yield, with the production gap largely reflecting differences in orchard size. As land size remained unchanged for both groups over the survey period, yield levels were relatively stable during the first three years but began to show an upward trend from 2022, reportedly due to increasingly favorable weather conditions in the regions. The observed range of yields (approximately 2.6 to 4.3 tons/ha) is much lower than the national average of 7.9 to 12.9 tons/ha (see Figure A2 in Appendix A.3), partly because our yield estimates are based on planted area, whereas the national figures are calculated using harvested area. However, even after accounting for this difference, the yield levels in our sample would still remain lower than the national average.
From 2019 to 2020, certified farmers’ total production increased by 15.3%, while yield rose by only 0.7%. This divergence can be explained by the difference between the “ratio of means” and the “mean of ratios.” In principle, if larger and smaller farms contributed proportionally to aggregate production, multiplying mean per-hectare yield by mean land size would produce aggregate outcomes consistent with the observed totals. However, when larger farms exert a stronger influence while the per-hectare value remains constant, the aggregate values exceed the multiplication outcome. Conversely, when smaller farms dominate, the aggregate values fall below that outcome. This phenomenon can be observed in two ways: first, in terms of the aggregate production structure within each year, and second, in terms of year-on-year changes.
Notably, the first year of the pandemic did not negatively affect certified farmers; instead, production even grew, possibly reflecting the relatively stronger economic coping capacity of export-oriented larger farms. Between 2021 and 2023, yield growth exceeded the increase in total production among certified farmers, possibly implying that smaller farms contributed more visibly to the recovery process during the later stage of the pandemic. By contrast, non-certified farmers selling mainly to domestic markets showed a relatively stronger contribution from smaller farms in terms of the absolute production structure throughout the observed period (Table A3).
Regarding the relative contribution of farm size to annual production changes, larger certified farms exerted a stronger positive influence in 2020, whereas smaller farms increasingly contributed to production changes from 2021 to 2023 (Table A4). As for non-certified farmers, from 2019 to 2021, larger farms played the leading role, mitigating the 2019–2020 decline and driving the 2020–2021 recovery. In 2021–2022, smaller farms became the main source of growth, while in 2022–2023, the influence shifted slightly back toward larger farms (Table A5).
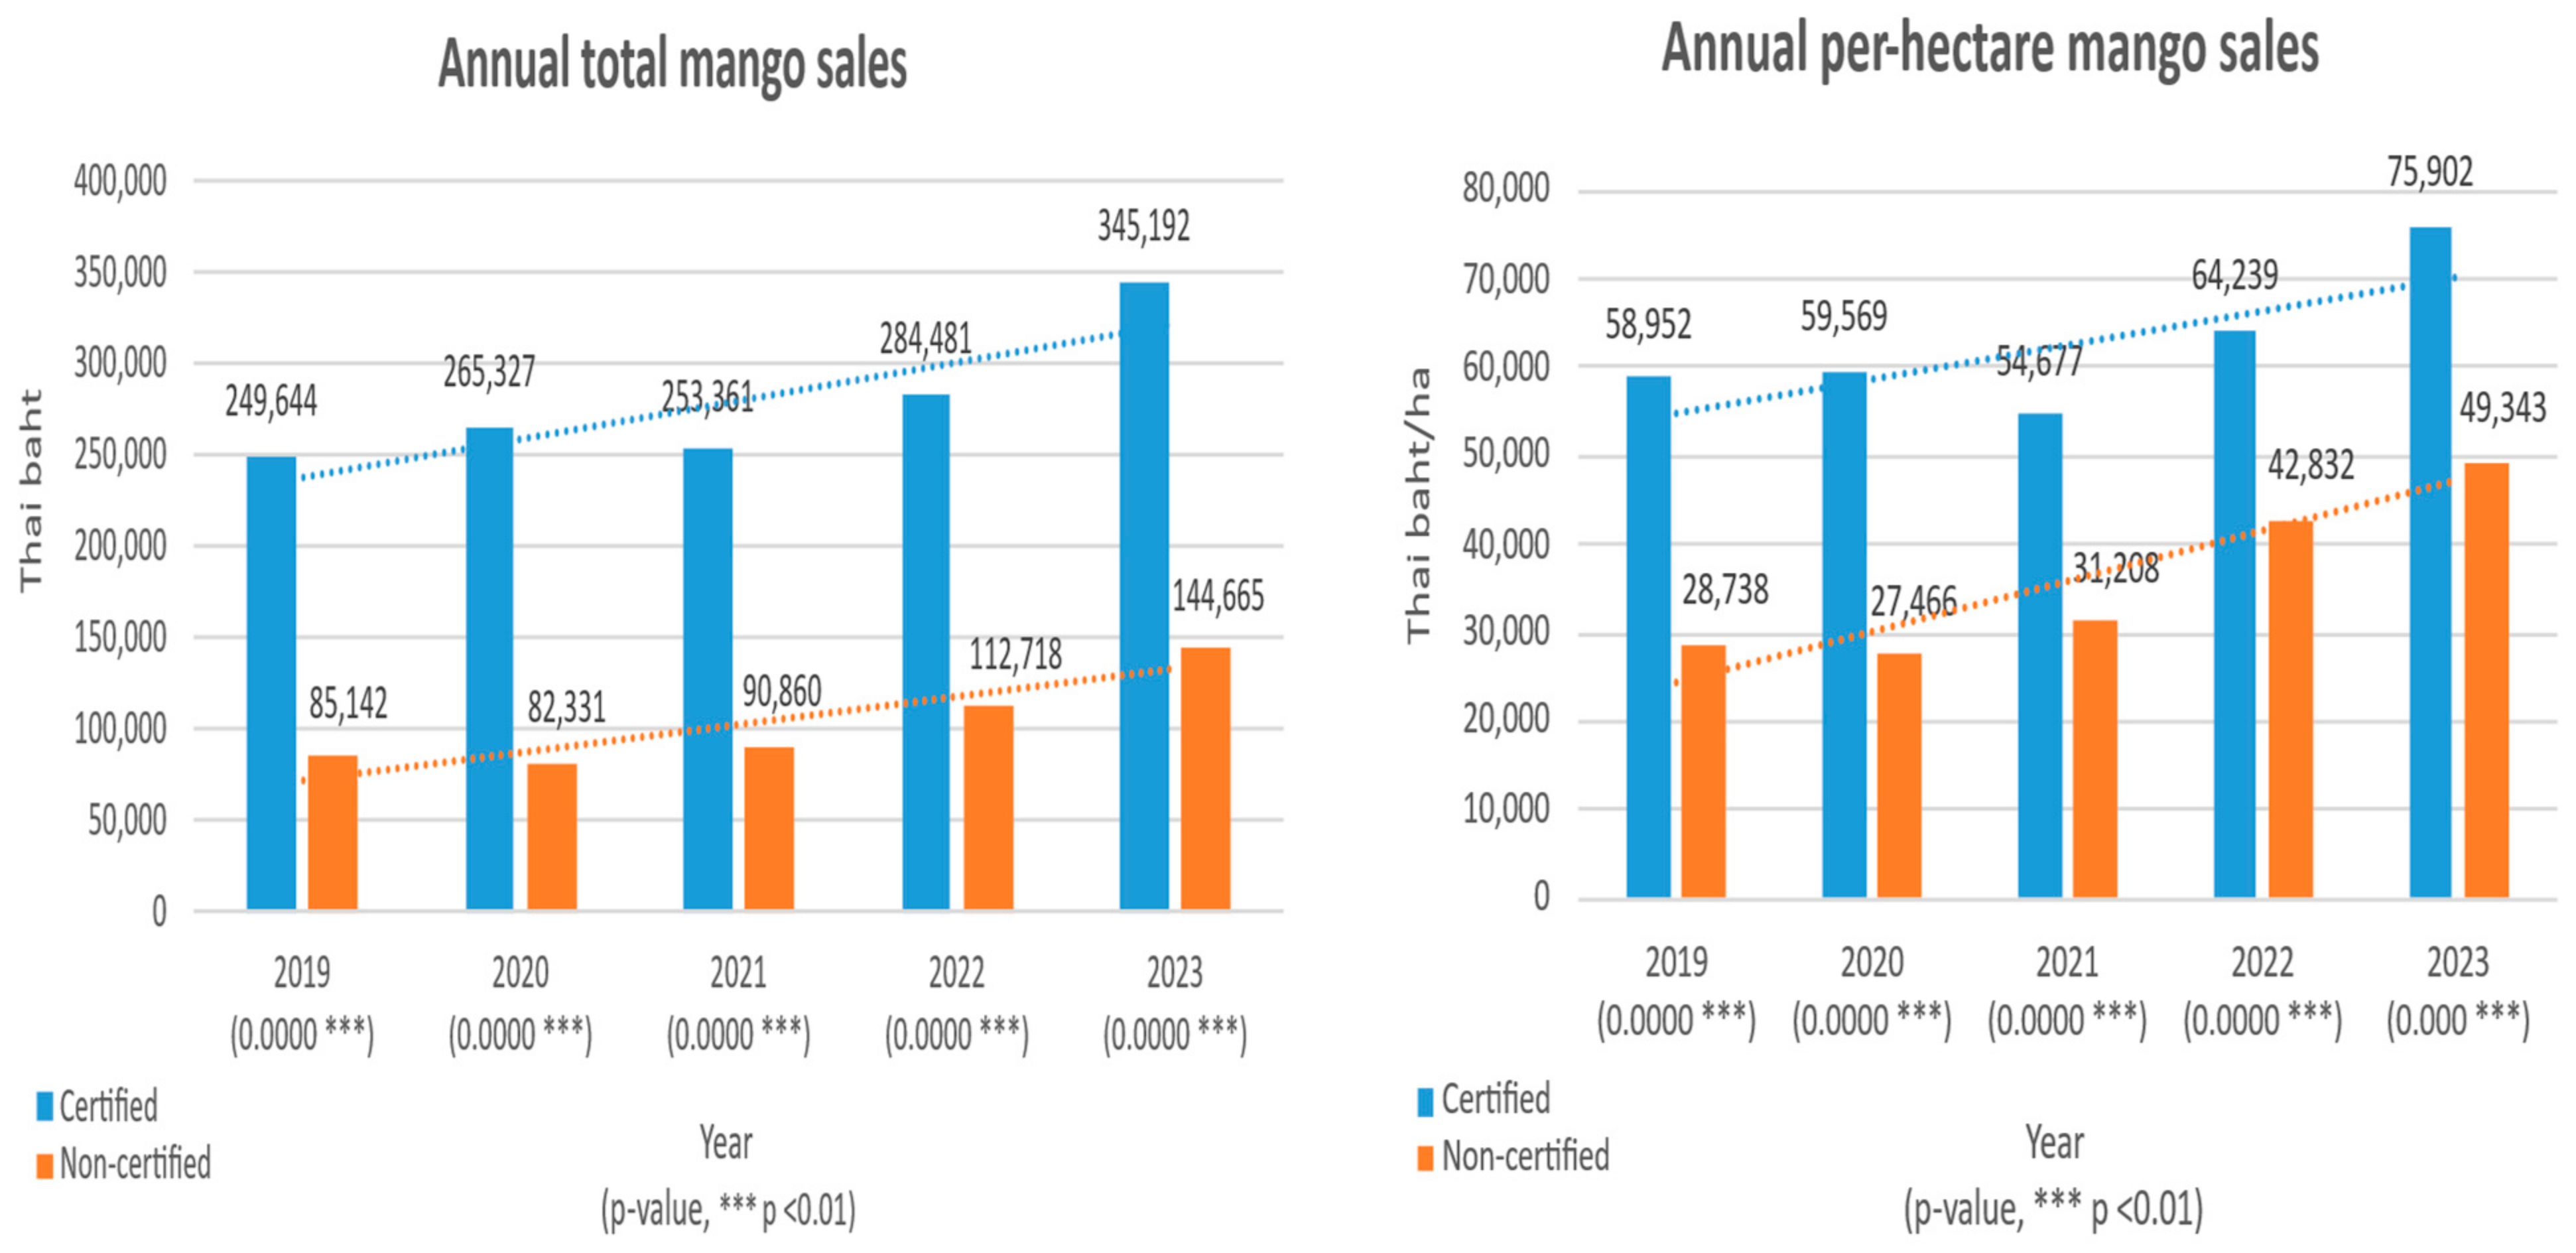
The certified farmers had significantly higher mean annual total mango sales and per-hectare mango sales during 2019–2023 (Figure 3). Given the absence of statistically significant differences in yield over the same period, the difference in per-hectare sales reflects the higher prices obtained by certified farmers in premium export markets compared with those received by non-certified farmers in the domestic market.
Within the certified group, smaller farms contributed relatively more to aggregate total sales throughout the five years (Table A6). This pattern may partly reflect the higher per-hectare financial efficiency of smaller certified farms, possibly associated with more intensive orchard management and quality control for premium export markets. By contrast, among non-certified farmers, larger farms generally exerted a stronger influence on aggregate total sales, although this pattern temporarily weakened in 2022 (Table A7). This difference may partly reflect the domestic marketing structure, where bulk sales to wholesalers and processors tend to favor larger farms through scale-related transaction and transport advantages. The temporary weakening of this pattern in 2022 may also reflect post-pandemic market adjustments that reduced the relative marketing advantages of larger farms.
Regarding the relative contribution of farm size to yearly changes in total sales, for certified farms, growth was led by larger farms from 2019 to 2020 (Table A8). In 2020–2021, smaller farms declined more sharply than larger farms. In 2021–2022, smaller farms drove the recovery, but in 2022–2023, larger farms again dominated overall growth. This pattern may suggest a post-pandemic differentiation in recovery patterns, whereby smaller farms contributed more to production recovery, while larger farms regained stronger market and pricing advantages during the later recovery stage. Among non-certified farmers, larger farms initially played a buffering role in 2019–2020, whereas smaller farms contributed more to sales recovery from 2020 to 2022 before the influence shifted back toward larger farms in 2022–2023 (Table A9).
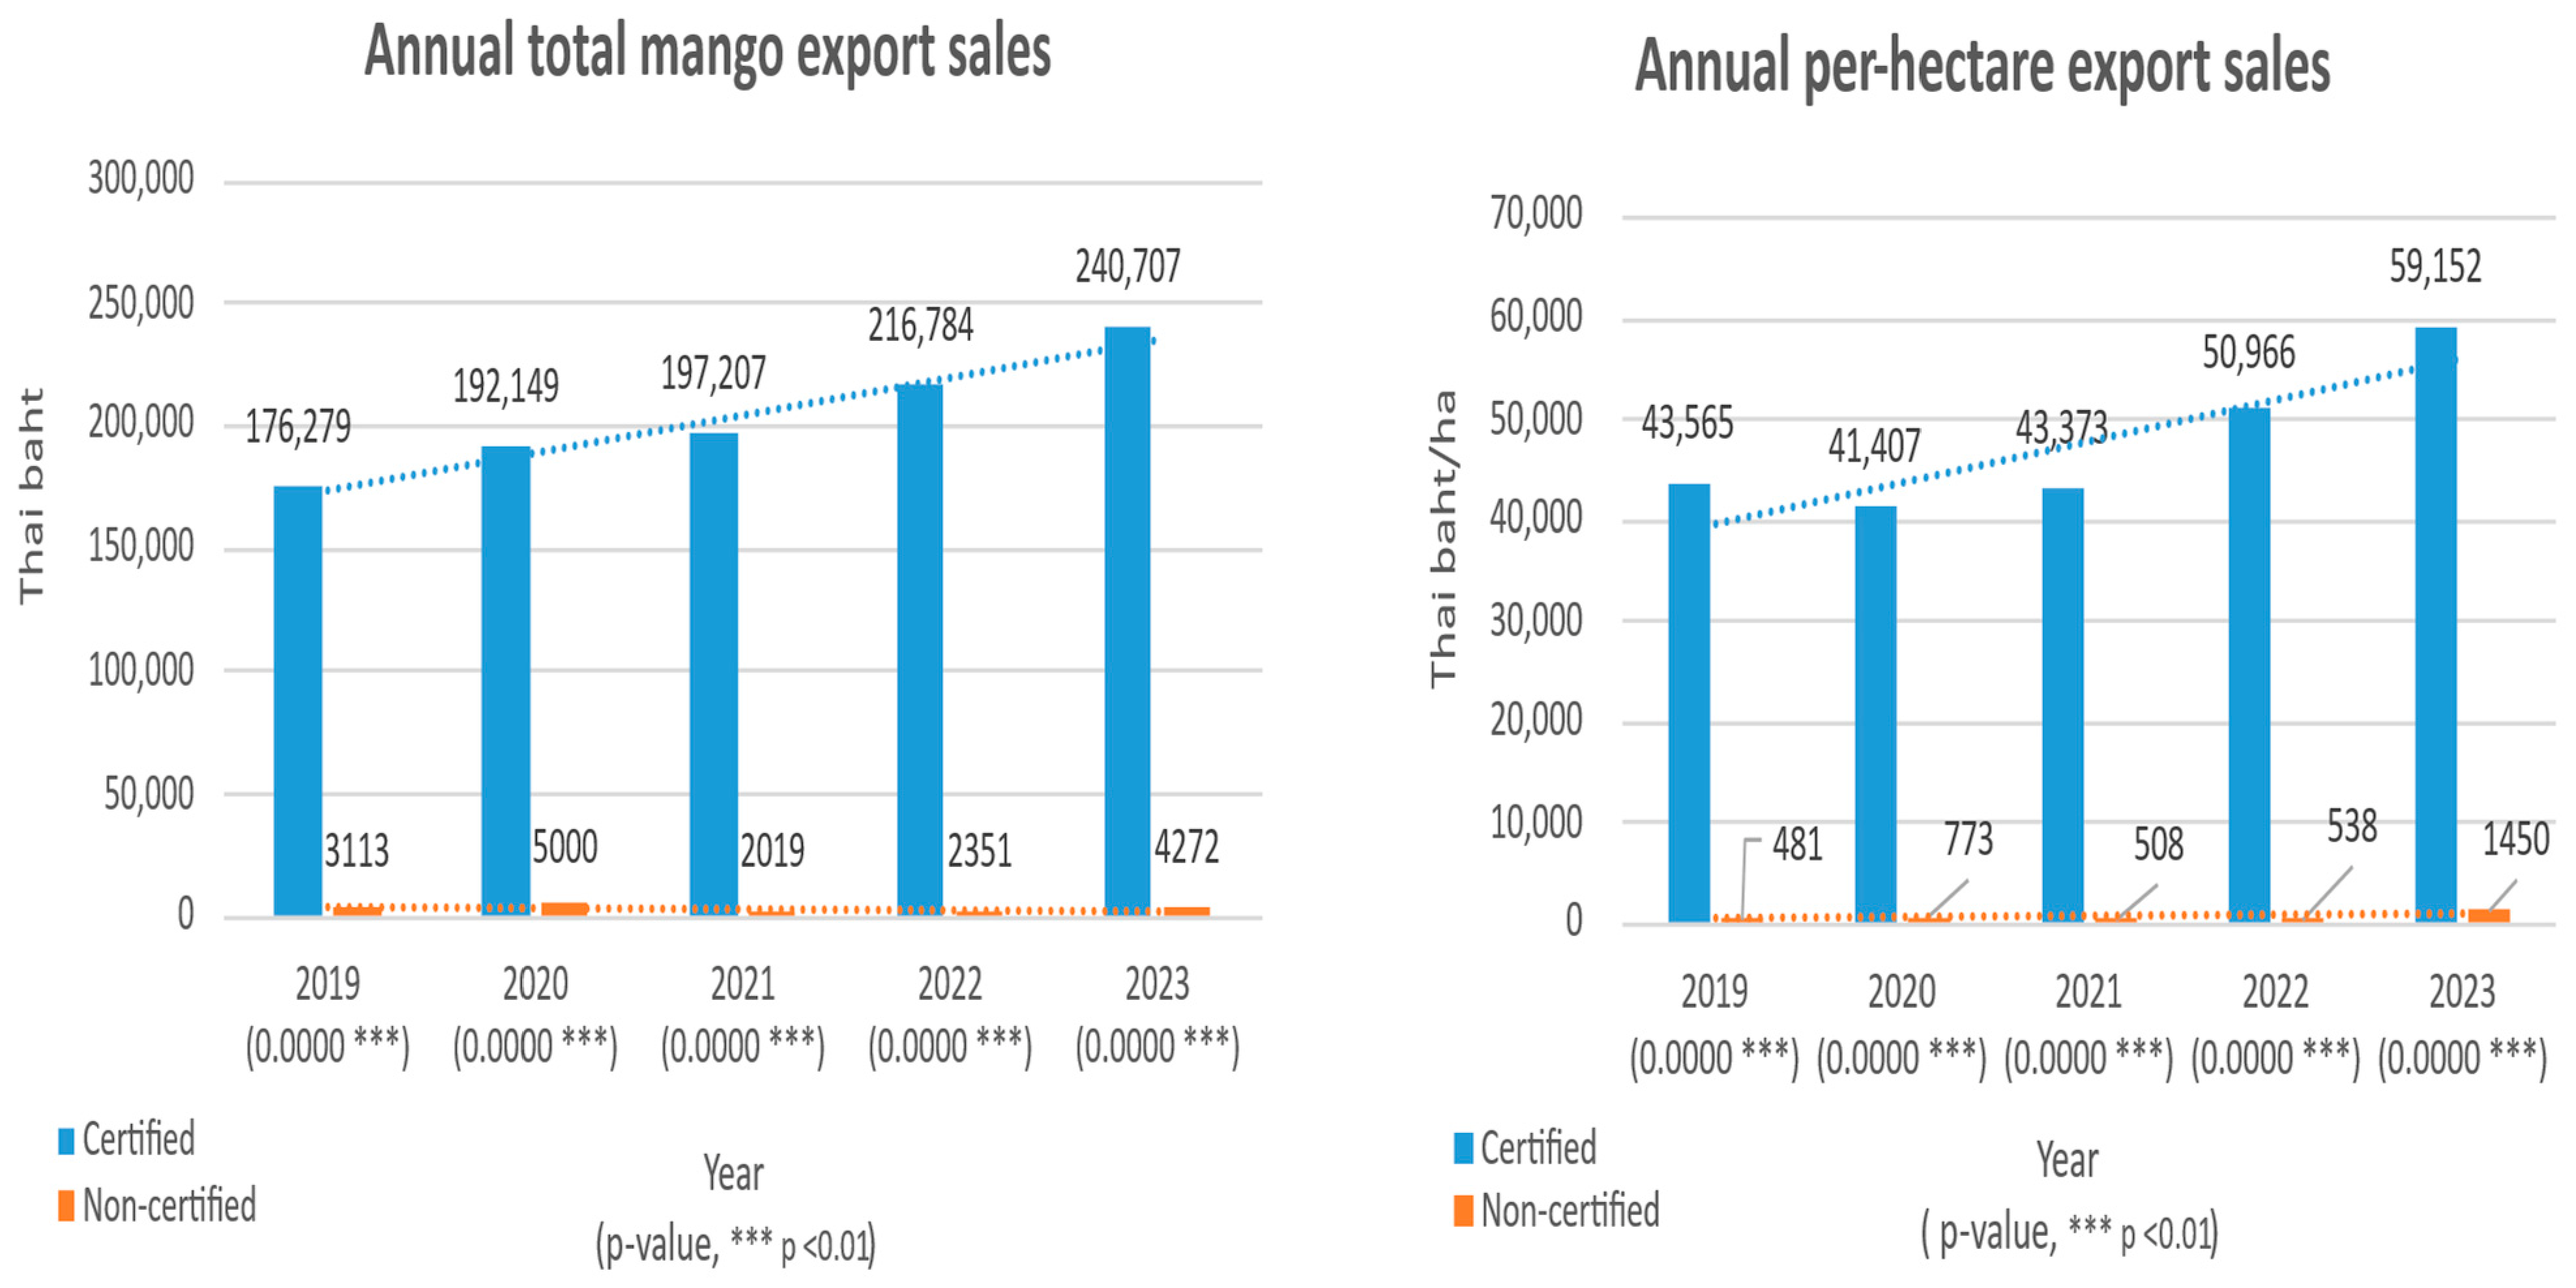
The certified farmers had significantly higher annual total export sales and per-hectare export sales compared with non-certified farmers (Figure 4). In addition to differences in market prices, this gap reflects the fact that all certified farmers export mangoes to premium destinations such as Japan and Korea, whereas only a limited number of non-certified farmers export to lower-value markets such as Malaysia.
Within the certified group, smaller farms exerted a consistently stronger influence on aggregate export sales throughout the observed period (Table A10). This pattern may reflect the substantially higher export sales per hectare achieved by smaller certified farms in premium export markets. Regarding yearly changes in export sales, larger certified farms played the leading role during the initial expansion phase in 2019–2020, whereas smaller farms contributed more strongly to export sales growth from 2020 to 2021 onward (Table A11).
Among non-certified farmers, the sharp increase in export sales in 2020 was largely driven by one large exporting farm. By contrast, the growth observed from 2022 to 2023 reflected an increase in the number of exporting farms.
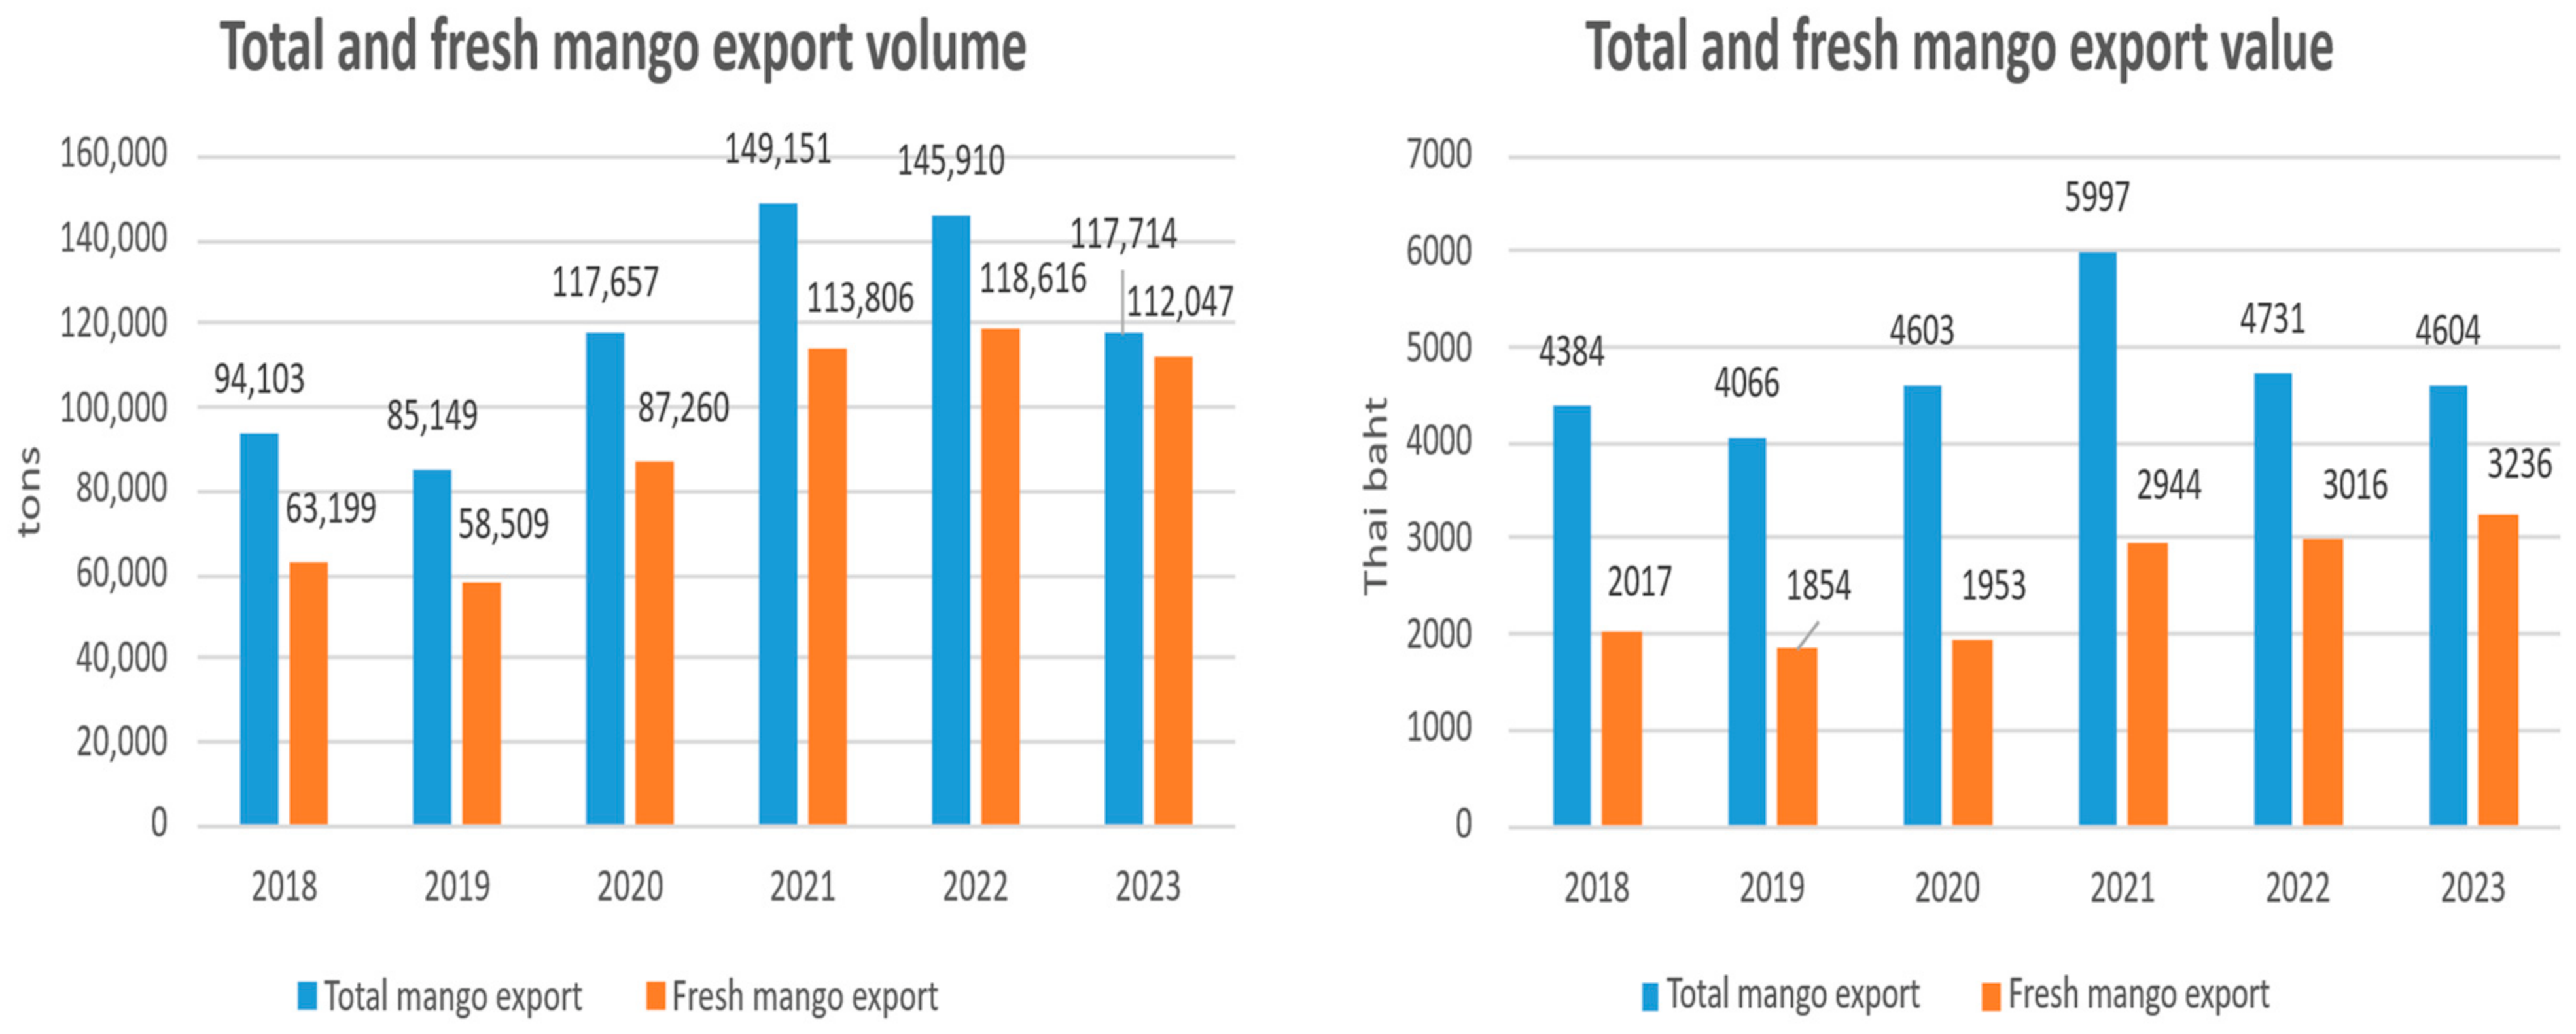
Overall, the economic outcomes of both certified and non-certified farms in our sample showed recovery trends from 2021 to 2023. However, this pattern differed from national-level trends, where most production and export indicators peaked earlier (Figure A1, Figure A2 and Figure A3). This discrepancy may partly reflect the particularly favorable local weather conditions in the study area during the recovery period, as reported by local respondents and the exporting company.

3.4. Coping Strategies of Respondent Farmers During the COVID-19 Pandemic

During the severe pandemic period of 2020–2023, significant differences were observed between certified and non-certified farmers in ten of the eleven coping strategies adopted in response to the impacts of COVID-19 on mango farming, while one strategy showed a marginally significant association (Table 4). Among these strategies, certified farmers showed significantly higher proportions for five methods, whereas non-certified farmers showed significantly higher proportions for another five methods. One additional strategy showed a marginally significant difference between the two groups. Overall, certified farmers displayed a greater tendency to adopt production- and market-oriented adjustment measures, such as planting new crops, increasing state credit loans, relying on rice farming, and engaging in mango processing businesses. Interviews further revealed that most farmers who planted crops other than mango during the pandemic did so primarily for subsistence.
Notably, none of the certified farmers reduced their investment in mango production, while more than half of the non-certified farmers did so. The finding that all certified farmers increased their state credit loans is likely related to their stronger commitment and capacity to maintain and improve export mango production and sales during the pandemic. Field observations and interview responses suggested that these borrowing practices reflected autonomous household-level financial decisions rather than collectively coordinated credit arrangements organized through producer groups or cooperatives. The high prevalence of increased reliance on state agricultural bank loans among certified farmers may also partly reflect the stronger integration of export-oriented farmers into formal agricultural financing systems. The non-certified farmers were more likely to adopt measures such as receiving remittances from migrant family members, relying on sales of other agricultural products, depending on non-farm income-generating activities, and engaging in agricultural wage labor. However, the proportions for these activities were relatively low (11.9% or less).

3.5. Farmers’ Perceptions of GAP Policy and Pesticide Use

Interviews revealed that 98.0% of the certified farmers were able to link the goal of the Q-GAP policy to food safety assurance (Table 5). In contrast, only 67 out of the 151 non-certified farmers (44.3%) reported prior knowledge of Q-GAP. Among these 67 farmers, 63 (94.0%) were able to associate the policy’s objective with food safety. Between the GAP-certified farmers and the non-certified farmers who had prior knowledge of GAP, no significant difference was observed in their ability to relate the purpose of Q-GAP to food safety assurance.
While 63.5% of the certified farmers were able to explain the concept of Integrated Pest Management (IPM), only 13.2% of the non-certified farmers could do so, representing a significant difference (p < 0.05). Both certified and non-certified farmers expressed high confidence that appropriate pesticide management protects users’ health, consumers’ health, and the environment. However, certified farmers exhibited significantly higher levels of confidence regarding these three aspects of pesticide use (p < 0.01). Additionally, a significantly higher proportion of certified farmers (55.8%) reported receiving sufficient local government support for necessary technologies or services compared to non-certified farmers (29.8%) (p < 0.01).

3.6. Respondent Farmers’ Training Experiences

Respondent farmers were asked whether they had received government training on the use of synthetic pesticides, Q-GAP, IPM, and organic fertilizer. For all four training categories, certified farmers had a significantly higher participation rate than non-certified farmers (p < 0.01) (Table 6). When non-attendees were coded as having zero training days, certified farmers also recorded a significantly higher average number of training days for both pesticide-use and Q-GAP training compared to non-certified farmers (p < 0.01). Among respondents who attended government training, including both pesticide training and Q-GAP training, certified farmers participated in significantly more training days than non-certified farmers (p < 0.01), indicating that the difference lies not only in participation rates but also in the intensity of training exposure.

3.7. Certified Farmers’ Experiences of Audit

The mean number of Department of Agriculture (DoA) audits required for certified farmers to obtain their most recent Q-GAP certification for mango was 1.91 (Table 7; see Appendix A.1 for details of the Q-GAP certification system). Among the 77 reported reasons for failing the first inspection, the most common was failure to maintain orchard cleanliness, such as overgrown plant debris, undisposed chemical containers, leftover plastic packaging, and improperly stored fertilizer bags (35.1%). This was followed by inadequate storage for chemical inputs (22.1%) and incomplete documentation (19.5%).
Although GAP audits are intended to be unannounced to ensure surprise inspections, this practice often results in inefficiencies, as auditors may arrive when farmers are absent. Consequently, 91.3% of surveyed farmers reported receiving advance notice from the DoA regarding their initial audit schedule for the latest certification. On average, farmers were informed 6.5 days in advance.
The first audit typically lasted about 45 min. In line with the protocol, DoA auditors are required to verify applicants’ record-keeping by reviewing their documentation. In practice, 93.3% of farmers reported that they were granted Q-GAP certification through these record-keeping checks, suggesting that 6.7% received certification without such checks. In addition, auditors are tasked with randomly selecting mango samples from farmers’ fields for pesticide residue testing to prevent selective submission of low-residue produce. Despite this, five farmers received Q-GAP certification without providing any mango samples, and of those who did provide samples, 95.2% were allowed to select the fruit themselves before handing it to the auditors. Among farmers who submitted mango fruits, the average number of fruits submitted per farmer was 6.5.

3.8. Synthetic Pesticide Use

A significantly higher proportion of certified farmers reported using insecticides (p < 0.01) and fungicides (p < 0.05) compared to non-certified farmers in the past year, whereas no significant difference was observed in herbicide use (Table 8; see Table A12 in Appendix A.5 for details on commonly used pesticides). With respect to the annual frequency of synthetic pesticide application, this measure should be understood as an approximate indicator of pesticide use intensity rather than a precise measure of actual exposure conditions. Certified farmers applied all three types more frequently than non-certified farmers, regardless of whether non-users were included or excluded from the calculation.

3.9. Detected Pesticide Residue Levels

Of the 14 active chemical ingredients analyzed for OP residues, one ingredient—Profenofos—was not detected in either farm type and is therefore excluded from Table 9. The proportion of farms with detected OP residues was relatively low in both groups, at 10.58% for certified farms and 4.63% for non-certified farms. Residues of all 13 active ingredients were detected in at least one certified farm, whereas non-certified farms showed residues for only nine, with no detections for Mevinphos, Monocrotophos, Prothiophos, and Azinphos-ethyl. Among the detected ingredients, only Fenitrophos exhibited a statistically significant difference in mean residue levels, with certified farmers showing higher amounts than non-certified farmers (p < 0.05). Accordingly, no significant difference was found in the overall mean residue levels.
Residues were detected for all eight active chemical ingredients examined in the PY analysis (Table 10). Unlike the OP analysis, the PY analysis showed significantly higher overall detection rates on certified farms (61.54%) compared with non-certified farms (42.38%). Significant differences in residue amounts were observed for three ingredients—λ-Cyhalothrin, Permethrin, and Fenvalerate—with certified farms exhibiting higher levels than non-certified farms (p < 0.01). Moreover, a significantly higher proportion of certified farmers had residues detected for these three ingredients compared with non-certified farmers (all Pearson chi-square tests: p = 0.000). Among certified farms, Cypermethrin had the highest detection rate (42.31%), whereas among non-certified farms, Cyfluthrin showed the highest detection rate (27.81%).
Additional analysis of farms exceeding relevant national MRL standards (Thai, Japanese, and Korean) showed that 17 certified farms (corresponding to 18 detected cases; 17.3%) and 25 non-certified farms (25 detected cases; 16.3%) exceeded at least one residue standard (Table A17; also see Table A15 and Table A16 on the national MRL standards). All exceedance cases involved pyrethroid pesticides, particularly Cyfluthrin. While non-certified farms showed more concentrated exceedance patterns, certified farms exhibited exceedance cases involving multiple pyrethroid compounds, including Cyfluthrin, Permethrin, and Fenpropathrin (see Appendix A.6 for additional analytical discussion).

3.10. Non-Synthetic Pest Management

A significantly higher proportion of certified farmers adopted at least one non-synthetic pest management method compared with non-certified farmers (p < 0.05) (Table 11). In this study, non-synthetic pest management broadly includes non-chemical weed management practices, as weeds are also treated as pests in many GAP and integrated pest management frameworks. Among the four non-synthetic pest control methods reported by respondent farmers, only mowing with a weed cutter exhibited a significant difference (p < 0.01), favoring certified farmers. The relatively limited number of methods adopted, compared with previous observations in other crop systems, may reflect a greater reliance on synthetic pesticides to manage pests in the highly commercialized context of mango production. While mowing—widely practiced in both vegetable and fruit farming—had a high adoption rate, the use of the other three methods (herbal insecticide, biological insecticide, and wood vinegar) remained quite limited among both certified and non-certified farmers. Consequently, the overall adoption of non-synthetic pest management methods in mango production is largely attributable to mowing rather than biological or botanical pest control methods.

3.11. Record-Keeping

Record-keeping practices were examined among farmers who adopted specific pest control and fertilization methods (Table 12). Significant differences were found in all five items (p < 0.01), with certified farmers generally showing higher levels of record-keeping than non-certified farmers, except in the case of herbicide use, where non-certified farmers reported higher levels of record-keeping.

3.12. Factors Affecting the Quantity of Pesticide Residue

Although the pooled test did not indicate a statistically significant difference in slope structure between certified and non-certified farms (see Appendix A.2, Step 8), the two groups were analyzed separately on an exploratory basis because they differ substantially in market orientation, institutional exposure, training experience, and pesticide management practices. The subgroup regressions are therefore presented not as strong evidence of distinct certification effects, but rather as a heuristic device for exploring potentially different patterns of association under contrasting production and marketing conditions.
Regression analysis did not identify any robust factors associated with PY-type residue levels among certified farmers, although herbicide application frequency showed a marginal relationship under the weak model fit (Table 13). Since PY residues represent pyrethroid-based insecticidal compounds rather than herbicides, this association may reflect broader pesticide management intensity rather than a direct effect of herbicide application itself. Variance Inflation Factors are low (mean VIF = 1.52), indicating no multicollinearity concerns. However, given the relatively low explanatory power and non-significant overall model fit, these associations should be interpreted cautiously as exploratory relationships rather than strong causal findings.
For non-certified farms, total pesticide frequency is not significant, while only mango yield has a significant negative association with PY residues (p < 0.05) (Table 14). With the negative coefficient of −3.08 × 10⁻⁶, the results indicate that lower mango yields are associated with higher levels of PY-type pesticide residues among non-certified farmers. VIF values are again low (mean VIF = 1.28).

4. Discussion and Conclusions

Rather than constructing a single integrated causal mechanism model, the study adopts a multidisciplinary empirical perspective to examine two related but analytically distinct dimensions of sustainability-related challenges among mango farmers under prolonged COVID-19 disruptions and GAP-related production systems. This approach is intended to provide a broader field-based understanding of both economic coping conditions and pesticide-management-related concerns among mango farmers, rather than a narrowly specified causal model.
The pesticide-use and residue-related findings reflect conditions observed during the year preceding the 2024 survey and should therefore be interpreted as a cross-sectional assessment rather than as evidence fully representative of the entire 2019–2023 period. Nevertheless, these findings may still partly capture accumulated and path-dependent management conditions associated with different market orientations and GAP-related production systems developed over preceding years.
Analysis of farm-level economic outcomes from 2019 to 2023 revealed that although yield differences were not significant, certified farms consistently achieved significantly higher aggregate production and total sales than non-certified farms over the five-year period. This advantage appears to reflect their substantially larger landholdings and the export price premiums received for certified products. These differences suggest that the superior economic outcomes observed among certified farms cannot be attributed solely to Q-GAP certification itself, but also reflect structural differences in farm size, export linkage, and market orientation between the two groups. Indeed, these structural differences partly reflect the study’s intentional focus on export-oriented certified farms linked to premium overseas markets.
In economic coping with COVID-19 effects, several significant gaps between certified and non-certified farmers were observed. Certified farmers tended to rely on rice farming, plant new crops, increase agricultural credit borrowing from the state agricultural bank, and engage in mango processing activities. Meanwhile, non-certified farmers emphasized reducing investment in mango production to maintain cost savings. It is also worth noting that while 57.7% of certified farmers engaged in online sales by leveraging the social capital of their producer groups, none of the non-certified farmers engaged in online sales. The coping strategies adopted by certified farmers suggest a more adaptive and diversification-oriented response pattern supported by stronger institutional, financial, and organizational linkages embedded in export-oriented organized production systems. By contrast, non-certified farmers relied more heavily on defensive cost-reduction strategies, reflecting more limited adaptive resources and market flexibility associated with weaker social and institutional network support.
The analysis of economic resilience related to production, yields, and on-farm (export) sales revealed dynamic changes in the role of farm size within both certified and non-certified groups during the COVID-19 period. Among export-oriented certified farms, larger farms played a leading role in sustaining production and sales during the initial disruption phase (2019–2020), suggesting that they functioned as important shock absorbers under early pandemic conditions. Supported by premium export linkages, scale advantages, established export channels, and greater logistical capacity, these larger farms appeared relatively well positioned to cope with the initial shock.
From 2021 onward, however, smaller certified farms became increasingly important, particularly in terms of yield recovery, total sales, and export sales per hectare. This suggests a phase-dependent differentiation of resilience within the certified sector, in which larger farms contributed more strongly to initial stability, whereas smaller farms played a greater role during the subsequent recovery and adjustment process. The resilience of smaller certified farms also appeared to be associated with higher land-use efficiency, more intensive management, closer quality control, and stronger adaptation to premium export market requirements.
In contrast, non-certified farms exhibited different dynamics. Smaller farms showed relatively stronger contributions within the production structure, whereas larger farms remained more influential in the sales structure. This may suggest that production resilience and market resilience were structurally separated within the non-certified sector. Particularly within domestic market systems, larger farms may have been better positioned to maintain sales resilience through advantages in bulk delivery, transport efficiency, and the spreading of transaction costs. Nevertheless, the contribution of smaller non-certified farms gradually expanded after the initial disruption phase, indicating that small-scale farmers also demonstrated adaptive responses during the later stages of the pandemic and subsequent adjustment process.
Overall, these findings suggest that economic resilience in export-oriented horticulture is not concentrated in a single farm type, but rather emerges through changing complementarities between larger and smaller farms under different market and crisis conditions. More broadly, the findings indicate that resilience in this context emerged through dynamic interactions among farm size, market structure, and different phases of the pandemic, suggesting that economic resilience may be understood as a relational, phase-dependent, and structurally distributed phenomenon.
Regarding certified farmers’ perceptions, knowledge, training experience, and record-keeping practices related to GAP, IPM, and pesticide management, it is not surprising that certified farmers showed significantly superior results compared with non-certified farmers. Moreover, certified farmers demonstrated significantly higher confidence regarding the possible effects of pesticide use on the health of users, consumers, and the environment. This finding contrasts with a previous study on domestic market-oriented cabbage farmers, in which non-certified farmers showed higher confidence regarding these issues [21].
It appears somewhat counterintuitive that certified farmers showed superior cognitive and management-related results while simultaneously exhibiting higher adoption rates of the three pesticide types than non-certified farmers. This contrasts with findings from the previous study on domestic market-oriented cabbage production, which reported significantly higher adoption of all three pesticide types among non-certified farmers [21]. In the present study, certified mango farmers also showed significantly more frequent insecticide and fungicide applications. These cases may suggest that greater confidence regarding pesticide-related risks does not necessarily contradict greater pesticide use.
Regarding the OP pesticide residue analysis, the proportion of farms with detectable residues was low for both groups (<11%), and no significant differences were observed in the aggregate mean detected residue levels. In contrast, the PY results showed detections in approximately 61.5% of certified farms and 42.4% of non-certified farms, with certified farms exhibiting a significantly higher aggregate mean detected residue level than non-certified farms.
The MLR results for PY-type pesticide residues showed that herbicide application frequency was marginally associated with PY-type residue levels among certified farmers, whereas lower mango yields were significantly associated with higher PY-type residue levels among non-certified farmers. Since PY residues represent pyrethroid-based insecticidal compounds, the marginal association between herbicide application frequency and PY-type residues among certified farmers should not be interpreted as a direct causal effect of herbicide application itself. Rather, herbicide application frequency may serve as a proxy indicator of more intensive pesticide management practices associated with PY-type residues. Meanwhile, the negative association between mango yields and PY-type residues among non-certified farmers may reflect less effective pest management or differences in farm management conditions among lower-yield farms. Further, these findings should be interpreted as exploratory rather than conclusive, as the pooled test did not indicate a statistically significant difference in slope structure between certified and non-certified farms, and the regression results for certified farms exhibited weak model fit.
Although certified farmers demonstrated significantly higher levels of Q-GAP- and IPM-related training and knowledge, they also reported higher rates of pesticide adoption, more frequent pesticide applications, and higher PY residue levels. This apparently paradoxical pattern may reflect the strong market and cosmetic pressures associated with premium export markets such as Japan and Korea, where visual appearance, surface quality, and cosmetic standards are strictly emphasized. Under such conditions, certified farmers may engage in more intensive but technically controlled pesticide management in order to minimize visible pest damage while maintaining compliance with residue-related requirements.
The results concerning the implementation of the Q-GAP audit system also warrant careful attention. In the present study, approximately 91% of certified farmers reported receiving advance notice before the first audit, while approximately 95% reported that crop samples were handed directly by farmers to auditors. Compared with previous studies on Q-GAP systems, in which the corresponding figures for advance notice and direct farmer-to-auditor sample handover were reported as 58% and 18% (n = 98) for durian farmers, 100% and 10% (n = 41) for cabbage farmers, and 56% and 71% for chili pepper farmers (n = 100), respectively [21,22,23], the mango-sector results observed in this study appear particularly high. These findings may suggest important institutional limitations in the field-level implementation of Q-GAP monitoring and residue-control mechanisms within export-oriented mango supply chains. Given that the certified farms in this study were primarily linked to premium overseas markets such as Japan and Korea, where food safety and residue-control requirements are relatively stringent, these implementation patterns may reflect a structural contradiction between export-oriented food safety governance and the practical operation of field-level audit systems.
Overall, this study suggests that economic advantages and adaptation patterns observed among certified mango farmers during the COVID-19 disruptions were not independent from the ecological implications associated with pesticide use practices. Rather, both outcomes appear to have emerged from the same export-oriented production structure. Integration into premium export markets provided farmers with higher prices and more flexible marketing responses under crisis conditions, thereby strengthening their economic coping capacity. However, the same market orientation also generated stronger pressures for cosmetic quality maintenance and export-standard compliance, potentially encouraging more intensive pesticide applications despite higher levels of GAP- and IPM-related training and knowledge. In this sense, the study highlights a structural tension embedded in export-oriented horticultural production systems, whereby the institutional and market mechanisms supporting economic resilience may simultaneously reinforce ecological and pesticide-related pressures. In this context, the Q-GAP certification system functions not only as a food safety and export governance mechanism, but also as an institutional arrangement that mediates both the economic advantages and ecological pressures associated with premium export agriculture.
Several practical implications emerge from this study. First, the results highlight the importance of strengthening field-level verification within the Q-GAP audit system through more random on-farm residue sampling, closer verification of pesticide application records, and stronger traceability between farm-level practices and export supply chains. Second, closer coordination among exporters, producer organizations, and extension agencies is necessary to develop pesticide management approaches that can satisfy premium export standards while reducing excessive reliance on chemical-intensive quality control practices. In particular, premium export systems may require institutional mechanisms that better balance cosmetic quality requirements with sustainable pesticide management, for example through strengthened residue-monitoring systems, differentiated quality standards, or incentive structures rewarding reduced pesticide dependence.
The findings also suggest that small non-certified farmers may play important adaptive roles during the later stages of economic disruption and post-crisis adjustment processes. Although larger non-certified farms remained more influential in maintaining sales resilience within domestic market systems, the contribution of smaller non-certified farms gradually expanded after the initial disruption phase, indicating their adaptive capacity under changing market conditions. In this context, local extension agencies may contribute not only by promoting certification itself, but also by strengthening the adaptive capacities of small-scale non-certified farmers through support for flexible marketing strategies, locally adapted pest-management practices, and diversified livelihood opportunities.
More broadly, the study raises important questions regarding the relationship between economic resilience and ecological sustainability in export-oriented horticulture. Resilience-enhancing export-market structures may simultaneously generate new ecological vulnerabilities through intensified pesticide dependence and quality-control pressures. Future research should therefore investigate how export-market orientation, farm-size structures, and certification systems (e.g., Japanese/Korean premium markets versus European markets, larger versus smaller farms, and Q-GAP versus GlobalGAP) shape the relationship between economic resilience and pesticide management practices in horticultural production systems.
Finally, limitations of this research must be noted. The economic data on farmers’ retrospective recollections collected during the 2024 survey, and farm-level accounting records or export documents could not be systematically verified. Therefore, the annual production and sales figures should be interpreted as approximate indicators of comparative trends and relative differences rather than precise accounting values. Due to time constraints during mango sampling in the peak harvest season, we relied on crop samples collected by the respondent farmers themselves after providing them with guidance on the sampling procedure. Ideally, the samples would have been collected directly by the research team in the orchards; however, this was not feasible given the wide geographic distribution of the surveyed farms and the limited available time during the harvest period. Although farmers were instructed to collect samples randomly from different locations within their orchards, the possibility of intentional or unintentional selection effects cannot be completely excluded. In particular, differences in residue awareness, market orientation, and export-related quality concerns between certified and non-certified farmers may have influenced the sample selection process. Accordingly, the residue-related findings should be interpreted with appropriate caution. Additionally, information on pesticide use and record-keeping was based on farmers’ self-reports during the interviews rather than on direct examination of their record-keeping books. These factors may have introduced some degree of bias into the collected data. Furthermore, because the longitudinal economic analysis relied primarily on year-by-year comparative statistics rather than formal panel-data modeling, the resilience-related findings should be interpreted as descriptive longitudinal patterns rather than rigorous causal estimates of dynamic adaptation processes. Lastly, since the PY residue data included a considerable proportion of undetected or near-zero observations, the regression analysis may have been affected by left censoring and non-normal distributional characteristics. In such cases, more advanced approaches for handling partially zero-inflated residue data, such as censored, hurdle, or zero-inflated models, may provide more rigorous statistical treatment in future research.

Author Contributions

Conceptualization, Y.A., P.T. (Panamas Treewannakul), and S.H.; Writing—original draft, Y.A.; Writing—review and editing, Y.A., U.J., K.B., and S.H.; Software—statistical analysis, Y.A., Software—pesticide residue determination, P.T. (Phannika Tongchai) and P.J.; Validation, N.L., P.Y., P.T. (Phannika Tongchai), and Y.A.; Formal analysis—statistical analysis, Y.A.; Formal analysis—pesticide residue determination, U.J., K.B., S.H., and P.T. (Phannika Tongchai); Investigation—preliminary, Y.A. and P.T. (Panamas Treewannakul); Investigation—main, P.T. (Phannika Tongchai), S.H., U.J., P.Y., K.B., P.J., S.Y., and N.L.; Visualization—maps and statistical data, Y.A.; Visualization—pesticide residue analysis figures, U.J., P.T. (Phannika Tongchai), P.Y., and K.B.; Supervision, Y.A., S.H., P.T. (Phannika Tongchai), and S.Y.; Project administration, Y.A. and S.H. All authors have read and agreed to the published version of the manuscript.

Funding

This research was supported by the Japan Society for the Promotion of Science (JSPS) KAKENHI Grant Number 23K27014.

Institutional Review Board Statement

The study protocol was reviewed and approved by the Human Experimentation Committee (HEC) of the Research Institute for Health Sciences, Chiang Mai University (Certificate Nos. 23/2024 and 23/2025; approved on 24 April 2024).

Data Availability Statement

The data presented in this study are available on request from the corresponding authors.

Acknowledgments

The authors wish to extend their sincere appreciation to the officers of the DoA Chiang Mai Office and the DoAE offices in Chiang Mai Province, as well as to the CEO of the exporting company and the leaders of the mango growers’ group, for their invaluable support and facilitation in enabling the research team’s access to the study sites. The authors are also deeply grateful to the participating mango farmers for their generous cooperation during the interviews. Furthermore, the authors gratefully acknowledge Chiang Mai University for providing access to its facilities for pesticide residue analyses and related laboratory work. The authors would also like to express their sincere gratitude to the three anonymous reviewers for their valuable comments and suggestions, which greatly helped improve the manuscript.

Conflicts of Interest

The authors declare no conflicts of interest.

Appendix A

Appendix A.1. Certification Procedure of Q-GAP Standard (TAS 9001–2013)

The TAS 9001–2013 certification is valid for three years. During the application process, auditors from the Department of Agriculture (DoA) conduct one to three inspections of the applicant’s farming operations and practices within the first year. Crop and soil samples are taken for laboratory analysis to check for pesticide residues. If residue levels exceed the permissible limits, certification is denied. Should the applicant fail all three audits, they are barred from reapplying for one year. To maintain certification, farmers must submit a renewal application at least 120 days before the current certification expires [22].

Appendix A.2. Variable Screening and Model Simplification Process for the MLR

  • Step 1. Initial specification
The model specification began by identifying 23 candidate explanatory variables, starting with “Age” as shown below.
Table A1. Variable definitions.
Variable DescriptionDescriptionUnit/ScaleTypePurpose
PYDetected residuemg/kgContinuousDependent
Farm typeGAP certification
(1 = certified, 0 = non-certified)
BinaryGroupingSubsample identifier
AgeAge of the main household mango producerYearsContinuousSocio-demographic
EducationYears of schoolingYearsContinuousSocio-demographic
Total farm sizeTotal farm areaHectareContinuousFarm production
Mango farm sizeMango cultivation areaHectareContinuousFarm production
Mango yieldMango production per unit areakg/haContinuousFarm production
Per hectare mango salesMango sales per unit areaBaht/haContinuousFarm economic
Know about IPMKnowledge of IPM
(1 = yes, 0 = no)
BinaryNominal/dummyKnowledge
No harm producer healthPerceived concern for producer health (1 = yes, 0 = no)BinaryNominal/dummyAttitude
No harm consumer healthPerceived concern for consumer health (1 = yes, 0 = no)BinaryNominal/dummyAttitude
No harm environmentPerceived concern for environment
(1 = yes, 0 = no)
BinaryNominal/dummyAttitude
Received government supportReceived government support (1 = yes, 0 = no)BinaryNominal/dummyInstitutional support
Training on pesticide useTraining on pesticide use (1 = yes, 0 = no)BinaryNominal/dummyTraining experience
Training on Q-GAPTraining on Q-GAP (1 = yes, 0 = no)BinaryNominal/dummyTraining experience
Training on organic fertilizerTraining on organic fertilizer (1 = yes, 0 = no)BinaryNominal/dummyTraining experience
Training on IPMTraining on IPM
(1 = yes, 0 = no)
BinaryNominal/dummyTraining experience
Number of training days on QGAPDays of Q-GAP trainingDaysContinuousTraining experience
Number of training days on pesticideDays of pesticide trainingDaysContinuousTraining experience
InsectuseInsecticide use
(1 = yes, 0 = no)
BinaryNominal/dummyBehavioral
FunguseFungicide use
(1 = yes, 0 = no)
BinaryNominal/dummyBehavioral
HerbuseHerbicide use
(1 = yes, 0 = no)
BinaryNominal/dummyBehavioral
Freq_insectAnnual insecticide use frequencyTimesContinuousBehavioral
Freq_fungAnnual fungicide use frequencyTimesContinuousBehavioral
Freq_herbAnnual herbicide use frequencyTimesContinuousBehavioral
  • Step 2. Initial multicollinearity diagnostics (VIF screening)
We computed Variance Inflation Factors (VIFs) to diagnose potential multicollinearity across the 23 candidate explanatory variables. The diagnostics revealed that for certified farms (FT = 1), total farm size and mango farm size exhibited VIF values around 20, indicating severe collinearity. For non-certified farms (FT = 0), know about IPM and training on IPM exceeded 20, reflecting both conceptual and empirical overlap. Based on these findings, we orthogonalized the area variables by using the residuals of mango farm size regressed on total farm size (mfs_resid). We also reduced the IPM-related variables to a single non-overlapping indicator, know about IPM. know about IPM was retained as the single indicator because it captures the respondent’s basic knowledge of IPM without overlapping conceptually with other training variables. We did not choose training on IPM as it exhibited a higher VIF than know about IPM and was also more likely to function as a mediator rather than a confounder in the relationship between pesticide-use frequency and PY.
  • Step 3. Removing uninformative pesticide-use “dummy” indicators
At this stage, we tested whether the binary “any-use” dummy variables (insectuse, funguse, and herbuse) provided additional explanatory power beyond application frequency. Using a pooled model that included freq_total, the three dummies, and controls, we jointly tested the dummy coefficients. The joint F-test yielded F(3, 245) = 1.74, p = 0.158, so we fail to reject the null hypothesis that all three dummy coefficients are zero once frequency is controlled. Although funguse is individually significant (p = 0.025), the block as a whole is not, indicating that the extensive-margin indicators add no systematic explanatory power beyond the intensity measure. Accordingly, all pesticide-use dummy variables were removed at this stage. In contrast, the frequency variable was retained because it becomes an informative predictor in the split-sample specifications (FT = 1 and FT = 0) used in subsequent steps.
  • Step 4. Correlation structure of the three pesticide-use frequency variables
Identification of a high correlation among pesticide use frequency variables (freq_insect, freq_fung, and freq_herb) helped identify multicollinearity and reduce over-parameterization through consolidation. We examined their correlation patterns separately for the two farmer types. For certified farms (FT = 1), the correlation between insecticide and fungicide applications was moderately strong (r = 0.6935, p < 0.001), but herbicide use was uncorrelated with insecticide (r = 0.0734, ns) and fungicide frequency (r = 0.0986, ns). Thus, while insecticide and fungicide uses can be combined into one dimension, herbicide use represents a separate application pattern that should be modeled independently. For non-certified farms (FT = 0), insecticide and fungicide application frequencies were moderately correlated (r = 0.5979, p < 0.001), while herbicide frequency showed only weak correlations with either of the two (r ≈ 0.11, ns). These patterns indicate that, for both certified and non-certified farms, insecticide and fungicide applications load onto a single underlying usage dimension (freq_insectfung), whereas herbicide use represents a distinct and independent component.
  • Step 5. Consolidation of the three pesticide-use frequency variables
Because the three frequency counts (insecticide, fungicide, and herbicide applications) were highly correlated and conveyed overlapping information, including all three simultaneously risked near-multicollinearity and over-parameterization—especially in the certified subsample (FT = 1, N = 104). To reduce dimensionality and obtain a stable measure of pesticide-use intensity, we compared alternative frequency specifications using AIC/BIC. The results indicated that a single composite index (freq_total) was preferred for non-certified farms (FT = 0), whereas a two-variable structure—combining insecticide and fungicide applications into one measure and retaining herbicide separately—was preferred for certified farms (FT = 1). This step established the final pesticide-use intensity measure(s) used in the subsequent analyses.
  • Step 6. Model selection based on AIC/BIC
Following the correlation-based consolidation, we compared alternative specifications of pesticide-use intensity using Akaike Information Criterion (AIC) and Bayesian Information Criterion (BIC). Before comparing alternative frequency specifications, we first reduced the full set of covariates to a parsimonious baseline model, retaining only theoretically essential controls (age, education, farm size, mango yield, and per-hectare mango sales). This ensured that the AIC/BIC comparison evaluated the pesticide-use measures within a stable and non-overparameterized specification. The results showed that, for the certified subsample (FT = 1), the two-variable specification (freq_insectfung and freq_herb) should be preferred over the single index (freq_total), as AIC was lower for the two-variable model than for the single-index model (−502.09 vs. −499.68), while BIC values were very similar and slightly favoured the single-index model (−480.94 vs. −481.17). Additionally, in the FT = 1 model, herbicide frequency is statistically significant (p = 0.046), whereas freq_insectfung remains non-significant (p = 0.837), indicating that only herbicide applications are predictive within certified farms. For non-certified farms (FT = 0), the one-variable frequency index produced lower AIC/BIC values (−699.97 vs. −698.42 for AIC and −678.85 vs. −674.28 for BIC), making the single-index specification preferable to the two-variable alternative.
  • Step 7. Screening the training/knowledge block
  • Certified farms (FT = 1)
We examined whether the training/knowledge block provides additional explanatory power beyond the pesticide-use frequency variables (split into freq_insectfung and freq_herb) and the standard controls. The original block contained nine indicators; however, no harm consumer health was automatically dropped due to collinearity, leaving eight variables in the estimated model. The inclusion of these eight training/knowledge variables produces a jointly significant block (F(8,88) = 3.81, p = 0.0007). Nevertheless, most individual indicators are not statistically strong on their own; only training on pesticide use shows a marginal negative effect (p = 0.087). This implies that the block reflects a joint pattern rather than any single robust predictor. Model fit, however, deteriorates when the training/knowledge block is added. The AIC for the augmented model (−497.28) is higher than for the more parsimonious two-frequency model (−502.09) and also worse than for the single-index frequency specification (−499.68). Given the relatively small sample size (N = 104), this suggests over-parameterization. Overall, the training/knowledge block does not improve the explanatory power of the FT = 1 model and is therefore not retained in the main specification.
  • Non-certified farms (FT = 0)
We next tested whether the full set of training and knowledge variables—including no harm consumer health, which was dropped from the FT = 1 model—adds explanatory value beyond the baseline frequency specification. In this expanded model, freq_total is not significant (p = 0.277), most controls remain insignificant, and mango yield shows only a weak marginal effect (p = 0.049). The joint F-test also indicates that the nine-variable training/knowledge block is not significant (F(9,135) = 1.25, p = 0.268). Model fit similarly worsens relative to the simpler FT = 0 baseline (AIC −695.3 vs. −700.0; BIC −647.0 vs. −678.8). As in the FT = 1 case, adding the training/knowledge block does not enhance explanatory power and leads to over-parameterization. Accordingly, this block should also be excluded from the FT = 0 main model.
  • Step 8. Testing group differences in frequency effects
  • 8-A. Pooled test of slope heterogeneity across farm type
We estimated a pooled OLS model with robust standard errors including farmtype, freq_total, and their interaction to test whether the effect of pesticide-use frequency differs by certification status. The interaction term (farmtype#c.freq_total) is not significant (t = −0.65; F-test p = 0.518), so we fail to reject the null hypothesis of equal slopes across groups. Neither the main effect of frequency (p = 0.191) nor the farm type indicator (p = 0.353) is significant, and most control variables are likewise insignificant, with only mango yield showing a borderline effect (p = 0.065). The overall model fit is weak (F(8,246) = 2.17, p = 0.0306; R2 = 0.056). These results indicate no statistical evidence that the frequency–PY relationship differs between certified and non-certified farms. Thus, a common frequency slope is acceptable in pooled models, and the previously observed within-group differences should be interpreted as exploratory patterns rather than statistically validated heterogeneity.
  • 8-B. Pooled model with farm type–herbicide-frequency interaction
We next estimated a pooled OLS specification including the two frequency measures (freq_insectfung and freq_herb), along with their interaction with farm type, to assess whether herbicide responses differ by certification status. We only tested the farm type interaction for herbicide frequency because the pooled model already showed no slope heterogeneity for total pesticide frequency (and therefore for its main component, freq_insectfung), while the split-sample estimates suggested that herbicide effects might differ by certification status. The interaction between farm type and herbicide frequency is positive and just statistically significant (coef = 0.00227, p = 0.049), while the baseline herbicide slope for non-certified farms is not significant (−0.00049, p = 0.545). This implies an estimated combined effect of approximately 0.00178 (= −0.00049 + 0.00227) for certified farms—consistent with the FT = 1 split-sample result, where herbicide frequency was significant as observed in Step 6 (p = 0.046). By contrast, the combined insecticide–fungicide frequency remains non-significant (p = 0.287). Overall model fit is modest (F(9,245) = 2.04, p = 0.035; R2 = 0.067), and most controls remain insignificant, with only mango yield showing a borderline effect (p = 0.089). Only the herbicide-frequency component shows statistically detectable slope heterogeneity by farm type—i.e., herbicide applications matter for certified farms but not for non-certified ones—whereas the insecticide–fungicide component shows no evidence of differential effects.
  • Step 9. Robustness check
  • Certified farms (FT = 1)
Six observations were identified as outliers in the studentized residuals (2.24, 3.80, 2.63, 3.32, 2.40, 2.27), although none reached a level that would undermine the model. Five observations exceeded the 2 × mean leverage cutoff of 0.2514 (0.270, 0.273, 0.288, 0.300, 0.437), all remaining within generally acceptable ranges, with only one overlapping with the set of outliers. Based on the Cook’s distance threshold of 4/n = 4/104 ≈ 0.03846, seven observations exceeded this value (0.0957, 0.0588, 0.0671, 0.0994, 0.0681, 0.2578, 0.1125), with only one slightly exceeding 0.25 (0.2578). Key regression results—including Prob > F, R2, coefficients, and significance levels—remained virtually unchanged when HC1 rather than HC3 standard errors were applied, indicating strong robustness.
  • Non-certified farms (FT = 0)
Three observations were identified as outliers, two exceeding a value of 3 (2.33, 4.19, 12.18). Only three points surpassed the 2 × mean leverage cutoff of 0.13935 (0.612, 0.483, 0.151), with no overlap with outliers. Using the Cook’s distance threshold of 4/n = 4/151 ≈ 0.02649, seven observations exceeded this value (0.0271, 0.1173, 0.0280, 0.0326, 0.0403, 1.0822, 0.0351), with only one exceeding 0.25 (1.0822). This extreme Cook’s D corresponds to the observation with the highest studentized residual (12.18). Excluding this point does not alter the main results: ‘mango yield’ remains the only statistically significant predictor, freq_total remains non-significant, and the model’s overall F-statistic and R2 remain virtually unchanged. HC1–HC3 comparisons likewise confirm the robustness of the estimates.

Appendix A.3. National Mango Production and Export Trends in Thailand, 2018–2023

Figure A1. Number of mango farms (left) and total mango cultivation area (ha) (right) in Thailand, 2018–2023. Compiled from [25].
Agriculture 16 01167 g0a1
Figure A2. Total mango production (tons) (left) and yield (kg/ha) (right) in Thailand, 2018–2023. Source: Compiled from [25].
Agriculture 16 01167 g0a2
Figure A3. Total and fresh mango export volume (tons) (left) and value (right), 2018–2023. Source: Compiled from [26].
Agriculture 16 01167 g0a3

Appendix A.4. Comparative Production, Sales, and Export Outcomes by Farm Certification and Farm Size, 2019–2023

Table A2. Comparison of total production (ratio of means) and estimated total (mean of ratios × farm size) for certified farms, 2019–2023.
Variable Description20192020202120222023
Total production [a]15,901.9218,333.6518,121.1519,009.6219,875.00
Per-hectare yield × farm size [b] 17,854.0817,979.2617,896.1119,562.4721,763.80
Gap between [a] and [b] (%)−10.93%1.97%1.26%−2.83%−8.68%
Note: All production values are in kilograms. Gap between [a] and [b] (%) = (([a] − [b])/[b]) × 100.
Table A3. Comparison of total production (ratio of means) and estimated total (mean of ratios × farm size) for non-certified farms, 2019–2023.
Variable Description20192020202120222023
Total production [a]7103.316866.767250.138736.5610,902.65
Per-hectare yield × farm size [b] 7312.916991.677423.989288.5611,424.32
Gap between [a] and [b] (%)−2.87%−1.79%−2.34%−5.94%−4.56%
Note: All production values are in kilograms. Gap between [a] and [b] (%) = (([a] − [b])/[b]) × 100.
Table A4. Comparison of annual rate of change in total and per-hectare production of certified farms, 2019–2023.
Variable Description2019–20202020–20212021–20222022–2023
Total production (% change) [a]15.29−1.164.904.55
Per-ha production (% change) [b]0.70−0.469.3111.25
Gap between [a] and [b] (%)14.59−0.69−4.40−6.70
Note: Gap between [a] and [b] (%) represents the difference between total and per-hectare annual changes, calculated as [a] − [b].
Table A5. Comparison of annual rate of change in total and per-hectare production of non-certified farms, 2019–2023.
Variable Description2019–20202020–20212021–20222022–2023
Total production (% change) [a]−3.335.5820.5024.79
Per-hectare production (% change) [b]−4.394.6225.1222.99
Gap between [a] and [b] (%)1.060.96−4.611.80
Note: Gap between [a] and [b] (%) represents the difference between total and per-hectare annual changes, calculated as [a] − [b].
Table A6. Comparison of total sales, scaled sales estimates, per-hectare sales, and export shares by farm size for certified farms, 2019–2023.
Variable Description20192020202120222023
Total sales (THB) [a]249,644.20265,326.90253,360.60284,480.80345,192.30
Per-hectare sales × farm size (THB) [b] 338,566.87342,107.50314,016.20368,930.60435,909.20
Gap between [a] and [b] (%)−26.26−22.44−19.32−22.89−20.81
Mean sales per hectare of larger farms (THB) [c] 6767.818405.098073.668408.699547.38
Mean sales per hectare of smaller farms (THB) [d] 11,806.4210,533.919349.1211,943.5214,456.92
Gap between [c] and [d] (%)−74.45−25.31−15.82−42.02−51.41
Export share of larger farms in total sales (%) [e]83.2774.6782.3681.2376.71
Export share of smaller farms in total sales (%) [f]77.6478.6485.9182.7283.57
Gap between [e] and [f] (%)5.63−3.97−3.55−1.49−6.86
Note: Gap between [a] and [b] (%) = (([a] − [b])/[b]) × 100. Larger farms: mango land size > median; Smaller farms: ≤ median. Gap between [c] and [d] (%) = (([c] − [d])/[c]) × 100. Gap between [e] and [f] (%) = [e] − [f], expressed in percentage points.
Table A7. Comparison of total sales, scaled sales estimates, and per-hectare sales by farm size for non-certified farms, 2019–2023.
Variable Description20192020202120222023
Total sales (THB) [a]85,142.3882,331.1390,860.26112,717.90144,664.90
Per-hectare sales × farm size (THB) [b] 76,643.6373,252.3783,232.02114,234.93131,597.70
Gap between [a] and [b] (%)11.0812.389.16−1.339.95
Mean sales per hectare of larger farms (THB) [c] 30,569.3431,016.0834,251.9942,695.6555,157.54
Mean sales per hectare of smaller farms (THB) [d] 26,929.8923,962.6428,203.8335,499.9743,604.18
Gap between [c] and [d] (%)13.5129.4521.4420.2726.50
Note: Gap between [a] and [b] (%) = (([a] − [b])/[b]) × 100. Larger farms: mango land size > median; Smaller farms: ≤ median. Gap between [c] and [d] (%) = (([c] − [d])/[c]) × 100.
Table A8. Comparison of annual rate of change in total and per-hectare sales of certified farms, 2019–2023.
Variable Description2019–20202020–20212021–20222022–2023
Total sales (% change) [a]6.28−4.5112.2821.13
Per-hectare sales (% change) [b]1.01−8.2117.4918.15
Gap between [a] and [b] (%)5.273.70−5.202.98
Note: Gap between [a] and [b] (%) represents the difference between total and per-hectare annual changes, calculated as [a] − [b].
Table A9. Comparison of annual rate of change in total and per-hectare sales of non-certified farms, 2019–2023.
Variable Description2019–20202020–20212021–20222022–2023
Total sales (% change) [a]−3.3010.3624.0628.34
Per-hectare sales (% change) [b]−4.4213.6237.2511.54
Gap between [a] and [b] (%)1.12−3.26−13.1916.80
Note: Gap between [a] and [b] (%) represents the difference between total and per-hectare annual changes, calculated as [a] − [b].
Table A10. Comparison of total export sales, scaled export estimates, and per-hectare export sales performance by farm size for certified farms, 2019–2023.
Variable Description20192020202120222023
Total export sales (THB) [a]176,278.80192,149.00197,206.70216,783.70240,706.70
Per-hectare export sales × farm size (THB) [b] 250,198.00237,803.72249,093.50292,701.20339,714.30
Gap between [a] and [b] (%)−29.53−19.19−20.79−25.93−29.12
Mean export sales per ha of larger farms (THB) [c] 4835.825785.895997.706378.617192.65
Mean export sales per ha of smaller farms (THB) [d] 8848.977372.767787.859736.8611,487.76
Gap between [c] and [d] (%)−82.89−27.44−29.88−52.58−59.75
Note: Gap between [a] and [b] (%) = (([a] − [b])/[b]) × 100. Larger farms: mango land size > median; Smaller farms: ≤ median. Gap between [c] and [d] (%) = (([c] − [d])/[c]) × 100.
Table A11. Comparison of annual rate of change in total and per-hectare export sales of certified farms, 2019–2023.
Variable Description2019–20202020–20212021–20222022–2023
Total export sales (% change) [a]15.022.639.9711.04
Per-hectare export sales (% change) [b]−4.954.7517.5116.06
Gap between [a] and [b] (%)19.97−2.12−7.54−5.02
Note: Gap between [a] and [b] (%) represents the difference between total and per-hectare annual changes, calculated as [a] − [b].

Appendix A.5. List of Pesticides Commonly Used by the Mango Farmers Surveyed

Table A12. The pesticides commonly used by the mango farmers surveyed.
No.Common NameTrade NameConcentrationIUPAC Name *Molecular FormulaChemical Structure Depiction
Insecticides
1AbamectinAbamectin1.8% w/v EC(1′R,2R,3S,4′S,6S,8′R,10′E,12′S,13′S,14′E,16′E,20′R,21′R,24′S)-2-butan-2-yl-21′,24′-dihydroxy-12′-[(2R,4S,5S,6S)-5-[(2S,4S,5S,6S)-5-hydroxy-4-methoxy-6-methyloxan-2-yl]oxy-4-methoxy-6-methyloxan-2-yl]oxy-3,11′,13′,22′-tetramethylspiro [2,3-dihydropyran-6,6′-3,7,19-trioxatetracyclo [15.6.1.14,8.020,24]pentacosa-10,14,16,22-tetraene]-2′-one;(1′R,2R,3S,4′S,6S,8′R,10′E,12′S,13′S,14′E,16′E,20′R,21′R,24′S)-21′,24′-dihydroxy-12′-[(2R,4S,5S,6S)-5-[(2S,4S,5S,6S)-5-hydroxy-4-methoxy-6-methyloxan-2-yl]oxy-4-methoxy-6-methyloxan-2-yl]oxy-3,11′,13′,22′-tetramethyl-2-propan-2-ylspiro [2,3-dihydropyran-6,6′-3,7,19-trioxatetracyclo [15.6.1.14,8.020,24]pentacosa-10,14,16,22-tetraene]-2′-oneC95H142O28Agriculture 16 01167 i001
2FipronilEsteena5% w/v SC5-amino-1-[2,6-dichloro-4-(trifluoromethyl)phenyl]-4-(trifluoromethylsulfinyl)pyrazole-3-carbonitrileC12H4Cl2F6N4OSAgriculture 16 01167 i002
3CypermethrinCheck-in4% w/v EC[cyano-(3-phenoxyphenyl)methyl] 3-(2,2-dichloroethenyl)-2,2-dimethylcyclopropane-1-carboxylateC22H19Cl2NO3Agriculture 16 01167 i003
4ProfenofosCheck-in40% w/v EC4-bromo-2-chloro-1-[ethoxy(propylsulfanyl)phosphoryl]oxybenzeneC11H15BrClO3PSAgriculture 16 01167 i004
5lambda-Cyhalothrinlambda-Cyhalothrin2.5% w/v ECtrans-[(R)-cyano-(3-phenoxyphenyl)methyl] (1S,3S)-3-[(Z)-2-chloro-3,3,3-trifluoroprop-1-enyl]-2,2-dimethylcyclopropane-1-carboxylateC23H19ClF3NO3Agriculture 16 01167 i005
6ThiamethoxamCelta 25WG25% WG(NE)-N-[3-[(2-chloro-1,3-thiazol-5-yl)methyl]-5-methyl-1,3,5-oxadiazinan-4-ylidene]nitramideC8H10ClN5O3SAgriculture 16 01167 i006
7DinotefuranKendo20% w/v SG2-methyl-1-nitro-3-(oxolan-3-ylmethyl)guanidineC7H14N4O3Agriculture 16 01167 i007
Fungicides
1PyridabenPyridaben 20 WP20% w/v WP2-tert-butyl-5-[(4-tert-butylphenyl)methylsulfanyl]-4-chloropyridazin-3-oneC19H25ClN2OSAgriculture 16 01167 i008
2PropinebPropineb70% WPzinc N-[1-(sulfidocarbothioylamino)propan-2-yl]carbamodithioateC5H8N2S4ZnAgriculture 16 01167 i009
3MancozebThree-ten M80% WPzinc;manganese(2+);bis(N-[2-(sulfidocarbothioylamino)ethyl]carbamodithioate)C8H12MnN4S8ZnAgriculture 16 01167 i010
Herbicides
1GlyphosateGlyphosate 4848% w/v N-phosphonomethyl-glycineC3H8NO5PAgriculture 16 01167 i011
Source: Compiled from [27]. Note: * “IUPAC Name” refers to the IUPAC nomenclature used in organic chemistry. For inline chemical structures, the color-coding represents atoms as follows: Gray/Black = Carbon (C), White/Gray line = Hydrogen (H), Blue = Nitrogen (N), Red = Oxygen (O), Yellow = Sulfur (S), Light Green = Chlorine (Cl), Pink = Fluorine (F), Mn = Manganese, and Zn = Zinc.
Table A13. Analytical performance characteristics of the GC-based pesticide residue analysis method for organophosphate (OP) and pyrethroid (PY) pesticides.
PesticidesGroupsLinear RangeLODLOQCorrelation
r2
(mg/kg)(mg/kg)(mg/kg)
MethamidophosOP0.020–0.6400.0300.1000.9983
MevinphosOP0.020–0.6400.0200.0700.9990
DiazinonOP0.020–0.6400.1700.5200.9966
DicrotophosOP0.020–0.6400.2300.7000.9924
MonocrotophosOP0.020–0.6400.0500.1400.9967
DimethoateOP0.020–0.6400.0600.1900.9938
Pirimiphos-methylOP0.020–0.6400.0600.1800.9944
ChlorpyrifosOP0.020–0.6400.0600.1800.9944
Parathion-methylOP0.020–0.6400.0700.2000.9931
MalathionOP0.020–0.6400.0500.1600.9956
FenitrophosOP0.020–0.6400.0900.2600.9987
ProthiophosOP0.020–0.6400.0600.1900.9938
MethidathionOP0.020–0.6400.0800.2400.9903
ProfenofosOP0.020–0.6400.3000.9000.9842
EthionOP0.020–0.6400.0700.2200.9914
TriazophosOP0.020–0.6400.2400.7300.9921
EPNOP0.020–0.6400.0900.2600.9884
Azinphos-ethylOP0.020–0.6400.0900.2700.9878
Azinphos-methylOP0.020–0.6400.1700.5000.9999
FenpropatrinPY0.050–0.6000.0100.0300.9938
L-CyhalothrinPY0.050–0.6000.0250.0300.9935
PermethrinPY0.050–0.6000.0240.0800.9953
CyflutrinPY0.050–0.6000.0190.0700.9941
CypermethrinPY0.050–0.6000.0250.0600.9963
FenvaleratePY0.050–0.6000.0220.0700.9940
EsfenvaleratePY0.050–0.6000.0210.0700.9953
DeltamethrinPY0.050–0.6000.0210.0700.9957
Notes: The GC-based analytical method showed good linearity and sensitivity for the determination of organophosphate (OP) and pyrethroid (PY) pesticides in mango samples. The linear calibration ranges were 0.020–0.640 mg/kg for OP pesticides and 0.050–0.600 mg/kg for PY pesticides. Correlation coefficients (r2) ranged from 0.9842 to 0.9999, indicating satisfactory calibration performance. The LOD and LOQ values ranged from 0.002 to 0.300 mg/kg and 0.030–0.900 mg/kg, respectively, demonstrating adequate sensitivity for pesticide residue determination in mango matrices. Overall, the method was suitable for multi-residue pesticide analysis and can be reliably applied for food safety monitoring studies.
Table A14. Precision and recovery performance of the GC-based method for organophosphate (OP) and pyrethroid (PY) pesticide analysis.
Pesticides% RSD% Recovery (n = 3)
Intra-Batch Inter-Batch Low Conc.Medium Conc.High Conc.
n = 10n = 10(0.020 mg/kg)(0.040 mg/kg)(0.160 mg/kg)
Methamidophos6.548.12104.5385.3095.43
Mevinphos7.363.0363.6264.04105.74
Diazinon4.272.4593.8178.1894.51
Dicrotophos4.165.67105.0788.8696.02
Monocrotophos4.526.1085.4283.0099.76
Dimethoate3.645.36103.0787.3694.74
Pirimiphos-methyl3.514.34103.6685.2194.21
Chlorpyrifos8.113.2389.0988.96106.49
Parathion-methyl4.032.8388.6783.34110.54
Malathion4.312.45105.2686.9194.71
Fenitrophos3.572.3399.3683.9594.40
Prothiophos3.831.3396.1481.61113.15
Methidathion5.252.4498.2386.93115.76
Profenofos2.732.22109.2591.3797.57
Ethion3.271.64107.9287.45120.49
Triazophos4.242.97104.2293.5697.00
EPN3.611.81104.7490.6095.50
Azinphos-ethyl6.326.30104.2791.8995.37
Azinphos-methyl6.542.71104.5385.3098.54
Fenpropatrin7.386.2768.5099.11102.40
L-Cyhalothrin13.446.1493.1090.92103.37
Permethrin12.335.7376.2186.4797.57
Cyflutrin7.204.2996.0784.18101.68
Cypermethrin4.566.3280.5380.3599.17
Fenvalerate6.194.0491.77101.66101.75
Esfenvalerate6.814.3870.8993.16100.23
Deltamethrin4.696.1976.0980.58104.72
Notes: The precision and recovery results demonstrated that the analytical method provided acceptable repeatability and accuracy for the determination of organophosphate (OP) and pyrethroid (PY) pesticides. The intra-batch and inter-batch precision values (% RSD, n = 10) ranged from 2.73 to 13.44% and 1.33–8.12%, respectively, indicating good method precision and reproducibility. Recovery values evaluated at three spiking levels (0.020, 0.040, and 0.160 mg/kg) ranged from 63.62 to 109.25%, 64.04–101.66%, and 94.21–120.49%, respectively. Most analytes showed recoveries within the acceptable range of 70–120%, confirming satisfactory method accuracy for pesticide residue analysis in mango samples. Overall, the method demonstrated suitable precision and recovery performance for multi-residue pesticide determination.
Table A15. Pesticide residues Organophosphate in mango samples and relevant MRLs.
PesticideCommodity/Crop CategoryCodex MRL (mg/kg)Thailand MRL (mg/kg)Japan MRL (mg/kg)Korea MRL (mg/kg)RemarksRef.
MevinphosMango/tropical fruitNE0.01 *0.10.01 *Default/PLS may apply where no specific mango MRLCodex; TAS 9002; Japan PLS; Korea PLS
MonocrotophosMango/tropical fruitNENot permitted/0.01 *0.01 *0.01 *Highly restricted pesticideTAS 9002; Japan PLS; Korea PLS
DimethoateMango/fruit1.01.0 **1.00.01 *Codex/Japan allow higher limit; Korea default if no specific mango MRLCodex; TAS 9002; Japan/Korea PLS
Pirimiphos-methylMango/fruitNE0.01 *0.100.01 *Import tolerance may applyCodex; TAS 9002; Japan/Korea PLS
ChlorpyrifosMango/fruitNE0.01 *0.050.5Strictly regulated in export marketsCodex; TAS 9002; Japan/Korea PLS
Parathion-methylMango/fruitNE0.01 *0.20.01 *Restricted in several countriesCodex; TAS 9002; Japan/Korea PLS
MalathionMango/fruitNE0.01 *8.00.5Country-specific limits differ greatlyCodex; TAS 9002; Japan/Korea PLS
FenitrophosMango/fruitNE0.01 *0.80.2 ***JP/KR may apply specific/other-fruit category limitsCodex; TAS 9002; Japan/Korea PLS
ProthiophosMango/fruitNE0.01 *0.01 *0.01*Default positive-list may applyCodex; TAS 9002; Japan/Korea PLS
MethidathionMango/fruitNE0.01 *0.20.05Specific Japan/Korea mango MRL appliesCodex; TAS 9002; Japan Mango MRL; Korea MRL
Profenofos 0.20.20.050.01 *Japan has a stricter mango MRL than Codex/Thai; Korea default PLS may apply if no mango-specific MRL is established.Codex; TAS 9002; Japan FFCR/PLS; Korea PLS
EthionMango/fruitNE0.01 *0.30.01 *More restrictive in export marketsCodex; TAS 9002; Japan/Korea PLS
EPNMango/fruitNE0.01 *0.01 *0.01 *Potential exceedance concern under default limitCodex; TAS 9002; Japan/Korea PLS
Azinphos-ethylMango/fruitNE0.01 *0.01 *0.01 *Obsolete/restricted pesticideTAS 9002; Japan/Korea PLS
Source: Compiled from [28,29,30]. NE = Not established, indicating that no pesticide–commodity-specific MRL has been established for mango. In Japan and Korea, when no specific MRL is available, the default Positive List System limit of 0.01 mg/kg is applied. * Default/Positive List System limit = 0.01 mg/kg when no specific MRL is established. ** Thailand TAS 9002 states that when no Thai MRL is specified, Codex MRL may be applied before the default limit is invoked. *** Korea value may be based on “other fruits” category in older MFDS table; verify with current Korea Food Code before final submission.
Table A16. Pesticide residues Pyrethroid in mango samples and relevant MRLs.
PesticideCommodity/Crop CategoryCodex MRL (mg/kg)Thailand MRL (mg/kg)Japan MRL (mg/kg)Korea MRL (mg/kg)RemarksRef.
FenpropathrinMango/tropical fruitNE0.01 *0.01 *0.01 *Export markets apply default/strict limitsCodex; TAS 9002; Japan/Korea PLS
Lambda-cyhalothrinMango0.20.20.50.01 *Below Thai/Codex MRL but stricter KR default may applyCodex; TAS 9002; Japan/Korea PLS
PermethrinMango/fruitNE0.01 *5.05.0Country-specific import tolerances may applyCodex; TAS 9002; Japan/Korea PLS
CyfluthrinMango/fruitNE0.01 *0.022.0 ***Some samples may exceed stricter JP limitCodex; TAS 9002; Japan/Korea PLS
CypermethrinMango/fruit0.70.70.032.0Export standards stricter in JapanCodex; TAS 9002; Japan/Korea PLS
FenvalerateMango/fruitNE1.51.01.0Potential exceedance under JP/KR if >1.0 mg/kgCodex; TAS 9002; Japan/Korea PLS
EsfenvalerateMango/fruitNE1.51.01.0Often regulated together with fenvalerateCodex; TAS 9002; Japan/Korea PLS
DeltamethrinMangoNE0.20.50.01 *KR applies lower/default limit if no mango-specific MRLCodex; TAS 9002; Japan/Korea PLS
Source: Compiled from [28,29,30]. NE = Not established, indicating that no pesticide–commodity-specific MRL has been established for mango. In Japan and Korea, when no specific MRL is available, the default Positive List System limit of 0.01 mg/kg is applied. * Default/Positive List System limit = 0.01 mg/kg when no specific MRL is established. *** Korea value may be based on “other fruits” category in older MFDS table; verify with current Korea Food Code before final submission.
Table A17. Profiles of surveyed mango farms with pesticide residues exceeding relevant national MRL standards.
Farm IDFarm TypePesticide
Detected
Residue Concentration (mg/kg)Thai MRL (mg/kg)Japan MRL (mg/kg)Korea MRL (mg/kg)
GAP-MG-PB-003certified farmsCyfluthrin0.02420.010.022
GAP-MG-PB-004certified farmsPermethrin0.02420.0155
GAP-MG-PB-005certified farmsCyfluthrin0.01170.010.022
GAP-MG-PB-006certified farmsCyfluthrin0.02640.010.022
GAP-MG-PB-007certified farmsPermethrin0.02640.0155
GAP-MG-PB-007certified farmsCyfluthrin0.02600.010.022
GAP-MG-PB-008certified farmsCyfluthrin0.02950.010.022
GAP-MG-PB-009certified farmsCyfluthrin0.03240.010.022
GAP-MG-PB-010certified farmsCyfluthrin0.03000.010.022
GAP-MG-PB-022certified farmsCyfluthrin0.03210.010.022
GAP-MG-PB-023certified farmsCyfluthrin0.03420.010.022
GAP-MG-PJ-001certified farmsCyfluthrin0.01320.010.022
GAP-MG-PJ-006certified farmsCyfluthrin0.01690.010.022
GAP-MG-PJ-007certified farmsCyfluthrin0.01330.010.022
GAP-MG-PJ-008certified farmsCyfluthrin0.01690.010.022
GAP-MG-PJ-011certified farmsCyfluthrin0.02350.010.022
GAP-MG-PJ-016certified farmsCyfluthrin0.02700.010.022
GAP-MG-PS-114certified farmsFenpropathrin0.01050.010.010.01
GAPN-MG-PB-005Non-certified farmsCyfluthrin0.04140.010.022
GAPN-MG-PB-013Non-certified farmsCyfluthrin0.04210.010.022
GAPN-MG-PS-035Non-certified farmsCyfluthrin0.03180.010.022
GAPN-MG-PS-036Non-certified farmsCyfluthrin0.01710.010.022
GAPN-MG-PS-041Non-certified farmsCyfluthrin0.03230.010.022
GAPN-MG-PS-043Non-certified farmsCyfluthrin0.01730.010.022
GAPN-MG-PS-044Non-certified farmsCyfluthrin0.0120.010.022
GAPN-MG-PS-045Non-certified farmsCyfluthrin0.02090.010.022
GAPN-MG-PS-046Non-certified farmsCyfluthrin0.01230.010.022
GAPN-MG-PS-049Non-certified farmsCyfluthrin0.02050.010.022
GAPN-MG-PS-050Non-certified farmsCyfluthrin0.01490.010.022
GAPN-MG-PS-055Non-certified farmsCyfluthrin0.02430.010.022
GAPN-MG-PS-085Non-certified farmsCyfluthrin0.01210.010.022
GAPN-MG-PS-092Non-certified farmsCyfluthrin0.01260.010.022
GAPN-MG-PS-095Non-certified farmsCyfluthrin0.01240.010.022
GAPN-MG-PS-119Non-certified farmsCyfluthrin0.01260.010.022
GAPN-MG-PJ-002Non-certified farmsCyfluthrin0.02420.010.022
GAPN-MG-PJ-019Non-certified farmsCyfluthrin0.0130.010.022
GAPN-MG-PJ-028Non-certified farmsCyfluthrin0.02180.010.022
GAPN-MG-PJ-030Non-certified farmsCyfluthrin0.01660.010.022
GAPN-MG-PJ-032Non-certified farmsCyfluthrin0.01490.010.022
GAPN-MG-PJ-033Non-certified farmsCyfluthrin0.01540.010.022
GAPN-MG-PJ-036Non-certified farmsCyfluthrin0.01570.010.022
GAPN-MG-PJ-038Non-certified farmsCyfluthrin0.01720.010.022
GAPN-MG-PJ-040Non-certified farmsCyfluthrin0.0150.010.022
Source: Authors’ experimental results and References [28,29,30]. Note: GAP = Good Agricultural Practices. GAP indicates certified mango farms, whereas GAPN indicates non-certified mango farms. The suffixes PB, PS, and PJ represent the sampling areas or farm-location groups used in this study. Thai MRLs were used as the primary reference values for compliance assessment, while Codex, Japanese, and Korean MRLs were included for comparison with export-market standards. For pesticides without a Codex commodity-specific MRL for mango, “NE” is indicated. Exceedance of an MRL indicates a potential regulatory or export-market compliance concern but does not necessarily imply acute dietary risk without a formal dietary exposure assessment.

Appendix A.6. Additional Analytical Remarks on the Surveyed Farms Exceeding MRL Standards

The findings may suggest that pesticide-related risks in mango farming are increasingly associated with intensive reliance on pyrethroid-based pest management practices rather than older OP-type chemicals.
At the same time, the structure of exceedance cases differed between certified and non-certified farms. Among certified farms, exceedance cases involved multiple PY chemicals, including Cyfluthrin, Permethrin, and Fenpropathrin, whereas exceedance cases among non-certified farms were almost entirely concentrated in Cyfluthrin residues. This pattern may imply that export-oriented certified farms operate under a more diversified and technically managed pesticide regime associated with premium-market production systems. By contrast, non-certified farms appear to rely more narrowly on a smaller range of pesticide compounds.
Nevertheless, several of the highest residue concentrations were observed among non-certified farms, including Cyfluthrin levels exceeding 0.04 mg/kg, which were substantially above both Thai and Japanese MRL standards. This may suggest that while certified farms exhibited broader chemical complexity, non-certified farms faced greater risks of extreme residue accumulation under less formalized pesticide management conditions.
Another important finding concerns the substantial variation across international residue standards. Most exceedance cases surpassed Thai MRL standards (0.01 mg/kg for Cyfluthrin), while several also exceeded the Japanese standard (0.02 mg/kg). However, none exceeded the Korean MRL standard (2 mg/kg), which is substantially higher. These results highlight the fragmented nature of transnational food safety governance, whereby the same residue level may be regarded as problematic in one export market but acceptable in another. For export-oriented certified farms supplying premium overseas markets, compliance therefore involves navigating multiple overlapping and sometimes inconsistent residue governance systems.
Overall, the findings suggest that Q-GAP certification should not be interpreted as a mechanism that completely eliminates pesticide residue-related risks. Rather, it appears to function more as a risk-management and export-governance mechanism within premium export-oriented production systems. While certified farms generally maintained residue levels within ranges generally compatible with export-market requirements, they also exhibited signs of relatively intensive and diversified pyrethroid-based pesticide management associated with the quality-control pressures of premium export agriculture.

References

  1. Chomchalow, N.; Songkhla, P.N. Thai mango export: A slow-but-sustainable development. AU J. Technol. 2008, 12, 1–8. [Google Scholar]
  2. Tiyayon, C.; Paull, R.E. Mango production. In Handbook of Mango Fruit: Production, Postharvest Science, Processing Technology and Nutrition; Siddiq, M., Brecht, J.K., Sidhu, J.S., Eds.; Wiley-Blackwell: Hoboken, NJ, USA, 2017; pp. 17–33. [Google Scholar]
  3. Sangwanangkul, P. Postharvest technology of tropical fruits in Thailand: Mango and young coconut. Food Preserv. Process. Ind. 2015, 14, 3–9. [Google Scholar]
  4. OECD. Food Supply Chains and COVID-19: Impacts and Policy Lessons. 2020. Available online: https://www.oecd.org/en/publications/food-supply-chains-and-covid-19-impacts-and-policy-lessons_71b57aea-en.html (accessed on 14 November 2024).
  5. Banzon, A.; Mojica, L.E.; Cielo, A.A. Adoption of Good Agricultural Practices (GAP): How does the Philippines fare? J. Interdiscip. Netw. 2013, 2, 2–8. [Google Scholar]
  6. Hoang, G.H. Adoption of good agricultural practices by cattle farmers in the Binh Dinh Province of Vietnam. J. Agric. Ext. 2020, 24, 151–160. [Google Scholar] [CrossRef]
  7. Krause, H.; Lippe, R.S.; Grote, U. Adoption and income effects of public GAP standards: Evidence from the horticultural sector in Thailand. Horticulturae 2016, 2, 18. [Google Scholar] [CrossRef]
  8. Laosutsan, P.; Shivakot, G.P.; Soni, P. Factors influencing the adoption of good agricultural practices and export decision of Thailand’s vegetable farmers. Int. J. Commons 2019, 13, 867–880. [Google Scholar] [CrossRef]
  9. Loan, L.T.T.; Pabuayon, I.M.; Catelo, S.P.; Sumalde, Z.M. Adoption of good agricultural practices (VietGAP) in the lychee industry in Vietnam. Asian J. Agric. Ext. Econ. Sociol. 2016, 8, 1–12. [Google Scholar] [CrossRef] [PubMed]
  10. Mankeb, P.; Limunggura, T.; In-Go, A.; Chulilung, P. Adoption of Good Agricultural Practices by durian farmers in Koh Samui district, Surat Thani Province, Thailand. Soc. Soc. Manag. Sys. Internet J. 2014, 9, 1–6. [Google Scholar]
  11. Maw, T.; Leshan, J.; Aung, H.P. Assessing the adoption of good agricultural practices in muskmelon production in Chaung Oo Township, Myanmar. Asian J. Agric. Ext. Econ. Sociol. 2023, 41, 124–133. [Google Scholar] [CrossRef]
  12. Nicetic, O.; van de Fliert, E.; Van Chien, H.; Mai, V.; Cuong, L. Good Agricultural Practice (GAP) as a Vehicle for Transformation to Sustainable Citrus Production in the Mekong Delta of Vietnam. In Proceedings of the 9th European IFSA Symposium, Vienna, Austria, 4–7 July 2010; Available online: https://espace.library.uq.edu.au/view/UQ:220758 (accessed on 30 March 2025).
  13. Pongvinyoo, P.; Yamao, M.; Hosono, K. Cost efficiency of Thai national GAP (QGAP) and mangosteen farmers’ understanding in Chanthaburi Province. Am. J. Rural Dev. 2015, 3, 15–23. [Google Scholar] [CrossRef]
  14. Srisopaporn, S.; Jourdain, D.; Perret, S.R.; Shivakoti, G. Adoption and continued participation in a public Good Agricultural Practices program: The case of rice farmers in the Central Plains of Thailand. Technol. Forecast. Soc. Change 2015, 96, 242–253. [Google Scholar] [CrossRef]
  15. Supapunt, P.; Intanu, P.; Chaikampun, K. Factors affecting farmers’ adoption of good agricultural practice in vegetable production in the upper North of Thailand. Int. J. Agric. Technol. 2021, 17, 349–362. [Google Scholar]
  16. Suwanmaneepong, S.; Kullachai, P.; Fakkhong, S. An investigation of factors influencing the implementation of GAP among fruit farmers in Rayong Province, Thailand. Int. J. Agric. Technol. 2016, 12, 1745–1757. [Google Scholar]
  17. Tinh, L.; Hung, P.T.M.; Dzung, D.G.; Trinh, V.H.D. Determinants of farmers’ intention of applying new technology in production: The case of VietGAP standard adoption in Vietnam. Asian J. Agric. Rural Dev. 2019, 9, 164–178. [Google Scholar] [CrossRef]
  18. Van Bac, H.O.; Nanseki, T.; Chomei, Y. Impact of VietGAP tea production on farmers’ income in Northern Vietnam. Agric. Manag. Res. 2017, 56, 100–105. [Google Scholar]
  19. Amekawa, Y.; Chuan, N.C.; Lumayag, L.A.; Tan, G.H.; Wong, C.S.; Lukman, B.A.; Tan, H.B.; Tai, W.X.; Tan, S.M.; Liu, C.H.; et al. Producers’ perceptions of public good agricultural practices and their pesticide use: The case of MyGAP for durian farming in Pahang, Malaysia. Asian J. Agric. Rural Dev. 2017, 7, 1–16. [Google Scholar] [CrossRef]
  20. Chau, T.H.B. Propensity score matching method to estimate impact of VietGAP program on health of farmers in Thua Thien Hue Province. Hue Univ. J. Sci. 2017, 126, 17–31. [Google Scholar]
  21. Amekawa, Y.; Hongsibsong, S.; Sawarng, N.; Yadoung, S.; Gebre, G.G. Producers’ perceptions of public GAP standard and their pesticide use: The case of cabbage farming in Chiang Mai Province, Thailand. Sustainability 2021, 13, 6333. [Google Scholar] [CrossRef]
  22. Amekawa, Y.; Bumrungsri, S.; Wayo, K.; Gebre, G.G.; Hongsibsong, S. Pesticide use under public good agricultural practices standard: A comparative study in Thailand. Agriculture 2022, 12, 606. [Google Scholar] [CrossRef]
  23. Amekawa, Y.; Hongsibsong, S.; Sawarng, N.; Gebre, G.G. Chili pepper farmers’ pesticide use and residues under Thailand’s public good agricultural practices standard: A case study in Thailand. Agriculture 2023, 13, 1105. [Google Scholar] [CrossRef]
  24. Codex Alimentarius. Codex Pesticide Residues in Food Online Database. 2017. Available online: https://www.fao.org/fao-who-codexalimentarius/codex-texts/dbs/pestres/en/ (accessed on 1 December 2025).
  25. Department of Agricultural Extension (DoAE). Agricultural Production Information System. 2025. Available online: https://production.doae.go.th/site/login (accessed on 24 September 2025).
  26. Ministry of Commerce. Thailand’s Trade Statistics. 2025. Available online: https://tradereport.moc.go.th/th (accessed on 24 September 2025).
  27. National Library of Medicine. Explore Chemistry: Quickly Find Chemical Information from Authoritative Sources. 2025. Available online: https://pubchem.ncbi.nlm.nih.gov (accessed on 2 December 2025).
  28. TAS 9002-2013; Pesticide Residues: Maximum Residue Limits. National Bureau of Agricultural Commodity and Food Standards (ACFS): Bangkok, Thailand, 2013.
  29. The Japan Food Chemical Research Foundation (FFCR). MRLs of Agricultural Chemicals, Feed Additives, and Veterinary Drugs in Foods (as of 19 February 2026); The Japan Food Chemical Research Foundation: Toyonaka, Osaka, Japan, 2026; Available online: https://www.ffcr.or.jp/en/zanryu/ (accessed on 18 May 2026).
  30. USDA Foreign Agricultural Service. Implementation of Positive List System for Maximum Residue Limits: Republic of Korea; GAIN Report KS1843; USDA Foreign Agricultural Service: Washington, DC, USA, 2018. Available online: https://apps.fas.usda.gov/newgainapi/api/report/downloadreportbyfilename?filename=Implementation+of+Positive+List+System+for+Maximum+Residue+Limits_Seoul_Korea+-+Republic+of_11-27-2018.pdf (accessed on 18 May 2026).
Figure 1. Field survey provinces, Thailand (Green: Phitsanulok; Blue: Phichit; Yellow: Phetchabun). Source: Modified from the SVG base map by NordNordWest.
Agriculture 16 01167 g001
Figure 2. Annual total mango production (kg) (left) and annual mango yield (kg/ha) (right) among respondent farmers, 2019–2023.
Agriculture 16 01167 g002
Figure 3. Annual total mango sales (Thai baht) (left) and annual per-hectare mango sales (Thai baht/ha) (right) among respondent farmers, 2019–2023.
Agriculture 16 01167 g003
Figure 4. Annual total mango export sales (Thai baht) (left) and annual per-hectare mango export sales (Thai baht/ha) (right) among respondent farmers, 2019–2023.
Agriculture 16 01167 g004
Table 1. Number and locations of mango farmers participating in the survey.
Province NameDistrict NameNumber of Certified FarmsNumber of Non-Certified FarmsTotal
PhichitSaklek192746
Wang Sai10010
PhitsanulokNoen Maprang2890118
Wat Bot628
Wang Thong13013
PhetchabunWang Pong17825
Nong Phai111122
Mueang 01313
Total104151255
Table 2. Basic profile of the respondent farmers.
Variable DescriptionCertified
(N = 104)
Non-Certified
(N = 151)
p-Value
Age (years)56.61 (9.58)56.43 (11.72)0.8997 NS
Education (years)7.95 (3.81)7.68 (3.77)0.5765 NS
Total farm size (ha)6.69 (8.81)3.61 (3.93)0.0002 ***
Mango farm size (ha)5.76 (8.45)2.67 (3.14)0.0001 ***
Total number of mango trees 1491 (2295)775 (1398)0.0024 ***
Number of mango trees per ha264 (73)284 (132)0.1604 NS
Number of crops grown other than mango and rice0.70 (0.89)0.63 (0.63)0.5115 NS
Farms growing certified crops other than mango and rice (1 = yes) (%)4.810.000.007 ***
Permanent worker employment for mango farming (1 = yes) (%)31.7324.500.116 NS
Number of permanently employed workers for mango farming2.29 (4.17)1.81 (8.48)0.5986 NS
*** p < 0.01; NS = not significant. Standard deviation in parentheses.
Table 3. Respondents’ marketing platforms.
Variable DescriptionCertified
(N = 104)
Non-Certified
(N = 151)
p-Value
(Exporter A) (1 = yes) (%)87.50.00.000 ***
(Exporter B) (1 = yes) (%)12.50.00.000 ***
Domestic market through middlemen (1 = yes) (%)100.060.90.000 ***
Domestic market through DIT
(1 = yes) (%)
0.00.70.406 NS
Export market through middlemen (1 = yes) (%)0.05.30.017 **
Direct sales to wholesale market
(1 = yes) (%)
0.040.40.000 ***
Direct sales to community or neighborhood outlets
(1 = yes) (%)
100.076.80.000 ***
Online sales (1 = yes) (%)57.70.00.000 ***
*** p < 0.01, ** p < 0.05; NS = not significant.
Table 4. The respondent farmers’ coping with the COVID-19 effects during 2020–2023.
Variable DescriptionCertified
(N = 104)
Non-Certified
(N = 151)
p-Value
Reduced investment in mango production (1 = yes) (%)0.054.30.000 ***
Cut mango trees to plant something else (1 = yes) (%)42.36.60.000 ***
Planted something new without cutting mango trees (1 = yes) (%)57.717.20.000 ***
Increased mango marketing platforms (1 = yes) (%)0.03.30.061 *
Received remittances from migrant family members (1 = yes) (%)0.05.30.017 ***
Increased credit loans from the state agricultural bank (1 = yes) (%)100.017.20.000 ***
Relied on rice farming for sales and self-consumption (1 = yes) (%)100.015.80.000 ***
Relied on sales of other agricultural products (1 = yes) (%)0.011.90.000 ***
Relied on non-farm income-generating activities (1 = yes) (%)0.09.90.001 ***
Relied on agricultural wage labor for income (1 = yes) (%)0.04.00.040 **
Relied on mango processing business (1 = yes) (%)42.325.20.004 ***
*** p < 0.01, ** p < 0.05, * p < 0.10.
Table 5. Respondent farmers’ perceptions of Q-GAP policy and pesticide use.
Variable Description (1 = Yes)Certified
(N = 104)
Non-Certified
(N = 151)
p-Value
Can relate the goal of the Q-GAP policy to food safety (%)98.094.0
(n = 67)
0.160 NS
Has a knowledge of IPM63.513.20.000 ***
Thinks that pesticides are not very harmful to the health of users when appropriately managed (%)97.185.40.002 ***
Thinks that pesticides are not very harmful to the health of consumers when appropriately managed (%)97.187.40.007 ***
Thinks that pesticides are not very harmful to the environment when appropriately managed (%)96.284.10.002 ***
Thinks that sufficient assistance has
been received from local government agencies to obtain agricultural technologies or practices (%)
55.829.80.000 ***
*** p < 0.01; NS = not significant. The number of samples is indicated as n in parentheses for the item that falls short of the complete sample N.
Table 6. Training experience of respondent farmers.
Variable DescriptionCertified
(N = 104)
Non-Certified
(N = 151)
p-Value
Ever received government training on pesticide use (1 = yes) (%)94.250.30.000 ***
Number of days taken for participation in government training on agricultural pesticides including those who did not participate1.72
(0.93)
0.75
(0.93)
0.0000 ***
Number of days taken for participation in government training on agricultural pesticides excluding those who did not participate1.82
(0.84)
(n = 98)
1.50
(0.77)
(n = 76)
0.0092 ***
Ever received government training on Q-GAP (1 = yes) (%)96.227.20.000 ***
Number of days taken for participation in government training on Q-GAP including those who did not participate1.95
(0.92)
0.40
(0.78)
0.0000 ***
Number of days taken for participation in government training on Q-GAP excluding those who did not participate2.07
(0.79)
(n = 100)
1.49
(0.81)
(n = 41)
0.0001 ***
Ever received government training on IPM (1 = yes) (%)56.713.90.000 ***
Ever received government training on the use of organic fertilizer (1 = yes) (%)86.541.10.000 ***
*** p < 0.01. Standard deviation in parentheses. The number of samples is indicated as n in parentheses for items that fall short of the complete sample N.
Table 7. Audit experiences of Q-GAP-certified farmers.
Variable DescriptionQ-GAP-Certified
(N = 104)
Number of times DoA audit was needed to receive Q-GAP certification1.91
Received advance notice on the date of the first audit (1 = yes) (%)91.3
Number of days advance notice was made prior to the first audit6.5 (n = 95)
Time taken for the first audit (minutes)45.0
Checked in audit on the record-keeping of farming practices (1 = yes) (%)93.3
Handed mango samples directly to DoA officers for pesticide residue test (1 = yes) (%) 95.2 (n = 99)
The mean number of mango fruit samples submitted6.5 (n = 99)
Table 8. Synthetic pesticide use by respondent farmers.
Variable Description Certified
(N = 104)
Non-Certified
(N = 151)
p-Value
Insecticides
Use (1 = yes) (%)
Frequency of insecticide application in the past year
99.0
14.0 (8.48)
86.1
7.0 (8.24)
0.000 ***
0.0000 ***
Frequency of insecticide application in the past year when excluding those who did not use insecticides14.1 (8.40)
(n = 103)
8.10 (8.36)
(n = 130)
0.0000 ***
Fungicides
Use (1 = yes) (%)
Frequency of fungicide application in the past year
96.2
10.36 (7.30)
86.8
6.54 (7.31)
0.012 **
0.0001 ***
Frequency of fungicide application in the past year when excluding those who did not use fungicides10.77 (7.14)
(n = 100)
7.53 (7.35)
(n = 131)
0.0009 ***
Herbicides
Use (1 = yes) (%)
Frequency of herbicide application in the past year
59.6
1.47 (2.38)
59.6
1.00 (1.45)
0.998 NS
0.0508 *
Frequency of herbicide application in the past year when excluding those who did not use herbicides2.47 (2.70)
(n = 62)
1.68 (1.54)
(n = 90)
0.0222 **
*** p < 0.01, ** p < 0.05, * p < 0.10; NS = not significant. Standard deviation in parentheses. The number of samples is indicated as n in parentheses for items that fall short of the complete sample N.
Table 9. Detected pesticide residue levels from the OP analysis.
Name of Active Chemical Ingredients Q-GAP-Certified (N = 104)Non-Certified (N = 151)
Mean
(mg/kg)
SDMin
(mg/kg)
Max
(mg/kg)
Farms Detected (%)Mean
(mg/kg)
SDMin
(mg/kg)
Max
(mg/kg)
Farms Detected (%)p-Value
Mevinphos0.00018680.00190460.0194240.0194240.96-0--0N.D.
Monocrotophos0.00021470.00218950.0223280.0223280.96-0--0N.D.
Dimethoate0.00092360.00468260.0240130.0272783.850.00127650.00546110.0246320.0306534.630.5918 NS
Pirimiphos-methyl0.00092360.00468260.0265370.0281651.920.00127650.00546110.0205030.0209901.990.8020 NS
Chlorpyrifos0.00074930.00439740.0259750.0281682.880.00095040.0047690.0239180.0209903.970.7330 NS
Parathion-methyl0.00110880.00569450.028830.0378333.850.00129950.00644930.0327040.0384383.970.8081 NS
Malathion0.00024510.00249960.0254910.0254910.960.00036610.00258020.0184260.0186891.990.7097 NS
Fenitrophos0.00273730.00866040.0284680.0455249.620.00068640.00419940.025910.0305742.650.0126 **
Prothiophos0.00023550.00240160.0244920.0244920.96-0--0N.D.
Methidathion0.00139640.00642780.0290440.0413524.810.00054040.00383210.0272010.0314541.990.1849 NS
Ethion0.00091620.00551370.031760.0422472.880.00034790.00551370.0262670.0284201.320.2915 NS
EPN0.00112890.00678140.0391360.0522282.880.00021540.00264710.0325280.0325280.660.1352 NS
Azinphos-ethyl0.00039120.00398970.0406870.0406870.96-0--0N.D.
Total0.01074410.04742670.01942360.05222810.580.00608990.00245350.0184260.0384384.630.3392 NS
** p < 0.05; NS = not significant. (-) indicates no detection, and N.D. indicates not detectable.
Table 10. Detected pesticide residue levels from the PY analysis.
Name of Active Chemical IngredientsQ-GAP-Certified (N = 104)Non-Certified (N = 151)
Mean
(mg/kg)
SDMin
(mg/kg)
Max
(mg/kg)
Farms Detected (%)Mean
(mg/kg)
SDMin
(mg/kg)
Max
(mg/kg)
Farms Detected (%)p-Value
for the Mean Concentration
Fenpropathrin0.00021200.00129580.0051360.0104792.850.00008460.0007330.0062450.0065341.320.3188 NS
L-Cyhalothrin0.00385370.00497770.0078340.02521542.310.00113930.00286680.0078620.01245113.900.0000 ***
Permethrin0.00132050.00384720.0042920.02636319.230.00005710.00049460.0042420.0043801.320.0001 ***
Cyfluthrin0.00343580.00886300.0116790.03415614.420.00328850.00810530.0061190.04212117.220.8909 NS
Cypermethrin0.00580600.01134640.0087840.08904135.580.00427790.00854060.0097700.06580627.810.2213 NS
Fenvalerate0.00111920.00327030.0104670.01085210.580.00007120.00087540.0107570.0107570.660.0002 ***
Esfenvalerate0.00106960.00351460.011570.0149618.650.00110930.00348370.0115580.0131999.270.9291 NS
Deltamethrin0.00095750.00103910.0110220.0320766.730.00103910.00103910.0106440.0120369.270.8593 NS
Total0.01777440.02083840.0042920.08904161.540.01106700.01678700.0042420.06580642.380.0049 ***
*** p < 0.01; NS = not significant.
Table 11. Use of non-synthetic pest control methods.
Variable Description (1 = Yes)Certified
(N = 104)
Non-Certified
(N = 151)
p-Value
Farmers who use at least one non-synthetic pest management method (%)90.478.80.014 **
Adoption of specific method
Herbal insecticide2.91.30.377 NS
Biological insecticide3.82.60.590 NS
Wood vinegar as insect repellent5.80.70.005 ***
Mowing with weed cutter90.476.80.005 ***
*** p < 0.01, ** p < 0.05; NS = not significant.
Table 12. Record-keeping by respondent farmers.
Variable Description (1 = Yes)Certified
(N = 104)
Non-Certified
(N = 151)
p-Value
Insecticide use (%)92.2
(n = 103)
34.6
(n = 130)
0.000 ***
Fungicide use (%)92.0
(n = 100)
35.1
(n = 131)
0.000 ***
Herbicide use (%)88.7
(n = 62)
100
(n = 90)
0.001 ***
Use of non-synthetic pest management methods (%)63.8
(n = 94)
33.3
(n = 108)
0.000 ***
Use of chemical fertilizers (%)92.1
(n = 89)
27.3
(n = 121)
0.000 ***
*** p < 0.01.
Table 13. Influence of various factors on the quantity of detected pesticide residues among certified farmers based on the PY analysis.
Explanatory VariablesCoef.Std. Errtp > |t|
Age (years)0.00022460.00029970.750.455 NS
Education (years)0.00068920.0006711.030.307 NS
Mango farm size (ha)0.00002770.00005450.510.612 NS
Mango yield (kg/ha)−2.51 × 10−77.38 × 10−6−0.030.973 NS
Per hectare mango sales8.52 × 10−83.70 × 10−70.230.818 NS
Annual frequency of insecticide/fungicide application−0.00003170.0001656−0.190.849 NS
Annual frequency of herbicide application0.00183830.00105091.750.083 *
_cons−0.00423670.0226807−0.190.852 NS
Number of observations104
Prob > F0.7773
R-squared0.0658
Root MSE0.02086
* p < 0.10; NS = not significant.
Table 14. Influence of various factors on the quantity of detected pesticide residues among non-certified farmers based on the PY analysis.
Explanatory VariablesCoef.Std. Errtp > |t|
Age (years)0.00018690.00035910.520.604 NS
Education (years)0.00145750.00145481.000.318 NS
Mango farm size (ha)−0.00007620.0000808−0.940.347 NS
Mango yield (kg/ha)−3.08 × 10−61.35 × 10−6−2.280.024 **
Per hectare mango sales3.24 × 10−72.26 × 10−71.430.155 NS
Annual frequency of total pesticide application0.00019930.00014691.360.177 NS
_cons−0.01145760.0280271−0.410.683 NS
Number of observations151
Prob > F0.0761
R-squared0.0664
Root MSE0.0233
** p < 0.05; NS = not significant.
Disclaimer/Publisher’s Note: The statements, opinions and data contained in all publications are solely those of the individual author(s) and contributor(s) and not of MDPI and/or the editor(s). MDPI and/or the editor(s) disclaim responsibility for any injury to people or property resulting from any ideas, methods, instructions or products referred to in the content.