Article

Flash Drought Assessment in the Black Soil Region of Northeast China Using FDHI


Heilongjiang Province Key Laboratory of Geographical Environment Monitoring and Spatial Information Service in Cold Regions, Harbin Normal University, Harbin 150025, China
*
Author to whom correspondence should be addressed.
Agriculture 2026, 16(11), 1153; https://doi.org/10.3390/agriculture16111153
Submission received: 14 April 2026 / Revised: 19 May 2026 / Accepted: 21 May 2026 / Published: 24 May 2026
(This article belongs to the Section Ecosystem, Environment and Climate Change in Agriculture)

Abstract

Flash droughts, characterized by rapid onset and intensification, are occurring more frequently under global warming. Accurately identifying the frequency and hazard severity of flash droughts remains challenging, as they are influenced by multiple hydroclimatic drivers, including precipitation deficits, temperature increases, and soil moisture depletion. We developed a daily-scale Flash Drought Hazard Index (FDHI) by integrating the interactive effects of multiple driving factors, aiming to assess the spatiotemporal patterns of flash drought hazard in the Black Soil Region of Northeast China during the period 2000–2020. The FDHI employs the daily Standardized Precipitation Evapotranspiration Index, Standardized Soil Moisture Index, Standardized Soil Temperature Index, and Standardized Runoff Index to characterize short-term anomalies in multiple hydrometeorological variables. Results showed that flash droughts occurred most frequently in the southern part of the Black Soil Region of Northeast China, particularly in the Songnen Plain and the Liaohe Plain, with annual frequencies of 5.98 and 5.80 events, respectively. Flash drought severity in the Liaohe Plain exhibited a significant increasing trend during the past decade. Moreover, the dominant driving factors varied substantially among regions. Flash droughts in the Liaohe Plain were mainly associated with precipitation deficits and enhanced evapotranspiration, whereas soil moisture depletion and temperature anomalies played a more important role in the Songnen Plain. These results reveal pronounced regional heterogeneity in flash drought mechanisms across the Black Soil Region of Northeast China and demonstrate the effectiveness of the proposed FDHI for daily-scale agricultural flash drought monitoring. The study provides scientific support for agricultural drought risk management and disaster mitigation under climate change.

1. Introduction

Flash drought, distinguished by its abrupt onset and swift intensification, has drawn growing attention in recent years as a discrete category of drought event [1,2,3]. Flash droughts are characterized by a much more rapid onset than conventional droughts, often developing within only two weeks, whereas conventional drought events typically evolve over periods longer than one month [4,5,6]. In contrast to conventional drought events, flash droughts can trigger rapid depletion of soil moisture and severe crop stress within a short period. Their abrupt development substantially limits the time available for effective response measures, thereby posing heightened risks to agricultural production and food security [7]. A flash drought that occurred across the northern Great Plains of the United States during the summer of 2017 caused agricultural losses estimated at approximately $2.6 billion [8]. During the summer of 2022, a flash drought across China’s Yangtze River basin caused crop failure over an area exceeding 0.6 million ha [9]. From spring to summer 2023, western Europe experienced its most severe flash drought since 1993, leading to widespread crop losses in most affected regions [10]. These examples demonstrate the devastating consequences of extreme flash drought hazard for agriculture, leading to massive economic losses and extensive crop failure within a remarkably short period [11]. Therefore, accurate detection of flash drought events and a clear understanding of their effects on agricultural production are essential for safeguarding food security.
During recent years, numerous studies have explored different techniques for detecting and tracking flash drought events, which can generally be classified into three major methodological categories. Among them, the soil moisture-based percentile method identifies flash drought onset according to the speed of soil moisture decline and the persistence of dry conditions [12]. The drought-index-based approach identifies flash drought events using a single indicator [13], including the Standardized Precipitation Evapotranspiration Index (SPEI), and Standardized Evaporative Stress Ratio (SESR) et al. Among these indicators, the SPEI, originally developed by Sergio Vicente-Serrano and colleagues [14], has been extensively applied because it effectively characterizes abnormal atmospheric evaporative demand and enables continuous drought monitoring at regional scales. Li et al. conducted a comparative analysis of Evaporative Stress Percentile (ESP), Soil Moisture Percentile (SMP), and Precipitation Anomaly Percentage (PAP) [15]. Their results demonstrated that ESP enables earlier detection of flash droughts than SMP and PAP. Additionally, Yao et al. demonstrated that solar-induced chlorophyll fluorescence (SIF) was capable of identifying both the initiation and recovery phases of flash droughts earlier during their analysis of drought spatiotemporal dynamics across China over the 2001–2019 period [16]. Parker et al. evaluated the effectiveness of the Evaporative Stress Index (ESI), Evaporative Demand Drought Index (EDDI), and Standardized Precipitation Index (SPI), and reported that ESI and EDDI exhibited superior capability in tracking flash drought evolution [17]. The recently developed multi-indicator threshold approach detects flash drought events according to abnormal conditions across several variables; specifically, a flash drought is considered to occur when anomalies in evapotranspiration, soil moisture, temperature, and related factors surpass their corresponding threshold values [18]. This method simultaneously accounts for the influence of multiple driving factors and captures the dependency structure among them, offering a more effective and comprehensive approach for identifying flash droughts [19].
The Black Soil Region of Northeast China represents one of the most important grain-yielding areas worldwide and is of strategic importance to national food security in China [20,21]. Under ongoing climate warming, the region has experienced increasing flash drought risk, with compound high-temperature and drought events posing growing threats to crop production [22,23]. Given the rapid evolution characteristics of flash droughts described above, conventional monthly-scale drought monitoring approaches face important limitations in capturing their development processes. Because monthly-scale drought indices are based on temporal aggregation over relatively long intervals [24], they tend to smooth short-term hydroclimatic fluctuations [25], dilute transient extreme anomalies [26], and obscure abrupt transitions in soil moisture and atmospheric water demand that are critical to flash drought development [27]. As a result, rapidly intensifying drought conditions occurring within a short period may be underestimated or remain undetected in monthly-scale monitoring systems. This temporal aggregation effect can delay flash drought detection and reduce the available response time for irrigation management and agricultural drought mitigation during critical crop growth stages [28]. However, these limitations may be particularly pronounced in the Black Soil Region of Northeast China, where the fertile soils in this region are highly sensitive to rapid hydroclimatic fluctuations during the crop growing season [29]. Previous studies have shown that seasonal freeze–thaw processes, soil structure degradation, and rapid root-zone soil moisture loss can accelerate flash drought development in Northeast China [30,31,32]. In addition, black soil degradation caused by long-term erosion and organic matter decline has further weakened soil water retention capacity, increasing the susceptibility of cropland to rapid drying under high-temperature and precipitation-deficit conditions [33]. Compared with some other agricultural soil types, black soils in Northeast China may exhibit more rapid root-zone drying and stronger spatial heterogeneity under short-term heat and precipitation-deficit conditions, thereby facilitating faster flash drought propagation [34,35]. Current drought monitoring research in the Black Soil Region still primarily relies on monthly-scale conventional drought identification methods based on monthly-scale drought indices, lacking the capability to identify daily-scale flash drought events. This methodological limitation poses challenges for crop disaster monitoring, disaster prevention, and mitigation.
To address the above limitations, this study developed a daily-scale Flash Drought Hazard Index (FDHI) for agricultural flash drought monitoring in the Black Soil Region of Northeast China. Unlike conventional monthly-scale or single-factor drought indices, the FDHI integrates atmospheric evaporative demand, soil hydrothermal conditions, and hydrological responses by incorporating SPEI, SSMI, STI, and SRI records at a daily temporal resolution for the 2000–2020 study period, thereby improving the capability to capture the rapid onset and multi-factor coupling characteristics of flash droughts in black soil agricultural systems. Based on the FDHI, this study aimed to (1) identify the spatiotemporal characteristics of flash drought frequency, duration, intensity, and hazard severity in the Black Soil Region of Northeast China; (2) analyze the temporal trends and spatial evolution of flash drought hazards during 2000–2020; and (3) quantify the relative contributions of different hydroclimatic driving factors to flash drought development across major agricultural regions.

2. Materials and Methods

2.1. Study Area

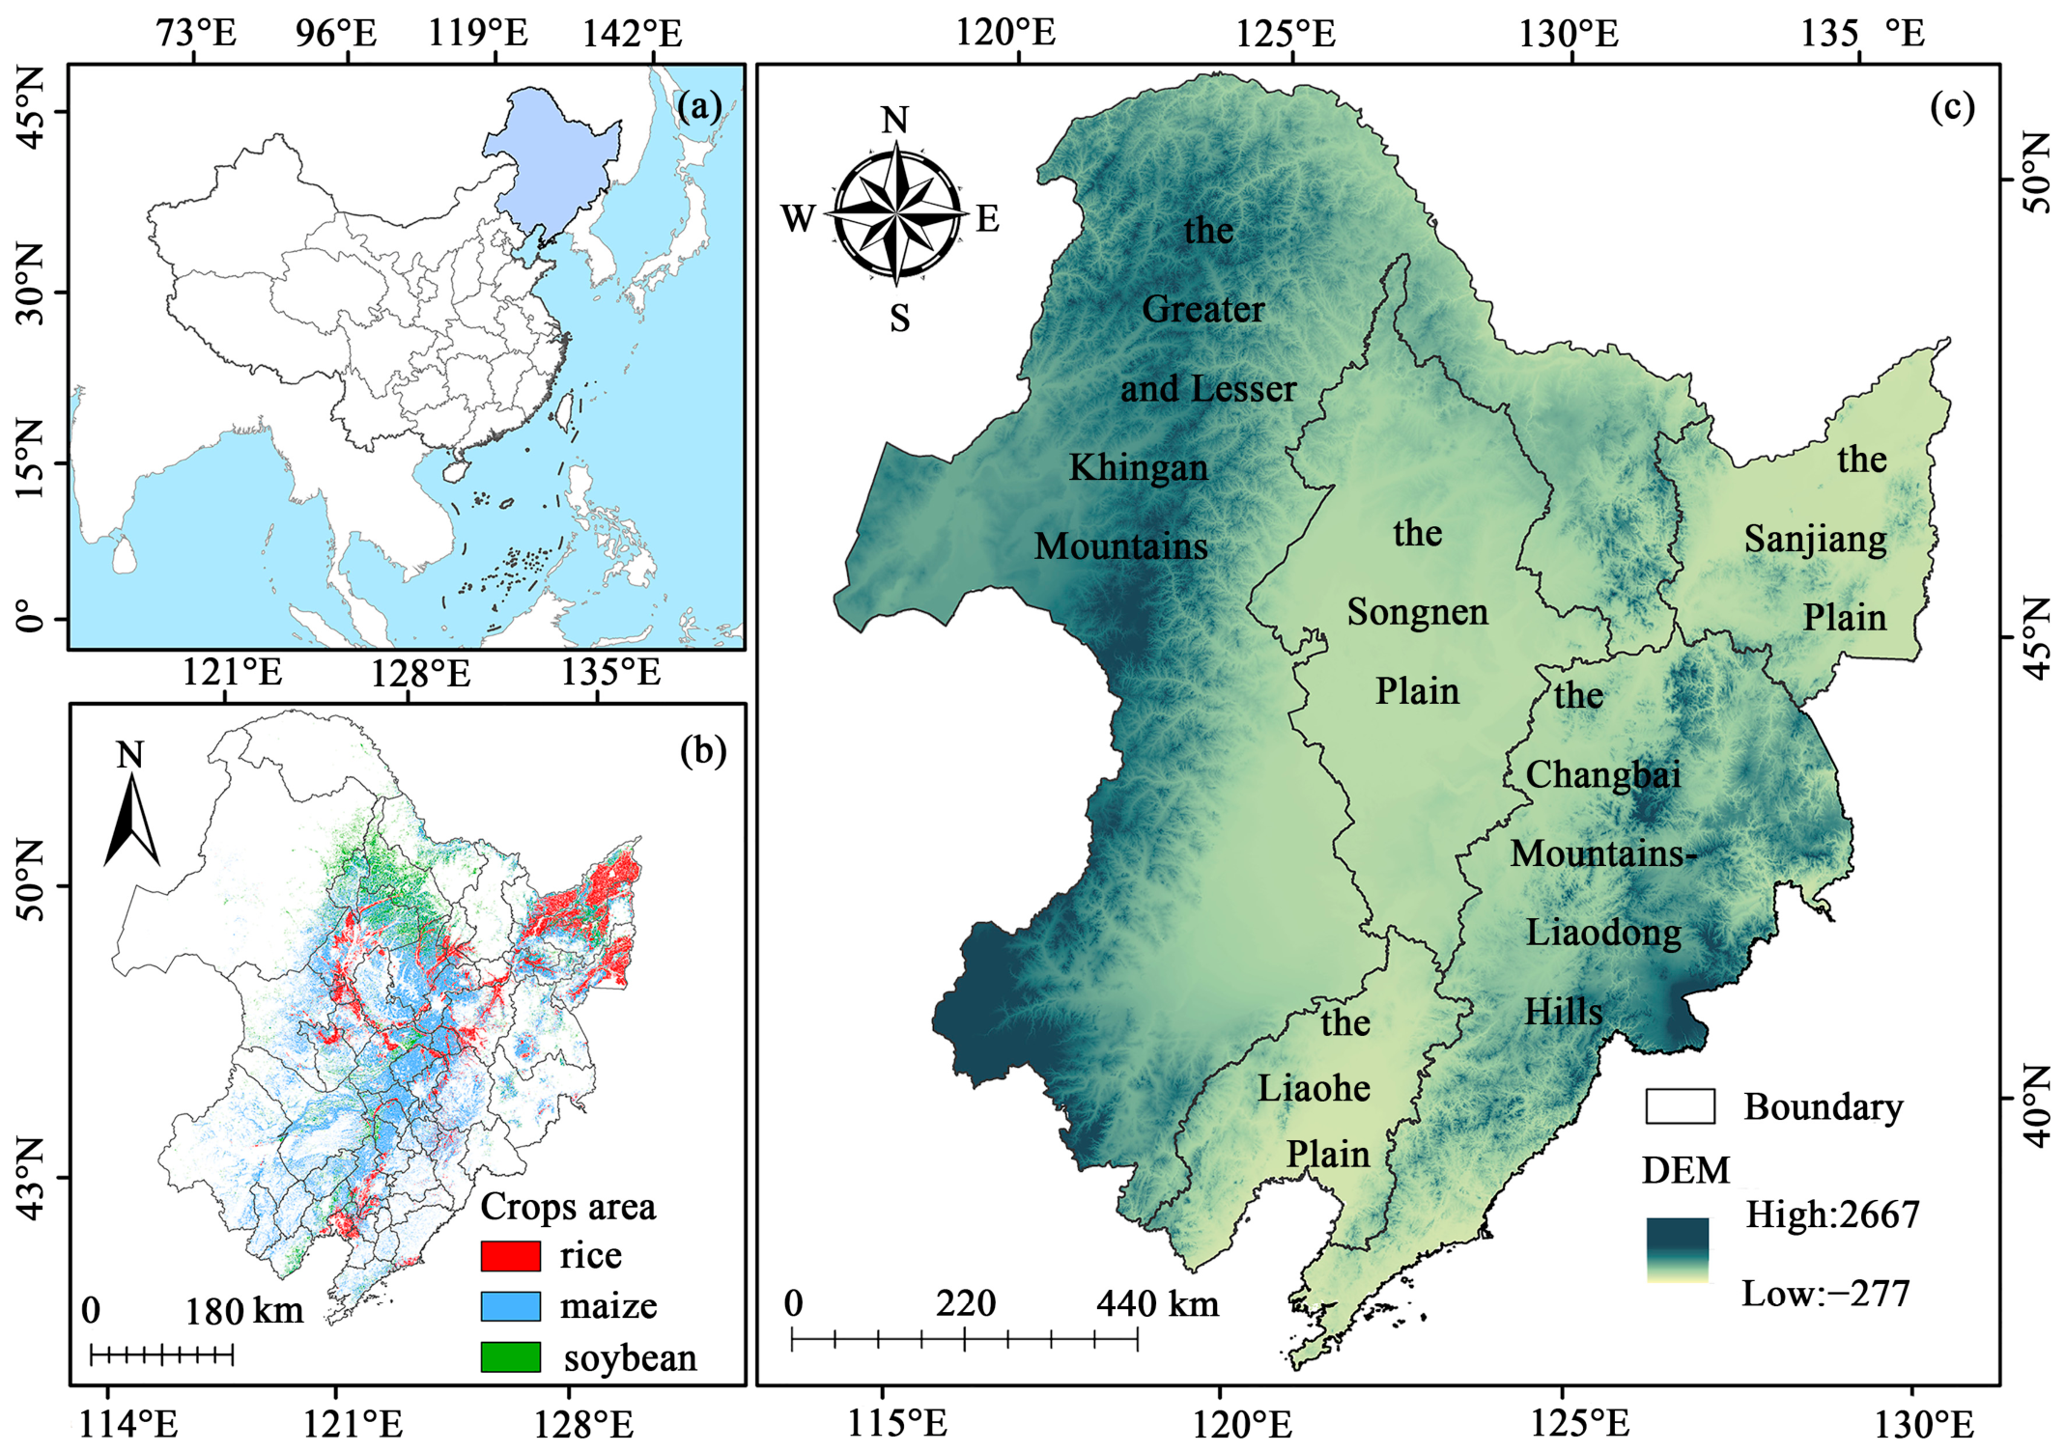
The Black Soil Region of Northeast China covers an area of 387,500 km2 and represents one of the world’s most significant agricultural production regions. The study area includes five major grain-producing regions: the Songnen Plain, the Liaohe Plain, the Sanjiang Plain, the Changbai Mountains–Liaodong Hills area, and the Greater and Lesser Khingan Mountains. It is located between 38°43′–53°33′ N and 115°29′–135°05′ E. The study area experiences a temperate continental monsoon climate, with an average annual temperature of about 5.4 °C and annual precipitation of approximately 600 mm, characterized by hot and humid summers as well as cold and dry winters [36]. The regional landscape is mainly composed of plains and mountainous terrain, with relatively high elevations primarily distributed across the western Greater and Lesser Khingan mountains and the eastern Changbai Mountains–Liaodong Hills region. Crops in the study area are mostly single-harvest per year and primarily consist of maize, rice, and soybeans, with cultivated areas of 125,000 km2, 44,000 km2, and 42,000 km2, respectively. These crops account for 32.28%, 18.92%, and 44.08% of the region’s total grain output, respectively. The growing season generally extends from early April to mid-October each year. A general overview of the study area is presented in Figure 1.

2.2. Data Sources

Daily Standardized Precipitation Evapotranspiration Index (SPEI) data for the 2000–2020 period were mainly derived from the Global Multiscale Daily SPEI Dataset (SPEI-GD), which is the first global daily SPEI product developed across multiple timescales and covers the years 1982–2021. The dataset has a spatial resolution of 0.25° × 0.25° and contains continuous daily SPEI records from 1982 to 2020.
Data used to calculate the daily scale Standardized Soil Moisture Index (SSMI) were primarily obtained from the daily soil moisture records within the GLEAM 4.2 dataset. The dataset contains records for the 1980–2023 period and is provided at a spatial resolution of 0.1° × 0.1°.
Daily soil temperature and surface runoff data derived from the ERA5-Land dataset were used as the main inputs for deriving the daily STI and SRI indices. This dataset provides daily-scale data spanning the period from 1980 to 2021, with a spatial resolution of 0.1° × 0.1°.
Solar-Induced Chlorophyll Fluorescence (SIF) data employed in the correlation analysis were obtained from the OCO-2-based Global SIF Product (GOSIF). The dataset provides 8-day composite SIF observations at a spatial resolution of 0.05° × 0.05° and spans the 2000–2024 period. For all datasets described above, only records from 2000 to 2020 were used in the present analysis.
The Emergency Events Database (EM-DAT) provides records of more than 27,000 major disaster events worldwide from 1900 onward. The database includes information on the duration, intensity, and impacts of multiple types of disasters, such as earthquakes, flash droughts, and floods. Its data are compiled from diverse sources, including United Nations agencies, research institutions, non-governmental organizations, reinsurance companies, and news media. In this study, flash drought events occurring within the Black Soil Region of Northeast China were extracted from the database to evaluate the reliability of the experimental results.
Other datasets, including the 90 m elevation data of Northeast China and the 30 m resolution crop classification dataset of Northeast China from 2021, were obtained from the National Earth System Science Data Center. An overview of the experimental datasets is presented in Table 1.

2.3. Research Procedures

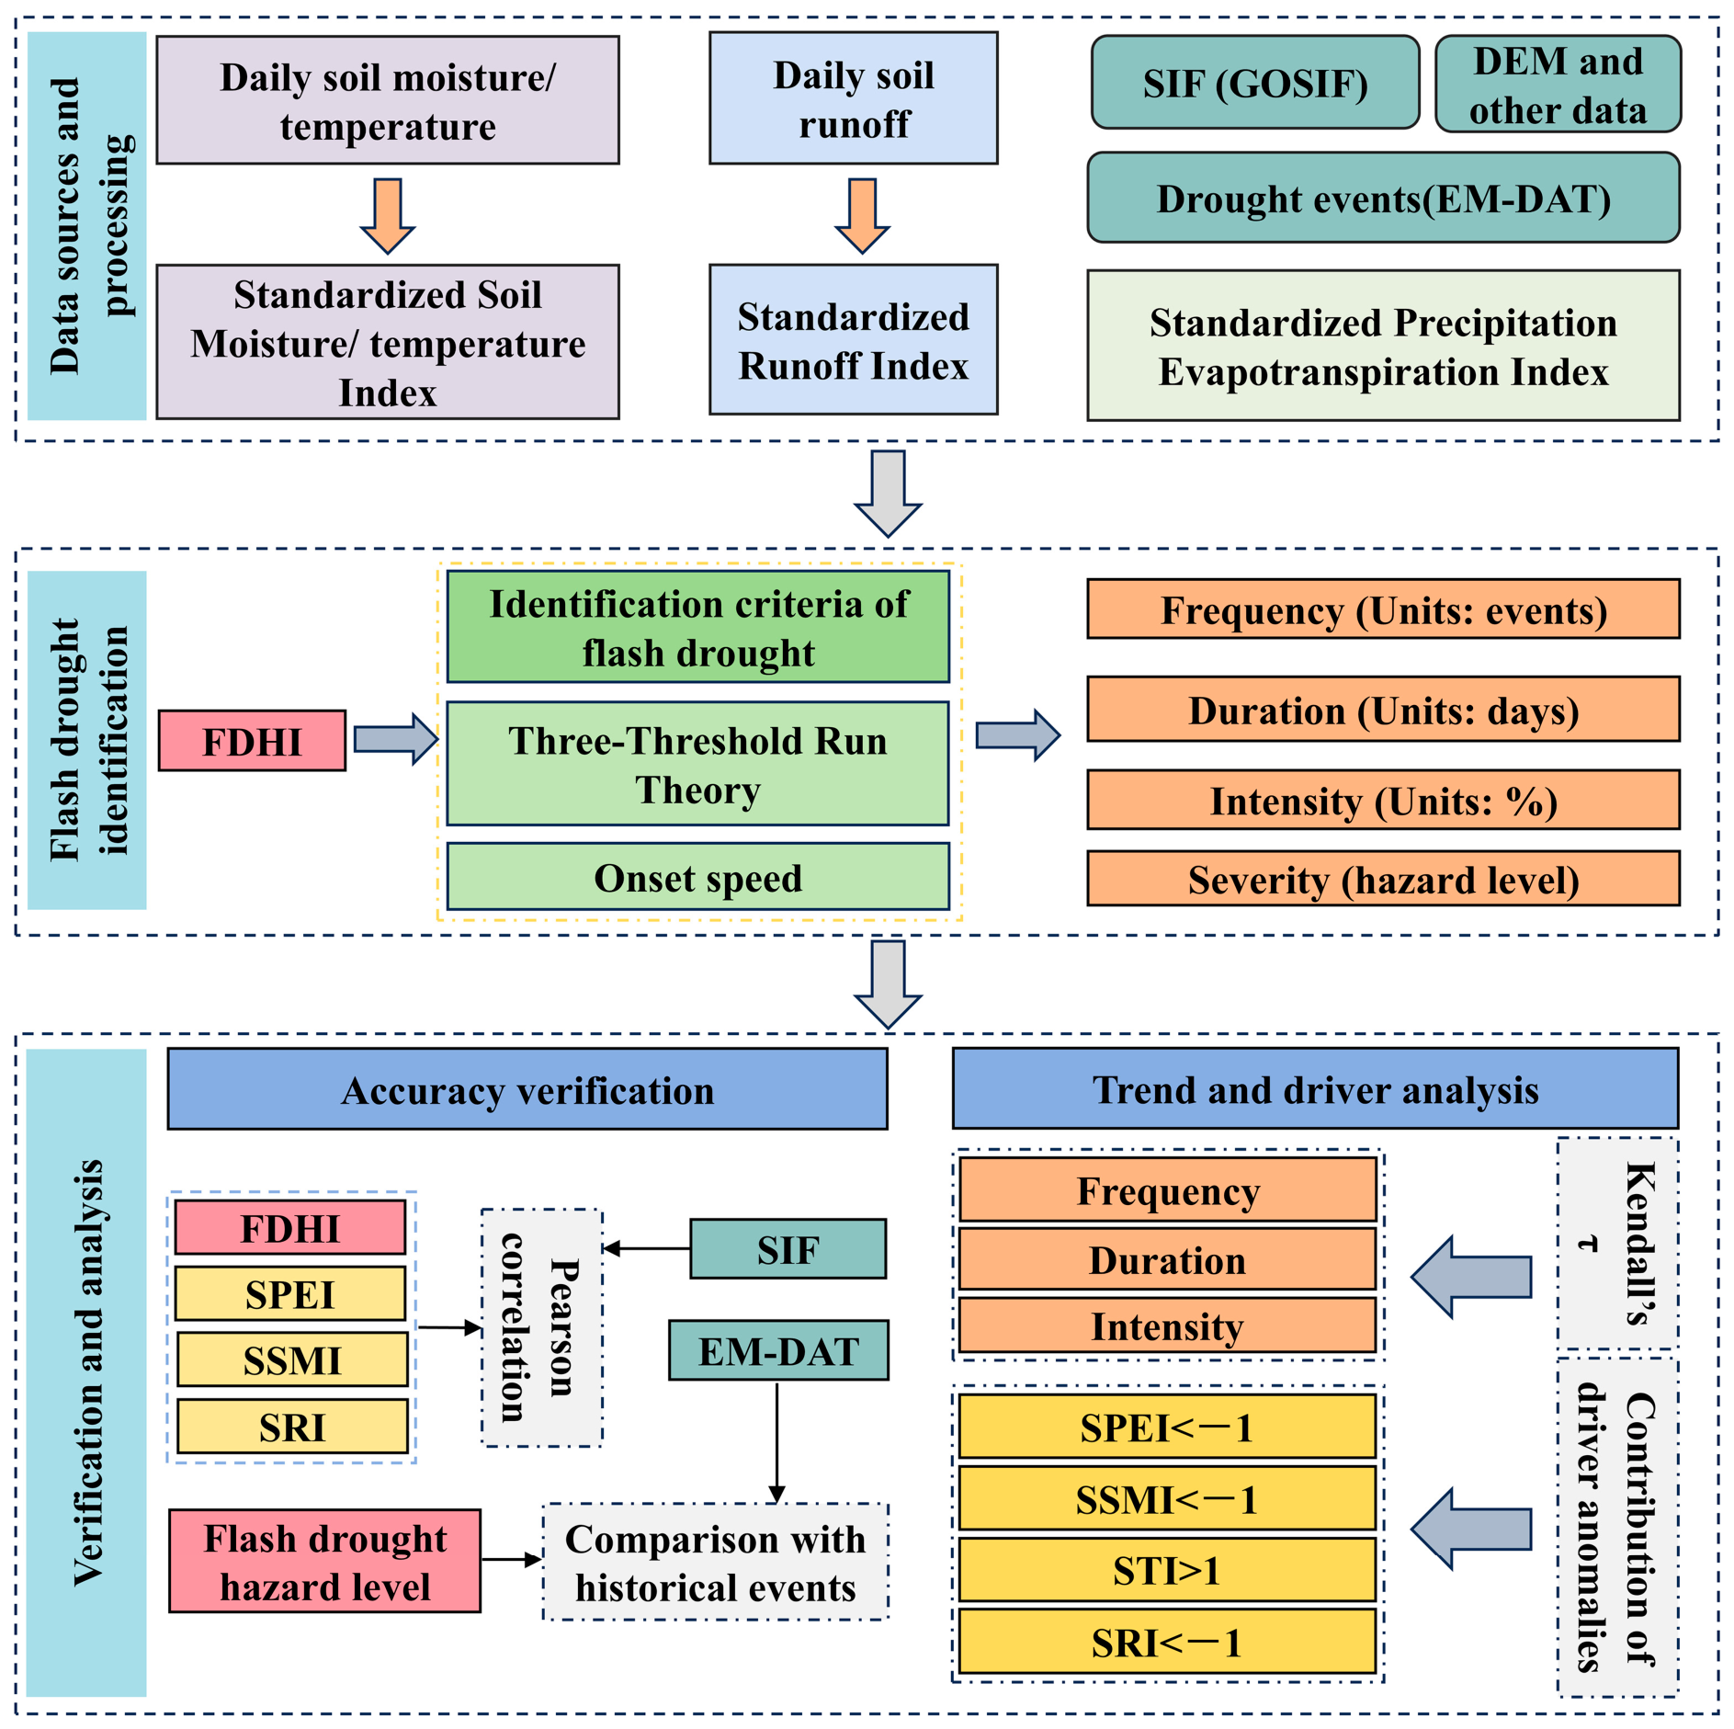
As shown in Figure 2, the framework of this study consists of four sequential stages. Step 1: Data acquisition. Step 2: Data processing. First, the spatial resolutions of the SPEI, SM, ST, and SR datasets were unified. The aforementioned datasets were resampled to a uniform 0.01° × 0.01° spatial resolution using the trilinear interpolation method. Then, SM, ST, and SR data were standardized to derive the SSMI, STI, and SRI indices. Step 3: An entropy weight method was employed to construct the Flash Drought Hazard Index (FDHI) by integrating indicators representing atmospheric water supply–demand conditions, soil moisture status, and hydrological processes. Specifically, the atmospheric water supply–demand, soil moisture, and hydrological components were represented by the daily-scale SPEI, SSMI/STI, and SRI, respectively. Step 4: The three-threshold run theory was applied to the FDHI to quantify the frequency, intensity, and duration of flash droughts. This step assesses flash drought hazard conditions during the crop growing season in the Black Soil Region of Northeast China. Step 5: Examine the spatiotemporal evolution, regional propagation patterns, and dominant driving mechanisms of flash drought hazard based on variations in frequency, duration, and intensity across different subregions.

2.4. Flash Drought Hazard Identification Method

2.4.1. Standard Normalization Index

To remove the climatological seasonal cycle and ensure that daily anomalies are comparable across different calendar days, a per-calendar-day standardization is applied. This is accomplished by subtracting the climatological mean and dividing by the climatological standard deviation for each calendar day, which realigns the seasonal baseline and removes the periodic seasonal signal. All indices (SPEI, SSMI, STI, SRI) follow the same standardization form:
I t = X t X ¯ t σ t
where X t is the observed value on day t, X ¯ t is the historical mean for the same calendar day, and σ t is the historical standard deviation.

2.4.2. Construction of Flash Drought Hazard Index

The entropy weight method [37] utilizes information entropy theory to determine the objective weights of individual indicators. In this method, the weight of each indicator is derived from its information entropy, which measures the degree of variation in the indicator’s values. The smaller the entropy, the greater the variation and the more information the indicator provides; hence, a larger weight is assigned. In this study, this method was employed to determine the weights of the standardized SPEI, SSMI, STI, and SRI indices, thereby constructing a Flash Drought Hazard Index (FDHI). These four indices were chosen to capture atmospheric supply–demand, soil condition, and hydrological response, while avoiding redundant evaporative-demand metrics (e.g., VPD) that would inflate the atmospheric weight. This approach effectively captures the information structure of each evaluation indicator, ensuring that the results are highly objective and scientifically sound. The specific formulas are as follows:
The information entropy value for each indicator is calculated. Entropy serves as a measure of the degree of dispersion in the data distribution, with its magnitude being inversely proportional to the amount of information the indicator provides. The formula for information entropy is expressed as follows:
E j = ln ( k ) 1 i = 1 m j = 1 k R i j ln ( R i j )
R ij = P i j i = 1 m P i j
Calculate the corresponding weights of each indicator using the following formula:
W i = 1 E i n E i , ( i = 1 , 2 , n )
This study develops a soil condition response index by integrating the SSMI and STI. The formula can be expressed as:
P = a × S S M I + b × S T I
where P is an integrated index that reflects crop flash drought stress through soil conditions. It captures the coupled dry–hot effects of soil moisture and temperature, which jointly regulate crop water stress and rapid soil desiccation during flash droughts. Combining SSMI and STI into a single P reduces model dimensionality, avoids multicollinearity, and supports a three-dimensional “atmosphere-soil-hydrology” monitoring framework (SPEI for atmosphere, P for soil, SRI for hydrology). The weights a and b for SSMI and STI are determined using the entropy weight method.
The Flash Drought Hazard Index is developed by integrating flash drought response indices from three dimensions: precipitation supply and demand, soil condition, and hydrological cycle, as expressed below:
F D H I = α × S P E I + β × P + γ × S R I
where FDHI denotes the Flash Drought Hazard Index, while SPEI, P, and SRI represent the flash drought response indicators derived from the atmospheric water supply–demand balance, soil condition, and hydrological response dimensions, respectively. These variables were selected because they collectively capture the key processes involved in flash drought propagation while avoiding redundancy among highly correlated atmospheric variables. Specifically, SPEI was used to represent precipitation–evapotranspiration anomalies and atmospheric moisture deficits, whereas SSMI and STI jointly characterize soil hydrothermal conditions associated with rapid soil drying and thermal stress. SRI was further included to represent hydrological responses to moisture deficits at the regional scale. The weights α, β, and γ assigned to SPEI, P, and SRI were calculated using the entropy weight method, and the resulting weights are presented in Table 2.

2.4.3. Flash Drought Hazard Level

The degree of crop hazard associated with flash drought is mainly influenced by its frequency, persistence, and intensity. In general, flash drought events occurring more frequently, lasting for longer periods, and exhibiting stronger intensity tend to produce more severe agricultural impacts. Consequently, the hazard magnitude can be quantified as the product of frequency, duration, and intensity, as Θ   =   Ϝ I ,   H ,   F .
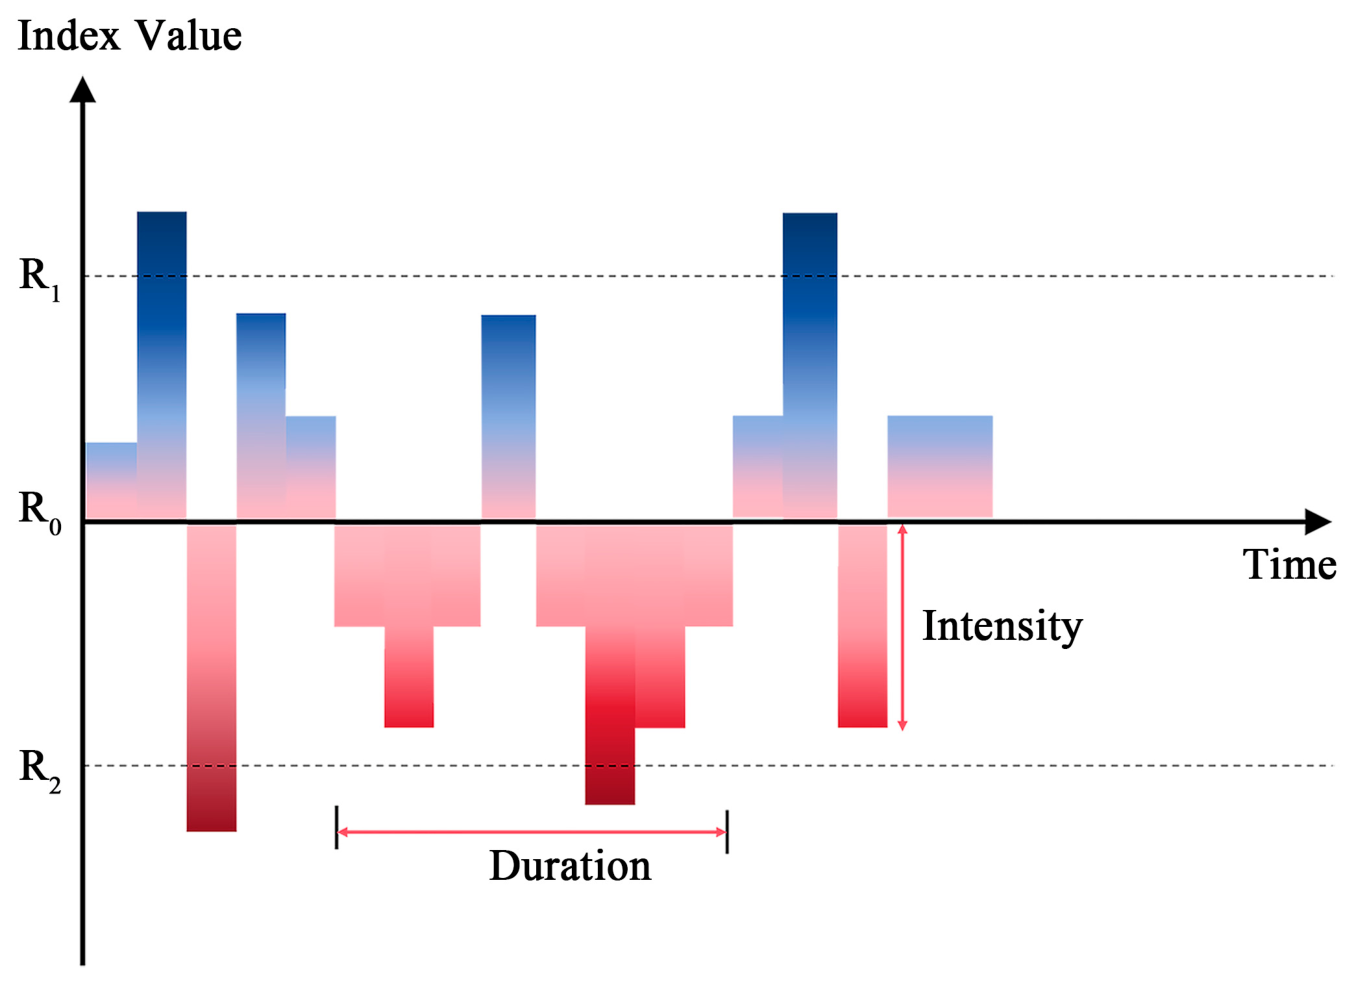
In this study, the three-threshold run theory [38] was employed to calculate the frequency and intensity of flash droughts. By defining three critical thresholds ( R 0 , R 1 , R 2 ), this method allows for the objective identification of the onset, termination, and duration of flash drought events from continuous time series data. A schematic illustration is provided in Figure 3. To distinguish flash droughts from conventional droughts, we quantified the intensification rate using the concept of onset speed. For each drought event identified by the three-threshold run theory, the intensification phase is defined as the period from the onset time t s to the time t p when the FDHI reaches its maximum value during that event. The onset speed S is defined as the mean rate of increase in FDHI during this phase:
S = F D H I t P F D H I t s t p t s
Based on the onset speed S of all drought events, flash droughts are separated from conventional droughts through a statistically grounded extreme-value criterion. Because there is no universal physical constant that defines rapid onset, extreme outliers in the upper tail of the onset-speed distribution are conventionally taken to represent flash droughts. Accordingly, we adopt the 95th percentile of S as the regional threshold. For our data, the 95th percentile corresponds to S = 0.18 d−1, meaning that an event with this onset speed can escalate from a near-normal state to a severe level within approximately 3–4 days, or from moderate to severe within a week, fully consistent with the sub-monthly onset window documented in global flash drought literature.
To examine whether this 95th percentile threshold yields a physically meaningful separation, we compared the key characteristics of the two resulting event groups (Table 3). Flash droughts identified by S ≥ P95 exhibit a significantly higher mean peak FDHI (0.65 vs. 0.34, p < 0.001), confirming their greater hazard severity. Their mean duration is markedly shorter (34.1 days vs. 37.8 days, p < 0.001), which matches the definition of flash droughts as events that emerge and terminate rapidly. These contrasts collectively validate the use of the 95th percentile as a robust and interpretable criterion for distinguishing flash droughts from conventional droughts in the Black Soil Region of Northeast China.
Flash drought intensity I j characterizes the severity of a specific flash drought event, calculated as the cumulative sum of the flash drought hazard index across all grid cells within the study area, from its onset time t s to its termination time t e . The formula is as follows:
I j = t s t e C t
The flash drought frequency F for crops refers to the percentage of flash drought occurrences at each station j (j = 1, 2, 3,…) within the study area during the crop growing season, relative to the total number of flash drought occurrences across all stations in the entire study area. Accordingly, flash drought levels are categorized for each study area to facilitate the calculation of the corresponding crop flash drought frequency F j .
F j = β i B × 100 %
Flash Drought hazard level on Crops K j :
Κ j = j = 1 m I j × j = 1 m H j × j = 1 m F j

2.4.4. Trend Analysis

Kendall’s τ [39] rank correlation coefficient is derived from the relative difference between concordant and discordant observation pairs of two variables, yielding a τ statistic that characterizes both the magnitude and direction of monotonic variation within a data sequence, with values ranging from −1 to 1. A positive τ indicates an upward trend, whereas a negative value represents a downward trend. In the present study, this method was applied to analyze temporal variations in flash drought characteristics. The corresponding equation is given as follows:
τ = 2 n ( n 1 ) j < i s i g n ( x i x j ) s i g n ( y i y j )

2.4.5. Contribution Rates of Driving Factors for Flash Drought

To assess the relative influence of different hydroclimatic variables during flash drought events, the contribution of each potential driving factor was calculated. For every identified flash drought event within an individual grid cell, anomalies of four candidate driving variables were evaluated: precipitation–evapotranspiration deficit (SPEI), soil moisture (SSMI), temperature (STI), and runoff (SRI). The anomaly of SPEI during the event was taken directly as its original standardized value, denoted as SPEI_A, since SPEI itself quantifies climatic water balance anomalies relative to a reference period. For SSMI, STI, and SRI, which exhibit pronounced seasonality, daily values were first converted to Z-scores using the climatology of the same calendar day (with 29 February mapped to 28 February) across the study period:
Z i , d = X i , d μ d σ d
where X i , d is the raw index on day d of year i, and μ d and σ d are the multi-year mean and standard deviation for that calendar day. The event-averaged Z-score was then designated as the anomaly value for each factor: SSMI_A, STI_A, and SRI_A.
An event was considered significantly influenced by a given factor if the corresponding anomaly value met a predefined threshold (SPEI_A ≤ –1.0, SSMI_A ≤ –1.0, SRI_A ≤ –1.0, STI_A ≥ 1.0). For each grid cell, let N t o t a l be the total number of flash drought events detected and N f a c t o r the number of events during which the factor was significantly anomalous. The contribution rate of factor F is defined as:
C F = N factor N t o t a l
This metric ranges from 0 to 1 and represents the proportion of flash drought events at that location that co-occur with significant anomalies of the respective driving factor.

2.4.6. Pearson Correlation Analysis

This study employs Pearson correlation analysis [40] between the FDHI and SIF to determine their interrelationship. The reliability and applicability of the FDHI for flash drought detection in the study area were evaluated by analyzing its relationship with SIF. In the assessment of their linear correlation, coefficients approaching 1 or −1 represent strong positive or negative associations, respectively, whereas values close to 0 indicate a weak or negligible linear relationship between the two variables.

3. Results

3.1. Spatial Patterns of Flash Droughts

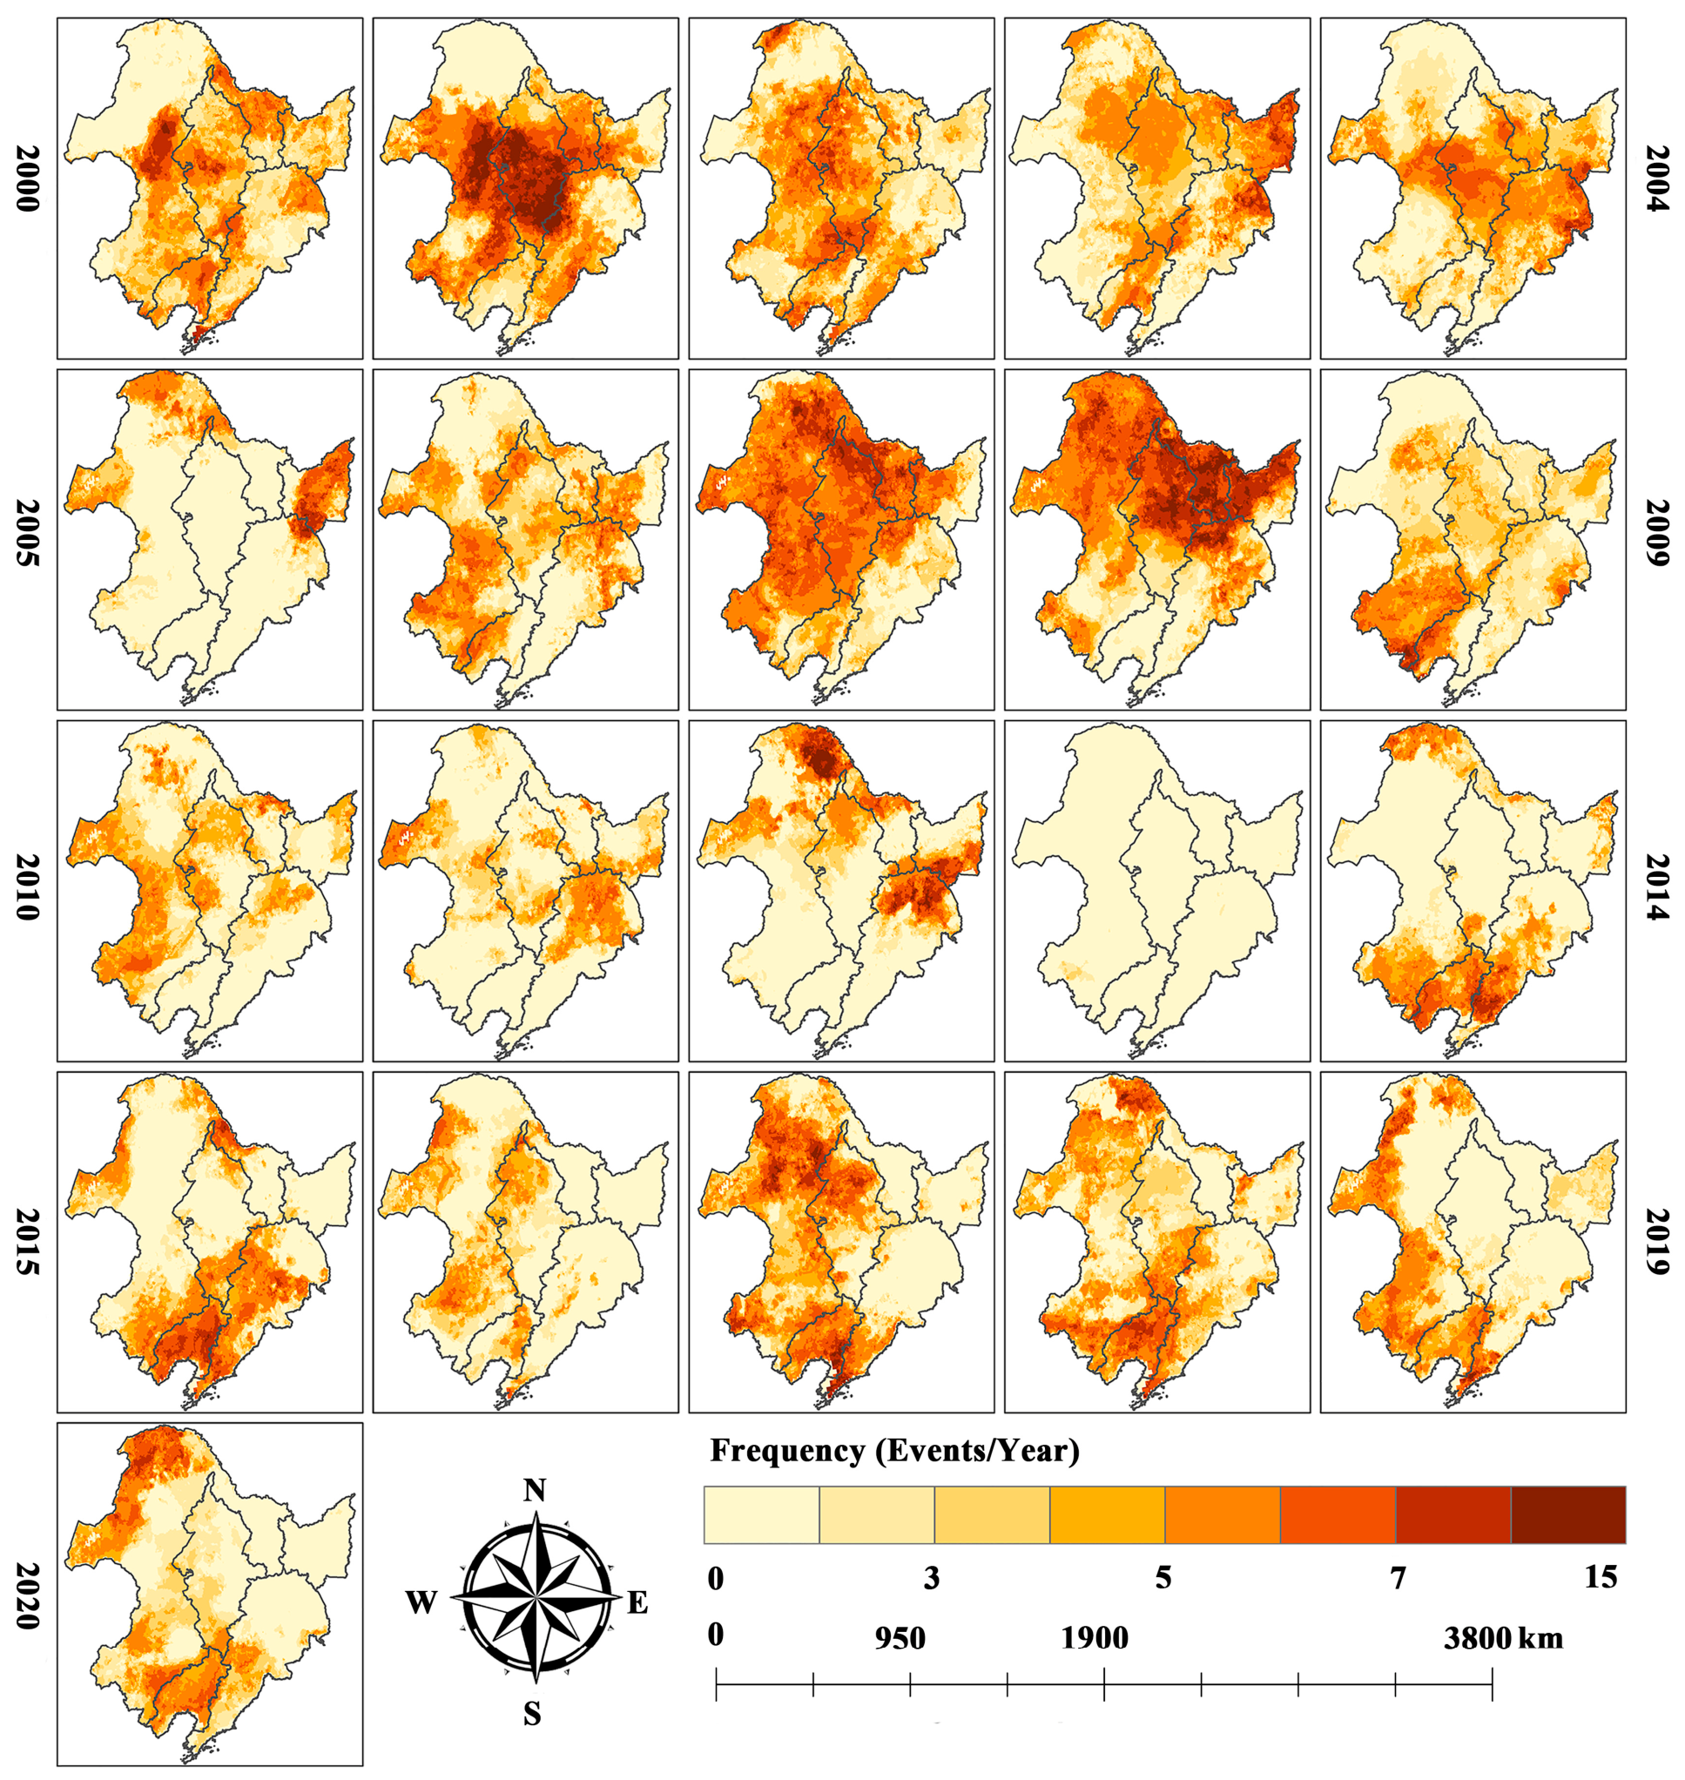
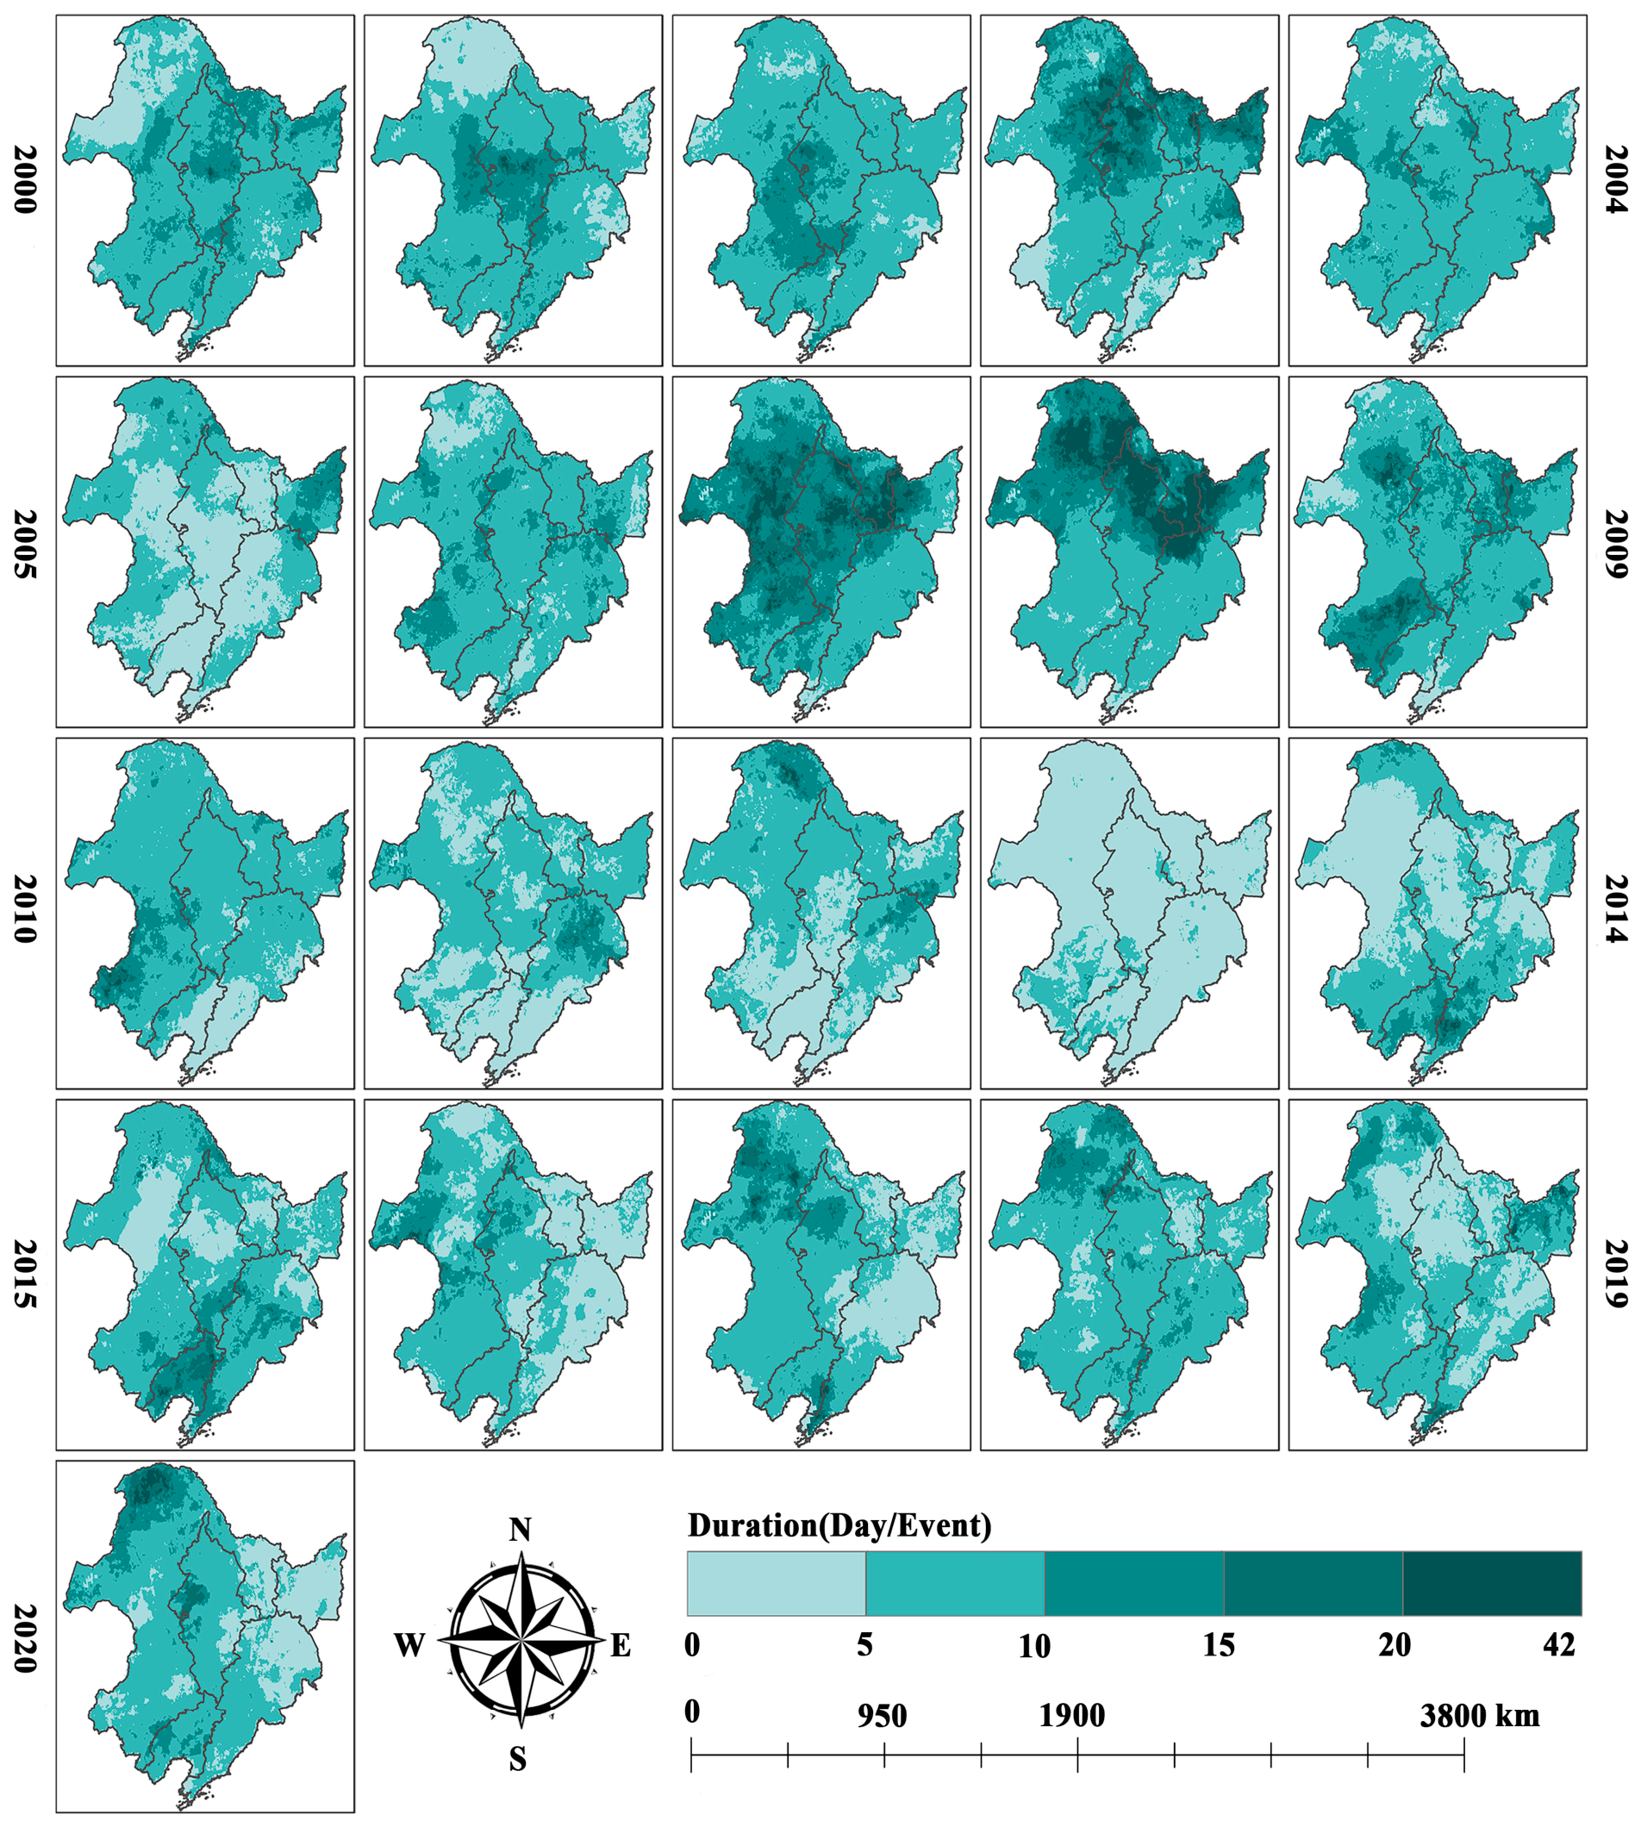
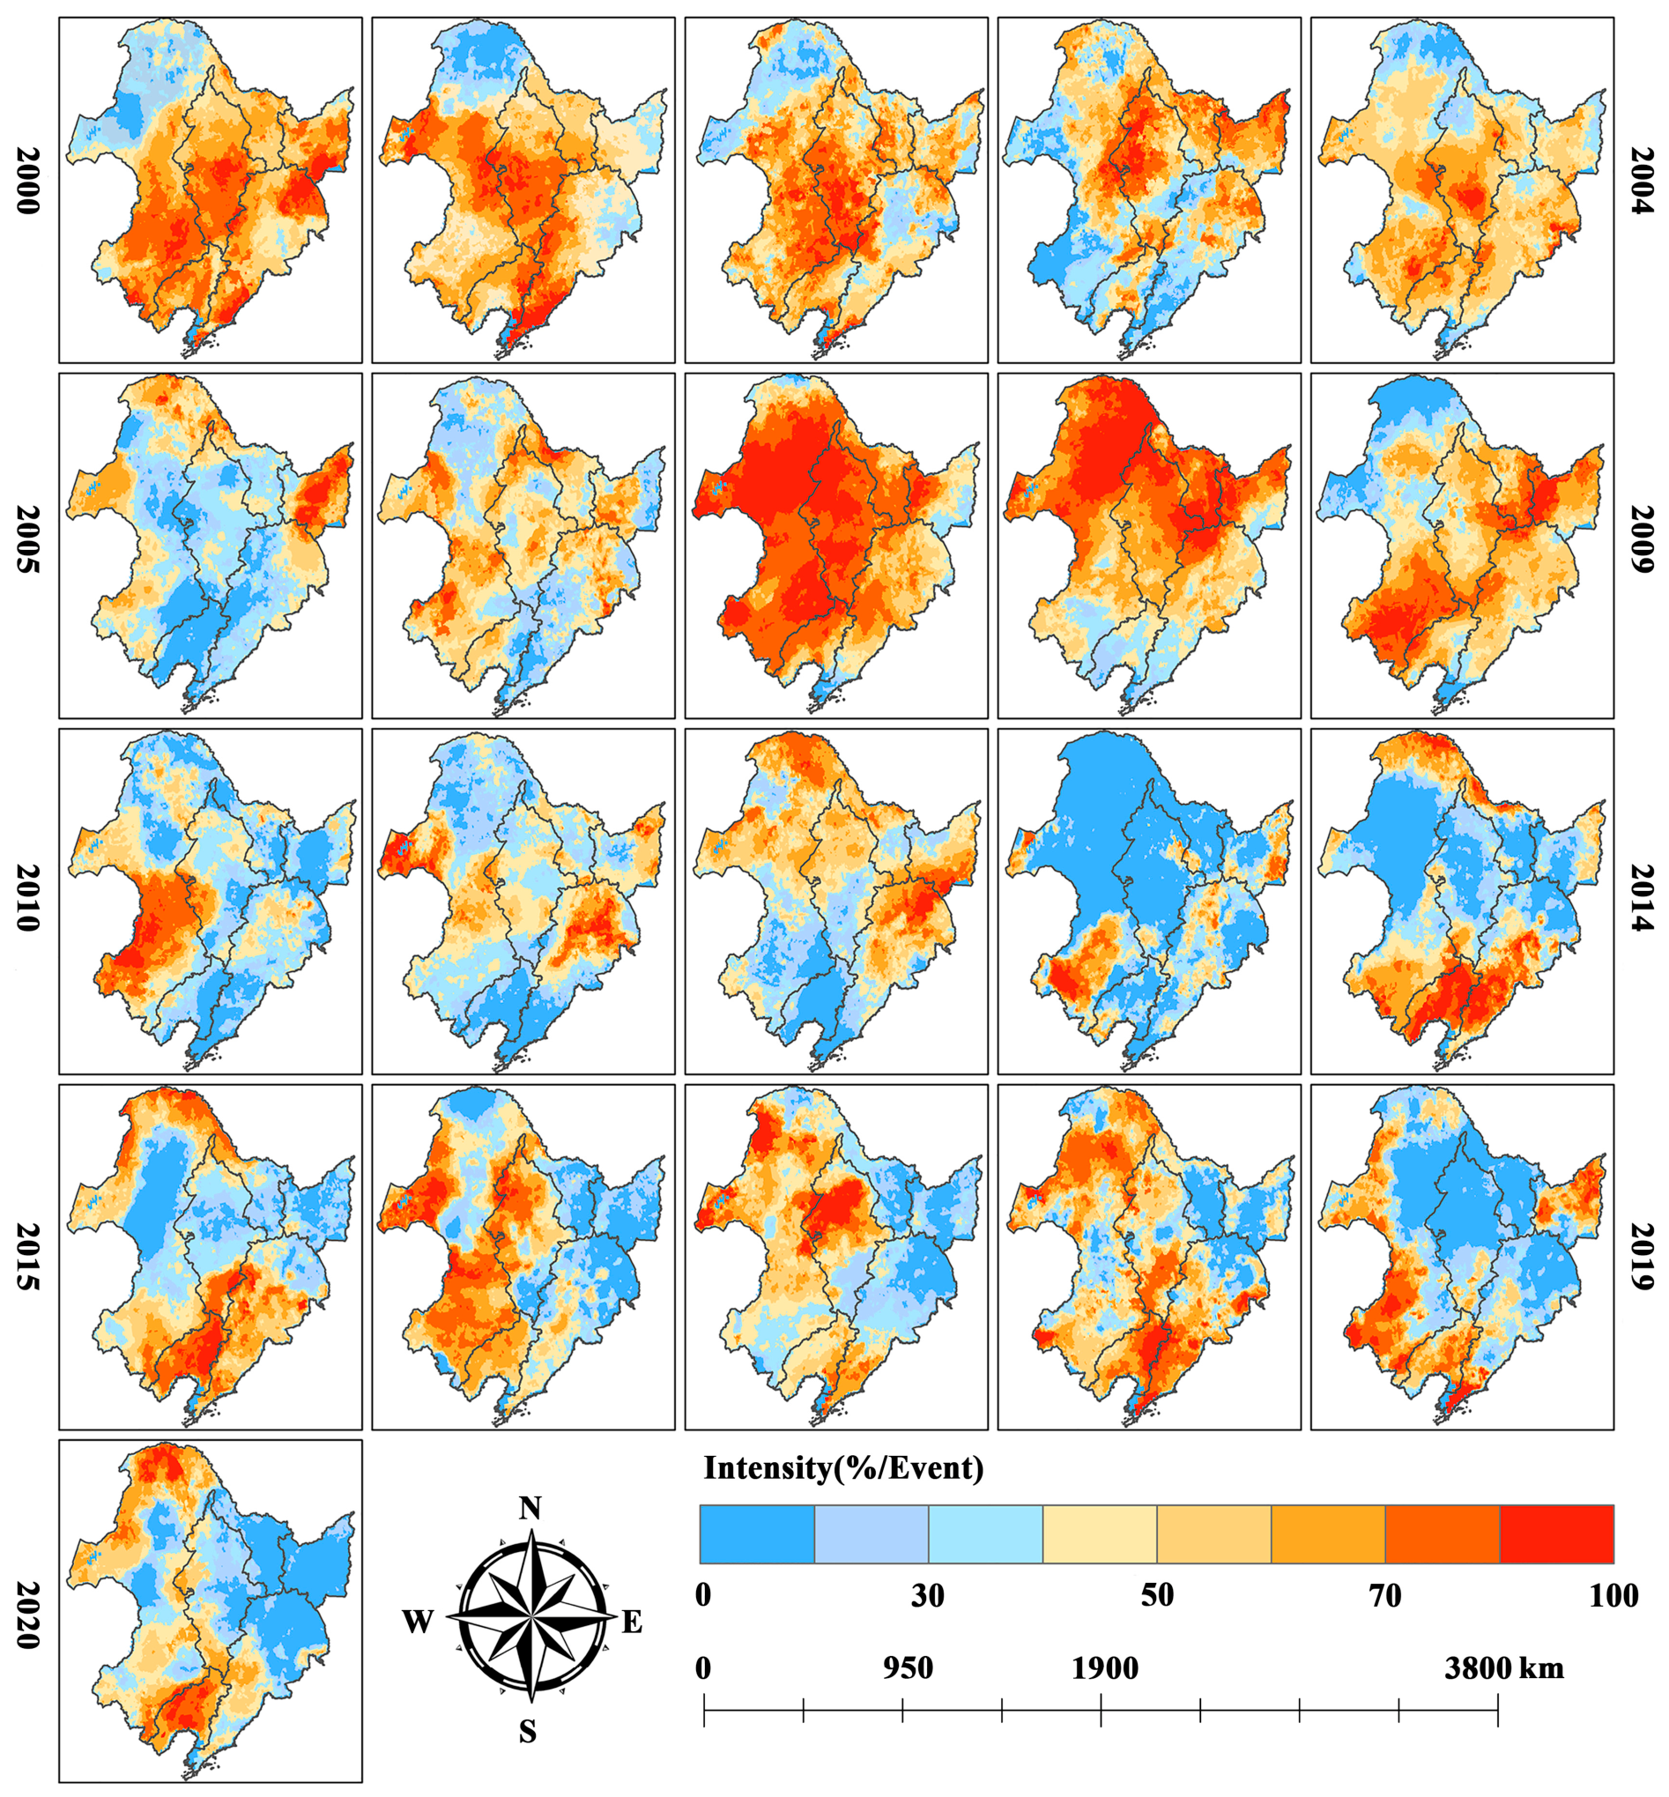
Drought events were identified using the FDHI and the three-threshold run theory. To distinguish flash droughts from all identified drought types, the onset speed threshold was set at the 95th percentile, with events exceeding this threshold classified as flash droughts. Figure 4, Figure 5 and Figure 6 present the spatial distributions of flash drought frequency, duration, and intensity across different agricultural regions of the Black Soil Region of Northeast China during the growing seasons from 2000 to 2020. As shown in Figure 4, the highest flash drought frequency was observed in the Songnen Plain (5.98 events per year), followed by the Liaohe Plain (5.80 events per year). Notably high frequencies were also recorded in the central Greater and Lesser Khingan Mountains (5.03 events per year) and the southern part of the Changbai Mountains–Liaodong Hills region (4.86 events per year). In contrast, relatively lower frequencies were found in the northeastern Greater and Lesser Khingan Mountains (4.16 events per year) and the northern part of the Changbai Mountains–Liaodong Hills region (4.11 events per year), while the Sanjiang Plain exhibited the lowest frequency (3.73 events per year). Duration and intensity generally exhibited spatial patterns similar to those of flash drought frequency, with regions characterized by more frequent flash drought occurrence also tending to experience longer-lasting events (typically lasting 20 to 42 days, as shown in Figure 5) and higher drought intensity. This spatial coherence highlights pronounced regional disparities in flash drought characteristics across the Black Soil Region of Northeast China.

3.2. Regional Variations of Flash Droughts

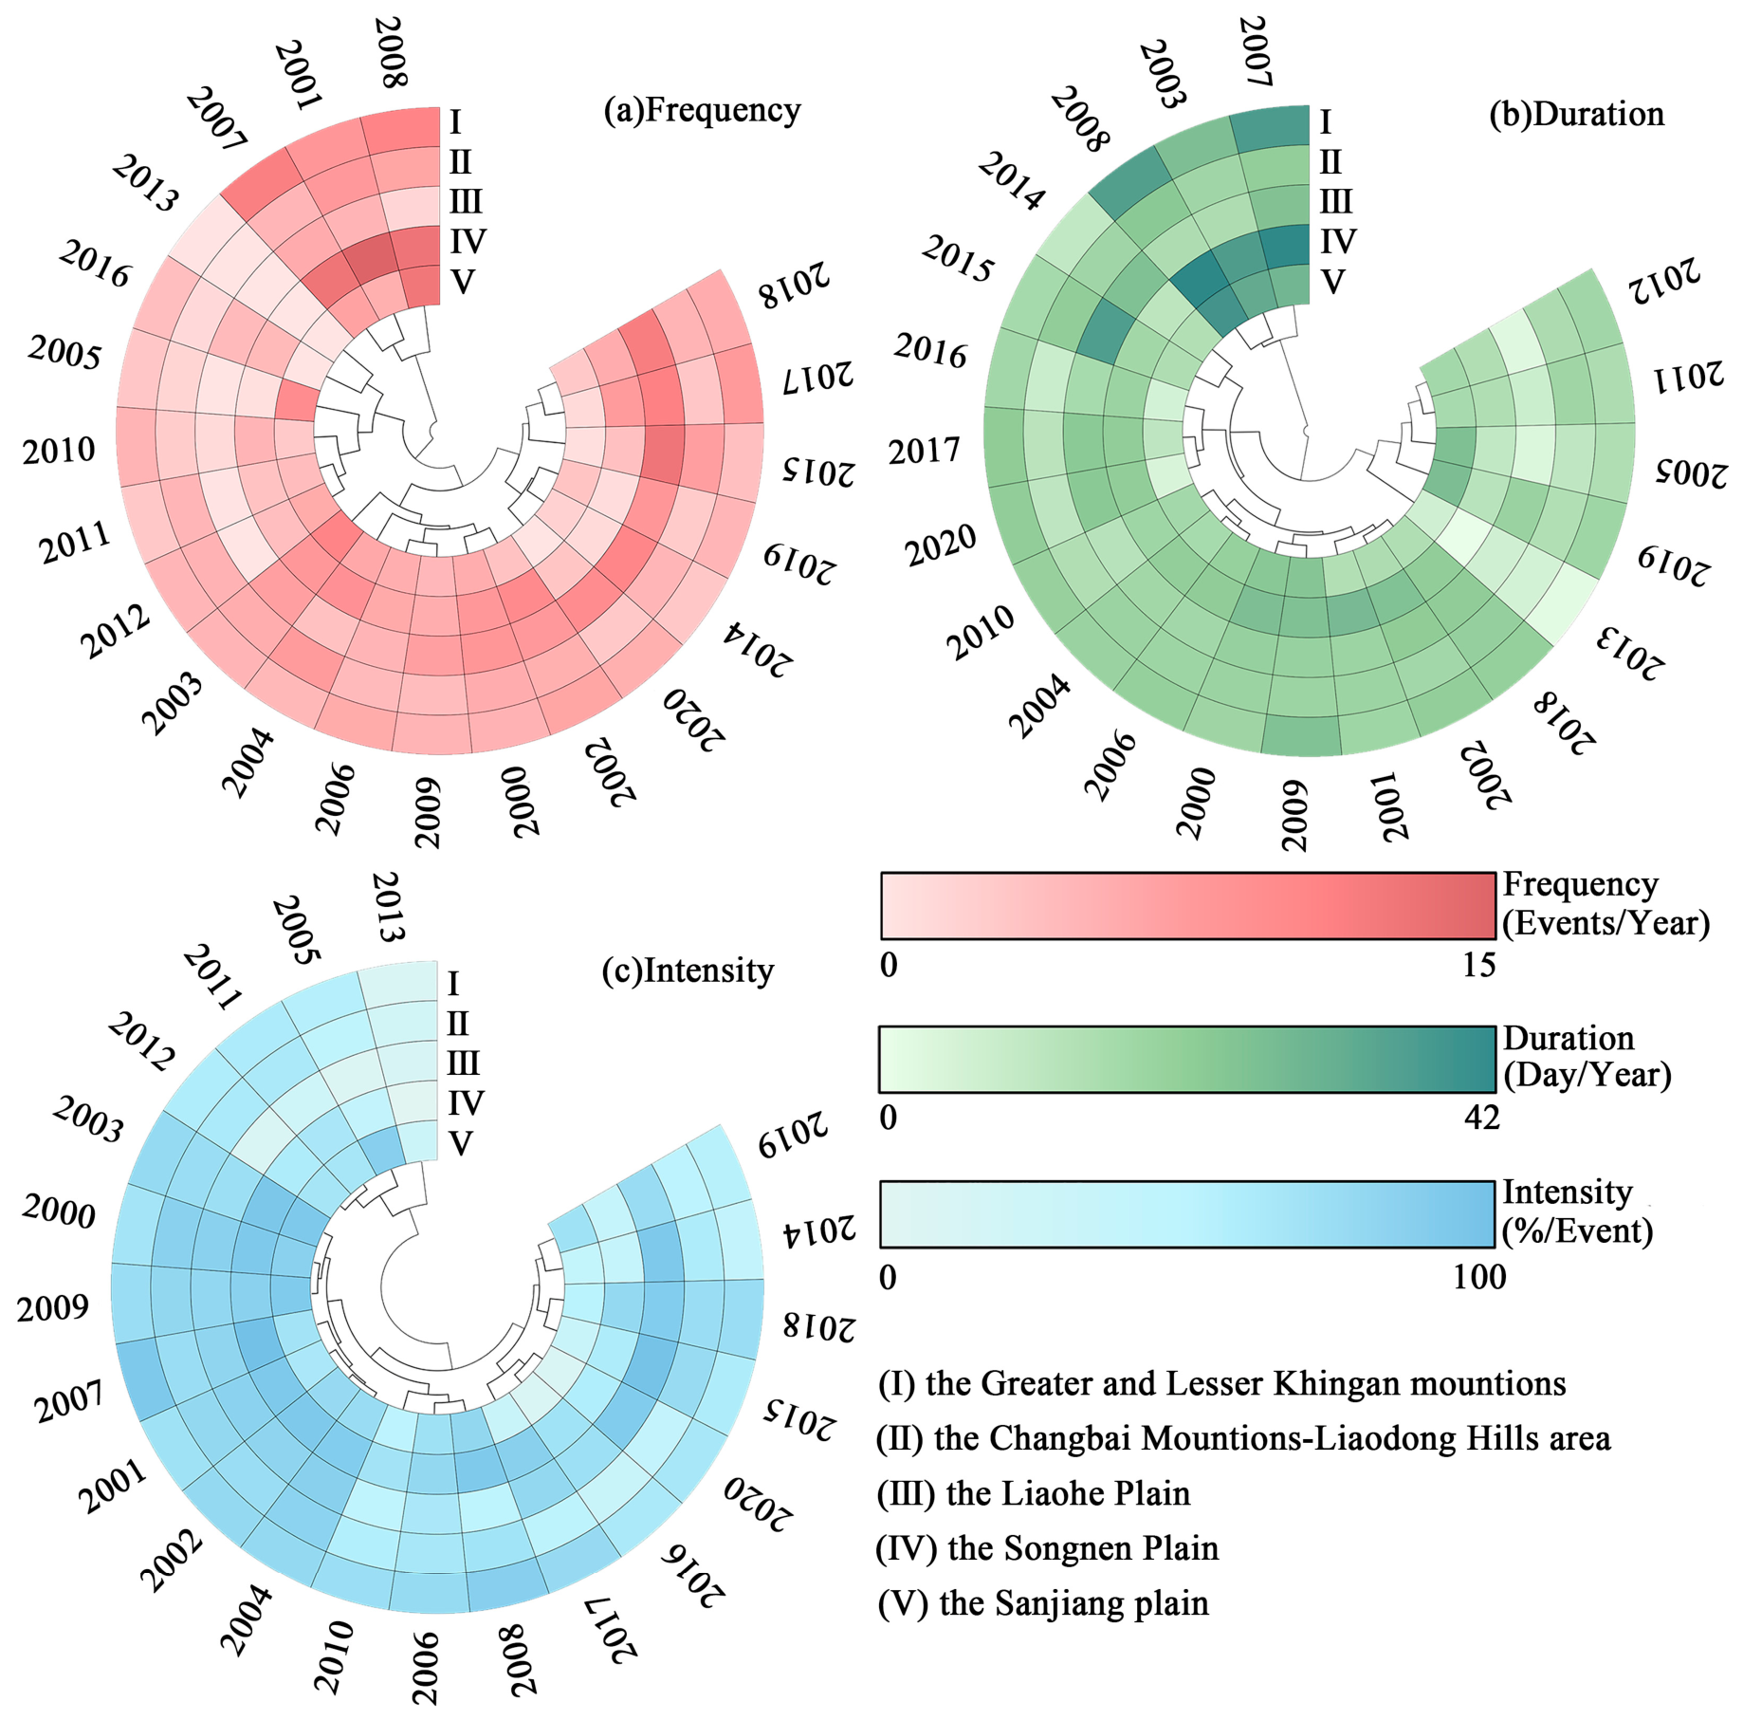
To investigate the regional differences and interannual variability of flash drought, we analyzed the interannual variations in flash drought frequency, duration, and intensity across the five major agricultural regions (Figure 7). Prior to 2010, the Songnen Plain experienced more severe flash drought events, with peak values recorded in 2007 and 2008 (frequency = 14.83 events per year, duration = 41.79 days per event, intensity = 87.36% per event). The Greater and Lesser Khingan Mountains, characterized by limited cropland primarily distributed in areas adjacent to the Songnen Plain, exhibited flash drought occurrences highly consistent with those of the Songnen Plain, with all flash drought attributes also peaking in 2007 and 2008. In contrast, the Liaohe Plain maintained relatively high flash drought attributes after 2010, reaching their maximum in 2014 and 2018 (frequency = 14.52 events per year, duration = 39.36 days per event, intensity = 85.88% per event). The Sanjiang Plain displayed elevated flash drought attributes only in 2007 and 2008, and as further illustrated in Figure 4, Figure 5 and Figure 6, flash drought events were predominantly concentrated in the western part of this region.

3.3. Trend Analysis for Flash Droughts

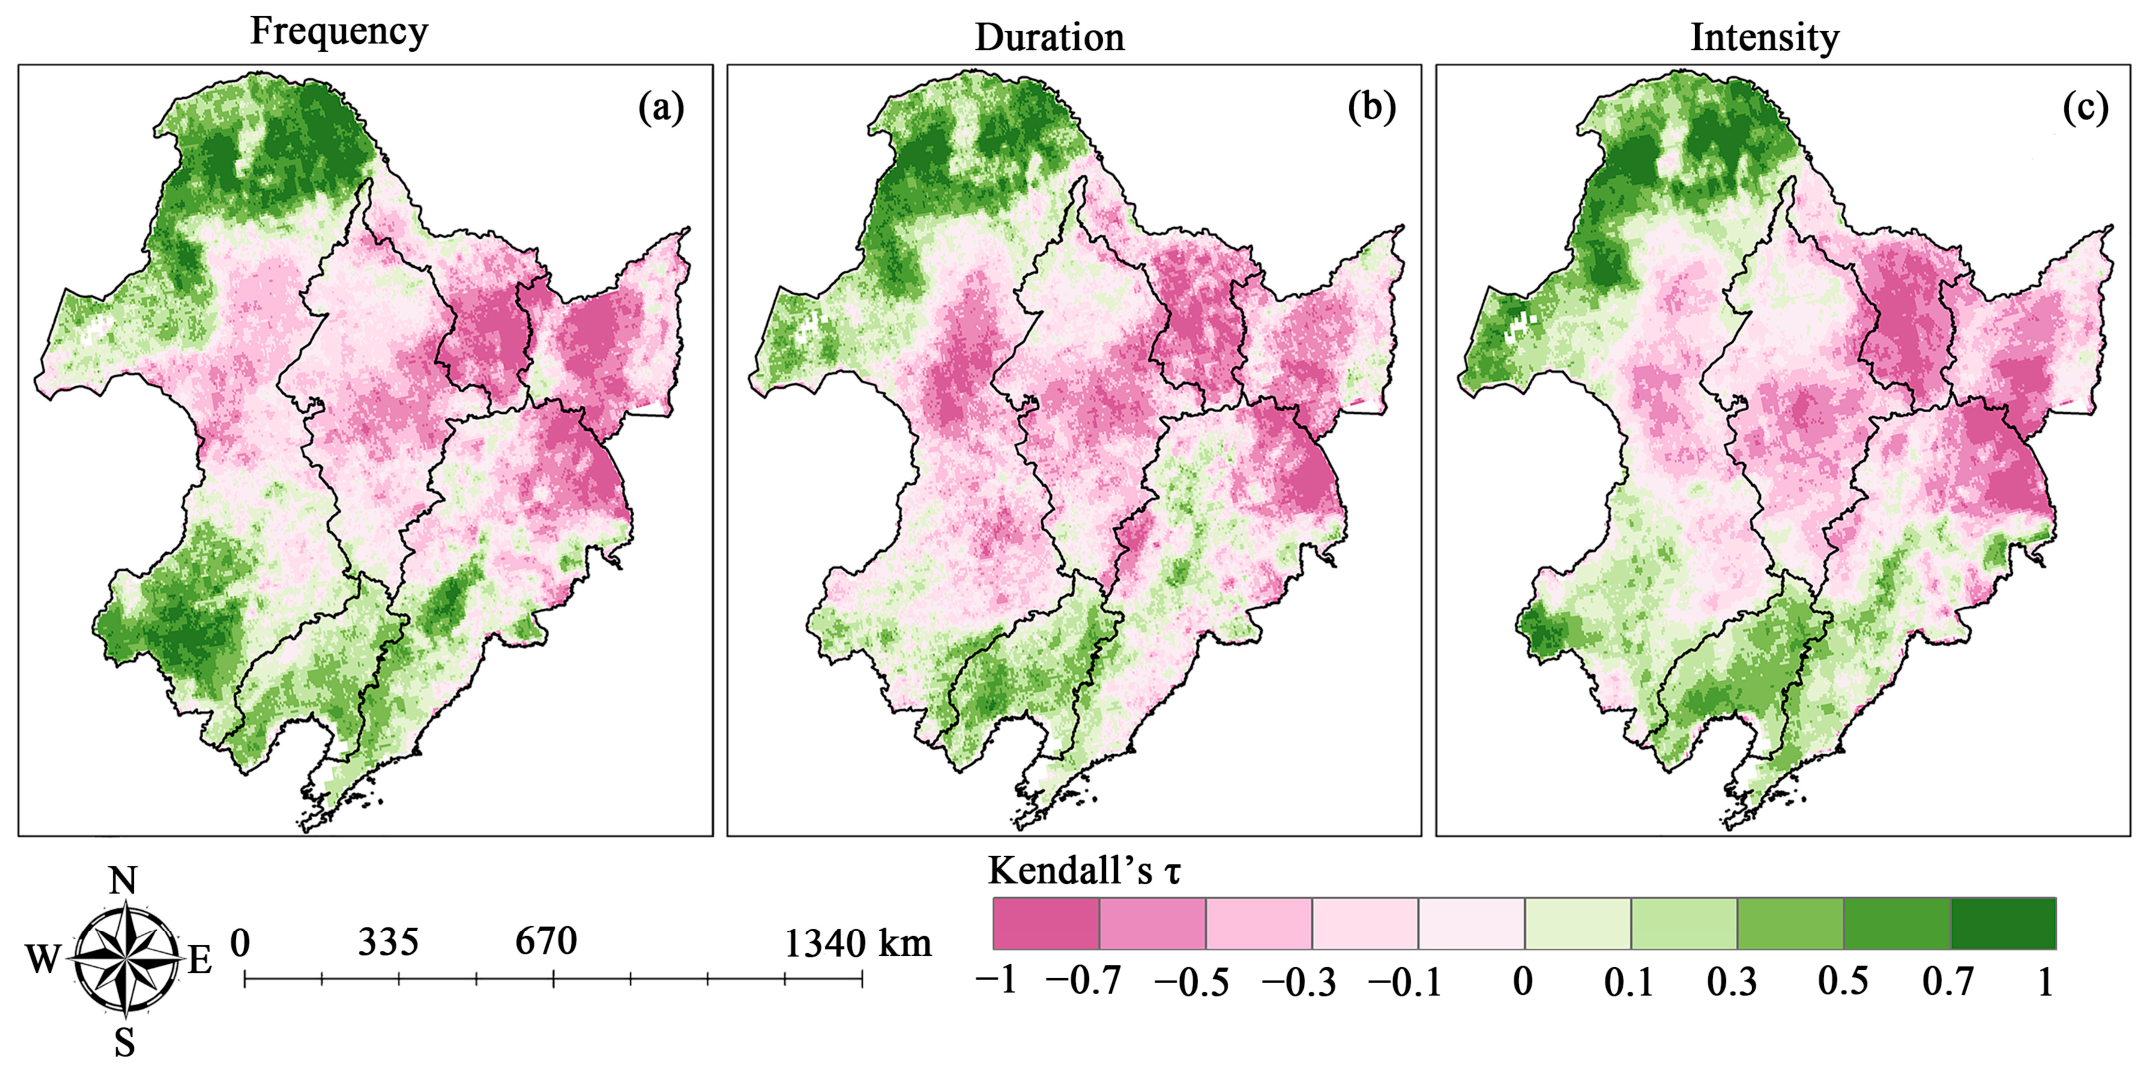
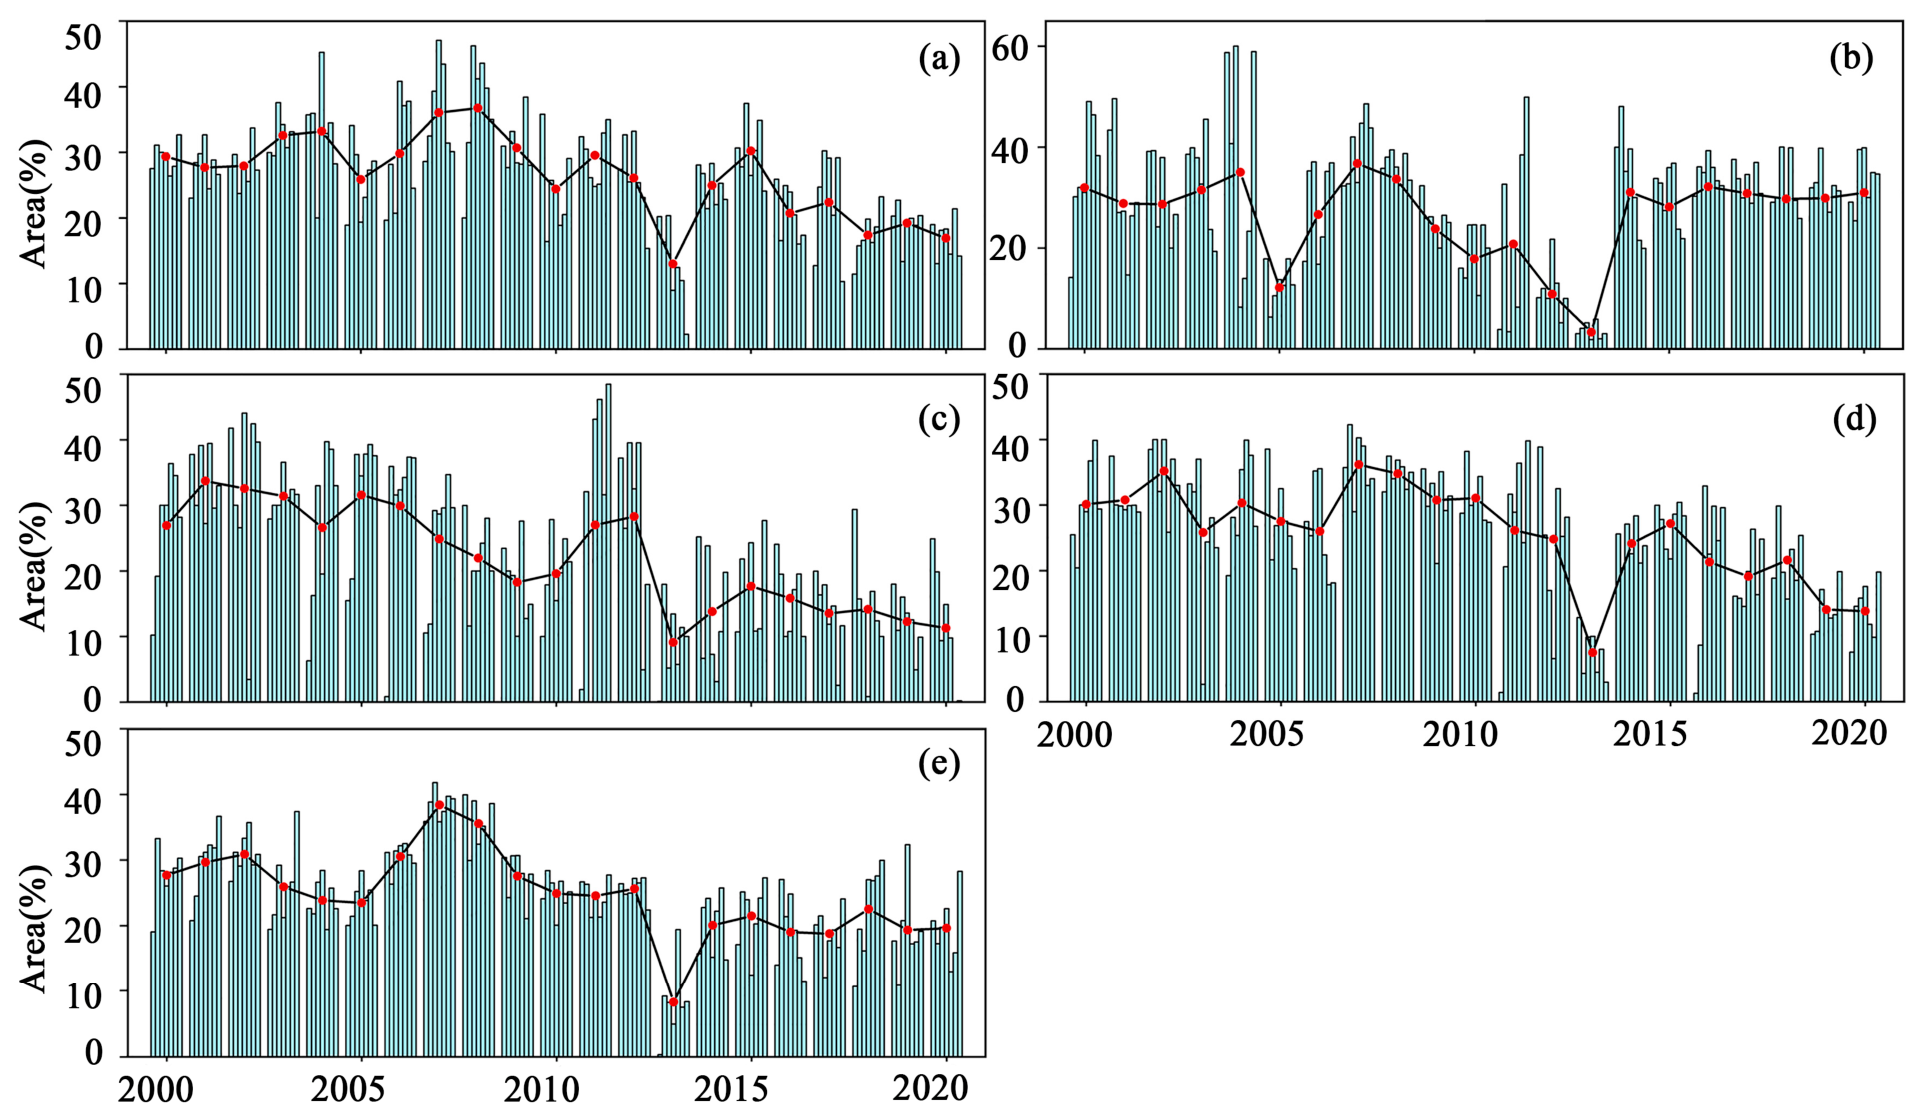
To characterize temporal variations in flash drought properties, Kendall’s τ was applied to perform a grid-scale trend analysis. As illustrated in Figure 8, positive τ values represent increasing tendencies through time, whereas negative values correspond to declining tendencies. Changes in flash drought duration and intensity showed strong spatial agreement with the regional patterns observed for flash drought frequency. Regions with declining tendencies were primarily distributed across the Songnen Plain, Sanjiang Plain, and northern sections of the Changbai Mountains–Liaodong Hills area. By comparison, increasing tendencies were largely observed in the southern portion of the Black Soil Region of Northeast China, particularly in the Liaohe Plain, where the increase in flash drought activity was most evident (Kendall’s τ > 0.3). To further evaluate the severity of flash drought impacts among the five principal agricultural zones of the study area, Figure 9 shows the proportional extent of regions exposed to flash drought hazards within each agricultural subregion. Between 2000 and 2013, the proportion of land influenced by flash drought remained comparatively high across all five agricultural regions, reaching nearly 60% in some years. After 2013, however, the spatial extent of flash drought impacts declined markedly in the Songnen Plain, Sanjiang Plain, Greater and Lesser Khingan Mountains, and Changbai Mountains–Liaodong Hills area. In contrast, the Liaohe Plain showed a pronounced expansion in flash drought-affected area, consistent with the spatial trend patterns presented in Figure 8.

3.4. Contribution of Driver Anomalies to Flash Droughts

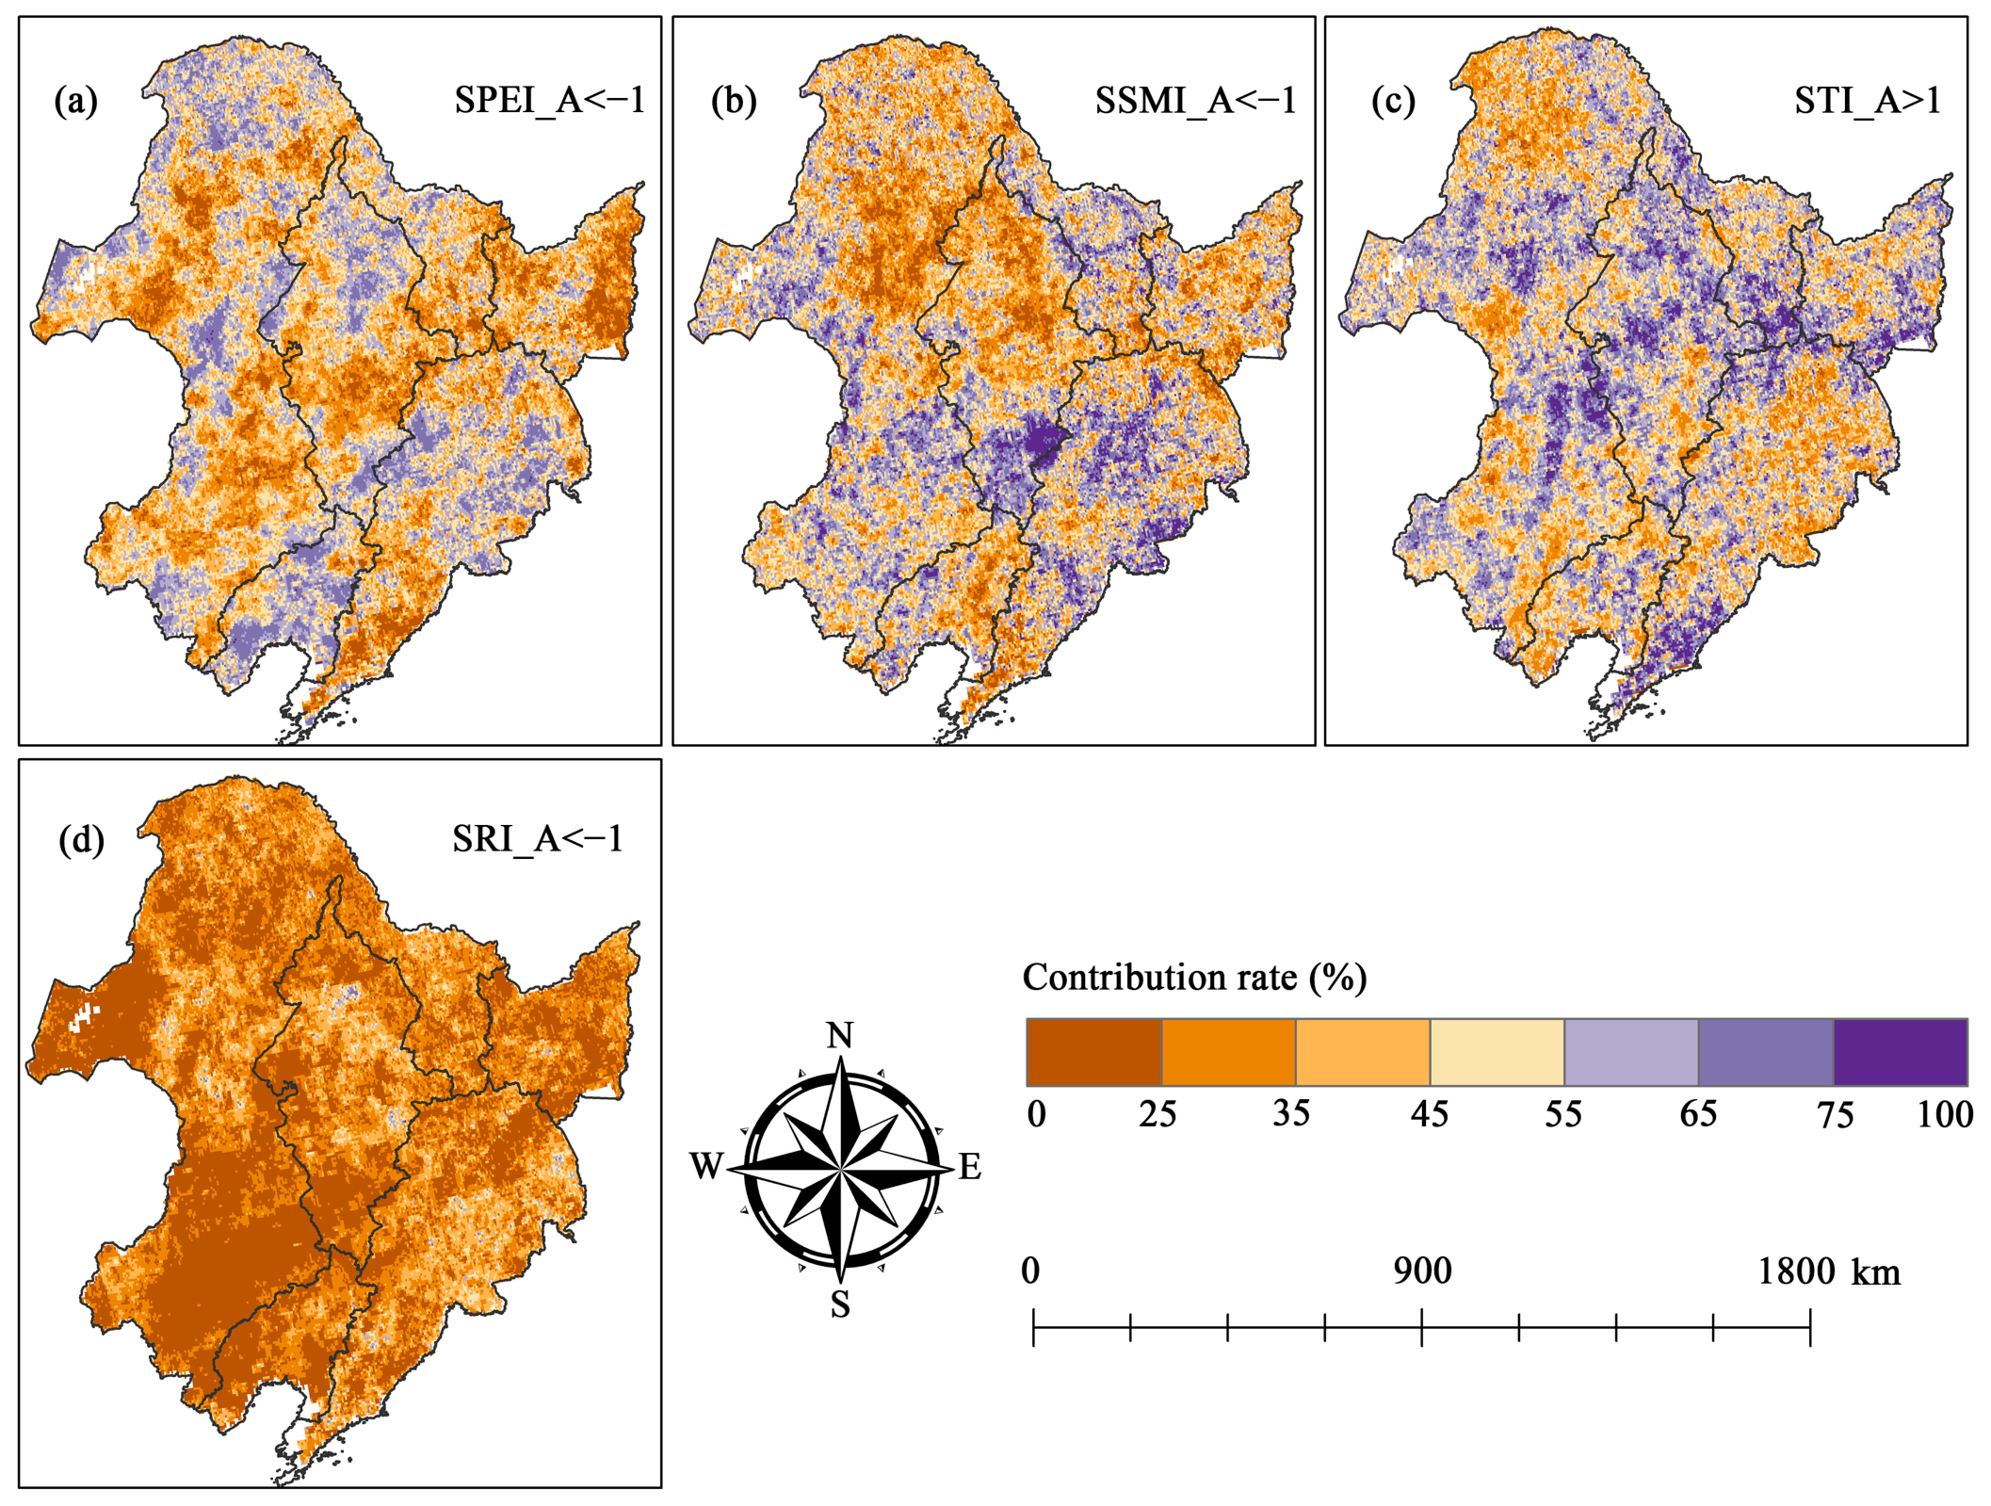
To evaluate the contributions of different driving factors to flash drought events, the average values of SPEI_A, SSMI_A, STI_A, and SRI_A were computed for each grid cell during individual flash drought events across the Black Soil Region of Northeast China over the 2000–2020 period, as presented in Figure 10. It can be observed that in the Changbai Mountains–Liaodong Hills region, all four driving factors exhibited high contribution rates (48.26%, 54.19%, 46.71%, and 33.42%, respectively), indicating that flash droughts in this area result from the coupled effects of multiple factors, including precipitation, evapotranspiration, and soil moisture. In contrast, in the Liaohe Plain, SPEI_A showed the highest contribution rate (56.33%), whereas in the Songnen Plain, the Greater and Lesser Khingan Mountains, and the Sanjiang Plain, the contributions of precipitation and evapotranspiration anomalies were relatively small, while SSMI_A and STI_A, which reflect soil moisture and temperature, exhibited higher contribution rates. These spatial patterns clearly indicate that the driving mechanisms of flash droughts in the Black Soil Region of Northeast China exhibit significant regional differentiation and cannot be uniformly attributed to the traditional paradigm of precipitation deficit dominance.

4. Discussion

4.1. Spatial and Temporal Characteristics of Flash Drought

The spatial distribution of flash droughts in the Black Soil Region of Northeast China reflects the combined influences of climate variability and regional cropping systems. As summarized in Table 4, substantial differences exist in crop rotation systems, cropping structures, and agricultural management practices among the major agricultural subregions. Higher flash drought frequency and intensity were mainly observed in the Songnen Plain and Liaohe Plain, whereas comparatively lower occurrences were identified in the Sanjiang Plain. The Songnen Plain is dominated by rainfed maize-soybean rotation systems with strong seasonal dependence on summer precipitation [41]. During the growing season, particularly in the maize reproductive stage, high transpiration demand combined with persistent heat conditions can rapidly accelerate root-zone soil moisture depletion, thereby increasing flash drought susceptibility [42]. In contrast, the Sanjiang Plain is characterized by irrigated paddy rice systems and widespread wetland conditions, where irrigation and standing water can partially buffer rapid soil drying and alleviate short-term agricultural water stress [43,44]. The intensified flash drought severity in the Liaohe Plain after 2013 may be related to the combined effects of regional warming and intensive agricultural production systems. Compared with other subregions, the Liaohe Plain has a more concentrated summer crop growth period and relatively higher agricultural water demand [45]. Under warming conditions, increased evapotranspiration and recurrent heat extremes may further intensify the imbalance between atmospheric water demand and available soil moisture, thereby promoting rapid flash drought development [46]. In addition, previous studies have indicated that long-term intensive cultivation and simplified crop rotation systems may weaken soil structure stability and reduce soil water retention capacity, which can further accelerate soil moisture depletion during hot and rainless periods [47]. Therefore, the spatial heterogeneity of flash drought in the Black Soil Region is controlled not only by climatic anomalies, but also by regional differences in cropping systems, agricultural water demand, and crop–soil water interactions.

4.2. Regional Patterns of Driven Factors

Our findings highlight the need for a paradigm shift from a monolithic, precipitation-deficit-centered framework toward a region-specific, multi-mechanism approach. As shown in Figure 10, the Songnen Plain and adjacent interior regions exhibit high contribution rates from SSMI_A and STI_A, while SPEI_A—the conventional atmospheric indicator—remains comparatively low. This spatial pattern reveals a distinct soil condition-dominated flash drought mechanism, in which anomalous soil moisture and temperature can trigger rapid agricultural stress without a proportionally strong atmospheric drought signal, thereby diminishing the prerequisite role of conventional precipitation-deficit indicators in these regions. At its core lies a two-step land-driven process. Anomalous soil warming, often amplified by earlier snowmelt or reduced cloud cover, intensifies surface sensible heat flux at the expense of latent heat flux, sharply elevating the near-surface vapor pressure deficit even in the absence of a canonical heatwave [48,49]. This soil-temperature-driven evaporative stress is compounded by the soil memory of antecedent moisture deficits accumulated from prior dry seasons [50]. As the root-zone silently approaches wilting point, a modest, otherwise benign dry spell can abruptly exhaust the remaining soil moisture buffer, creating the illusion of a rapid-onset crisis from a modest atmospheric trigger [51]. The coupling of these two mechanisms suppresses local evapotranspiration to the point of breaking the regional moisture recycling loop, rendering the land dependent on external advection and decoupled from local precipitation generation [52,53]. This pathway demonstrates that, in such regions, soil moisture and temperature must be treated as primary rather than auxiliary drought indicators.

4.3. Methods to Identify Flash Droughts

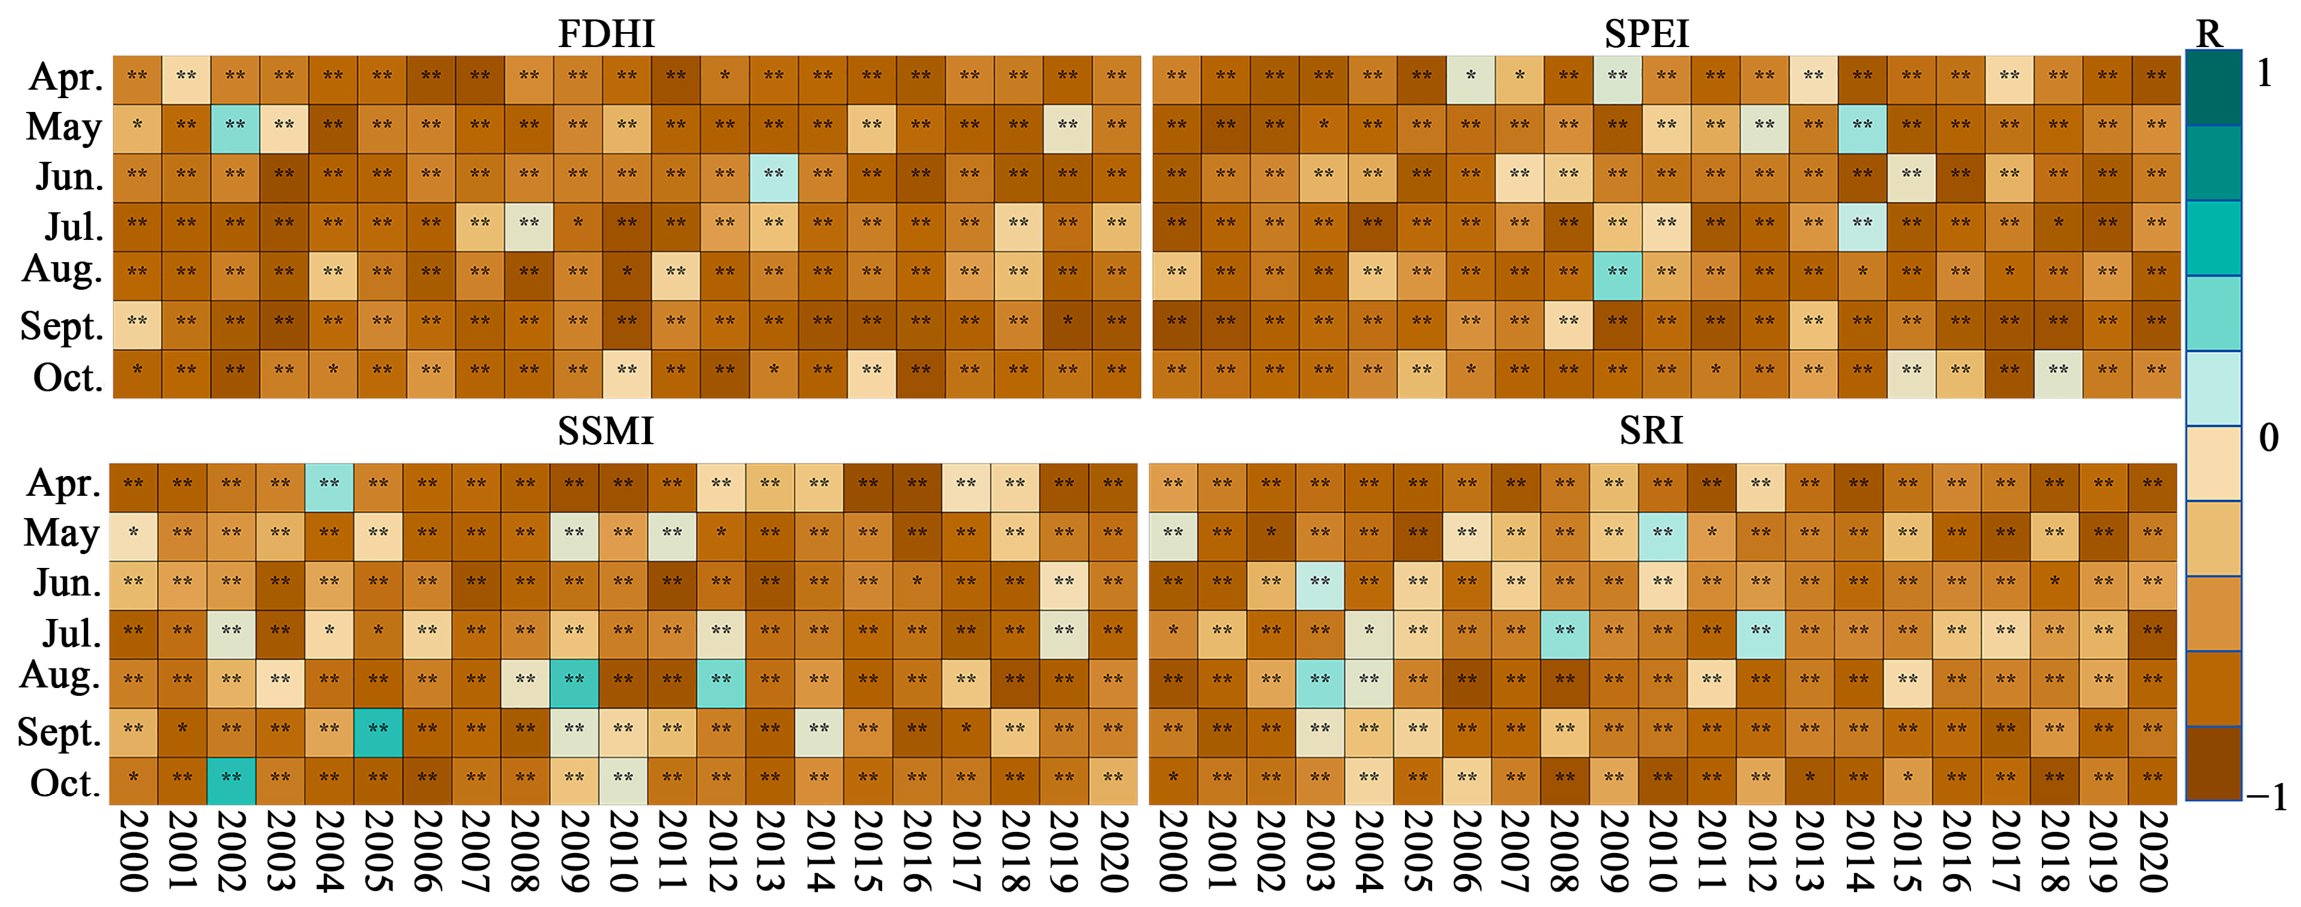
To evaluate the drought monitoring performance of the FDHI, we compared this composite index and three univariate drought indices (SPEI, SSMI, SRI) against SIF using Pearson correlation analysis. The monthly spatial correlations among these indices and SIF from 2000 to 2020 were examined (see Figure 11). The proportion of months with correlation coefficients exceeding −0.5 for FDHI, SPEI, SSMI, and SRI relative to SIF was 77% (mean r = −0.631), 62% (mean r = −0.573), 57% (mean r = −0.449), and 49% (mean r = −0.418), respectively, with correlations statistically significant at the 99% confidence level in almost all months. This analysis indicates that FDHI captures drought conditions more effectively than the single-variable indices. To further validate the monitoring effectiveness of FDHI, its identification results were compared with historical flash drought records from the authoritative EM-DAT international disaster database, alongside parallel comparisons with the individual indices (SPEI, SSMI, SRI), as detailed in Table 5. The comparative analysis shows that during major flash drought events in the Liaohe and Songnen Plains in 2015, all single indices and the composite FDHI successfully identified the events. However, for flash drought events in the Liaohe Plain in 2014 and 2017, only FDHI’s monitoring results fully aligned with the EM-DAT records, whereas every single index exhibited varying degrees of missed or false detection. This key difference highlights the significant advantage of the composite index over single indicators.
Although the FDHI was specifically developed for the Black Soil Region of Northeast China, the multi-factor framework proposed in this study may provide a useful methodological reference for flash drought monitoring in other agricultural regions because it is based on fundamental hydroclimatic processes involved in flash drought evolution. However, the dominant mechanisms controlling flash drought development may vary substantially among regions with different climate conditions, soil properties, vegetation characteristics, and agricultural management practices. Previous studies have shown that flash drought propagation exhibits considerable regional differences under different hydroclimatic environments [54]. Therefore, direct application of the FDHI to other agricultural regions may introduce uncertainties, and region-specific recalibration of factor weights and drought thresholds would likely be necessary. Future studies should further evaluate the applicability and robustness of the framework under diverse climatic and agricultural conditions.

4.4. The Significance and Limitations of This Study

Our findings provide important implications for flash drought hazard assessment and agricultural drought risk management in the Black Soil Region of Northeast China. The FDHI developed in this study provides a useful framework for quantitatively characterizing the frequency, duration, intensity, and spatiotemporal evolution of flash drought events during critical crop growth periods, thereby providing a useful framework for characterizing regional flash drought hazards. In addition, the identified regional differences in flash drought driving mechanisms suggest that drought prevention and mitigation strategies should be adapted to local environmental conditions. For example, in the Liaohe Plain, where flash drought occurrence is more strongly associated with precipitation and evapotranspiration anomalies, improving meteorological monitoring and optimizing irrigation scheduling during key crop growth stages may help alleviate drought risk. In contrast, in regions such as the Songnen Plain and the Greater and Lesser Khingan Mountains, where soil moisture and temperature anomalies play a more dominant role, enhancing soil water conservation capacity and improving farmland moisture retention practices may be more effective. These findings highlight the importance of region-specific drought assessment and adaptive agricultural management under increasing climate extremes.
However, several limitations of this study should be acknowledged. Although the FDHI effectively integrates atmospheric water demand, soil hydrothermal conditions, and hydrological responses for regional flash drought identification, the current framework still relies on spatially uniform drought-response thresholds and does not explicitly account for crop-specific physiological characteristics or soil physical heterogeneity. In agricultural systems, crop sensitivity to water deficits varies substantially among crop types and across different phenological stages. For example, maize is generally more vulnerable to short-term water stress during tasseling and grain-filling stages, whereas soybean exhibits relatively stronger drought resistance during early vegetative growth [55,56]. Consequently, a flash drought event with an average duration of approximately 24 days may produce markedly different agricultural impacts depending on the affected crop type and growth stage. The use of a unified FDHI threshold may introduce uncertainties when translating hydrometeorological anomalies into actual crop drought stress. In addition, this study incorporated soil moisture and soil temperature conditions through SSMI and STI, but did not explicitly include physical soil properties such as soil texture, clay and sand fractions, bulk density, organic matter content, or soil water holding capacity. These properties strongly regulate infiltration, water retention, evaporation efficiency, and the rate of soil moisture depletion during hot and rainless periods, thereby influencing flash drought propagation processes [57]. For instance, compared with clay-rich soils that retain moisture for longer periods, coarse-textured soils with higher sand fractions generally exhibit more rapid soil drying and weaker water storage capacity, which may accelerate flash drought onset [58]. Although black soils are generally characterized by high organic matter content and relatively strong water retention capacity, substantial spatial heterogeneity in soil hydraulic properties still exists across the Black Soil Region of Northeast China and may contribute to regional differences in flash drought evolution.
Future improvements of the FDHI framework should therefore focus on integrating dynamic crop–soil response mechanisms into flash drought identification rather than relying solely on regionally uniform thresholds. From the crop perspective, crop-specific drought sensitivity coefficients and phenology-dependent weighting schemes could be incorporated to better represent variations in crop water demand and physiological resistance during different growth stages. From the soil perspective, integrating soil hydraulic parameters, including field capacity, wilting point, saturated hydraulic conductivity, and soil texture information, may improve the representation of land-surface water storage and depletion processes. Such developments would enhance the capability of the FDHI to distinguish hydrometeorological flash droughts from actual agricultural drought impacts and improve its applicability for crop-specific drought risk assessment and agricultural management.

5. Conclusions

Given the diverse topography of the Northeast black soil region and the complex nature of flash drought, relying on a single factor proves inadequate for effective flash drought monitoring across the entire area. This study developed a Flash Drought Hazard Index by integrating three-dimensional factors, precipitation supply and demand (SPEI), soil conditions (SSMI, STI), and hydrological cycle (SRI), through the entropy weighting method, enabling daily-scale flash drought monitoring across the Black Soil Region of Northeast China from 2000 to 2020. The principal findings of this study can be summarized as follows: (1) Within the Black Soil Region of Northeast China, regions with relatively frequent flash drought occurrence are mainly distributed across the Songnen Plain and Liaohe Plain; (2) Over the past decade, the Liaohe Plain has experienced a pronounced increase in flash drought frequency, duration, and severity; (3) Flash droughts in the Black Soil Region of Northeast China are driven by regionally distinct mechanisms. Multi-factor coupling (precipitation, evapotranspiration, and soil moisture) dominates flash droughts in the Changbai Mountains–Liaodong Hills. In contrast, precipitation and evapotranspiration anomalies prevail in the Liaohe Plain, whereas soil moisture and temperature anomalies dominate the Songnen Plain, the Greater and Lesser Khingan Mountains, and the Sanjiang Plain. The results of this study provide valuable scientific support for agricultural flash drought management, as well as for disaster prevention and mitigation strategies under the increasing occurrence of climate change-driven extreme events.

Author Contributions

Conceptualization, S.M. and X.N.; methodology, S.M.; software, Y.W.; validation, Y.W., Z.Z., and X.L.; formal analysis, S.M.; investigation, S.M.; resources, X.L.; data curation, Z.Z.; writing—original draft preparation, S.M.; writing—review and editing, X.N.; visualization, S.M.; supervision, X.N.; project administration, S.M.; funding acquisition, X.N. All authors have read and agreed to the published version of the manuscript.

Funding

This work was supported by the National Natural Science Foundation of China (42571553) and the Natural Science Foundation of Heilongjiang Province (PL2024D012).

Data Availability Statement

The data that support the findings are available from the corresponding author upon reasonable request.

Conflicts of Interest

The authors declare no conflicts of interest.

References

  1. Christian, J.I.; Hobbins, M.; Hoell, A.; Otkin, J.A.; Ford, T.W.; Cravens, A.E.; Powlen, K.A.; Wang, H.; Mishra, V. Flash drought: A state of the science review. WIREs Water 2024, 11, e1714. [Google Scholar] [CrossRef]
  2. Hu, C.; She, D.; Wang, G.; Zhang, L.; Jing, Z.; Song, Z.; Xia, J. Unravelling spatiotemporal propagation processes among meteorological, soil, and evaporative flash droughts from a three-dimensional perspective. Agric. Water Manag. 2025, 308, 109294. [Google Scholar] [CrossRef]
  3. Liu, Y.; Zhu, Y.; Zhang, L.; Ren, L.; Yuan, F.; Yang, X.; Jiang, S. Flash droughts characterization over China: From a perspective of the rapid intensification rate. Sci. Total Environ. 2020, 704, 135373. [Google Scholar] [CrossRef]
  4. Goswami, P.; Gallant, A.J. Understanding drought onset: What makes flash droughts different from conventional droughts? Weather. Clim. Extrem. 2025, 49, 100782. [Google Scholar] [CrossRef]
  5. Liu, Y.; Zhu, Y.; Ren, L.; Singh, V.P.; Yuan, S. Flash drought fades away under the effect of accumulated water deficits: The persistence and transition to conventional drought. Environ. Res. Lett. 2023, 18, 114035. [Google Scholar] [CrossRef]
  6. Shi, R.; Liu, Y.; Zhu, Y.; Ren, L.; Liu, Y.; Zhang, X.; Zhang, L. Impact of flash droughts on global crop yields considering crop phenology and irrigation conditions. Agric. For. Meteorol. 2025, 373, 110763. [Google Scholar] [CrossRef]
  7. Yuan, X.; Wang, Y.; Ji, P.; Wu, P.; Sheffield, J.; Otkin, J.A. A global transition to flash droughts under climate change. Science 2023, 380, 187–191. [Google Scholar] [CrossRef] [PubMed]
  8. Hoell, A.; Parker, B.-A.; Downey, M.; Umphlett, N.; Jencso, K.; Akyuz, F.A.; Peck, D.; Hadwen, T.; Fuchs, B.; Kluck, D. Lessons learned from the 2017 flash drought across the US Northern Great Plains and Canadian Prairies. Bull. Am. Meteorol. Soc. 2020, 101, E2171–E2185. [Google Scholar] [CrossRef]
  9. Zhu, Y.; Li, Y.; Zhou, X.; Feng, W.; Gao, G.; Li, M.; Zheng, G. Causes of the severe drought in Southwest China during the summer of 2022. Atmos. Res. 2024, 303, 107320. [Google Scholar] [CrossRef]
  10. Yadav, D.; Kumar, R.; Shah, J.; Thakur, V.; Hanel, M.; Rakovec, O. Increasing spatial extent and frequency of flash drought in Europe with each degree of global warming. Environ. Res. Lett. 2025, 20, 114046. [Google Scholar] [CrossRef]
  11. Sreeparvathy, V.; Debdut, S.; Mishra, A. A review of advances in flash drought research: Challenges and future directions. Earths. Future 2025, 13, e2025EF006603. [Google Scholar] [CrossRef]
  12. Zhang, L.; Liu, Y.; Ren, L.; Teuling, A.J.; Zhu, Y.; Wei, L.; Zhang, L.; Jiang, S.; Yang, X.; Fang, X. Analysis of flash droughts in China using machine learning. Hydrol. Earth Syst. Sci. 2022, 26, 3241–3261. [Google Scholar] [CrossRef]
  13. Ford, T.W.; Otkin, J.A.; Quiring, S.M.; Lisonbee, J.; Woloszyn, M.; Wang, J.; Zhong, Y. Flash drought indicator intercomparison in the United States. J. Appl. Meteorol. Climatol. 2023, 62, 1713–1730. [Google Scholar] [CrossRef]
  14. Vicente-Serrano, S.M.; Beguería, S.; López-Moreno, J.I. A multiscalar drought index sensitive to global warming: The standardized precipitation evapotranspiration index. J. Clim. 2010, 23, 1696–1718. [Google Scholar] [CrossRef]
  15. Li, P.; Jia, L.; Lu, J.; Jiang, M.; Zheng, C. A new evapotranspiration-based drought index for flash drought identification and monitoring. Remote Sens. 2024, 16, 780. [Google Scholar] [CrossRef]
  16. Yao, T.; Liu, S.; Hu, S.; Mo, X. Response of vegetation ecosystems to flash drought with solar-induced chlorophyll fluorescence over the Hai River Basin, China during 2001–2019. J. Environ. Manag. 2022, 313, 114947. [Google Scholar] [CrossRef] [PubMed]
  17. Parker, T.; Gallant, A.; Hobbins, M.; Hoffmann, D. Flash drought in Australia and its relationship to evaporative demand. Environ. Res. Lett. 2021, 16, 064033. [Google Scholar] [CrossRef]
  18. Alencar, P.H.L.; Paton, E.N. How do we identify flash droughts? A case study in Central European Croplands. Hydrol. Res. 2022, 53, 1150–1165. [Google Scholar] [CrossRef]
  19. Zhang, J.; Zhang, M.; Yu, J.; Yu, Y.; Yu, R. Comparison of flash drought and traditional drought on characteristics and driving forces in Xinjiang. Remote Sens. 2023, 15, 4758. [Google Scholar] [CrossRef]
  20. Shen, H.; Hu, W.; Che, X.; Li, C.; Liang, Y.; Wei, X. Assessment of effectiveness and suitability of soil and water conservation measures on hillslopes of the black soil region in Northeast China. Agronomy 2024, 14, 1755. [Google Scholar] [CrossRef]
  21. Wang, Q.; Ren, J.; Zhang, M.; Sui, H.; Li, X. Synergistic matching and influencing factors of grain production and cropland net primary productivity in the black soil region of northeast China. Agronomy 2024, 14, 2932. [Google Scholar] [CrossRef]
  22. Ji, R.; Yu, W.; Guo, B.; Feng, R.; Wu, J.; Liu, D.; Xu, C. Characteristics of summer flash drought and its effect on maize growth in Liaoning Province, China. Agronomy 2024, 14, 1791. [Google Scholar] [CrossRef]
  23. Sun, J.; Zhang, Q.; Liu, X.; Sun, J.; Chen, L.; Wu, Y.; Hu, B.; Zhang, G. Flash droughts in a hotspot region: Spatiotemporal patterns, possible climatic drivings and ecological impacts. Weather Clim. Extrem. 2024, 45, 100700. [Google Scholar] [CrossRef]
  24. Walker, D.W.; Vergopolan, N.; Cavalcante, L.; Smith, K.H.; Agoungbome, S.M.D.; Almagro, A.; Apurv, T.; Dahal, N.M.; Hoffmann, D.; Singh, V. Flash drought typologies and societal impacts: A worldwide review of occurrence, nomenclature, and experiences of local populations. Weather Clim. Soc. 2024, 16, 3–28. [Google Scholar] [CrossRef]
  25. Zhang, R.; Bento, V.A.; Qi, J.; Xu, F.; Wu, J.; Qiu, J.; Li, J.; Shui, W.; Wang, Q. The first high spatial resolution multi-scale daily SPI and SPEI raster dataset for drought monitoring and evaluating over China from 1979 to 2018. Big Earth Data 2023, 7, 860–885. [Google Scholar] [CrossRef]
  26. Li, H.; Choy, S.; Zaminpardaz, S.; Wang, X.; Liang, H.; Zhang, K. Flash drought monitoring using diurnal-provided evaporative demand drought index. J. Hydrol. 2024, 633, 130961. [Google Scholar] [CrossRef]
  27. Ma, R.; Yuan, X. Subseasonal ensemble prediction of flash droughts over China. J. Hydrometeorol. 2023, 24, 897–910. [Google Scholar] [CrossRef]
  28. Li, P.; Jia, L.; Lu, J.; Jiang, M.; Zheng, C.; Menenti, M. Investigating the response of vegetation to flash droughts by using cross-spectral analysis and an evapotranspiration-based drought index. Remote Sens. 2024, 16, 1564. [Google Scholar] [CrossRef]
  29. Gao, J.; Liu, L.; Guo, L.; Sun, D.; Liu, W.; Hou, W.; Wu, S. The effects of climate change and phenological variation on agricultural production and its risk pattern in the black soil area of northeast China. J. Geogr. Sci. 2023, 33, 37–58. [Google Scholar] [CrossRef]
  30. Chen, Y.; Guo, D.; Wang, H.; Wang, A. Observed Changes in Seasonal Surface Soil Freeze—Thaw Cycles in China and Subregions From 1981 to 2017 and Their Relationships with Meteorological Elements. J. Geophys. Res. Atmos. 2025, 130, e2024JD042351. [Google Scholar] [CrossRef]
  31. Liu, H.; Zhou, L.; Huang, D.; Yang, D.; Shi, X.; Bai, Q.; Yang, H. The effects of freeze-thaw processes on crusting, aggregation and the interaction with erosive level winds in the Mollisol region of Northeast China. Int. Soil. Water Conserv. Res. 2025, 13, 716–732. [Google Scholar] [CrossRef]
  32. Mu, X.; Wang, J.; Meng, F.; Zheng, E.; Li, G.; Li, M.; Li, T.; Xiao, Z.; Fan, Y.; Li, X. Effects of conservation tillage and rainwater harvesting-recharge irrigation on soybean root architecture and yield in cold-region mollisols. Agric. Water Manag. 2026, 323, 110082. [Google Scholar] [CrossRef]
  33. Kane, D.A.; Bradford, M.A.; Fuller, E.; Oldfield, E.E.; Wood, S.A. Soil organic matter protects US maize yields and lowers crop insurance payouts under drought. Environ. Res. Lett. 2021, 16, 044018. [Google Scholar] [CrossRef]
  34. Ma, C.; Wang, S.; Zheng, D.; Zhang, Y.; Tang, J.; Wen, Y.; Dong, J. Understanding soil loss in Mollisol permanent gully head cuts through hydrological and hydromechanical responses. Hydrol. Earth Syst. Sci. 2025, 29, 823–839. [Google Scholar] [CrossRef]
  35. Li, Y.; Huang, S.; Wang, H.; Huang, Q.; Li, P.; Zheng, X.; Wang, Z.; Jiang, S.; Leng, G.; Li, J. Warming and greening exacerbate the propagation risk from meteorological to soil moisture drought. J. Hydrol. 2023, 622, 129716. [Google Scholar] [CrossRef]
  36. Sun, L.; Shen, B.; Sui, B.; Huang, B. The influences of East Asian Monsoon on summer precipitation in Northeast China. Clim. Dyn. 2017, 48, 1647–1659. [Google Scholar] [CrossRef]
  37. Tang, X.; Feng, Y.; Gao, C.; Lei, Z.; Chen, S.; Wang, R.; Jin, Y.; Tong, X. Entropy-weight-based spatiotemporal drought assessment using MODIS products and Sentinel-1A images in Urumqi, China. Nat. Hazard. 2023, 119, 387–408. [Google Scholar] [CrossRef]
  38. Ma, Q.; Li, Y.; Liu, F.; Feng, H.; Biswas, A.; Zhang, Q. SPEI and multi-threshold run theory based drought analysis using multi-source products in China. J. Hydrol. 2023, 616, 128737. [Google Scholar] [CrossRef]
  39. Sen, P.K. Estimates of the regression coefficient based on Kendall’s tau. J. Am. Stat. Assoc. 1968, 63, 1379–1389. [Google Scholar] [CrossRef]
  40. Li, Q.; He, P.; He, Y.; Han, X.; Zeng, T.; Lu, G.; Wang, H. Investigation to the relation between meteorological drought and hydrological drought in the upper Shaying River Basin using wavelet analysis. Atmos. Res. 2020, 234, 104743. [Google Scholar] [CrossRef]
  41. Du, G.; Han, L.; Yao, L.; Faye, B. Spatiotemporal Dynamics and Evolution of Grain Cropping Patterns in Northeast China: Insights from Remote Sensing and Spatial Overlay Analysis. Agriculture 2024, 14, 1443. [Google Scholar] [CrossRef]
  42. Wang, X.; Yan, Y.; Xu, C.; Wang, X.; Luo, N.; Wei, D.; Meng, Q.; Wang, P. Mitigating heat impacts in maize (Zea mays L.) during the reproductive stage through biochar soil amendment. Agric. Ecosyst. Environ. 2021, 311, 107321. [Google Scholar] [CrossRef]
  43. Baluch, S.M.; Wang, L.; Faiz, M.A.; Li, H.; Chen, Y.; Wang, L.; Li, M. Adaptation simulation and planning for crop yield under climate change: Integrating AquaCrop and DSSAT to project drought-induced yield risks in the Sanjiang Plain. Agric. Water Manag. 2025, 319, 109818. [Google Scholar] [CrossRef]
  44. Zhang, Q.; Sun, J.; Dai, C.; Zhang, G.; Wu, Y. Sustainable development of groundwater resources under the large-scale conversion of dry land into rice fields. Agric. Water Manag. 2024, 298, 108851. [Google Scholar] [CrossRef]
  45. Xiao, D.; Zhang, Y.; Bai, H.; Tang, J. Trends and climate response in the phenology of crops in Northeast China. Front. Earth Sci. 2021, 9, 811621. [Google Scholar] [CrossRef]
  46. Gu, L.; Schumacher, D.L.; Fischer, E.M.; Slater, L.J.; Yin, J.; Sippel, S.; Chen, J.; Liu, P.; Knutti, R. Flash drought impacts on global ecosystems amplified by extreme heat. Nat. Geosci. 2025, 18, 709–715. [Google Scholar] [CrossRef]
  47. Miller, J.; Owen, M.; Yang, X.; Drury, C.; Reynolds, W.; Chanasyk, D. Long-term cropping and fertilization influences soil organic carbon, soil water repellency, and soil hydrophobicity. Can. J. Soil. Sci. 2020, 100, 234–244. [Google Scholar] [CrossRef]
  48. Das, J.; Das, S.; Umamahesh, N. Surface latent and sensible heat trigger flash drought events in India. Hydrol. Process. 2023, 37, e15037. [Google Scholar] [CrossRef]
  49. García-García, A.; Cuesta-Valero, F.J.; Miralles, D.G.; Mahecha, M.D.; Quaas, J.; Reichstein, M.; Zscheischler, J.; Peng, J. Soil heat extremes can outpace air temperature extremes. Nat. Clim. Change 2023, 13, 1237–1241. [Google Scholar] [CrossRef]
  50. Liang, M.; Yuan, X. Critical role of soil moisture memory in predicting the 2012 Central United States flash drought. Front. Earth Sci. 2021, 9, 615969. [Google Scholar] [CrossRef]
  51. Lovino, M.A.; Pierrestegui, M.J.; Müller, O.V.; Müller, G.V.; Berbery, E.H. The prevalent life cycle of agricultural flash droughts. npj Clim. Atmos. Sci. 2024, 7, 73. [Google Scholar] [CrossRef]
  52. Christian, J.I.; Basara, J.B.; Hunt, E.D.; Otkin, J.A.; Furtado, J.C.; Mishra, V.; Xiao, X.; Randall, R.M. Global distribution, trends, and drivers of flash drought occurrence. Nat. Commun. 2021, 12, 6330. [Google Scholar] [CrossRef]
  53. Schumacher, D.L.; Keune, J.; Dirmeyer, P.; Miralles, D.G. Drought self-propagation in drylands due to land–atmosphere feedbacks. Nat. Geosci. 2022, 15, 262–268. [Google Scholar] [CrossRef] [PubMed]
  54. Qing, Y.; Wang, S.; Ancell, B.C.; Yang, Z.-L. Accelerating flash droughts induced by the joint influence of soil moisture depletion and atmospheric aridity. Nat. Commun. 2022, 13, 1139. [Google Scholar] [CrossRef] [PubMed]
  55. Elsalahy, H.H.; Reckling, M. Soybean resilience to drought is supported by partial recovery of photosynthetic traits. Front. Plant Sci. 2022, 13, 971893. [Google Scholar] [CrossRef]
  56. Miyamoto, B.C.; Hackmann, C.L. Effects of drought on crop yields and agricultural revenue in Southern Brazil. Discov. Agric. 2025, 3, 246. [Google Scholar] [CrossRef]
  57. Assouline, S. What can we learn from the water retention characteristic of a soil regarding its hydrological and agricultural functions? Review and analysis of actual knowledge. Water Resour. Res. 2021, 57, e2021WR031026. [Google Scholar] [CrossRef]
  58. Huang, J.; Hartemink, A.E.; Kucharik, C.J. Soil-dependent responses of US crop yields to climate variability and depth to groundwater. Agric. Syst. 2021, 190, 103085. [Google Scholar] [CrossRef]
Figure 1. Information of the study area: (a) Relative position, (b) Distribution of main crops, (c) Information of terrain.
Agriculture 16 01153 g001
Figure 2. Overview of methodology.
Agriculture 16 01153 g002
Figure 3. Three-Threshold Run Theory. The color gradient from blue to red indicates a decrease in index values. The range between R0 and R2 serves as the judgment interval for flash drought.
Agriculture 16 01153 g003
Figure 4. The Spatial characteristics of Flash Drought Frequency from 2000 to 2020.
Agriculture 16 01153 g004
Figure 5. The Spatial characteristics of Flash Drought Duration from 2000 to 2020.
Agriculture 16 01153 g005
Figure 6. The Spatial characteristics of Flash Drought Intensity from 2000 to 2020.
Agriculture 16 01153 g006
Figure 7. Interannual variability of average anomaly of frequency, duration, and intensity in the five major agricultural regions from 2000 to 2020.
Agriculture 16 01153 g007
Figure 8. Spatial patterns of Kendall’s τ coefficients describing temporal trends in flash drought frequency, duration, and intensity over the 2000–2020 period. (a) Flash drought fruquency, (b) Flash drought duration, and (c) Flash drought intensity.
Agriculture 16 01153 g008
Figure 9. Temporal variations in flash drought impact severity across the five principal agricultural regions during the growing seasons (April–October) from 2000 to 2020. Red markers represent the mean area affected by flash drought in each growing season. (a) Changbai Mountains–Liaodong Hilly Region, (b) Liaohe Plain, (c) Sanjiang Plain, (d) Songnen Plain, and (e) Greater and Lesser Khingan Mountains.
Agriculture 16 01153 g009
Figure 10. Average contribution rate (%) of anomalies of each driving factor during flash drought events. (a), SPEI_A, (b), SSMI_A, (c), STI_A, and (d), SRI_A.
Agriculture 16 01153 g010
Figure 11. Correlation coefficients for all months between FDHI, SPEI, SSMI, SRI, and SIF from 2000 to 2020. ** denotes significant correlation at 0.01 significance level. * denotes significant correlation at 0.05 significance level.
Agriculture 16 01153 g011
Table 1. Data types and sources.
Data CategoryVariable DescriptionSpatial ResolutionTemporal CoverageSource
SPEIDaily Standardized Precipitation Evapotranspiration Index0.25°1982–2021http://data.cma.cn/, accessed on 17 April 2025
Soil moistureSoil moisture at 30 cm depth0.1°1982–2021https://www.gleam.eu/, accessed on 24 May 2025
Soil temperatureNear-surface soil temperature 0.1°1980–2021https://cds.climate.copernicus.eu/, accessed on 24 May 2025
RunoffSurface runoff observations0.1°1980–2021
SIFSolar-Induced Chlorophyll Fluorescence0.05°2000–2020https://globalecology.unh.edu/data/GOSIF.html, accessed on 15 June 2025
Disaster recordsHistorical flash drought events-1990–2025https://www.emdat.be/, accessed on 15 June 2025
Phenology dataCrop growth stage records-2001–2020http://data.cma.cn/, accessed on 15 June 2025
Crop distributionSpatial distribution of crop planting areas30 m2021https://www.geodata.cn/, accessed on 15 June 2025
TopographyDigital elevation data90 m-
Table 2. The weight values for each indicator.
Goal IndicatorDimensionIndicatorWeights
FDHIprecipitation supply and demandSPEI0.23
soil conditionP0.57
hydrological cycleSRI0.21
Psoil conditionSSMI0.51
STI0.49
Table 3. Comparison of flash and conventional drought characteristics.
Drought TypeOnset Speed ThresholdMean Peak FDHIMean Duration (Days)
Flash droughtS ≥ P950.6524.1
Conventional droughtS < P950.3437.8
p-value-<0.001<0.001
P95 denotes the 95th percentile of the onset-speed distribution for all drought events (2000–2020). Mean peak FDHI is the average maximum FDHI reached during an event.
Table 4. Crop Rotation Systems in the Black Soil Region of Northeast China.
Agricultural SubregionDominant CropsTypical Crop Rotation SystemsCropping Characteristics
Songnen PlainMaize, soybeanMaize-soybean rotation; continuous maize in high-yield areasPredominantly rainfed agriculture; large-scale mechanized farming; strong dependence on summer precipitation
Liaohe PlainMaize, riceMaize monoculture; rice-upland crop alternation in irrigated areasIntensive agricultural production; high fertilizer and irrigation input; concentrated summer crop growth period
Sanjiang Plainrice, soybean, maizeRice monoculture; rice-soybean rotation in transitional zonesDominated by irrigated paddy systems; widespread lowland wetlands and high groundwater table
Changbai Mountains–Liaodong Hills RegionMaize, riceMaize-soybean rotation; mixed dryland-paddy systemsComplex terrain and fragmented cropland; strong spatial heterogeneity in hydrothermal conditions
Greater and Lesser Khingan MountainsSoybean, maizeSoybean-maize rotationShort growing season; relatively lower accumulated temperature; mainly rainfed systems
Table 5. Comparison of Historical Flash Drought Events.
AreaDrought YearSPEISSMISRIFDHIActual Situation
The Changbai Mountains–Liaodong Hilly Region2000YYNYY
2014YNYYY
2016NYYYY
The Liaohe Plain2009YNNYY
2014NNNYY
2015YYYYY
2017NNNYY
The Songnen Plain2015YYYYY
2017NYNYY
Disclaimer/Publisher’s Note: The statements, opinions and data contained in all publications are solely those of the individual author(s) and contributor(s) and not of MDPI and/or the editor(s). MDPI and/or the editor(s) disclaim responsibility for any injury to people or property resulting from any ideas, methods, instructions or products referred to in the content.