Article

Anthocyanin Degradation Drives Heat-Induced Petal Fading in Chrysanthemum morifolium at Full Bloom: A Multi-Omics Analysis

by
Ge Zhao
1,2,
Yanan Li
1,2,
Jialin Peng
1,2,
Xiuge Li
1,2,
Wenhao Xia
1,2,
Yuhe Tian
1,2,
Yukun Li
1,2 and
Lijie Zhou
1,2,*
1
State Key Laboratory of Crop Genetics & Germplasm Enhancement and Utilization, Key Laboratory of Landscaping, Key Laboratory of State Forestry and Grassland Administration on Biology of Ornamental Plants in East China, Ministry of Agriculture and Rural Affairs, College of Horticulture, Nanjing Agricultural University, No. 666, Binjiang Avenue, Jiangbei New Area, Nanjing 210014, China
2
Zhongshan Biological Breeding Laboratory, No. 50 Zhongling Street, Nanjing 210014, China
*
Author to whom correspondence should be addressed.
Agriculture 2025, 15(9), 950; https://doi.org/10.3390/agriculture15090950
Submission received: 10 March 2025 / Revised: 24 April 2025 / Accepted: 24 April 2025 / Published: 27 April 2025
(This article belongs to the Special Issue Genetics, Breeding and Transcriptomic Analysis of Chrysanthemum)

Abstract

:
Chrysanthemum morifolium, a major cut flower worldwide, undergoes petal fading under heat stress due to reduced anthocyanin accumulation, significantly compromising its ornamental value. While previous studies have focused on heat-induced inhibition of anthocyanin biosynthesis, the mechanisms governing anthocyanin degradation remain unclear. In this study, ‘Nannong Fencui’ chrysanthemums at full bloom—when anthocyanin accumulation peaks—were exposed to 35 °C, while a control group was maintained at 22 °C, to assess heat stress effects on anthocyanin metabolism, including both biosynthesis and degradation. Transcriptomic analysis identified nine core structural genes and three key transcription factors involved in anthocyanin biosynthesis, along with twelve core genes linked to enzymatic anthocyanin degradation. Notably, the FPKM values of structural genes for anthocyanin biosynthesis were extremely low in both groups, indicating that anthocyanin biosynthesis was largely inactive at full bloom. Untargeted metabolomic analysis identified the 30 most significantly enriched metabolic pathways. Compared to the control, heat treatment led to a significant increase in 93 metabolites (FC > 1.5, p < 0.05, VIP > 1) and a significant decrease in 160 metabolites (FC < 1/1.5, p < 0.05, VIP > 1). Cyanidin glucoside, the primary anthocyanin in chrysanthemum petals, significantly decreased under heat treatment, while its potential degradation product, protocatechuic acid, was undetectable. Meanwhile, 5-carboxyvanillic acid levels significantly increased in heat-treated groups, suggesting that protocatechuic acid may have been converted into 5-carboxyvanillic acid via an O-methylation pathway. These findings provide new insights into the metabolic regulation of anthocyanins in chrysanthemums under heat stress and offer potential strategies for maintaining flower color quality during summer production, highlighting key candidate genes (CmPRXs and CmOMT1) for future functional validation and breeding efforts aimed at improving heat tolerance and color stability.

1. Introduction

Anthocyanins are water-soluble pigments localized in vacuoles, primarily comprising cyanidin-3-glucoside, pelargonidin-3-glucoside, and delphinidin-3-glucoside. Among them, cyanidin-3-galactoside is the dominant pigment responsible for the pink-to-purple coloration of chrysanthemum (Chrysanthemum morifolium) petals [1]. Additionally, anthocyanins enhance plant resilience to abiotic stresses such as drought, cold, and intense light by scavenging excess reactive oxygen species [2,3,4].
Anthocyanin metabolism in plants involves biosynthesis and degradation, with their dynamic balance determining anthocyanin accumulation. Over the past few decades, the anthocyanin biosynthetic pathway has been extensively studied, revealing four distinct stages. First, phenylalanine is converted into p-coumaroyl-CoA, a key intermediate in various secondary metabolic pathways, catalyzed by phenylalanine ammonia-lyase (PAL), the rate-limiting enzyme. Next, p-coumaroyl-CoA is converted into naringenin, a crucial step in flavonoid metabolism, catalyzed by chalcone synthase (CHS) and chalcone isomerase (CHI), with CHS serving as the rate-limiting enzyme. Subsequently, flavone synthase (FNS) and flavanone 3-hydroxylase (F3H) catalyze the conversion of naringenin into flavone and dihydrokaempferol, respectively. Finally, dihydrokaempferol is a key branch point with two potential fates: it can be converted into flavonols via flavonol synthase (FLS), or it can be transformed into various leucoanthocyanidins. The conversion to leucoanthocyanidins involves the catalytic actions of flavonoid 3′-hydroxylase (F3′H), dihydroflavonol 4-reductase (DFR), and flavonoid 3′,5′-hydroxylase (F3′5′H). These leucoanthocyanidins are then converted into anthocyanins through the actions of anthocyanidin synthase (ANS) and flavonoid 3-O-glycosyltransferase (UFGT) [5,6].
Compared to anthocyanin biosynthesis, research on anthocyanin biodegradation remains relatively limited. Evidence from in vitro and in vivo studies suggests that anthocyanin degradation follows three main pathways. The first is coupled oxidation, in which anthocyanins degrade through redox coupling with polyphenolic compounds. During this process, quinones from polyphenols are reduced to their original phenolic forms, while anthocyanins are oxidized into anthocyanin quinones or other degradation products. This reaction is catalyzed by polyphenol oxidase (PPO) and requires oxygen (O2) as a substrate. The second is two-step degradation, which occurs in two stages. Initially, anthocyanins undergo deglycosylation, catalyzed by β-glucosidase (also known as anthocyanase), producing unstable anthocyanidins. These are subsequently oxidized into colorless or degraded products by polyphenol oxidase (PPO) or peroxidase (POD), which use O2 or H2O2 as substrates, respectively. The third pathway is direct oxidation, where anthocyanins are degraded without prior deglycosylation. This reaction is catalyzed by peroxidase (POD), which utilizes hydrogen peroxide (H2O2) to rapidly oxidize and degrade anthocyanins. While all three pathways may occur under specific conditions, POD-mediated direct oxidation is considered the most probable mechanism in planta [7]. Class III peroxidases (PRXs) are a plant-specific group of peroxidases that catalyze anthocyanin degradation. To date, several PRX genes involved in this process have been identified in various plant species. In Brunfelsia calycina, flower color shifts rapidly from purple to white upon blooming, a process strongly linked to anthocyanin degradation. Studies have shown that the PRX enzyme BcPrx01, localized in petal vacuoles, directly degrades anthocyanins, leading to petal color changes [8]. In wine grape (Vitis vinifera L. cv. Sangiovese), the PRX gene VviPRX31 is strongly induced under high temperatures and contributes to fruit discoloration. Overexpression of VviPRX31 in Petunia hybrida, followed by heat stress, significantly reduces anthocyanin content in transgenic plants [9]. The degradation products of anthocyanins vary depending on oxidative conditions, with protocatechuic acid being a common byproduct [10,11]. In Prunus salicina Lindl., exposure to 35 °C for nine days results in a significant decline in anthocyanin content, accompanied by a notable increase in protocatechuic acid levels. In vitro experiments further confirm that the addition of H2O2 and horseradish peroxidase (HRP) accelerates anthocyanin (cyanidin-3-glucoside) degradation and promotes protocatechuic acid formation [12].
Amid global climate warming, the adverse effects of heat stress on the yield and quality of economic crops have drawn increasing attention. Heat stress inhibits anthocyanin accumulation in plants, significantly affecting the ornamental quality and commercial value of chrysanthemums and other important flowering plants [13,14,15]. Most studies have focused on elucidating how heat stress suppresses anthocyanin biosynthesis. For example, in tea (Camellia sinensis), the MBW complex, formed by CsMYB75, the bHLH transcription factor CsTT8, and the WD40 protein CsTTG1, promotes anthocyanin biosynthesis by directly activating the structural genes CsDFR and CsANS. Under heat stress, however, the E3 ubiquitin ligase CsCOP1 is upregulated and accumulates. This leads to the ubiquitin-mediated degradation of CsbZIP1, an upstream activator of CsMYB75, subsequently preventing CsbZIP1 from activating CsMYB75 and thereby disrupting MBW complex formation and reducing anthocyanin accumulation [16]. In Chrysanthemum morifolium, heat stress induces the accumulation of the atypical subgroup 7 (SG7) R2R3-MYB transcription factor CmMYB012. This transcription factor suppresses anthocyanin biosynthesis by repressing the transcription of the structural genes CmCHS, CmDFR, CmANS, and CmUFGT, thereby reducing anthocyanin accumulation in petals [17]. A previous study subjected ‘Nannong Ziyunying’ and ‘Nannong Zizhu’ chrysanthemums to 38 °C heat stress from the bud stage to full bloom. Transcriptomic analysis revealed that heat stress inhibits anthocyanin biosynthesis and accumulation in petals by downregulating key anthocyanin biosynthetic genes [18]. Despite these insights, the impact of heat stress on anthocyanin metabolism in chrysanthemum petals, particularly its degradation process, remains poorly understood.
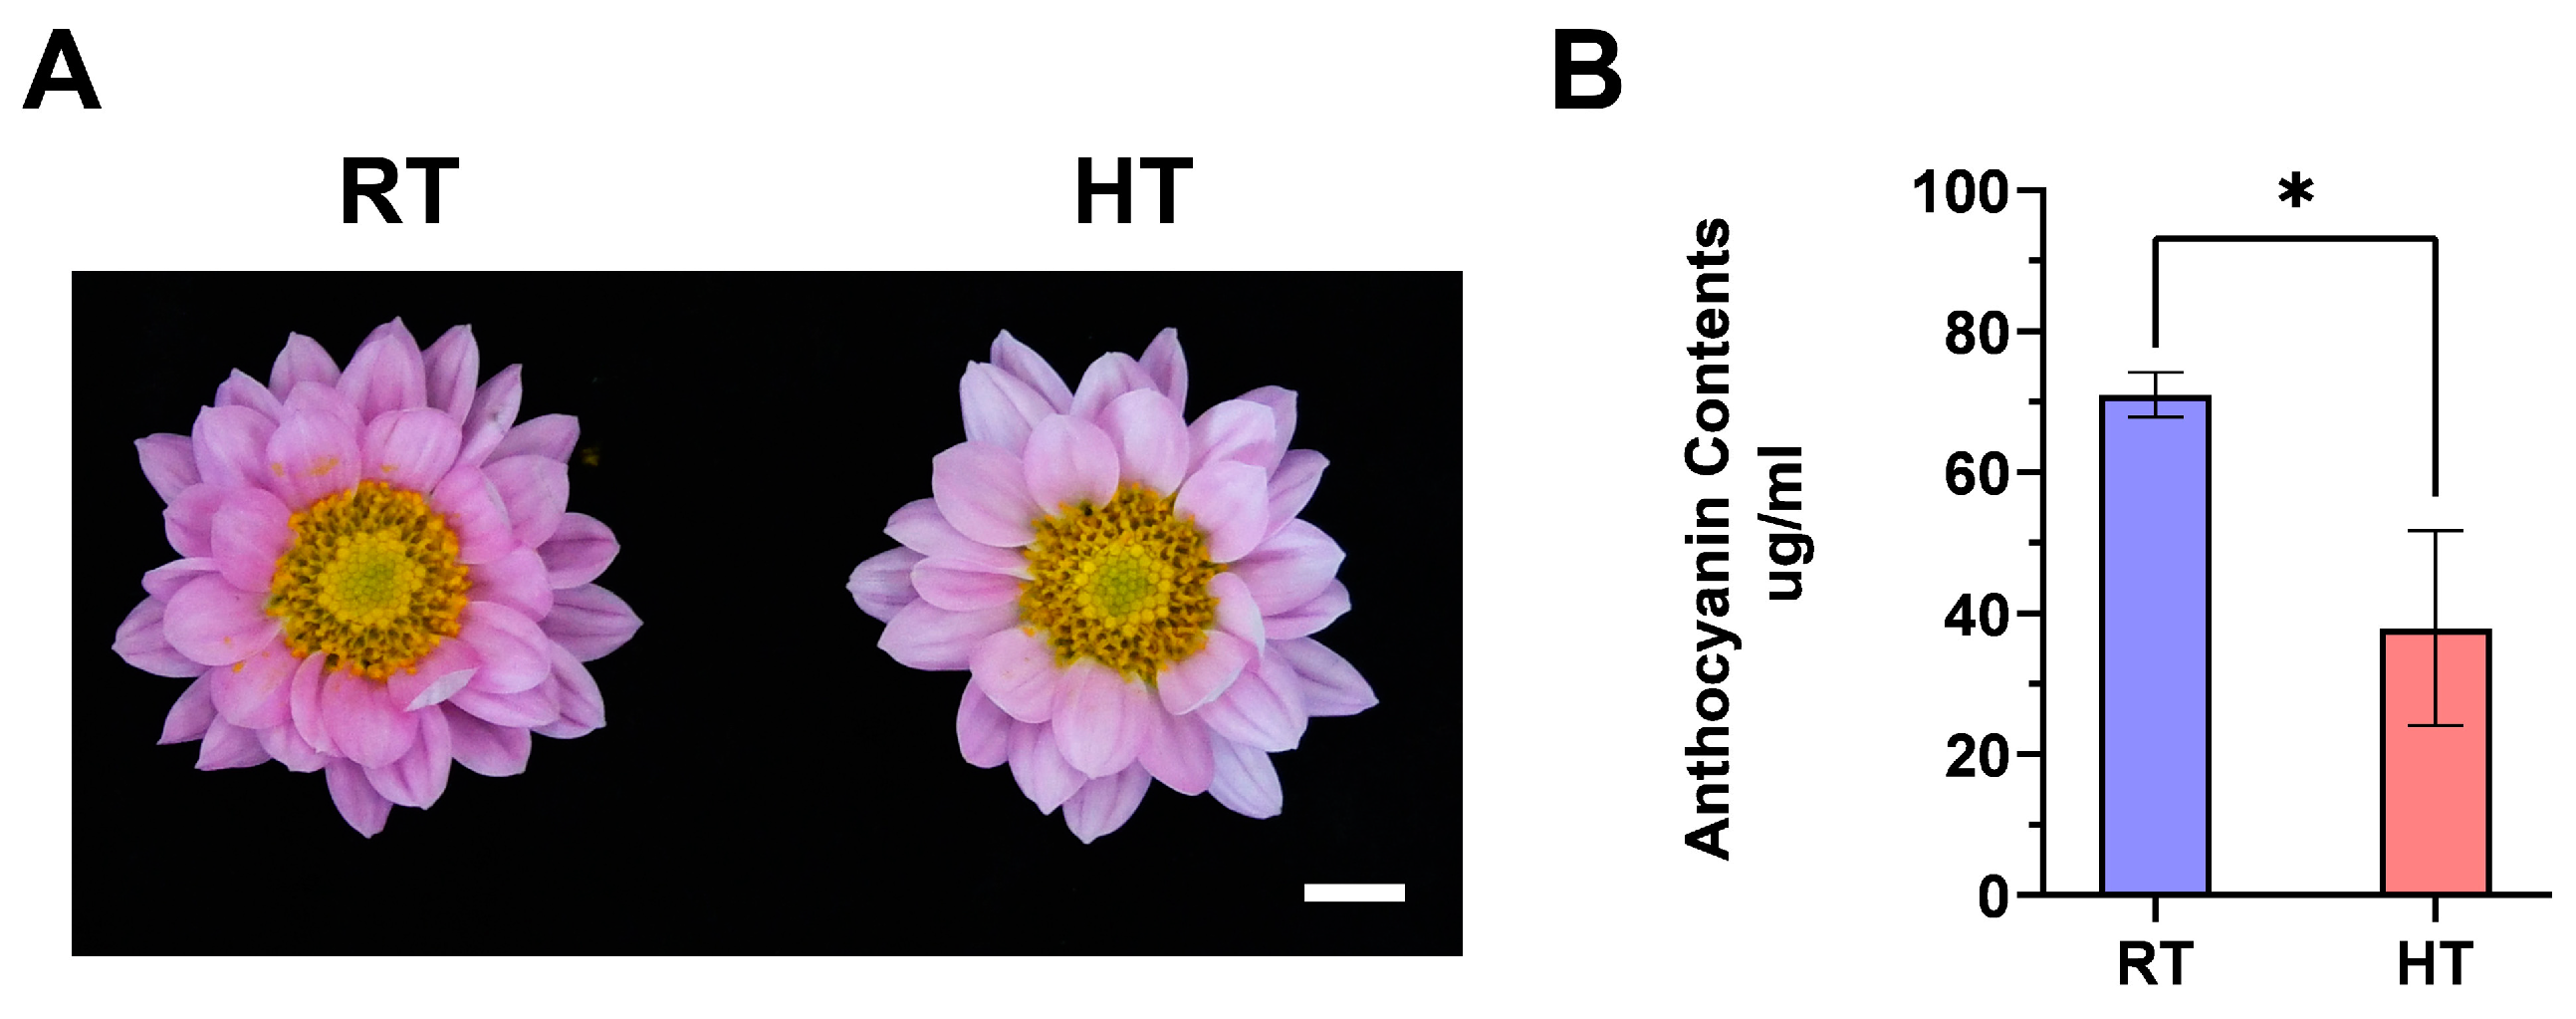
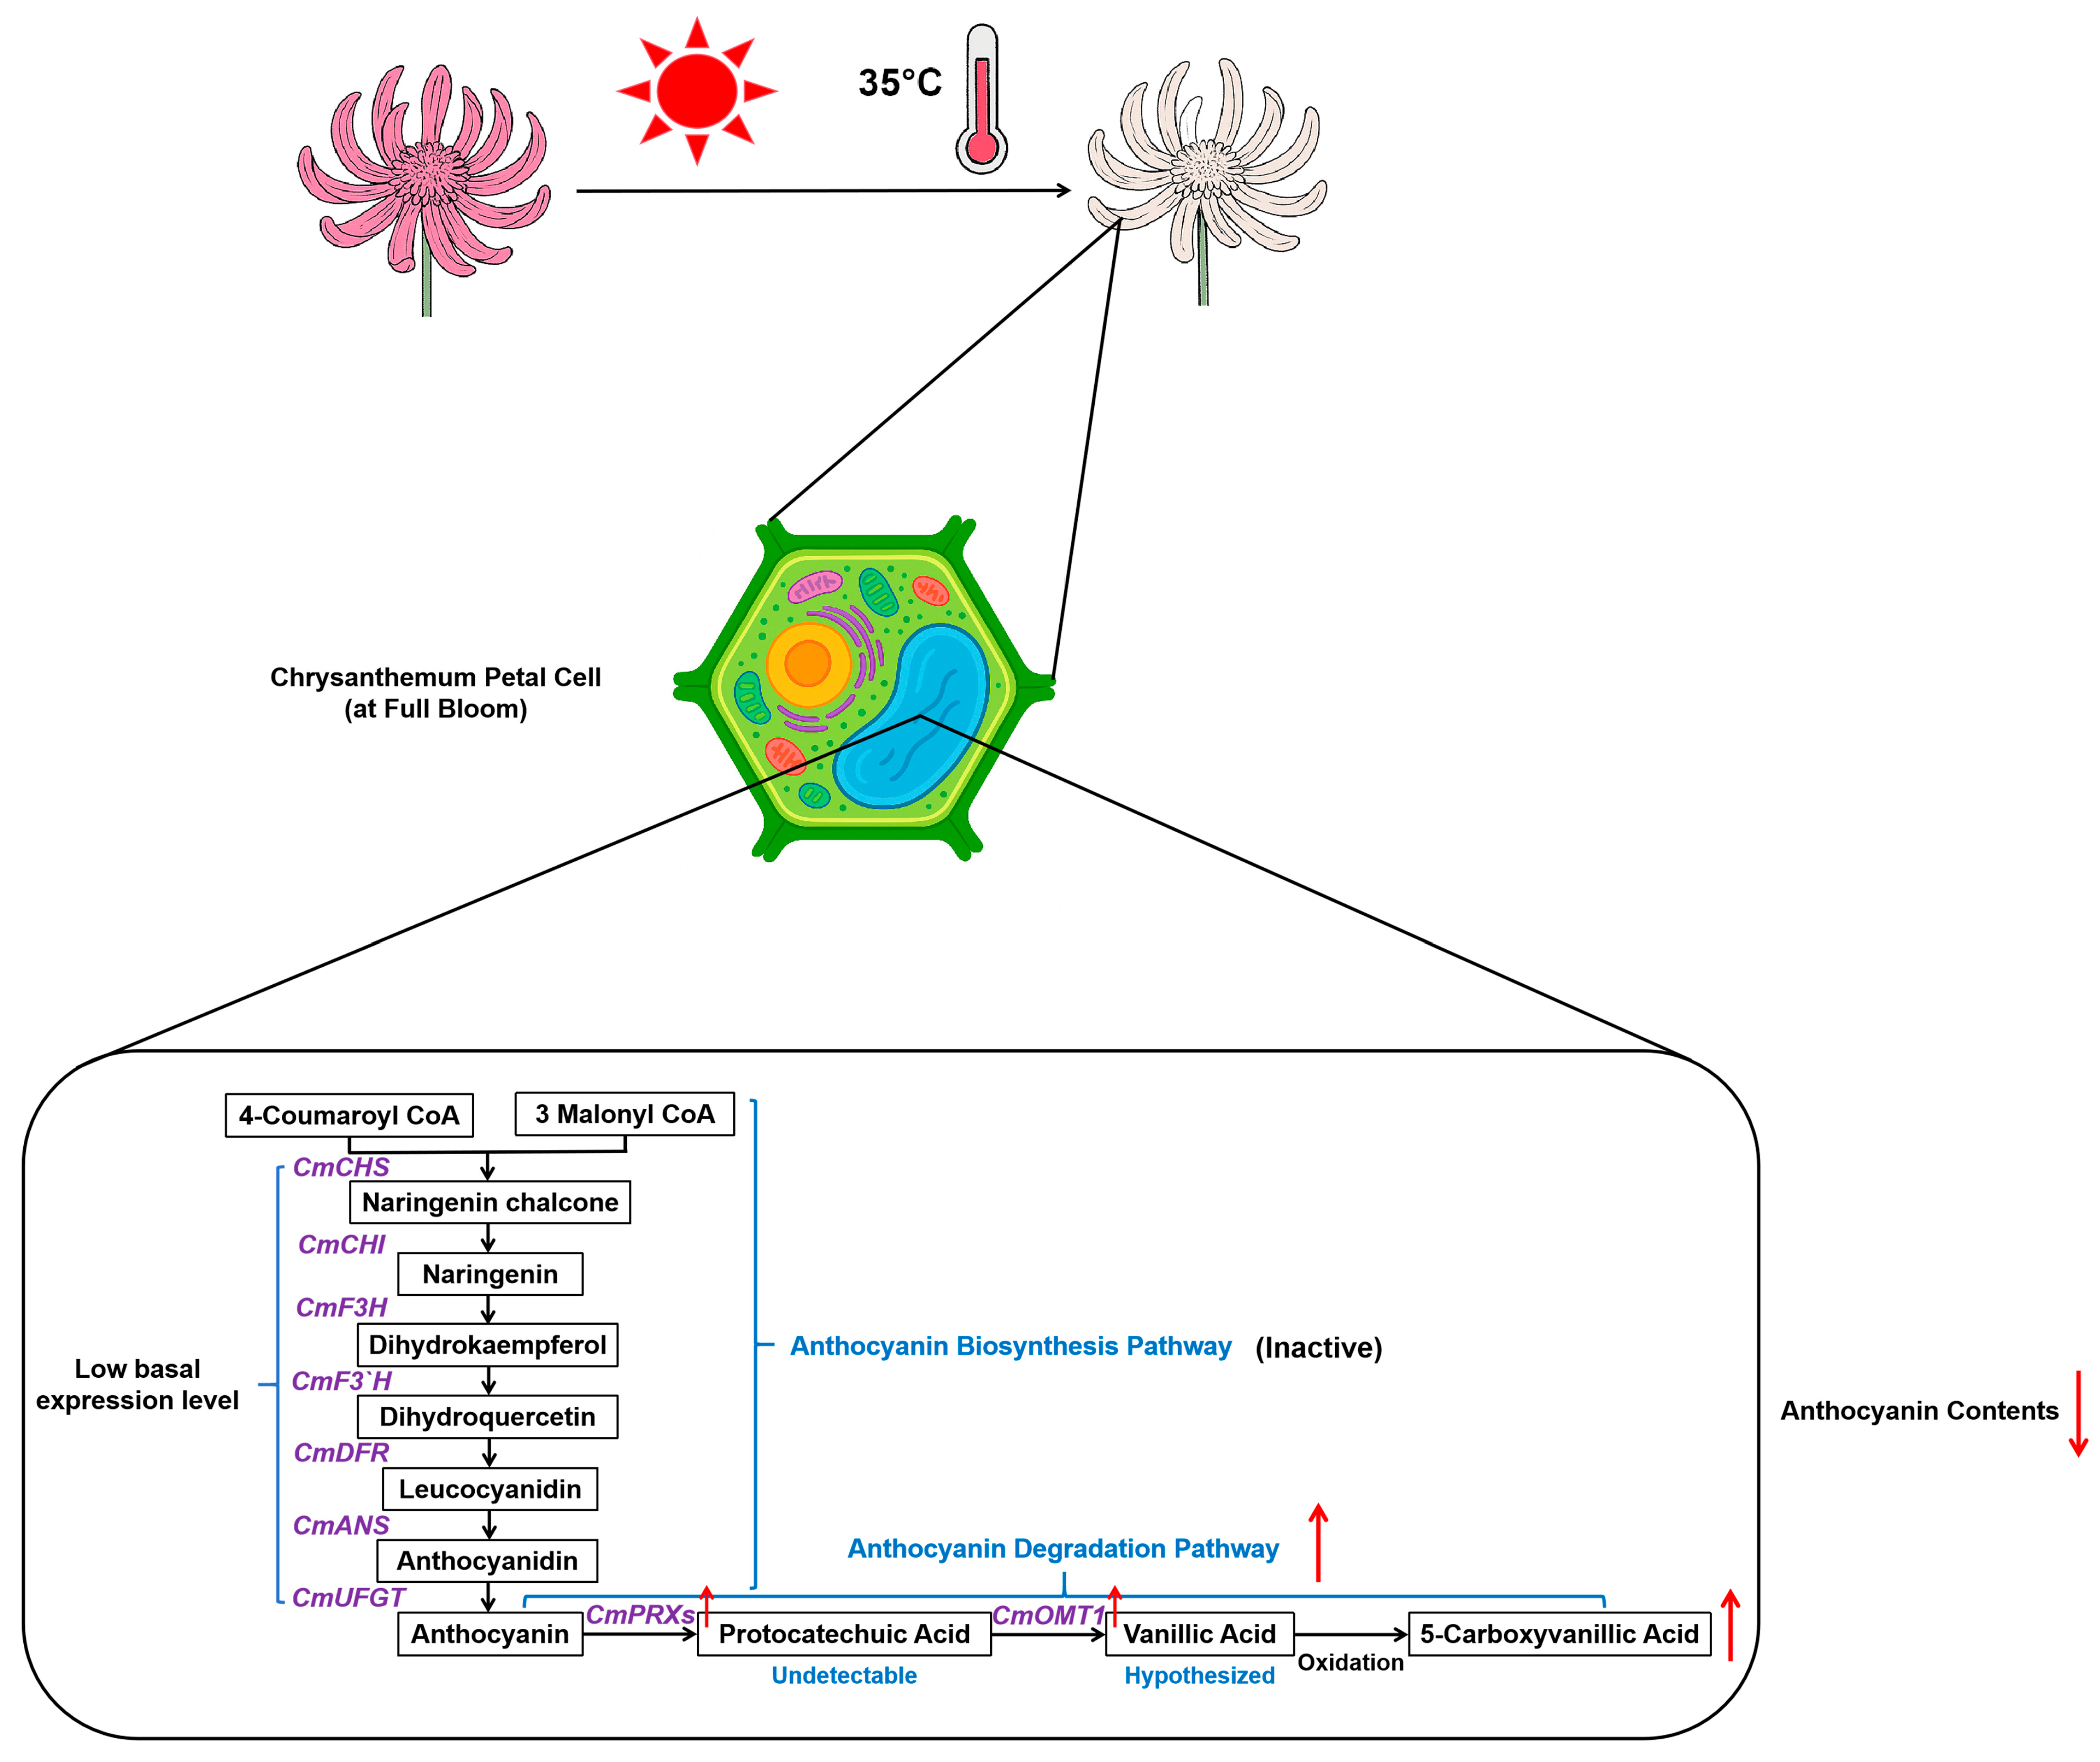
Here, we focused on the Chrysanthemum cultivar ‘Nannong Fencui’. Our previous research indicates that the flowering process of the ‘Nannong Fencui’ chrysanthemum consists of six stages: flower bud, broken bud, dew color, first bloom, full bloom, and post-flowering. Anthocyanin accumulation in the petals first appears at the dew color stage, gradually increases, peaks at full bloom, and declines during post-flowering [19]. This peak accumulation phase is a critical point for examining color stability under heat stress. Therefore, in this study, fully bloomed ‘Nannong Fencui’ chrysanthemums, having reached peak anthocyanin accumulation, were exposed to 35 °C for five days, with a parallel control maintained at 22 °C. Samples were collected for transcriptomic and untargeted metabolomic sequencing to comprehensively assess the effects of heat stress on anthocyanin metabolism, including both biosynthesis and degradation. Our results indicate that anthocyanin biosynthesis is largely inactive in fully bloomed chrysanthemums, and heat stress has minimal impact on this process. This suggests that petal fading at this stage is unlikely to result from the direct inhibition of anthocyanin biosynthesis. Ultra-high-performance liquid chromatography (UHPLC) and untargeted metabolomics revealed a significant reduction in anthocyanin (cyanidin-3-glucoside) levels in heat-treated petals. While protocatechuic acid, a common anthocyanin degradation product, was undetectable in both heat-treated and control groups, its O-methylated oxidation derivative, 5-carboxyvanillic acid, accumulated significantly after heat exposure. Furthermore, multiple PRX enzyme genes potentially associated with anthocyanin degradation were significantly upregulated under heat stress. Similarly, O-methyltransferase genes involved in the O-methylation of protocatechuic acid were also significantly upregulated. These findings suggest that anthocyanin degradation plays a major role in petal fading in fully bloomed chrysanthemums under heat stress. Our study provides new insights into the regulation of anthocyanin metabolism in chrysanthemums and offers potential strategies for maintaining flower color quality during summer production.

2. Materials and Methods

2.1. Plant Material and Growth Conditions

The chrysanthemum cultivar ‘Nannong Fencui’ was provided by the Chrysanthemum Germplasm Resource Preservation Center at Nanjing Agricultural University, China. Initially, chrysanthemum cuttings were rooted in trays for 15 days and then transferred to an intelligent greenhouse for 45 days of cultivation, maintained at 24 °C/18 °C (day/night), under a 16/8 h light/dark photoperiod, and 70% relative humidity. Subsequently, seedlings exhibiting consistent growth were selected, and new cuttings were taken and rooted in trays for another 15 days. These cuttings were then transplanted into pots and placed in an intelligent glass greenhouse for three months to induce flowering under conditions of 24 °C/18 °C (day/night), an 8/16 h light/dark cycle, and 70% relative humidity. Finally, 48 uniformly vigorous, fully bloomed ‘Nannong Fencui’ plants were selected and randomly divided into six groups of eight plants each for further experiments conducted in Nanjing City, Jiangsu Province, China, in November 2024.
For the high-temperature treatment, two groups of eight plants each (totaling 16 plants) were transferred to plant incubators under two conditions: the treatment group (35 °C/22 °C day/night temperatures, 8/16 h light/dark cycle, 30,000 lx light intensity, and 75% relative humidity) and the control group (CK) (22 °C/18 °C day/night temperatures, 8/16 h light/dark cycle, 30,000 lx light intensity, and 75% relative humidity). The 35 °C daytime temperature for the treatment group was specifically selected because it represents a significant heat stress level for chrysanthemum, a cool-season plant with an optimal growth range of 17–22 °C. This temperature also reflects challenging high-temperature conditions commonly encountered during summer horticultural production. Both groups were watered every two days. After five days of treatment, one flower was randomly sampled from each plant per group, and their ray flower petals were pooled to form a biological replicate. Each treatment was performed in triplicate, yielding three biological replicates per condition. Samples were flash-frozen in liquid nitrogen for anthocyanin quantification and subsequently analyzed using multi-omics approaches at Shanghai Bioprofile (www.bioprofile.cn (accessed on 20 November 2024)).

2.2. Determination of Anthocyanin Content by Ultra-Performance Liquid Chromatography (UPLC)

For anthocyanin content determination, ray floret samples were collected in three biological replicates from both the high-temperature treatment and control groups. For each replicate, 0.1 g of powdered sample (pulverized in liquid nitrogen) was transferred to a test tube containing 5 mL of extraction solution (70% methanol, 27% ultrapure water, 2% formic acid, and 1% trifluoroacetic acid), wrapped in aluminum foil to prevent light exposure, and incubated at 4 °C for 24 h. The supernatant was then filtered through an organic membrane. A 1.5 mL portion of the filtrate was collected into a brown volumetric flask for subsequent analysis. Cyanidin standard solutions (100, 50, 10, 5, and 2.5 μg/mL) were prepared using 25 mg/mL DMSO and standard compounds from Med Chem Express. The mobile phase consisted of ultrapure water, methanol, 0.1% aqueous formic acid, and 0.1% formic acid in acetonitrile. All prepared solutions were filtered through organic or inorganic membranes and subjected to ultrasonic treatment for 10 min. Chromatographic analysis was conducted using a T3 column maintained at 35 °C, with cyanidin detected at 525 nm. Anthocyanin concentration was calculated using a standard curve derived from linear regression, plotting absorbance (y-axis) against concentration (x-axis). The equation was y = 5.468x − 0.08888, where x represents the peak area.

2.3. Transcriptome Sequencing

Total RNA was extracted from ray floret samples collected in three biological replicates from both the high-temperature treatment and control groups. mRNA with a poly(A) tail was enriched using Oligo(dT) magnetic beads, followed by RNA fragmentation into ~300 bp fragments via ion fragmentation. First-strand cDNA was synthesized using RNA as a template, random hexamer primers, and reverse transcriptase. The second-strand cDNA was then synthesized using the first-strand cDNA as a template. After library construction, PCR amplification was performed to enrich library fragments, and quality control was conducted using an Agilent 2100 Bioanalyzer. Libraries with different index sequences were proportionally mixed, diluted to 2 nM, and denatured to generate single-stranded libraries. Next-generation sequencing (NGS) was performed on the Illumina platform using paired-end (PE) sequencing. Raw sequencing data were filtered to obtain high-quality clean reads, which were then aligned to the reference genome of C. morifolium [20]. Gene expression levels were quantified based on the alignment results, followed by differential expression analysis, enrichment analysis, and clustering analysis. The aligned reads were further assembled to reconstruct transcript sequences, using the full-length transcriptome of C. morifolium as the reference genome.

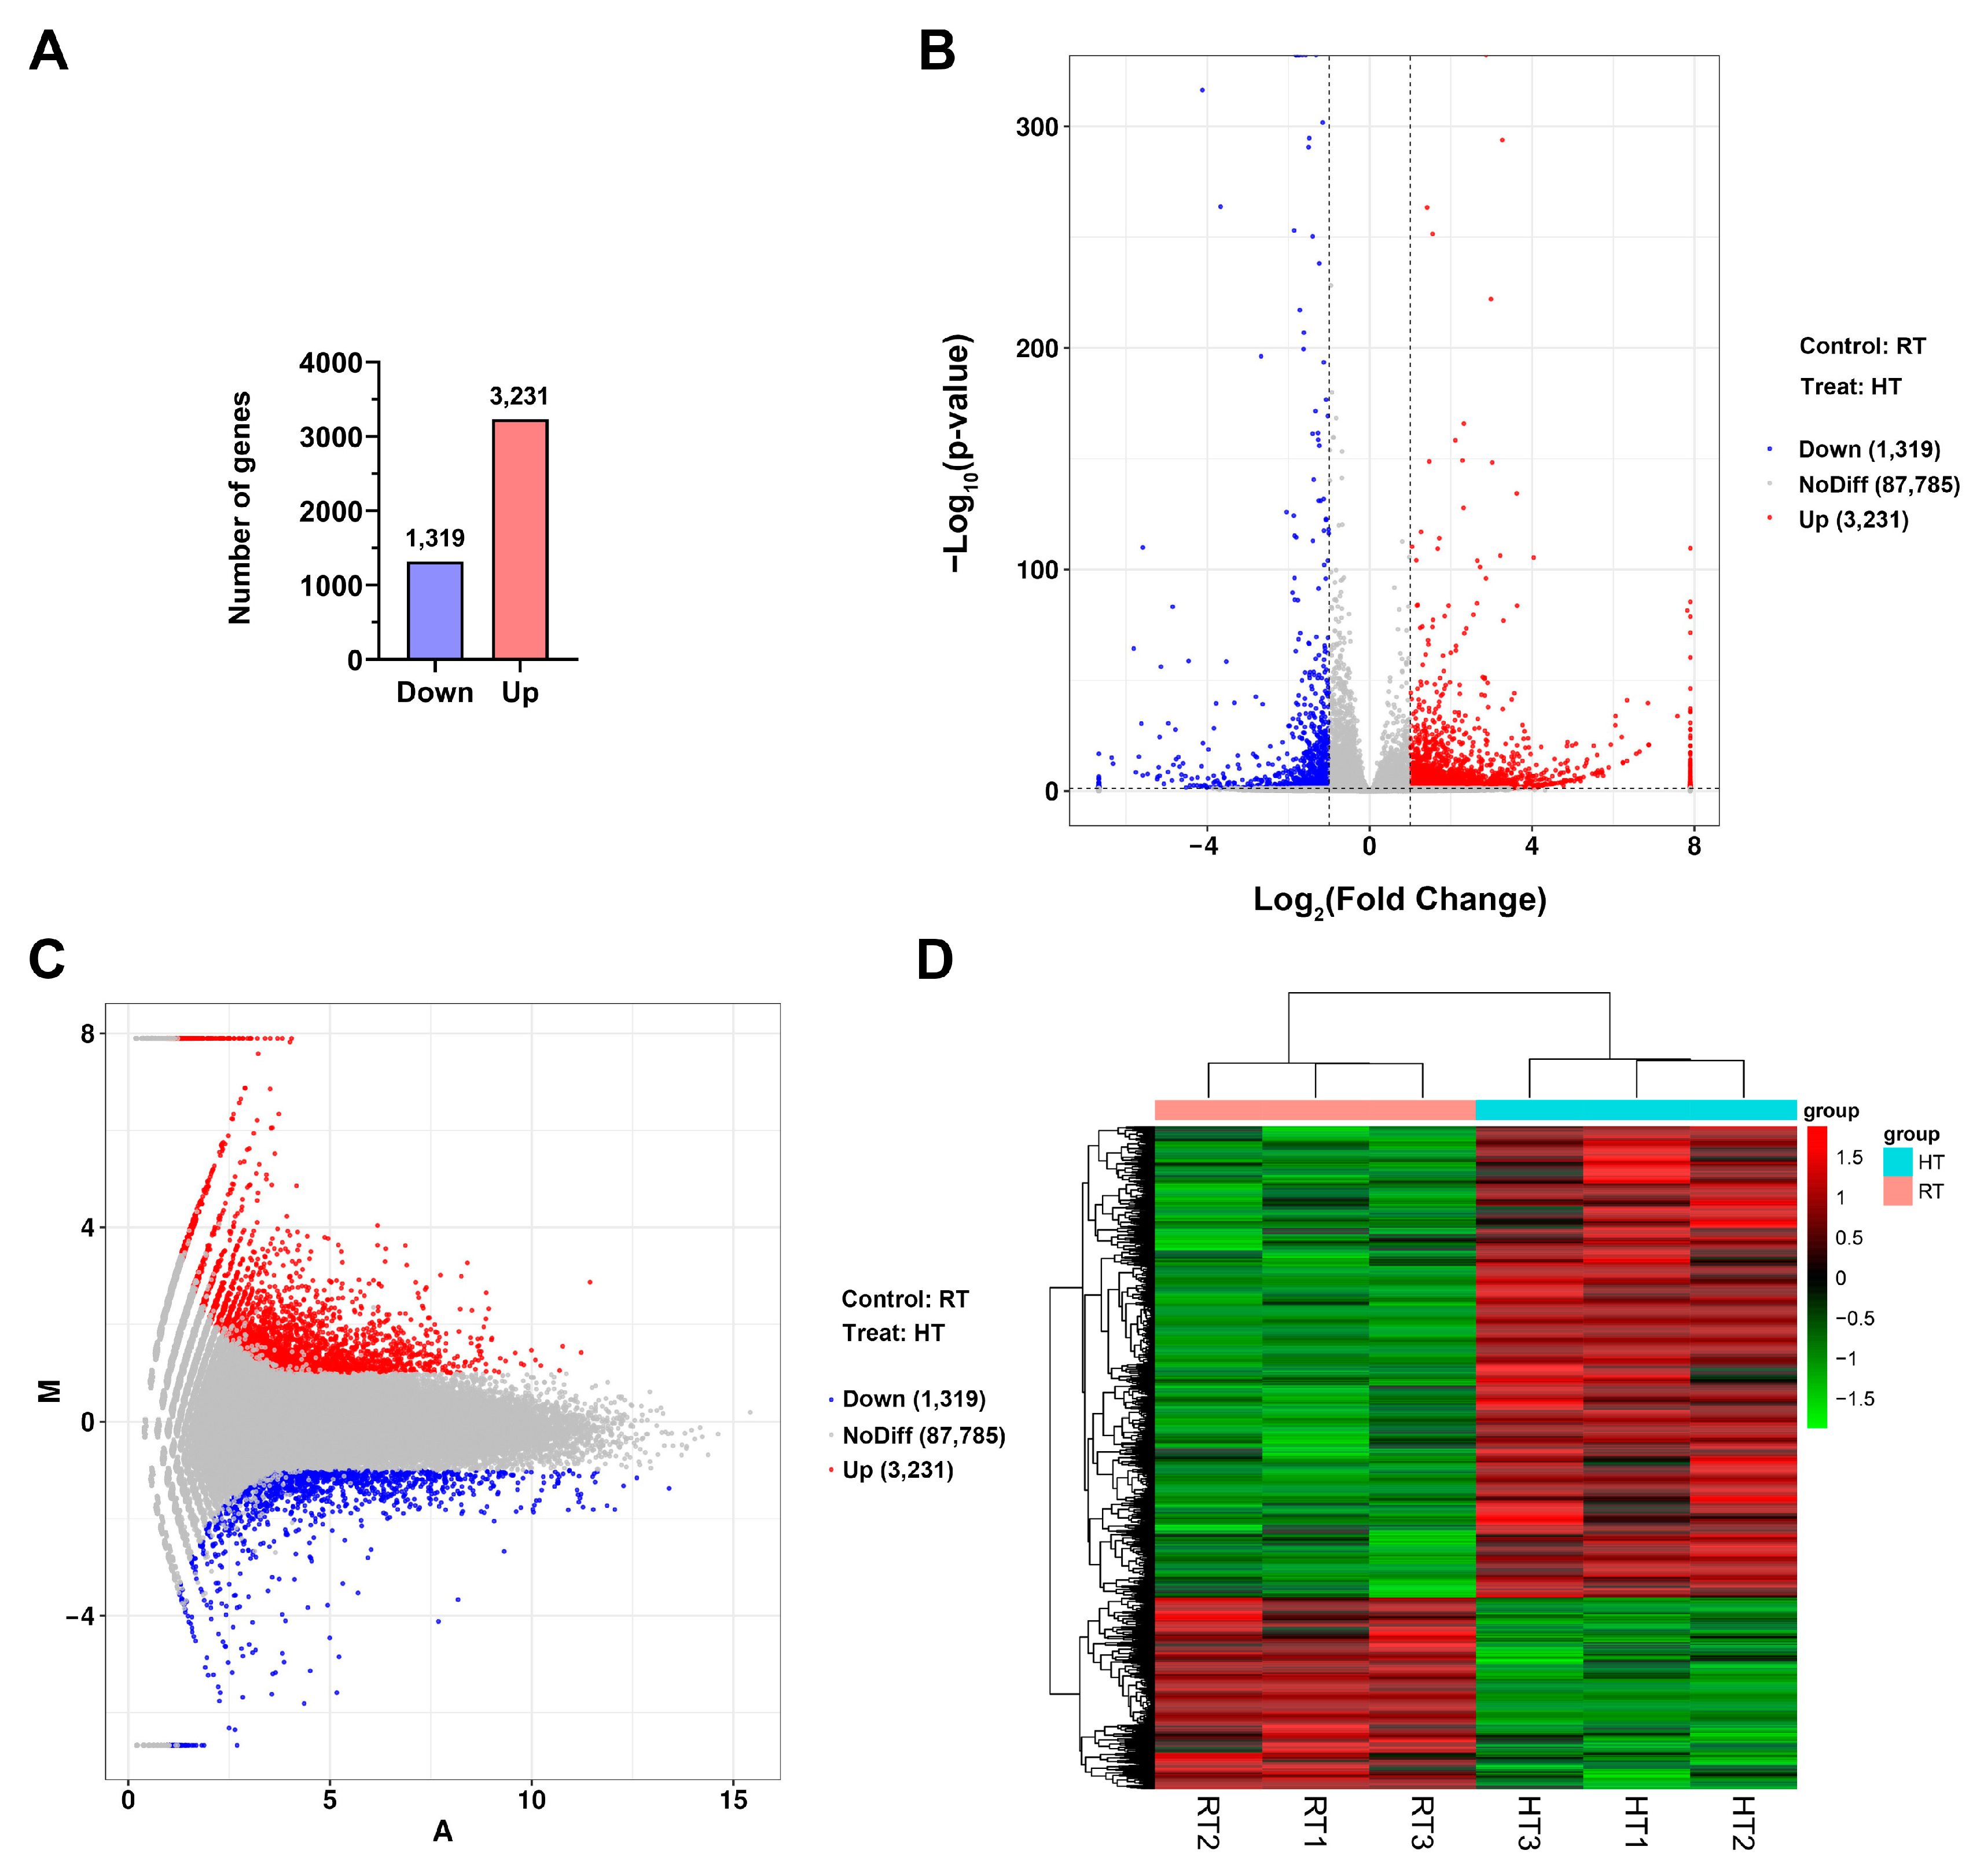
2.4. Identification of Differentially Expressed Genes (DEGs) and Functional Annotation Analysis

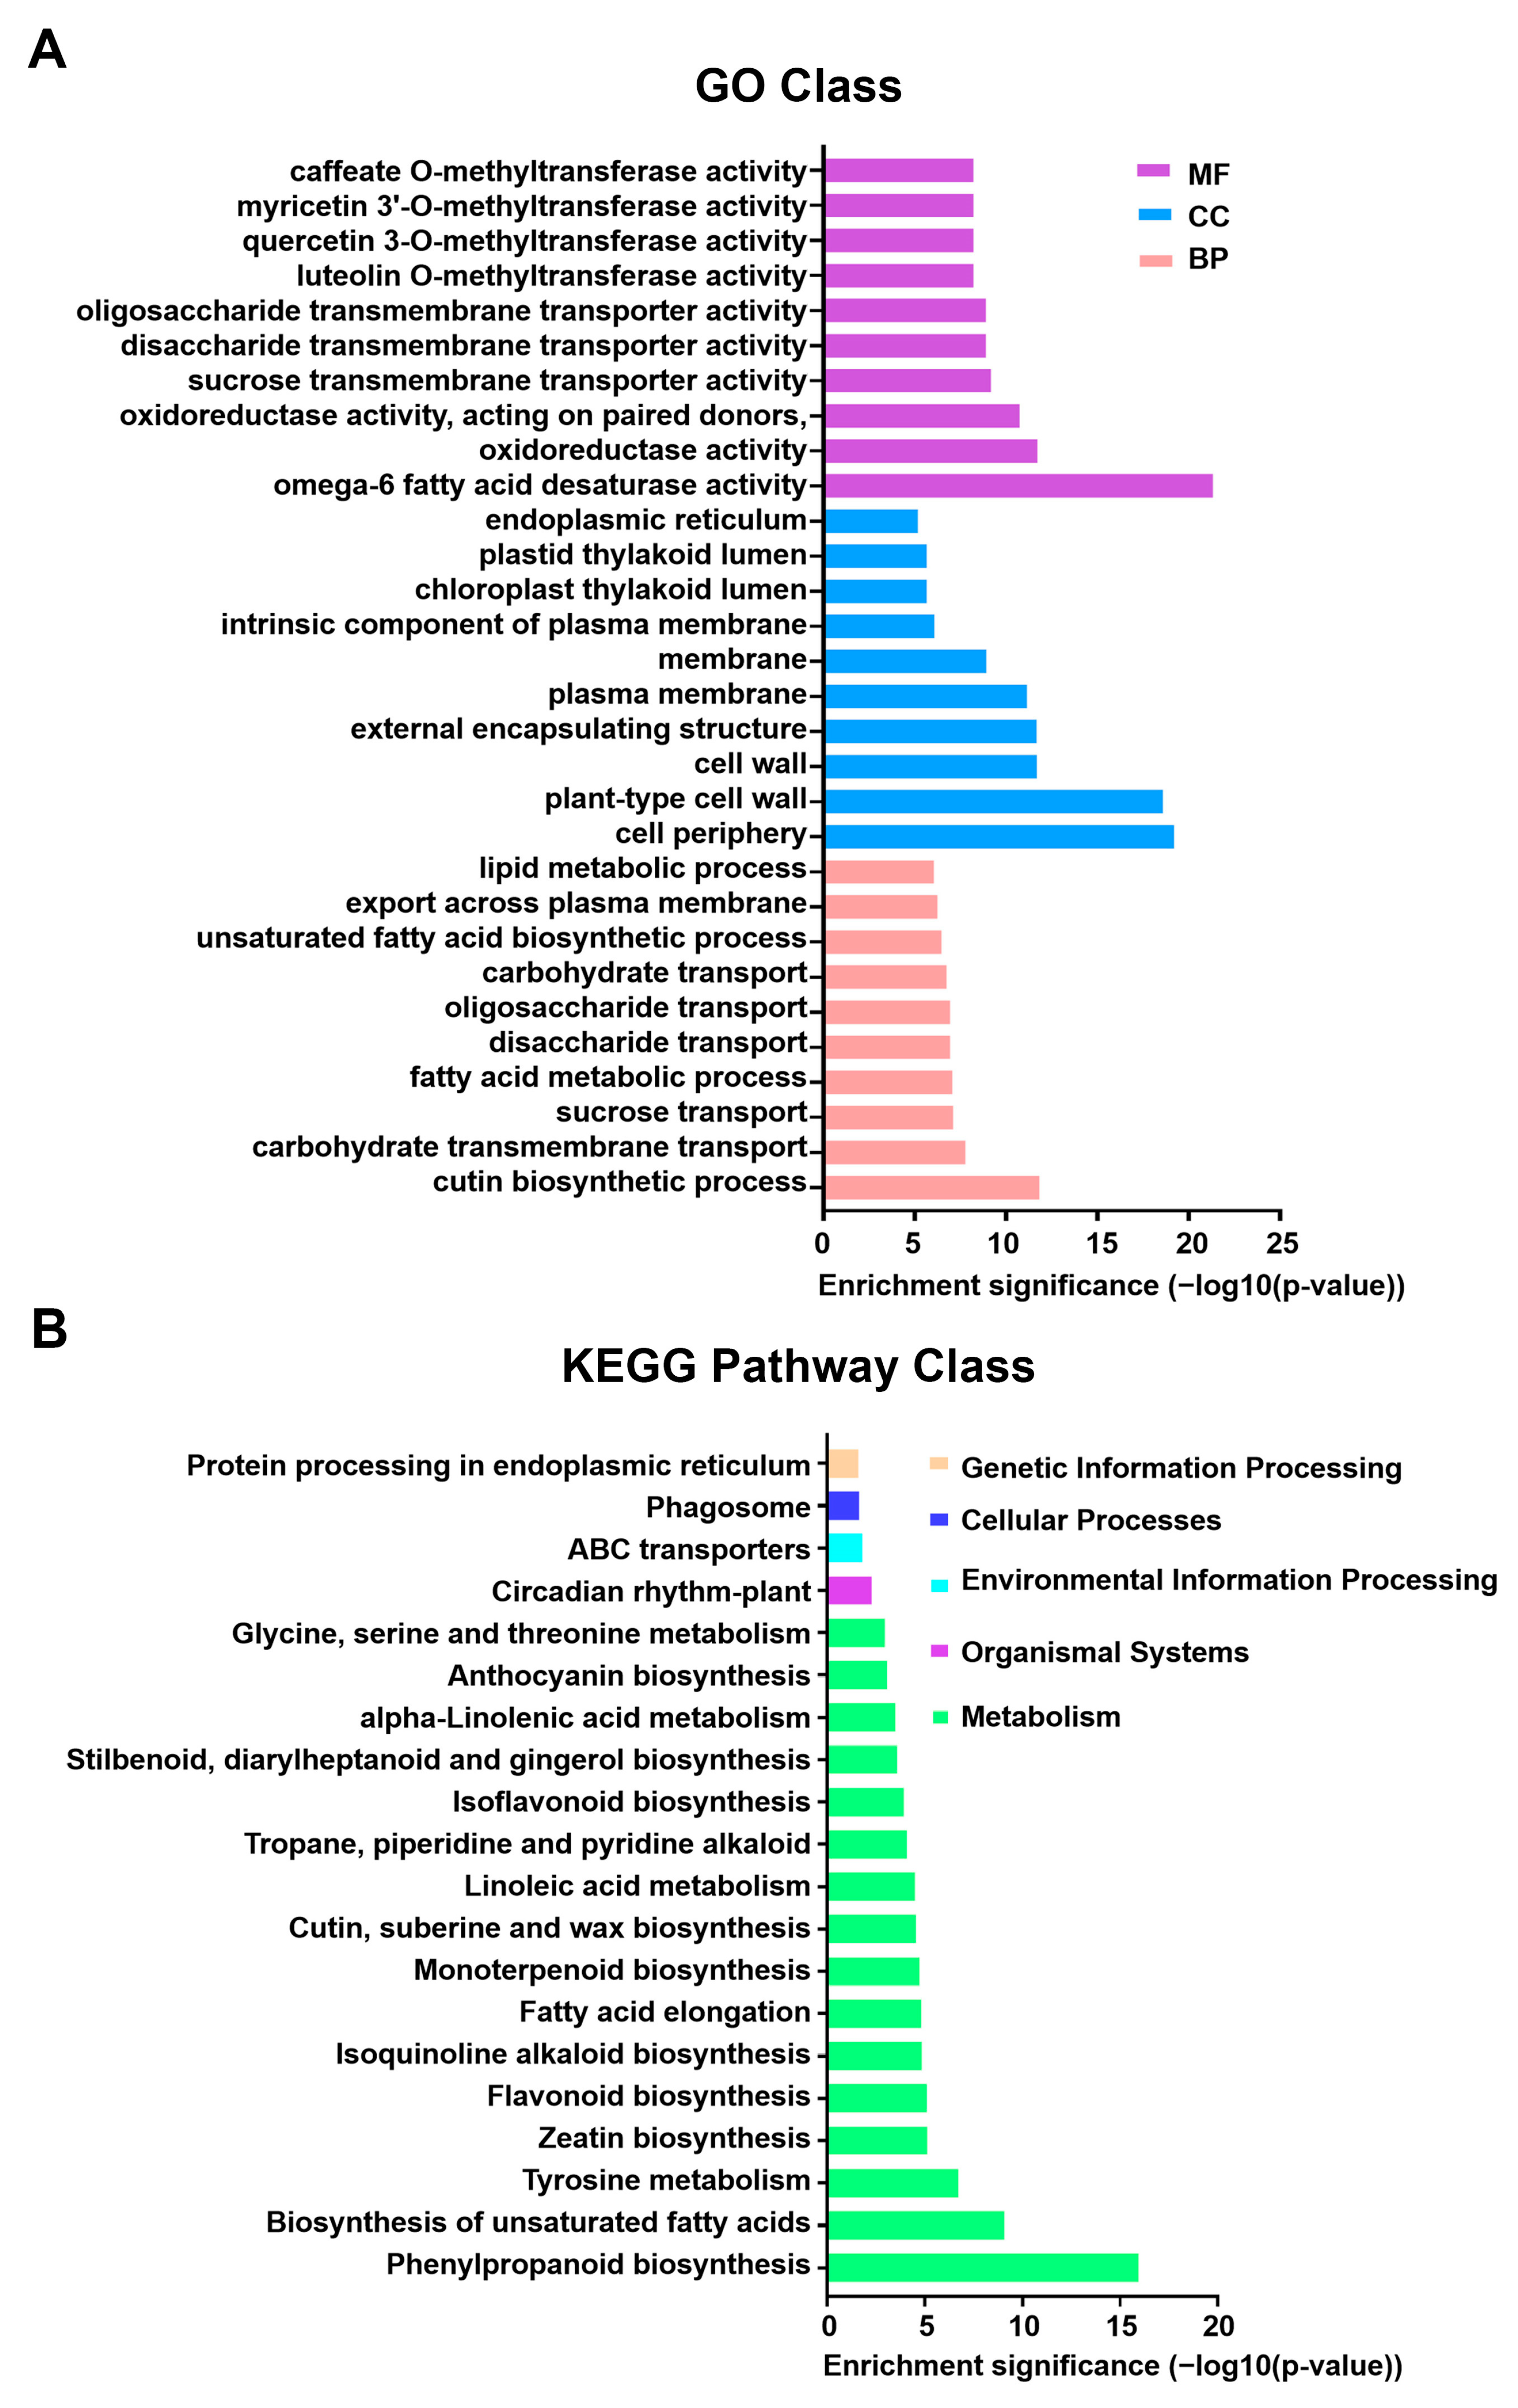
Gene annotation was conducted using data from the GO, SwissProt, KEGG, NR, eggNOG, eggNOG_Category, and SwissProtName databases. HTSeq was used to count reads mapped to each gene, representing the raw gene expression levels. FPKM normalization was applied to standardize gene expression across genes and samples for comparability. Differential gene expression analysis was performed using DESeq, with DEGs identified based on the criteria |log2FoldChange| > 1 and p < 0.05. Bidirectional clustering analysis of DEGs across different comparison groups and samples was conducted using the R package Pheatmap. Genes were clustered based on their expression profiles, while samples were grouped according to gene expression patterns. Euclidean distance was used to compute dissimilarities, and hierarchical clustering was performed using the complete linkage method. GO enrichment analysis was conducted using topGO, where DEGs associated with GO terms were evaluated based on their gene lists and counts per term. The hypergeometric distribution method was used to calculate p-values, with a significance threshold of p < 0.05. Significantly enriched GO terms were identified by comparing DEGs against the genomic background, providing insights into their major biological functions. KEGG enrichment analysis was assessed using the Rich factor, FDR value, and the number of genes mapped to each pathway.

2.5. Metabolite Extraction, Detection, and Statistical Analysis

Freeze-dried samples were transferred to 2 mL centrifuge tubes with a 5 mm tungsten bead and homogenized at 65 Hz for 1 min using a grinding instrument. Next, 1 mL of pre-cooled extraction solvent (methanol/acetonitrile/water, 2:2:1, v/v/v) was added, followed by ultrasonic extraction in an ice bath for 1 h. The samples were then incubated at −20 °C for 1 h and centrifuged at 14,000 rpm for 20 min at 4 °C. The supernatant was vacuum-dried to remove solvents. Metabolomic profiling was performed using the UPLC-ESI-Q-Orbitrap-MS system (Nexera X2 UHPLC, Shimadzu, Japan) and the TripleTOF 6600 mass spectrometer (AB Sciex, Framingham, MA, USA). Liquid chromatography separation was conducted on an ACQUITY UPLC® HSS T3 column (2.1 × 100 mm, 1.8 μm, Waters, Milford, MA, USA) at a flow rate of 0.3 mL/min. The mobile phase comprised 0.1% formic acid in water (A) and pure acetonitrile (B). The elution gradient was as follows: 0–2 min, 0% B; 2–6 min, increased to 48% B; 6–10 min, increased to 100% B and held for 2 min; 10–10.1 min, decreased to 0% B; and 10.1–13 min, re-equilibration at 0% B. Mass spectrometry data were acquired in both positive and negative ionization modes. Raw MS data processing, including peak alignment, retention time correction, and peak area extraction, was performed using the MS-DIAL software (version 4.70). Metabolites were identified by cross-referencing public databases (HMDB, MassBank) and an in-house standard library, ensuring mass accuracy within 10 ppm and MS/MS deviation under 0.02 Da. Multivariate data analysis and modeling were conducted in R (version 4.0.3) using associated R libraries. Data were standardized using Pareto scaling, and models were constructed using principal component analysis (PCA), orthogonal PLS-DA (PLS-DA), and OPLS-DA. Statistically significant metabolites were identified via the OPLS-DA model based on VIP scores, followed by a two-tailed t-test on normalized data to determine key differential metabolites. Clustering analysis of identified differential metabolites was performed using R.

2.6. Gene Expression Analysis

Total RNA was extracted from chrysanthemum ray flower petals with a Quick RNA Isolation Kit (Huayueyang, Beijing, China), adhering to the manufacturer’s guidelines. First-strand cDNA was generated using HiScript II Q Select RT SuperMix for qPCR (Vazyme Biotech, Co., Ltd., Nanjing, China), following the provided protocol. Subsequently, the cDNA was adjusted to 400 ng μL−1 using ddH2O, and qRT-PCR was performed with TB Green Premix Ex Taq II (Tli RNaseH Plus) (Takara, Dalian, China) in a 20 μL reaction volume. CmEF1α and CmActin served as reference genes for normalization. Primers employed in this research are detailed in Supplemental Table S1.

2.7. Statistical Analysis

All experiments were performed in triplicate, and bar graphs were generated using GraphPad Prism 7.05 (Chicago, IL, USA). One-way analysis of variance (ANOVA) was conducted using SPSS 19.0 to assess statistical significance.

3. Results

3.1. Heat-Induced Color Fading in the ‘Nannong Fencui’ Chrysanthemum at Full Bloom

To investigate the effect of heat on anthocyanin metabolism in chrysanthemum petals, fully bloomed ‘Nannong Fencui’ plants were exposed to either a heat treatment (HT, 35 °C) or normal control conditions (RT, 22 °C), as detailed in the Methods (Section 2.1). After treatment, the flower color phenotype was assessed, and anthocyanin (cyanidin-3-glucoside) levels in the petals were quantified using ultra-performance liquid chromatography (UPLC). As shown in Figure 1, heat treatment caused noticeable petal fading, with anthocyanin content in the heat-treated group (37.850 µg/mL) significantly lower than in the control group (70.998 µg/mL). These results suggest that heat negatively impacts anthocyanin accumulation, leading to petal fading in chrysanthemums.

3.2. Quality Assessment of Transcriptome Sequencing Data

To investigate the negative regulation of anthocyanin accumulation at full bloom under heat stress in chrysanthemums, transcriptome sequencing was performed on three biological replicates from both the heat-treated (HT) and normal temperature control (RT) groups. Samples from the HT group were labeled HT1, HT2, and HT3, while those from the RT group were designated RT1, RT2, and RT3. After sequencing, the raw data underwent quality assessment and filtering. As shown in Table 1, the six samples (HT1–HT3 and RT1–RT3) yielded 242,488,124 total reads, with 238,050,542 clean reads comprising 98.17% of the total. Quality analysis indicated that each sample had at least 98.34% Q20 bases, over 95.47% Q30 bases, no more than 0.110% ambiguous bases, and a GC content of at least 41.91% (Table 1). These metrics confirm that the sequencing produced high-quality data, providing a reliable foundation for subsequent analyses.
Filtered reads were aligned to the Chrysanthemum morifolium reference genome using HISAT2 at http://ccb.jhu.edu/software/hisat2/index.shtml (accessed on 5 December 2024), an advanced successor to TopHat2. All six samples exhibited mapping rates exceeding 80%, with uniquely mapped reads ranging from 69.94% to 70.29% and multiple mapped reads from 29.71% to 30.06% (Table 2). These results indicate strong concordance with the reference genome, confirming the data’s reliability for transcriptome analysis.

3.3. Analysis of Differentially Expressed Genes (DEGs) Between HT and RT Groups

To analyze DEGs between the HT and RT groups, we used the DESeq R package to normalize gene expression levels across samples, calculate fold changes, and perform significance testing. DEGs were identified based on the thresholds |log2FoldChange| > 1 and p-value < 0.05. As a result, 4550 DEGs were detected, including 3231 upregulated genes and 1319 downregulated genes (Figure 2A). A volcano plot (Figure 2B) illustrates the distribution and significance of gene expression changes. In the figure, blue regions indicate downregulated genes, while red regions represent upregulated genes. Most DEGs exhibited |log2FoldChange| values between 1 and 5, suggesting that heat treatment significantly altered the gene expression profile of the ‘Nannong Fencui’ chrysanthemum, though the changes were generally moderate. The distribution of DEGs in the normalized HT and RT groups is shown in Figure 2C, where red dots denote upregulated genes, blue dots represent downregulated genes, and gray dots indicate non-significant genes. The results reveal that most genes remained unaffected by heat treatment, with only a subset showing significant changes. The predominance of red dots over blue dots indicates a tendency toward gene activation under heat stress. To further examine gene expression patterns, bidirectional clustering analysis was conducted using the Pheatmap R package (Figure 2D). Euclidean distance was used for similarity measurement, and hierarchical clustering was performed using the complete linkage method. Hierarchical clustering grouped DEGs into nine distinct clusters based on their expression patterns. Specifically, Clusters 1–4 exhibited significantly higher expression in the HT group, while Clusters 5–9 showed higher expression in the RT group (Supplementary Figure S1).

3.4. Gene Ontology (GO) Functional Classification and KEGG Pathway Analysis of DEGs

DEGs were classified via GO enrichment analysis into three categories: molecular function (MF), cellular component (CC), and biological process (BP). The ten most significantly enriched GO terms (lowest p-values) in each category were selected for visualization (Figure 3A). In the MF category, the top three terms were “omega-6 fatty acid desaturase activity”, “oxidoreductase activity”, and “oxidoreductase activity, acting on paired donors”. For CC, the top three terms were “cell periphery”, “plant-type cell wall”, and “cell wall”. In the BP category, the top terms included “cutin biosynthetic process”, “carbohydrate transmembrane transport”, and “sucrose transport”. Notably, in the heat-treated group, most upregulated DEGs fell within the MF and BP categories (Supplementary Figure S2), with “omega-6 fatty acid desaturase activity” encompassing the highest number of DEGs in molecular function. These findings indicate that heat stress triggers a multifaceted response in chrysanthemums, ranging from membrane lipid metabolism adjustments to osmotic protection, significantly affecting their physiological processes.
KEGG enrichment analysis of differentially expressed genes (DEGs) identified the 20 most significantly enriched pathways (lowest p-values), as shown in Figure 3B. Compared to the control group, most DEGs in the heat-treated group were enriched in the metabolism category, with “phenylpropanoid biosynthesis” exhibiting the highest significance. Within this pathway, 103 genes were upregulated and 21 were downregulated, totaling 124 DEGs out of 1430 genes (8.7%). These findings suggest that heat stress strongly impacts the “phenylpropanoid biosynthesis” pathway, potentially triggering its activation. This pathway facilitates the production of secondary metabolites such as lignin and flavonoids, which contribute to cell wall reinforcement, ROS mitigation, and redox balance in chrysanthemums [21]. Additionally, the observed metabolic reprogramming, alongside previously identified changes in membrane lipid metabolism (e.g., omega-6 fatty acid desaturase activity) and osmotic regulation (e.g., sucrose transport), suggests a multi-tiered stress adaptation network. These results highlight phenylpropanoid metabolism as a central hub in the heat response, playing a crucial role in the stress adaptation of chrysanthemums.

3.5. Analysis of Heat Stress-Responsive Genes Based on Transcriptome Sequencing

As core components of the plant heat stress response, heat shock proteins (HSPs) play an essential role in maintaining protein stability and preventing misfolding [22]. Transcriptome analysis identified 56 CmHSP genes that were significantly upregulated and 27 that were downregulated following heat treatment in chrysanthemums. A heatmap was generated based on the 10 most significantly upregulated and downregulated CmHSP genes (Figure 4A). The results revealed that several CmHSP genes were differentially expressed under heat stress. Notably, CmHSP70.1 (evm.TU.scaffold_7043.14) exhibited the highest upregulation (4.5-fold), while CmHSP18.7 (evm.TU.scaffold_1095.148) showed the most significant downregulation, with expression reduced to 0.41-fold of the normal temperature control. Heat shock transcription factors (HSFs) play a key regulatory role in plant responses to heat stress by inducing HSP expression and other protective genes, thereby enhancing thermotolerance [23]. Transcriptomic analysis revealed that 12 HSF genes were upregulated, while 6 were downregulated in ‘Nannong Fencui’ chrysanthemums under heat stress. Among them, CmHSFA2B (evm.TU.scaffold_906.161) exhibited the highest upregulation (2.6-fold), whereas CmHSF30.5 (evm.TU.scaffold_1645.88) showed the most significant downregulation, with expression reduced to 0.28-fold of the control (Figure 4B). The differential expression of CmHSF and CmHSP genes in response to high temperatures suggests that chrysanthemums employ diverse molecular strategies, likely involving multiple biological processes, to mitigate heat stress.
Beyond CmHSPs and CmHSFs, transcriptome analysis identified the differential expression of multiple WRKY and bZIP transcription factors following heat treatment. Specifically, 42 CmWRKY genes were upregulated and 21 downregulated, while 23 CmbZIP genes were upregulated and 5 downregulated. Heatmaps visualized the most significantly altered genes in each family (Figure 4C,D). The observed expression trends indicate that WRKY and bZIP transcription factors are likely key regulators in the chrysanthemum heat stress response network.

3.6. Untargeted Metabolomic Analysis of Differentially Accumulated Metabolites in Petals Under Heat Stress

To elucidate the metabolic basis of petal fading in ‘Nannong Fencui’ chrysanthemums under heat stress, we performed untargeted metabolomic profiling using a TripleTOF 6600 LC-MS system to compare metabolite changes between the HT and RT groups. Principal component analysis (PCA) revealed distinct metabolic separation between the HT and RT groups (Figure 5A). Additionally, an orthogonal partial least squares discriminant analysis (OPLS-DA) model was applied to further examine the data (Table 3). The model showed exceptionally high R2Y(cum) (0.998) and Q2(cum) (0.933) values, indicating excellent model fit and strong internal predictive performance, as Q2 substantially exceeds the commonly accepted threshold of 0.5. However, permutation testing yielded non-significant p-values for R2Y (0.215) and Q2 (0.115), both exceeding 0.05, suggesting that the model’s explanatory and predictive power may not be statistically validated. This may be attributed to the limited statistical power of the permutation test due to the small sample size (n = 3 per group), raising concerns about potential overfitting and emphasizing the need for further validation to confirm the model’s robustness in predicting new samples. Despite these limitations, the high Q2 value underscores the model’s value as an exploratory tool in this study, enabling effective identification of metabolites that distinguish between the HT and RT groups. Differential metabolites were identified using thresholds of Variable Importance in Projection (VIP) > 1 (Multivariate Statistical Analysis) and p-value < 0.05 (Univariate Statistical Analysis). A total of 2399 metabolites were detected, of which 483 showed differential accumulation between HT and RT, including 176 upregulated and 307 downregulated compounds (Figure 5B). Among these, 93 metabolites had a fold change (FC) > 1.5, including significantly upregulated compounds such as indole-3-acrylic acid, 1,5-naphthalenediamine, N-methylquinolinium-2-carboxylate, Tryptophan, 6-methyltryptophan, speciosin J, and podofilox. Conversely, 160 metabolites had a FC < 0.67 (1/1.5), with glycerophosphoglycerol, α,4-dimethylstyrene, and benzoyl cyanide notably downregulated. Further analysis revealed that chrysanthemum petals accumulated diverse metabolites under heat stress (Figure 5C), including 97 lipids and lipid-like molecules, 54 phenylpropanoids and polyketides, 44 organic acids and derivatives, and 37 organic oxygen compounds. Under heat stress, plants undergo lipid remodeling, leading to reduced lipid unsaturation and increased antioxidant levels, which preserve membrane integrity and enhance thermotolerance via signaling pathways [24,25,26]. Additionally, anthocyanin degradation may generate phenolic acids [27], suggesting that some of the 44 organic acids and their derivatives could be anthocyanin degradation products. KEGG enrichment analysis identified the 30 most significantly enriched pathways (Figure 5D). Notably, the “phenylalanine metabolism” pathway showed strong enrichment, with phenylalanine—a critical anthocyanin precursor—markedly upregulated. In contrast, while the “flavone and flavonol biosynthesis” pathway was enriched, flavones and flavonols were substantially downregulated. The “oxidative phosphorylation” pathway also exhibited significant enrichment, suggesting its role in energy metabolism, potentially linked to the heat stress response (Supplementary Table S2). These findings collectively indicate a significant impact of heat stress on anthocyanin metabolism in chrysanthemum petals. Evidence includes the marked upregulation of phenylalanine, a key precursor for anthocyanin biosynthesis. Concurrently, related flavonoid compounds, such as flavones and flavonols, were substantially downregulated. Furthermore, the upregulation of numerous organic acids and their derivatives suggests an increase in potential anthocyanin degradation products.

3.7. Integrated Transcriptomic and Metabolomic Analysis

To uncover the regulatory mechanisms of chrysanthemums under heat stress, we conducted an integrated transcriptomic and metabolomic analysis. KEGG pathway enrichment analysis was first performed separately for the transcriptomic and metabolomic datasets, followed by the identification of shared KEGG pathways. A total of 42 pathways were commonly enriched in both analyses, including “phenylpropanoid biosynthesis”, “flavonoid biosynthesis”, “zeatin biosynthesis”, and “starch and sucrose metabolism” (Figure 6). In this figure, the bubble size reflects the number of enriched features (count, 0–100), and color gradient (blue to red) denotes statistical significance (−Log10(p), 0–12), with red indicating greater significance. The transcriptomic dataset showed larger bubbles, suggesting higher enrichment levels. For example, “phenylpropanoid biosynthesis” appeared as a large red bubble (count ≈ 75, −Log10(p) ≈ 12), indicating a drastic alteration in gene expression (Figure 6). Similarly, “flavonoid biosynthesis” and “biosynthesis of unsaturated fatty acids” displayed light green to yellow bubbles (counts ≈ 50–75, −Log10(p) = 8–12), reflecting a significant change in gene expression under heat stress. In contrast, the metabolomic dataset exhibited smaller, lighter bubbles (counts < 25, −Log10(p) = 0–4, blue to light green), signifying lower metabolite enrichment and significance (Figure 6). Despite these differences, this integrative analysis elucidated the complex molecular response of chrysanthemums to heat stress. Higher transcriptomic enrichment suggests a rapid gene expression response, particularly in secondary metabolic pathways such as “phenylpropanoid biosynthesis” and “flavonoid biosynthesis”. Lower metabolomic enrichment may reflect a lag in metabolite accumulation or downstream regulatory effects. These findings imply that the interaction between transcriptomic and metabolomic responses to heat stress is highly dynamic, providing insights into the coordinated regulation of gene expression and metabolite fluctuations.

3.8. Analysis of Heat Stress Effects on Anthocyanin Metabolism in Chrysanthemums

During the full-bloom stage, ‘Nannong Fencui’ chrysanthemums exhibited a decline in anthocyanin accumulation and petal fading following heat treatment (Figure 1). To investigate the underlying regulatory mechanisms, we conducted a differential expression analysis of the genes involved in anthocyanin biosynthesis using transcriptomic data. Our findings revealed that structural genes in the primary anthocyanin biosynthesis pathway had consistently low expression levels. Notably, CmCHS-1 (evm.TU.scaffold_asm7_new.842), CmF3′H (evm.TU.scaffold_5596.31), CmANS (evm.TU.scaffold_371.22), and CmUFGT (evm.TU.scaffold_10818.92) all had FPKM values of 0 in both the HT and RT groups (Figure 7). Heatmap analysis of gene expression (based on FPKM values) confirmed that heat stress had negligible effects on the expression of structural genes involved in anthocyanin biosynthesis (Figure 7). Regarding anthocyanin biosynthesis branch pathways, CmFLS (evm.TU.scaffold_11345.15), encoding flavonol synthase, maintained high expression (FPKM ≈ 15–20) under both conditions, whereas CmFNS (evm.TU.scaffold_830.17), involved in flavones synthesis, showed low expression. Similarly, genes in anthocyanin branch pathways exhibited negligible expression changes under heat stress (Figure 7). In chrysanthemums, anthocyanin biosynthesis is primarily regulated by the MBW complex, comprising CmMYB6, CmbHLH2, and CmTTG1 [28]. Transcriptomic analysis revealed low expression of CmMYB6 (evm.TU.scaffold_113.121), CmbHLH2 (evm.TU.scaffold_11779.113), and CmTTG1 (evm.TU.scaffold_11367.24) in both the HT and RT groups, with CmMYB6 expression declining under heat stress, as indicated by its average FPKM dropping from 2.76 to 1.92 (Figure 7). These findings suggest that, at full bloom—when anthocyanin accumulation peaks—anthocyanin biosynthesis in ‘Nannong Fencui’ is largely inactive. Consequently, heat-induced petal fading at this stage likely does not stem from direct suppression of anthocyanin biosynthesis.
To investigate the potential enzymatic degradation of anthocyanins in chrysanthemum petals under heat stress, we analyzed changes in the accumulation of relevant metabolites in the metabolome and examined the expression changes of associated genes in the transcriptome. Previous studies have shown that anthocyanins in plants can be degraded into protocatechuic acid through the catalytic action of class III peroxidase (PRX) [12]. However, metabolomic analysis revealed that protocatechuic acid was undetectable in both the HT and RT groups (Supplementary Table S2). It is reported that plants may convert protocatechuic acid to vanillic acid via O-methylation or to gallic acid via hydroxylation [29]. Metabolomic analysis confirmed that 5-carboxyvanillic acid, an oxidative derivative of vanillic acid, significantly increased in HT petals, while gallic acid remained undetectable in both the HT and RT groups (Supplementary Table S2). Based on these findings, we hypothesize that under heat stress, anthocyanins degrade into protocatechuic acid via PRX enzyme catalysis, which is then O-methylated by O-methyltransferase 1 (OMT1) to form vanillic acid, followed by oxidation to 5-carboxyvanillic acid. To preliminarily validate this at the gene expression level, we analyzed the expression changes of PRX and OMT1 genes in the transcriptome. Previous studies have shown that BcPrx01, a PRX in Brunfelsia calycina, degrades anthocyanins as flowers develop and lose pigmentation [8]. Similarly, VviPRX31, a PRX in grapevine (Vitis vinifera cv. Sangiovese), is induced by high-temperature treatment and mediates anthocyanin degradation during ripening under high temperatures [9]. To identify chrysanthemum homologs of these PRX genes, we conducted a BLAST search at http://210.22.121.250:8880/asteraceae/blast/blastPage (accessed on 9 February 2025) using BcPrx01 and VviPRX31 and analyzed their expression changes in the transcriptome. Our results showed that evm.TU.scaffold_11851.65, the chrysanthemum homolog of VviPRX31, was induced by heat stress, whereas evm.TU.scaffold_550.87, the chrysanthemum homolog of BcPrx01, had nearly undetectable expression, with an FPKM value close to 0 (Figure 8A). The distinct expression patterns of PRX homologs across plant species prompted us to further investigate the role of additional PRX genes in chrysanthemum during this process. To this end, we conducted a genome-wide identification of PRX genes in the Chrysanthemum morifolium genome [20]. Using Hidden Markov Models (HMMs) of PRX proteins (Pfam: PF00141), we searched for homologous sequences with an E-value threshold of <1 × 10⁻⁵. Additionally, 73 PRX protein sequences from Arabidopsis thaliana were used to further screen the C. morifolium genome database. The intersection of candidate genes was validated using the NCBI Conserved Domain Database (NCBI-CDD; https://www.ncbi.nlm.nih.gov/cdd/ (accessed on 9 February 2025)), confirming the presence of a conserved secretory_peroxidase domain (E-value < 1 × 10⁻⁵). After removing duplicates, we identified 224 PRX genes as putative members of the C. morifolium PRX family. Transcriptome analysis revealed that 10 CmPRX genes were upregulated under heat stress, with evm.TU.scaffold_888.372 showing the highest increase, suggesting its potential role in anthocyanin degradation under these conditions (Figure 8B). Meanwhile, a BLAST search using the Arabidopsis OMT1 protein sequence identified CmOMT1 (evm.TU.scaffold_604.282) as its chrysanthemum homolog, with its expression significantly elevated under heat stress (Figure 8C). These findings suggest that in chrysanthemums, heat stress may induce PRX and OMT1 expression, leading to the enzymatic degradation of anthocyanins into 5-carboxyvanillic acid, an oxidative derivative of vanillic acid. This process likely contributes to the reduction of anthocyanin accumulation, ultimately resulting in petal fading under heat stress.
To independently validate the RNA-Seq expression patterns of key anthocyanin metabolism genes, we performed quantitative real-time PCR (qRT-PCR) on nine selected targets. CmEF1α and CmActin were used as reference genes for normalization. Overall, qRT-PCR results closely matched the RNA-Seq data, strongly supporting our findings (Supplementary Figure S3). Specifically, qRT-PCR confirmed the significant heat-induced upregulation (p < 0.01) of all candidate genes implicated in anthocyanin degradation: CmOMT1 (evm.TU.scaffold_604.282) and four CmPRX genes (evm.TU.scaffold_11851.65, evm.TU.scaffold_10341.32, evm.TU.scaffold_1456.120, and evm.TU.scaffold_888.372). This validation covered both the substantial (e.g., >10-fold for evm.TU.scaffold_888.372) and moderate (e.g., ~1.5-fold for evm.TU.scaffold_11851.65) induction levels observed by RNA-Seq. Additionally, qRT-PCR supported the RNA-Seq finding of extremely low transcript abundances for core anthocyanin biosynthesis genes at the full-bloom stage. CmCHS-1 (evm.TU.scaffold_asm7_new.842) was undetectable under both conditions (Ct > 35, labeled n.d.). Similarly, CmUFGT (evm.TU.scaffold_10818.92) showed high Ct values (~33), indicating very low expression and no significant difference between treatments, consistent with the RNA-Seq results. Although CmANS (evm.TU.scaffold_371.22) and the key regulator CmMYB6 (evm.TU.scaffold_113.121) also showed low transcript levels (Ct ~ 34 and 30, respectively), qRT-PCR detected a statistically significant downregulation under heat stress (p < 0.01; Supplementary Figure S3). The qRT-PCR method, being more sensitive, revealed clearer downregulation trends for these low-abundance transcripts compared to RNA-Seq.
In summary, the qRT-PCR validation confirmed the key transcriptional changes identified by RNA-Seq, notably the marked activation of degradation-related genes and the general inactivity or slight suppression of the anthocyanin biosynthesis pathway under heat stress at the full-bloom stage.

4. Discussion

Chrysanthemums (Chrysanthemum morifolium) typically bloom in the cool autumn season, but to meet high market demand, year-round production is necessary. However, petal fading due to high temperatures during summer cultivation significantly impacts their ornamental quality and commercial value, posing a major production challenge [30,31]. Understanding the mechanisms of flower color regulation under heat stress, identifying key regulatory genes, and developing heat-tolerant chrysanthemum varieties through molecular breeding are essential strategies to address this issue. Previous research has primarily focused on how heat stress suppresses anthocyanin biosynthesis, while anthocyanin degradation under heat stress remains largely unexplored. This knowledge gap limits a comprehensive understanding of anthocyanin metabolism in chrysanthemums and restricts the identification of superior genetic resources. In this study, we used the chrysanthemum cultivar ‘Nannong Fencui’ as the research material, subjected fully bloomed flowers—when anthocyanin accumulation peaked—to heat treatment, and conducted transcriptome sequencing to compare gene expression differences between heat-treated and control groups. Combined with metabolomic analysis of differential metabolites after heat treatment, we systematically examined the impact of heat stress on anthocyanin metabolism in fully bloomed chrysanthemums.
Heat stress-induced reductions in anthocyanin accumulation are widely observed across various plant species. For example, heat stress inhibits anthocyanin accumulation in apple (Malus domestica) and cherry (Prunus avium L.) fruits, leading to poor coloration [32,33]. Several key mechanisms underlie the impact of heat stress on anthocyanin accumulation. High temperatures promote the nuclear translocation of the E3 ubiquitin ligase COP1, which degrades anthocyanin biosynthesis activators such as HY5 [34]. Under heat stress, phenylalanine metabolism shifts toward lignin and chlorogenic acid synthesis, reducing the availability of direct precursors for anthocyanin biosynthesis [35]. The transcriptional expression of anthocyanin biosynthesis activators is suppressed under heat stress [36], while the transcription of anthocyanin biosynthesis inhibitors is enhanced in response to heat stress [17]. Additionally, PRX enzyme genes are upregulated under heat stress, leading to increased PRX enzyme levels and activity, which promote anthocyanin degradation [9,12]. Thus, heat stress affects anthocyanin metabolism through multiple interconnected regulatory mechanisms. In this study, we integrated transcriptomic and metabolomic approaches to comprehensively analyze the effects of heat stress on anthocyanin metabolism in chrysanthemum petals, considering both biosynthesis and degradation. Our research aims to unravel the regulatory network governing anthocyanin metabolism under heat stress, providing a foundation for further investigation of key regulatory pathways.
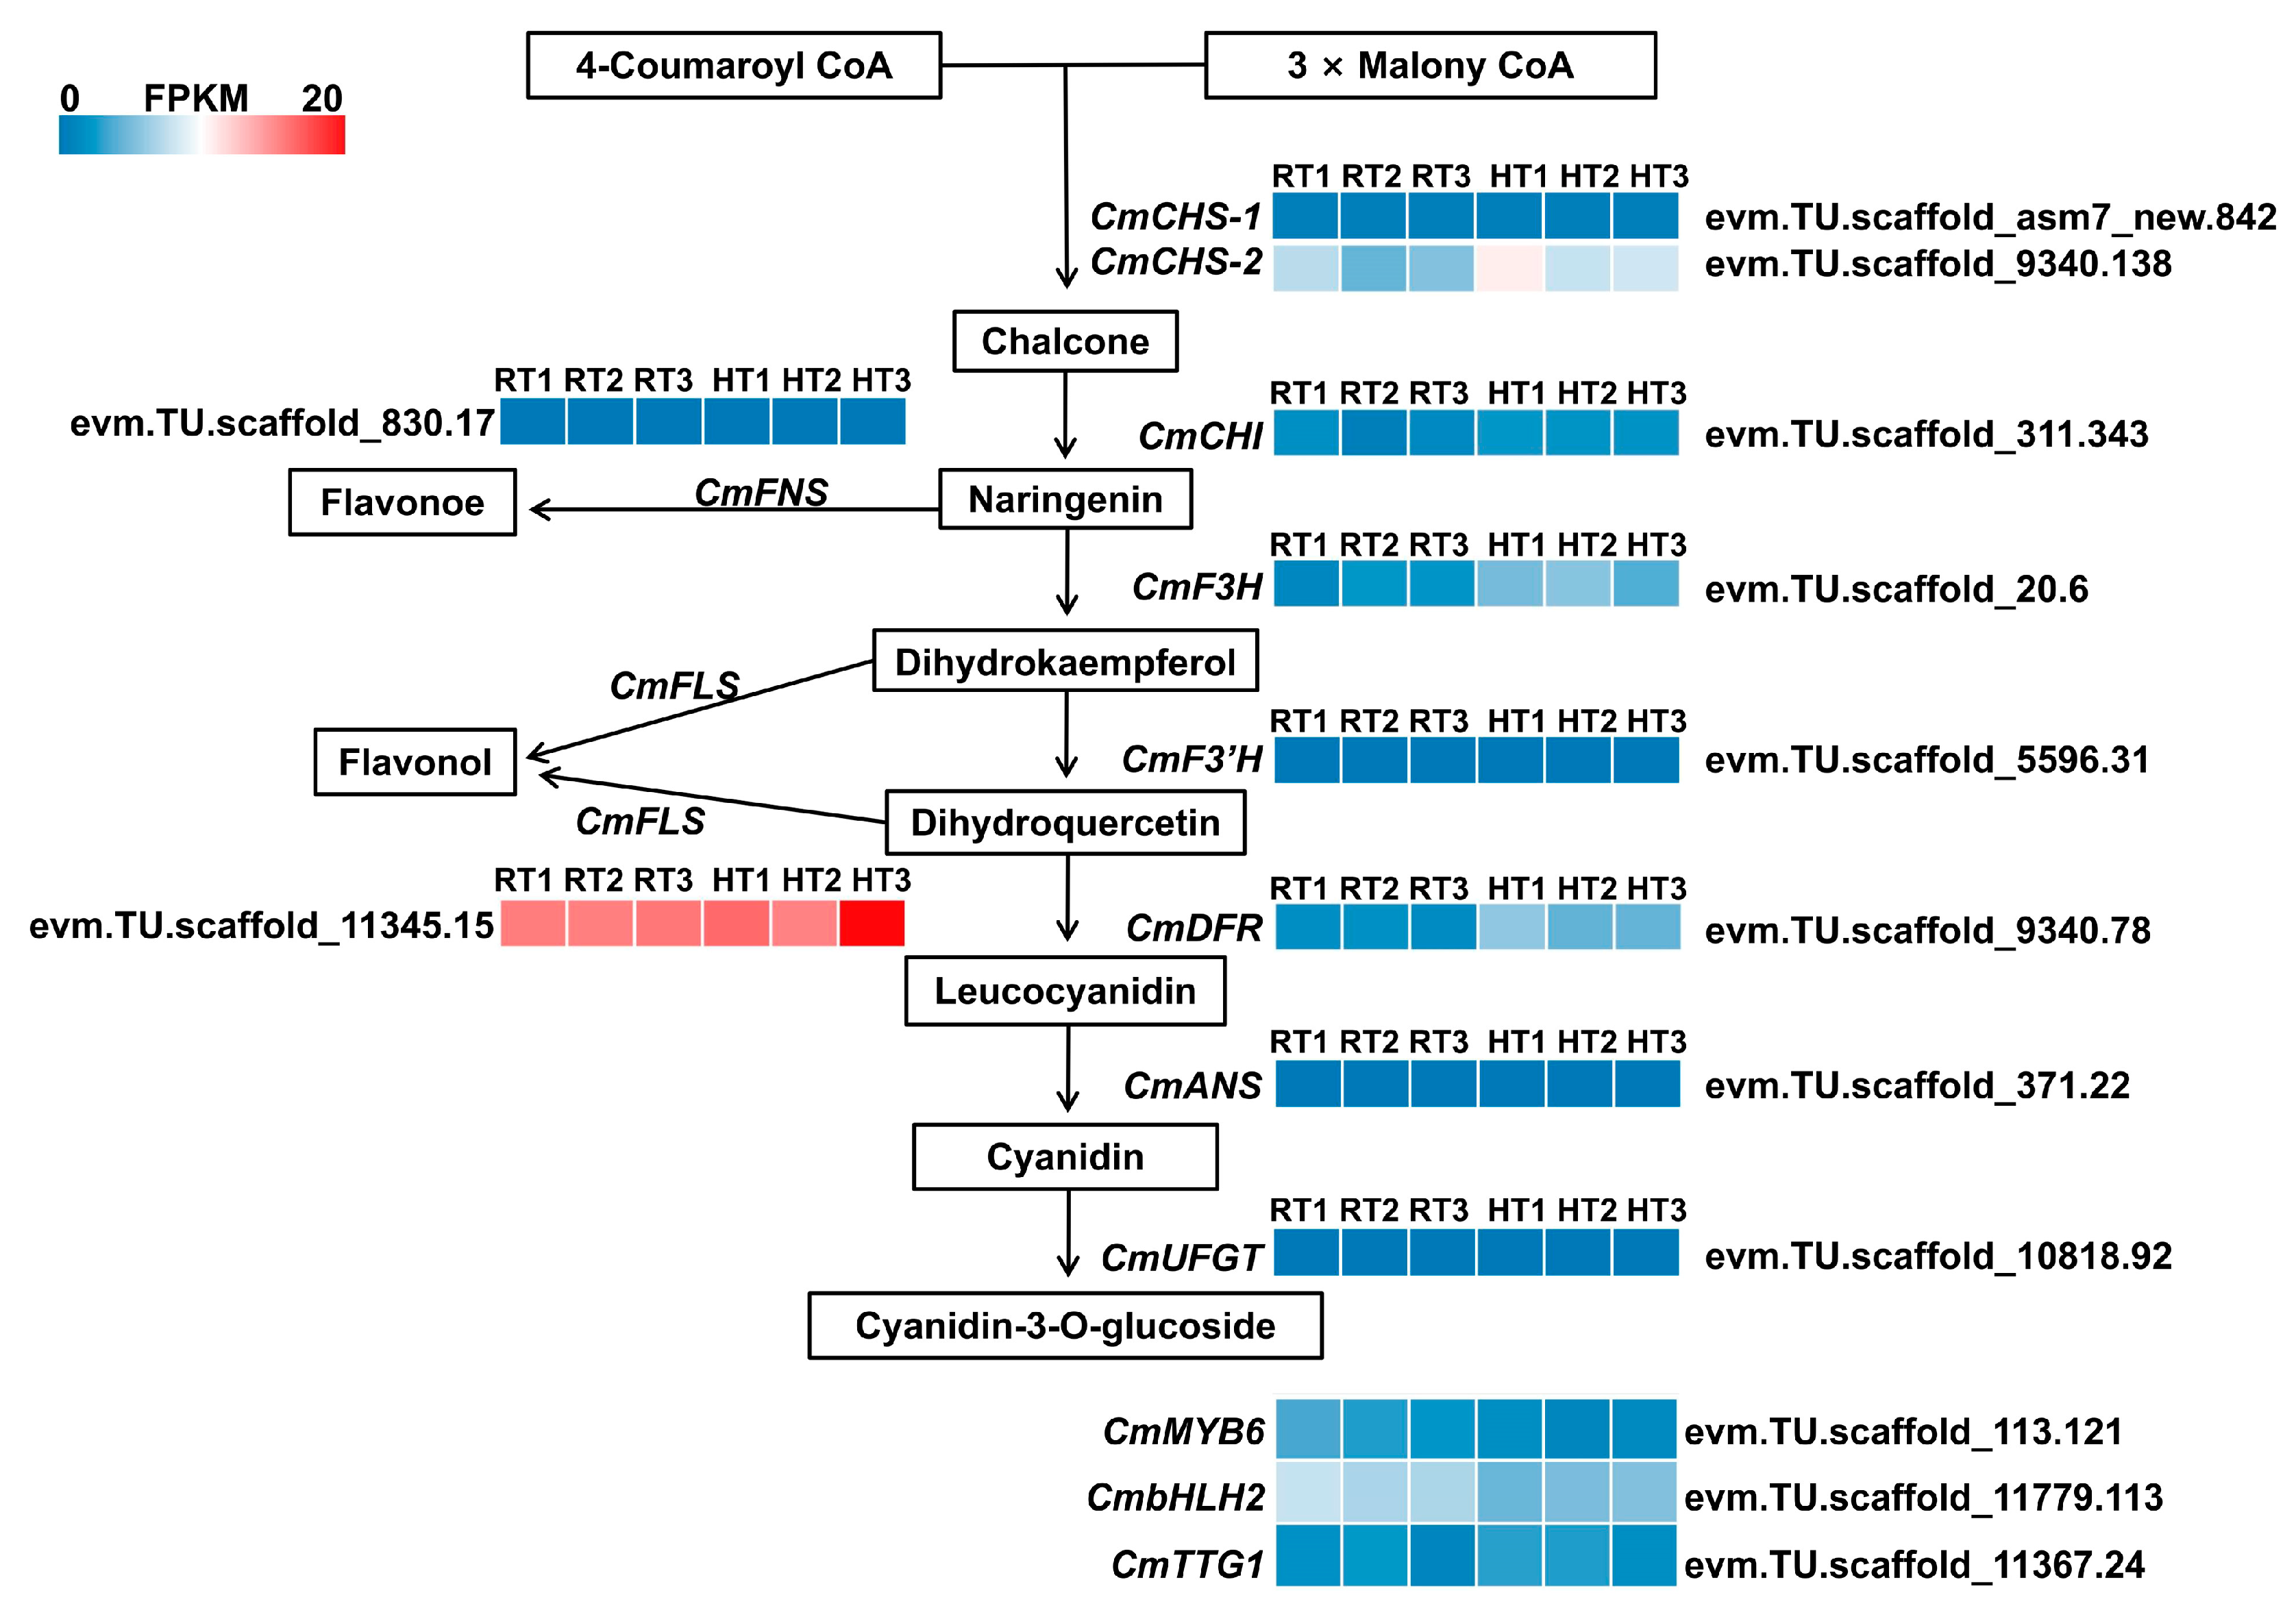
Transcriptomic analysis revealed that at full bloom, most structural genes involved in anthocyanin biosynthesis exhibited minimal expression levels, regardless of whether plants were exposed to normal or high temperatures (Figure 7). This suggests that at this stage, anthocyanin accumulation in chrysanthemum petals has peaked, and the biosynthetic pathway is relatively inactive. Interestingly, the flavonol synthase gene CmFLS maintained consistently high basal expression (FPKM values approximately 15–20) under both normal and high-temperature conditions, whereas the flavone synthase gene CmFNS remained at low expression levels throughout (Figure 7). These findings suggest that at full bloom, chrysanthemums may prioritize flavonol biosynthesis over anthocyanins or other flavonoids. This preferential metabolic branching could serve as a regulatory strategy to sustain flavonoid homeostasis after anthocyanin biosynthesis has concluded.
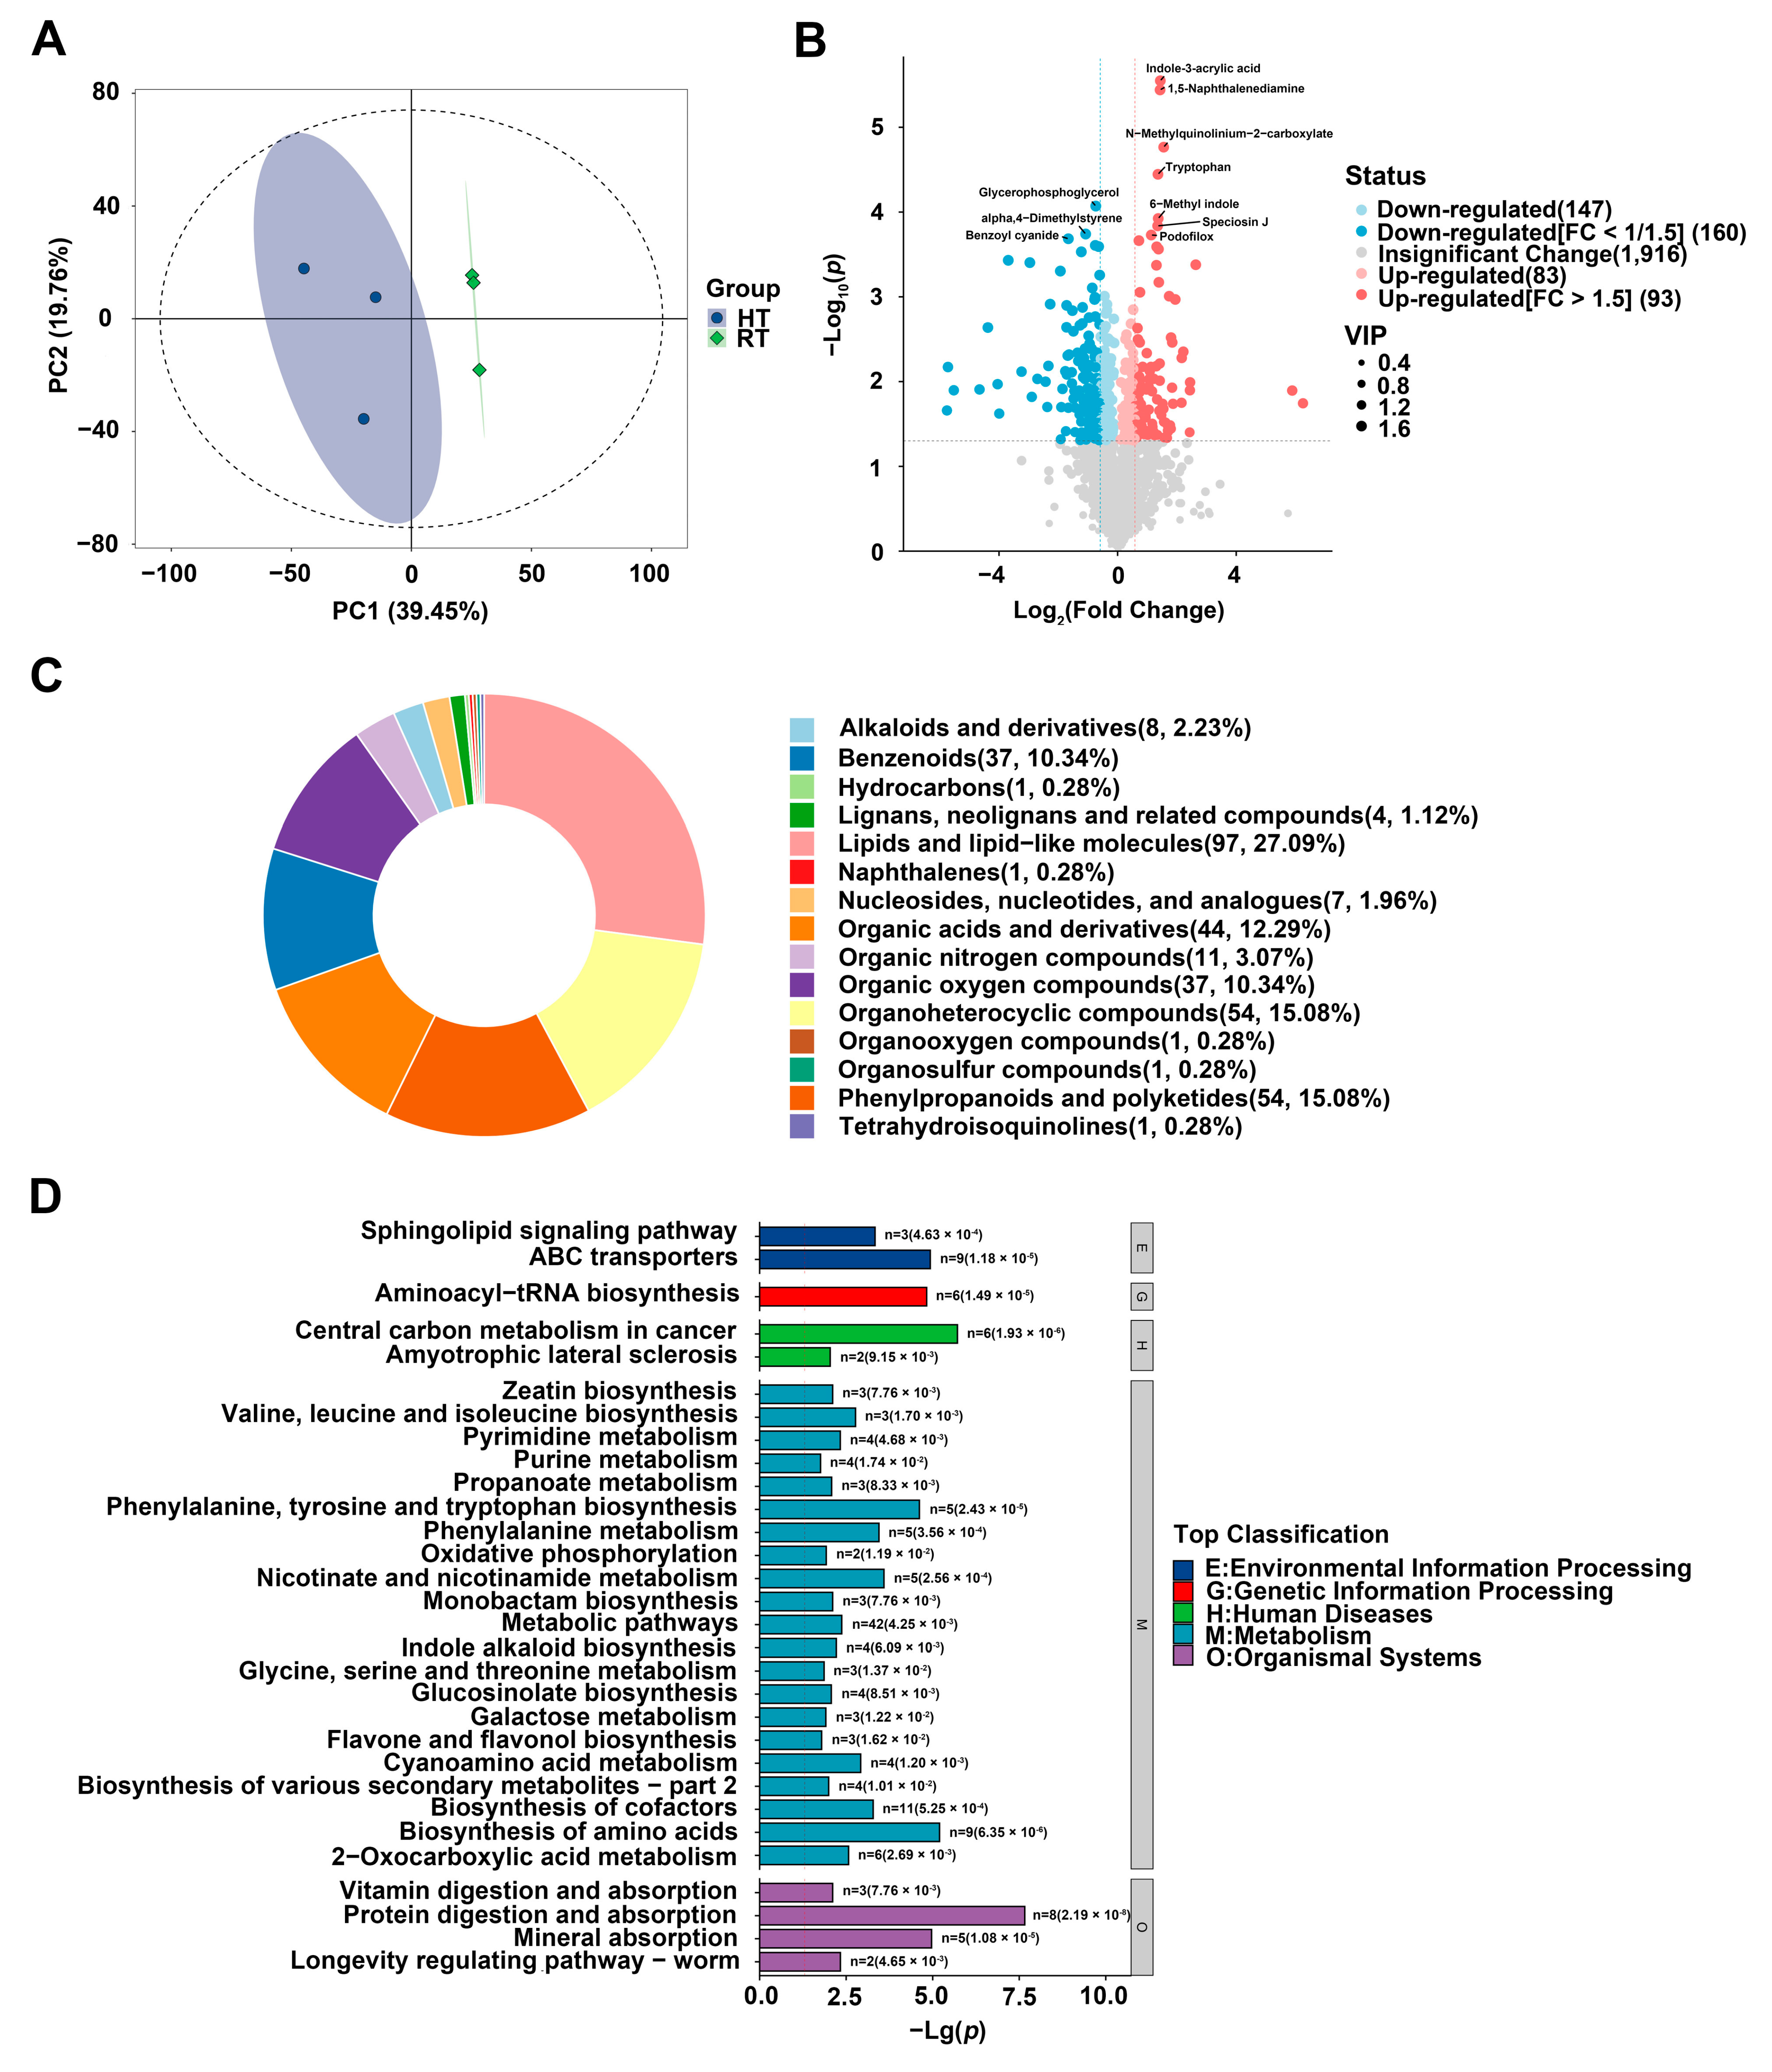
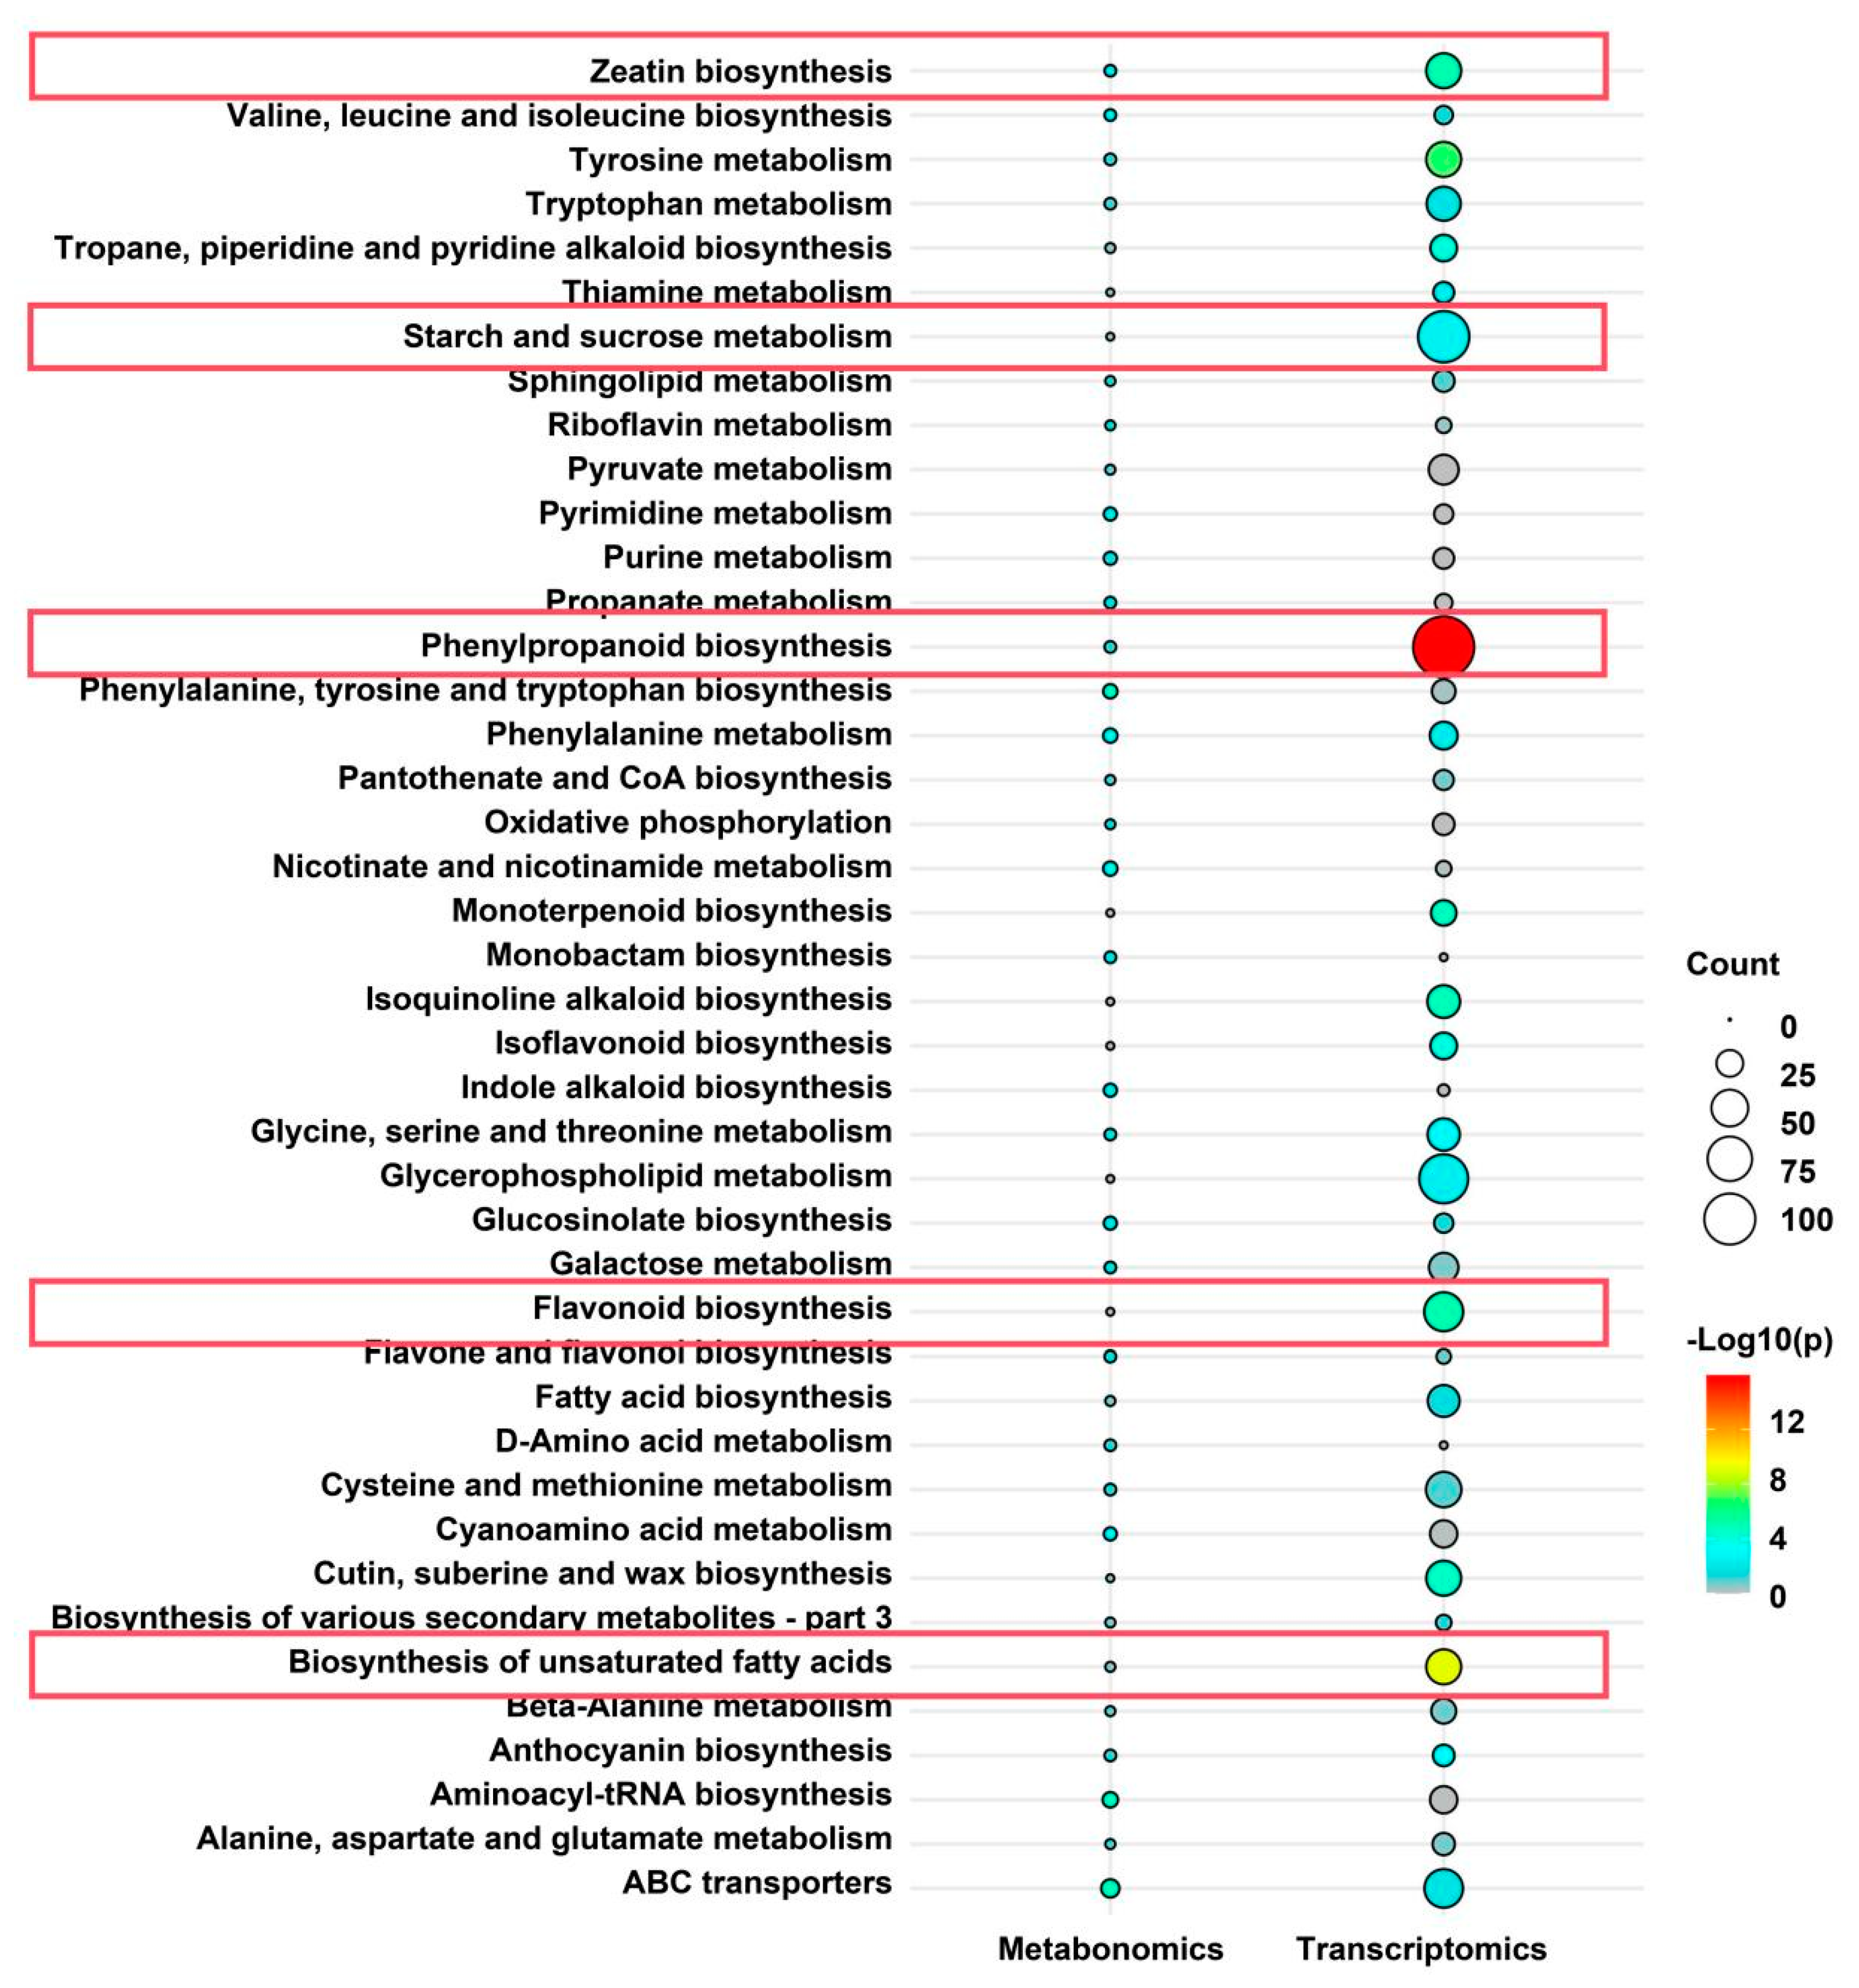
Metabolomic analysis provided additional insights into how heat stress affects anthocyanin metabolism-related compounds. KEGG metabolic pathway analysis revealed a significant enrichment of the phenylalanine metabolism pathway under heat stress, accompanied by a pronounced accumulation of phenylalanine in the heat-treated group (Figure 5D and Supplementary Table S2). As the primary precursor for flavonoid metabolism, phenylalanine accumulation may result from heat-induced inhibition of its normal flux into downstream pathways (e.g., anthocyanin biosynthesis), leading to precursor buildup. Beyond its effects on anthocyanin biosynthesis, heat stress also influences other secondary metabolites in the flavonoid metabolic pathway. Metabolomic analysis revealed a substantial decline in flavonol and flavone content following heat exposure (Supplementary Table S2). However, transcriptomic analysis showed that CmFLS and CmFNS expression levels were only marginally affected by heat stress (Figure 7). These findings suggest that heat stress likely reduces flavone and flavonol accumulation by modulating enzyme activity, altering metabolic flux, or promoting product degradation rather than directly suppressing biosynthetic gene expression. In conclusion, heat stress disrupts anthocyanin metabolism by altering precursor and branch metabolite levels, causing precursor accumulation while reducing the levels of end-products and branch compounds. This metabolic imbalance ultimately leads to decreased anthocyanin accumulation, negatively affecting petal pigmentation.
In plants, anthocyanin biosynthesis is primarily regulated by the MBW complex (MYB-bHLH-WD40), with MYB and bHLH transcription factors serving as key transcriptional regulators. Transcriptomic analysis revealed that the expression of genes encoding MBW complex members in chrysanthemums (CmMYB6, CmbHLH2, and CmTTG1) remained low at the full-bloom stage. Specifically, the gene encoding the key regulatory factor CmMYB6 (evm.TU.scaffold_113.121) had a relatively low expression level under normal temperature conditions (FPKM~2.76), which further declined to approximately 1.92 after high-temperature treatment. Meanwhile, CmbHLH2 (evm.TU.scaffold_11779.113) and CmTTG1 (evm.TU.scaffold_11367.24) exhibited extremely low expression levels under both temperature conditions (Figure 7). These findings indicate that at full bloom, the transcriptional activators responsible for anthocyanin biosynthesis in chrysanthemums are minimally active, and high temperatures further suppress anthocyanin production by downregulating CmMYB6 expression. This observation is consistent with findings in other plant species, where high temperatures commonly repress MYB transcription factors in the MBW complex, leading to reduced anthocyanin accumulation [37].
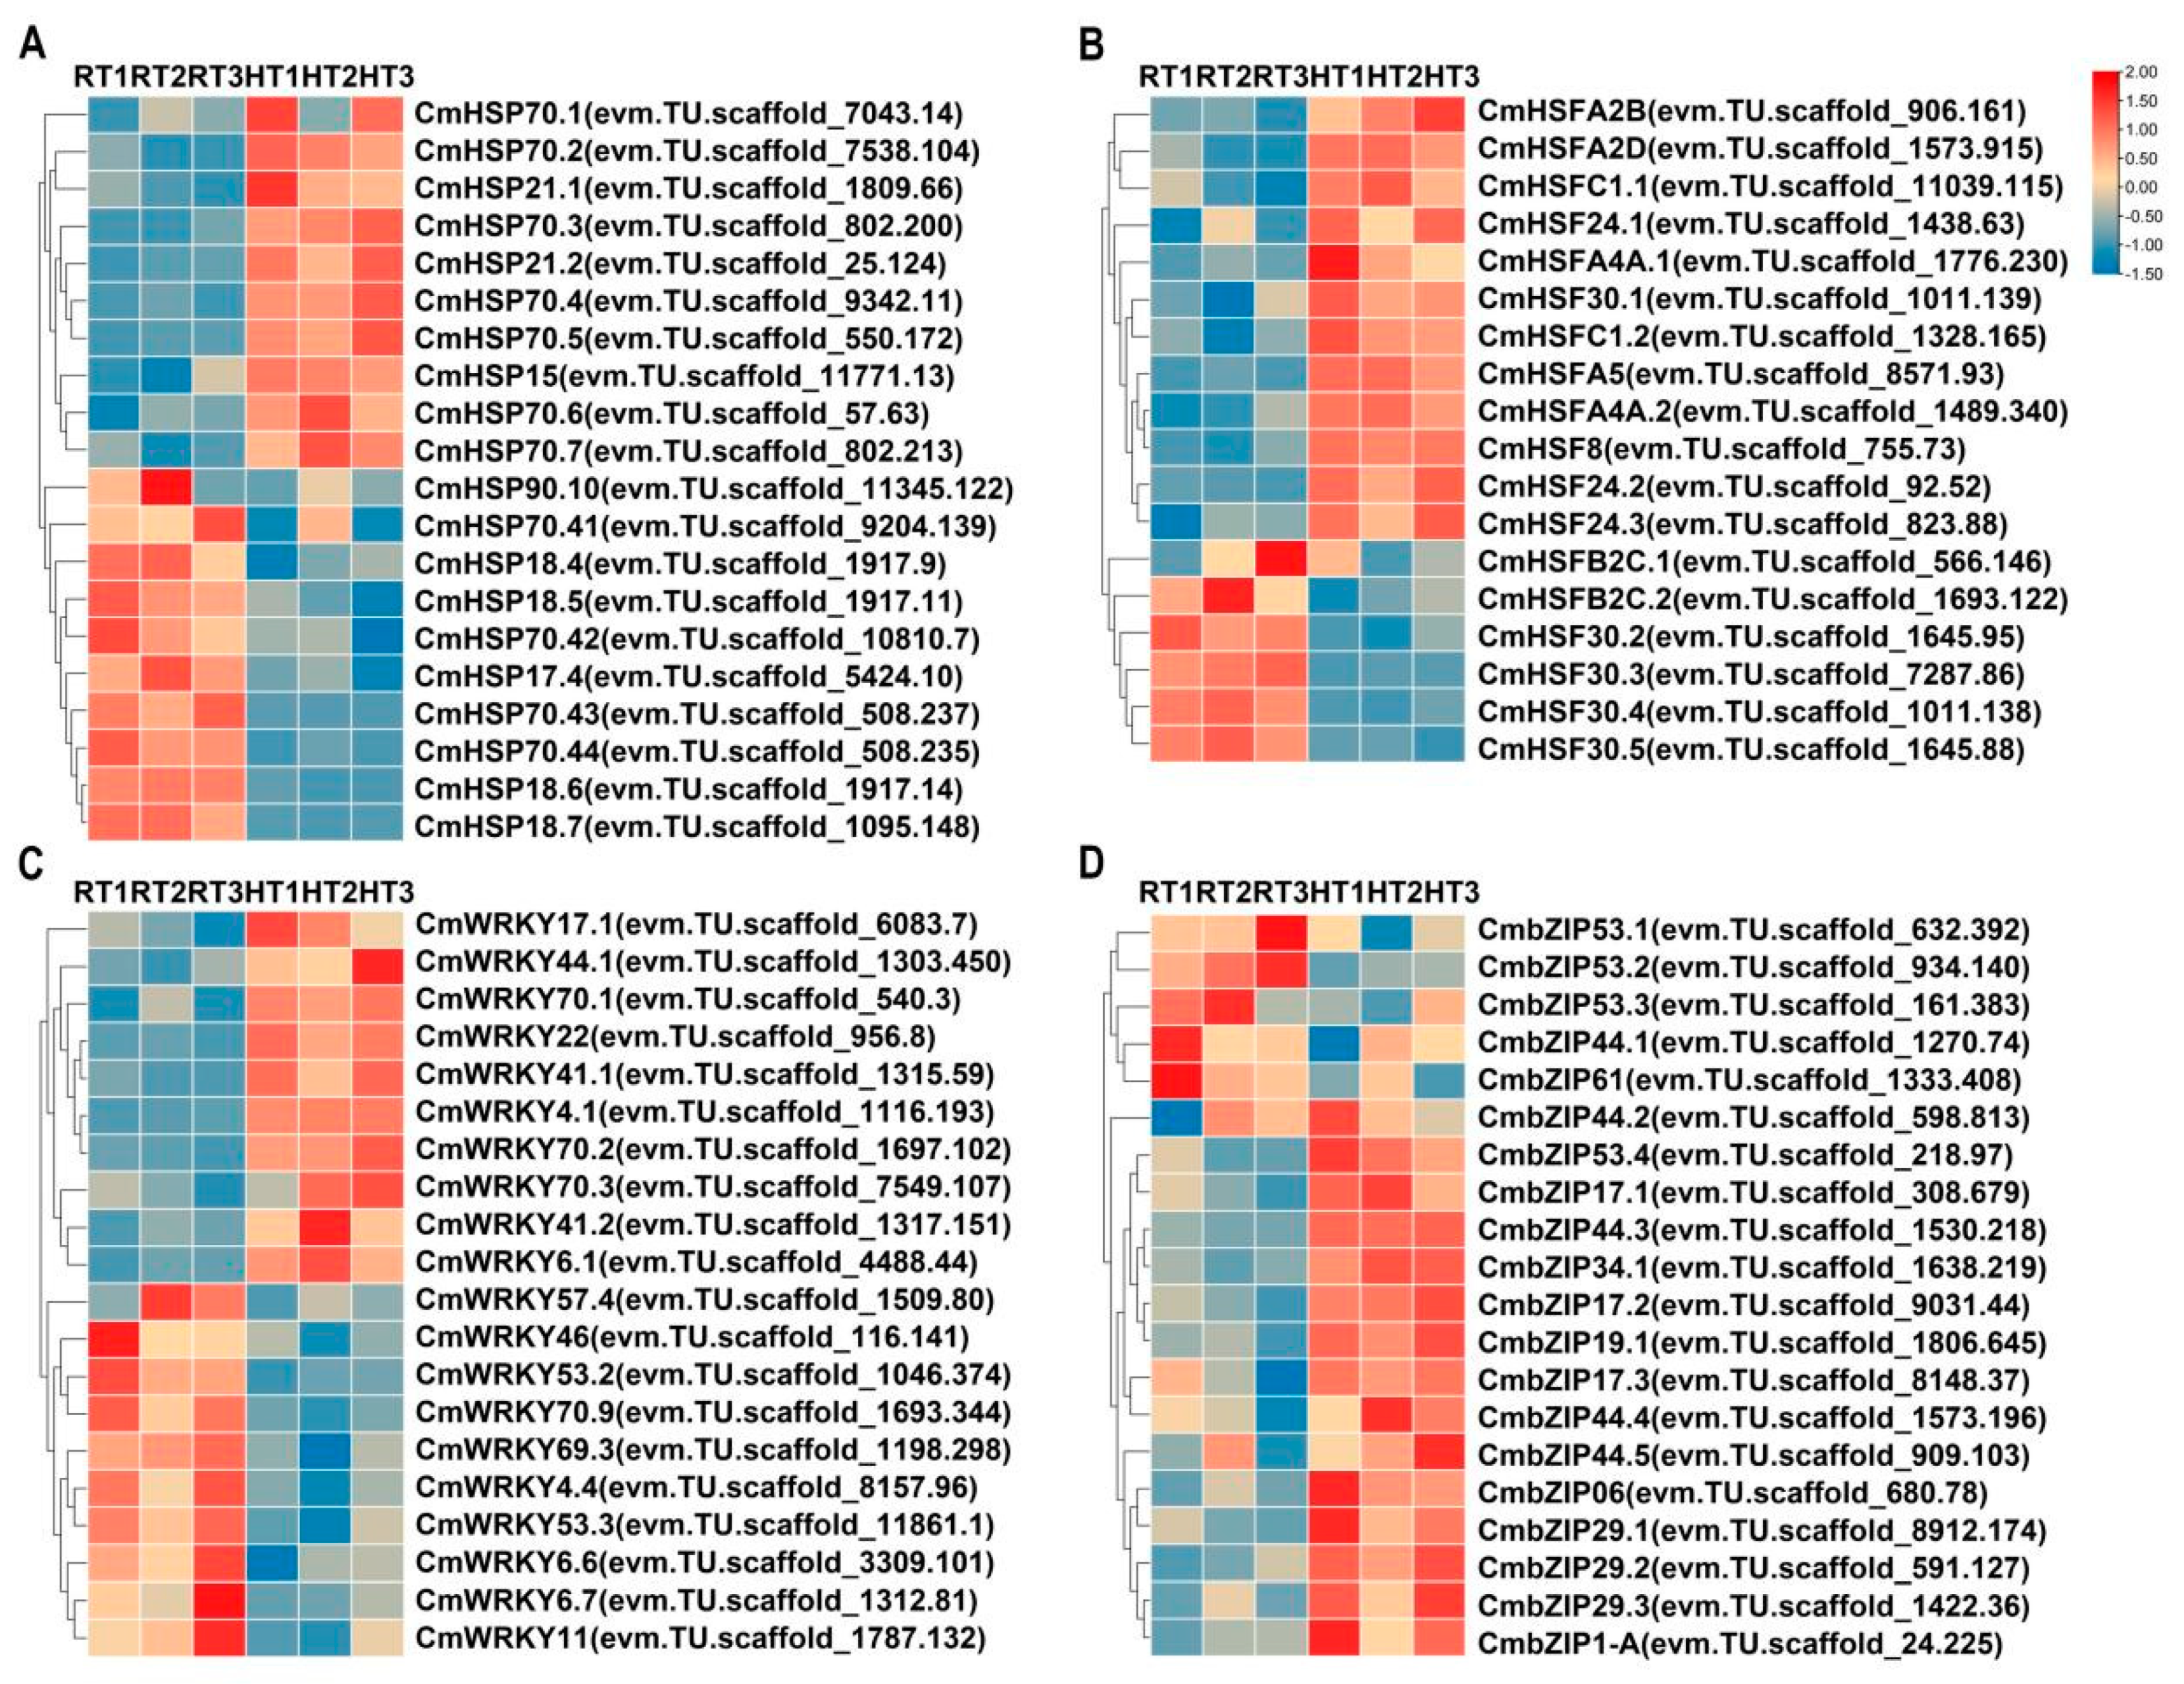
Transcriptomic analysis revealed that, in addition to the MBW complex, heat stress induced substantial changes in other transcription factor families in chrysanthemums. The heat shock transcription factor (HSF) family plays a central role in plant thermotolerance by activating protective genes such as heat shock proteins (HSPs) [38,39,40]. Our study identified 12 CmHSF genes that were significantly upregulated in response to heat stress. Additionally, heat stress reprogrammed the transcriptional profiles of numerous WRKY and bZIP transcription factors. Among them, 42 CmWRKY genes were upregulated, while 21 were downregulated; similarly, 23 CmbZIP genes were upregulated, whereas 5 were downregulated under heat stress. WRKY transcription factors are key regulators of plant adaptation to heat stress. They enhance thermotolerance, partly by binding to W-box elements in target gene promoters and modulating reactive oxygen species (ROS), phytohormone signaling, and MAPK-mediated pathways [41,42,43]. Moreover, bZIP transcription factors respond to heat stress, often being upregulated under the regulation of abscisic acid (ABA) and other plant hormones. This activation leads to the expression of downstream genes that enhance heat resistance [44]. The widespread transcriptional changes in WRKY and bZIP transcription factors suggest that heat stress extensively remodels the transcription factor network in chrysanthemums, altering metabolic and defense-related gene expression. This large-scale transcriptional reprogramming not only regulates heat stress defense mechanisms but may also indirectly impact anthocyanin metabolism.
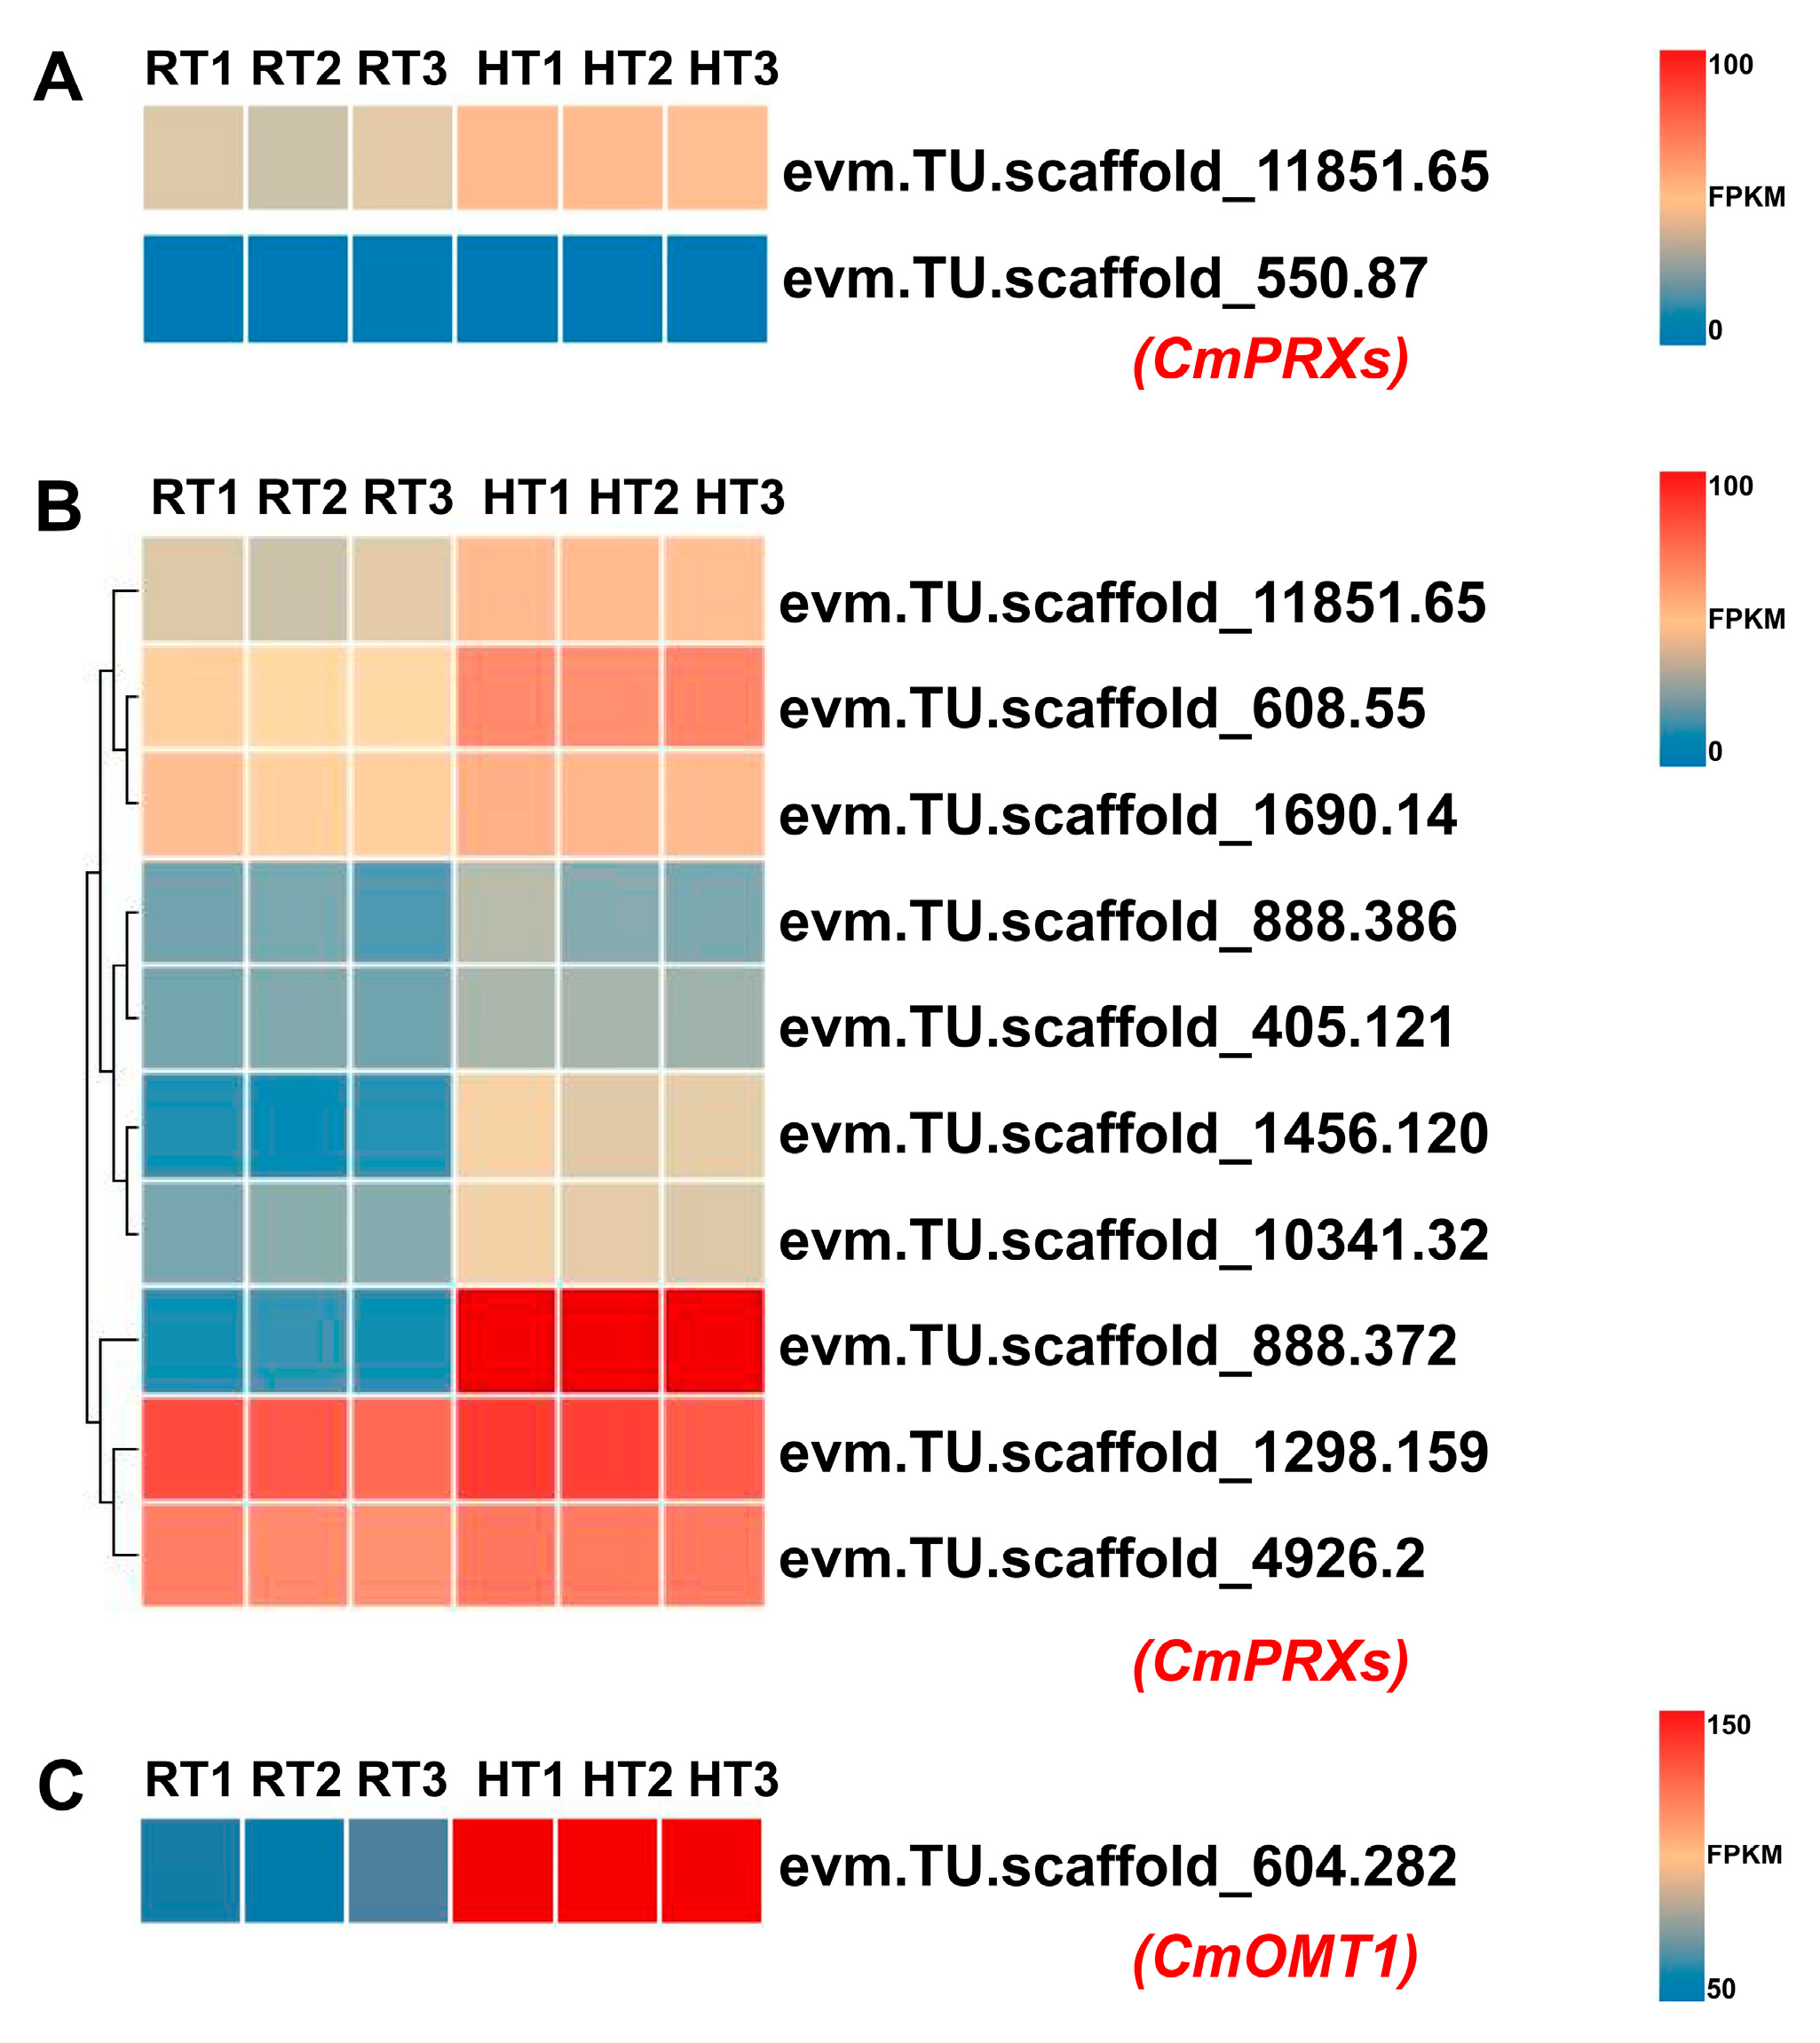
Since anthocyanin biosynthesis is relatively inactive at full bloom, the decline in anthocyanin accumulation and petal fading under heat stress is more likely attributable to anthocyanin degradation. By integrating metabolomic and transcriptomic analyses, our study investigates the potential enzymatic pathways involved in anthocyanin degradation in chrysanthemums under heat stress. Class III peroxidases (PRXs) have been reported to facilitate anthocyanin degradation into protocatechuic acid in plants [12]. However, our metabolomic data revealed no substantial accumulation of protocatechuic acid under heat stress, suggesting that it may undergo further metabolic conversion. According to a pioneering work, protocatechuic acid in plants can undergo O-methylation to form vanillic acid or hydroxylation to produce gallic acid [29]. Notably, our metabolomic analysis revealed a significant accumulation of 5-carboxyvanillic acid, an oxidized derivative of vanillic acid, in response to heat treatment, whereas gallic acid was undetectable under both conditions (Supplementary Table S2). The observed accumulation of 5-carboxyvanillic acid suggests a possible pathway in which anthocyanins are first degraded into protocatechuic acid by PRX, subsequently methylated into vanillic acid by O-methyltransferase (OMT), and then further oxidized into 5-carboxyvanillic acid. Supporting this, several key enzyme genes associated with anthocyanin degradation were markedly upregulated in response to heat stress. Among them, a class III peroxidase gene, CmPRX (evm.TU.scaffold_11851.65), homologous to grape VviPRX31—known to participate in anthocyanin degradation—showed slight induction. Additional heat-responsive CmPRX genes (evm.TU.scaffold_1456.120, evm.TU.scaffold_10341.32, and evm.TU.scaffold_888.372) also exhibited elevated expression, with evm.TU.scaffold_888.372 showing the highest upregulation among all candidates. Furthermore, CmOMT1 (evm.TU.scaffold_604.282), an O-methyltransferase gene likely involved in the downstream methylation of anthocyanin degradation products, was significantly upregulated (Figure 8). Combined with our finding that anthocyanin levels decline under heat stress without transcriptional repression of biosynthetic genes at the full-bloom stage, these results provide direct transcriptional evidence supporting our central hypothesis: heat stress induces petal fading by activating specific enzymatic degradation pathways of anthocyanins.
Looking ahead, several avenues warrant further investigation based on our findings. Functional validation of the key candidate genes identified, particularly the highly heat-responsive CmPRX (e.g., evm.TU.scaffold_888.372) and CmOMT1 (evm.TU.scaffold_604.282), using techniques like CRISPR/Cas9 or VIGS in chrysanthemum is crucial to confirm their direct roles in heat-induced anthocyanin degradation. Elucidating the upstream signaling pathways and transcriptional regulators that mediate the heat induction of these degradation genes represents another important research direction. Furthermore, assessing the conservation of this PRX-OMT1 mediated degradation mechanism across diverse chrysanthemum cultivars and other ornamental species would be valuable. Ultimately, translating this knowledge into practical applications, such as developing molecular markers for breeding programs or designing strategies to mitigate anthocyanin degradation, could significantly benefit the horticulture industry by improving flower color stability under challenging high-temperature conditions.

5. Conclusions

In summary, this study integrated transcriptomic and metabolomic analyses to investigate how heat stress (35 °C) influences anthocyanin metabolism and its underlying molecular mechanisms in the petals of Chrysanthemum morifolium during full bloom (Figure 9). Our results showed that at this developmental stage, anthocyanin biosynthesis was relatively inactive. Instead, the observed reduction in anthocyanin content and petal fading under heat stress were primarily due to enhanced degradation rather than suppressed synthesis. Further analysis revealed that several class III peroxidase genes (CmPRXs) and an O-methyltransferase gene (CmOMT1) were significantly upregulated under heat stress. This upregulation was accompanied by the accumulation of 5-carboxyvanillic acid, a putative anthocyanin degradation product. These findings suggest the activation of a degradation pathway potentially co-mediated by PRX and OMT1 enzymes in response to high-temperature conditions. By focusing on the full-bloom stage—when anthocyanin content peaks while biosynthetic activity declines—this study provides a detailed view of chrysanthemum’s physiological and molecular responses to heat stress. The results clearly indicate that accelerated enzymatic degradation is the primary cause of petal fading under high temperature, offering a new perspective distinct from the conventional focus on biosynthetic inhibition.
Based on integrated multi-omics evidence, we propose a degradation pathway hypothesis involving PRX and OMT1, supported by both transcriptional and metabolic data. These findings not only advance our understanding of flower color stability under heat stress in ornamental plants but also underscore the importance of anthocyanin degradation in plant responses to environmental challenges. Moreover, the identification of key candidate genes (CmPRXs and CmOMT1) provides valuable genetic resources for improving heat tolerance and flower color retention through molecular breeding, with both theoretical and practical implications.

Supplementary Materials

The following supporting information can be downloaded at: https://www.mdpi.com/article/10.3390/agriculture15090950/s1, Figure S1: Expression trend analysis of differentially expressed genes (DEGs) in ‘Nannong Fencui’ chrysanthemum under heat stress; Figure S2: GO enrichment analysis of upregulated DEGs in ‘Nannong Fencui’ chrysanthemum under heat stress (HT vs. RT); Figure S3: qRT-PCR validation of RNA-Seq results for selected anthocyanin metabolism genes; Table S1: Primers used for qRT-PCR; Table S2: Differentially accumulated metabolites (DAMs) and identified metabolites (IMs) detected through untargeted metabolomic analysis.

Author Contributions

G.Z.: writing—original draft, methodology, formal analysis, data curation. Y.L. (Yanan Li): methodology, formal analysis, data curation. J.P.: methodology, investigation, formal analysis. X.L.: investigation, formal analysis. W.X.: investigation, formal analysis. Y.T.: investigation, formal analysis. Y.L. (Yukun Li): investigation, formal analysis. L.Z.: writing—review and editing, conceptualization, supervision, funding acquisition. All authors have read and agreed to the published version of the manuscript.

Funding

This work was financially supported by grants from the Hainan Provincial Natural Science Foundation of China (322QN340) and the National Natural Science Foundation of China (32372745).

Institutional Review Board Statement

Not applicable.

Data Availability Statement

The authors confirm that all experimental data are available and accessible via the main text and/or the Supplemental Data.

Acknowledgments

During the preparation of this work, the authors used DeepSeek in order to improve readability. After using this tool/service, the authors reviewed and edited the content as needed. The authors take full responsibility for the content of the publication.

Conflicts of Interest

The authors declare that they have no conflicts of interest.

References

  1. Mekapogu, M.; Vasamsetti, B.M.K.; Kwon, O.-K.; Ahn, M.-S.; Lim, S.-H.; Jung, J.-A. Anthocyanins in floral colors: Biosynthesis and regulation in chrysanthemum flowers. Int. J. Mol. Sci. 2020, 21, 6537. [Google Scholar] [CrossRef]
  2. Yan, W.; Li, J.; Lin, X.; Wang, L.; Yang, X.; Xia, X.; Zhang, Y.; Yang, S.; Li, H.; Deng, X. Changes in plant anthocyanin levels in response to abiotic stresses: A meta-analysis. Plant Biotechnol. Rep. 2022, 16, 497–508. [Google Scholar] [CrossRef]
  3. Li, Z.; Ahammed, G.J. Plant stress response and adaptation via anthocyanins: A review. Plant Stress 2023, 10, 100230. [Google Scholar] [CrossRef]
  4. Buitrago, S.; Yang, X.; Wang, L.; Pan, R.; Zhang, W. Evolutionary analysis of anthocyanin biosynthetic genes: Insights into abiotic stress adaptation. Plant Mol. Biol. 2025, 115, 6. [Google Scholar] [CrossRef] [PubMed]
  5. Sunil, L.; Shetty, N.P. Biosynthesis and regulation of anthocyanin pathway genes. Appl. Microbiol. Biotechnol. 2022, 106, 1783–1798. [Google Scholar] [CrossRef]
  6. Yücetepe, M.; Özaslan, Z.T.; Karakuş, M.Ş.; Akalan, M.; Karaaslan, A.; Karaaslan, M.; Başyiğit, B. Unveiling the multifaceted world of anthocyanins: Biosynthesis pathway, natural sources, extraction methods, copigmentation, encapsulation techniques, and future food applications. Food Res. Int. 2024, 187, 114437. [Google Scholar] [CrossRef] [PubMed]
  7. Oren-Shamir, M. Does anthocyanin degradation play a significant role in determining pigment concentration in plants? Plant Sci. 2009, 177, 310–316. [Google Scholar] [CrossRef]
  8. Zipor, G.; Duarte, P.; Carqueijeiro, I.; Shahar, L.; Ovadia, R.; Teper-Bamnolker, P.; Eshel, D.; Levin, Y.; Doron-Faigenboim, A.; Sottomayor, M. In planta anthocyanin degradation by a vacuolar class III peroxidase in Brunfelsia calycina flowers. New Phytol. 2015, 205, 653–665. [Google Scholar] [CrossRef]
  9. Movahed, N.; Pastore, C.; Cellini, A.; Allegro, G.; Valentini, G.; Zenoni, S.; Cavallini, E.; D’Incà, E.; Tornielli, G.B.; Filippetti, I. The grapevine VviPrx31 peroxidase as a candidate gene involved in anthocyanin degradation in ripening berries under high temperature. J. Plant Res. 2016, 129, 513–526. [Google Scholar] [CrossRef]
  10. Vitaglione, P.; Donnarumma, G.; Napolitano, A.; Galvano, F.; Gallo, A.; Scalfi, L.; Fogliano, V. Protocatechuic acid is the major human metabolite of cyanidin-glucosides3. J. Nutr. 2007, 137, 2043–2048. [Google Scholar] [CrossRef]
  11. Song, J.; He, Y.; Luo, C.; Feng, B.; Ran, F.; Xu, H.; Ci, Z.; Xu, R.; Han, L.; Zhang, D. New progress in the pharmacology of protocatechuic acid: A compound ingested in daily foods and herbs frequently and heavily. Pharmacol. Res. 2020, 161, 105109. [Google Scholar] [CrossRef] [PubMed]
  12. Niu, J.; Zhang, G.; Zhang, W.; Goltsev, V.; Sun, S.; Wang, J.; Li, P.; Ma, F. Anthocyanin concentration depends on the counterbalance between its synthesis and degradation in plum fruit at high temperature. Sci. Rep. 2017, 7, 7684. [Google Scholar] [CrossRef]
  13. Zhao, D.; Tao, J. Recent advances on the development and regulation of flower color in ornamental plants. Front. Plant Sci. 2015, 6, 261. [Google Scholar] [CrossRef] [PubMed]
  14. Fernandes, M.E.S.; Tomiozzo, R.; Freitas, C.P.d.O.d.; Roso, T.P.; de Sousa, M.H.L.; Uhlmann, L.O.; Zanon, A.J.; Streck, N.A. Damage and lethal temperature due to heat stress in field grown dahlia. Ornam. Hortic. 2023, 29, 216–223. [Google Scholar] [CrossRef]
  15. Mircea, D.-M.; Boscaiu, M.; Sestras, R.E.; Sestras, A.F.; Vicente, O. Abiotic Stress Tolerance and Invasive Potential of Ornamental Plants in the Mediterranean Area: Implications for Sustainable Landscaping. Agronomy 2024, 15, 52. [Google Scholar] [CrossRef]
  16. Zhao, X.; Li, P.; Zuo, H.; Peng, A.; Lin, J.; Li, P.; Wang, K.; Tang, Q.; Tadege, M.; Liu, Z. CsMYBL2 homologs modulate the light and temperature stress-regulated anthocyanin and catechins biosynthesis in tea plants (Camellia sinensis). Plant J. 2023, 115, 1051–1070. [Google Scholar] [CrossRef]
  17. Zhou, L.-J.; Geng, Z.; Wang, Y.; Wang, Y.; Liu, S.; Chen, C.; Song, A.; Jiang, J.; Chen, S.; Chen, F. A novel transcription factor CmMYB012 inhibits flavone and anthocyanin biosynthesis in response to high temperatures in chrysanthemum. Hortic. Res. 2021, 8, 248. [Google Scholar] [CrossRef]
  18. Shi, Z.; Han, X.; Wang, G.; Qiu, J.; Zhou, L.-j.; Chen, S.; Fang, W.; Chen, F.; Jiang, J. Transcriptome analysis reveals chrysanthemum flower discoloration under high-temperature stress. Front. Plant Sci. 2022, 13, 1003635. [Google Scholar] [CrossRef]
  19. Zhou, L.; Liu, S.; Wang, Y.; Wang, Y.; Song, A.; Jiang, J.; Chen, S.; Guan, Z.; Chen, F. CmMYB3-like negatively regulates anthocyanin biosynthesis and flower color formation during the post-flowering stage in Chrysanthemum morifolium. Hortic. Plant J. 2024, 10, 194–204. [Google Scholar] [CrossRef]
  20. Song, A.; Su, J.; Wang, H.; Zhang, Z.; Zhang, X.; van de Peer, Y.; Chen, F.; Fang, W.; Guan, Z.; Zhang, F. Analyses of a chromosome-scale genome assembly reveal the origin and evolution of cultivated chrysanthemum. Nat. Commun. 2023, 14, 2021. [Google Scholar] [CrossRef]
  21. Hodaei, M.; Rahimmalek, M.; Arzani, A.; Talebi, M. The effect of water stress on phytochemical accumulation, bioactive compounds and expression of key genes involved in flavonoid biosynthesis in Chrysanthemum morifolium L. Ind. Crops Prod. 2018, 120, 295–304. [Google Scholar] [CrossRef]
  22. Mondal, S.; Karmakar, S.; Panda, D.; Pramanik, K.; Bose, B.; Singhal, R.K. Crucial plant processes under heat stress and tolerance through heat shock proteins. Plant Stress 2023, 10, 100227. [Google Scholar] [CrossRef]
  23. Haider, S.; Raza, A.; Iqbal, J.; Shaukat, M.; Mahmood, T. Analyzing the regulatory role of heat shock transcription factors in plant heat stress tolerance: A brief appraisal. Mol. Biol. Rep. 2022, 49, 5771–5785. [Google Scholar] [CrossRef]
  24. Li, Z.; Cheng, B.; Zhao, Y.; Luo, L.; Zhang, Y.; Feng, G.; Han, L.; Peng, Y.; Zhang, X. Metabolic regulation and lipidomic remodeling in relation to spermidine-induced stress tolerance to high temperature in plants. Int. J. Mol. Sci. 2022, 23, 12247. [Google Scholar] [CrossRef] [PubMed]
  25. Cheng, B.; Zhou, M.; Tang, T.; Hassan, M.J.; Zhou, J.; Tan, M.; Li, Z.; Peng, Y. A Trifolium repens flavodoxin-like quinone reductase 1 (TrFQR1) improves plant adaptability to high temperature associated with oxidative homeostasis and lipids remodeling. Plant J. 2023, 115, 369–385. [Google Scholar] [CrossRef]
  26. Spivey, W.W.; Rustgi, S.; Welti, R.; Roth, M.R.; Burow, M.D.; Bridges, W.C., Jr.; Narayanan, S. Lipid modulation contributes to heat stress adaptation in peanut. Front. Plant Sci. 2023, 14, 1299371. [Google Scholar] [CrossRef] [PubMed]
  27. Sadilova, E.; Carle, R.; Stintzing, F.C. Thermal degradation of anthocyanins and its impact on color and in vitro antioxidant capacity. Mol. Nutr. Food Res. 2007, 51, 1461–1471. [Google Scholar] [CrossRef]
  28. Wang, Y.; Wang, Y.; Zhou, L.-J.; Peng, J.; Chen, C.; Liu, S.; Song, A.; Jiang, J.; Chen, S.; Chen, F. CmNAC25 targets CmMYB6 to positively regulate anthocyanin biosynthesis during the post-flowering stage in chrysanthemum. BMC Biol. 2023, 21, 211. [Google Scholar] [CrossRef]
  29. El-Basyouni, S.Z.; Chen, D.; Ibrahim, R.; Neish, A.; Towers, G. The biosynthesis of hydroxybenzoic acids in higher plants. Phytochemistry 1964, 3, 485–492. [Google Scholar] [CrossRef]
  30. Li, Z.; Zhou, H.; Chen, Y.; Chen, M.; Yao, Y.; Luo, H.; Wu, Q.; Wang, F.; Zhou, Y. Analysis of Transcriptional and Metabolic Differences in the Petal Color Change Response to High-Temperature Stress in Various Chrysanthemum Genotypes. Agronomy 2024, 14, 2863. [Google Scholar] [CrossRef]
  31. Wang, F.; Li, Z.; Wu, Q.; Guo, Y.; Wang, J.; Luo, H.; Zhou, Y. Floral response to heat: A study of color and biochemical adaptations in purple chrysanthemums. Plants 2024, 13, 1865. [Google Scholar] [CrossRef] [PubMed]
  32. Gao, H.-N.; Jiang, H.; Cui, J.-Y.; You, C.-X.; Li, Y.-Y. The effects of hormones and environmental factors on anthocyanin biosynthesis in apple. Plant Sci. 2021, 312, 111024. [Google Scholar] [CrossRef]
  33. Tan, Y.; Wen, B.; Xu, L.; Zong, X.; Sun, Y.; Wei, G.; Wei, H. High temperature inhibited the accumulation of anthocyanin by promoting ABA catabolism in sweet cherry fruits. Front. Plant Sci. 2023, 14, 1079292. [Google Scholar] [CrossRef] [PubMed]
  34. Kim, S.; Hwang, G.; Lee, S.; Zhu, J.-Y.; Paik, I.; Nguyen, T.T.; Kim, J.; Oh, E. High ambient temperature represses anthocyanin biosynthesis through degradation of HY5. Front. Plant Sci. 2017, 8, 1787. [Google Scholar] [CrossRef]
  35. Liu, Y.; Lin-Wang, K.; Espley, R.V.; Wang, L.; Li, Y.; Liu, Z.; Zhou, P.; Zeng, L.; Zhang, X.; Zhang, J. StMYB44 negatively regulates anthocyanin biosynthesis at high temperatures in tuber flesh of potato. J. Exp. Bot. 2019, 70, 3809–3824. [Google Scholar] [CrossRef]
  36. Sun, Y.; Zheng, Y.; Wang, W.; Yao, H.; Ali, Z.; Xiao, M.; Ma, Z.; Li, J.; Zhou, W.; Cui, J. VvFHY3 links auxin and endoplasmic reticulum stress to regulate grape anthocyanin biosynthesis at high temperatures. Plant Cell 2025, 37, koae303. [Google Scholar] [CrossRef]
  37. Lin-Wang, K.; Micheletti, D.; Palmer, J.; Volz, R.; Lozano, L.; Espley, R.; Hellens, R.P.; Chagne, D.; Rowan, D.D.; Troggio, M. High temperature reduces apple fruit colour via modulation of the anthocyanin regulatory complex. Plant Cell Environ. 2011, 34, 1176–1190. [Google Scholar] [CrossRef] [PubMed]
  38. Guo, M.; Liu, J.-H.; Ma, X.; Luo, D.-X.; Gong, Z.-H.; Lu, M.-H. The plant heat stress transcription factors (HSFs): Structure, regulation, and function in response to abiotic stresses. Front. Plant Sci. 2016, 7, 114. [Google Scholar] [CrossRef]
  39. Tian, F.; Hu, X.-L.; Yao, T.; Yang, X.; Chen, J.-G.; Lu, M.-Z.; Zhang, J. Recent advances in the roles of HSFs and HSPs in heat stress response in woody plants. Front. Plant Sci. 2021, 12, 704905. [Google Scholar] [CrossRef]
  40. Yurina, N. Heat shock proteins in plant protection from oxidative stress. Mol. Biol. 2023, 57, 951–964. [Google Scholar] [CrossRef]
  41. Cheng, Z.; Luan, Y.; Meng, J.; Sun, J.; Tao, J.; Zhao, D. WRKY transcription factor response to high-temperature stress. Plants 2021, 10, 2211. [Google Scholar] [CrossRef] [PubMed]
  42. Khoso, M.A.; Hussain, A.; Ritonga, F.N.; Ali, Q.; Channa, M.M.; Alshegaihi, R.M.; Meng, Q.; Ali, M.; Zaman, W.; Brohi, R.D. WRKY transcription factors (TFs): Molecular switches to regulate drought, temperature, and salinity stresses in plants. Front. Plant Sci. 2022, 13, 1039329. [Google Scholar] [CrossRef] [PubMed]
  43. Yan, X.; Zhao, J.; Huang, W.; Liu, C.; Hao, X.; Gao, C.; Deng, M.; Wen, J. Genome-wide identification of WRKY transcription factor family in chinese rose and response to drought, heat, and salt stress. Genes 2024, 15, 800. [Google Scholar] [CrossRef]
  44. Liu, H.; Tang, X.; Zhang, N.; Li, S.; Si, H. Role of bZIP transcription factors in plant salt stress. Int. J. Mol. Sci. 2023, 24, 7893. [Google Scholar] [CrossRef] [PubMed]
Figure 1. Heat-induced color fading in the ‘Nannong Fencui’ chrysanthemum at full bloom. A. Flower color phenotype of ‘Nannong Fencui’ chrysanthemums at full bloom after 35 °C heat treatment. RT represents the normal temperature control, while HT indicates the 35 °C heat treatment. The scale bar represents 1 cm. B. Measurement of anthocyanin (cyanidin-3-glucoside) content in the petals shown in panel A using ultra-performance liquid chromatography (UPLC). Error bars indicate the standard deviation (SD) of three independent biological replicates. The asterisk denotes a statistically significant difference (p < 0.05) between treatments, as determined by Student’s t-test.
Agriculture 15 00950 g001
Figure 2. Analysis of differentially expressed genes (DEGs) between HT and RT groups. (A) Statistics of differentially expressed genes (DEGs). (B) Volcano plot of DEGs, where blue represents downregulated genes (DOWN; log2FoldChange < −1 and p-value < 0.05), gray indicates non-significant genes (NoDiff), and red marks upregulated genes (UP; log2FoldChange > 1 and p-value < 0.05). RT refers to the normal temperature control, whereas HT denotes the 35 °C heat treatment. (C) MA plot of DEGs. M represents the log2 fold change in gene expression between the HT and RT, while A represents the log2 mean expression level across both conditions. Upregulated genes in the HT group are marked in red, downregulated genes in blue, and non-significant genes in gray. (D) Heatmap of DEGs, illustrating gene expression patterns in HT and RT groups. FPKM values were Z-score normalized, with a color gradient representing relative gene expression: red denotes high expression, while green indicates low expression. Hierarchical clustering analysis was performed on both genes (rows, vertical axis) and samples (columns, horizontal axis) using Euclidean distance and the complete linkage method to construct dendrograms. The left-side dendrogram represents gene expression pattern similarities, identifying functional clusters associated with heat stress, while the top dendrogram illustrates sample clustering, confirming distinct gene expression profiles between the HT and RT groups.
Agriculture 15 00950 g002
Figure 3. Gene Ontology (GO) functional classification and KEGG pathway enrichment analysis of differentially expressed genes (DEGs). The X-axis in both panels represents enrichment significance based on the p-value (−log10 transformed), where higher values indicate greater statistical significance. (A) Top significantly enriched GO terms categorized by function. MF (molecular function; purple), CC (cellular component; blue), and BP (biological process; pink) are shown. GO enrichment analysis was performed using the R package ‘topGO’, and significance was determined using the hypergeometric distribution method (p < 0.05). (B) Top 20 significantly enriched KEGG pathways for DEGs. Pathways are color-coded according to the main functional categories indicated by the legend on the right. KEGG pathway enrichment significance (p-value) was calculated using the hypergeometric test. Pathways with FDR < 0.05 were considered significantly enriched.
Agriculture 15 00950 g003
Figure 4. Analysis of heat stress-responsive genes based on transcriptome sequencing. The horizontal axis of the heatmap represents different samples, including the normal temperature control group (RT1, RT2, and RT3) and the heat treatment group (HT1, HT2, and HT3), while the vertical axis represents different genes. FPKM values were standardized using Z-score transformation, with a color gradient indicating relative expression levels: red represents high expression, while blue denotes low expression. Genes displayed in each panel were selected from the differentially expressed genes (DEGs; defined by p-value < 0.05 and |log2FoldChange| > 1) identified within each respective gene family. (A) Heatmap showing the expression of heat shock protein (HSP) genes. Displayed are the top 10 upregulated and top 10 downregulated HSP DEGs, ranked by fold change. (B) Heatmap illustrating the expression of heat shock transcription factor (HSF) genes. All 18 HSF genes identified as DEGs (12 upregulated and 6 downregulated) in this study are shown. (C) Heatmap displaying WRKY transcription factor gene expression patterns. Displayed are the top 10 upregulated and top 10 downregulated WRKY DEGs, ranked by fold change. (D) Heatmap representing the expression of bZIP transcription factor genes. All 5 downregulated bZIP DEGs identified in this study, along with the top 15 upregulated bZIP DEGs, ranked by fold change are shown (total 20 genes).
Agriculture 15 00950 g004
Figure 5. Untargeted metabolomic analysis of differentially accumulated metabolites in petals under heat stress. (A) Principal component analysis (PCA) model plot. This plot illustrates the overall distribution of samples based on mass spectrometry data. The position of sample points on the two-dimensional plane is determined by Principal Component 1 (PC1) and Principal Component 2 (PC2), where PC1 accounts for 39.45% of the total variance (ranging from approximately −100 to 100), and PC2 explains 19.76% of the variance (ranging from approximately −80 to 80). Blue dots represent the HT group, while green dots indicate the RT group. (B) Volcano plot of differential metabolites. This plot visualizes the differential accumulation of metabolites between the HT and RT groups. The x-axis represents log2(fold change), indicating the fold change in metabolite accumulation, while the y-axis represents −log10(p-value), reflecting the statistical significance of differences. Red dots indicate metabolites with increased accumulation in the HT group, while blue dots represent those with decreased accumulation. The dot size corresponds to the Variable Importance in Projection (VIP) score, highlighting metabolites that contribute most to group separation. Significantly differential metabolites were defined by a VIP > 1 and p-value < 0.05. Among these, upregulated metabolites (red dots) further met the criterion of fold change (HT/RT) > 1.5, while downregulated metabolites (blue dots) met the criterion of fold change (HT/RT) < 0.67 (approximately 1/1.5). (C) Pie chart of differential metabolite categories and their proportions. Each sector represents a metabolite category, with its area proportional to the number and percentage of compounds within that category. (D) KEGG enrichment pathway analysis of differential metabolites. This plot presents the KEGG pathway enrichment analysis results for differentially accumulated metabolites. The y-axis lists the metabolic pathways, with specific p-values labeled on the bars. The right panel categorizes these metabolic pathways based on their functional classifications. KEGG pathway enrichment significance (p-value) was calculated using the hypergeometric test. Pathways with FDR < 0.05 were considered significantly enriched.
Agriculture 15 00950 g005
Figure 6. Integrated transcriptomic and metabolomic analysis. The figure illustrates 42 metabolic pathways found to be significantly enriched in both transcriptomic and metabolomic analyses. The x-axis represents metabolomics and transcriptomics, while the y-axis lists the shared metabolic pathways. Bubble color represents enrichment significance (−log10(p-value)), where higher values and redder colors indicate greater statistical significance (scale provided). Bubble size corresponds to the count value, representing the number of detected genes (transcriptomics) or metabolites (metabolomics) within the pathway (scale provided). Pathway enrichment analyses for both datasets were performed using the hypergeometric test. Pathways with a False Discovery Rate (FDR) < 0.1 were considered significantly enriched. Only pathways meeting this significance threshold (FDR < 0.1) in both omics datasets are displayed. The pathways of focus in this study are outlined in red boxes.
Agriculture 15 00950 g006
Figure 7. Expression profile of genes related to the anthocyanin biosynthesis pathway. This figure presents a schematic representation of the anthocyanin biosynthetic pathway, alongside heatmaps illustrating the differential expression of key structural genes and transcription factors. The heatmap is generated using FPKM values ranging from 0 to 20, where lower FPKM values are represented in blue, while higher values are shown in red. Each heatmap displays expression levels across the six samples (RT1–3 and HT1–3) in columns.
Agriculture 15 00950 g007
Figure 8. Heatmap showing the differential expression of candidate CmPRX and CmOMT1 genes potentially involved in anthocyanin degradation. The heatmaps display FPKM values, with lower expression levels represented in blue and higher levels in red. Note the different FPKM scales used for color mapping in panels (A,B) (0–100) versus panel (C) (50–150), indicated by the adjacent color bars. (A) Heatmap displaying the expression of chrysanthemum homologs of VviPRX31 (evm.TU.scaffold_11851.65) and BcPRX01 (evm.TU.scaffold_550.87). (B) Heatmap of 10 CmPRX genes identified as significantly upregulated under heat stress in this study. Hierarchical clustering was applied to rows (genes), generating a dendrogram to visualize similarities in expression patterns. (C) Heatmap of CmOMT1 (evm.TU.scaffold_604.282), the chrysanthemum homolog of AtOMT1, showing significant upregulation under heat stress.
Agriculture 15 00950 g008
Figure 9. Proposed schematic model illustrating the mechanism of heat-induced anthocyanin degradation leading to petal fading in Chrysanthemum morifolium at the full-bloom stage. At the full-bloom stage, the anthocyanin biosynthesis pathway exhibits low basal transcriptional activity (indicated as “Inactive”), as supported by low FPKM values of key biosynthetic genes (see Figure 7). Upon exposure to heat stress (35 °C), anthocyanin degradation is preferentially activated rather than further suppression of biosynthesis. This response involves significant transcriptional upregulation (red arrows ↑) of key degradation-related enzymes, including class III peroxidases (CmPRXs) and O-methyltransferase 1 (CmOMT1). These enzymes are hypothesized to catalyze anthocyanin breakdown (indicated by red arrows ↓ for content decrease), potentially via intermediate metabolites such as protocatechuic acid (marked “Undetectable” based on experimental data) and vanillic acid (marked “Hypothesized”). This degradation cascade is proposed to result in the accumulation (red arrows ↑) of downstream products such as 5-carboxyvanillic acid, contributing to the observed reduction in anthocyanin levels and petal fading. Solid arrows indicate metabolic flow or enzymatic reactions.
Agriculture 15 00950 g009
Table 1. Sequencing data and quality assessment.
SampleTotal ReadsTotal Clean ReadsClean Read Ratio (%)Total Clean BasesClean Reads Q20 (%)Clean Reads Q30 (%)N (%)GC (%)
HT143,839,83843,017,00498.126,482,096,39498.3995.590.009541.95
HT242,062,43041,325,52298.256,228,241,78998.5496.000.010541.93
HT337,330,38636,695,78898.305,528,613,45898.5095.860.009441.91
RT137,666,59836,928,41298.045,563,585,78698.3495.470.009342.00
RT240,039,02839,291,75898.135,920,416,72898.3995.580.009342.03
RT341,549,84440,792,05898.186,147,404,82498.4595.740.011042.04
Sample: the specimen subjected to sequencing. Total reads: the total number of raw sequencing reads generated. Total clean reads: the number of high-quality reads retained after filtering. Clean read ratio (%): the proportion of clean reads relative to total reads. Total clean bases: the total number of bases in the clean reads. Clean reads Q20 (%): the percentage of bases with a Phred score ≥ 20, indicating a base calling accuracy of at least 99%. Clean reads Q30 (%): the percentage of bases with a Phred score ≥ 30, corresponding to a base calling accuracy of at least 99.9%. N (%): the proportion of ambiguous bases (denoted as ‘N’) among the total bases. GC (%): the percentage of guanine (G) and cytosine (C) bases in the total base content. High clean read ratios (>98%) and base quality scores (Q30 > 95.4%), together with an extremely low proportion of ambiguous bases (N% ≤ 0.011%), indicate that high-quality and reliable sequencing data were obtained for all samples.
Table 2. Statistics of read mapping to the reference genome.
SampleClean Reads Total Mapped Reads (%)Multiple Mapped Reads (%)Uniquely Mapped Reads (%)
HT143,017,00483.2129.9570.05
HT241,325,52283.3630.0070.00
HT336,695,78883.3730.0669.94
RT136,928,41283.4529.9270.08
RT239,291,75883.4729.8970.11
RT340,792,05883.3729.7170.29
Sample: the specimen subjected to sequencing. Clean reads: total number of high-quality reads retained for mapping to the reference genome. Total mapped reads (%): percentage of clean reads successfully aligned to the reference genome. Multiple mapped reads (%): percentage of reads that mapped to more than one genomic location. Uniquely mapped reads (%): percentage of reads that mapped to a single, unique genomic location. High mapping rates (total mapped reads > 83%, uniquely mapped reads ~70%) demonstrate successful alignment of sequencing reads to the reference genome, ensuring reliable gene expression quantification.
Table 3. Assessment metrics for the OPLS-DA.
R2X (cum)R2Y (cum)Q2 (cum)RMSEEpreortpR2YpQ2
Total0.5510.9980.9330.0306200.2150.115
R2X(cum) and R2Y(cum) represent the cumulative variation explained by the model in the X matrix (metabolites) and Y matrix (group membership), respectively. The high R2Y(cum) value (0.998) indicates excellent goodness-of-fit for the group variable. Q2(cum) reflects the cumulative predicted variation in Y based on cross-validation and serves as a key indicator of the model’s predictive ability and robustness. A Q2 value above 0.5 generally indicates good predictive performance; the value obtained here (0.933) demonstrates excellent predictability. RMSEE (Root Mean Square Error of Estimation) measures the model’s estimation error. The terms ‘pre’ and ‘ort’ denote the number of predictive (2) and orthogonal (0) components in the OPLS-DA model, respectively. pR2Y (0.215) and pQ2 (0.115) are p-values from permutation testing, used to assess the model’s statistical significance and guard against overfitting or spurious correlations. A p-value below 0.05 is typically considered indicative of a statistically valid model.
Disclaimer/Publisher’s Note: The statements, opinions and data contained in all publications are solely those of the individual author(s) and contributor(s) and not of MDPI and/or the editor(s). MDPI and/or the editor(s) disclaim responsibility for any injury to people or property resulting from any ideas, methods, instructions or products referred to in the content.

