Article

Arbuscular Mycorrhizal Fungi Play More Important Roles in Saline–Sodic Soil than in Black Soil of the Paddy Field in Northeast China

1
Key Laboratory of Straw Comprehensive Utilization and Black Soil Conservation, Ministry of Education, College of Life Science, College of Resources and Environment, Jilin Agricultural University, Changchun 130118, China
2
State Key Laboratory of Black Soils Conservation and Utilization, Northeast Institute of Geography and Agroecology, Chinese Academy of Sciences, Changchun 130102, China
*
Authors to whom correspondence should be addressed.
Agriculture 2025, 15(9), 951; https://doi.org/10.3390/agriculture15090951
Submission received: 8 February 2025 / Revised: 14 March 2025 / Accepted: 20 March 2025 / Published: 27 April 2025
(This article belongs to the Special Issue Soil Microbial Community and Ecological Function in Agriculture)

Abstract

:
Rice serves as the staple food for half of the world’s population. Given the expanding global population, the urgency to allocate land for rice cultivation is paramount. In Northeast China, saline–sodic and black soils represent two distinct soil types used in rice production. During rice growth, soil microorganisms, including arbuscular mycorrhizal fungi (AMF), play pivotal roles in nutrient uptake and resistance to biotic and abiotic stressors. While numerous studies have elucidated the role of AMF in enhancing rice growth and its adaptation to stress, the differences in AMF communities within paddy fields between different soil types have been largely overlooked. In this study, high-throughput sequencing technology was employed to analyze the diversity and community structure of AMF, and metagenomic sequencing was employed to analyze AMF functional gene differences between the two soil types (black and saline–sodic soils). At the same time, the commonalities and differences of the soil characteristics (nitrogen, phosphorus, potassium, pH, etc.) were verified in influencing AMF communities. The results indicated that Glomus was the predominant genus in both soil types, followed by Paraglomus. The overall abundance of AMF was higher at the heading stage than at the harvest stage, with Paraglomus showing greater adaptation to the saline–sodic soil environment. Total phosphorus (TP) was identified as the primary factor influencing AMF diversity at the heading stage. In the harvest stage, AMF community diversity was greater in saline–sodic paddy soil compared to black soil, a reversal from the heading stage. Further analysis of the functional genes of Rhizophagus intraradices revealed that gene activity in the heading stage of saline soils significantly surpassed that in black soils, suggesting that R. intraradices plays a more crucial role in saline environments. Additionally, spore density and the content of easily extractable glomalin-related soil protein were relatively higher in saline–sodic soil than in black soil. Thus, it may be inferred that AMFs are more vital in saline–sodic soils than in black soils of the paddy fields in Northeast China. This study may offer valuable insights into the utilization of AMF in paddy fields in Northeast China.

1. Introduction

Rice (Oryza sativa L.) is the staple food of more than half of the global population, and its demand continues to rise with increasing population pressures [1]. In Northeast China, particularly in the provinces of Liaoning, Jilin, and Heilongjiang, black soil is a primary agricultural resource for rice cultivation. In 2020, the areas dedicated to rice cultivation in Liaoning Province, Jilin Province, and Heilongjiang Province were 520,400, 837,100, and 3,870,800 hm2, accounting for approximately about 17.38% of the total rice planting area in China [2,3,4,5]. Notably, Jilin Province is situated within the black soil belt of the three cold regions globally and is also a representative area of soda saline lands in Northeast China. The soils cultivated for rice in this region include both black soil and saline–sodic soil, with significant saline–alkali areas primarily located in Songyuan and Baicheng cities [6]. Currently, due to long-term excessive farming and poor management practices, the quality and quantity of black soil have severely deteriorated, and the area of saline–alkali land has progressively increased [7]. These changes have adversely impacted the yield of food crops and reduced land utilization rates. In this context, biofertilizers, especially arbuscular mycorrhizal fungi (AMF), are considered the most ecologically sustainable solutions [8]. These fungi have been increasingly applied to rice cultivation, supported by the availability of mature AMF products in the market [9]. The application of AMF can mitigate the resistance of crops to saline–sodic stress and promote crop growth under normal environmental conditions [10]. Therefore, the study for illustrating the difference in AMF communities between black soil and saline–sodic soil is of particular significance.
AMFs, belonging to the phylum Glomeromycota, are beneficial fungi that coexist with over 80% of terrestrial plant species [11,12]. They expand the root area of host plants, enhancing the uptake of minerals and water, thereby offering substantial benefits to agricultural ecosystems [13,14]. The literature indicates that AMF plays a vital role in enhancing nutrient absorption (notably nitrogen and phosphorus), combating salinity and alkaline stress, mitigating drought impacts [15,16,17], stabilizing soil structure, promoting the formation of soil aggregates, and reducing emissions of methane (CH4) and nitrous oxide (N2O) in rice fields [18]. As an organic fungal fertilizer, AMFs enhance crop growth and reduce the reliance on chemical fertilizers [19,20]. They can recruit phosphate-solubilizing bacteria in the soil, preventing soil damage and water pollution caused by the over-application of phosphorus fertilizers [21].
Currently, AMFs are at the forefront of soil science and ecology, particularly in areas concerning stress resistance and soil remediation. Studies have confirmed the presence of AMF in both black and saline–sodic soils [22,23]. Current research on AMF in black soil and saline–sodic paddy fields predominantly focuses on their roles in promoting plant nutrient absorption, particularly phosphorus, and enhancing drought and salinity tolerance. However, there has been relatively limited analysis of the differences in AMF diversity across different soils, which highlights the importance of studying AMF community dynamics in these contrasting environments. Specifically, it is essential to analyze the variations among different soil types in major national grain production areas.
Moreover, AMF communities are influenced by a combination of environmental and human factors, particularly soil characteristics such as carbon, nitrogen, phosphorus, water content, and pH levels. The intensity of anthropogenic disturbances and land use patterns significantly affects AMF diversity, with lower diversity typically associated with higher degrees of disturbance [22,24]. Beyond human impacts, natural soil conditions and sampling periods are also crucial drivers of AMF community composition and diversity [25]. Thus, understanding AMF community composition and diversity is essential, given their dependency on varying environmental conditions. This understanding is vital for improving the applicability of AMFs in stress resistance, soil remediation, and molecular-level analysis.
Currently, the similarities and differences in AMF community compositions and the influence of soil factors between black soil and saline–sodic soils remain unclear. Likewise, the specific roles of AMF in these soil types have not been adequately defined. Therefore, this study aims to identify a large role of AMF in paddy fields with black soil or saline soil by analyzing the differences in AMF diversity and functional genes. Key factors influencing AMF diversity and community composition were explored to verify the correlation between the two soil types. This research could significantly contribute to the screening and utilization of AMF in both black and saline–sodic soils, enhancing their effectiveness in sustainable agriculture practices.

2. Experimental Materials and Methods

2.1. Experimental Materials

In this study, black soil and saline–sodic soil from Jilin Province was used. The saline–sodic soils were collected from two paddy fields in Qian’an County, Songyuan City (44°37′47″~45°18′08″ N, 123°21′16″~124°22′50″ E), and Da’an City, Jilin Province (44°57′00″~45°45′51″ N, 123°08′45”~124°21′56″ E). Black soils were obtained from two paddy fields in Dehui County, Changchun City (44°8′24″ N, 125°27′59″ E). The sampling was carried out in August and November 2023, which were, respectively, named as the heading period (CS) and the harvest period (QS). Soil samples were collected uniformly from each period, and all soil samples were subsequently used for physical, chemical, and biological analysis. For each site, five sampling points were established. The soil was excavated at a depth of 20 cm and a width of 20 cm, about 5 kg; placed into a self-sealed bag; and divided into two parts. One part was stored in a refrigerator at 4 °C, while the other part was processed immediately for sieving AMF spores. The sites were named Da’an city (DA), Qian’an county (QA), black soil No. 1 (HT1), and black soil No. 2 (HT2), with each having both harvest period (QS) and heading period (CS) samples.

2.2. Soil Treatment

About 5 g of soil was processed by using the wet sieve precipitation method for collecting AMF spores [24]. Soil retained on a 300 mesh screen was processed further. Approximately 0.5 g of sieved soil samples was transferred into 2 mL centrifuge tubes for DNA extraction and sequencing, and the remaining portion of soil was normally used for other index measurements.

2.3. DNA Extraction, Amplification, and High-Throughput Genome Sequencing

Total soil DNA was extracted using the protocol provided by the Fast DNA SPIN Kit (Catalog No. 6560-220, Mpbio, Irvine, CA, USA). The extracted DNA served as a template for PCR amplification. The AMV4.5NF/AMDGR primers were utilized for this amplification, with sequences AMV4.5NF (5′-AAGCTCGTAGTTGAATTTCG-3′) and AMDGR (5′-CCCAACTATCCCTATTAATCAT-3′). The reaction mixture consisted of 50 μL: 2 μL of DNA, 2 μL of AMV4.5NF, 2 μL of AMDGR, 25 μL of PreMix (Tiangen, Beijing, China), and 19 μL of sterilized water. The PCR protocol included an initial denaturation at 94 °C for 5 min, followed by 35 cycles of denaturation at 94 °C for 30 s, annealing at 56 °C for 30 s, and extension at 72 °C for 50 s, with a final extension at 72 °C for 10 min and preservation at 4 °C. High-throughput sequencing was then conducted on an Illumina MiSeq platform (Personalbio Technology Co., Ltd., Shanghai, China). Raw sequencing data were processed using QIIME 2 2020.8 software (https://qiime2.org/). Initially, unmatched primer sequences were removed using the cutadapt tool. Sequences were then merged using the vsearch fastq_mergepairs module, followed by quality filtering with the fastq_filter module. Sequence clustering was performed using the cluster_size module at a 98% similarity level to remove chimeras with the uchime_denovo module. A perl script from the VSEARCH pipeline (https://github.com/torognes/vsearch/wiki/VSEARCH-pipeline, accessed on 1 February 2024) was employed to further clean the sequence set after quality control. Finally, sequences were clustered at a 97% similarity level to obtain high-quality sequences and generate representative sequence and operational taxonomic unit (OTU) tables. The taxonomic annotation of OTU species was carried out against the MaarJAM database (https://maarjam.ut.ee/, accessed on 1 February 2024) using QIIME2 software.

2.4. Metagenomic Data Analysis of Rhizophagus intraradices Sequencing Data in the Rhizospheres of Rice Plants

The method for metagenomic data analysis of Rhizophagus intraradices was performed as described by Tian et al. [26]. Total soil DNA was also used for metagenomic sequencing. DNA libraries were submitted for paired-end shotgun sequencing using the Illumina HiSeq × TEN platform (San Diego, CA, USA). The raw metagenomic sequencing data were quality-controlled using fastp (https://github.com/OpenGene/fastp, accessed on 27 January 2025).
To estimate the expression of R. intraradices-related genes in soil, the genome sequence of R. irregularis was compared to the clean metagenomic data using Salmon version 0.7.2 software (https://combine-lab.github.io/salmon/, accessed on 27 January 2025). The genome sequence of R. irregularis daom197198 from the Joint Genome Institute database (https://mycocosm.jgi.doe.gov/Rhiir2_1/Rhiir2_1.home.html, accessed on 27 January 2025) was used as the reference genome. The transcripts per million (TPM) read data were used to represent the expression of R. intraradices-related genes in soil and calculate differentially expressed genes (DEGs) [26]. DEGs were used to identify significantly differentially expressed genes between saline–sodic and black soils, with pheatmap analysis conducted using R software v. 3.5.1.

2.5. Determination of Spore Density and Soil Physical and Chemical Properties Between Black Soil and Saline–Sodic Soil

The spore density (SD) of AMF was determined by isolating spores from the soil using the wet sieve precipitation method [27]. The isolated spores were observed under a stereo microscope and counted, expressed as the number of spores per 5 g of air-dried soil [28]. Spore density was calculated as the number of spores per gram of soil.
Soil pH and electrical conductivity (EC) were measured using a pH meter. Total nitrogen (TN) and total phosphorus (TP) were quantified using the Kjeldahl method and the perchloric-acid–sulfuric-acid method, respectively. Alkaline hydrolyzable nitrogen (AN), available phosphorus (AP), and exchangeable potassium (AK) were assessed using the alkaline diffusion method, sodium-bicarbonate-extraction–molybdenum-antimony colorimetric method, and ammonium-acetate–flame-photometer method, respectively. Organic matter content was determined by the potassium dichromate oxidation method [29].

2.6. Determination of Glomalin-Related Soil Protein Concentration in Black Soil and Saline–Sodic Soil

Glomalin-related soil protein (GRSP) concentrations were determined using the methodologies outlined by Wright et al. and Janos et al. [30,31]. Briefly, the easy extraction of glomalin-related soil protein (EE-GRSP) involved placing 1 g of air-dried soil in a centrifuge tube, adding 8 mL of sodium citrate extraction agent (20 mmol/L, pH = 7.0), mixing thoroughly, and sterilizing at 121 °C and 0.1 MPa for 30 min. Following sterilization, samples were immediately centrifuged at 5000× g for 6 min to collect the brown-red supernatant, which was then stored at 4 °C for analysis. The total glomalin-related soil protein (T-GRSP) extraction procedure involved adding 8 mL of sodium citrate extract (50 mmol/L, pH = 8.0) to 1 g of air-dried soil, mixing, and sterilizing at 121 °C and 0.1 MPa for 90 min. After the initial centrifugation at 10,000× g for 6 min, the supernatant was removed, and an equal volume of sodium citrate extract was added for a further 60 min extraction at high temperature. This process was repeated until the supernatant no longer appeared brown-red. The collected supernatants were mixed and stored at 4 °C. For quantification, 0.5 mL each of EE-GRSP and T-GRSP was transferred into test tubes, along with 0.5 mL of distilled water for the blank control. Then, 5.0 mL of Coomassie blue dye was added, mixed thoroughly, and allowed to rest for 3 min, and then the absorbance was measured at 595 nm using a spectrophotometer, alongside a standard curve, completing all measurements within 15 min.

2.7. Determination of Aggregate Content of Black Soil and Saline–Sodic Soil

The content of water-stable aggregates was determined by wet sieving [32]. Fifty grams of dry soil was placed into a top-sleeve sieve set with apertures of 5 mm, 2 mm, 1 mm, 0.25 mm, and 0.053 mm and slowly submerged in a bubble-free water bucket for 10 min. The water level was then leveled with the top sieve edge, and the bucket was placed on a soil aggregate analyzer (XY-100; Beijing, China). The sieve was agitated for 30 min, and the water-stable aggregates remaining on the sieve were collected, dried on a heating plate, and weighed. The content of aggregates larger than 0.25 mm (R0.25) was recorded as the measure of water-stable aggregates.

2.8. Data Processing

Data collation was performed by using Excel 2019. Significant differences between experimental groups were analyzed using one-way ANOVA followed by Duncan’s post hoc test, conducted in SPSS 19.0. A significance level of p < 0.05 was considered statistically significant. Data visualization included stacking bar graphs and multifactor bar graphs using Origin 2021; redundancy analysis (RDA) with Canoco5; and the creation of sparse curves and correlation heat maps using the Gene Cloud online platform of the sequencing company (Personalbio Technology Co., Ltd., Shanghai, China). Linear discriminant analysis of effect size (LEFSe) based on a linear discriminant analysis (LDA) threshold of 3.0 was used for the difference of the taxa in the samples on the Gene Cloud online platform.

3. Results

3.1. Statistical Analysis of AMF Sequencing Data of Black Soil and Saline–Sodic Soil in Late Autumn Harvest and Heading Stage

High-throughput sequencing of AMF from black and saline–sodic soils in the harvest and heading periods yielded 279,902 and 378,172 raw sequences, respectively, with 221,030 and 306,147 effective sequences obtained for each period (Table 1). The OTU number of black soil in both the late autumn harvest and heading periods was higher than that of saline–sodic soil, with overall higher OTU counts at the heading period than at the harvest stage (Table 1). The sequencing rarefaction curves for each treatment at both stages plateaued, indicating that the depth of sequencing was sufficient to accurately represent the AMF community structure in the soils (Figure 1).

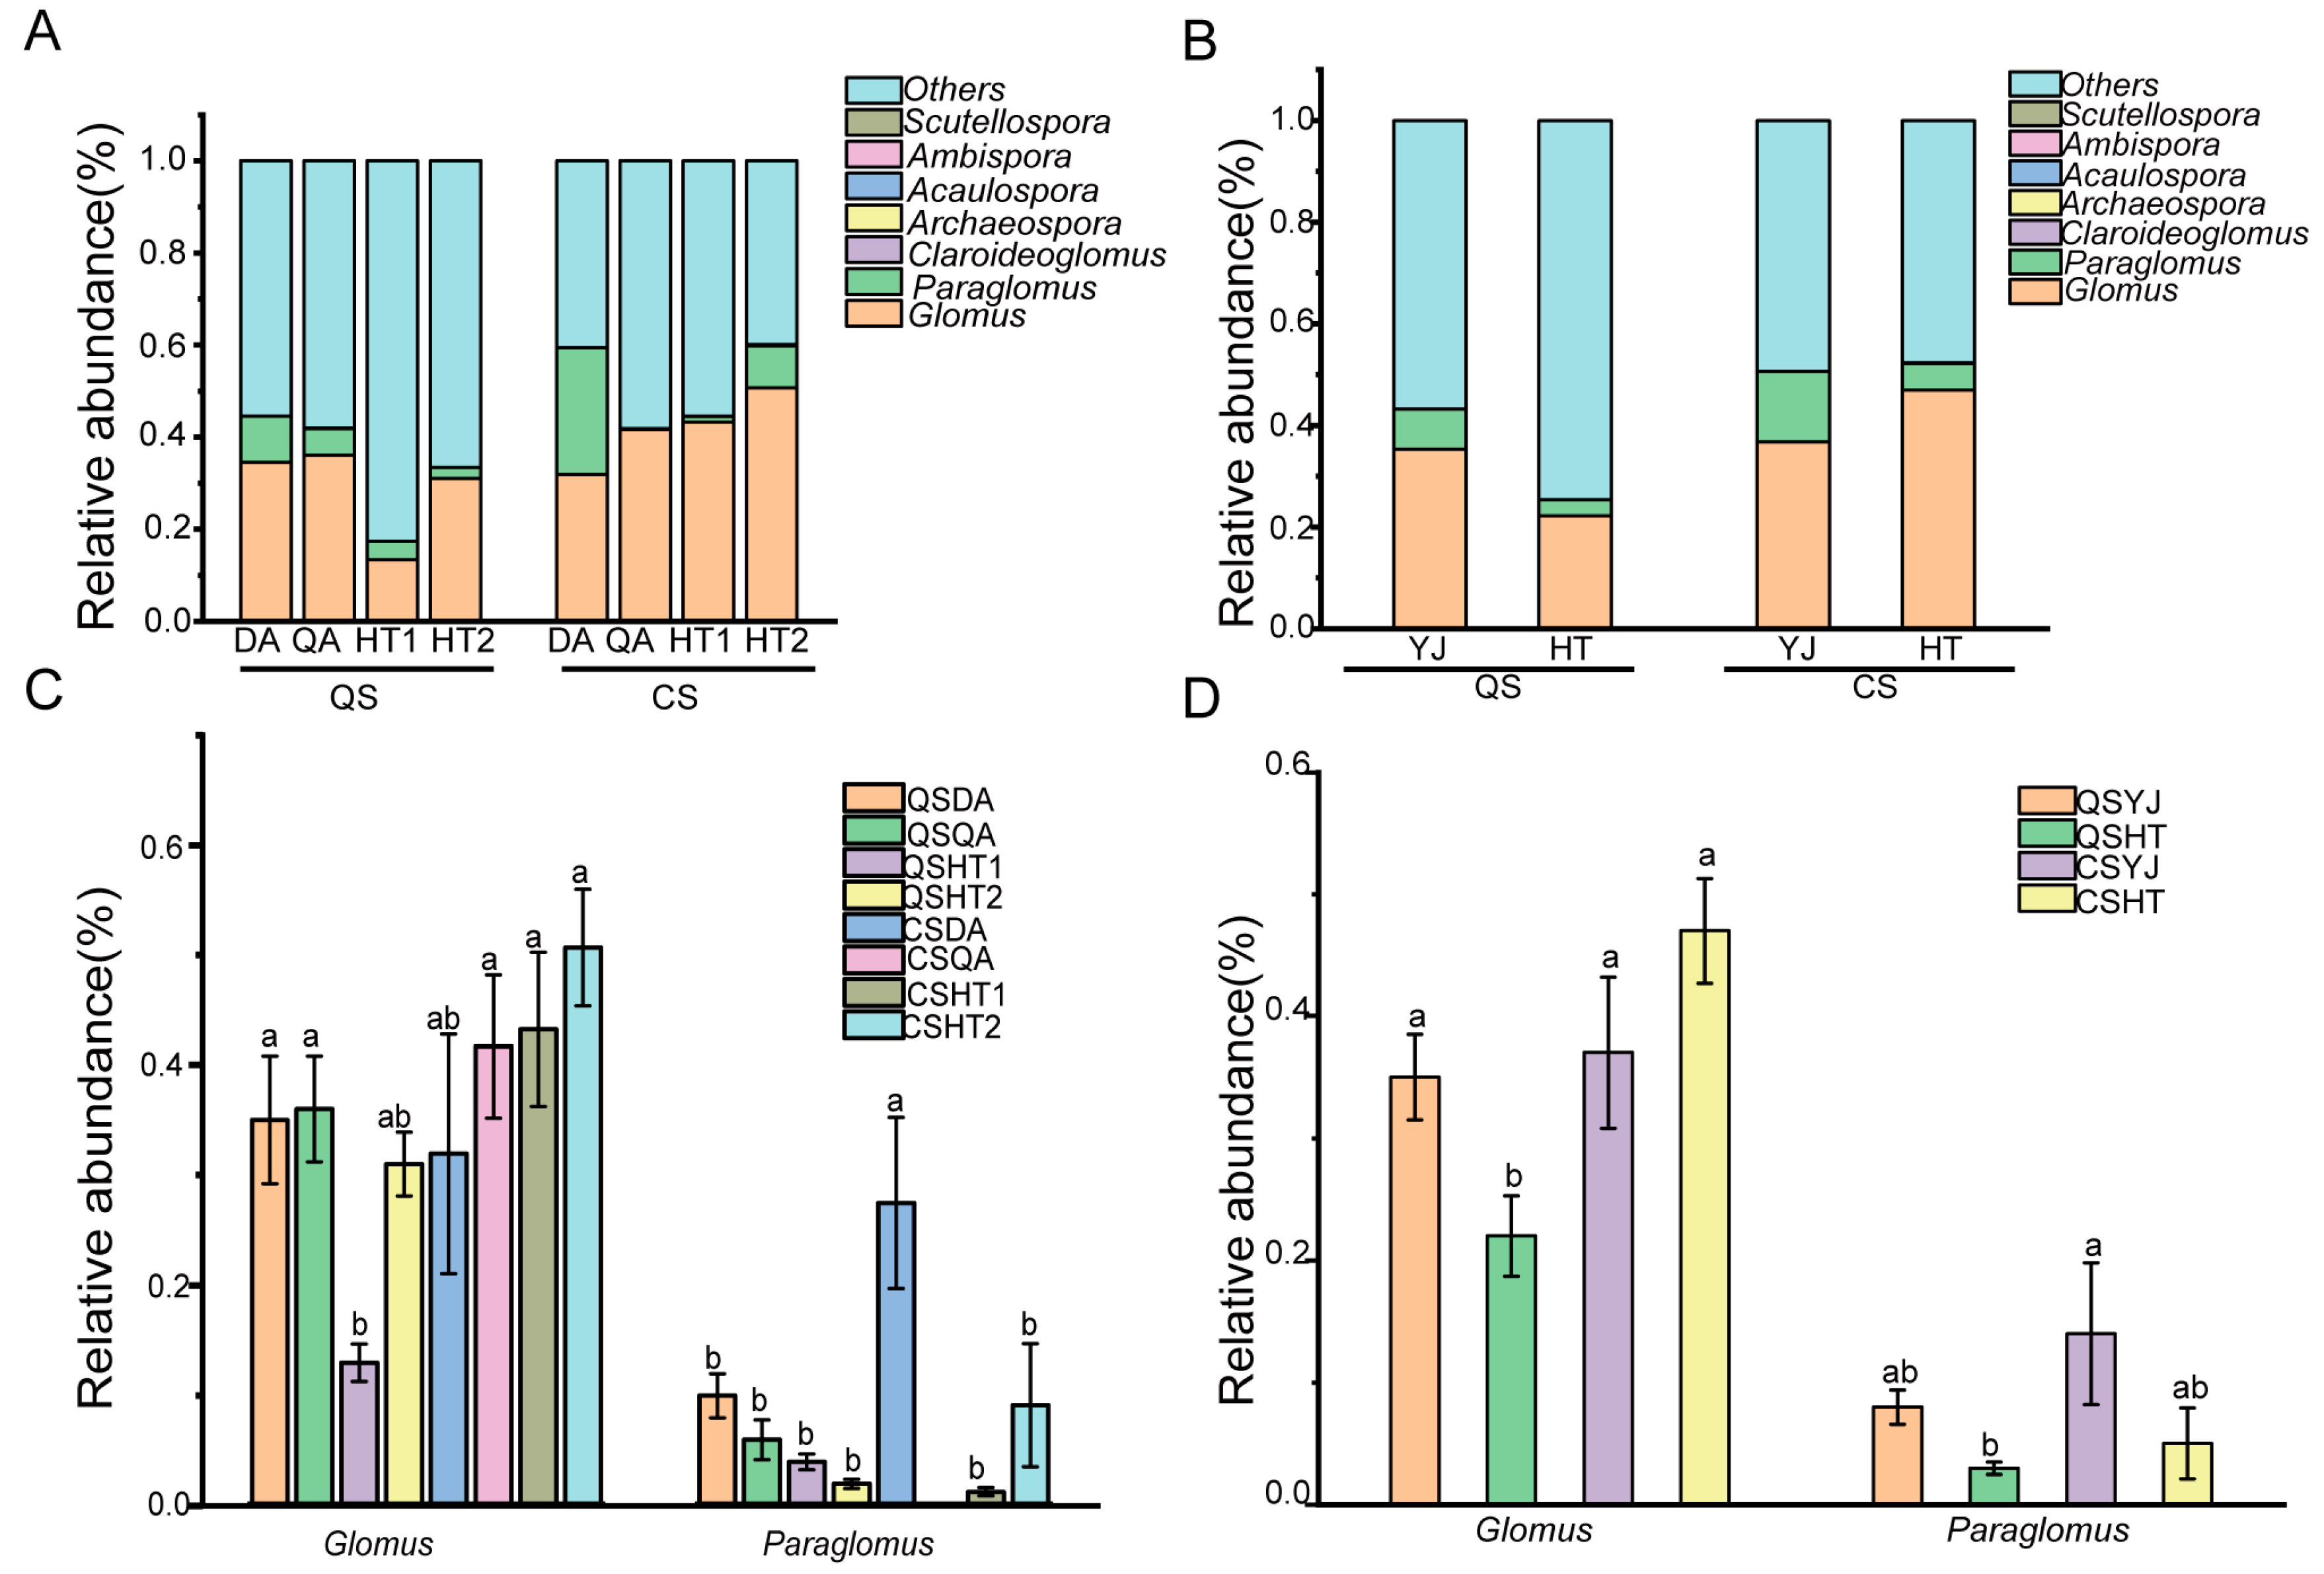
3.2. AMF Community Composition Analysis of Black Soil and Saline–Sodic Soil

At the genus level, Glomus and Paraglomus represented the highest proportions in both soil types at both stages. At the harvest stage, the average relative abundances of Glomus and Paraglomus in saline–sodic soil were 36.5% and 8.24%, respectively, while in black soil, they were 22.23% and 3.20%, respectively. At the heading stage, the average relative abundances of Glomus and Paraglomus in saline–sodic soil were 36.81% and 13.83%, respectively, and in black soil, 46.96% and 5.21%, respectively. However, the relative abundances of Claroideoglomus, Archaaeospora, Acaulospora, Ambispora, Scutellospora in saline–sodic soil and black soil were all less than 0.01% (Figure 2).

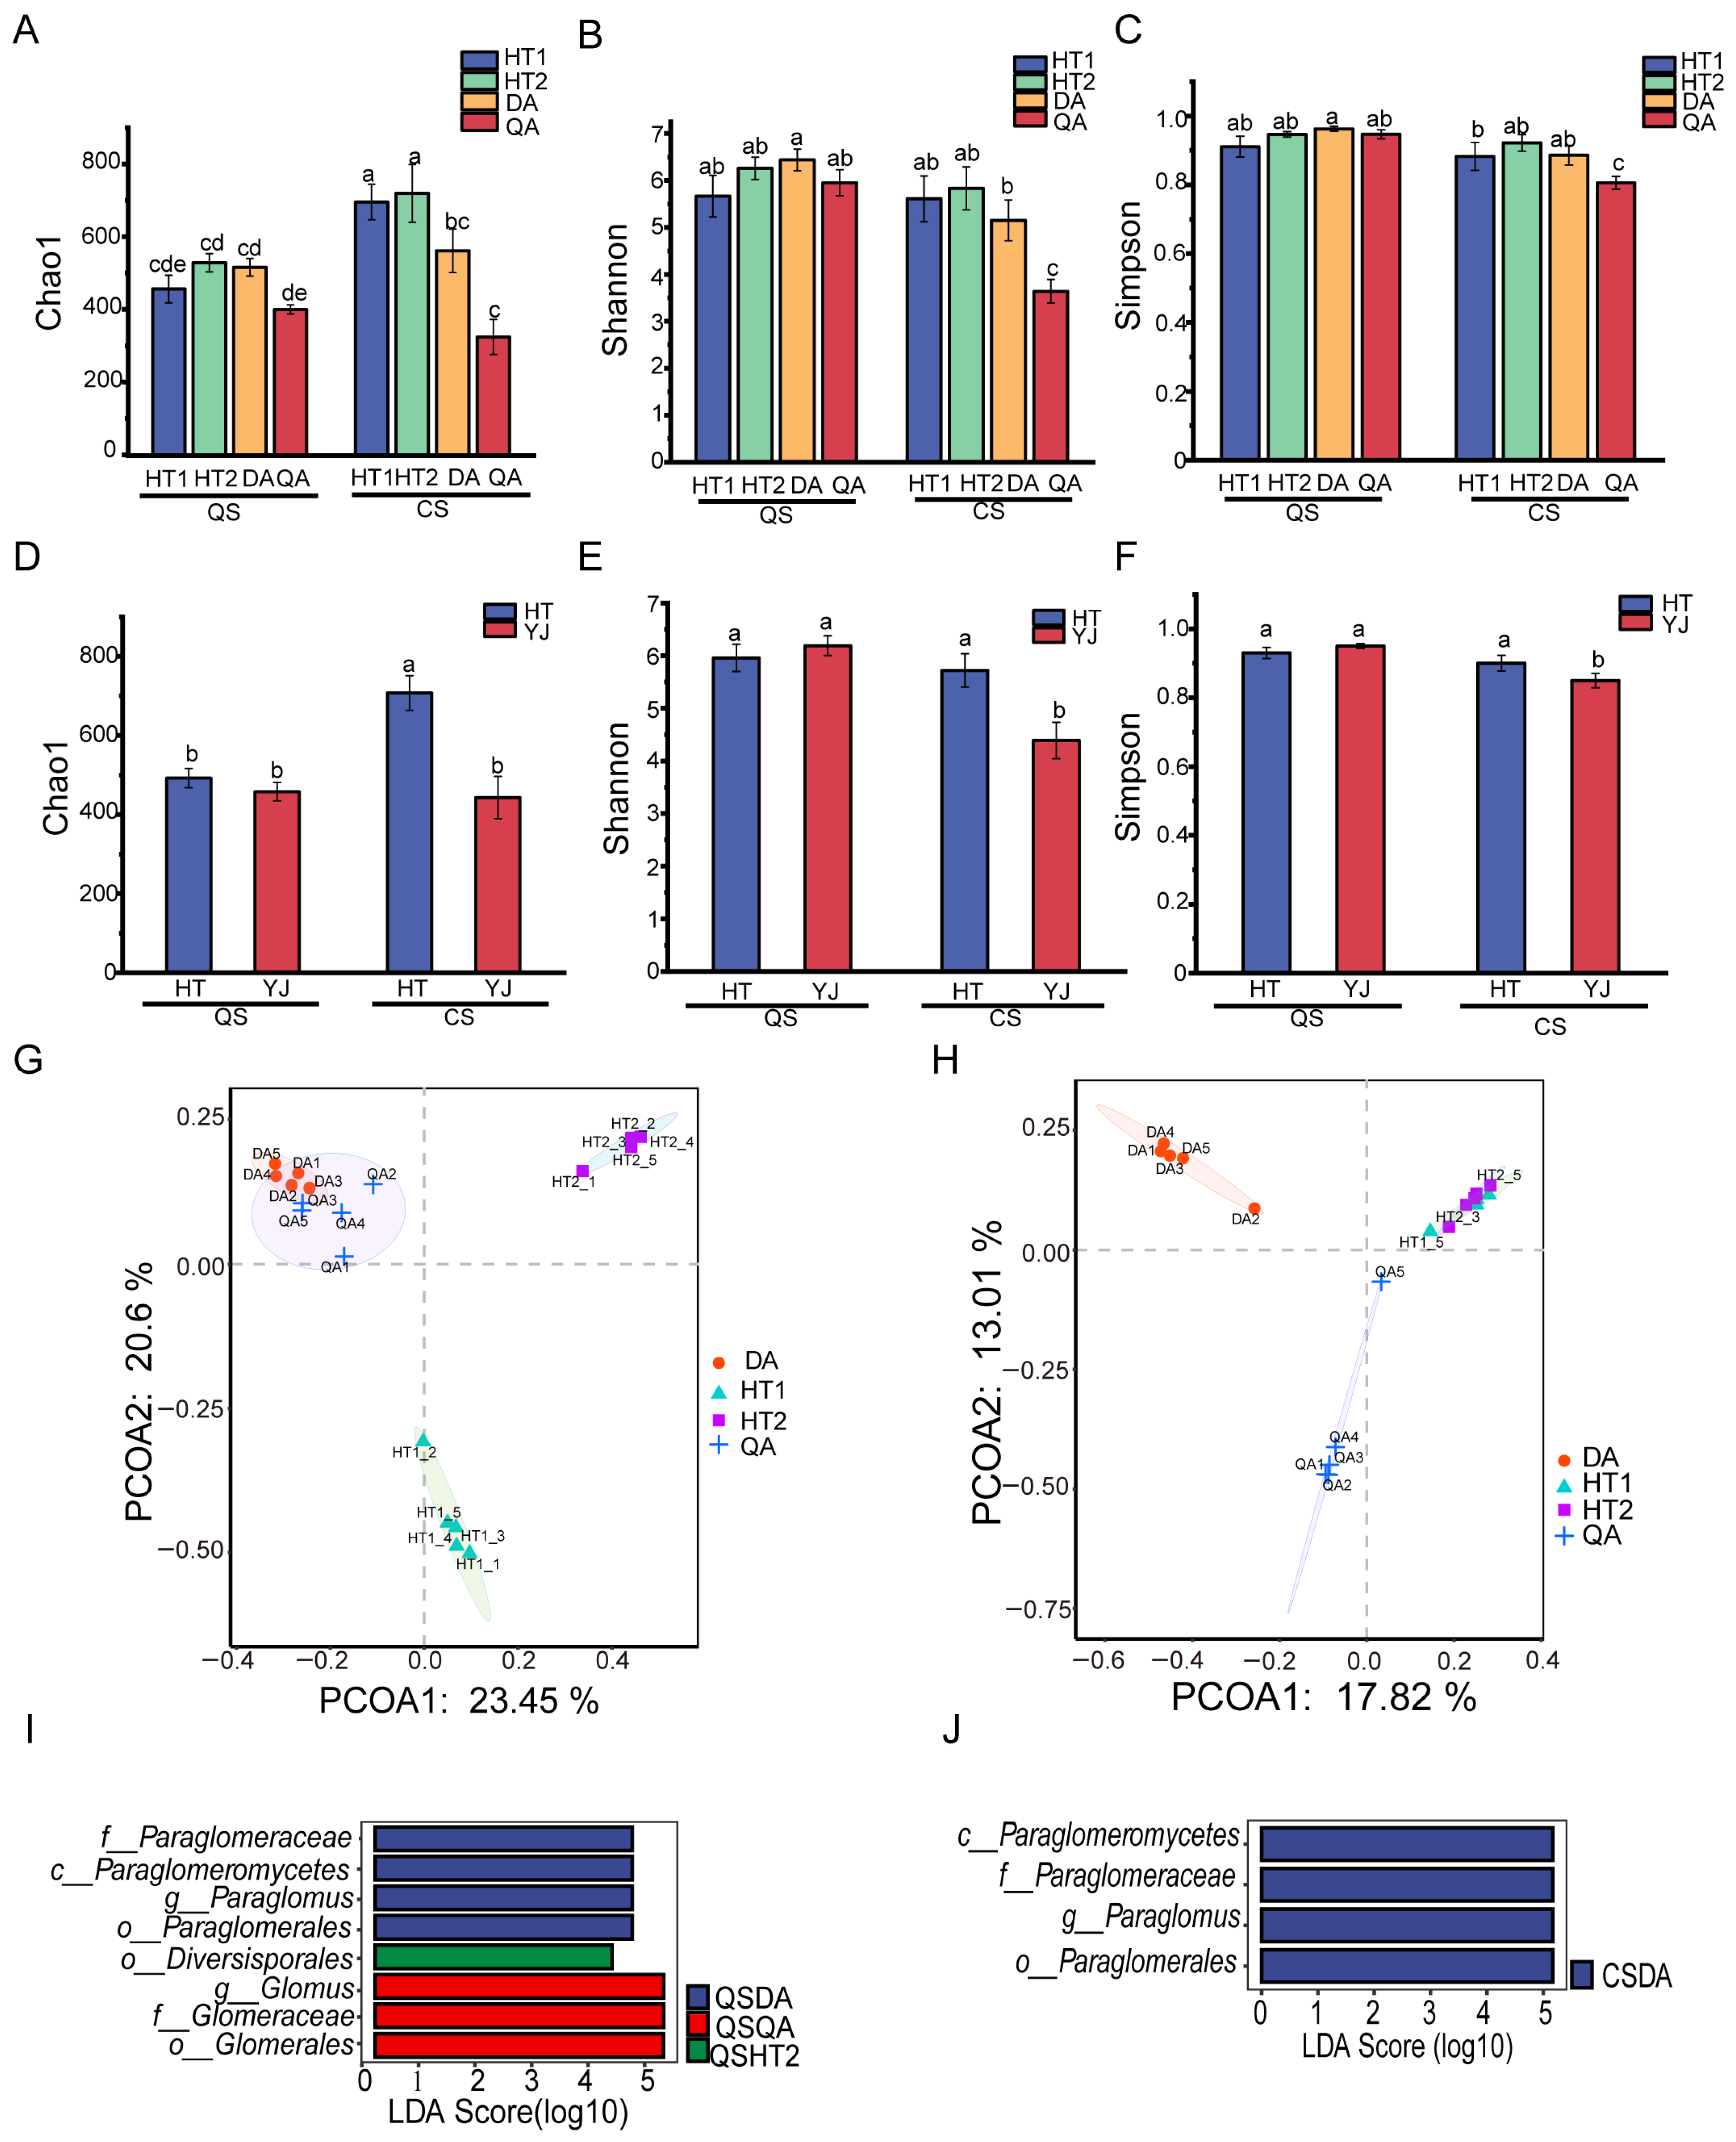
3.3. AMF Alpha Diversity of Black Soil and Saline–Sodic Soil

The alpha diversity of AMF between black soil and saline–sodic soil at the harvest stage is depicted in Figure 3A–F. At this stage, the Chao1 index of black soil was higher than that of saline–sodic soil (HT2 > DA > HT1 > QA), whereas the Shannon and Simpson indices showed the opposite trend (DA > HT2 > QA > HT1). At the heading stage, the Chao1, Shannon, and Simpson indices of black soil were consistently higher than those of saline–sodic soil, with significant differences observed (highest in HT2 and lowest in QA).

3.4. AMF Beta Diversity of Black Soil and Saline–Sodic Soil

PCoA results demonstrated significant differences in AMF community structures in black soil and saline–sodic soil between the harvest and heading period (Figure 3G,H). In the harvest stage, the dominant AMFs in the saline–sodic soil of DA were identified as belonging to the Paraglomeraceae, within the order Paraglomerales and the class Paraglomeromycetes, specifically the genus Paraglomus; in QA, the dominant AMF belonged to the family Glomeraceae, within the order Glomerales, specifically the genus Glomus; and in HT2, the dominant AMF were from the order Diversisporales (Figure 3I). At the heading period, the dominant AMF in the saline–sodic soil of DA continued to be Paraglomus from the family Paraglomeraceae, class Paraglomeromycetes, and order Paraglomerales (Figure 3J).

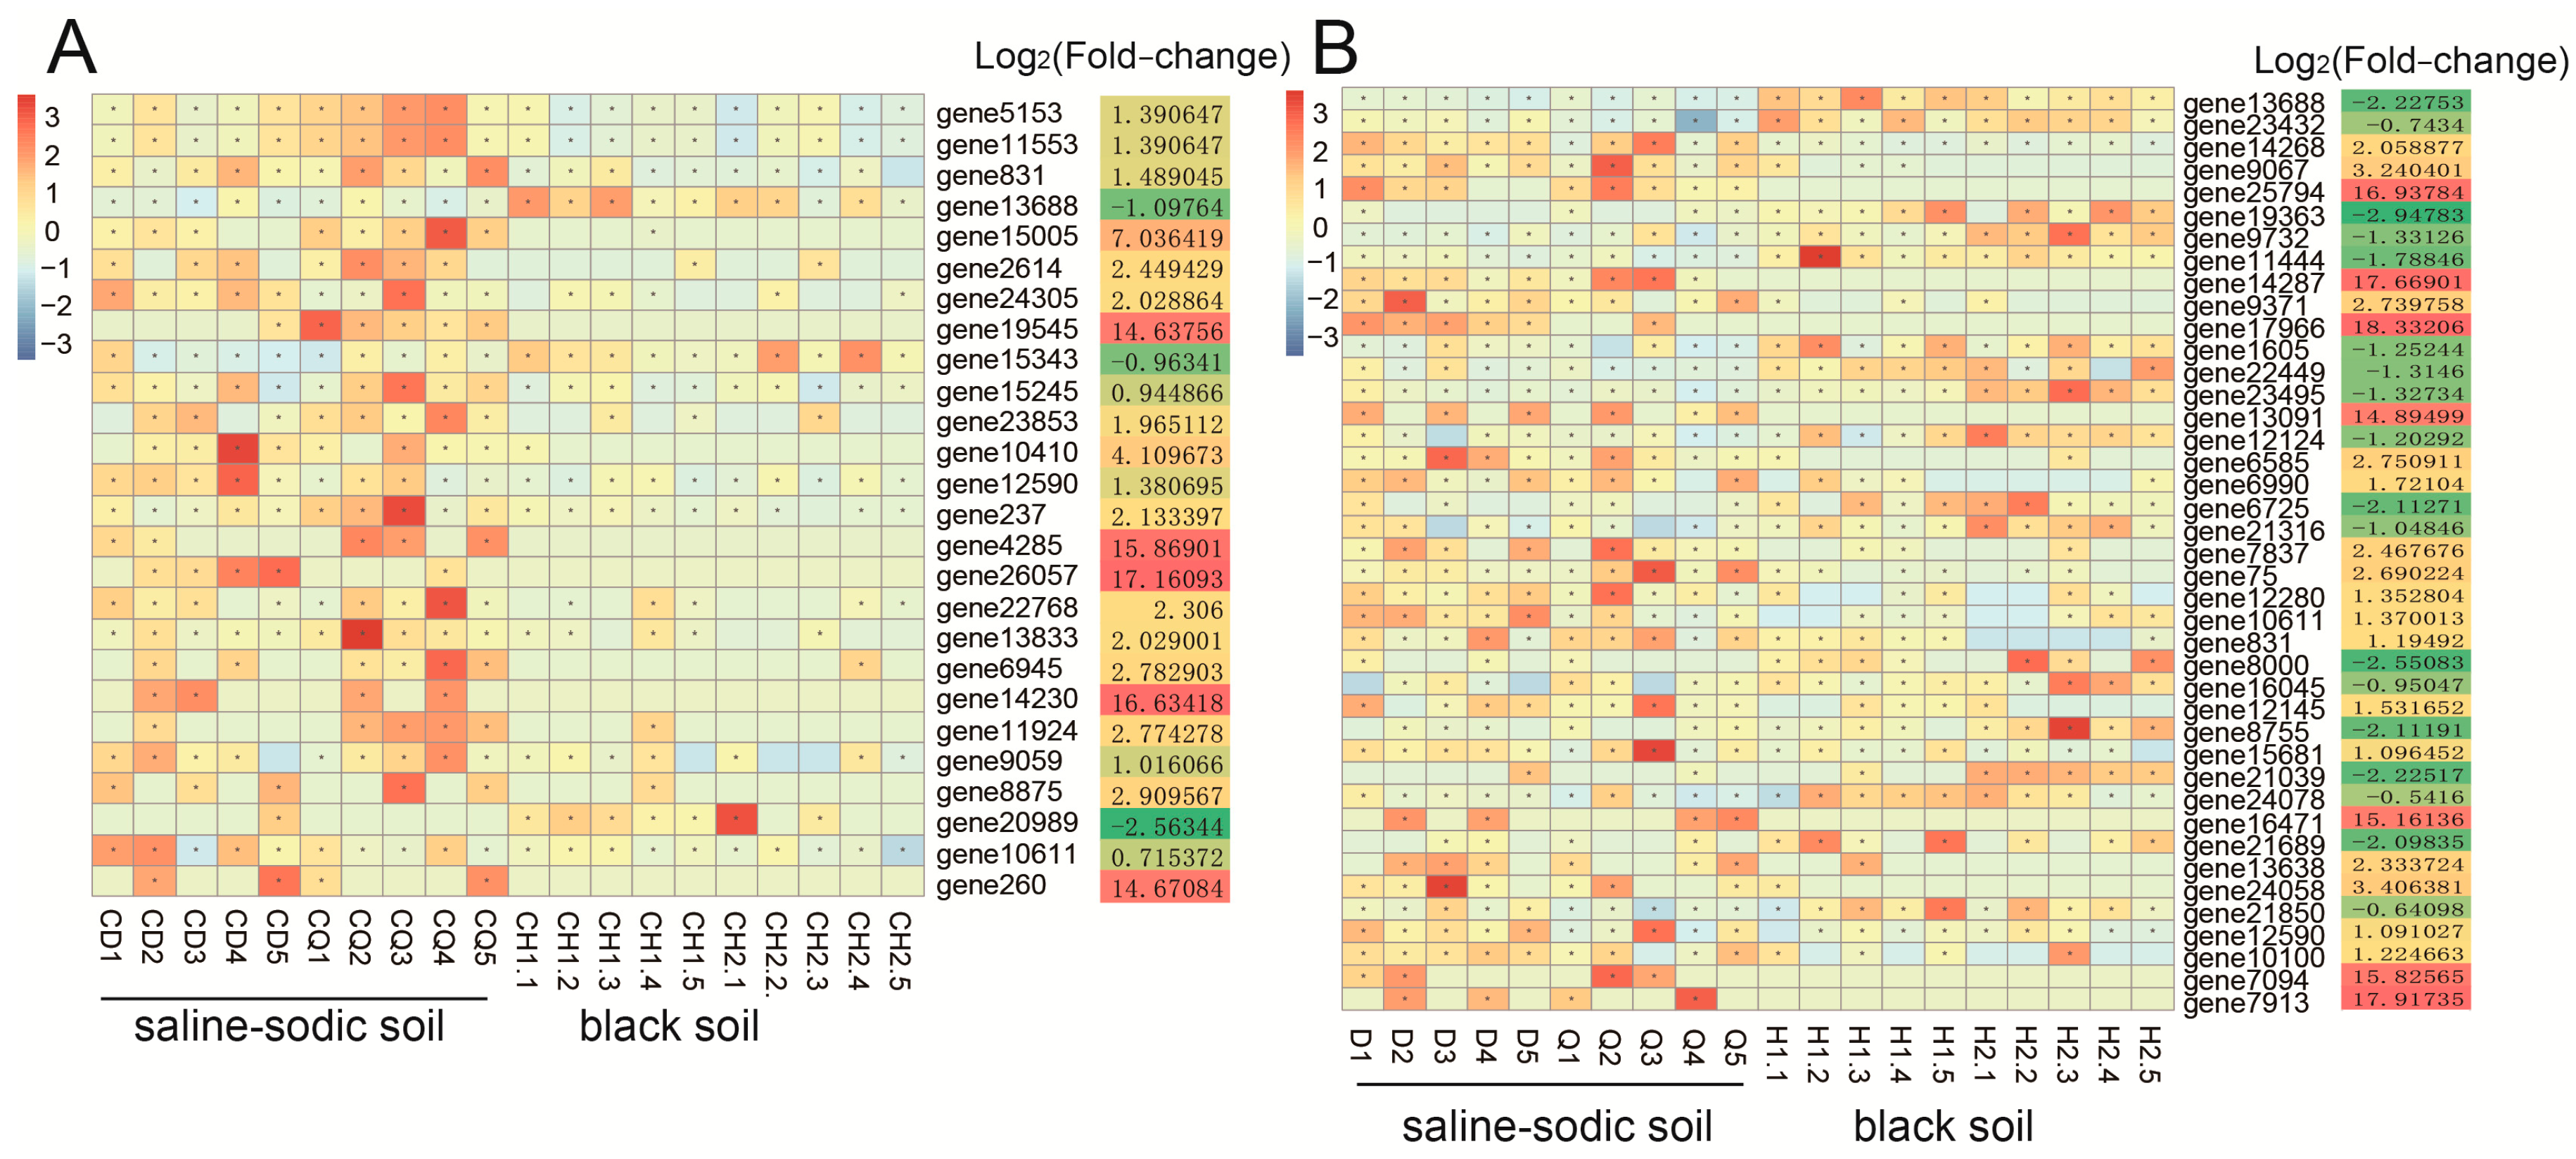
3.5. Metagenomic Data Analysis of R. intraradices-Related Genes in the Rhizospheres of Rice Plants

Metagenomic Data Analysis of R. intraradices in the Rhizospheres of Rice Plants

Metagenomic data analysis revealed the presence of Rhizophagus intraradices-related genes, enabling the identification of differences in gene expression between saline–sodic and black soils. At the rice heading stage, a total of 26 differentially expressed genes (DEGs) were identified between the two soil types (Figure 4A). Among these DEGs, 23 genes were significantly up-regulated in saline–sodic soil compared to black soil, while only 3 genes were significantly up-regulated in black soil relative to saline–sodic soil (Figure 4A). At the rice harvest stage, 41 DEGs were identified between saline–sodic soil and black soil (Figure 4B). Of these, 23 genes were significantly up-regulated in saline–sodic soil relative to black soil, whereas 18 genes were significantly up-regulated in black soil compared to saline–sodic soil (Figure 4B).

3.6. Physicochemical Properties and Glomalin-Related Soil Protein of Black Soil and Saline–Sodic Soil

Table 2 and Table 3 illustrate significant differences in the physicochemical properties between black soil and saline–sodic soil at both the harvest and heading stages. At the harvest stage, the concentrations of nitrate-nitrogen (NO3-N), total nitrogen (TN), total phosphorus (TP), available potassium (AK), organic matter (OM), and available phosphorus (AP) were higher in black soil than in saline–sodic soil, while the electrical conductivity (EC), pH, and ammonium-nitrogen (NH4+-N) levels were lower in black soil (Table 2). At the heading stage, black soil continued to exhibit higher levels of NH4+-N, NO3-N, TN, TP, AK, OM, and AP compared to saline–sodic soil, with lower EC and pH values (Table 3).
Regarding the glomalin-related soil proteins, the content of easily extracted glomalin-related soil protein (EE-GRSP) in saline–sodic soil was higher than in black soil for both the harvest and heading stages. Notably, the EE-GRSP levels at the harvest stage were significantly higher than at the heading stages for both soil types. Conversely, the total glomalin-related soil protein (T-GRSP) content was greater in black soil compared to saline–sodic soil (Table 4), and the T-GRSP levels at the harvest stage exceeded those in the heading stage for both soil types. In terms of spore density (SD), saline–sodic soil demonstrated a relatively higher SD compared to black soil (Table 4).

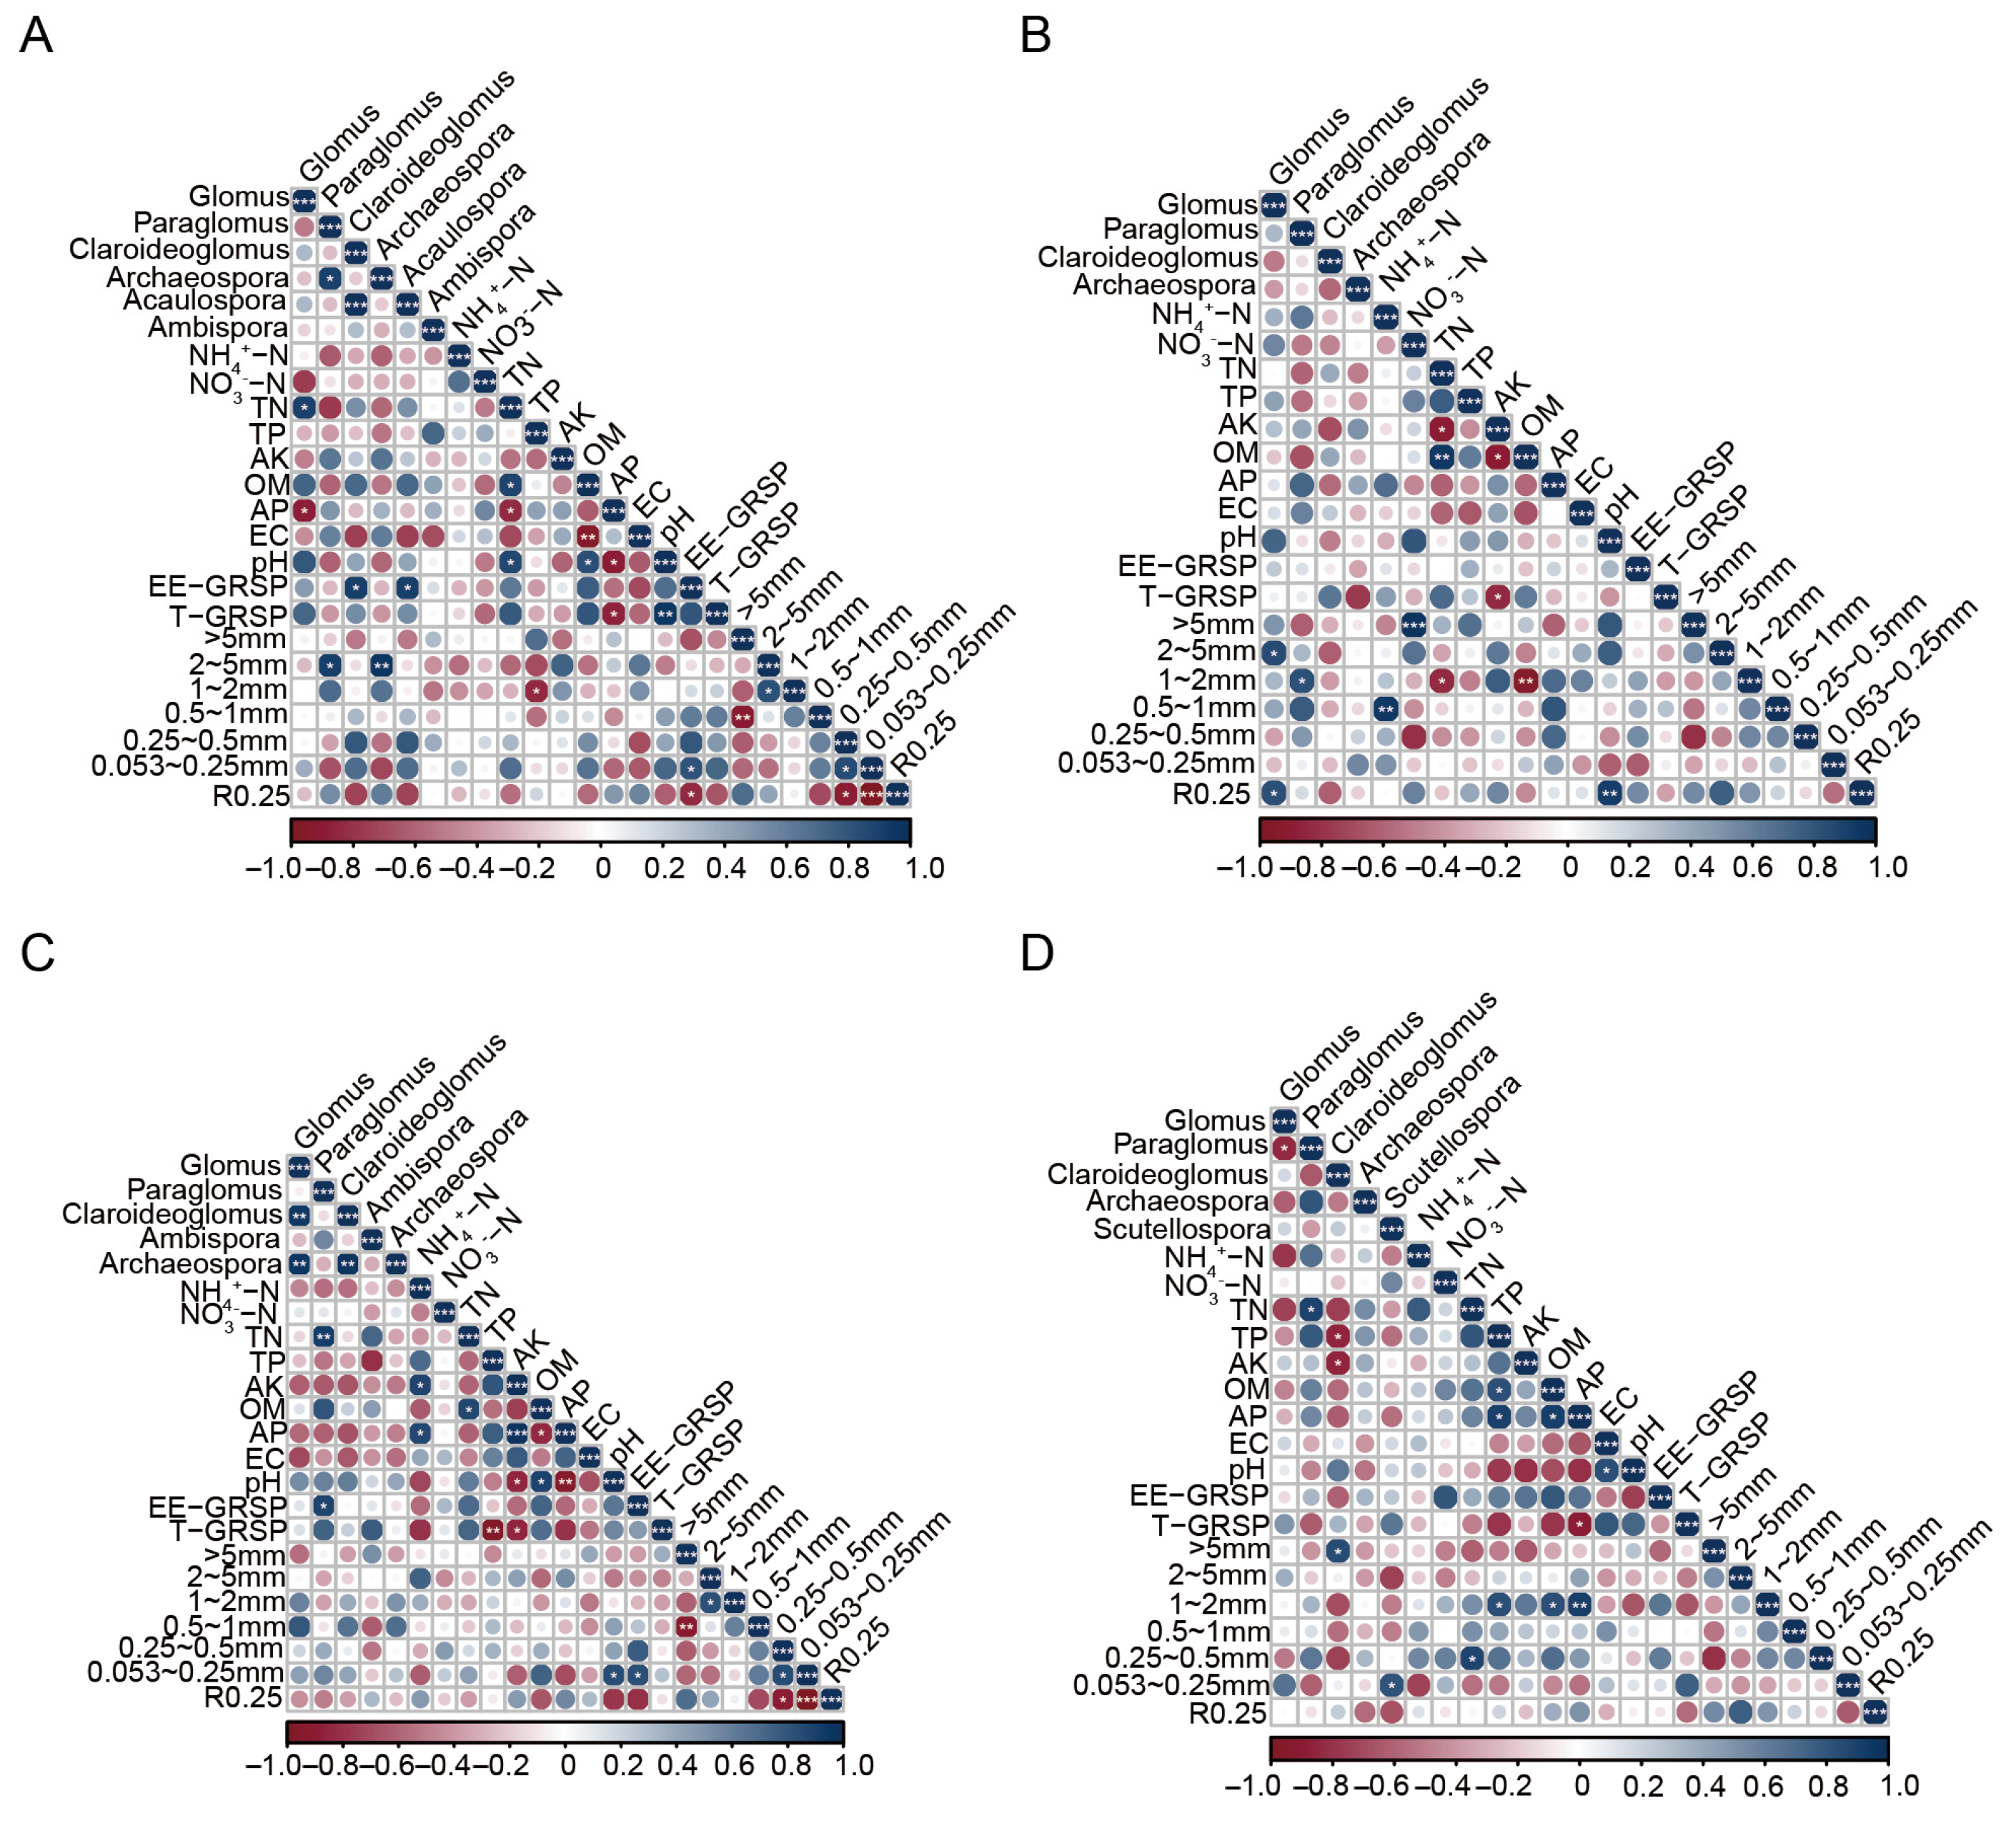
3.7. Correlation of the Genus Relative Abundance, Diversity, and Environmental Factors

Redundancy analysis (RDA) was conducted to ascertain the significant edaphic factors influencing the composition of the AMF community (Figure 5). At the harvest period, nitrate-nitrogen (NO3-N) content significantly impacted AMF community structures in black soil. Total nitrogen (TN), organic matter (OM), and available potassium (AK) were key influences on AMF species richness, while available phosphorus (AP) affected AMF community diversity in saline–sodic soil. At the heading period, both total phosphorus (TP) in black soil and saline–sodic soil influenced AMF species richness and community diversity (Figure 5).
The correlations between soil AMF genus abundance, aggregate content, and glomalin-related soil protein (GRSP) content with environmental factors were analyzed by heatmap analysis (Figure 6). In the harvest stage, the relative abundance of Glomus was positively correlated with TN content and significantly negatively correlated with AP in black soil; and EE-GRSP was significantly negatively associated with R0.25 and positively associated with 0.053~0.25 mm aggregate content in black soil (Figure 6A). Total GRSP (T-GRSP) showed a positive correlation with pH and a negative correlation with AP (Figure 6A). In saline–sodic soil at the harvest stage, the 25 mm aggregate content positively correlated with the abundance of Glomus, and the 1~2 mm aggregate content was positively correlated with the abundance of Paraglomus (Figure 6B).
In the heading stage, a distinct correlation was identified between soil physicochemical properties and genus abundance. Notably, the relative abundance of Paraglomus demonstrated a significantly positive correlation with TN in both black and saline–sodic soils (Figure 6B,C). EE-GRSP in black soil was found to promote the formation of 0.053~0.25 mm microaggregate particles, yet the content of these aggregates was influenced by TP, TN, and OM in saline–sodic soil (Figure 6).

4. Discussion

The black soil and saline–sodic soil in Northeast China are vital resources for rice cultivation [33,34]. Arbuscular mycorrhizal fungi (AMFs) play a crucial role in enhancing rice growth and resilience under adverse conditions [35]. Despite this, comprehensive studies on AMFs within these soil types in Northeast China are currently lacking, highlighting the potential for significant research into the AMF community structure within these distinct environments. This study aims to explore the diversity of AMF in black and saline–sodic soils, identify key factors influencing AMF diversity, and delineate the commonalities and differences between these soil types.
Distinct AMF communities were observed in the black and saline–sodic soils of Northeast China, with Glomus emerging as the predominant genus in both, aligning with findings by Wang et al. [36]. Glomus exhibits superior adaptation to these environments compared to other genera, followed by Paraglomus. The study identified the relative abundance of Glomus as being higher in the heading stage than in the harvest stage in black soil (Figure 2D). The difference in Chao1 and Shannon indexes of the black soil and soda saline soil during the harvest and heading period, indicating that the diversity of AMF is closely linked to seasonal variations [37]. However, the relative abundance of Paraglomus in saline–sodic soil was higher that was in black soil at both harvest and heading stages (Figure 2), suggesting that different soil types can also affect the AMF distribution. Paraglomus, as the dominant AMF, may play a more crucial role in saline–sodic environments. This observation is consistent with studies showing that Paraglomus thrives in the rhizosphere of cotton in saline–alkali soils [38]. Moreover, the number of up-regulated genes in saline–sodic paddy soil was significantly higher than that in black paddy soil, indicating that AMFs play a greater role in saline soil.
Relevant studies showed that the densities of spores and the hyphae grown from spores are higher in summer and autumn than in spring and winter [39]. This study found that spore density in saline–sodic soil exceeded that in black soil at both the harvest and heading stages (Table 4), suggesting that rice in saline–sodic soil has a stronger association with AMFs. Nevertheless, spore production in AMF species does not occur simultaneously, contributing to seasonal variations in AMF communities [40,41]. AMF diversity is influenced not only by seasonal changes but also by soil physical and chemical properties, including pH, nitrogen, and phosphorus [42]. The Chao1 index of saline–sodic soil was significantly negatively correlated with pH, underscoring the critical role of soil pH in shaping AMF community composition [14,43,44]. During crop growth, AMF community diversity in both soils significantly correlates with TP content (p < 0.05). Moreover, the anaerobic conditions prevalent at the rice heading stage affect AMF growth, as AMF are aerobic fungi [45]. A significant positive correlation exists between the TN content of black and saline–sodic soils and Paraglomus, with TN levels peaking during the harvest stage. High TN content in the soil, which enhances plant growth, is a major factor influencing carbon availability in microbial biomass, thus augmenting the carbon sources available to AMF [46]. In the late harvest of Northeast black soil, differing physical and chemical factors impact AMF diversity, with soil type playing a pivotal role in shaping biomorphism and community structure characteristics [47].
In addition to improving the ability of plants to absorb nutrients and resist stress, AMFs also promote the formation of soil aggregates [30,48,49]. Among these, they secrete GRSP with excellent thermal stability and adhesion properties, which can enhance the formation of soil aggregates but also contribute to maintaining their stability; GRSP interacts closely with the soil carbon reservoir [30,48,49]. Consequently, AMFs play a crucial role in the ecological structure of both aboveground and underground environments. As soil microorganisms, increased AMF diversity leads to more active soil microorganisms, which is beneficial for the restoration of soil fertility [50]. GRSP is essential for exploring AMF functions [51], and both GRSP and AMF mycelia are vital in promoting soil improvement and fertilizer use, maintaining soil health, and ensuring sustainable productivity [52,53,54,55]. GRSP includes two forms: easily extracted glomalin-related soil protein (EE-GRSP) and total glomalin-related soil protein (T-GRSP) [30]. Previous studies have shown no correlation between GRSP concentration and AMF abundance [56,57]. However, this study identified a significant positive correlation between EE-GRSP and the relative abundance of Claroideoglomus and Acaulospora in black soil at the harvest stage, a relationship not observed at other times or places. This suggests that the correlation between AMF abundance and GRSP concentration warrants further extensive investigation. In this analysis, a significant positive correlation was only found between EE-GRSP and 0.053~0.25 mm aggregate content in the northeast black soil in the harvest stage (Figure 6A). EE-GRSP can promote the formation of soil aggregates and thus stabilize the soil structure. EE-GRSP content in saline soil is higher than in black soil, so AMFs function in saline–sodic soil. Their concentration declines from the late autumn harvest to the heading period, indicating that AMFs play a pivotal role in soil remediation at the harvest stage. Furthermore, the significant positive correlation between T-GRSP and pH during the harvest period can be attributed to the ease with which GRSP precipitates in acidic and neutral soils and dissolves in alkaline conditions [58]. The T-GRSP content was found to be higher in black soil than in saline–sodic soil, likely due to the greater nutrient richness of the former compared to the latter [59]. Additionally, there was a significant positive correlation between the 25 mm aggregate content and the relative abundance of Paraglomus and Archaeospora in black soil at the harvest stage. Conversely, in saline–sodic soil at the harvest stage, the 25 mm aggregate content positively correlated with the abundance of Glomus, and the 1~2 mm aggregate content was positively correlated with the abundance of Paraglomus (Figure 6B). Soil aggregate formation is closely related to the community and abundance of AMF [60].
An increasing number of studies have demonstrated significant variations in AMF diversity across different habitat conditions [61] and host plants [62]. Factors such as elevation, geographical environment, soil physicochemical properties, temperature, season, and land management practices all contribute to the diversity of AMF [63,64]. This study has elucidated the differences in AMF community composition and diversity between black soil and saline–sodic soil at the molecular level, providing a foundation for further research into AMF diversity and the enhancement of AMF resources. However, the specific factors driving these differences have not yet been fully identified, necessitating additional research to understand the factors influencing AMF diversity between black soil and saline–sodic soil.

5. Conclusions

In conclusion, Glomus was identified as the dominant AMF genus in both black and saline–sodic soils, with Paraglomus following as a secondary prevalent genus. In the heading stage, Paraglomus was particularly dominant in saline–sodic soil. The levels of easily extracted glomalin-related soil protein (EE-GRSP) and spore density were found to be higher in saline–sodic soil compared to black soil. Further, the functional genes of Rhizophagus intraradices were significantly more abundant in the heading stage of saline soil than in black soil, suggesting that R. intraradices plays a more pivotal role in saline environments. In black soil, EE-GRSP promoted the formation of 0.053~0.25 mm microparticles. AMF diversity varied across different sampling periods and was influenced by various soil factors. During rice growth, total phosphorus (TP) emerged as a critical factor influencing AMF diversity in both soil types, with excessive TP content notably reducing AMF diversity. An increase in total nitrogen (TN) content enhanced the relative abundance of Paraglomus. This study underscores the critical impact of AMF in enhancing the productivity of saline–sodic soils compared to black soils in paddy fields.

Author Contributions

L.H. and L.T. conceptualized and designed the experiment. D.J., J.L., C.Z., Y.Y., Y.S. and S.H. conducted the experiments. D.J. analyzed and visualized the data, and authored the original manuscript with contributions from L.H., L.T. and C.S. provided critical revisions. All authors have read and agreed to the published version of the manuscript.

Funding

This work was supported by the National Key Research and Development Program, China (No. 2022YFD1500201), the Key Projects of the Jilin Province Science and Technology Development Plan (20240303022NC), the Science and Technology Innovation Project of Black Soil Granary, China (No. XDA28020400 and XDA28080200), the National Natural Science Foundation of Jilin Province, China (No. YDZJ202201ZYTS472), and the Innovation Team Project of Northeast Institute of Geography and Agroecology, Chinese Academy of Sciences (No.2023CXTD02).

Data Availability Statement

The data presented in this study are available on request from the corresponding author.

Conflicts of Interest

The authors declare no conflict of interest.

References

  1. Bin Rahman, A.R.; Zhang, J. Trends in rice research: 2030 and beyond. Food Energy Secur. 2023, 12, e390. [Google Scholar] [CrossRef]
  2. Xinran, W. Analysis on the sustainable development of rice industry in Heilongjiang Province under the background of rural Revitalization. Shanxi Agric. Econ. 2025, 1, 195–197+220. (In Chinese) [Google Scholar] [CrossRef]
  3. Bing, H.; Chao, L.; Liang, Y.; Xiaoyang, W.; Dianyuan, C.; Guangbin, Y.; Zhenjiao, L. Analysis of Current Status and Development Strategies of Rice Seed Industry in Jilin Province. China Seed Ind. 2023, 12, 47–51+56. (In Chinese) [Google Scholar] [CrossRef]
  4. Fuyi, W. Analysis on Changes of Rice Planting in Liaoning Province. Agric. Sci. Technol. Equip. 2024, 04, 85–86. (In Chinese) [Google Scholar] [CrossRef]
  5. Chen, W.; Qi, W.; Yuan, F.; Li, Z. Comparative analysis of rice yield prediction in Jilin Province Based on time series and cross-sectional data. China Agric. Inf. 2018, 30, 91–101. [Google Scholar]
  6. Wang, S.; Huang, Y. Research progress on saline-alkali land improvement in Songnen Plain. Soils Crop 2023, 12, 206–217. [Google Scholar]
  7. Qadir, M.; Tubeileh, A.; Akhtar, J.; Larbi, A.; Minhas, P.; Khan, M. Productivity enhancement of salt-affected environments through crop diversification. Land Degrad. Dev. 2008, 19, 429–453. [Google Scholar] [CrossRef]
  8. Chen, B.D.; Yu, M.; Hao, Z.P.; Xie, W.; Zhang, X. Research progress in arbuscular mycorrhizal technology. Ying Yong Sheng Tai Xue Bao J. Appl. Ecol. 2019, 30, 1035–1046. [Google Scholar]
  9. Vosátka, M.; Látr, A.; Gianinazzi, S.; Albrechtová, J. Development of arbuscular mycorrhizal biotechnology and industry: Current achievements and bottlenecks. Symbiosis 2012, 58, 29–37. [Google Scholar] [CrossRef]
  10. Yang, M.; Guo, H.; Duan, G.; Wang, Z.; Fan, G.; Li, J. Role and mechanism of arbuscular mycorrhizal fungi in enhancing plant stress resistance and soil Improvement: A review. China Powder Sci. Technol 2024, 30, 164–172. [Google Scholar]
  11. Mathur, S.; Sharma, M.P.; Jajoo, A. Improved photosynthetic efficacy of maize (Zea mays) plants with arbuscular mycorrhizal fungi (AMF) under high temperature stress. J. Photochem. Photobiol. B Biol. 2018, 180, 149–154. [Google Scholar] [CrossRef] [PubMed]
  12. Zhu, X.; Cao, Q.; Sun, L.; Yang, X.; Yang, W.; Zhang, H. Stomatal conductance and morphology of arbuscular mycorrhizal wheat plants response to elevated CO2 and NaCl stress. Front. Plant Sci. 2018, 9, 410525. [Google Scholar] [CrossRef]
  13. Shao, Y.-D.; Zhang, D.-J.; Hu, X.-C.; Wu, Q.-S.; Jiang, C.-J.; Xia, T.-J.; Gao, X.-B.; Kuča, K. Mycorrhiza-induced changes in root growth and nutrient absorption of tea plants. Plant Soil Environ. 2018, 64, 283–289. [Google Scholar] [CrossRef]
  14. Huang, Z.; Zhao, F.; Wang, M.; Qi, K.; Wu, J.; Zhang, S. Soil chemical properties and geographical distance exerted effects on arbuscular mycorrhizal fungal community composition in pear orchards in Jiangsu Province, China. Appl. Soil Ecol. 2019, 142, 18–24. [Google Scholar] [CrossRef]
  15. Augé, R.M. Water relations, drought and vesicular-arbuscular mycorrhizal symbiosis. Mycorrhiza 2001, 11, 3–42. [Google Scholar] [CrossRef]
  16. Hodge, A.; Storer, K. Arbuscular mycorrhiza and nitrogen: Implications for individual plants through to ecosystems. Plant Soil 2015, 386, 1–19. [Google Scholar] [CrossRef]
  17. Garg, N.; Chandel, S. Effect of mycorrhizal inoculation on growth, nitrogen fixation, and nutrient uptake in Cicer arietinum (L.) under salt stress. Turk. J. Agric. For. 2011, 35, 205–214. [Google Scholar] [CrossRef]
  18. Bao, X.; Ma, Y.; Zou, J.; Wu, L.; Yang, T.; Huang, Q.; Zhang, B.; Chu, H. Research progress of arbuscular mycorrhizal fungi in paddy fields. Microbiol. China 2023, 50, 392–412. [Google Scholar]
  19. Cozzolino, V.; Di Meo, V.; Piccolo, A. Impact of arbuscular mycorrhizal fungi applications on maize production and soil phosphorus availability. J. Geochem. Explor. 2013, 129, 40–44. [Google Scholar] [CrossRef]
  20. Qian, S.; Xu, Y.; Zhang, Y.; Wang, X.; Niu, X.; Wang, P. Effect of AMF Inoculation on Reducing Excessive Fertilizer Use. Microorganisms 2024, 12, 1550. [Google Scholar] [CrossRef]
  21. Pang, F.; Li, Q.; Solanki, M.K.; Wang, Z.; Xing, Y.-X.; Dong, D.-F. Soil phosphorus transformation and plant uptake driven by phosphate-solubilizing microorganisms. Front. Microbiol. 2024, 15, 1383813. [Google Scholar] [CrossRef] [PubMed]
  22. Liu, R.; Liu, P.; Xu, K.; Lu, Z. Ecological distribution of AM bacteria in saline-alkali soil in China. J. Appl. Ecol. 1999, 10, 721. [Google Scholar]
  23. Yang, W. Arbuscular Mycorrhizal Fungal Diversity and Its Response to Soil Organic Carbon in the Black Soil Region of Northeast China. Ph.D. Thesis, University of Chinese Academy of Sciences, Changchun, China, 2022. (In Chinese). [Google Scholar]
  24. Bergen, M.; Koske, R. Vesicular-arbuscular mycorrhizal fungi from sand dunes of Cape Cod, Massachusetts. Trans. Br. Mycol. Soc. 1984, 83, 157–158. [Google Scholar] [CrossRef]
  25. Bainard, L.D.; Klironomos, J.N.; Gordon, A.M. Arbuscular mycorrhizal fungi in tree-based intercropping systems: A review of their abundance and diversity. Pedobiologia 2011, 54, 57–61. [Google Scholar] [CrossRef]
  26. Tian, L.; Wang, J.; Chen, H.; Li, W.; Tran, L.-S.P.; Tian, C. Integrative multi-omics approaches reveal that Asian cultivated rice domestication influences its symbiotic relationship with arbuscular mycorrhizal fungi. Pedosphere 2024, 34, 315–327. [Google Scholar] [CrossRef]
  27. Liu, H.; Chen, M.; Huang, Y.; Ren, J.; Fan, D.; Zhao, J. Diversity of arbuscular mycorrhizal fungi in the rhizosphere of tea plant from Anhui tea area, China. Chin. J. Appl. Ecol. 2017, 28, 2897–2906. [Google Scholar]
  28. Yang, Y.; Wu, F.; Chen, J.; Wu, Z.; Liu, L.; Zhang, D.; Ma, H.; Wu, J. Correlation between root rot of Camellia oleifera and arbuscular mycorrhizal fungi. Southwest China J. Agric. Sci. 2023, 36, 2426–2436. [Google Scholar]
  29. Bao, S. Soil Agrochemical Analysis; China Agriculture Press: Beijing, China, 2000. (In Chinese) [Google Scholar]
  30. Wright, S.F.; Upadhyaya, A. A survey of soils for aggregate stability and glomalin, a glycoprotein produced by hyphae of arbuscular mycorrhizal fungi. Plant Soil 1998, 198, 97–107. [Google Scholar] [CrossRef]
  31. Janos, D.P.; Garamszegi, S.; Beltran, B. Glomalin extraction and measurement. Soil Biol. Biochem. 2008, 40, 728–739. [Google Scholar] [CrossRef]
  32. Cambardella, C.; Elliott, E. Carbon and nitrogen distribution in aggregates from cultivated and native grassland soils. Soil Sci. Soc. Am. J. 1993, 57, 1071–1076. [Google Scholar] [CrossRef]
  33. Leng, C.-X.; Zheng, F.-Y.; Zhao, B.-P.; Liu, H.-Y.; Wang, Y.-J. Advances on alkaline tolerance of rice. Biotechnol. Bull. 2020, 36, 103. [Google Scholar]
  34. Li, B.; Liu, Z.; Huang, F.; Yang, X.; Liu, Z.; Wan, W.; Wang, J.; Xu, Y.; Li, Z.; Ren, T. Ensuring national food security by strengthening high-productivity black soil granary in Northeast China. Bull. Chin. Acad. Sci. (Chin. Version) 2021, 36, 1184–1193. [Google Scholar]
  35. Zhang, S.-H.; Mi, C.-X.; Yu, Y.-J.; Liu, G.-Q.; Zhu, C.-Q.; Tian, W.-H.; Zhu, L.-F.; Cao, X.-C.; Zhang, J.-H.; Kong, Y.-L. Physiological characteristics of arbuscular mycorrhizal fungi in alleviating saline alkali stress in rice. China Rice 2023, 29, 56. [Google Scholar]
  36. Wang, Y.; Fan, J.; Shi, Z. Molecular diversity of arbuscular mycorrhizal fungal in China. Microbiol. China 2018, 45, 2399–2408. [Google Scholar]
  37. He, X.; Geng, X.; Zhao, L.; Niu, K. Seasonal variation of AM fungal diversity in the rhizosphere of Lonicera japonica. Ecol. Environ. Sci. 2013, 22, 90–94. [Google Scholar]
  38. Chen, K.; Tian, Q.; Liu, Z.; Wang, H.; Xiong, J.; Lei, Y.; Sun, Y. Diversity of arbuscular mycorrhizal fungi in cotton rhizosphere soil in Shihezi and surrounding areas, Xinjiang. Cotton Sci. 2022, 34, 69–78. [Google Scholar]
  39. Oehl, F.; Sieverding, E.; Ineichen, K.; Maeder, P.; Wiemken, A.; Boller, T. Distinct sporulation dynamics of arbuscular mycorrhizal fungal communities from different agroecosystems in long-term microcosms. Agric. Ecosyst. Environ. 2009, 134, 257–268. [Google Scholar] [CrossRef]
  40. Marinho, F.; Oehl, F.; da Silva, I.R.; Coyne, D.; da Nobrega Veras, J.S.; Maia, L.C. High diversity of arbuscular mycorrhizal fungi in natural and anthropized sites of a Brazilian tropical dry forest (Caatinga). Fungal Ecol. 2019, 40, 82–91. [Google Scholar] [CrossRef]
  41. Wang, F.; Liu, R. Preliminary investigation of AM fungi in saline soil in the Yellow River Delta. Biodiversity 2001, 9, 389. [Google Scholar]
  42. Hazard, C.; Gosling, P.; Van Der Gast, C.J.; Mitchell, D.T.; Doohan, F.M.; Bending, G.D. The role of local environment and geographical distance in determining community composition of arbuscular mycorrhizal fungi at the landscape scale. ISME J. 2013, 7, 498–508. [Google Scholar] [CrossRef]
  43. Oehl, F.; Laczko, E.; Oberholzer, H.-R.; Jansa, J.; Egli, S. Diversity and biogeography of arbuscular mycorrhizal fungi in agricultural soils. Biol. Fertil. Soils 2017, 53, 777–797. [Google Scholar] [CrossRef]
  44. Miller, S.P.; Sharitz, R. Manipulation of flooding and arbuscular mycorrhiza formation influences growth and nutrition of two semiaquatic grass species. Funct. Ecol. 2000, 14, 738–748. [Google Scholar] [CrossRef]
  45. Zhou, D.; Sun, H.; Zhu, C.; Zhao, Z.; Zhou, S.; Wu, S. Effects of nitrogen level on rice yield, AMF infection status and soil traits in rhizosphere. Shanghai J. Agric. 2021, 37, 35–41. [Google Scholar] [CrossRef]
  46. Karasawa, T.; Ariharal, J.; Kasahara, Y. Effects of previous crops on arbuscular mycorrhizal formation and growth of maize under various soil moisture conditions. Soil Sci. Plant Nutr. 2000, 46, 53–60. [Google Scholar] [CrossRef]
  47. Oehl, F.; Laczko, E.; Bogenrieder, A.; Stahr, K.; Bösch, R.; van der Heijden, M.; Sieverding, E. Soil type and land use intensity determine the composition of arbuscular mycorrhizal fungal communities. Soil Biol. Biochem. 2010, 42, 724–738. [Google Scholar] [CrossRef]
  48. Wright, S.; Upadhyaya, A.; Buyer, J. Comparison of N-linked oligosaccharides of glomalin from arbuscular mycorrhizal fungi and soils by capillary electrophoresis. Soil Biol. Biochem. 1998, 30, 1853–1857. [Google Scholar] [CrossRef]
  49. Agnihotri, R.; Sharma, M.P.; Prakash, A.; Ramesh, A.; Bhattacharjya, S.; Patra, A.K.; Manna, M.C.; Kurganova, I.; Kuzyakov, Y. Glycoproteins of arbuscular mycorrhiza for soil carbon sequestration: Review of mechanisms and controls. Sci. Total Environ. 2022, 806, 150571. [Google Scholar] [CrossRef]
  50. Li, S.; Chen, P.; Liu, H.; Hao, J.; Zhou, W.; Shi, L. Mechanism and Ecological Effects of Arbuscular Mycorrhizal Fungi on Improving Salt Tolerance of Plants in Coastal Saline-alkaline Land. Ecol. Environ. Sci. 2019, 28, 411–418. [Google Scholar]
  51. Wang, J.; Zhou, Z.; Ling, W. Distribution and environmental function of glomalin-related soil protein: A review. Ying Yong Sheng Tai Xue Bao J. Appl. Ecol. 2016, 27, 634–642. [Google Scholar]
  52. Tang, H.-L.; Liu, L.; Wang, L.; Ba, C.-J. Effect of land use type on profile distribution of glomalin. Chin. J. Eco-Agric. 2009, 17, 1137–1142. [Google Scholar] [CrossRef]
  53. Lovelock, C.E.; Wright, S.F.; Clark, D.A.; Ruess, R.W. Soil stocks of glomalin produced by arbuscular mycorrhizal fungi across a tropical rain forest landscape. J. Ecol. 2004, 92, 278–287. [Google Scholar] [CrossRef]
  54. Rillig, M.C.; Wright, S.F.; Eviner, V.T. The role of arbuscular mycorrhizal fungi and glomalin in soil aggregation: Comparing effects of five plant species. Plant Soil 2002, 238, 325–333. [Google Scholar] [CrossRef]
  55. QF, W.; Xie, G.; Wang, J. The stability of organic carbon and aggregates of three limestone soils in the Western Zhejiang. Chin. J. Soil Sci. 2018, 49, 567–574. [Google Scholar]
  56. Schindler, F.V.; Mercer, E.J.; Rice, J.A. Chemical characteristics of glomalin-related soil protein (GRSP) extracted from soils of varying organic matter content. Soil Biol. Biochem. 2007, 39, 320–329. [Google Scholar] [CrossRef]
  57. Whiffen, L.K.; Midgley, D.J.; McGee, P.A. Polyphenolic compounds interfere with quantification of protein in soil extracts using the Bradford method. Soil Biol. Biochem. 2007, 39, 691–694. [Google Scholar] [CrossRef]
  58. Singh, A.K.; Rai, A.; Pandey, V.; Singh, N. Contribution of glomalin to dissolve organic carbon under different land uses and seasonality in dry tropics. J. Environ. Manag. 2017, 192, 142–149. [Google Scholar] [CrossRef]
  59. Gałązka, A.; Niedźwiecki, J.; Grządziel, J.; Gawryjołek, K. Evaluation of changes in Glomalin-Related Soil Proteins (GRSP) content, microbial diversity and physical properties depending on the type of soil as the important biotic determinants of soil quality. Agronomy 2020, 10, 1279. [Google Scholar] [CrossRef]
  60. Wilson, G.W.; Rice, C.W.; Rillig, M.C.; Springer, A.; Hartnett, D.C. Soil aggregation and carbon sequestration are tightly correlated with the abundance of arbuscular mycorrhizal fungi: Results from long-term field experiments. Ecol. Lett. 2009, 12, 452–461. [Google Scholar] [CrossRef]
  61. Hood, L.; Swaine, M.D.; Mason, P. The influence of spatial patterns of damping-off disease and arbuscular mycorrhizal colonization on tree seedling establishment in Ghanaian tropical forest soil. J. Ecol. 2004, 92, 816–823. [Google Scholar] [CrossRef]
  62. Kiers, E.T.; Lovelock, C.E.; Krueger, E.L.; Herre, E.A. Differential effects of tropical arbuscular mycorrhizal fungal inocula on root colonization and tree seedling growth: Implications for tropical forest diversity. Ecol. Lett. 2000, 3, 106–113. [Google Scholar] [CrossRef]
  63. Xu, X.; Chen, C.; Zhang, Z.; Sun, Z.; Chen, Y.; Jiang, J.; Shen, Z. The influence of environmental factors on communities of arbuscular mycorrhizal fungi associated with Chenopodium ambrosioides revealed by MiSeq sequencing investigation. Sci. Rep. 2017, 7, 45134. [Google Scholar] [CrossRef] [PubMed]
  64. Luo, Y.; Wang, Z.; He, Y.; Li, G.; Lv, X.; Zhuang, L. High-throughput sequencing analysis of the rhizosphere arbuscular mycorrhizal fungi (AMF) community composition associated with Ferula sinkiangensis. BMC Microbiol. 2020, 20, 335. [Google Scholar] [CrossRef] [PubMed]
Figure 1. The rarefaction curves for the harvest stage (A) and heading stage (B). CSDA denotes the saline–sodic soil of Da’an at the heading stage, CSQA denotes the saline–sodic soil of Qian’an at the rice heading stage, CSHT1 and CSHT2 represent the first and second samples of black soil at the heading stage, respectively. QSDA and QSQA indicate saline–sodic soil from Da’an and Qian’an at the harvest stage, while QSHT1 and QSHT2 represent the first and second samples of black soil at the harvest stage, respectively.
Agriculture 15 00951 g001
Figure 2. The relative abundance analysis of various microorganisms (A) and the overall microbial community (B) in black and saline–sodic soils at the harvest and heading stages; analysis of differences in microbial communities (C) and the overall comparison of black soil and saline–sodic soil (D) across both periods. CS, the heading stage; QS, the harvest stage; HT, the black soil; YJ, the saline–sodic soil; CSDA, the saline–sodic soil of Da’an at the heading stage; CSQA, the saline–sodic soil of Qian’an at the rice heading stage. CSHT1 and CSHT2 represent the first and second samples of black soil at the heading stage, respectively. QSDA and QSQA indicate saline–sodic soil from Da’an and Qian’an at the harvest stage, while QSHT1 and QSHT2 represent the first and second samples of black soil at the harvest stage, respectively. Different letters above the bars indicate significant differences among samples at p < 0.05.
Agriculture 15 00951 g002
Figure 3. The α-diversity indices for northeast black soil and saline–sodic soil paddy fields at the harvest and heading stages (AF); Principal Coordinates Analysis (PCoA) comparing black and saline–sodic soils at the harvest (G) and heading stages (H); linear discriminant analysis effect size (LefSe) illustrating differences between black soil and saline–sodic soil at the harvest (I) and heading stages (J). For abbreviations details, kindly refer to the caption of Figure 2. Different letters above the bars indicate significant differences among samples at p < 0.05.
Agriculture 15 00951 g003
Figure 4. The functional genes of Rhizophagus intraradices in the black soil group and the saline–sodic soil group at the heading (A) and harvest stages (B).
Agriculture 15 00951 g004
Figure 5. Redundancy analysis (RDA) of α-diversity indices and physicochemical factors in the black soil group and saline–sodic soil group at the harvest and heading stages. Specific panels include the black soil group at the harvest stages (A), the saline–sodic soil group at the harvest stages (B), the black soil group at the heading stage (C), and the saline–sodic soil group at the heading stage (D). OM: soil organic matter; TN: total nitrogen; NH4+-N: ammonium nitrogen; NO3-N: nitrate nitrogen; TP: total phosphorus; AP: available phosphorus; EC: electrical conductivity; AK: available potassium.
Agriculture 15 00951 g005
Figure 6. Heatmap depicting the interactive correlations between horizontal abundance, physicochemical properties, GRSP, and aggregate within the black soil group and saline–sodic soil group across the harvest and heading stages. Panels include the black soil group at the harvest stage (A), the saline–sodic soil group at the harvest stage (B), the black soil group at the heading stage (C), and the saline–sodic soil group at the heading stage (D). OM: soil organic matter; TN: total nitrogen; NH4+-N: ammonium nitrogen; NO3-N: nitrate nitrogen; TP: total phosphorus; AP: available phosphorus; EC: electrical conductivity; AK: available potassium; EE-GRSP: easy extraction of glomalin-related soil protein; T-GRSP: the total glomalin-related soil protein.
Agriculture 15 00951 g006
Table 1. High-throughput sequencing data of black soil and soda saline soil at the harvest and heading stages. DA represents soda saline soil in Da’an; QA represents soda saline soil in Qian’an; HT1 represent the first black soil; HT2 represent the second black soil.
SampleLate Autumn HarvestHeading Period
Number of Original SequencesNumber of Effective SequencesOTUNumber of Original SequencesNumber of Effective SequencesOTU
DA76,97759,845151295,34077,8121871
QA77,48163,450126689,72577,7901292
HT165,56851,749130593,17872,1142310
HT259,87645,986151299,92978,4312510
Total279,902221,0305595378,172306,1477983
Table 2. Physical and chemical indexes of black soil and soda saline soil at the harvest stage. DA represents soda saline soil in Da’an; QA represents soda saline soil in Qian’an; HT1 represents the first black soil; and HT2 represents the second black soil. Different letters above the bars indicate signifcant differences among samples at p < 0.05.
UnitHT1HT2DAQA
NH4+-Nmg/kg7 ± 2.12 a7.58 ± 1.16 a36.57 ± 7.88 a30.56 ± 22.51 a
NO3-Nmg/kg65.44 ± 28.68 a26.23 ± 2.08 a24.67 ± 4.14 a50.3 ± 31.97 a
TNmg/kg358.76 ± 40.22 b695.98 ± 35.42 a160.5 ± 10.16 c292.69 ± 12.93 b
TPmg/kg637.66 ± 56.36 a597.86 ± 18.38 a265.52 ± 16.02 b315.75 ± 16.67 b
AKmg/kg226.46 ± 21.90 a199.73 ± 15.49 ab196.06 ± 1.92 ab150.18 ± 14.68 b
OM%1.81 ± 0.33 b2.88 ± 0.28 a0.92 ± 0.03 c1.25 ± 0.045 bc
APmg/kg65.53 ± 1.56 a36.63 ± 4.28 b28.37 ± 1.03 b15.94 ± 5.46 c
ECus/cm815 ± 104.84 ab646 ± 95.63 b1187.67 ± 200.11 a880.67 ± 145.48 ab
pH 6.69 ± 0.07 c7.11 ± 0.07 b7.51 ± 0.04 a7.51 ± 0.1 a
Note: OM: soil organic matter; TN: total nitrogen; NH4+-N: ammonium nitrogen; NO3-N: nitrate nitrogen; TP: total phosphorus; AP: available phosphorus; EC: electrical conductivity; AK: available potassium.
Table 3. Physical and chemical indexes of black soil and soda saline soil at the heading stage. DA represents soda saline soil in Da’an; QA represents soda saline soil in Qian’an; HT1 represents the first black soil; HT2 represents the second black soil. Different letters above the bars indicate signifcant differences among samples at p < 0.05.
UnitHT1HT2DAQA
NH4+-Nmg/kg2.83 ± 0.35 a1.83 ± 0.07 b2.34 ± 0.25 ab2.4 ± 0.16 ab
NO3-Nmg/kg7.64 ± 5.42 a6.94 ± 3.24 a5.19 ± 1.10 a3.5 ± 1.10 a
TNmg/kg1153 ± 43.05 b1536.25 ± 137.07 a823.83 ± 47.38 c740.74 ± 28.99 c
TPmg/kg640.83 ± 22.64 a561.5 ± 30.08 b317.68 ± 5.38 c264.3 ± 4.09 c
AKmg/kg216.67 ± 9.73 a155.6 ± 3.98 b172.16 ± 6.91 b152.67 ± 3.33 b
OM%2.71 ± 0.14 b3.43 ± 0.13 a1.64 ± 0.06 c1.41 ± 0.04 c
APmg/kg112.69 ± 2.05 a92 ± 1.42 b87.12 ± 1.21 b73.56 ± 039 c
ECus/cm927.5 ± 143.35 ab358.75 ± 78.78 c760 ± 71.74 bc1205.6 ± 149.96 a
pH 6.34± 0.27 c7.76 ± 0.02 b7.51 ± 0.14 b8.39 ± 0.13 a
Note: OM: soil organic matter; TN: total nitrogen; NH4+-N: ammonium nitrogen; NO3-N: nitrate nitrogen; TP: total phosphorus; AP: available phosphorus; EC: electrical conductivity; AK: available potassium.
Table 4. Glomalin-related soil protein and spore density of black soil and soda saline soil at the harvest and heading stages. DA represents soda saline soil in Da’an; QA represents soda saline soil in Qian’an; HT1 represents the first black soil; HT2 represents the second black soil. Different letters above the bars indicate signifcant differences among samples at p < 0.05.
Different StageIndexHT1HT2DAQA
Heading stageEE-GRSP (mg/g)0.25 ± 0.11 b0.53 ± 0.60 ab0.8 ± 0.03 a0.66 ± 0.22 ab
T-GRSP (mg/g)1.24 ± 0.69 b2.3 ± 0.68 a1.2 ± 0.34 c2.3 ± 0.55 c
SD (spores/g)5.67 ± 0.33 c8.67 ± 2.89 bc17.67 ± 3.18 a10.33 ± 1.33 bc
Harvest stageEE-GRSP (mg/g)1.33 ± 0.13 b4.16 ± 1.72 a5.3 ± 0.89 a5.11 ± 0.02 a
T-GRSP (mg/g)9.27 ± 0.77 b17.41 ± 2.38 a7.7 ± 0.97 b9.85 ± 1.06 b
SD (spores/g)5.67 ± 0.33 c8.33 ± 1.2 bc13 ± 2.08 ab9.33 ± 3.18 bc
Note: EE-GRSP: easy extraction of glomalin-related soil protein; T-GRSP: the total glomalin-related soil protein; SD: spore density.
Disclaimer/Publisher’s Note: The statements, opinions and data contained in all publications are solely those of the individual author(s) and contributor(s) and not of MDPI and/or the editor(s). MDPI and/or the editor(s) disclaim responsibility for any injury to people or property resulting from any ideas, methods, instructions or products referred to in the content.

