Article

Innovative Techniques for Managing Dollar Spot in Warm- and Cool-Season Turfgrasses: The Case of UV-B and UV-C Irradiations

Department of Agriculture, Food and Environment, University of Pisa, Via del Borghetto 80, 56124 Pisa, Italy
*
Author to whom correspondence should be addressed.
Agriculture 2025, 15(7), 784; https://doi.org/10.3390/agriculture15070784
Submission received: 12 March 2025 / Revised: 31 March 2025 / Accepted: 3 April 2025 / Published: 5 April 2025
(This article belongs to the Section Crop Protection, Diseases, Pests and Weeds)

Abstract

:
The management of Dollar spot, the fungal disease of turfgrasses, is complicated and, today, tends to include new eco-friendly approaches. The aim of this study is to evaluate the effect of UV-B and UV-C lamps against the infection of Clarireedia species in warm- and cool-season turfgrasses. In vitro tests were performed to evaluate the growth of C. jacksonii mycelium on Potato Dextrose Agar, irradiated with UV-B and UV-C at heights of 5 and 15 cm, 5 s per day for three consecutive days. The same treatments, prolonged for seven days, were applied on naturally infected potted Agrostis stolonifera and Cynodon dactylon × C. transvaalensis, for in vivo tests. Disease severity, antioxidant capacity, and pigment content were assessed at the end of the experiment. Only UV-C reduced the growth of C. jacksonii after 48 h at 5 cm (−36%) and 72 h at both distances (−15 and −27%). Agrostis stolonifera showed symptoms, reduced by UV-C at 5 cm, and fungal structures, except in UV-C exposed samples. Total antioxidant capacity increased after UV-B exposure at 5 cm (+10%). No variations in terms of photosynthetic pigments were observed. These results confirm the potential of UV-C lamps for the containment of Dollar spot.

1. Introduction

Turfgrass has been adopted for centuries in recreational contexts and represents a significant economic asset worldwide [1,2]. In the United States, turfgrass occupies an estimated area exceeding 8.1 million hectares (including home lawns, golf courses, athletic fields, roadsides, parks, and school gardens), making it the third largest agricultural crop by acreage nationwide [3,4]. Across various landscapes and roles, users display a marked preference for turfgrasses with elevated aesthetic/ornamental value and immaculate appearance [5]. Consequently, high expectations in turfgrass appearance and playability require diligent management, including the control of diseases [6].
Dollar spot, caused by Clarireedia species (formerly an ascomycete filamentous fungus Sclerotinia homoeocarpa F.T. Bennet), is one of the most economically destructive diseases affecting all cultivated warm- and cool-season turfgrass species [7,8,9,10]. Specifically, the genus Clarireedia includes six distinct phylogenetically pathogenic species responsible for Dollar spot disease [8,10,11,12]. Their coexistence in the same regions makes these pathogens particularly difficult to manage and/or control [13,14]. Symptoms include the development of lesions on affected leaves that consist firstly of single or multiple chlorosis, which may turn white or tan in colour. As the disease progresses, patches may appear white or straw-coloured, with sunken spots sized from 3 to 5 cm (in diameter) in low-cut turfgrass or from 15 to 30 cm in higher cut turfgrass [15]. Infection and symptom development are favoured by high humidity (especially for extended long periods), warm humid days, and cool nights with consequent dew formations, which contribute to a cottony or spider web-like growth of mycelium [16]. Dollar spot significantly compromises turfgrass quality by reducing its aesthetic appearance and playability. Its impact is particularly severe in sports turfs, which often need effective disease management practices to meet user’s expectations [9,17].
Several strategies, including resistant breeding and cultural practices (i.e., proper use of nitrogen, good irrigation management, and sufficient air circulation) can effectively reduce disease severity [8]. However, chemical control represents the most effective method to control Dollar spot. Repeated and frequent applications of systemic fungicides are required to maintain acceptable turf quality (especially in intensely managed areas such as golf course putting greens) [6]. Despite several products being available for Dollar spot control, the frequent fungicide applications may lead to the selection of Clarireedia strains with reduced sensitivity by increasing the risk of disease outbreaks and decreasing the disease control effectiveness [18]. In addition, the rising costs of fungicides for managing Dollar spot disease, coupled with the European Union’s strict restrictions on chemical products (many of them are not approved for use worldwide or their use is forbidden in areas used by the public) have recently intensified the need for alternative and eco-friendly control strategies [15].
Recent progress in non-invasive and non-chemical methods has investigated the application of ultraviolet (UV) radiation for disease management and pathogen control. Ultraviolet light can reduce the infection pressure of plant pathogens with two main modes of action being involved: a process analogous to surface sterilization and an enhancement of plant resistance to microorganisms [19]. UV-B (280–315 nm) and UV-C (200–280 nm) wavebands seem the most promising for horticulture applications; however, little is known about the overall effect on disease management and plant–microbe interactions need to be evaluated on a species and cultivation basis. UV-B radiation, which accounts for approximately 5% of the total UV radiation reaching the Earth’s surface, is largely filtered by the ozone (O3) layer in the high atmosphere. Due to its high energy, UV-B has a strong impact on plants at a physiological, biochemical, and molecular level [20,21]. Several studies (few of them were carried out on turfgrass) have documented the ability of UV-B radiation to enhance plant disease resistance by promoting the biosynthesis of secondary metabolites, strengthening cell walls, and activating defence-related enzymes [22,23,24,25,26,27]. In addition, UV-B can induce fluorescence or photochemical responses in fungal structures and/or infected tissues by enabling the identification of infected areas before the appearance of visible injuries. On the other hand, UV-C radiation, which is entirely shielded by the O3 layer, is highly absorbed by DNA and can induce various forms of DNA damage, such as the formation of pyrimidine dimers, which in turn disrupt microbial cell replication [28]. UV-C radiation has been reported to elicit plant defence responses by upregulating the production of secondary metabolites, as well as by enhancing the activity of antioxidant enzymes, and increasing the expression of phenylpropanoid-related genes [29,30,31,32]. UV-C, different from UV-B radiation, has a dual action in plant defence stimulation and in pathogen inactivation, as an attractive eco-friendly tool for plant disease management [33]. Although studies have examined the effectiveness and feasibility of UV-C irradiation for phytosanitary treatments, little is known about its effects on the physiology and anatomy of turfgrass species, particularly those cultivated under high-intensity management regimes [34]. In addition, it is worth noting that the efficacy of UV-B and UV-C treatments depends on several factors including irradiance, exposure duration, and the timing of application relative to pathogen infection [20,21,35]. Despite these advances, research on UV-B and UV-C effects on turfgrasses and specifically for controlling Dollar spot disease is scarce.
The aims of the present work are to determine the direct effect of UV-B and UV-C light on Dollar spot and to assess the biochemical plant response involved in the plant–pathogen interaction. To achieve this, the same UV treatments have been applied in vitro to the mycelium of C. jacksonii and in vivo to naturally infected turfgrasses. Ultraviolet treatments applied in controlled conditions have been set to simulate a field application with maintenance equipment (e.g., machines equipped with the UV lamps).

2. Materials and Methods

2.1. Experimental Design, Plant, and Fungal Material

Experimental activities were conducted at the Department of Agriculture, Food, and Environment (DAFE) of the University of Pisa, San Piero a Grado, Tuscany, Italy (43°42′42″ N, 10°24′45″ E, 5 m a.s.l.), starting from June 2023. Plant material consisted of two turfgrass species: creeping bentgrass (A. stolonifera L. var. ‘Penncross’) and hybrid bermudagrass (Cynodon dactylon × Cynodon transvaalensis Burt Davy var. ‘Tahoma 31’). Sod samples purchased from a local nursery were placed in plastic bowls (Ø 14 cm; n = 12 for each species) containing a silt loam soil (28% sand, 55% silt, 17% clay, 18 g kg−1 of organic matter, pH 7.8) and maintained at field capacity in a greenhouse. Preliminary tests, consisting of signs and symptom observations, as well as fungal isolation and growth on Potato Dextrose Agar (PDA; 42 g L−1, Biolife Italiana, Milan, Italy), confirmed the presence of natural Clarireedia spp. inoculum.
Clarireedia jacksonii, purchased from an Italian fungal collection, was grown in Petri dishes (Ø 14 cm) containing PDA (42 g L−1) amended with streptomycin sulphate (0.1 g L−1, Gold Biotechnology, St. Louis, MO, USA) for 7 days at 23 °C, 12 h photoperiod. Specifically, at least 20 replicates were prepared for each in vitro treatment by placing a plug (Ø 0.6 cm) of C. jacksonii in the middle of Petri dishes containing PDA.

2.2. UV Treatments

Irradiation tests were carried out in growth chambers maintained at 22 °C and 70% of relative humidity (RH). The chambers were equipped with LED lighting systems that provided a mix of blue and red light in a 1:2 ratio, supplemented with 10% green light (C-LED, Imola, Italy). This setup delivered photosynthetically active radiation (PAR) at a photosynthetic photon flux density (PPFD) of 228 μmol m−2 s−1. UV treatments were conducted using either UV-B (TL 20W/013RS, Koninklijke Philips Electronics, Eindhoven, Netherlands; 311 nm emission peak, 5 nm half bandwidth) or UV-C (TUV T8, Koninklijke Philips Electronics; 254 nm emission peak, 5 nm half bandwidth) lamps. A separate chamber, used as the control (CTR), was equipped with identical PAR lighting and UV lamps. However, the UV lamps were shielded by plastic barriers to prevent UV-B or UV-C exposure.
UV treatments were applied to cultures of C. jacksonii on Petri dishes and to naturally inoculated turfgrasses placing the lamps at heights of 5 and 15 cm above the material. UV irradiances and doses were applied and measured using the spectrometer (Ocean Insight, Ostfildern, Germany) with fibre optics (QP400-1-UV-BX; Ocean Insight) and cosine corrector (CC-3-UV-S; Ocean Insight), reported in Table 1. The setups included six configurations: CTR at 5 cm, CTR at 15 cm, UV-B at 5 cm, UV-B at 15 cm, UV-C at 5 cm, and UV-C at 15 cm. For each treatment condition and each turfgrass species, three circular plastic bowls (Ø 14 cm) containing the plant material were treated. Each UV exposure lasted 5 s per day. Treatments were conducted over 3 consecutive days for fungal plates and extended to 7 consecutive days for naturally inoculated turfgrasses. At the end of the treatment, a pooled sample of leaves from different areas of the circular container was collected for each replicate (n = 3), frozen in liquid nitrogen, stored at −20 °C, and lyophilized before the analyses (Telstar LyoQuest-55 freeze dryer, Terrassa, Spain). The distances between the UV lamps and the turfgrasses, as well as the duration of the UV treatments, were selected to realistically replicate the operating conditions of an automated lawn mower equipped with UV lamps, ensuring that the treatments are applicable in field conditions. Disease severity was calculated as percentage of infected area of the total turf surface in each sod sample and, when visible, fungal propagules were collected from infected leaves and directly placed on Petri dishes containing PDA, stored for a week at 23 °C and a 12 h photoperiod. If the mycelium was not macroscopically visible, leaves were disinfected in sodium hypochlorite (0.5% v/v for 5 min), rinsed with sterile water, placed on PDA and maintained at the same conditions.

2.3. Dark Green Colour Index Determination

The Red-Green-Blue (RGB) values of the visible images acquired (by using a camera) at the beginning and at the end of the trials were first converted into Hue, Saturation, and Brightness (HSB) values by using GIMP software 2.10.34. The Dark Green Colour Index (DGCI) has been calculated on a scale from 0 (very yellow) to 1 (dark green), according to Karcher and Richardson [36], as follows:
DGCI = [((Hue − 60)/60 + (1 − (Saturation)) + (1 − Brightness))]/3.
Images were taken with auto-focus, auto-white balance, and an automatic exposure, and they were saved in Joint Photographic Experts Group (JPEG) format. Subsequently, images were analyzed with the open-source Quantum GIS 2.18 software 2018 to extract the RGB values of the pixels.

2.4. Extraction and Determination of Antioxidant Activity on Plant Material

The aqueous extract used for the antioxidant assays was obtained from 50 mg of freeze-dried samples following the method outlined by [37]. Samples were kept in darkness throughout all extraction and analysis steps to prevent potential oxidation and degradation. Extraction was conducted using 1.5 mL of 80% methanol (Sigma-Aldrich, Merck KGaA, Darmstadt, Germany) and samples were subjected to sonication for 30 min (Branson 3510 ultrasonic cleaner, Branson Ultrasonics, Danbury, CT, USA). The mixture was then stirred for an additional 30 min (BioSan Thermo-Shaker TS-100C, Biosan, Riga, Latvia), centrifuged for 15 min (4 °C; 14,000× g; MPW 260R, MPW Med. Instruments, Warsaw, Poland), and the resulting supernatant was collected and stored at 4 °C. The remaining pellet underwent a second extraction with 1 mL of 80% methanol, and the resulting supernatants from both extractions were combined and kept at 4 °C until being used for antioxidant analyses. The total antioxidant activity was assessed using the 2,2-azinobis (3-ethylbenzothiazoline-6-sulfonic acid; ABTS; Sigma-Aldrich, Merck KGaA, Darmstadt, Germany) and the 2,2-diphenyl-1-picrylhydrazyl (DPPH; Sigma-Aldrich, Merck KGaA, Darmstadt, Germany) radical scavenging assays [38,39]. For the ABTS assay, absorbance was measured at 734 nm by using an Ultrospec 2100 pro-UV–vis spectrophotometer (Amersham Biosciences, Amersham, UK), and antioxidant activity was expressed as μmol of Trolox equivalent antioxidant capacity (TEAC) per gram of fresh weight (FW). For the DPPH assay, absorbance was read at 517 nm (with the same spectrophotometer reported above), with the antioxidant activity reported as μmol of Trolox equivalent per gram of FW. The analyses were performed on three biological replicates, with three technical replicates conducted for each. Standard calibration curves were constructed using commercial Trolox (Sigma-Aldrich Chemical, St. Louis, MO, USA) for both methods.

2.5. Extraction and Quantification of Photosynthetic Pigments

Pigment extraction was performed by weighing 30 mg of freeze-dried samples and adding 1 mL of 80% (v/v) ice-cold acetone (Sigma-Aldrich, Merck KGaA, Darmstadt, Germany). The mixture, kept in darkness to prevent potential oxidation and degradation of photosynthetic pigments, was vortexed for 30 s and incubated at 4 °C for 30 min. Subsequently, the sample was centrifuged at 12,000× g for 15 min at 4 °C and the supernatant was collected. The pellet was resuspended in 1 mL of pure ice-cold acetone, vortexed, incubated at 4 °C, and centrifuged again under the same conditions. The supernatants from the two extractions were combined, yielding a final volume of 2 mL. The resulting extract was filtered through a PTFE syringe filter (0.22 μm) and transferred into amber vials for High Performance Liquid Chromatography (HPLC; Thermo Fisher Scientific, Waltham, MA, USA) analysis. Identification and quantification of photosynthetic pigments were carried out via HPLC (Vanquish™ Core HPLC System equipped with Diode Array Detector CG, Thermo Fisher Scientific, Waltham, MA, USA) following the protocol described by [40]. The HPLC separation was conducted at 20 °C using a Phenomenex Prodigy LC-18RP column (5 μm particle size, 250 × 4.6 mm; Phenomenex Italia, Castel Maggiore, Italy). Pigments were eluted using 100% solvent A (acetonitrile/methanol, 75:25 v/v) for the first 12 min to separate lutein. This was followed by a 2 min linear gradient to 100% solvent B (methanol/ethyl acetate, 68:32 v/v) and a subsequent 12 min isocratic phase with solvent B to elute chlorophyll (Chl) b, Chl a, and β-carotene. The process concluded with a 4 min linear gradient back to 100% solvent A. The column was equilibrated in 100% solvent A for 2 min before the next injection. The flow rate was maintained at 1 mL min−1. The analyses were performed on three biological replicates, with three technical replicates conducted for each. The quantification of pigments was performed by measuring absorbance at 450 nm. Standard curves were generated using commercial standards of lutein, Chls, and β-carotene (Sigma-Aldrich, Milan, Italy).

2.6. Statistical Analysis

Firstly, normal distribution of the obtained data was evaluated with the Shapiro–Wilk test. The effect of “treatment” (i.e., lamp irradiations), “time”, and “distance” was assessed on in vitro mycelium growth by three-way analysis of variance (ANOVA), followed by Tukey’s post hoc test. Effects of “treatment” and “distance” on disease severity, DGCI ratio, antioxidant capacity, and photosynthetic pigment concentrations of the two turfgrass species (creeping bentgrass and hybrid bermudagrass), were evaluated by two-way ANOVA followed by Tukey’s post hoc test. A canonical discriminant analysis (CDA) was performed considering individual replicates to evaluate the overall effect and differences among the experimental groups based on both biochemical parameters [ABTS, DPPH, Chls and carotenoids (Car) concentrations, and related indices], disease severity, and DGCI values. Following this, a Pearson’s correlation analysis was conducted to identify which variables contributed most significantly to group separation. Pearson’s correlation coefficients were calculated between individual variables and the scores of the first and second canonical functions, which explained 66.6 and 22.8% of the total variance, respectively. Statistics were performed at a significance level of 0.05 (p < 0.05) and data are expressed as mean ± standard error. Statistical analyses were performed using JMP software (JMP®, Version 16, SAS Institute, Cary, NC, USA).

3. Results

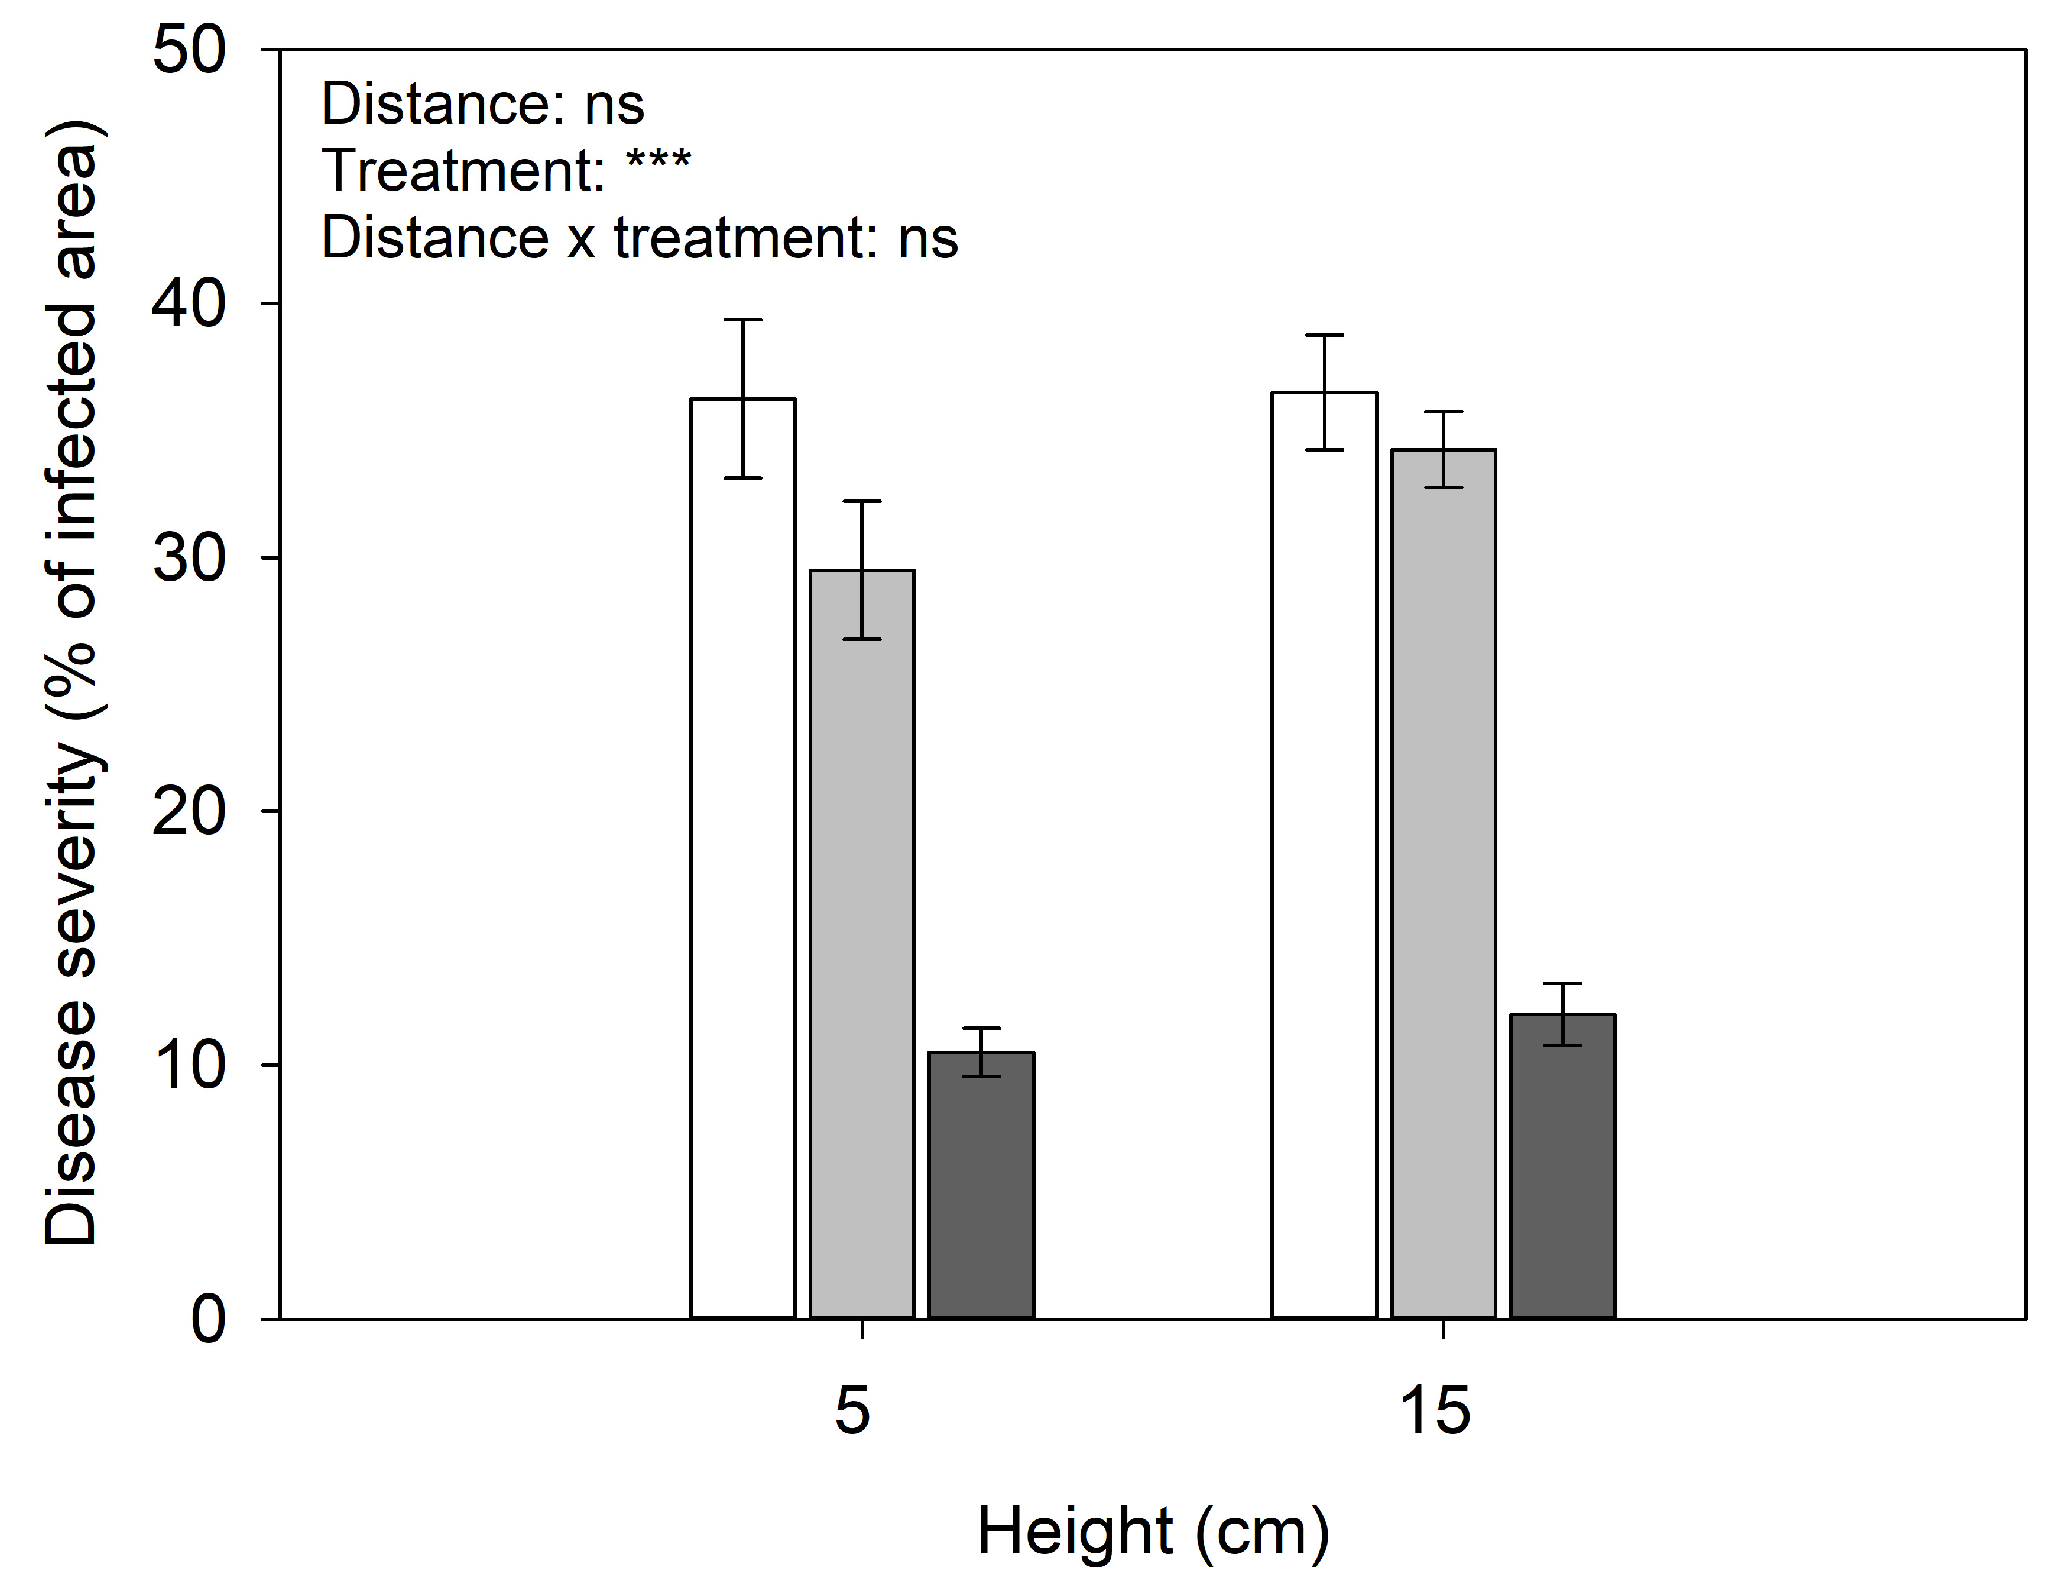
3.1. Evaluation of In Vitro and In Vivo Treatments

An in vitro test conducted on C. jacksonii cultures showed that the mycelium (Figure 1, Table S1) grew regularly, independently from the treatment and the distance from the lamps. No significant differences were observed after the UV-B irradiation at 5 and 15 cm (regardless of timing after the inoculation). At 48 h, fungal growth was statistically reduced only after UV-C irradiation at 5 cm (−36%, in comparison to the relative control), even if a similar trend was observed after the UV-C irradiation at 15 cm. At 72 h, C. jacksonii mycelium reached the edge of Petri dishes exposed to PAR and UV-B irradiation, regardless of the distance from the lamps. Conversely, UV-C lamps induced a moderate slowing growth again at 5 and 15 cm (−27 and −15%, respectively, in comparison to the respective controls).
At the end of the experiment, creeping bentgrass plants (Figure 2) naturally inoculated with Clarireedia spp. and exposed to PAR and UV-B lamps at 5 and 15 cm showed chlorosis and wilting in the sod samples, with a percentage of infected area ranging around 35%, on average. On the top of infected leaves, a floccose and hyaline mycelium was observed (Figure S1). In UV-C-exposed creeping bentgrass material, symptoms appeared restrained (−70%, in comparison to CTR and UV-B exposed plants), regardless of the distance from the lamps, and fungal structures did not develop.
In hybrid bermudagrass, visible injuries associated with Dollar spot were not easily assessable and differences among the different treatments were not noticed. Mycelium of Clarireedia spp. was easily reisolated from CTR and UV-B exposed turfgrasses and grown in vitro (Figure S1). The presence of fewer fungal propagules did not allow us to easily reisolate the Dollar spot causal agent(s) from UV-C exposed leaves.

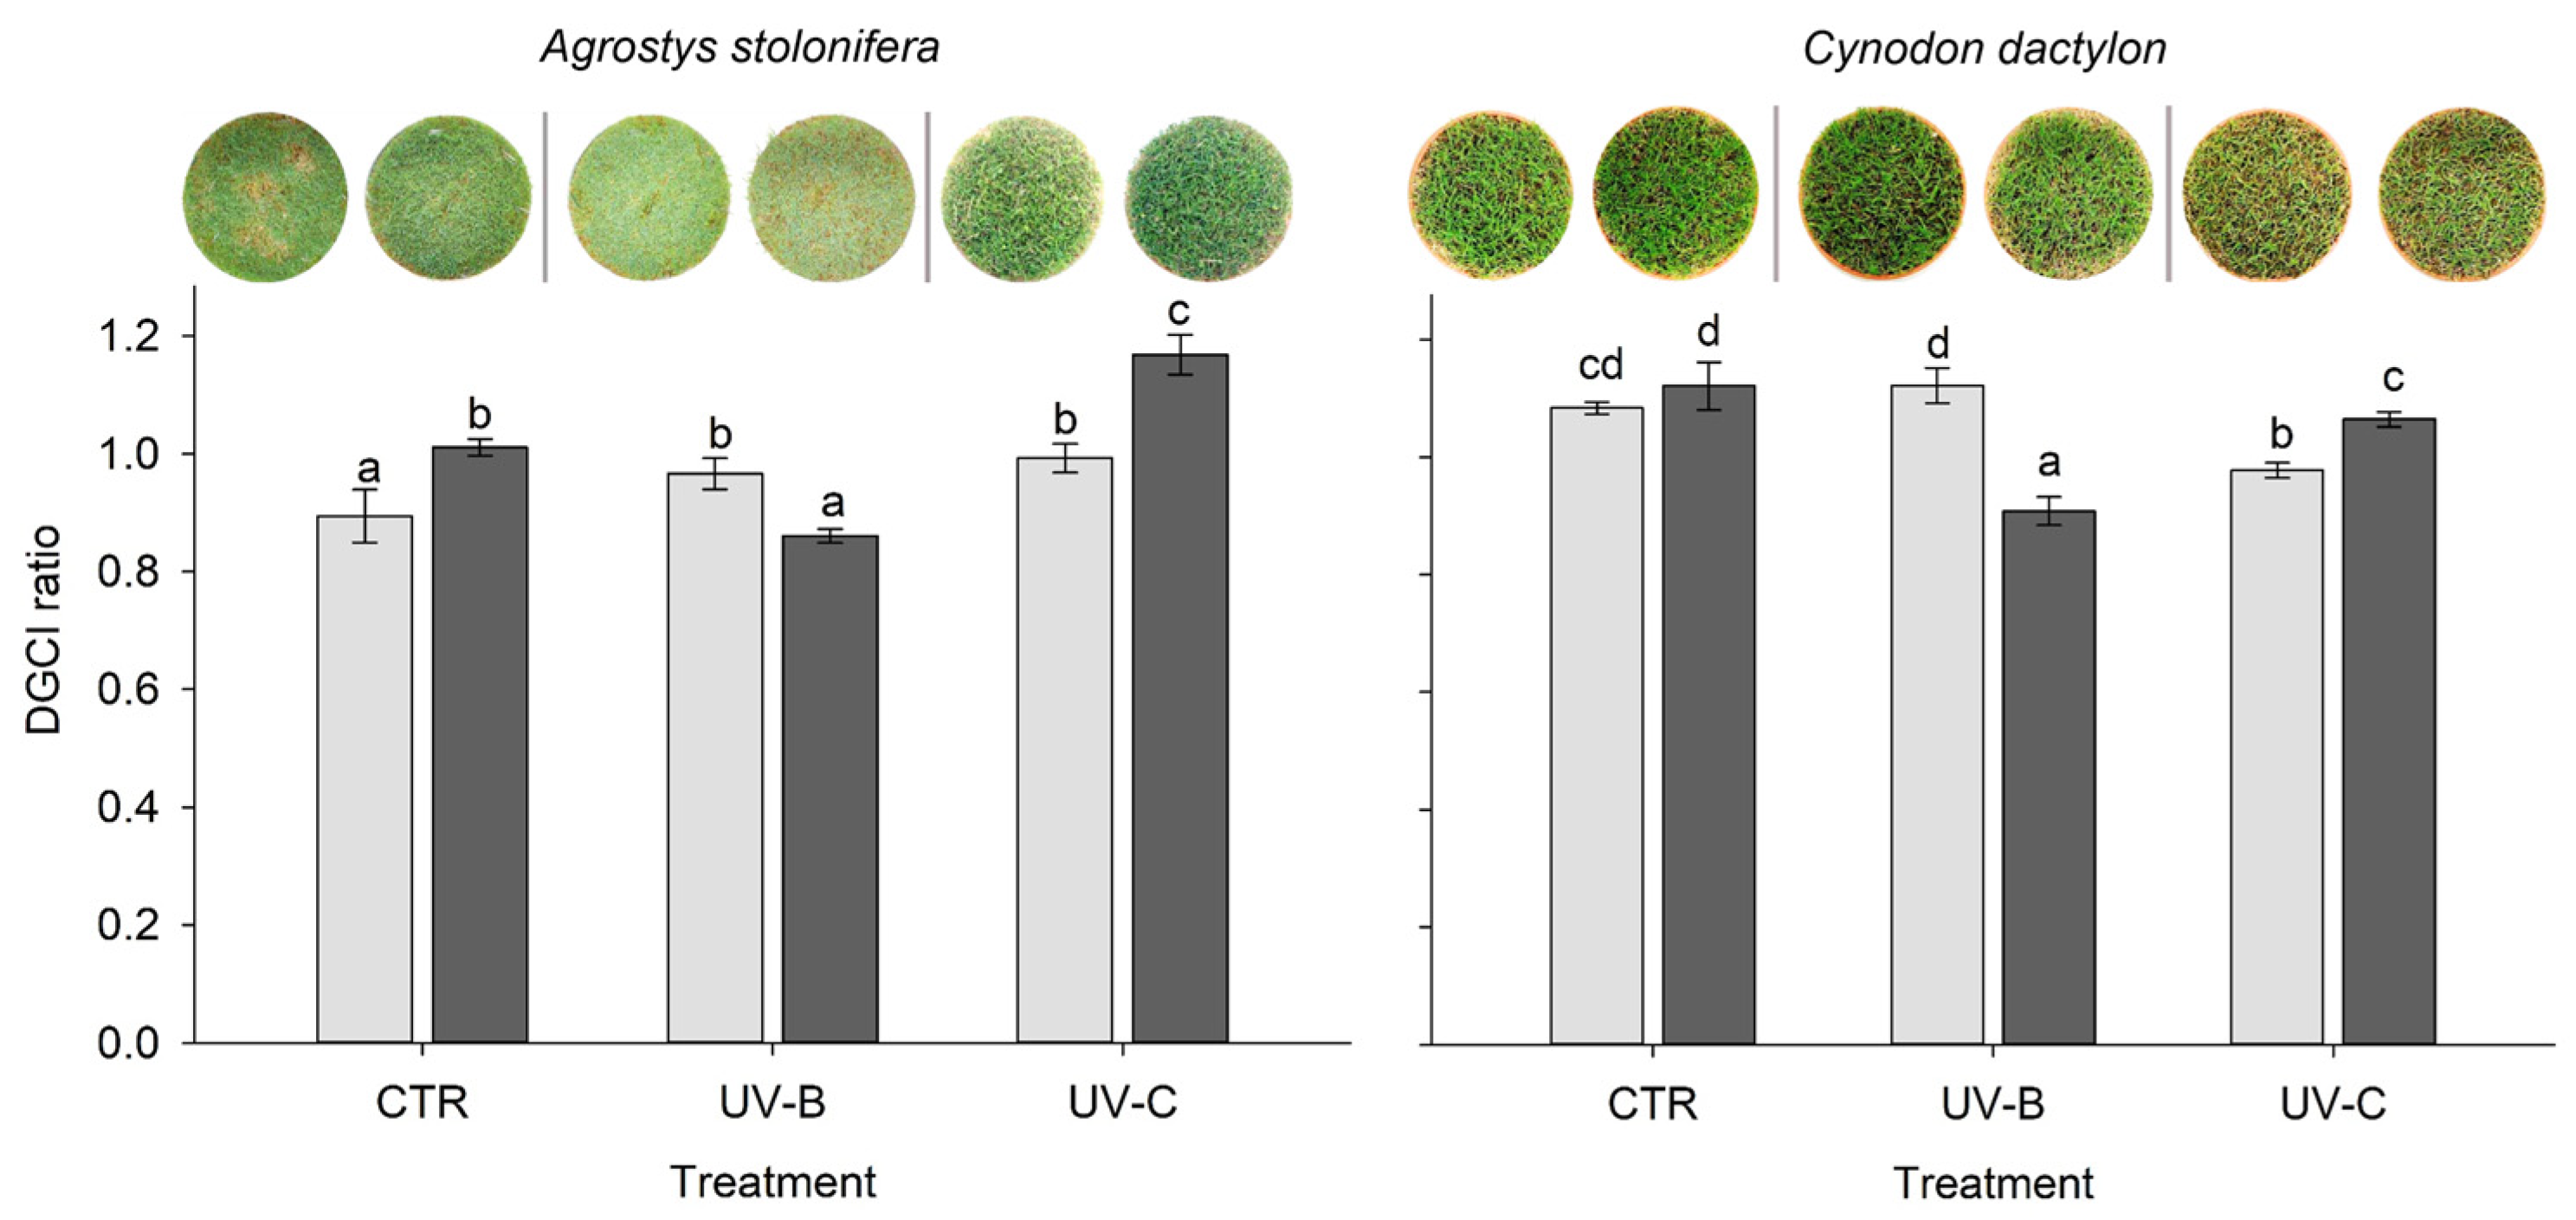
3.2. Dark Green Colour Index

The two-way ANOVA of DGCI ratios revealed that the interaction between “treatment” and “distance”, as well as the effects of the singular factors, were significant (Figure 3, Table S2). In creeping bentgrass, a slight increase in DGCI ratios was observed in UV treated material (regardless of the lamp) at 5 cm of distance (+8 and +11% compared to CTR under UV-B and UV-C treatment, respectively). At 15 cm, an opposite trend was observed in relation to the lamp (−15 and +36% compared to CTR in the case of UV-B and UV-C lamps, respectively). In hybrid bermudagrass, both UV-B and UV-C irradiation induced a significant decrease in DGCI ratios (−19% under UV-B treatments at 15 cm; −10 and −5% under UV-C treatments regardless of the lamp distances) except in the case of UV-B at 5 cm.

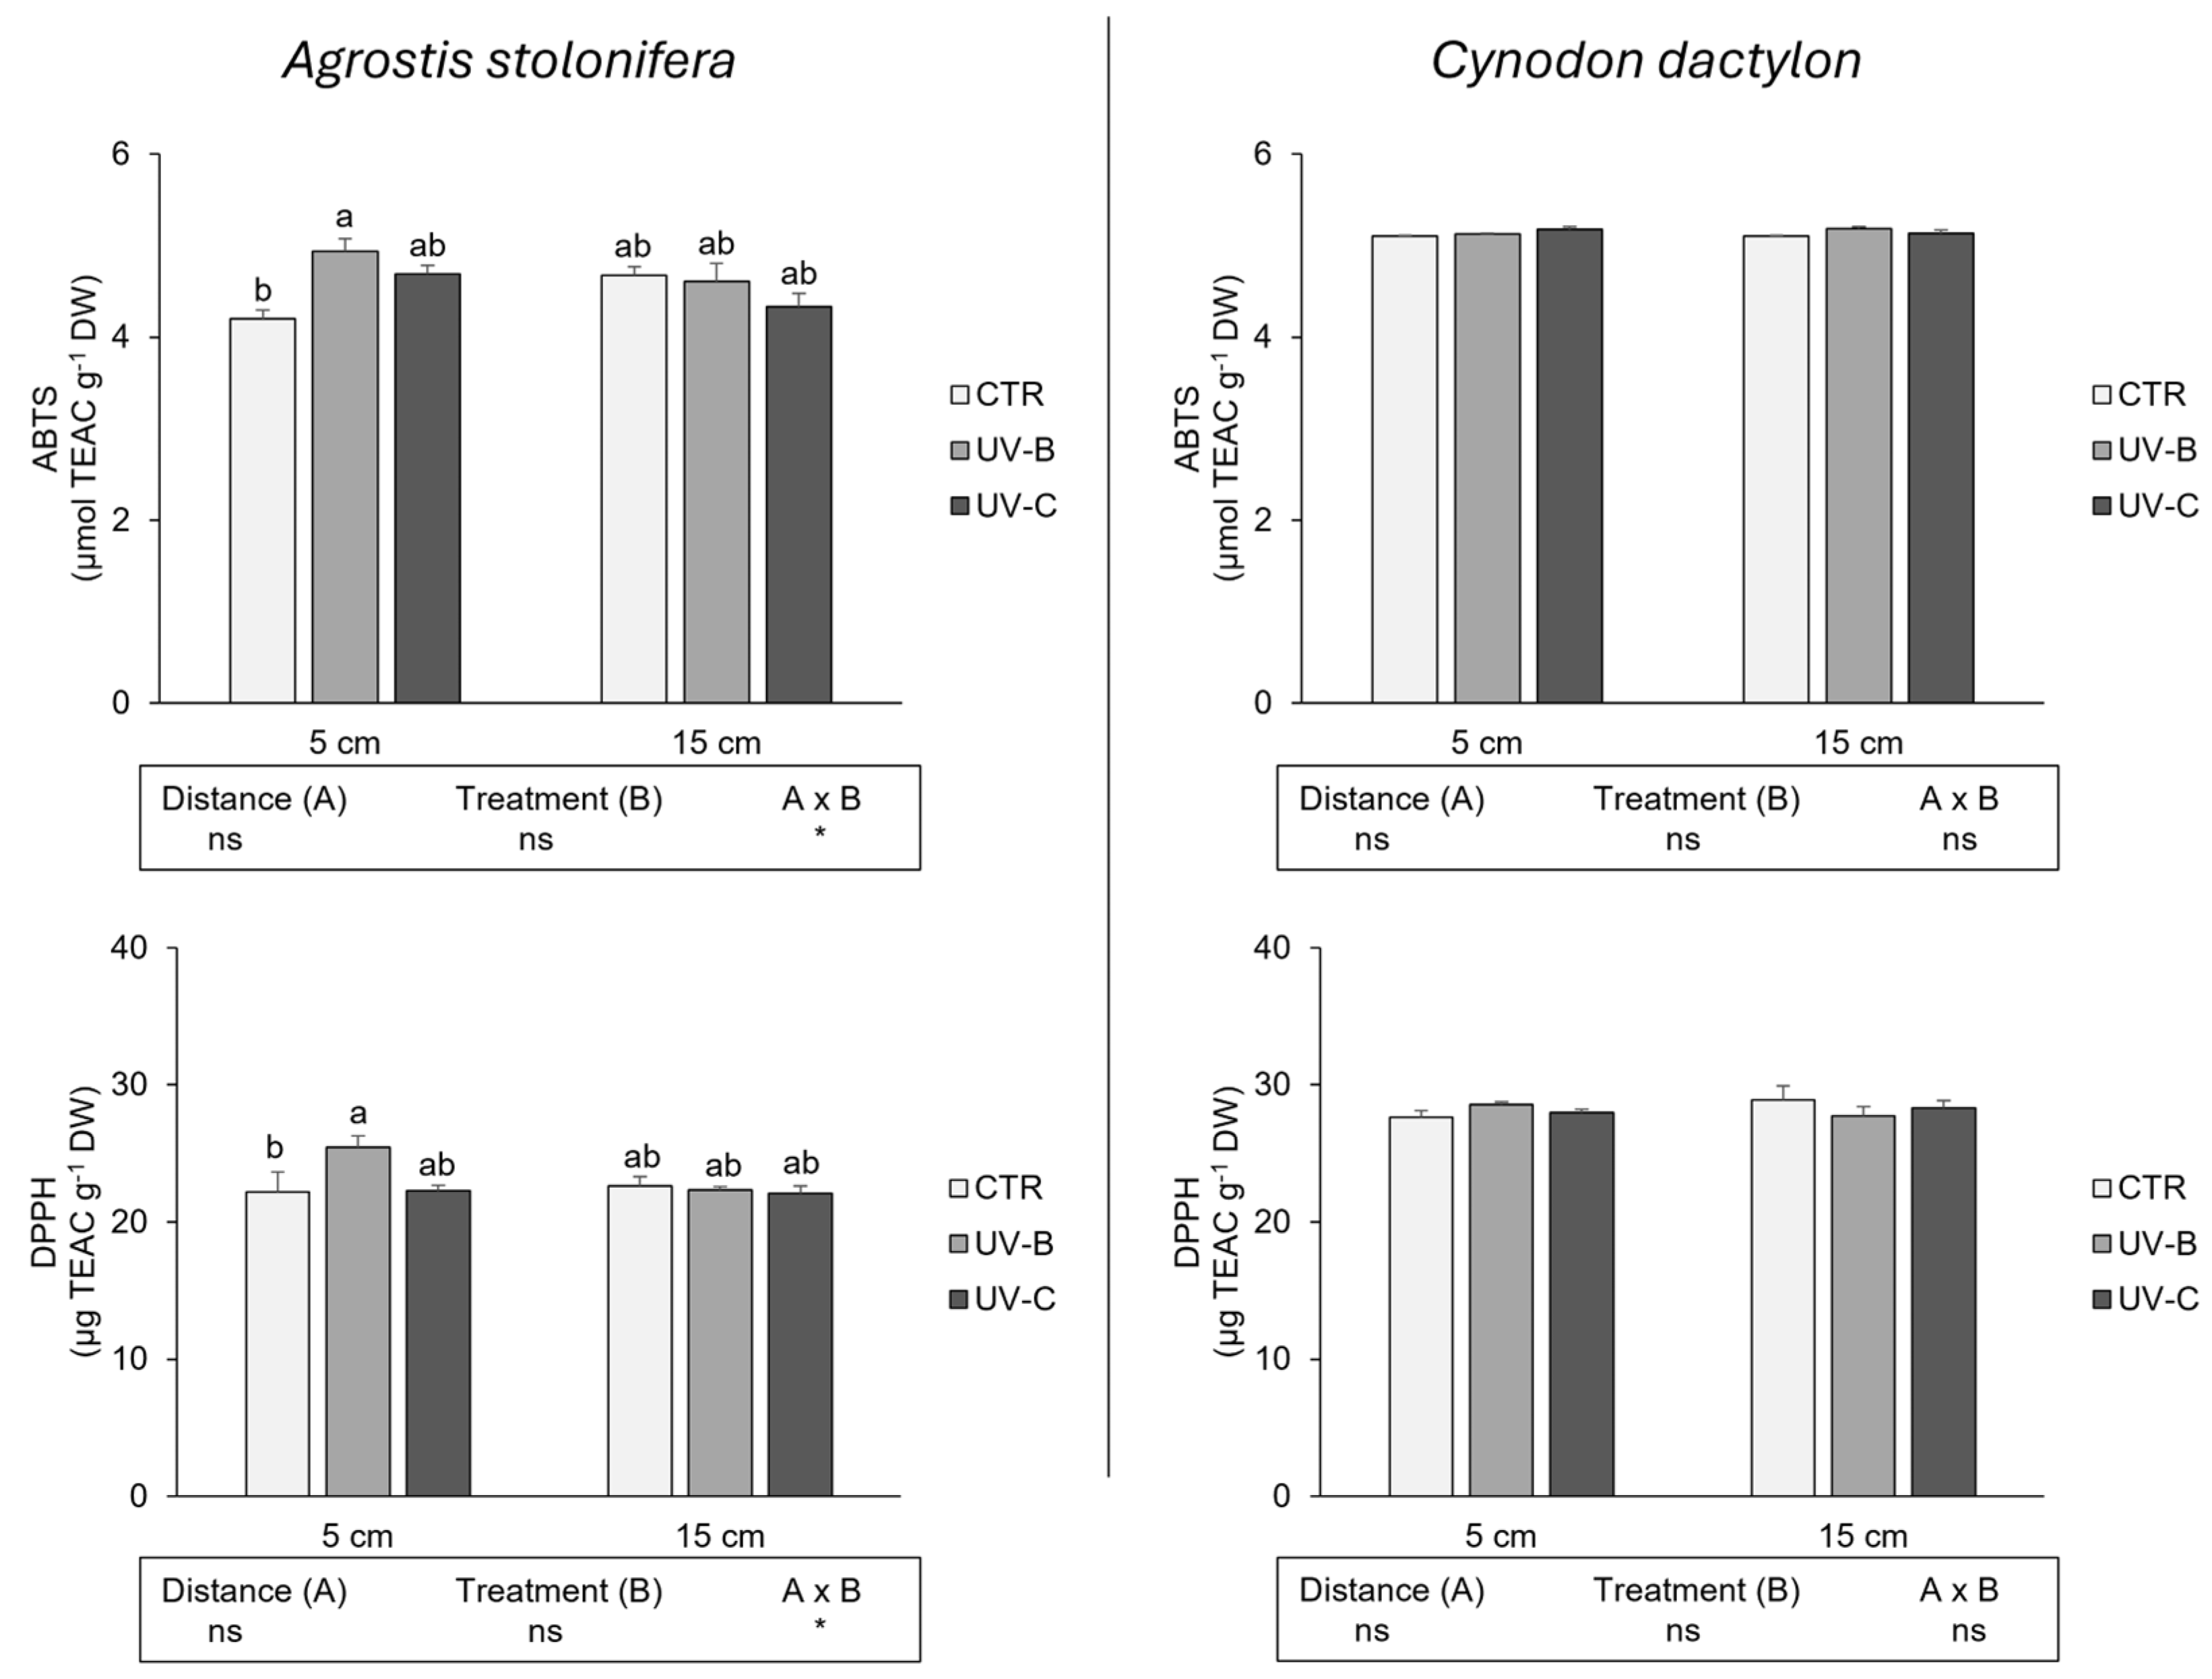
3.3. Evaluation of the Antioxidant Capacity

The antioxidant capacity of creeping bentgrass and hybrid bermudagrass plants (Figure 4) was evaluated after a 7-day UV-B or UV-C treatment at 5 or 15 cm distances from the lamps. While the distance from UV lamps and treatment type did not induce statistically significant results overall, the combination of factors revealed an interesting response. The UV-B treatment at 5 cm in creeping bentgrass significantly increased its antioxidant activity (+18 and +15% compared to controls in the ABTS and DPPH assays, respectively). No significant differences were observed after UV-B (at 15 cm distance) and UV-C irradiations (regardless of the distance). Regarding hybrid bermudagrass, no significant differences were observed regardless of UV treatment and lamp distance.

3.4. Concentration of Photosynthetic Pigments

Two-way ANOVA revealed no significant effects of either UV treatments, radiation distance, or their interaction on any of the analyzed pigments in both turfgrass species (p > 0.05; Table 2 and Table 3).

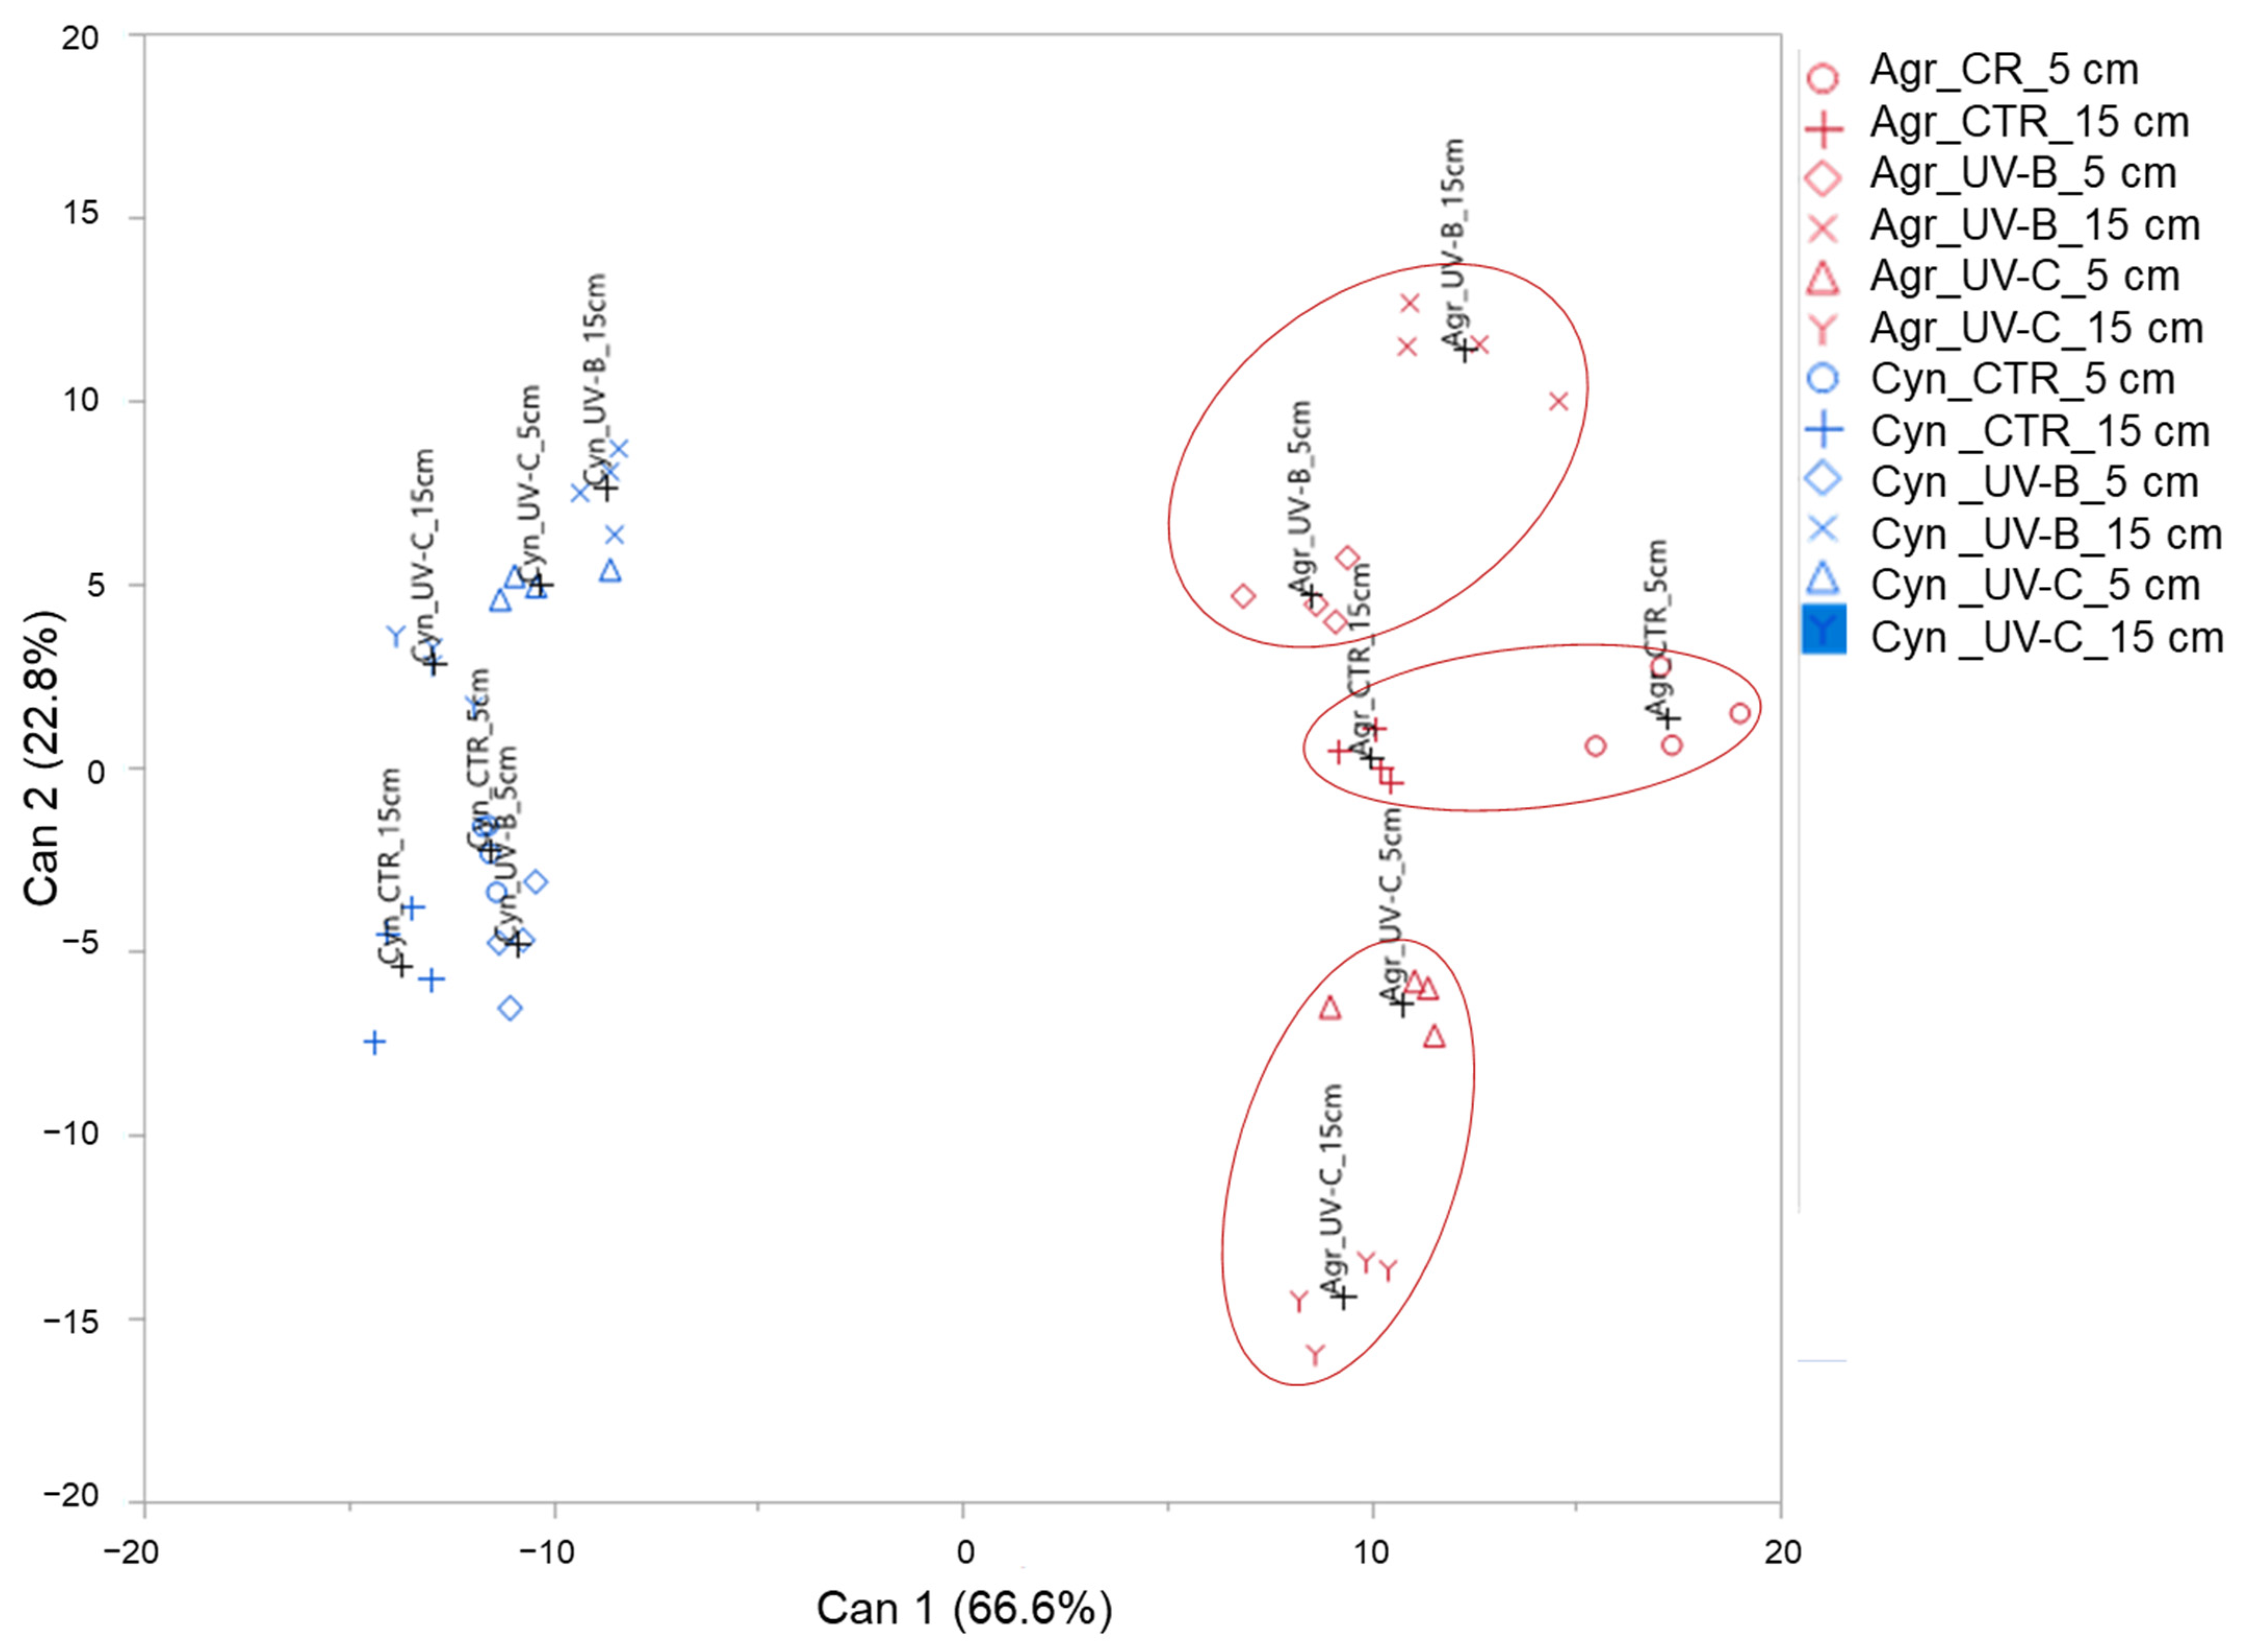
Canonical Discriminant Analysis and Pearson’s Correlation

A CDA was employed to find whether and how the variables measured in this study differentially impacted the different groups considered and, thus, if they fitted predetermined groups referring to the analyzed parameters (disease severity, DGCI ratio, ABTS, DPPH, and photosynthetic pigments; Figure 5). In the case of hybrid bermudagrass, the CDA did not determine a visible segregation of all six groups considered in this study (hybrid bermudagrass, CTR, 5 cm; hybrid bermudagrass, CTR, 15 cm; hybrid bermudagrass, UV-B, 5 cm; hybrid bermudagrass, UV-B, 15 cm; hybrid bermudagrass, UV-C, 5 cm; hybrid bermudagrass, UV-C, 15 cm). Conversely, the CDA effectively determined a visible segregation of all six groups in creeping bentgrass, indicating that both UV treatment and distance from the lamps impacted the variables investigated in this study. The canonical function 1 (Can 1) explained the separation among groups, with a coefficient of 66.6%. Based on this canonical function, on the x-axis of the plot, the main clusters within the hyperspace are strictly correlated with the turfgrass species, regardless of the treatment and the distance of lamps. However, the separation of groups based on the canonical function 2 (Can 2, y-axis), accounting for the 22.8%, is associated with the treatment (only in creeping bentgrass) regardless of the lamp distances.
In addition, the CDA-based Pearson’s correlation was also calculated between the canonical scores and the variables measured (Table 4), to determine which parameters are mostly associated with the differences attributable to the species (canonical function 1) and/or the lamp treatment (canonical function 2). The Pearson’ coefficients showed a strong correlation between most of the photosynthetic pigments (lutein, Chl b, Chl a, β-carotene, Chl a/Chl b, and Chl a + Chl b), ABTS, and disease severity and the Can 1 scores (r values of 0.87, 0.80, 0.96, 0.95, 0.87, 0.97, and 0.79 and 0.74, respectively), indicating that the differences in these variables were strongly imputable to the species. Contrarily, DGCI ratio was strongly associated with Can 2 score (r values of 0.82), which means that variations in this parameter are mostly influenced by the lamp treatment.

4. Discussion

Increased pressure to manage turfgrasses in a more ecologically friendly manner has reinvigorated the search for sustainable practices/technologies as alternatives to synthetic products [41]. In this context, high light intensity and UV radiation can play a crucial role in regulating plant–pathogen interactions due to their ability to enhance plant defences and act as physical elicitors [42].
The distances between the UV lamps and the turfgrasses, as well as the duration of the UV treatments, were selected to realistically replicate the operating conditions of an automated lawn mower equipped with UV lamps, ensuring that the treatments are applicable in field conditions. Unlike many studies in the literature that employ prolonged UV exposure to emphasize the UV-driven impact on plant metabolism, our approach was designed to reflect a feasible real-world application where UV irradiation occurs as part of routine lawn maintenance. Longer exposure times would not be practical in field conditions, as an automated lawn mower equipped with UV lamps would have to move at an unreasonably slow speed to achieve such prolonged irradiation (e.g., the common speed for this kind of machines ranges from 1.7 to 3.6 km/h) [43]. Therefore, the 5 s daily exposure was chosen to simulate a scenario in which the UV treatment is applied intermittently and efficiently during regular mowing operations, making this approach more viable for large-scale turfgrass management.
According to the results of our in vitro tests, the growth of C. jacksonii mycelium was significantly reduced only by UV-C irradiation (regardless of the lamp distances) confirming its possible role in suppressing fungal pathogens due to the high inhibition capability of mycelium growth and/or spore germination [44,45,46]. Similarly, the severity of Dollar spot (due to the natural infection of Clarireedia species) appeared constrained only in creeping bentgrass after UV-C irradiation at 5 cm. This is in accordance with Hesselsøe et al. [47] that reported the effects of UV-C irradiations at similar doses (0.35–0.40 kJ m−2, three times per week) in Clarireedia infections in A. stolonifera and Poa annua, finding reduced disease coverage in UV-C treated plots compared to untreated ones. Although UV-B and UV-C have a similar inactivation mechanism (i.e., radiation forms lesions in the DNA [48]; the second resulted in a stronger effect and efficacy for several microorganisms in water than the first [49]. In addition, UV-C has been found to be more effective at low distances (i.e., 5 cm) and with few host impacts, making it an effective management tool in agricultural settings and an attractive technology for future studies.
Intense light or UV radiation stimulate reactive oxygen species production, which are well-documented for their role against plant biotic and abiotic stress factors and contribute to the activation of various defence mechanisms (such as signalling pathways, the production of secondary metabolites and the activation of antioxidant enzymes), which serve as protective compounds [50,51]. In our work, an increase in the antioxidant activity was observed only in creeping bentgrass material under UV-B irradiation treatments performed at 5 cm of distance. According to the literature, despite the ineffectiveness of this irradiation in counteracting Dollar spot causal agents, the increased DPPH and ABTS values may represent a reinforcement against other stressors. It is worth knowing that generally, the effects of UV are rarely investigated on turfgrasses and usually researchers consider long-term treatments (i.e., ten days with 10 h photoperiod) [52], as those usually found in stressful environmental conditions related to climate change [22]. In this work, after one week of UV-B and UV-C lamp irradiation, the content of photosynthetic pigments in the two turfgrasses investigated did not change in comparison to CTR, suggesting that the selected doses (i.e., 5 s a day, for a week) did not have a phytotoxic effect. The ratio Chl/Car is a certain measure for the greenness of leaves with respect to the relative amounts of the yellow Car and represents—together with the Chl a/b ratio—a good marker for adaptation of chloroplasts. The unchanged values of this ratio observed at the end of treatment documented that both species can activate avoidance and/or tolerance mechanisms (such as an efficient protection system in terms of antioxidants) [53]. It is worth noting that a slight increase in DGCI ratios was observed in creeping bentgrass material under UV-B irradiation treatments performed at a 5 cm distance, suggesting a positive response of the plants (e.g., eustress [54]). Conversely, the reduction in DGCI rations observed in hybrid bermudagrass across most UV treatments (regardless of the type of the lamp) suggests greater sensitivity of this species under the selected experimental conditions (e.g., doses, timing of the treatments, distances of the lamps). Further investigation could be necessary to understand/clarify these responses for evaluating turfgrass tolerance to UV treatments and optimizing maintenance practices under varying light conditions.
In addition, the multivariate analysis provided valuable insights into the complex interactions between the turfgrass species, UV treatments, and lamp distances. The CDA revealed marked differences in how the two turfgrass species responded to the UV treatments. For hybrid bermudagrass, the CDA did not determine a clear segregation of the six experimental groups (different combinations of control, UV-B, UV-C at 5 cm and 15 cm distances), indicating that the measured parameters remained relatively similar across all treatment combinations. This suggests that hybrid bermudagrass exhibited limited reactivity to the applied UV treatments, maintaining relatively constant physiological and biochemical parameters regardless of the type of UV radiation or lamp distance. In contrast, creeping bentgrass showed clear segregation of all six experimental groups in the CDA hyperspace, demonstrating that especially UV treatment type (UV-B and UV-C) significantly impacted the measured variables. The first canonical function (Can 1), explaining 66.6% of the variation, primarily separated the groups based on turfgrass species identity, regardless of treatment or lamp distance. This confirms significant inherent physiological differences between creeping bentgrass and hybrid bermudagrass independently from their responsivity to UV radiation. The second canonical function (Can 2), accounting for 22.8% of the variation, further separated creeping bentgrass groups based on treatment type, irrespective of lamp distance. This pattern indicates that creeping bentgrass exhibits a more treatment-specific physiological and biochemical response compared to hybrid bermudagrass, proving to be more sensitive and reactive to the different UV treatments.

5. Conclusions

In conclusion, UV irradiation showed potential as a management strategy due to the direct action on mycelium growth, disease development, and the elicitation of secondary metabolites, which can increase plant responses against stress factors. To the best of our knowledge, this technology is poorly investigated in the context of turfgrass disease management, and our work represents a pilot assessment of the effects in controlled conditions, which may allow for the development of equipment suitable for the field application of UV treatments. According to the obtained results, among the four combinations tested on creeping bentgrass and hybrid bermudagrass, we consider the UV-C irradiation applied at 5 cm over a week as the best solution to reduce Dollar spot symptoms with the absence of phytotoxic effects at a physiological level. Questions concerning the doses applied and the need to understand the impact in terms of plant growth and the effects of the exposure after the cuts will be necessarily solved with further investigation in field conditions as well.

Supplementary Materials

The following supporting information can be downloaded at https://www.mdpi.com/article/10.3390/agriculture15070784/s1, Figure S1. Clarireedia jacksonii mycelium observed under an optical microscope, isolated from Agrostis stolonifera exposed for 5 s per day, for seven consecutive days, to (a) photosynthetically active radiation (PAR) at 5-cm distance from the source; (b) PAR at 15 cm height; (c): UV-B at 5 cm; (d) UV-B 15 cm. Bar: 50 µm; Table S1. Degree of freedoms (d.f.) and p levels (*** p ≤ 0.001, ** p ≤ 0.01; * p ≤ 0.05; ns, p > 0.05) for the effects of “treatment”, “time”, “distance” and their interaction on mycelial growth from 0 to 72 h in potato dextrose agar substrate exposed to photosynthetically active radiation (PAR), UV-B, UV-C irradiance (W m−2) values measured at 5 and 15 cm distance from the lamps; Table S2. Degree of freedoms (d.f.) and p levels (*** p ≤ 0.001, ** p ≤ 0.01) for the effects of “treatment” and “distance” and their interaction on dark green color index rations measured on Agrostis stolonifera and Cynodon dactylon exposed to photosynthetically active radiation, UV-B, UV-C irradiance (W m−2) values measured at 5 and 15 cm distance from the lamps.

Author Contributions

Conceptualization, E.P.; Methodology, M.S., L.C., S.M.L., S.M. and C.P.; Validation, L.G., E.P. and M.V.; Formal analysis, M.S., L.C., S.M. and C.P.; Investigation, M.S., L.C., S.M. and C.P.; Resources, E.P.; Data curation, M.S., L.C. and C.P.; Writing—original draft, M.S., L.C., S.M., E.P. and C.P.; Writing—review & editing, M.S., L.C., L.G., S.M.L., E.P., C.P. and M.R.; Visualization, M.V.; Supervision, E.P., M.R. and M.V.; Project administration, L.I.; Funding acquisition, L.I. All authors have read and agreed to the published version of the manuscript.

Funding

This work is supported by the project “Digitization of horticultural crops as a means to increase their sustainability” (DIGIORT, 488 PRA_2022_55) founded by the University of Pisa.

Data Availability Statement

The original contributions presented in this study are included in the article/supplementary material. Further inquiries can be directed to the corresponding author(s).

Acknowledgments

We gratefully acknowledge Tommaso Federighi for his help in plant material management, and Sara Federighi for her support in carrying out part of the experimental activities during her Master thesis in the M.S. course in “Urban Green Areas and Landscape Planning and Management”, Department of Agriculture, Food and Environment, University of Pisa.

Conflicts of Interest

The authors declare no conflicts of interest.

References

  1. Haydu, J.J.; Hodges, A.W.; Hall, C.R. Economic Impacts of the Turfgrass and Lawncare Industry in the United States; FE 632; Florida Cooperative Extension Service: Gainesville, FL, USA, 2006. [Google Scholar]
  2. Lindsey, A.J.; Schiavon, M.; Unruh, J.B.; Kenworthy, K. Urban landscapes: Turgrass benefits. Grasses 2025, 4, 3. [Google Scholar]
  3. Breuninger, J.M.; Welterlen, M.S.; Augustin, B.J.; Cline, V.; Morris, K. The turfgrass industry. In Turfgrass: Biology, Use, and Management; Stier, J.C., Horgan, B.P., Bonos, S.A., Eds.; ASA-CSSA-SSSA: Madison, WI, USA, 2013. [Google Scholar]
  4. Morris, K. National Turfgrass Research Initiative; National Turfgrass Federation and National Turfgrass Evaluation Program: Beltsville, MD, USA, 2003. [Google Scholar]
  5. Jung, H.; Chung, C. Consumers’ WTP for sustainability turfgrass attributes with consideration of aesthetic attributes and water conservation policies. Agriculture 2024, 14, 159. [Google Scholar] [CrossRef]
  6. Sang, H.; Popko, J.T., Jr.; Jung, G. Evaluation of a Sclerotinia homeocarpa population with multiple fungicide resistance phenotypes under differing selection pressures. Plant Disease 2019, 103, 4. [Google Scholar]
  7. Bennett, F.T. Dollar spot disease of turf and its causal organism, Sclerotinia homoeocarpa n. sp. Ann. Appl. Biol. 1937, 24, 236–257. [Google Scholar]
  8. Hu, J.; Zhou, Y.; Geng, J.; Dai, Y.; Ren, H.; Lamour, K. A new Dollar spot disease of turfgrass caused by Clarireedia paspali. Mycol. Prog. 2019, 18, 1423–1435. [Google Scholar]
  9. Salgado-Salazar, C.; Beirn, L.A.; Ismaiel, A.; Boehm, M.J.; Carbone, I.; Putman, A.I.; Tredway, L.P.; Clarke, B.B.; Crouch, J.A. Clarireedia: A new fungal genus comprising four pathogenic species responsible for Dollar spot disease of turfgrass. Fungal Biol. 2018, 122, 761–773. [Google Scholar]
  10. Kitchin, E.C.A.; Sneed, H.J.; McCall, D.S. Leveraging deep learning for Dollar spot detection and quantification in turfgrass. Crop Sci. 2024, 65, e21329. [Google Scholar]
  11. Hu, J.; Zhang, H.; Dong, Y.; Jiang, S.; Lamour, K.; Liu, J.; Chen, Y.; Yang, Z. Global distributions of Clarireedia species and their in vitro sensitivity profiles to fungicides. Agronomy 2021, 11, 2036. [Google Scholar] [CrossRef]
  12. Zhang, H.; Dong, Y.; Zhou, Y.; Hu, J.; Lamour, K.; Yang, Z. Clarireedia hainanense: A new species is associated with Dollar spot of turfgrass in Hainan, China. Plant Dis. 2022, 106, 996–1002. [Google Scholar]
  13. Hu, J.; Zhang, H.; Kong, Y.; Lamour, K.; Jung, G.; Yang, Z. Varied sensitivity to boscalid among different Clarireedia species causing Dollar spot in turfgrass. Pestic. Biochem. Physiol. 2024, 204, 106029. [Google Scholar]
  14. Zhang, H.; Liu, J.; Dong, Y.; Hu, J.; Lamour, K.; Yang, Z. A one-step multiplex PCR assay for the detection and differentiation of four species of Clarireedia causing Dollar spot on turfgrass. Pest Manag. Sci. 2023, 79, 1069–1077. [Google Scholar] [CrossRef] [PubMed]
  15. Sapkota, S.; Catching, K.E.; Raymer, P.L.; Martinez-Espinoza, A.D.; Bahri, B.A. New approaches to an old problem: Dollar spot of turfgrass. Phytopathol. 2022, 112, 469–480. [Google Scholar]
  16. Tredway, L.P.; Clarke, B.B.; Kerns, J.P.; Tomaso-Peterson, M. Compendium of Turfgrass Diseases, 4th ed.; The American Phytopathological Society: St Paul, MN, USA, 2022. [Google Scholar]
  17. Walsh, B.; Ikeda, S.S.; Boland, G.J. Biology and management of Dollar spot (Sclerotinia homoeocarpa); an important disease of turfgrass. HortScience 1999, 34, 13. [Google Scholar]
  18. Liu, J.; Wu, J.; Jin, P.; Hu, J.; Lamour, K.; Yang, Z. Activity of the succinate dehydrogenase inhibitor fungicide benzovindiflupyr against Clarireedia spp. Plant Disease 2023, 107, 12. [Google Scholar]
  19. Vanhaelewyn, L.; Prinsen, E.; Van Der Straeten, D.; Vandenbussche, F. Hormone-controlled UV-B responses in plants. J. Exp. Bot. 2016, 67, 4469–4482. [Google Scholar]
  20. Jenkins, G.I. Photomorphogenic responses to ultraviolet-B light. Plant Cell Environ. 2017, 40, 2544–2557. [Google Scholar]
  21. Vandenbussche, F.; Yu, N.; Li, W.; Vanhaelewyn, L.; Hamshou, M.; Van Der Straeten, D.; Smagghe, G. An ultraviolet B condition that affects growth and defense in Arabidopsis. Plant Sci. 2018, 268, 54–63. [Google Scholar]
  22. Reyes, T.H.; Pompeiano, A.; Ranieri, A.; Volterrani, M.; Guglielminetti, L.; Scartazza, A. Photosynthetic performance of five cool-season turfgrasses under UV-B exposure. Plant Physiol. Biochem. 2020, 151, 181–187. [Google Scholar]
  23. Santin, M.; Giordani, T.; Cavallini, A.; Bernardi, R.; Castagna, A.; Hause, M.-T.; Ranieri, A. UV-B exposure reduces the activity of several cell wall-dismantling enzymes and affects the expression of their biosynthetic genes in peach fruit (Prunus persica L., cv. Fairtime, melting phenotype). Photochem. Photobiol. Sci. 2019, 18, 1280–1289. [Google Scholar]
  24. Santin, M.; Zeni, V.; Grassi, A.; Ricciardi, R.; Pieracci, Y.; Di Giovanni, F.; Panzani, S.; Frasconi, C.; Agnolucci, M.; Avio, L.; et al. Do changes in Lactuca sativa metabolic performance, induced by mycorrhizal symbionts and leaf UV-B irradiation, play a role towards tolerance to a polyphagous insect pest? Environ. Sci.Pollut. Res. 2023, 30, 56207–56223. [Google Scholar]
  25. Thomas, T.T.D.; Puthur, J.T. UV-B priming enhances specific secondary metabolites in Oryza sativa (L.) empowering to encounter diverse abiotic stresses. Plant Growth Regul. 2020, 92, 169–180. [Google Scholar] [CrossRef]
  26. Yavaş, İ.; Ünay, A.; Ali, S.; Abbas, Z. UV-B radiations and secondary metabolites. Turk. J.Agric.-Food Sci. Technol. 2020, 8, 147–157. [Google Scholar] [CrossRef]
  27. Zeni, V.; Grassi, A.; Santin, M.; Ricciardi, R.; Pieracci, Y.; Flamini, G.; Di Giovanni, F.; Marmugi, M.; Agnolucci, M.; Avio, L.; et al. Leaf UV-B irradiation and mycorrhizal symbionts affect lettuce VOC emissions and defence mechanisms, but not aphid feeding preferences. Insects 2022, 14, 20. [Google Scholar] [CrossRef]
  28. Escalona, V.H.; Aguayo, E.; Martínez-Hernández, G.B.; Artés, F. UV-C doses to reduce pathogen and spoilage bacterial growth in vitro and in baby spinach. Postharvest Biol. Technol. 2010, 56, 223–231. [Google Scholar] [CrossRef]
  29. Han, S.; Cai, H.; Yu, H.; Yu, Z.; Wu, Y. Targeted metabolomic and transcriptomic reveal the regulation of UV-C on phenolics biosynthesis of peach fruit during storage. LWT 2023, 190, 115573. [Google Scholar] [CrossRef]
  30. Liu, C.; Zheng, H.; Sheng, K.; Liu, W.; Zheng, L. Effects of postharvest UV-C irradiation on phenolic acids, flavonoids, and key phenylpropanoid pathway genes in tomato fruit. Sci. Hortic. 2018, 241, 107–114. [Google Scholar] [CrossRef]
  31. Urban, L.; Charles, F.; de Miranda, M.R.A.; Aarrouf, J. Understanding the physiological effects of UV-C light and exploiting its agronomic potential before and after harvest. Plant Physiol.Biochem. 2016, 105, 1–11. [Google Scholar] [CrossRef]
  32. Zhang, W.; Jiang, H.; Cao, J.; Jiang, W. UV-C treatment controls brown rot in postharvest nectarine by regulating ROS metabolism and anthocyanin synthesis. Postharvest Biol.Technol. 2021, 180, 111613. [Google Scholar] [CrossRef]
  33. Hu, C. The Effect of Photocatalytic Titanium Dioxide and Ultraviolet B Radiation on Sclerotinia homoeocarpa Growth and Pathogenicity. Master’s Thesis, The University of Tennessee, Knoxville, TN, USA, 2013. [Google Scholar]
  34. Berkelmann-loehnertz, B.; Klaerner, S.; Flemming, B.; Keicher, R.; Schwarz, H.-P.; Pflieninger, F.; Loehnertz, O. Enhanced phytosanitary performance in the vineyard and physiological host responses induced by UV-C radiation. J. Plant Pathol. 2013, 1 (Suppl. S1), 75. [Google Scholar]
  35. Meyer, P.; Van de Poel, B.; De Coninck, B. UV-B light and its application potential to reduce disease and pest incidence in crops. Hortic. Res. 2021, 8, 194. [Google Scholar]
  36. Karcher, D.E.; Richardson, M.D. Quantifying turfgrass color using digital image analysis. Crop Sci. 2003, 43, 943–951. [Google Scholar]
  37. Santin, M.; Sciampagna, M.C.; Mannucci, A.; Puccinelli, M.; Angelini, L.G.; Tavarini, S.; Castagna, A. Supplemental UV-B exposure influences the biomass and the content of bioactive compounds in Linum usitatissimum L. sprouts and microgreens. Hortic. 2022, 8, 213. [Google Scholar]
  38. Re, R.; Pellegrini, N.; Proteggente, A.; Pannala, A.; Yang, M.; Rice-Evans, C. Antioxidant activity applying an improved ABTS radical cation decolorization assay. Free. Radic. Biol. Med. 1999, 26, 1231–1237. [Google Scholar] [PubMed]
  39. Blois, M.S. Antioxidant determinations by the use of a stable free radical. Nature 1958, 181, 1199–1200. [Google Scholar]
  40. Castagna, A.; Di Baccio, D.; Tognetti, R.; Ranieri, A.; Sebastiani, L. Differential ozone sensitivity interferes with cadmium stress in poplar clones. Biol. Plant. 2013, 57, 313–324. [Google Scholar]
  41. Marvin, J.W.; Kerr, R.A.; McCarty, L.B.; Bridges, W.; Martin, S.B.; Wells, C.E. Curative evaluation of biological control agents and synthetic fungicides for Clarireedia jacksonii. HortScience 2020, 55, 1622–1625. [Google Scholar]
  42. Demkura, P.V.; Ballaré, C.L. UVR8 mediates UV-B-induced Arabidopsis defense responses against Botrytis cinerea by controlling sinapate accumulation. Mol. Plant 2012, 5, 642–652. [Google Scholar]
  43. Luglio, S.M.; Sportelli, M.; Frasconi, C.; Raffaelli, M.; Gagliardi, L.; Peruzzi, A.; Fortini, V.; Volterrani, M.; Magni, S.; Caturegli, L.; et al. Monitoring Autonomous Mowers Operative Parameters on Low-Maintenance Warm-Season Turfgrass. Appl. Sci. 2023, 13, 7852. [Google Scholar] [CrossRef]
  44. Onofre, R.B.; Gadoury, D.M.; Stensvand, A.; Bierman, A.; Rea, M.; Peres, N.A. Use of ultraviolet light to suppress powdery mildew in strawberry fruit production fields. Plant Dis. 2021, 105, 2402–2409. [Google Scholar]
  45. Gadoury, D.M.; Sapkota, S.; Cadle-Davidson, L.; Underhill, A.; McCann, T.; Gold, K.M.; Gambhir, N.; Combs, D.B. Effects of nighttime applications of germicidal ultraviolet light upon powdery mildew (Erysiphe necator), downy mildew (Plasmopara viticola), and sour rot of grapevine. Plant Dis. 2023, 107, 1452–1462. [Google Scholar]
  46. McDaniel, A.L.; Gadoury, D.M.; Moyer, M.M. Effects of germicidal ultraviolet-C light on grape mealybug (Pseudococcus maritimus). Crop Prot. 2024, 178, 106584. [Google Scholar]
  47. Hesselsøe, K.J.; Borchert, A.F.; Bekken, M.; Aamlid, T.S.; Hahn, D.; Pramassing, W. FAIRWAYS4FUTURE—A New STERF-Project on Sustainable Management of Golf Course Fairways. 2023. Available online: http://www.sterf.org (accessed on 4 February 2025).
  48. Sinha, R.P.; Hader, D.P. UV-induced DNA damage and repair: A review. Photochem. Photobiol. Sci. 2002, 4, 225–236. [Google Scholar]
  49. Li, X.; Cai, M.; Wang, L.; Niu, F.; Yang, D.; Zhang, G. Evaluation survey of microbial disinfection methods in UV-LED water treatment systems. Sci. Tot. Environ. 2019, 659, 1415–1427. [Google Scholar]
  50. Dat, J.; Vandenabeele, S.; Vranov, E.; Van Montagu, M.; Inzé, D.; Van Breusegem, F. Dual action of the active oxygen species during plant stress responses. Cell Mol. Life Sci. 2000, 57, 779–795. [Google Scholar] [CrossRef]
  51. Grant, J.; Loake, G.J. Role of reactive oxygen intermediates and cognate redox signaling in disease resistance. Plant Physiol. 2000, 124, 21–29. [Google Scholar] [PubMed]
  52. Sarkar, D.; Bhowmik, P.C.; Shetty, K. The role of proline-associated pentose phosphate pathway in cool-season turfgrasses after UV-B exposure. Environ. Exp. Bot. 2011, 70, 251–258. [Google Scholar]
  53. Mackerness, S.A.H. Plant responses to ultraviolet-B (UV-B: 280–320 nm) stress: What are the key regulators? Plant Growth Regul. 2000, 32, 27–39. [Google Scholar]
  54. Marchica, A.; Ascrizzi, R.; Flamini, G.; Cotrozzi, L.; Tonelli, M.; Lorenzini, G.; Nali, C.; Pellegrini, E. Ozone as eustress for enhancing secondary metabolites and bioactive properties in Salvia officinalis. Ind. Crops Prod. 2021, 170, 113730. [Google Scholar]
Figure 1. Growth of Clarireedia jacksonii mycelium from 0 to 72 h (h) in Potato Dextrose Agar substrate exposed to photosynthetically active radiation (PAR; light grey bar), UV-B (grey bar), UV-C (dark grey bar) irradiance (W m−2) values measured at 5 (plain bar) and 15 (filled bar) cm distance from the lamps, 5 s per day for three days. Data are shown as means (n = 20) ± standard error. Different letters are significantly different after a three-way analysis of variance. Significant differences among treatments were determined by Tukey’s post hoc test (p ≤ 0.05).
Agriculture 15 00784 g001
Figure 2. Disease severity calculated as percentage of infected area of Agrostis stolonifera plants transplanted in containers, naturally inoculated with Clarireedia spp. and exposed to photosynthetically active radiation (PAR; white bar), UV-B (grey bar), UV-C (dark grey bar) irradiance (W m−2) values at 5 and 15 cm from the lamps, 5 s per day for seven days. Data are shown as mean (n = 4) ± standard error. Two-way ANOVA (p ≤ 0.05) was performed to assess statistical significance (ns, p > 0.05; *** p ≤ 0.001).
Agriculture 15 00784 g002
Figure 3. Dark Green Colour Index (DGCI) ratios of Agrostis stolonifera and Cynodon dactylon plants exposed to photosynthetically active radiation (PAR), UV-B, UV-C at 5 (light grey bars) or 15 (dark grey bars) cm distance from the lamps, 5 s per day for seven days. Data represent mean ± standard error (n = 3). Different letters correspond to significantly different values according to two-way ANOVA (p ≤ 0.05) followed by Tukey’s post hoc test.
Agriculture 15 00784 g003
Figure 4. Antioxidant capacity, measured through 2,2-azinobis (3-ethylbenzothiazoline-6-sulfonic acid (ABTS) and the 2,2-diphenyl-1-picrylhydrazyl (DPPH) assays, of Agrostis stolonifera and Cynodon dactylon untreated plants (CTR; white bars) or treated with UV-B (light grey bars) or UV-C (dark grey bars) at 5 or 15 cm distance from the lamps. Data represent mean ± standard error (n = 3). Different letters and asterisks correspond to significantly different values according to two-way ANOVA (p ≤ 0.05) followed by Tukey’s post hoc test (* p ≤ 0.05; n.s., p > 0.05). Abbreviation: DW, dry weight.
Agriculture 15 00784 g004
Figure 5. Two-dimensional scatterplot related to the Canonical Discriminant Analysis (CDA) performed on individual replicates, showing the separation of experimental groups based on both biochemical parameters and disease severity. Can 1 and 2 refers to the canonical function 1 and 2, which considers all the variables to maximize the separation among the groups.
Agriculture 15 00784 g005
Table 1. Photosynthetically active radiation (PAR), UV-B, UV-C irradiance (W m−2) values measured at 5 and 15 cm distance from the lamps. For UV-B and UV-C lamps, the total UV dose (kJ m−2) is also reported considering a daily UV exposure of 5 s and a total experimental duration of 7 days. Values represent mean ± standard deviation (n = 5).
Distance
from the Lamps (cm)
PAR
(µmol m−2 s−1)
UV-BUV-C
Irradiance
(W m−2)
Total Dose
(kJ m−2)
Irradiance
(W m−2)
Total Dose
(kJ m−2)
5370.7 ± 3.511.9 ± 1.70.42 ± 0.0625.5 ± 2.00.89 ± 0.07
15 340.2 ± 4.46.6 ± 0.60.23 ± 0.0214.5 ± 1.00.51 ± 0.04
Table 2. Lutein, chlorophyll b (Chl b), chlorophyll a (Chl a), chlorophyll a + b (Chl a + b), chlorophyll a/b (Chl a/b), β-carotene, and chlorophylls/carotenoids (Chl/Car) concentration in Agrostis stolonifera plants untreated (CTR) or treated with UV-B or UV-C at 5 or 15 cm distances from the lamps, 5 s per day for seven consecutive days. Data represent mean ± standard error (n = 3). Two-way ANOVA (p < 0.05) and Tukey’s post hoc test were performed to assess statistical significance (ns, p > 0.05). Abbreviations: CTR (control), DW (dry weight), Chl (chlorophyll), Car (carotenoids = lutein + β-carotene).
Distance (cm) Treatment Lutein
(µg g−1 DW)
Chl b
(mg g−1 DW)
Chl a
(mg g−1 DW)
Chl a + b
(mg g−1 DW)
Chl a/bβ-Carotene
(µg g−1 DW)
Chl/Car
5CTR 113.5 ± 4.8 1.80 ± 0.05 3.56 ± 0.05 5.36 ± 0.031.98 ± 0.0850.6 ± 0.7 32.7 ± 0.7
UV-B 118.6 ± 4.2 1.70 ± 0.05 3.28 ± 0.10 4.97 ± 0.07 1.94 ± 0.1150.6 ± 0.4 29.5 ± 1.0
UV-C 110.2 ± 6.5 1.68 ± 0.03 3.57 ± 0.12 5.24 ± 0.142.13 ± 0.04 49.4 ± 1.9 33.0 ± 1.8
15 CTR 114.1 ± 7.9 1.72 ± 0.09 3.51 ± 0.07 5.23 ± 0.092.06 ± 0.1247.4 ± 0.6 32.6 ± 2.2
UV-B 121.7 ± 2.6 1.82 ± 0.05 3.41 ± 0.09 5.23 ± 0.121.88 ± 0.0547.7 ± 0.4 30.9 ± 0.2
UV-C 115.5 ± 5.0 1.72 ± 0.08 3.45 ± 0.10 5.18 ± 0.012.02 ± 0.14 50.6 ± 2.1 31.2 ± 1.0
Mean effect
5 114.1 ± 2.9 1.72 ± 0.03 3.47 ± 0.07 5.19 ± 0.102.02 ± 0.0550.2 ± 0.6 31.7 ± 0.9
15 117.1 ± 3.0 1.75 ± 0.04 3.46 ± 0.05 5.21 ± 0.011.98 ± 0.0648.6 ± 0.8 31.6 ± 0.8
CTR 113.8 ± 4.1 1.76 ± 0.05 3.54 ± 0.04 5.30 ± 0.052.02 ± 0.0749.0 ± 0.8 32.7 ± 1.0
UV-B 120.2 ± 2.3 1.76 ± 0.04 3.35 ± 0.07 5.10 ± 0.091.91 ± 0.0549.1 ± 0.7 30.2 ± 0.6
UV-C 112.8 ± 3.9 1.70 ± 0.04 3.51 ± 0.07 5.21 ± 0.072.07 ± 0.0750.0 ± 1.3 32.2 ± 1.0
Table 3. Lutein, chlorophyll b (Chl b), chlorophyll a (Chl a), chlorophyll a + b (Chl a + b), chlorophyll a/b (Chl a/b), β-carotene, and chlorophylls/carotenoids (Chl/Car) concentration in Cynodon dactylon plants untreated (CTR) or treated with UV-B or UV-C at 5 or 15 cm distances from the lamps, 5 s per day for seven consecutive days. Data represent mean ± standard error (n = 3). Two-way ANOVA (p < 0.05) and Tukey’s post hoc test were performed to assess statistical significance (ns, p > 0.05). Abbreviations: CTR (control), DW (dry weight), Chl (chlorophyll), Car (carotenoids = lutein + β-carotene).
Distance (cm)Treatment Lutein
(µg g−1 DW)
Chl b
(mg g−1 DW)
Chl a
(mg g−1 DW)
Chl a + bChl a/bβ-Carotene
(µg g−1 DW)
Chl/Car
5CTR 91.7 ± 3.0 1.55 ± 0.11 2.15 ± 0.13 3.70 ± 0.151.40 ± 0.1436.3 ± 1.2 29.0 ± 1.7
UV-B 93.4 ± 1.2 1.57 ± 0.03 2.28 ± 0.11 3.85 ± 0.121.45 ± 0.0736.4 ± 1.3 29.6 ± 0.9
UV-C 95.1 ± 2.2 1.46 ± 0.05 2.06 ± 0.05 3.51 ± 0.091.41 ± 0.0435.4 ± 1.4 27.0 ± 0.1
15 CTR 87.9 ± 2.6 1.53 ± 0.06 2.06 ± 0.18 3.59 ± 0.201.35 ± 0.1332.5 ± 1.1 29.8 ± 1.6
UV-B 87.8 ± 3.8 1.51 ± 0.07 2.22 ± 0.09 3.73 ± 0.061.47 ± 0.1236.9 ± 1.4 29.9 ± 0.9
UV-C 91.4 ± 1.8 1.45 ± 0.04 2.15 ± 0.25 3.60 ± 0.231.49 ± 0.1935.2 ± 0.1 28.4 ± 1.7
Mean effect
5 cm 93.4 ± 1.2 1.53 ± 0.04 2.16 ± 0.06 3.69 ± 0.081.42 ± 0.0536.1 ± 0.7 28.5 ± 0.7
15 cm 89.1 ± 1.6 1.50 ± 0.03 2.14 ± 0.10 3.64 ± 0.091.44 ± 0.0834.9 ±0.8 29.4 ± 0.8
CTR 89.8 ± 2.0 1.54 ± 0.06 2.10 ± 0.10 3.64 ± 0.121.38 ± 0.0934.4 ± 1.1 29.4 ± 1.1
UV-B 90.7 ± 2.2 1.55 ± 0.04 2.25 ± 0.06 3.79 ± 0.061.46 ± 0.0636.7 ± 0.9 29.8 ± 0.6
UV-C 93.2 ± 1.5 1.45 ± 0.03 2.10 ± 0.12 3.55 ± 0.111.45 ± 0.0935.3 ± 0.6 27.7 ± 0.8
Table 4. Pearson’s correlation coefficients (r) between individual variables (biochemical parameters, disease severity, and DGCI ratio) and the first canonical function scores from the Canonical Discriminant Analysis (CDA). * 0.7 > |r| > 0.9: strong correlation; ** 0.9 > |r| > 1: very strong correlation.
Pearson
Coefficient (|r|)
Can 1Can 2
Lutein0.87 *0.04
Chl b0.80 *0.02
Chl a0.96 **0.11
β-carotene0.96 **0.09
Chl a/Chl b0.87 *0.14
Chl a + b0.97 **0.10
Chl/car0.580.21
ABTS0.79 *0.46
DPPH0.480.52
Disease severity0.74 *0.40
DGCI ratio0.450.82 *
Disclaimer/Publisher’s Note: The statements, opinions and data contained in all publications are solely those of the individual author(s) and contributor(s) and not of MDPI and/or the editor(s). MDPI and/or the editor(s) disclaim responsibility for any injury to people or property resulting from any ideas, methods, instructions or products referred to in the content.

