Article

Investigating the Impact of Sowing Date on Wheat Leaf Morphology Through Image Analysis

1
Jiangsu Key Laboratory of Crop Genetics and Physiology/Jiangsu Key Laboratory of Crop Cultivation and Physiology, Agricultural College of Yangzhou University, Yangzhou 225009, China
2
Jiangsu Co-Innovation Center for Modern Production Technology of Grain Crops, Yangzhou University, Yangzhou 225009, China
*
Author to whom correspondence should be addressed.
These authors contributed equally to this work.
Agriculture 2025, 15(7), 770; https://doi.org/10.3390/agriculture15070770
Submission received: 26 February 2025 / Revised: 29 March 2025 / Accepted: 31 March 2025 / Published: 2 April 2025

Abstract

:
The morphology of wheat leaves is a key indicator of crop stand quality and photosynthetic capacity, with sowing date being a critical factor influencing leaf morphology. To investigate the effects of sowing time on wheat growth, development, and leaf phenotypes, this study utilized image analysis technology to systematically extract key phenotypic traits of winter wheat leaves, including effective leaf area, leaf color, and leaf shape. The results demonstrated that delayed sowing significantly affected the morphology and color characteristics of winter wheat leaves. Specifically, leaf length and width exhibited a quadratic decreasing trend, resulting in an average reduction in leaf area of over 59%. Additionally, the greenness index (EXG) decreased by 25.84%, while the red pigment index (EXR) increased by 21.69%. Significant differences in leaf color changes were observed among the varieties. This study provides reliable data for determining the optimal sowing period for winter wheat and offers valuable guidance for optimizing field management strategies to enhance crop yield and quality.

1. Introduction

Wheat is a staple food crop in China, and its yield and quality are shaped by multiple factors, including varietal characteristics, water and fertilizer management, and cultivation practices. Among these factors, sowing date plays a pivotal role in regulating wheat growth and development, while the degree of leaf development serves as a reliable indicator of the crop’s growth condition. Studies have shown that an optimal sowing date can enhance the accumulation of photosynthetic products in wheat, thereby increasing yield [1]. Conversely, delayed sowing tends to shorten the growth period of winter wheat, resulting in insufficient development [2]. Currently, the determination of sowing dates for winter wheat in rural areas relies heavily on traditional practices, often leading to problems such as localized leaf freezing, yellowing, and root damage in the field. These issues not only complicate field management but also reduce wheat yield and quality. Thus, the adoption of scientific cultivation techniques and adjustments to the sowing schedule represent effective strategies to ensure the proper growth and development of winter wheat [3]. The primary impact of sowing date on wheat lies in its influence on leaf morphological traits, which subsequently affect population structure and photosynthetic capacity, ultimately determining yield. Therefore, the timely and accurate understanding of leaf morphological traits is essential for optimizing the cultivation and management of winter wheat.
Traditional methods for measuring leaf traits, such as morphological measurements, fertilization diagnosis, enzymatic diagnosis, and chemical analysis, predominantly rely on manual assessments. These methods are prone to subjectivity, low efficiency, and human error, making them inadequate to meet the requirements of modern agriculture in terms of accuracy, cost-effectiveness, and monitoring speed [4]. In recent years, advancements in data processing technologies for RGB images have significantly enhanced the efficiency and timeliness of agricultural data collection. For example, Fernandez-Gallego et al. utilized RGB images for low-cost yield estimation in durum wheat [5]; Zhou et al. employed conventional RGB images to assess wheat’s resistance to stripe rust at minimal expense [6]; and Xu et al. developed a weed recognition network for wheat fields by integrating RGB and depth images [7]. Deng et al. applied deep convolutional neural networks (CNNs) to RGB image processing, enabling the efficient and automated detection and recognition of wheat leaf diseases, aiming to improve the precision and applicability of agricultural disease monitoring [8]. Zang et al. proposed a deep learning detection method for rotated wheat spikes (OFPN), significantly improving the accuracy of wheat spike detection and counting [9]. Although these technologies have greatly enhanced monitoring scale and efficiency, they still face limitations in small-sample comparative analysis, especially in terms of practical applicability. Additionally, the high cost of equipment and operational complexity have further hindered their widespread adoption. To overcome these challenges, this study seeks to develop a simple yet efficient approach to examine phenotypic variations among individual leaves across different sowing dates, thus addressing the shortcomings of existing technologies and driving advancements in agricultural monitoring.
The phenotype of wheat leaves is closely linked to photosynthetic efficiency [10]. Previous studies have demonstrated a positive correlation between larger leaf area, deeper leaf color, and higher photosynthetic efficiency [11]. As a result, leaf phenotype information serves as a crucial indicator for evaluating wheat growth status. Niu et al. utilized threshold segmentation to analyze wheat phenotypes, achieving an average absolute error of 1.04 and a mean absolute percentage error (MAPE) of 5% [12]. Similarly, Zhou et al. combined threshold segmentation with Gabor and Canny operators to statistically analyze the total leaf area of wheat, attaining an average accuracy rate of 90% [13]. While these studies have successfully extracted leaf-related information, their methodologies are primarily limited to grayscale and binary image extraction. Consequently, they fail to provide a comprehensive analysis of phenotypic traits such as leaf length, leaf width, and leaf color, which are essential for a more detailed characterization of wheat morphology.
Previous studies have demonstrated that delayed sowing leads to postponed leaf development, a reduction in leaf area, and a higher incidence of yellowing [14,15]. However, these studies often rely on measurement techniques with limited precision and lack comprehensive analyses of detailed morphological traits. Moreover, quantitative research on dynamic leaf changes remains insufficient, and the relationship between phenotypic traits and leaf color indices has yet to be thoroughly explored.
Therefore, a precise and efficient technical approach is urgently needed to fully elucidate the specific effects of different sowing dates on leaf phenotypic traits, thereby establishing a critical foundation for scientifically informed field management. To bridge this research gap, this study introduces a digital measurement technique based on RGB image analysis, integrating multiple data processing methods, including HSV color space conversion, median filtering, morphological operations, and gamma correction. A systematic and high-precision framework for acquiring and analyzing leaf morphological traits was developed. This system enables the extraction of multi-dimensional phenotypic traits, including leaf length, leaf width, leaf area, leaf color, and various leaf color indices, offering a comprehensive perspective on the multi-layered effects of sowing date on the growth and photosynthetic characteristics of winter wheat leaves. Furthermore, this study is the first to systematically evaluate leaf color characteristics using different grayscale transformation formulas. By integrating correlation analysis, it thoroughly explores the applicability and specificity of leaf color indices in characterizing leaf health and photosynthetic efficiency. By incorporating spectral and geometric feature analysis methods, this study provides a scientific basis and technical support for the image-based analysis of crop phenotypic traits, further expanding the application potential of imaging technologies in agricultural phenotypic research.

2. Materials and Methods

2.1. Experimental Materials and Field Planting

The experiment was conducted at the Wenhui Road campus experimental field of Yangzhou University (119°25′24″ E, 32°23′21″ N). A two-factor split-plot design was implemented, with three replicates (Figure 1A). The main plots comprised three sowing date and seeding rate combinations: 1 November 2023 (timely sowing), with 1.8 million seeds/ha, November 20 (late sowing), with 3 million seeds/ha, and December 10 (very late sowing), with 3.9 million seeds/ha. The subplots included four winter wheat varieties—Yangmai 25, Yangmai 28, Yangmai 30, and Yangmai 39 (Table 1)—resulting in a total of 36 plots, each covering an area of 15 m2.
To effectively control all environmental variables except the sowing date, a precision seeder was used in the experiment, with a row spacing of 28 cm and a sowing depth of 2~3 cm. Urea (46.3% nitrogen content) served as the nitrogen source, calcium superphosphate (12% phosphorus) as the phosphorus source, and potassium chloride (60% potassium) as the potassium source. The nutrient application ratio was N:P2O5:K2O = 1:0.5:0.5. The total nitrogen application rate was set at 240 kg/ha, distributed in a ratio of 6:2:2 across the basal, jointing, and booting stages. A total of 50% of the phosphorus and potassium fertilizers were applied as basal fertilizer, while the remaining 50% was incorporated at the jointing stage. The basal fertilizer was applied before sowing, the jointing fertilizer was administered when the leaf age reached 2.5 leaves, and the booting fertilizer was applied at the flag leaf stage (Figure 1A).

2.2. Data Collection

2.2.1. Field Sampling

Random sampling was conducted in the experimental field on 14 March 2024, during the jointing stage, with all samples collected uniformly between 10:00 and 14:00. The weather conditions on the sampling day were clear and cloudless, with stable sunlight, providing optimal conditions for image acquisition and contributing to consistent and comparable data collection across treatments. The samples were divided into 12 experimental groups based on four wheat varieties—Yangmai 25, Yangmai 28, Yangmai 30, and Yangmai 39—and three sowing dates—November 1, November 20, and December 10. Each group was randomly assigned 30 plants, for a total of 360 samples. A second random selection was then performed within each experimental group, selecting 10 plants from the 30 collected samples, resulting in a final total of 120 plants (Figure 1B).

2.2.2. Image Acquisition

Each sample’s main stem and tillers were separated, and the leaves were removed. The detached leaves were arranged sequentially from top to base, positioned from left to right, secured with a transparent plate, and scanned using a VF3240 scanner (Beijing Weishan Technology Co., Ltd., Beijing, China). The scanned images were uniformly set to a resolution of 300 DPI (dots per inch) (Figure 1B) for both horizontal and vertical dimensions and saved into 12 folders, based on different treatments, to enable comparisons of the effects of different growth stages on winter wheat leaf morphology.

2.3. Experimental Methods

2.3.1. Image Preprocessing

The original images were edited to remove leaves affected by physical damage or natural aging, retaining only intact leaves with normal physiological and biochemical functions [16,17]. Large-scale noise that could not be eliminated through morphological opening and closing operations [18] was also excluded. Additionally, leaf length and width were annotated. For image processing, MATLAB R2023b (The MathWorks, Inc., Natick, MA, USA) was employed to extract leaf-related information. The preprocessed leaf images were read and converted from the RGB to HSV color space [19]. An HSV color threshold was defined to create a binary mask, followed by denoising and morphological operations to smooth the image. Meanwhile, “bwlabel” was applied to identify all green regions and sort them by area. Given the high noise levels in some images, the five largest regions were selected for further analysis. Their areas were computed, and “regionprops” was applied to extract R, G, and B spectral values. The five largest regions were then annotated on the image, showing region numbers and centroid coordinates. Finally, “isoutlier” was used to filter out anomalous RGB values, along with their corresponding leaf areas. The total effective leaf area and mean values for each wheat plant and stem were computed, along with an analysis of leaf length, leaf width (the maximum width of the leaf measured perpendicular to the midrib), and aspect ratio under different treatments (Figure 1C).

2.3.2. Data Processing

The majority of the selected wheat samples contained 2 to 3 tillers. Each stem, including the main stem, typically had around four leaves, exhibiting normal physiological and biochemical functions. Thus, the images associated with each treatment included a minimum of 140 leaves as the foundation for analysis. Due to the black background of the image, the mean RGB values are reduced. To enhance brightness and contrast, gamma correction [20] was applied, with a gamma value set to 0.5. After correction, the image was saved, and the RGB values were adjusted accordingly. The specific formula used is as follows [21]:
Gamma Correction = (255 × rgb_values/255)2
This study employs gamma-corrected data to apply four grayscale transformation formulas (Table 2) and calculates the weighted grayscale average and standard deviation for the same wheat variety and sowing date. This analysis aims to assess the impact of different treatments on wheat leaf color.
Building upon previous research, this experiment incorporates the extracted R, G, and B spectral bands to derive 14 standard leaf color indices (Figure 1D, Table 3) as essential indicators of leaf development. Furthermore, a pairwise correlation analysis was performed on the extracted indices. The specific calculation formulas are as follows:

3. Results

3.1. The Impacts of Sowing Dates on Leaf Morphology

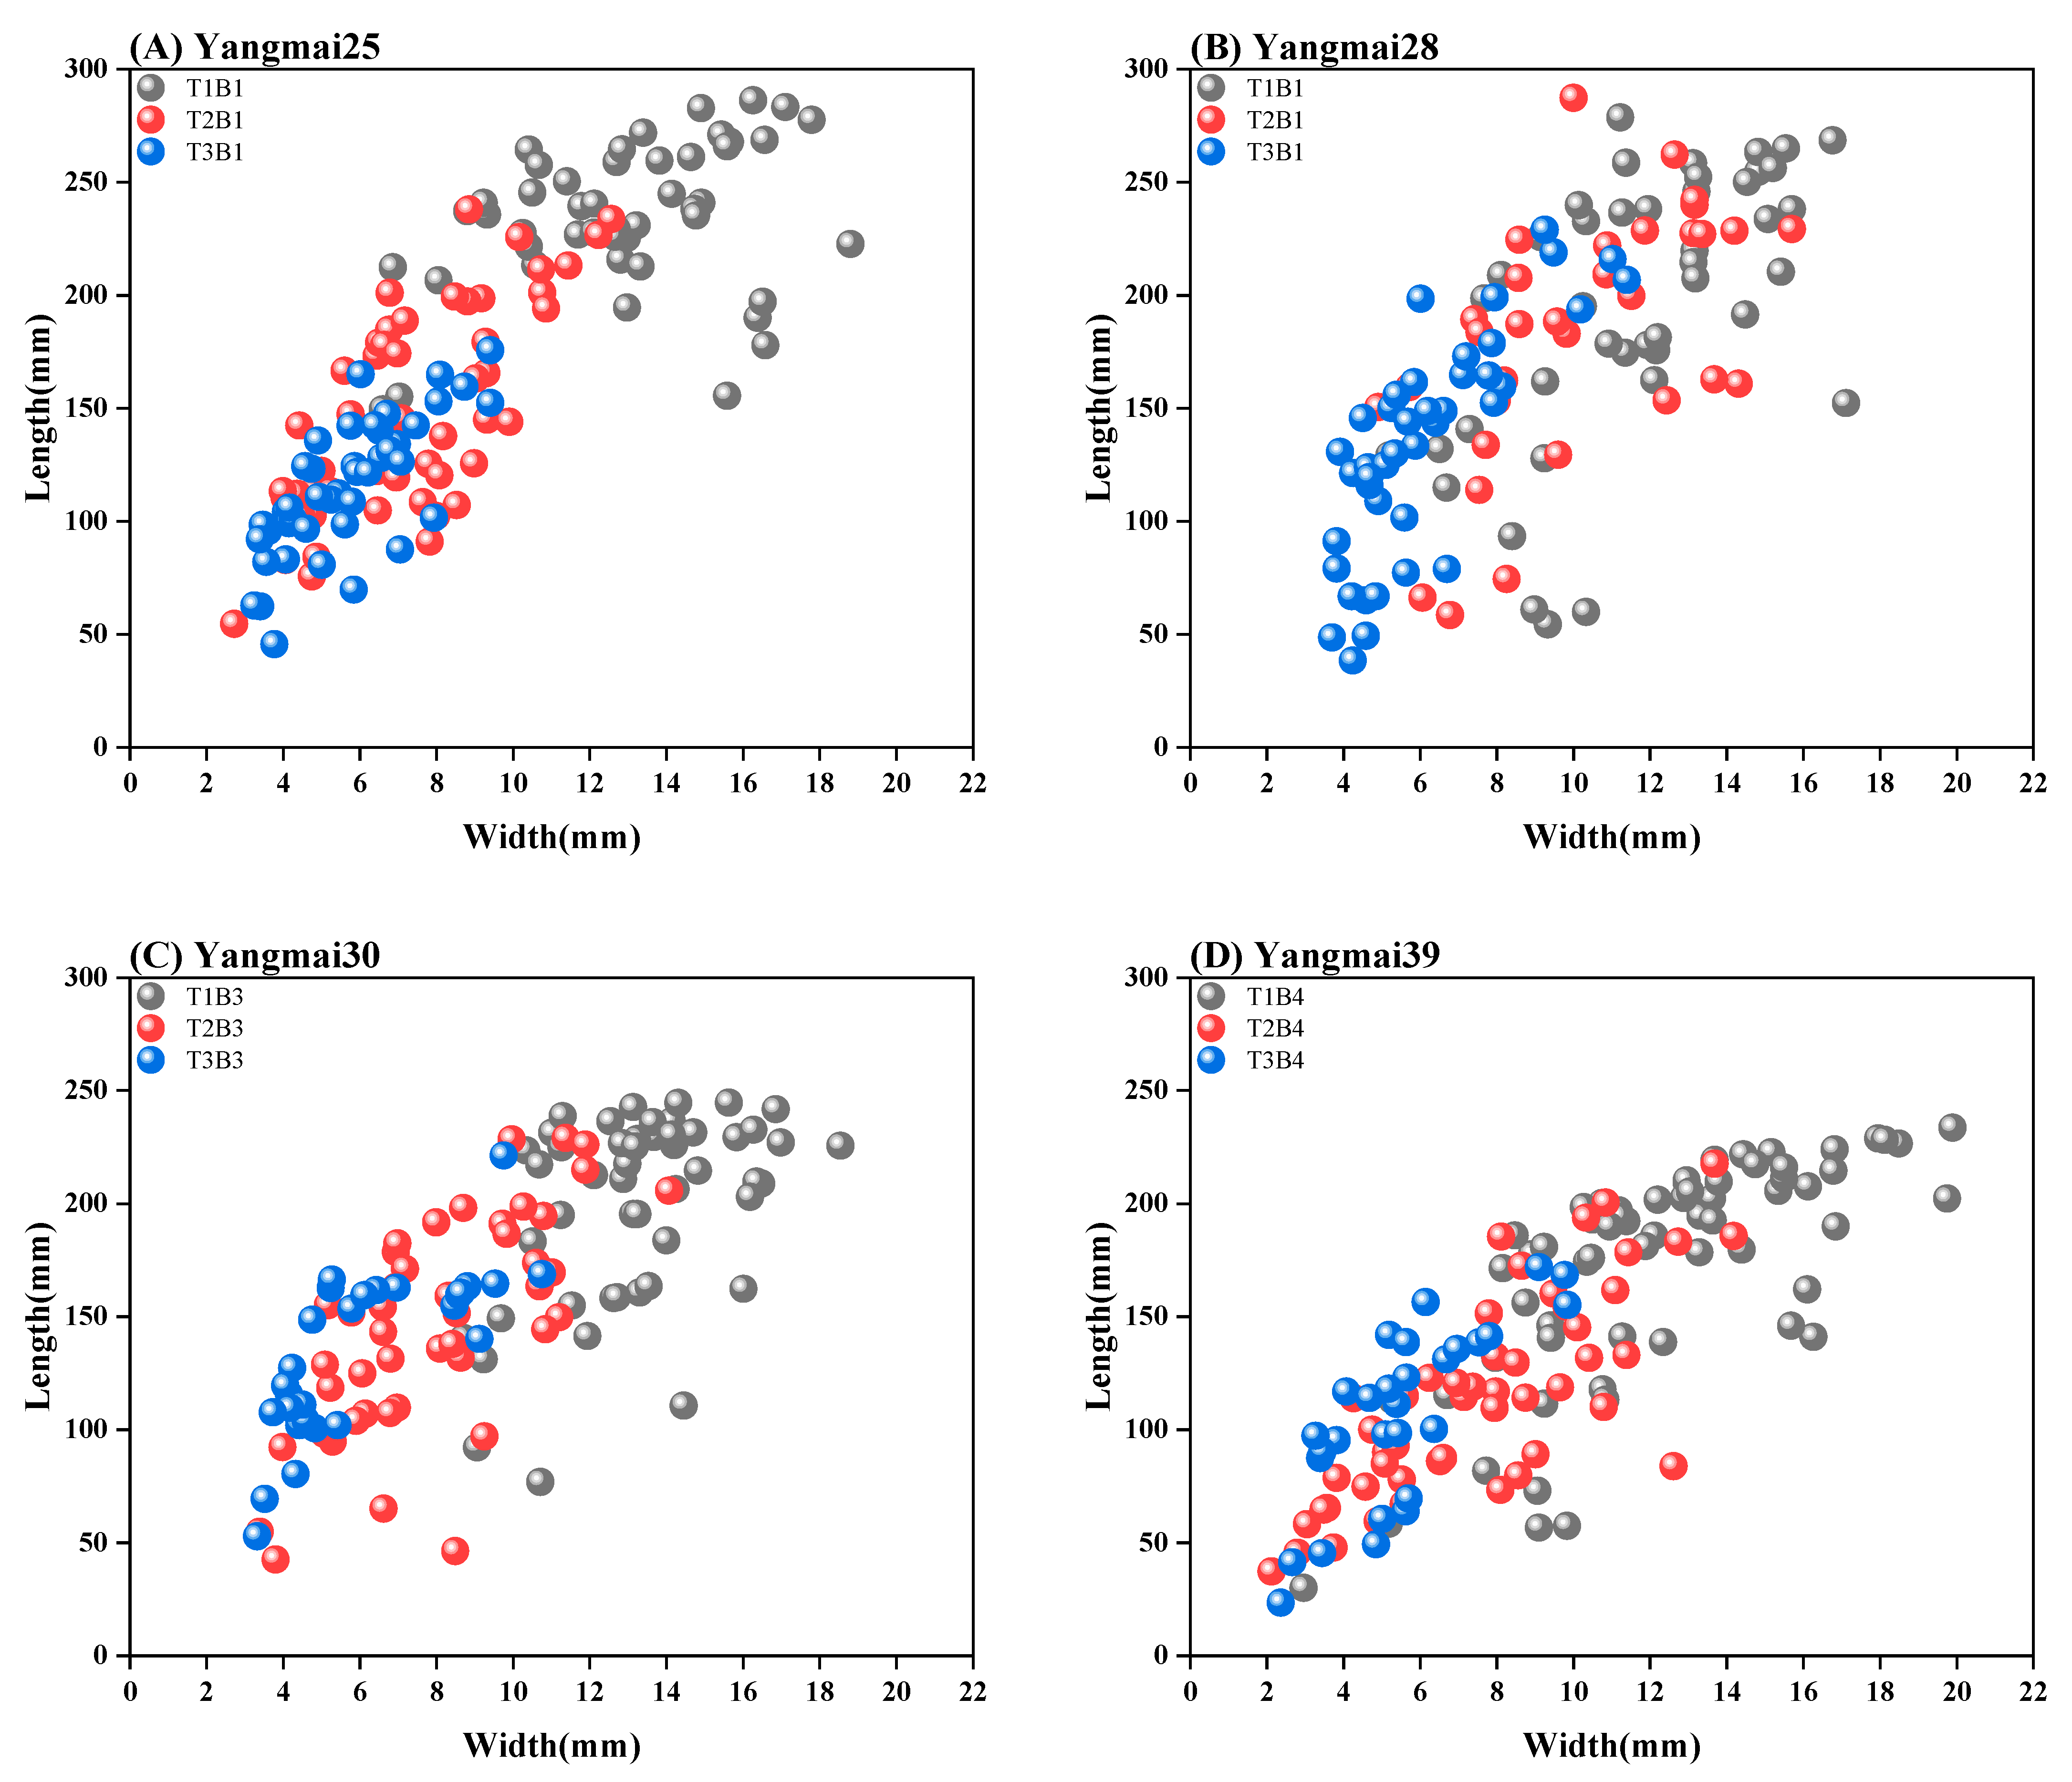
The research findings indicate that as the sowing date is delayed, the leaf length of winter wheat at the jointing stage exhibits a quadratic decline, accompanied by a reduction in leaf width, as shown in Figure 2. However, the leaf length-to-width ratio tends to increase, as presented in Table 4. Among the studied varieties, the leaf length of Yangmai 30 is minimally affected by sowing date, showing a slight 1% increase when sowing is delayed compared the results for late sowing. In contrast, Yangmai 25 demonstrates higher sensitivity to sowing date changes, experiencing a twofold reduction in leaf length following a 40-day delay, along with a more than 120% decrease in leaf width. Conversely, the leaf width of Yangmai 28 remains relatively stable across different sowing dates. For both timely and late-sown wheat, the leaf length-to-width ratio of Yangmai 39 remains consistent, whereas for Yangmai 25, the flag leaf length-to-width ratio tends to converge among individuals subjected to late and very late sowing conditions.

3.2. The Impacts of Different Treatments on the Leaf Area of Winter Wheat

In this experiment, as shown in Figure 3, the target leaf area was defined within a range of 50 to 4250 mm2. Leaves were categorized into two primary groups based on stem type, i.e., main stem and tillers. These groups were further subdivided into 12 major categories according to treatment conditions, resulting in a total of 24 subgroups.
Under the T1 sowing date, although Yangmai 28 exhibited the largest single-leaf area on the main stem, its tiller leaves exhibited considerable variation in regards to development, with relative deviations of 695.88 mm2 and 722 mm2, respectively. In contrast, the leaf development of Yangmai 25 was more uniform, with relative deviations remaining below 600 mm2. Additionally, Yangmai 39 showed the highest leaf count. Under the T2 sowing date, Yangmai 25 had the highest number of leaves, while Yangmai 28 exhibited the most robust leaf development, with mean leaf areas of 2753.98 mm2 and 2621.06 mm2 for the main stem and tillers, respectively. Among the four varieties, Yangmai 28 displayed the greatest variation in leaf area, with deviations exceeding 500 mm2, yet it also displayed the largest tiller leaves. Conversely, Yangmai 39 showed less variation among leaves but exhibited relatively weaker development. Under the T3 sowing date, Yangmai 25 continued to display the highest leaf count, while Yangmai 28 maintained the most vigorous leaf growth. In contrast, Yangmai 39 exhibited the weakest development, with an average main stem leaf area of less than 720 mm2 and only 335.54 mm2 on the tillers. Among all varieties, Yangmai 30 showed the lowest individual leaf area variation, with deviations remaining under 240 mm2.
As illustrated in Figure 4, the development of winter wheat leaves is significantly affected by the sowing date. With delayed sowing, various leaf morphological parameters exhibit an exponential decline. Wheat sown on November 1 (T1) exhibited the largest leaf area, with significant differences observed among varieties. By November 20 (T2), as sowing was delayed, the leaf area decreased substantially, and individual differences within the population became less pronounced. By December 10 (T3), the leaf area reached its lowest level, with both inter-varietal and intra-varietal differences in leaf area further diminishing.
For the T1 sowing date, Yangmai 28 had the largest leaf area, measuring 15,830 mm2, with a standard deviation of 4533.21 mm2, indicating substantial variability among individuals. Yangmai 39 exhibited a leaf area of 20,474 mm2, but its within-group standard deviation was relatively low, suggesting more uniform development. In contrast, Yangmai 30 had a smaller leaf area of 18,368 mm2. For the T2 sowing date, all varieties experienced a significant reduction in leaf area. The leaf area of Yangmai 39 declined to 7589 mm2, with a standard deviation of 4134.29 mm2, reflecting the highest variation among varieties at this stage and the most pronounced imbalance in individual development. The leaf area of Yangmai 28 decreased to 9659 mm2, showing a smaller decline compared to that of other varieties. Yangmai 25 had a leaf area of 9861 mm2, slightly higher than Yangmai 28, with relatively reduced individual variation. In comparison, Yangmai 30 exhibited a more pronounced decline, with its leaf area shrinking to 8898 mm2. For the T3 sowing date, the leaf area of all varieties reached its lowest levels. Yangmai 39 recorded a leaf area of only 3221 mm2, marking a reduction of over 84% compared to that of T1, indicating substantial developmental delays. Yangmai 28 demonstrated strong resilience under late and very late sowing conditions, maintaining a leaf area of 6067 mm2. Yangmai 25 and Yangmai 30 exhibited leaf areas of 5183 mm2 and 4068 mm2, respectively, with further reductions in individual variation, leading to more balanced overall development.
As shown in Table 5, Yangmai 28 exhibited lower sensitivity to late sowing, with an effective leaf area growth rate approaching 60% and a relatively small growth curvature. In contrast, delayed sowing led to a sharp decline in the effective leaf area of Yangmai 39, with the difference between T1 and T2 reaching nearly 1.7 times, and the difference between T1 and T3 surging to 535.63%, the largest observed reduction. Overall, as the sowing date was delayed, the variation in effective leaf area became less pronounced. However, the decrease in leaf area for Yangmai 28 during the late and very late sowing periods was slightly more substantial than the reduction observed between the optimal and late sowing dates.

3.3. The Impacts of Sowing Dates on Leaf Color Intensity

Table 6 presents the weighted RGB values. The experiment revealed that the original data were significantly distorted due to the black background. However, applying gamma correction with a gamma value of 0.5 effectively enhanced image contrast and brightness, mitigating the distortion.
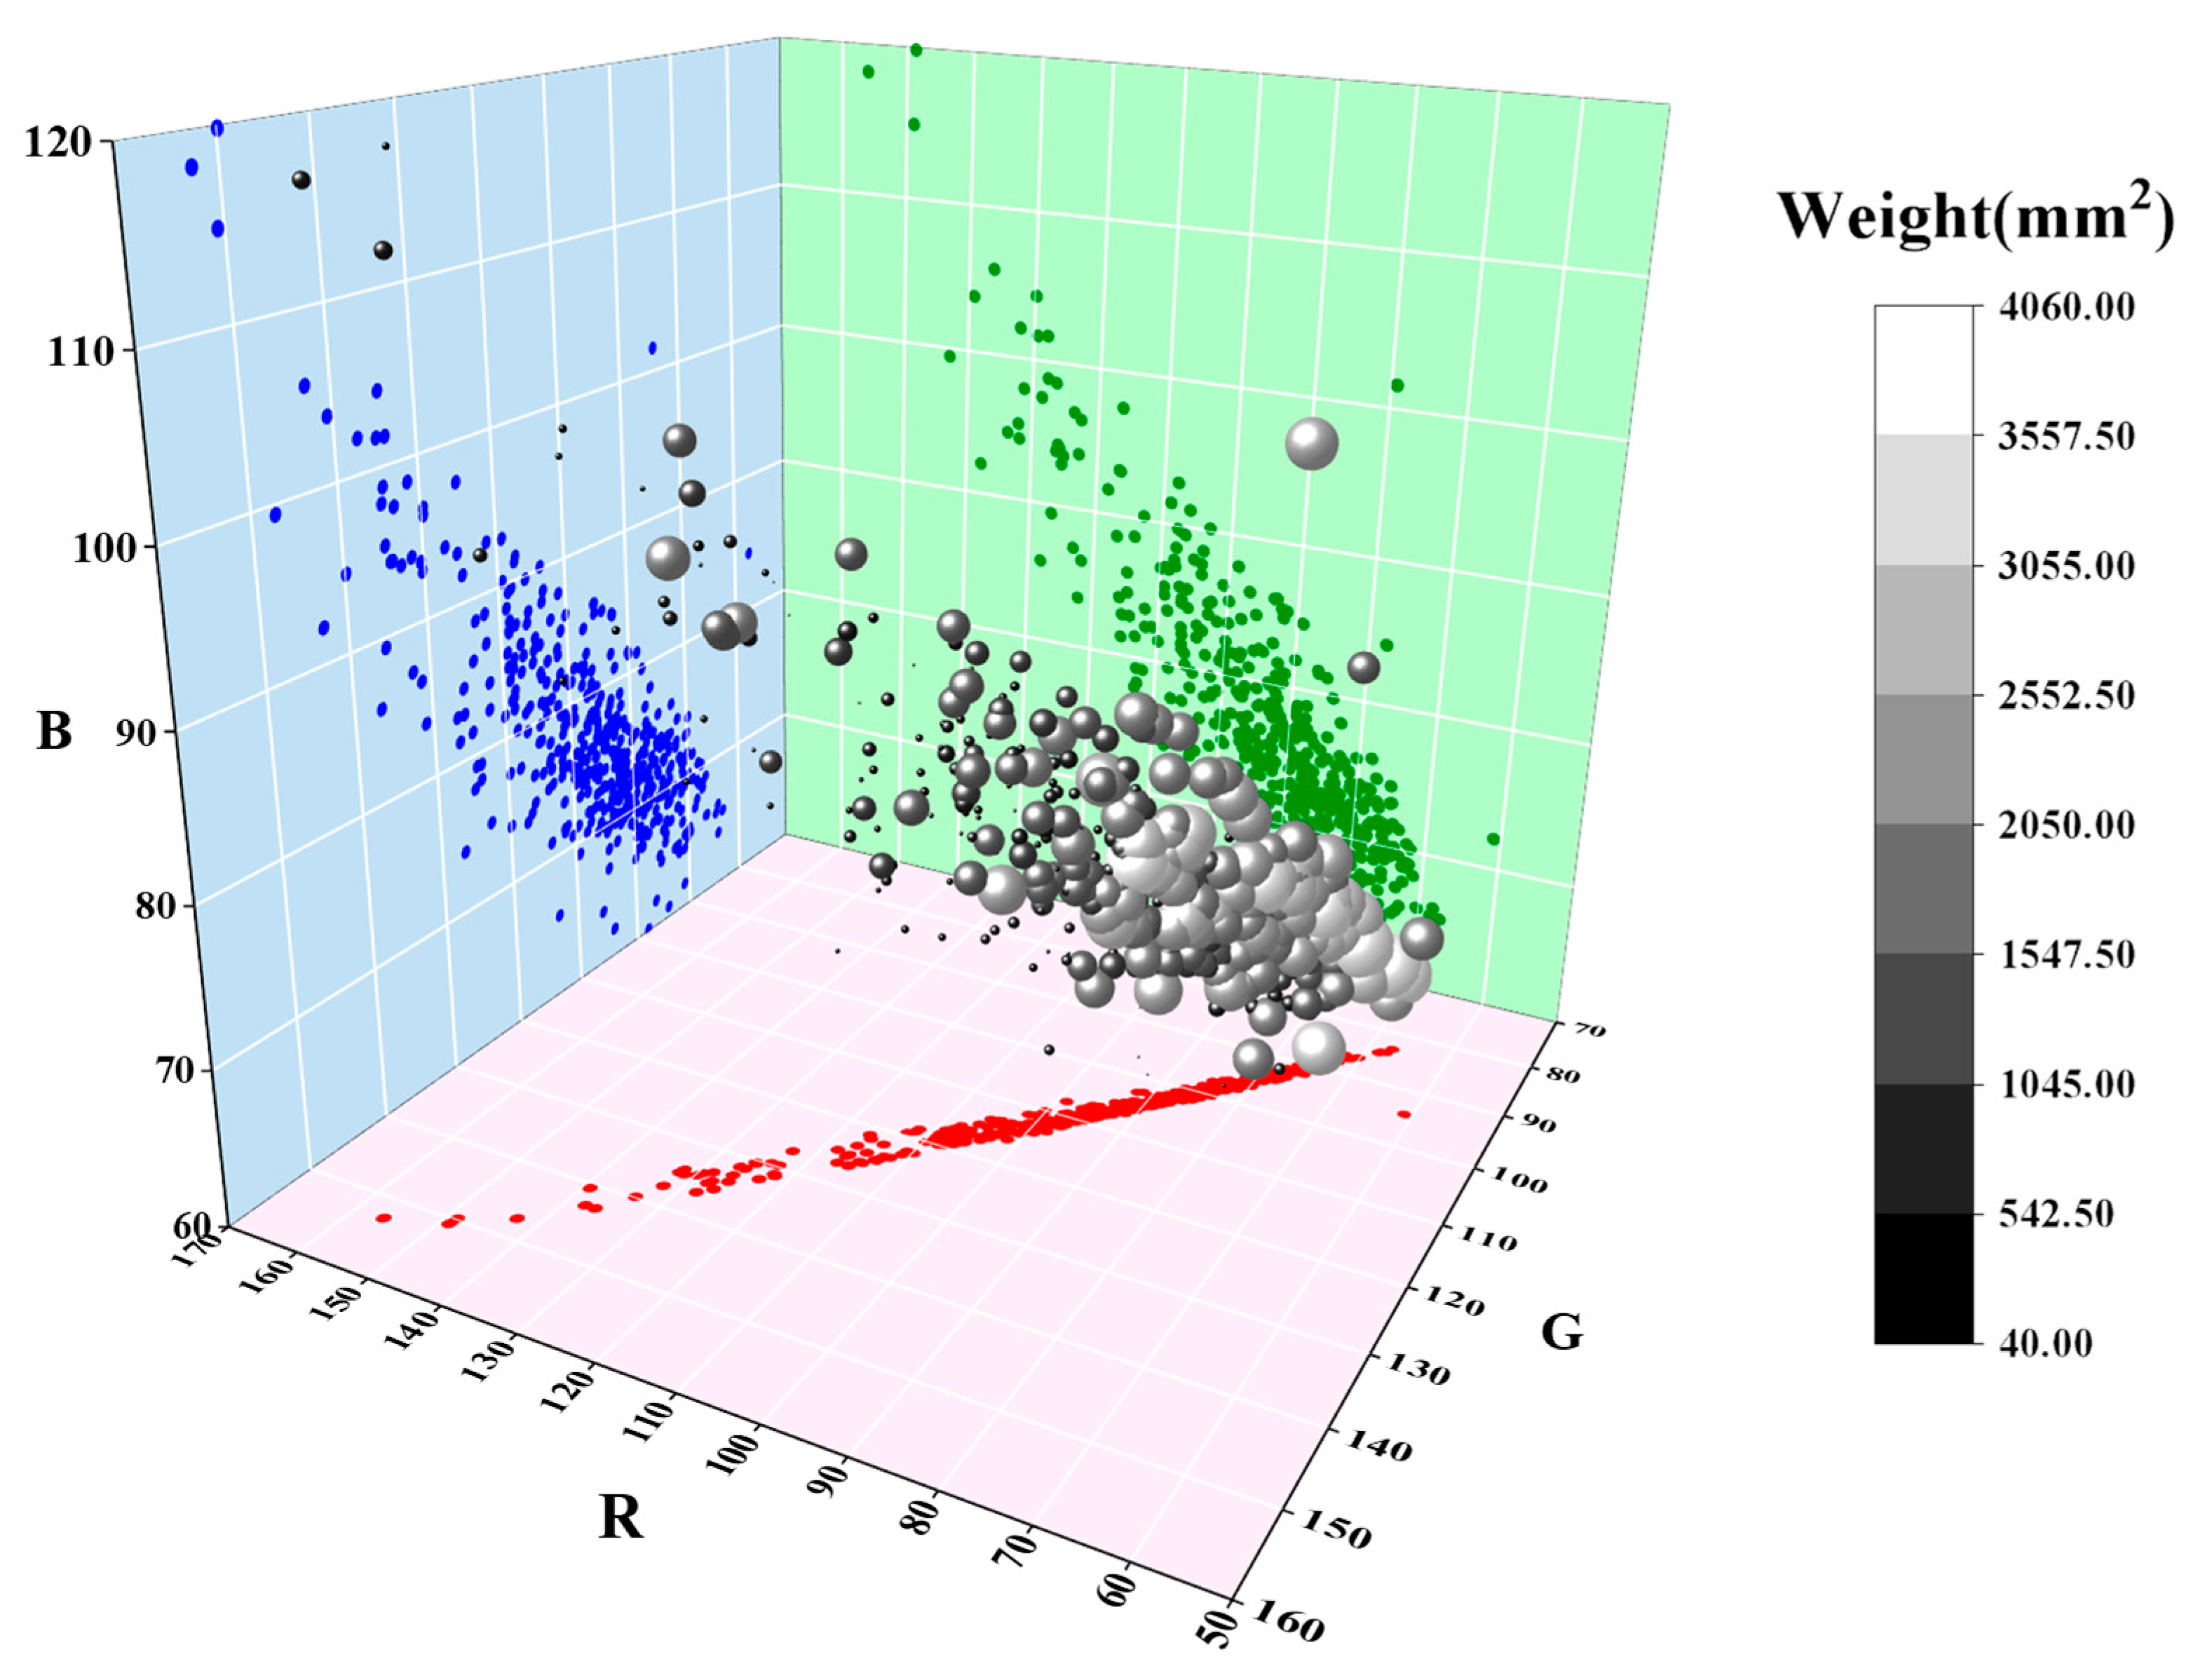
The corrected leaf images were integrated into a 3D model. As shown in Figure 5, each sphere represents an individual leaf. Leaf size ranges from 542.50 to 1547.50, with larger leaves assigned higher weights, resulting in spheres that appear both larger and brighter. The RGB values of each sphere are plotted along the coordinate axes, where red dots represent R, green dots represent G, and blue dots represent B. The corrected wheat leaves’ RGB values are primarily concentrated within the ranges of 70–110 for R, 80–120 for G, and 65–90 for B, respectively.
The data in Table 6 were processed using Formulas 1 to 4, yielding the values presented in Table 7. Lower values indicate darker leaf coloration.
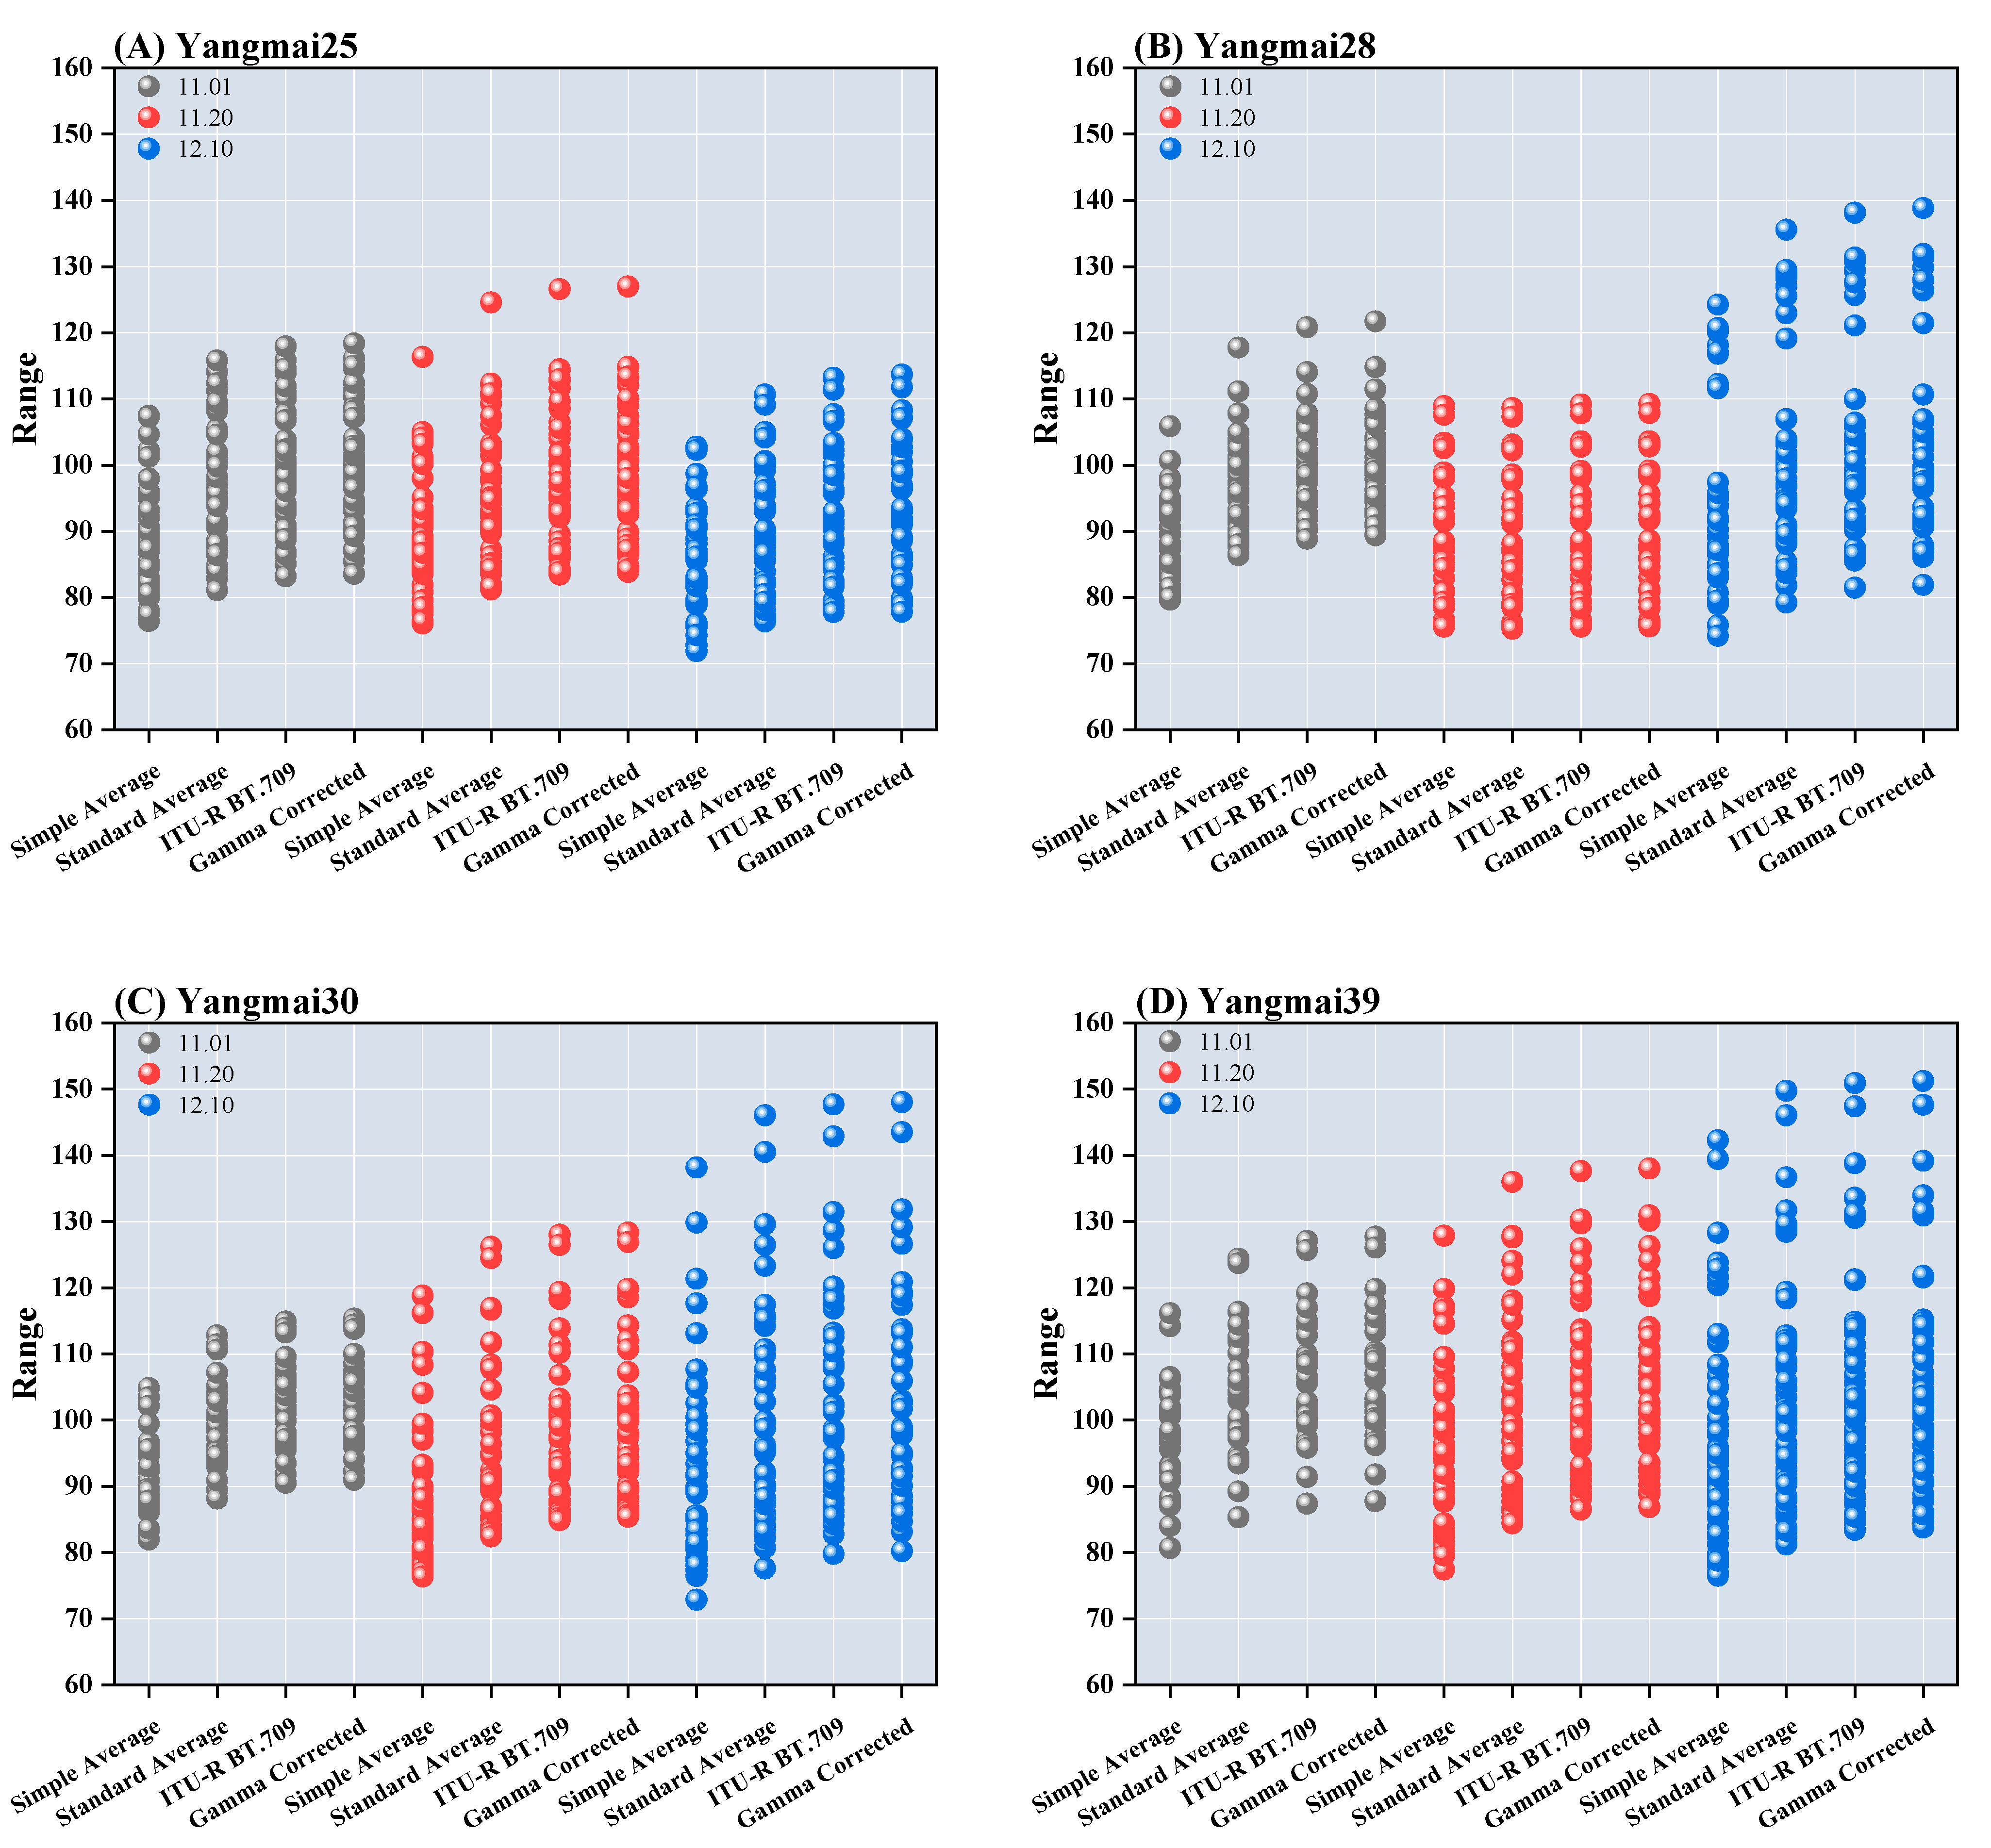
For different sowing dates, the leaf color of Yangmai 25 exhibited relatively stable variation, with grayscale values consistently ranging between 70 and 120 after excluding the influence of extreme outliers and applying the four grayscale transformation formulas. In contrast, the leaf color distribution of the other three varieties remained relatively stable under the optimal sowing date (T1). However, during the late sowing period, slight discontinuities in grayscale distribution were observed, accompanied by larger deviations. Among these varieties, Yangmai 30 and Yangmai 28 exhibited the smallest standard deviations in leaf color under the T1 and T2 sowing dates, respectively, indicating stable development, as illustrated in Figure 6.
This experiment demonstrated that sowing dates had varying effects on leaf color across different wheat varieties, as shown in Figure 7. For Yangmai 25, the grayscale value exhibited a positive correlation with the sowing date, increasing as sowing was delayed. In Yangmai 28, wheat sown during the T2 period exhibited the lightest leaf color at the jointing stage, whereas the darkest leaf color was observed under T3 sowing. In contrast, for Yangmai 30, the darkest leaf color occurred under the latest sowing date, while no significant differences were observed between the other two sowing periods. For Yangmai 39, the leaf color remained relatively consistent between wheat sown on November 1 and November 20; however, wheat sown on December 1 exhibited a slightly lighter leaf color. These findings underscore the impact of sowing date on leaf color development across different wheat varieties.

3.4. The Impacts of Sowing Dates on the Leaf Color Index

Table 8 demonstrates that as the sowing date is delayed, both EXG and EXGR generally exhibit a decreasing trend. For instance, the EXG of Yangmai 25 at the optimal sowing date (T1) is 27.01, but it declines to 20.03 under late sowing (T3), marking a reduction of 25.84%. Similarly, the EXGR of Yangmai 30 decreases from 9.94 at T1 to 8.32 at T3, a decline of 16.30%, indicating a notable reduction in greenness. These trends reflect the adverse effects of lower temperatures and reduced sunlight on late-sown wheat, leading to a decline in leaf physiological activity. Additionally, EXR increases as the sowing date is delayed; for example, the EXR of Yangmai 39 rises from 20.78 at T1 to 25.29 at T3, an increase of 21.69%, suggesting a greater accumulation of red pigments in the leaves. In contrast, NDGI and NPCI exhibit minimal variation with sowing date. The NDGI of Yangmai 25, for example, decreases slightly from 0.16 at T1 to 0.14 at T3, a decline of 12.50%, indicating that overall leaf health remains stable. However, SRPI and VARI experience significant reductions, with the SRPI of Yangmai 28 decreasing from 0.76 at T1 to 0.66 at T3, a reduction of 13.16%, while VARI drops from 0.24 to 0.18, a decline of 25.00%, suggesting that late sowing conditions substantially impair leaf health and coverage. Furthermore, both MGRVI and RGBVI exhibit a downward trend. For example, the MGRVI of Yangmai 30 declines from 0.32 at T1 to 0.28 at T3, a reduction of 12.50%, while RGBVI decreases from 0.44 to 0.42, a decline of 4.55%, indicating that delayed sowing significantly affects vegetation reflectance characteristics. In comparison, RGRI shows relatively minor fluctuations, with values slightly higher under optimal (T1) than under late (T3) sowing conditions. For Yangmai 39, the RGRI decreases from 0.77 at T1 to 0.76 at T3, reflecting only a slight decline of 1.30%, suggesting that the photosynthetic efficiency remains relatively higher under optimal sowing conditions.
Figure 8 presents the correlation matrix, illustrating the relationships between different leaf color indices. The correlation coefficient between EXG and EXR is 0.848, indicating a moderate consistency in representing vegetation greenness. NDGI and EXGR exhibit a correlation coefficient of 0.906, suggesting a high degree of similarity in capturing plant health and leaf color information. The correlation coefficient between EXG and SRPI is −0.908, reflecting a strong negative correlation, implying that their variation trends are inversely related under different leaf conditions. Similarly, the correlation coefficient between RGRI and EXGR is −0.949, demonstrating a strong inverse relationship between photosynthetic efficiency and green band reflectance. Additionally, EXGR and RGBVI share a correlation coefficient of 0.811, indicating high consistency in representing red pigment accumulation and overall leaf reflectance. Conversely, some indices exhibit relatively weak correlations. For instance, RGBVI and EXR have a correlation coefficient of 0.0725, highlighting significant differences in the types of information they capture. The correlation coefficients between RI and EXG, as well as EXGR, are −0.166 and −0.17, respectively, with similarly low correlations observed with most other indices, suggesting that RI functions independently in the analysis of red-edge features. The correlation coefficient between NGBDI and RI is −0.287, indicating a weak correlation with other indices, while highlighting its potential for analyzing blue-green light reflection characteristics in leaves. Finally, VARI and RGBVI exhibit a moderate correlation of 0.397, suggesting that VARI complements RGBVI in regards to analyzing specific vegetation characteristics.

4. Discussion

4.1. Analysis of the Effects and Patterns of Sowing Dates

This study systematically investigated the effects of sowing date on winter wheat leaf morphology, color, and leaf color indices using RGB image analysis technology. The results revealed that delayed sowing induced significant changes in leaf morphological parameters, with leaf length, width, and area exhibiting a decreasing trend. The observed trends in leaf morphological changes across different sowing dates were consistent with the results of previous studies, indicating that late-sown plants experience a shortened growth cycle, which restricts leaf development and leads to an overall decline in morphological traits [38]. Further analysis demonstrated that delayed sowing had a notable impact on winter wheat leaf color, resulting in progressively lighter leaf coloration. This phenomenon may be attributed to chlorophyll depletion, increased anthocyanin accumulation, and reduced photosynthetic efficiency. Additionally, greenness indices (EXG, EXGR) decreased significantly with delayed sowing, whereas the red pigment index (EXR) exhibited an increasing trend. These findings suggest that pigment composition adjustments occur in late-sown wheat, potentially due to low-temperature stress, insufficient light, or physiological metabolic changes, leading to reduced chlorophyll content and increased red pigment accumulation. Varietal differences in sensitivity to sowing date were also observed. Experimental data indicated that Yangmai 28 exhibited minimal changes in leaf morphology and color across different sowing dates, demonstrating strong environmental adaptability. In contrast, Yangmai 39 experienced a significant reduction in leaf area and pronounced color changes under late sowing conditions, suggesting lower adaptability to delayed sowing. Furthermore, delayed sowing led to a substantial decline in the photosynthetic efficiency index (VARI), indicating a reduction in photosynthetic activity under late sowing conditions, which in turn affected growth rate and biomass accumulation. In summary, delayed sowing influences both leaf morphology and physiological traits, including color characteristics. These changes may have significant implications for final crop yield and quality.

4.2. Evaluation of the Method

The majority of selected wheat samples contained 2 to 3 tillers, and each plant, including the main stem, had approximately four leaves with normal physiological and biochemical functions. Thus, each treatment contained at least 140 leaves as the foundational dataset. On this basis, the study employed HSV color space transformation and green masking techniques for the automatic segmentation of winter wheat leaves. To optimize leaf recognition precision, median filtering [39], morphological operations, and connected region detection techniques [40] were applied. During leaf information extraction, DPI data were used to convert the pixel area into physical dimensions, enhancing the accuracy of the leaf phenotypic measurements. Additionally, gamma correction was implemented to adjust for background RGB deviations, ensuring stable leaf color information and preventing distortions caused by lighting conditions or imaging equipment. During data processing, various grayscale conversion formulas were applied to quantify the leaf color characteristics. A comparative analysis of different formulas confirmed that Formula 4 exhibited superior performance in restoring color details in the low-brightness regions. After further calculating the leaf color indices [41], correlation analysis was conducted to assess their applicability, ensuring that the extracted phenotypic traits effectively represented the growth status of winter wheat leaves.
This study aimed to investigate the phenotypic responses of winter wheat leaves under different sowing date conditions. Data collection was uniformly conducted during the jointing stage, with all treatment groups sampled during the same time window and under consistent field management practices to ensure uniform experimental conditions and the comparability of the results. To reduce the influence of environmental variability, the experimental design prioritized stability in variable control. Environmental factors were not included as independent variables in the analysis. Except for the basic weather conditions recorded on the sampling day, no systematic environmental data were collected during the experiment, nor were such data supplemented in later stages. The potential influence of environmental factors on phenotypic responses will be further investigated in future studies.
In recent years, convolutional neural networks (CNNs) have gained widespread application in agricultural remote sensing and plant phenotyping tasks due to their robust capabilities in regards to automatic feature extraction. These models have demonstrated high recognition accuracy, particularly when applied to large-scale annotated datasets. For instance, Verma et al. developed a lightweight CNN model with 387,340 parameters, achieving an overall recognition accuracy of 84.4% in disease classification tasks involving maize, rice, and wheat [42]. Despite these advantages, CNN models are often constrained by their high dependency on large training datasets and computational resources. Their complex architectures and lengthy training times pose practical limitations, especially in resource-constrained scenarios. Mahony et al. further noted that deep learning models tend to exhibit significant performance degradation when trained on limited data, with a heightened risk of overfitting [43]. This study focuses on pixel-level feature extraction and the structural analysis of wheat leaf images—a relatively low-complexity task involving a limited number of samples. In the preliminary phase, we attempted to train a CNN model on a small dataset, but the results revealed unstable feature extraction, extended training times, and no notable performance advantage. To ensure methodological feasibility, result stability, and interpretability, we ultimately adopted a traditional image processing approach using the MATLAB R2023b (The MathWorks, Inc., Natick, MA, USA). This method leverages functions such as grayscale transformation, edge detection, and morphological processing to extract features in a stable and consistent manner, without requiring model training. It is computationally efficient and well-suited to the data scale and experimental context of this study. As highlighted by Münke et al., traditional image processing techniques offer greater efficiency and controllability in environments with limited computational power or when task objectives are well defined [44]. The image analysis pipeline developed in this study is characterized by ease of development, high computational efficiency, and transparency, making it particularly suitable for researchers who require visual interpretability and real-time parameter adjustments. Compared to deep learning methods that rely on extensive training and parameter tuning, the proposed approach offers enhanced portability and generalizability. It is well adapted to diverse experimental settings, reliable, and capable of consistently extracting key phenotypic traits.
The image data employed in this study were RGB images, which include only the red, green, and blue bands within the visible light spectrum. As a result, near-infrared (NIR) information was unavailable, rendering the calculation of indices such as NDVI infeasible. Accordingly, NDVI was not included in the scope of this analysis. Instead, we systematically compared a range of vegetation indices derived from RGB bands and ultimately selected EXG, EXR, and EXGR as the primary analytical indices. As shown in Table 8, under treatment B4, the EXR value increased from 20.78 in T1 to 25.29 in T3, with a variation of 4.51. The maximum change in EXG also exceeded 3 units, reflecting its strong sensitivity to sowing date differences. Correlation analysis further revealed that EXGR exhibited significant linear associations with multiple indices, including a correlation coefficient of 0.906 with NDGI and 0.811 with RGBVI, indicating its stability and strong capacity to convey phenotypic information. In contrast, while VARI showed moderate correlations with certain indices (e.g., 0.91 with MGRVI), its value varied minimally across sowing date treatments, with a maximum difference of only 0.04. This limited variability restricts its ability to characterize changes in leaf coloration, suggesting a weaker response to sowing date variation. Consequently, VARI was not included as a core analytical index in this study.

4.3. Application and Extension of the Method

The method proposed in this study exhibits strong transferability and is theoretically applicable to the leaf morphology analysis of Poaceae crops such as wheat, rice, and maize. These crops commonly share structural features such as narrow, lanceolate leaves with parallel venation, which provides a morphological basis for extending image processing methods across species., Hamuda et al. utilized HSV color space in combination with morphological operations to achieve effective segmentation of maize, soybean, and weed populations, further supporting the general applicability of these techniques across different crop species [45]. However, this study focuses on wheat, primarily due to its pivotal role in global food production and its sensitivity to environmental changes, making it an ideal model crop for detailed phenotypic analysis.
Focusing on a single crop presents multiple advantages in research. The growth cycle, phenotypic characteristics, and response mechanisms of wheat to environmental changes have been extensively studied, enabling this research to precisely develop leaf morphology and color analysis models. Compared to multi-crop studies, single-crop research reduces experimental variables, enhances data collection stability, and improves result reproducibility. Studies have shown that image analysis methods optimized for specific crops achieve higher accuracy and robustness in regards to leaf feature extraction and phenotypic quantification [46]. Although multi-crop approaches exhibit broader applicability, they typically require additional calibration and crop-specific parameter adjustments, increasing computational complexity and reducing adaptability. Furthermore, single-crop research provides a foundational framework for subsequent cross-crop analyses, improving the efficiency of model deployment and application.
Although this study focuses on wheat, the methodology is equally applicable to the growth monitoring and management optimization of other Poaceae crops. In rice, leaf morphology, color, and color indices are closely related to growth and yield, enabling quantitative analysis of phenotypic traits under different sowing dates or nitrogen managements [47]. Similarly, this method can be applied to maize and sorghum for analyzing leaf area index (LAI), color variation, and photosynthetic efficiency, supporting the optimization of planting density and precision field management [48,49]. Furthermore, this approach is highly valuable for monitoring crop disease and responses to drought and nutrient stress. In the early detection of diseases such as rice blast and maize brown spot, changes in leaf color indices serve as key indicators. RGB image-based analysis facilitates large-scale disease monitoring, improving the precision of agricultural disease prevention and control [50]. Future integration with artificial intelligence (AI) and deep learning could lead to the development of an intelligent RGB image-based crop phenotyping system, enhancing automation in leaf trait extraction, improving analysis efficiency and accuracy, and expanding applications for crop monitoring, agricultural management, and smart farming.

5. Conclusions

This study focuses on the leaf phenotypes of winter wheat to investigate the effects of sowing date and variety. By integrating methods such as green HSV masking and grayscale transformation, a systematic analysis of leaf color and leaf area was conducted, leading to the following conclusions:
(1)
The sowing date significantly influences winter wheat leaf morphology. Specifically, as sowing is delayed, the leaf length-to-width ratio decreases gradually, following a convex relationship. This results in a reduction in the leaf length-to-width ratio across varieties, indicating a negative correlation between this ratio and the delayed sowing date.
(2)
The leaf area exhibits an exponential decline with delayed sowing. Across all winter wheat varieties, leaf area decreases significantly, with an average reduction of more than 59% for every 20-day delay in sowing. Among the varieties, Yangmai 28 is less sensitive to temperature fluctuations, showing an average reduction of 61.54%, whereas Yangmai 39 is the most affected, with a decline of up to 148.20%. A comprehensive analysis indicates that Yangmai 25 is slightly less affected by sowing date changes compared to Yangmai 30 and Yangmai 39, but is still more sensitive than Yangmai 28.
(3)
The leaf color responses to delayed sowing vary among different varieties. The leaf color of Yangmai 25 and Yangmai 39 gradually darkens with later sowing dates, exhibiting an overall positive correlation with sowing delay. In contrast, Yangmai 28 displays a lighter leaf color under late sowing, which deepens significantly under very late sowing, following an opposite trend to that of Yangmai 30. Overall, Yangmai 25, under the optimal sowing date, Yangmai 30, under late sowing, and Yangmai 28, under very late sowing, exhibit darker leaf colors compared to those of other varieties, providing them with a photosynthetic advantage. Conversely, Yangmai 39 maintains a lighter leaf color across all sowing dates.
(4)
The sowing date significantly impacts winter wheat leaf color indices. As sowing is delayed, EXG and EXGR indices decline, reflecting a reduction in greenness, while the EXR index increases, indicating red pigment accumulation. The declines in the SRPI and VARI indices suggest a deterioration in leaf health. Correlation analysis reveals notable differences among various leaf color indices. The correlation between NDGI and EXGR is 0.906, indicating strong consistency in representing leaf health and color. Similarly, EXG and EXR exhibit a correlation of 0.848, suggesting high consistency in extracting leaf color variation features. However, such high correlations may indicate multicollinearity issues, necessitating the selection of indices with lower correlations. For example, RI, which displays correlations of −0.166 with EXG and −0.17 with EXGR, was selected for independent red-edge analysis. Additionally, RGRI shows a correlation of 0.0338 with SRPI and 0.702 with EXR, indicating that RGRI independently captures different leaf characteristics. Meanwhile, RGBVI exhibits a correlation of 0.569 with EXG and 0.811 with EXGR, suggesting that RGBVI can complement feature extraction from other dimensions.

Author Contributions

Conceptualization, J.C.; data curation, J.C. and J.L.; formal analysis, J.C. and J.W. (Jiacheng Wang); funding acquisition, J.W. (Jianliang Wang) and L.Z.; investigation, J.C. and C.S.; methodology, J.C. and T.L.; software, J.C. and Z.W.; supervision, L.Z. and H.X.; validation, J.W. (Jiacheng Wang) and Y.Y.; writing—original draft, J.C. and J.W. (Jianliang Wang); writing—review and editing, J.C. and J.W. (Jianliang Wang). All authors have read and agreed to the published version of the manuscript.

Funding

This research was supported by the Jiangsu Students’ Platform for Innovation and Entrepreneurship Training Program [202411117217Y]; the National Key Research and Development Program of China [2023YFD1202200]; the National Natural Science Foundation of China [32172110]; and the Open Project of the Key Laboratory of Smart Agriculture Technology Integration and Application Innovation, Ministry of Agriculture and Rural Affairs [KF2501].

Institutional Review Board Statement

This study did not require ethical approval.

Data Availability Statement

The original contributions presented in this study are included in the article; further inquiries can be directed to the corresponding author.

Conflicts of Interest

The authors declare that they have no known competing financial interests or personal relationships that could have appeared to influence the work reported in this paper.

References

  1. Minoli, S.; Jägermeyr, J.; Asseng, S.; Urfels, A.; Müller, C. Global crop yields can be lifted by timely adaptation of growing periods to climate change. Nat. Commun. 2022, 13, 7079. [Google Scholar] [CrossRef]
  2. Hussain, I.; Ijaz, M.; Ul-Allah, S.; Sattar, A.; Sher, A.; Nawaz, A.; Ghaffar, A.; Rahman, M.H.U.; Ahmad, S.; Rasheed, I.; et al. Optimum zinc fertilization and sowing date improved growth, yield components, and grain Zn contents of bread wheat under different tillage systems. J. Soil Sci. Plant Nutr. 2023, 23, 2344–2353. [Google Scholar] [CrossRef]
  3. Subedi, K.; Ma, B.; Xue, A. Planting date and nitrogen effects on grain yield and protein content of spring wheat. Crop Sci. 2007, 47, 36–44. [Google Scholar] [CrossRef]
  4. Kosina, R. Morphometry of lodicules in the genus Triticum L. Genet. Resour. Crop Evol. 2011, 58, 1129–1142. [Google Scholar] [CrossRef]
  5. Fernandez-Gallego, J.A.; Kefauver, S.C.; Vatter, T.; Gutiérrez, N.A.; Nieto-Taladriz, M.T.; Araus, J.L. Low-cost assessment of grain yield in durum wheat using RGB images. Eur. J. Agron. 2019, 105, 146–156. [Google Scholar] [CrossRef]
  6. Zhou, B.W.; Elazab, A.; Bort, J.; Vergara, O.; Serret, M.D.; Araus, J.L. Low-cost assessment of wheat resistance to yellow rust through conventional RGB images. Comput. Electron. Agric. 2015, 116, 20–29. [Google Scholar] [CrossRef]
  7. Xu, K.; Li, H.M.; Cao, W.X.; Zhu, Y.; Chen, R.J.; Ni, J. Recognition of weeds in wheat fields based on the fusion of RGB images and depth images. IEEE Access 2020, 8, 110362–110370. [Google Scholar] [CrossRef]
  8. Deng, J.; Zhou, H.; Lv, X.; Yang, L.; Shang, J.; Sun, Q.; Zheng, X.; Zhou, C.; Zhao, B.; Wu, J. Applying convolutional neural networks for detecting wheat stripe rust transmission centers under complex field conditions using RGB-based high spatial resolution images from UAVs. Comput. Electron. Agric. 2022, 200, 107211. [Google Scholar] [CrossRef]
  9. Zang, H.; Peng, Y.; Zhou, M.; Li, G.; Zheng, G.; Shen, H. Automatic detection and counting of wheat spike based on DMseg-Count. Sci. Rep. 2024, 14, 29676. [Google Scholar] [CrossRef]
  10. Sales, C.R.; Molero, G.; Evans, J.R.; Taylor, S.H.; Joynson, R.; Furbank, R.T.; Hall, A.; Carmo-Silva, E. Phenotypic variation in photosynthetic traits in wheat grown under field versus glasshouse conditions. J. Exp. Bot. 2022, 73, 3221–3237. [Google Scholar] [CrossRef]
  11. Carmo-Silva, E.; Andralojc, P.J.; Scales, J.C.; Driever, S.M.; Mead, A.; Lawson, T.; Raines, C.A.; Parry, M.A. Phenotyping of field-grown wheat in the UK highlights contribution of light response of photosynthesis and flag leaf longevity to grain yield. J. Exp. Bot. 2017, 68, 3473–3486. [Google Scholar] [CrossRef]
  12. Niu, Z.; Liang, N.; He, Y.Y.; Xu, C.J.; Sun, S.S.; Zhou, Z.J.; Qiu, Z.J. A novel method for wheat spike phenotyping based on instance segmentation and classification. Appl. Sci. 2024, 14, 6031. [Google Scholar] [CrossRef]
  13. Zhou, C.Q.; Yang, G.J.; Liang, D.; Hu, J.; Yang, H.; Yue, J.B.; Yan, R.R.; Han, L.; Huang, L.S.; Xu, L.J. Recognizing black point in wheat kernels and determining its extent using multidimensional feature extraction and a naive Bayes classifier. Comput. Electron. Agric. 2021, 180, 105919. [Google Scholar] [CrossRef]
  14. Tian, B.J.; Zhu, J.C.; Liu, X.W.; Huang, S.B.; Pu, W. Interacting leaf dynamics and environment to optimize maize sowing date in North China Plain. J. Integr. Agric. 2020, 19, 1227–1240. [Google Scholar] [CrossRef]
  15. Zhao, W.X.; Zhao, H.Y.; Wang, H.S.; He, Y. Research progress on the relationship between leaf senescence and quality, yield and stress resistance in horticultural plants. Front. Plant Sci. 2022, 13, 1044500. [Google Scholar] [CrossRef]
  16. Song, Y.; Wang, J.F.; Shang, J.L. Estimating effective leaf area index of winter wheat using simulated observation on unmanned aerial vehicle-based point cloud data. IEEE J. Sel. Top. Appl. Earth Obs. Remote Sens. 2020, 13, 2874–2887. [Google Scholar] [CrossRef]
  17. Easlon, H.M.; Bloom, A.J. Easy leaf area: Automated digital image analysis for rapid and accurate measurement of leaf area. Appl. Plant Sci. 2014, 2, 1400033. [Google Scholar] [CrossRef]
  18. Sun, S.Q.; Huang, Y.J.; Inoue, K.; Hara, K. Order space-based morphology for color image processing. J. Imaging 2023, 9, 139. [Google Scholar] [CrossRef]
  19. Barbedo, J.G.A. A novel algorithm for semi-automatic segmentation of plant leaf disease symptoms using digital image processing. Trop. Plant Pathol. 2016, 41, 210–224. [Google Scholar] [CrossRef]
  20. Li, X.S.; Liu, M.L.; Ling, Q. Pixel-wise gamma correction mapping for low-light image enhancement. IEEE Trans. Circuits Syst. Video Technol. 2023, 34, 681–694. [Google Scholar] [CrossRef]
  21. Cao, G.; Huang, L.H.; Tian, H.W.; Huang, X.L.; Wang, Y.B.; Zhi, R.C. Contrast enhancement of brightness-distorted images by improved adaptive gamma correction. Comput. Electr. Eng. 2018, 66, 569–582. [Google Scholar]
  22. Khudhair, Z.N.; Khdiar, A.N.; El Abbadi, N.K.; Mohamed, F.; Saba, T.; Alamri, F.S.; Rehman, A. Color to grayscale image conversion based on singular value decomposition. IEEE Access 2023, 11, 54629–54638. [Google Scholar]
  23. Sowmya, V.; Govind, D.; Soman, K.P. Significance of incorporating chrominance information for effective color-to-grayscale image conversion. Signal Image Video Process. 2017, 11, 129–136. [Google Scholar]
  24. Alrubaie, S.a.H.; Hameed, A.H. Dynamic weights equations for converting grayscale image to RGB image. J. Univ. Babylon Pure Appl. Sci. 2018, 26, 122–129. [Google Scholar]
  25. Lee, M.K.; Golzarian, M.R.; Kim, I. A new color index for vegetation segmentation and classification. Precis. Agric. 2021, 22, 179–204. [Google Scholar]
  26. Wang, J.; Chen, C.; Wang, J.; Yao, Z.; Wang, Y.; Zhao, Y.; Sun, Y.; Wu, F.; Han, D.; Yang, G. NDVI Estimation Throughout the Whole Growth Period of Multi-Crops Using RGB Images and Deep Learning. Agronomy 2024, 15, 63. [Google Scholar] [CrossRef]
  27. Štroner, M.; Urban, R.; Suk, T. Filtering green vegetation out from colored point clouds of Rocky terrains based on various vegetation indices: Comparison of simple statistical methods, support vector machine, and neural network. Remote Sens. 2023, 15, 3254. [Google Scholar] [CrossRef]
  28. Meyer, G.E.; Neto, J.C. Verification of color vegetation indices for automated crop imaging applications. Comput. Electron. Agric. 2008, 63, 282–293. [Google Scholar]
  29. Clay, D.E.; Kim, K.I.; Chang, J.; Clay, S.A.; Dalsted, K. Characterizing water and nitrogen stress in corn using remote sensing. Agron. J. 2006, 98, 579–587. [Google Scholar] [CrossRef]
  30. Xie, Q.Y.; Dash, J.D.; Huang, W.J.; Peng, D.L.; Qin, Q.M.; Mortimer, H.; Casa, R.; Pignatti, S.; Laneve, G.; Pascucci, S. Vegetation indices combining the red and red-edge spectral information for leaf area index retrieval. IEEE J. Sel. Top. Appl. Earth Obs. Remote Sens. 2018, 11, 1482–1493. [Google Scholar]
  31. Van Beek, J.; Tits, L.; Somers, B.; Deckers, T.; Janssens, P.; Coppin, P. Viewing geometry sensitivity of commonly used vegetation indices towards the estimation of biophysical variables in orchards. J. Imaging 2016, 2, 15. [Google Scholar] [CrossRef]
  32. Gitelson, A.A.; Kaufman, Y.J.; Stark, R.; Rundquist, D. Novel algorithms for remote estimation of vegetation fraction. Remote Sens. Environ. 2002, 80, 76–87. [Google Scholar]
  33. Ruwanpathirana, P.; Sakai, K.; Jayasinghe, G.; Nakandakari, T.; Yuge, K.; Wijekoon, W.; Priyankara, A.; Samaraweera, M.; Madushanka, P. Evaluation of Sugarcane Crop Growth Monitoring Using Vegetation Indices Derived from RGB-Based UAV Images and Machine Learning Models. Agronomy 2024, 14, 2059. [Google Scholar] [CrossRef]
  34. Liu, T.; Wang, J.; Wang, J.; Zhao, Y.; Wang, H.; Zhang, W.; Yao, Z.; Liu, S.; Zhong, X.; Sun, C. Research on the estimation of wheat AGB at the entire growth stage based on improved convolutional features. J. Integr. Agric. 2024, 24, 1403–1423. [Google Scholar]
  35. Zhang, L.Y.; Niu, Y.X.; Zhang, H.H.; Han, W.T.; Li, G.; Tang, J.D.; Peng, X.S. Maize canopy temperature extracted from UAV thermal and RGB imagery and its application in water stress monitoring. Front. Plant Sci. 2019, 10, 1270. [Google Scholar] [CrossRef]
  36. Liu, T.; Zhao, Y.; Sun, Y.; Wang, J.; Yao, Z.; Chen, C.; Zhong, X.; Liu, S.; Sun, C.; Li, T. High-throughput identification of fusarium head blight resistance in wheat varieties using field robot-assisted imaging and deep learning techniques. J. Clean. Prod. 2024, 480, 144024. [Google Scholar]
  37. Bendig, J.; Yu, K.; Aasen, H.; Bolten, A.; Bennertz, S.; Broscheit, J.; Gnyp, M.L.; Bareth, G. Combining UAV-based plant height from crop surface models, visible, and near infrared vegetation indices for biomass monitoring in barley. Int. J. Appl. Earth Obs. Geoinf. 2015, 39, 79–87. [Google Scholar]
  38. Cao, Z.Y.; Chen, Z.H.; Tang, B.; Zeng, Q.; Guo, H.L.; Huang, W.H.; Luo, Y.; Shen, S.; Zhou, S.L. The effects of sowing date on maize: Phenology, morphology, and yield formation in a hot subtropical monsoon region. Field Crops Res. 2024, 309, 109309. [Google Scholar] [CrossRef]
  39. Mishiba, K. Fast guided median filter. IEEE Trans. Image Process. 2023, 32, 737–749. [Google Scholar] [CrossRef]
  40. Wang, Y.M.; Wang, Z.D.; Liu, W.B.; Zeng, N.Y.; Lauria, S.; Prieto, C.; Sikström, F.; Yu, H.; Liu, X.H. A novel depth-connected region-based convolutional neural network for small defect detection in additive manufacturing. Cogn. Comput. 2025, 17, 36. [Google Scholar]
  41. Friedman, J.M.; Hunt Jr, E.R.; Mutters, R.G. Assessment of leaf color chart observations for estimating maize chlorophyll content by analysis of digital photographs. Agron. J. 2016, 108, 822–829. [Google Scholar] [CrossRef]
  42. Verma, S.; Kumar, P.; Singh, J.P. A unified lightweight CNN-based model for disease detection and identification in corn, rice, and wheat. IETE J. Res. 2024, 70, 2481–2492. [Google Scholar] [CrossRef]
  43. Mahony, N.O.; Campbell, S.; Carvalho, A.; Harapanahalli, S.; Velasco-Hernández, G.A.; Krpalkova, L.; Riordan, D.; Walsh, J. Deep Learning vs. Traditional Computer Vision. arXiv 2019, arXiv:1910.13796. [Google Scholar]
  44. Münke, F.R.; Schützke, J.; Berens, F.; Reischl, M. A review of adaptable conventional image processing pipelines and deep learning on limited datasets. Mach. Vision Appl. 2024, 35, 17. [Google Scholar] [CrossRef]
  45. Hamuda, E.; Mc Ginley, B.; Glavin, M.; Jones, E. Automatic crop detection under field conditions using the HSV colour space and morphological operations. Comput. Electron. Agric. 2017, 133, 97–107. [Google Scholar] [CrossRef]
  46. Thenappan, S.; Arun, C.A. Wheat leaf diseases classification and severity analysis using HT-CNN and Hex-D-VCC-based boundary tracing mechanism. Environ. Monit. Assess. 2023, 195, 20. [Google Scholar] [CrossRef] [PubMed]
  47. Zheng, J.; Song, X.; Yang, G.; Du, X.; Mei, X.; Yang, X. Remote sensing monitoring of rice and wheat canopy nitrogen: A review. Remote Sens. Environ. 2022, 14, 5712. [Google Scholar] [CrossRef]
  48. Shafian, S.; Rajan, N.; Schnell, R.; Bagavathiannan, M.; Valasek, J.; Shi, Y.; Olsenholler, J. Unmanned aerial systems-based remote sensing for monitoring sorghum growth and development. PLoS ONE 2018, 13, e0196605. [Google Scholar] [CrossRef]
  49. Ni, Q.; Zuo, Y.; Zhi, Z.; Shi, Y.; Liu, G.; Ou, Q. Diagnosis of corn leaf diseases by FTIR spectroscopy combined with machine learning. Vibr. Spectrosc. 2024, 135, 103744. [Google Scholar] [CrossRef]
  50. Zhang, J.; Yuan, L.; Wang, J.; Luo, J.; Du, S.; Huang, W. Advances in remote sensing monitoring of crop diseases and insect pests. Trans. Chin. Soc. Agric. Eng. 2012, 28, 1–11. [Google Scholar]
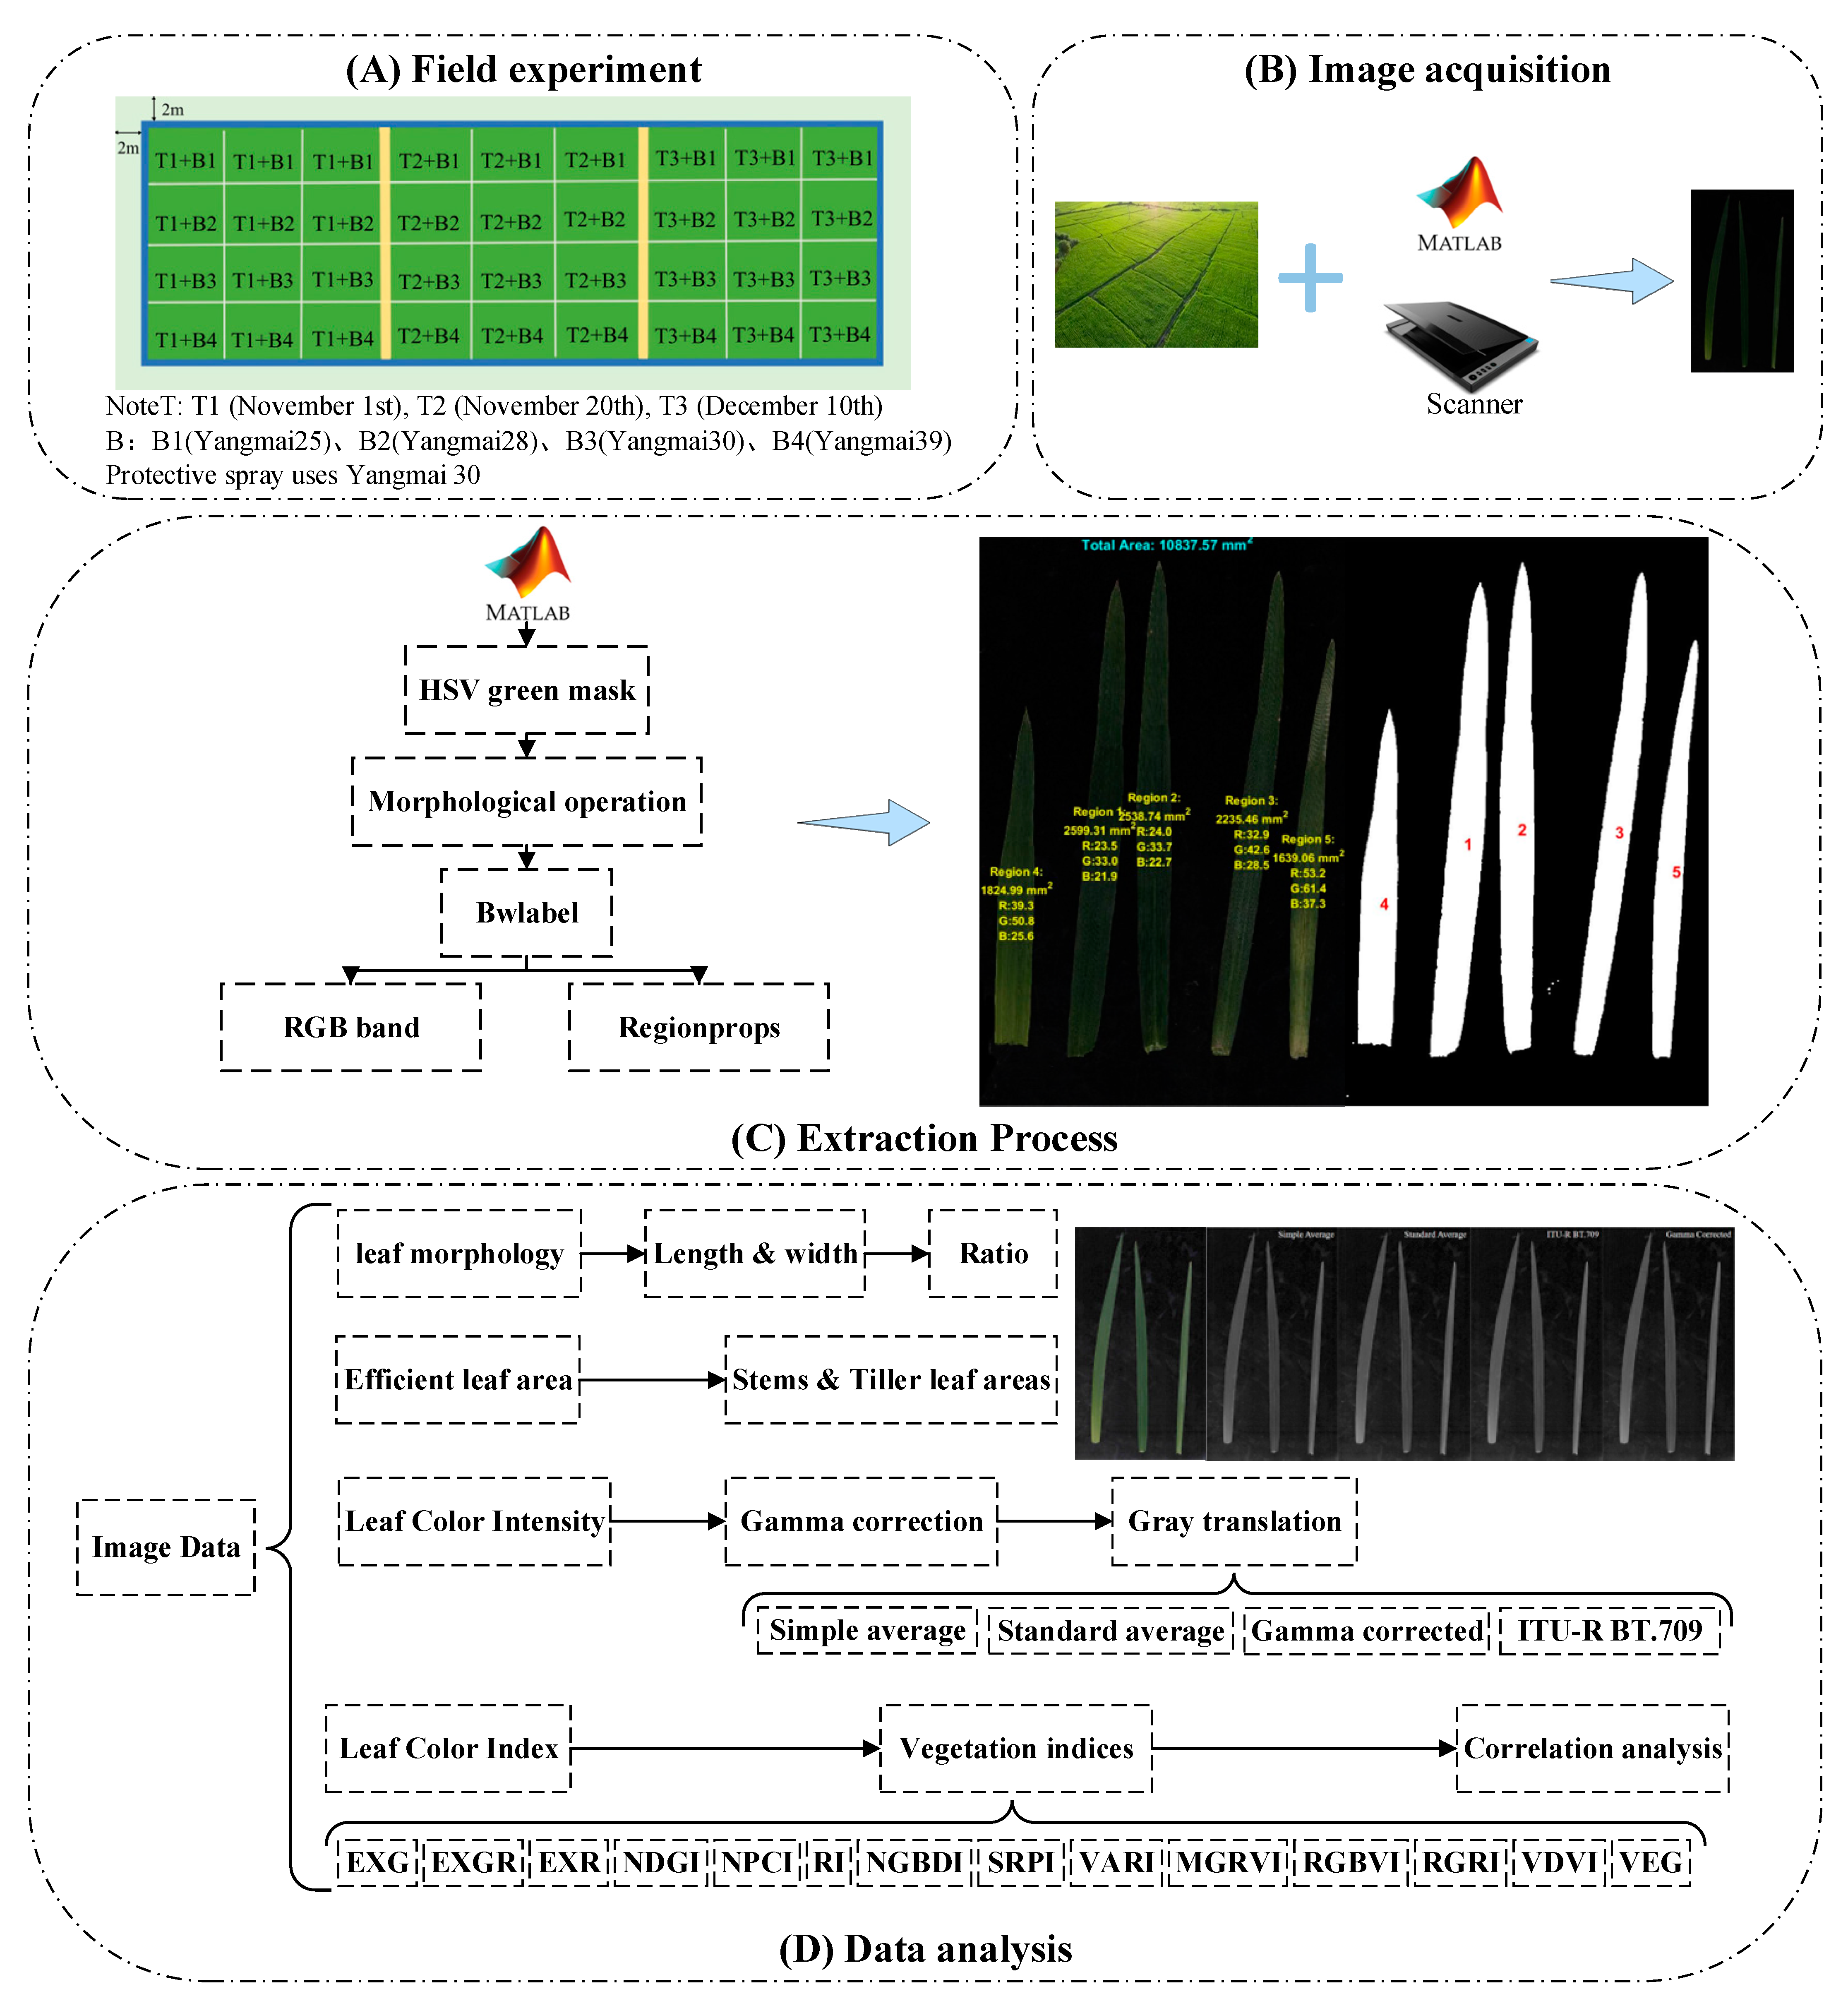
Figure 1. Experimental flow chart.
Agriculture 15 00770 g001
Figure 2. Leaf length–width distribution scatter plot.
Agriculture 15 00770 g002
Figure 3. Distribution of leaf area for different types.
Agriculture 15 00770 g003
Figure 4. Effective leaf area of winter wheat under different sowing dates.
Agriculture 15 00770 g004
Figure 5. Single leaf weight and its RGB color mapping in a 3D plot.
Agriculture 15 00770 g005
Figure 6. Wheat leaf color under different sowing dates after grayscale conversion.
Agriculture 15 00770 g006
Figure 7. Bar chart of wheat leaf color under different sowing dates after grayscale conversion.
Agriculture 15 00770 g007
Figure 8. Correlation analysis of vegetation index.
Agriculture 15 00770 g008
Table 1. List of variety characteristics.
TraitsYangmai 25Yangmai 28Yangmai 30Yangmai 39
Growth Duration (days)202196196200.2
Seedling CharacteristicsSemi-prostrate seedling, strong tilleringUpright seedling,
weaker tillering
Upright seedling, strong tilleringUpright seedling,
relatively strong tillering
Leaf CharacteristicsLeaves erect, uniform spike layerWide and long leaves, uniform spike layerDark green leaves, flag leaf flatWide and long leaves, yellow-green color
Protein Content (%)13.5612.5312.813.7
Wet Gluten Content (%)28.524.82129.4
Table 2. Summary of four grayscale transformation formulas.
No.Grayscale TransformationCalculation FormulasReferences
1Simple Average ( R + G + B ) / 3 [22]
2Standard Average 0.299 × R + 0.587 × G + 0.0722 × B [23]
3ITU-R BT.709 0.2126 × R + 0.7152 × G + 0.0722 × B [23]
4Gamma Corrected ( 0.2126 × R α + 0.7152 × G α + 0.0722 × B α ) 1 / α [24]
Table 3. Summary of fourteen standard leaf color indices.
No.Color IndicesCalculation FormulasReferences
1EXG 2 G-R B [25]
2EXGR 2 G - 2.4 R [26]
3EXR 1.4 R B [27]
4NDGI ( G R ) / ( G + R ) [28]
5NPCI ( R B ) / ( R + B ) [29]
6RI ( R G ) / ( R + G ) [30]
7NGBDI ( G B ) / ( G + B ) [28]
8SRPI B / R [31]
9VARI ( G R ) / ( G + R B ) [32]
10MGRVI(G2 − R2)/(G2 + R2) [33]
11RGBVI(G2 − R × B)/(G2 + R × B)[34]
12RGRI R / G [35]
13VDVI [ 2 G ( R + B ) ] / [ 2 G + ( R + B ) ] [36]
14VEG G / [ R α B ( 1 - α ) ] ,   α = 0.667 [37]
Table 4. Distribution of leaf length, leaf width, and their ratios.
Sowing DateYangmai 25Yangmai 28Yangmai 30Yangmai 39
LengthWidthRatioLengthWidthRatioLengthWidthRatioLengthWidthRatio
T1 (11.01)233.8812.9118.12194.9611.6616.73199.4013.3114.98167.8911.9614.04
T2 (11.20)149.537.4720.02179.5810.0217.91147.298.1118.17115.237.7614.84
T3 (12.10)115.515.7020.26133.156.1221.74133.916.1621.72105.625.5718.98
Both the length and width are measured in millimeters.
Table 5. Effective leaf area and its growth rate for winter wheat under different sowing dates.
CultivarsT1 (11.01)T2 (11.20)T3 (12.10)
Effective Leaf AreaRGRRGREffective Leaf AreaRGREffective Leaf Area
Yangmai 2519,392.3196.65%274.12%9861.3990.25%5183.51
Yangmai 2815,830.3863.89%160.91%9659.1359.20%6067.41
Yangmai 3018,368.42106.42%351.51%8898.72118.74%4068.24
Yangmai 3920,474.29169.77%535.63%7589.48135.62%3221.12
The effective leaf area is measured in square millimeters.
Table 6. Comparison of blade RGB tristimulus values before and after gamma correction.
TreatmentsBands of the Original ImagesBands After Gamma Correction
RedGreenBlueRedGreenBlue
T1B126.4736.7319.9982.0996.7371.38
T1B231.8042.1623.4289.98103.6777.24
T1B332.6042.8022.6391.03104.3875.94
T1B433.3543.1525.9192.14104.8581.27
T2B129.8240.3520.9287.16101.4173.01
T2B232.7943.5822.5391.35105.3775.76
T2B328.9939.2620.0485.8799.9871.46
T2B433.3743.7423.6492.04105.4777.61
T3B130.9141.2521.5688.73102.5374.14
T3B230.2641.0119.7887.84102.2571.01
T3B332.5043.4821.5790.96105.2574.14
T3B435.4645.9124.3694.91108.0778.79
Table 7. Grayscale transformation table for leaves after gamma correction.
TreatmentsGrayscale Transformation
Simple AverageStandard AverageITU-R BT.709Gamma Corrected
T1B183.4089.4691.7892.22
T1B290.3096.5698.8599.25
T1B390.4597.1599.4999.92
T1B492.7598.36100.45100.78
T2B187.1993.9196.3396.79
T2B290.8397.80100.25100.72
T2B385.7792.5194.9295.40
T2B491.7198.28100.61101.02
T3B188.4795.1797.5497.99
T3B287.0394.3896.9397.46
T3B390.1197.4399.96100.47
T3B493.93100.80103.16103.59
Table 8. Summary of standard leaf color indices.
IndicesCalculation Formulas
B1B2B3B4
T1T2T3T1T2T3T1T2T3T1T2T3
EXG27.0129.9630.0329.1131.8531.9830.3629.4932.8927.0430.4732.01
EXGR9.949.148.328.018.489.397.368.958.976.267.386.72
EXR17.0620.8321.7121.1023.3722.5923.0020.5523.9320.7823.0825.29
NDGI0.160.150.140.140.140.150.140.150.140.130.130.13
NPCI0.140.180.180.150.190.210.180.180.200.130.170.19
RI−0.16−0.15−0.14−0.14−0.14−0.15−0.14−0.15−0.14−0.13−0.13−0.18
NGBDI0.300.320.310.290.320.350.310.320.340.250.300.31
SRPI0.760.700.700.740.690.650.690.690.660.780.710.69
VARI0.240.210.200.210.200.210.190.210.200.190.190.18
MGRVI0.320.290.280.270.280.290.270.290.280.250.260.25
RGBVI0.440.450.440.410.440.480.430.450.460.370.420.42
RGRI0.720.740.750.750.750.740.760.740.750.770.760.77
Disclaimer/Publisher’s Note: The statements, opinions and data contained in all publications are solely those of the individual author(s) and contributor(s) and not of MDPI and/or the editor(s). MDPI and/or the editor(s) disclaim responsibility for any injury to people or property resulting from any ideas, methods, instructions or products referred to in the content.