Article

Identification Method of Mature Wheat Varieties Based on Improved DenseNet Model

by
Zihang Liu
1,2,†,
Yuting Zhang
1,2,† and
Guifa Teng
1,2,3,*
1
College of Information Science and Technology, Hebei Agricultural University, Baoding 071001, China
2
Hebei Key Laboratory of Agricultural Big Data, Baoding 071001, China
3
Hebei Digital Agriculture Industry Technology Research Institute, Hebei 056400, China
*
Author to whom correspondence should be addressed.
These authors contributed equally to this work.
Agriculture 2025, 15(7), 736; https://doi.org/10.3390/agriculture15070736
Submission received: 19 February 2025 / Revised: 19 March 2025 / Accepted: 26 March 2025 / Published: 29 March 2025
(This article belongs to the Section Digital Agriculture)

Abstract

:
Wheat is a crucial grain crop in China, yet differentiating different wheat varieties at the mature stage solely through visual observation remains challenging. However, the automatic identification of wheat varieties at the mature stage is very important for field management, planting area, and yield prediction. In order to achieve accurate and efficient recognition of wheat varieties planted in wheat fields, a recognition method based on an enhanced DenseNet network model is proposed in this study. The incorporation of SE and ECA attention mechanisms enhances the feature representation capability, leading to improved model performance and the development of the SECA-L-DenseNet model for wheat variety recognition. The experimental results show that the SECA-L-DenseNet model achieves a classification accuracy of 97.15% on the custom dataset, surpassing the original DenseNet model by 2.13%, which demonstrates a significant improvement. The model enables the accurate identification of wheat varieties in the field and can be integrated into applications for the automated identification of varieties, planting area estimation, and yield prediction in harvester equipment.

1. Introduction

Wheat, a widely cultivated staple crop across the globe, plays a vital role in ensuring global food security and driving the development of agricultural economies [1]. The ongoing progress in digital agricultural technologies is driving a shift from labor-intensive practices to fully automated, unmanned intelligent systems across various stages of agricultural production. This transformation is progressively enabling the full automation and digitalization of agricultural processes, including tillage, sowing, management, and harvesting. The vigorous development of digital agriculture serves as a crucial strategy to foster high-quality socio-economic growth in rural areas, advance comprehensive rural revitalization, and contribute to the establishment of a digital China.
Traditional methods for identifying field wheat varieties mainly rely on morphological feature observation, but because it is difficult to distinguish wheat varieties from their appearance, these methods not only require substantial temporal and labor investments but also are susceptible to evaluator subjectivity. The application of deep learning technology for identifying and classifying field wheat varieties not only reduces operational costs and enables the automatic acquisition of crop variety information to enhance efficiency but also significantly improves classification accuracy, ultimately contributing to reducing operational costs and improving efficiency. On the other hand, different wheat varieties exhibit distinct nutritional and hydrological requirements. Accurate identification of wheat varieties in the field enables the development of customized fertilization and irrigation schemes. This approach not only meets the species-specific water and nutrient requirements of different wheat varieties but also enhances resource utilization efficiency and minimizes waste. During the harvest phase, it facilitates the improved collection and management of agricultural metadata, offers data-driven support for estimating crop yields and cultivated areas of individual farmlands, and establishes a valuable data repository for the development of agricultural big data systems, according to which researchers can conduct in-depth studies on the growth differences, disease resistance, climate adaptability, and other aspects of crop varieties. This provides a scientific basis for optimizing wheat variety breeding and improving both yield and quality. Additionally, it enhances the intelligence and precision of government agricultural management, facilitates the large-scale implementation of digital agriculture, and offers valuable insights for yield forecasting, policy adjustments, and agricultural resource allocation. Collectively, these advancements contribute to a significant improvement in agricultural productivity. In summary, this research not only enhances the efficiency of crop identification but also holds significant importance for optimizing agricultural production, promoting the sustainable utilization of agricultural resources, and advancing the development of digital agriculture.
Similar to crop disease and pest image recognition, the identification of wheat varieties at field maturity stages can also achieve efficient and precise classification through deep learning techniques. In traditional machine learning approaches, images require preprocessing, followed by feature extraction, which typically relies on manually designed algorithms [2]. Experts must select appropriate feature extraction methods based on task-specific requirements, such as SIFT, HOG, LBP, etc. [3], which primarily focus on low-level features, including color, texture, and shape. However, these conventional methods demonstrate limited generalization capabilities and are only suitable for tasks with distinct features and small datasets, such as simple object recognition or text classification, making them insufficient for meeting agricultural production demands. In contrast, deep learning employs a self-supervised manner to autonomously learn target features [4]. Particularly, convolutional neural networks (CNNs), whose multi-layered architectures enable the progressive extraction of advanced image features—from edges to textures and shapes—ultimately forming high-level semantic understanding [5]. Studies have demonstrated that CNNs trained on large-scale datasets can automatically extract complex image features and achieve high-accuracy crop classification [6]. Furthermore, deep learning models exhibit superior performance in multi-task learning and large-scale dataset scenarios, demonstrating enhanced generalization capabilities [7].
Numerous domestic and international studies have implemented deep learning models in agricultural applications with promising outcomes [8]. Ananda S. Paymode et al. [9] investigated CNN applications in early disease detection for tomatoes and grapes, employing the Visual Geometry Group (VGG) [10] for feature extraction and classification. The experimental results demonstrate classification accuracies of 98.40% and 95.71% for grape leaves and tomato leaves, respectively. Yuan Y et al. [11] integrated transfer learning with AlexNet [12] and VGGNet to classify eight crop diseases, achieving a mean accuracy of 95.93%, which surpassed existing methods, while demonstrating enhanced robustness. F Chen et al. [13] integrated terahertz time-domain spectroscopy (THz-TDS) [14] with CNN to achieve the identification of 12 wheat varieties, reporting classification accuracies of 98.7% and 97.8% on the calibration and prediction sets, respectively, indicating its potential for seed identification and quality assessment. Yang G et al. [15] proposed a fine-grained crop disease classification model leveraging transfer learning. Utilizing a dataset comprising 58,200 leaf images, the NASNetLarge model enhanced with attention mechanisms achieved the highest F1-score of 93.05%, demonstrating a significant improvement in classification accuracy. Sardeshmukh, M et al. [16] explored CNN applications in crop classification, where VGG-16 outperformed other models with over 98% accuracy, while ResNet-50 exhibited suboptimal performance. Hongxing, Peng et al. [17] introduced the HQIP102 dataset and proposed MADN, a pest recognition model that integrates selective kernel units, representative batch normalization, and ACON activation functions [18] to enhance the DenseNet architecture. The experimental results show that MADN improved the accuracy and F1-scores by 5.17% and 5.20%, respectively, compared to baseline DenseNet121, and outperformed ResNet-101 by 10.48% accuracy and 10.56% F1-score while reducing parameters by 35.37%. Deployed on mobile cloud servers, it facilitates real-time identification of crop diseases and pests, offering a practical approach to yield optimization and quality control. Mu, Y et al. [19] introduced an enhanced weed recognition method based on DenseNet, incorporating local variance background segmentation and data augmentation to address overfitting issues. This approach was further strengthened by the integration of efficient channel attention mechanisms to improve feature extraction capabilities. The experimental results demonstrate 97.98% accuracy, significantly outperforming DenseNet, VGG-16, and ResNet-50, suggesting suitability for intelligent weeding devices. Jiang, M et al. [20] proposed a DenseNet architecture optimized with SE-attention for rice disease recognition, integrating depthwise separable convolutions to improve parameter efficiency and accelerate training speed. The model achieved 99.4% average classification accuracy, surpassing the original DenseNet by 13.8% and outperforming ResNet, VGG, and Vision Transformer architectures. Feng, S et al. [21] designed a CNN-based rapid classification model for crop diseases, incorporating SE modules into the DenseNet architecture to balance the importance of feature maps. Additionally, Leaky ReLU activation functions were utilized to enhance the model’s fitting capability. Experimental validation confirmed its strong potential for crop disease detection applications.
In summary, the feasibility of classifying crops through deep-learning-based image classification and recognition technology is demonstrated in this study; however, several challenges remain to be addressed. First, previous studies have primarily focused on crop diseases, pests, or wheat grain cultivars; to date, no research has specifically investigated the recognition of different wheat varieties at maturity. Second, to achieve reliable classification of field wheat varieties, it is imperative to utilize sufficiently large and diverse datasets that include adequate training samples, and these datasets should ideally encompass images of mature wheat captured from multiple viewpoints, representing various cultivars and developmental stages. Moreover, the rapid progress in deep learning has led to the development of numerous efficient network models specifically designed for image classification tasks; however, their recognition performance varies depending on the specific application. Therefore, the performance of the recognition system for field wheat varieties requires experimental validation, and whether the model’s accuracy can be further enhanced remains a critical research question.
To address the aforementioned issues, a SECA-L-DenseNet network model has been developed for wheat variety recognition in the field. Building upon the original DenseNet network model, the dual attention mechanism—comprising the Squeeze-and-Excitation (SE) module [22] and the Efficient Channel Attention (ECA) module [23]—has been integrated into this approach. This approach enhances feature representation in the intermediate layers, thereby improving the overall feature extraction capability and recognition accuracy. This research aims to develop an efficient deep-learning-based model for wheat variety classification, with the goal of improving both accuracy and robustness in image recognition. This model seeks to offer an automated solution for wheat variety identification, thereby contributing to the advancement of smart agriculture.

2. Materials and Methods

2.1. Data Collection

Considering that the ultimate objective of this study is to implement the findings in the context of automated wheat harvesting, where the image acquisition device is mounted on a harvester for real-time data collection and analysis, a smartphone was chosen for data acquisition. This selection was based on its cost-effectiveness and its ability to closely simulate real-world field conditions. As a result, all the dataset images were consistently captured using a smartphone. The images were captured using a Redmi K50 smartphone (manufactured by Xiaomi Corporation, Beijing, China) with an effective resolution of 58 megapixels. The images were taken from various angles, including front, side, oblique, horizontal, top, long shot, and close-up perspectives, among others. This study focused on mature wheat fields representing seven varieties, including Jimai 38, Shixin 633, and Lanmai, among others. Additionally, stubble fields after harvest were also photographed as control samples. The stubble and the example of seven wheat varieties are shown in Figure 1. Several environmental factors, such as time, location, and weather conditions, can significantly influence image quality. The dataset for this study was collected in Jingxiu District, Baoding, Hebei Province, China, at coordinates 38.88° N, 115.38° E, at an altitude of 29.4 m. The images were taken in mid-June 2024, primarily between 5:00 and 8:00 a.m. and 17:00 and 19:00 p.m. To ensure optimal image clarity, data collection was conducted under clear weather conditions with low wind speeds, which were deemed suitable for handheld photography.

2.2. Dataset Construction

The original dataset was classified into eight categories, comprising wheat stubble fields and seven distinct wheat varieties, with a total of 2453 images. To enhance the model’s generalization capability and improve dataset diversity, data augmentation techniques, such as flipping, cropping, translation, and noise addition, were applied. This process expanded the dataset to 8956 images, thereby increasing sample diversity and mitigating the risk of overfitting. The images have a resolution of 1984 × 1116 and are stored in JPG format. The augmented dataset was randomly partitioned into training, test, and validation sets in a 7:2:1 ratio. The training set was used for model learning, where the backpropagation algorithm iteratively optimized the model. The test set was employed to assess classification accuracy, while the validation set facilitated hyperparameter tuning and overfitting prevention. The distribution of the image data is detailed in Table 1.

2.3. Model Improvement

2.3.1. DenseNet Network Model

In traditional convolutional neural networks, the input to each layer is derived exclusively from the output of the preceding layer; this structure limits feature maps to connections with only adjacent layers, thereby preventing cross-layer interactions. As the network depth increases, issues such as gradient vanishing or explosion, as well as network degradation, become more pronounced [24]. Although the introduction of residual networks has significantly mitigated these problems, the problem of gradient vanishing continues to persist as the network depth increases. Moreover, in conventional CNNs, enhancing feature representation capacity typically necessitates increasing network depth, which directly leads to a substantial increase in the number of model parameters. Additionally, since features from each layer can only be propagated to the immediately subsequent layer, shallow-layer features may not be effectively transmitted to deeper layers, resulting in suboptimal feature utilization.
Inspired by the residual connection mechanism in ResNet [25], Gao Huang et al. [26] proposed DenseNet in 2017, a network architecture based on dense connections. The key innovation of this approach lies in its “Dense Connectivity” mechanism, where each layer is not only directly connected to its preceding layer but also receives the outputs of all the earlier layers as input. This ensures that every layer in the network maintains connections with all the preceding layers, facilitating feature reuse and improving gradient flow. The corresponding formula is as follows:
Xi = Hi ([X0, X1,…, Xi−1])
In the equation, Xi represents the output of the nth layer; [X0, X1, …, Xn−1] denotes the concatenation of feature maps from the preceding i − 1 layers along the channel dimension, where the i-th layer of the network contains i i + 1 2 connections; and Hi represents a combination of batch normalization (BN), an activation function (ReLU), and a convolution operation. Through this design, each layer receives information from all the preceding layers, thereby improving feature propagation efficiency, mitigating gradient vanishing in deep neural networks, and enhancing feature reuse within the network.
The DenseNet architecture consists of four dense blocks and three transition layers, as illustrated in Figure 2. Each dense block contains multiple convolutional layers, where the output of each convolutional layer is concatenated with the outputs of all the preceding convolutional layers and serves as the input for subsequent layers. The transition layers facilitate connections between different dense blocks. A typical transition layer consists of a convolutional layer (usually a 1 × 1 convolution), followed by a pooling layer (usually a 2 × 2 average pooling). These layers integrate features from the preceding dense block and reduce spatial dimensions to achieve downsampling. Structurally, a transition layer follows the following sequence: BN → ReLU → 1 × 1 Conv → 2 × 2 AvgPooling, where the 1 × 1 convolution adjusts the number of channels, and the 2 × 2 average pooling reduces the feature map dimensions. This architectural design enables DenseNet to effectively address the gradient vanishing issue while significantly reducing both the number of parameters and computational costs compared to ResNet. The inherent feature reuse mechanism in DenseNet also provides a regularization effect, thereby mitigating overfitting during model training. Additionally, based on the number of layers, DenseNet is available in three primary variants based on the number of layers: DenseNet121, DenseNet169, and DenseNet201. Among these, DenseNet121 is the most lightweight, with fewer parameters. Therefore, in this study, the DenseNet121 model was selected as the backbone for the classification and recognition of field wheat variety images.

2.3.2. Attention Mechanism

The attention mechanism is a fundamental component of modern artificial intelligence, particularly in deep learning. It is primarily designed to enhance a model’s ability to process input information, especially when handling long-sequence data. By effectively capturing the relative importance of different segments of the input, the attention mechanism significantly improves model performance [27].
The Squeeze-and-Excitation (SE) module is a neural network architecture that emphasizes channel attention mechanisms. Introduced by Jie Hu et al. in 2020 [22], its structure is illustrated in Figure 3. The SE module first applies global average pooling (GAP) to the input feature map, generating a compressed representation that encapsulates global information across all the channels. This compressed output is subsequently processed through a two-layer fully connected network: the first layer reduces the channel dimensionality, while the second layer restores it to its original size. The ReLU activation function is employed in the first layer, followed by the sigmoid function in the second layer to normalize the output weights within the range [0, 1]. Finally, the computed weights are multiplied with the original feature map, dynamically adjusting the activation strength of each channel. This process amplifies critical features while suppressing less relevant or redundant ones. By incorporating attention at the channel level, the SE module significantly enhances the model’s feature extraction and representation capabilities. Its core principle lies in dynamically assigning weights to each channel, highlighting the most relevant information while reducing the influence of less significant channels.
The core principle of the channel attention mechanism lies in capturing dependencies among different channels. In the SE module, the fully connected (FC) layer plays a crucial role in this process; however, its computational complexity and lack of interpretability present certain limitations. To address these issues, several studies have explored more efficient and lightweight approaches for modeling channel dependencies while reducing parameter count and computational cost.
In this context, Wang et al. (2020) [23] proposed the Efficient Channel Attention (ECA) mechanism, which implements channel attention without requiring a fully connected (FC) layer. The network structure of ECA is depicted in Figure 4. The fundamental concept of the ECA module is to generate channel attention using adaptive one-dimensional (1D) convolution. Specifically, the ECA module first compresses the input feature map’s channel information into a one-dimensional vector via global average pooling. It then computes channel attention weights through an efficient 1D convolution operation. The kernel size of this 1D convolution is adaptively determined based on nonlinear mapping of the channel dimensions, allowing the model to effectively capture cross-channel dependencies at multiple scales. This approach eliminates the need for dimensionality reduction, thereby preserving critical channel-wise information. Finally, the computed channel attention weights are applied to the original feature map via element-wise multiplication, producing an output feature map with enhanced attention representation.

2.3.3. Leaky RELU Activation Function

Leaky ReLU (leaky rectified linear unit) is a widely used activation function in neural networks [28] and represents an improved variant of the ReLU activation function. Similar to ReLU, Leaky ReLU is a non-linear function that enhances the network’s capacity to learn complex patterns. The mathematical formulation of Leaky ReLU is given by the following:
f ( x ) = x , x > 0 α x , x 0
where α is a small positive constant, typically less than 1 (e.g., 0.01).
The primary objective of Leaky ReLU is to mitigate the “dead neuron” problem encountered in ReLU-based networks. This issue arises when the output of the ReLU function becomes zero, preventing the affected neurons from updating their weights during training. Leaky ReLU addresses this limitation by introducing a small, non-zero gradient α for negative inputs, ensuring that neurons in the negative input region remain active and continue to update their weights rather than becoming completely deactivated.

2.3.4. SECA-L-DenseNet Network Model

To further enhance the recognition accuracy of the DenseNet model on the field wheat variety classification dataset, it is crucial to address the presence of irrelevant background in field-captured wheat crop images, which introduces significant interference in wheat variety classification and identification. Therefore, more attention should be directed toward the wheat crops themselves. Although DenseNet achieves multi-scale feature reuse through dense connections, its global feature fusion mechanism is insufficient for effectively modeling channel relationships.
The Squeeze-and-Excitation (SE) module constructs channel dependencies using two fully connected layers, complementing the dense feature maps of DenseNet. Meanwhile, the Efficient Channel Attention (ECA) module replaces fully connected layers with one-dimensional (1D) convolution, thereby retaining the advantages of the SE module while avoiding a substantial increase in the number of parameters. This is particularly beneficial for medium-scale image datasets, as it effectively mitigates the risk of overfitting.
Furthermore, given the characteristics of the dataset, wheat variety classification necessitates a model capable of extracting fine-grained features and capturing intricate image details. The SE module enhances the model’s sensitivity to key features through global channel recalibration, while the ECA module captures local inter-channel dependencies with lower computational complexity. This design aligns well with the dataset’s requirements for handling background interference and fine-grained feature extraction.
Therefore, this study integrates the SE and ECA attention mechanisms to address these challenges, leading to the development of the SECA-L-DenseNet model. The network structure is illustrated in Figure 5.
First, the average pooling layer in each transition layer is removed and replaced with an SE module, modifying its structure to BN → ReLU → 1 × 1 Conv→SE block, thereby forming a new transition layer. This modification ensures that feature maps are not directly downsampled in the transition layer but are instead refined and enhanced through the convolution and SE modules. The revised model allows for precise control over the size and number of feature map channels while generating channel attention weights via global average pooling and a two-layer fully connected network. These attention weights are applied to input features in a channel-wise manner, enhancing the representation capability of important channels.
Second, the 3 × 3 max pooling layer is removed during the initial feature extraction phase to better preserve the original feature information and minimize the loss of valuable low-level features. Additionally, the ECA module is incorporated after each DenseLayer, enabling the computation of channel attention through one-dimensional (1D) convolution, thereby improving the network’s ability to learn channel-wise feature dependencies. Compared to the conventional SE module, the ECA module introduces fewer parameters, reduces computational complexity, and generally achieves higher accuracy.
Furthermore, the enhanced model substitutes the ReLU activation function with the Leaky ReLU activation function, which mitigates the “neuron death” issue by introducing a small gradient for negative inputs. This adjustment enhances training efficiency and improves the overall performance of the neural network.

2.4. Experimental Environment and Model Training

The deep learning framework employed in this experiment is PyTorch 1.12.1, with Python 3.7 as the programming language. The operating system is Ubuntu 20.04.5 LTS, running on an Intel® Xeon® Gold 6248R CPU @ 3.00 GHz × 96. The graphics processing unit (GPU) used is NVIDIA GeForce RTX 3090, with CUDA 11.4.
Given the relatively small size of the field wheat dataset, transfer learning was adopted to enhance model performance. The model was first pre-trained on a large-scale source dataset and subsequently fine-tuned on the wheat image dataset. This approach improves both the accuracy and generalization capability of the model.

3. Results and Analysis

3.1. Evaluation Index

In this study, precision, recall, F1-score, and accuracy were employed as evaluation metrics to assess the performance of each classification model. Additionally, a confusion matrix analysis was conducted to examine misclassification patterns among the eight categories.
Precision quantifies the proportion of correctly predicted positive samples relative to the total number of predicted positive cases. Recall measures the proportion of correctly predicted positive samples relative to the total number of actual positive samples. The F1-score, defined as the harmonic mean of precision and recall, ranges from 0 to 1, where higher values indicate superior model performance. Accuracy represents the proportion of correctly classified samples relative to the total number of samples. The corresponding mathematical formulations are provided in Equations (3)–(6).
Precision   Rate = T P T P + F P
Recall   Rate = T P T P + F N
F 1 - Score = 2 · P r e c i s i o n · R e c a l l P r e c i s i o n + R e c a l l
Accuracy   Rate = T P + T N T P + T N + F P + F N
True positives (TP) refer to the number of correctly predicted positive samples. False positives (FP) indicate the number of incorrectly predicted positive samples. False negatives (FN) represent the number of actual positive samples misclassified as negative, while true negatives (TN) denote the number of correctly predicted negative samples.
Additionally, considering the operational requirements of model deployment, it is essential to incorporate evaluation metrics that account for both the number of parameters and frames per second (FPS) to assess the feasibility of deploying enhanced models. The number of parameters directly influences memory consumption and computational complexity, while FPS serves as a critical metric for evaluating real-time inference performance in agricultural machinery applications.

3.2. Comparison Experiment of Different Classification Models

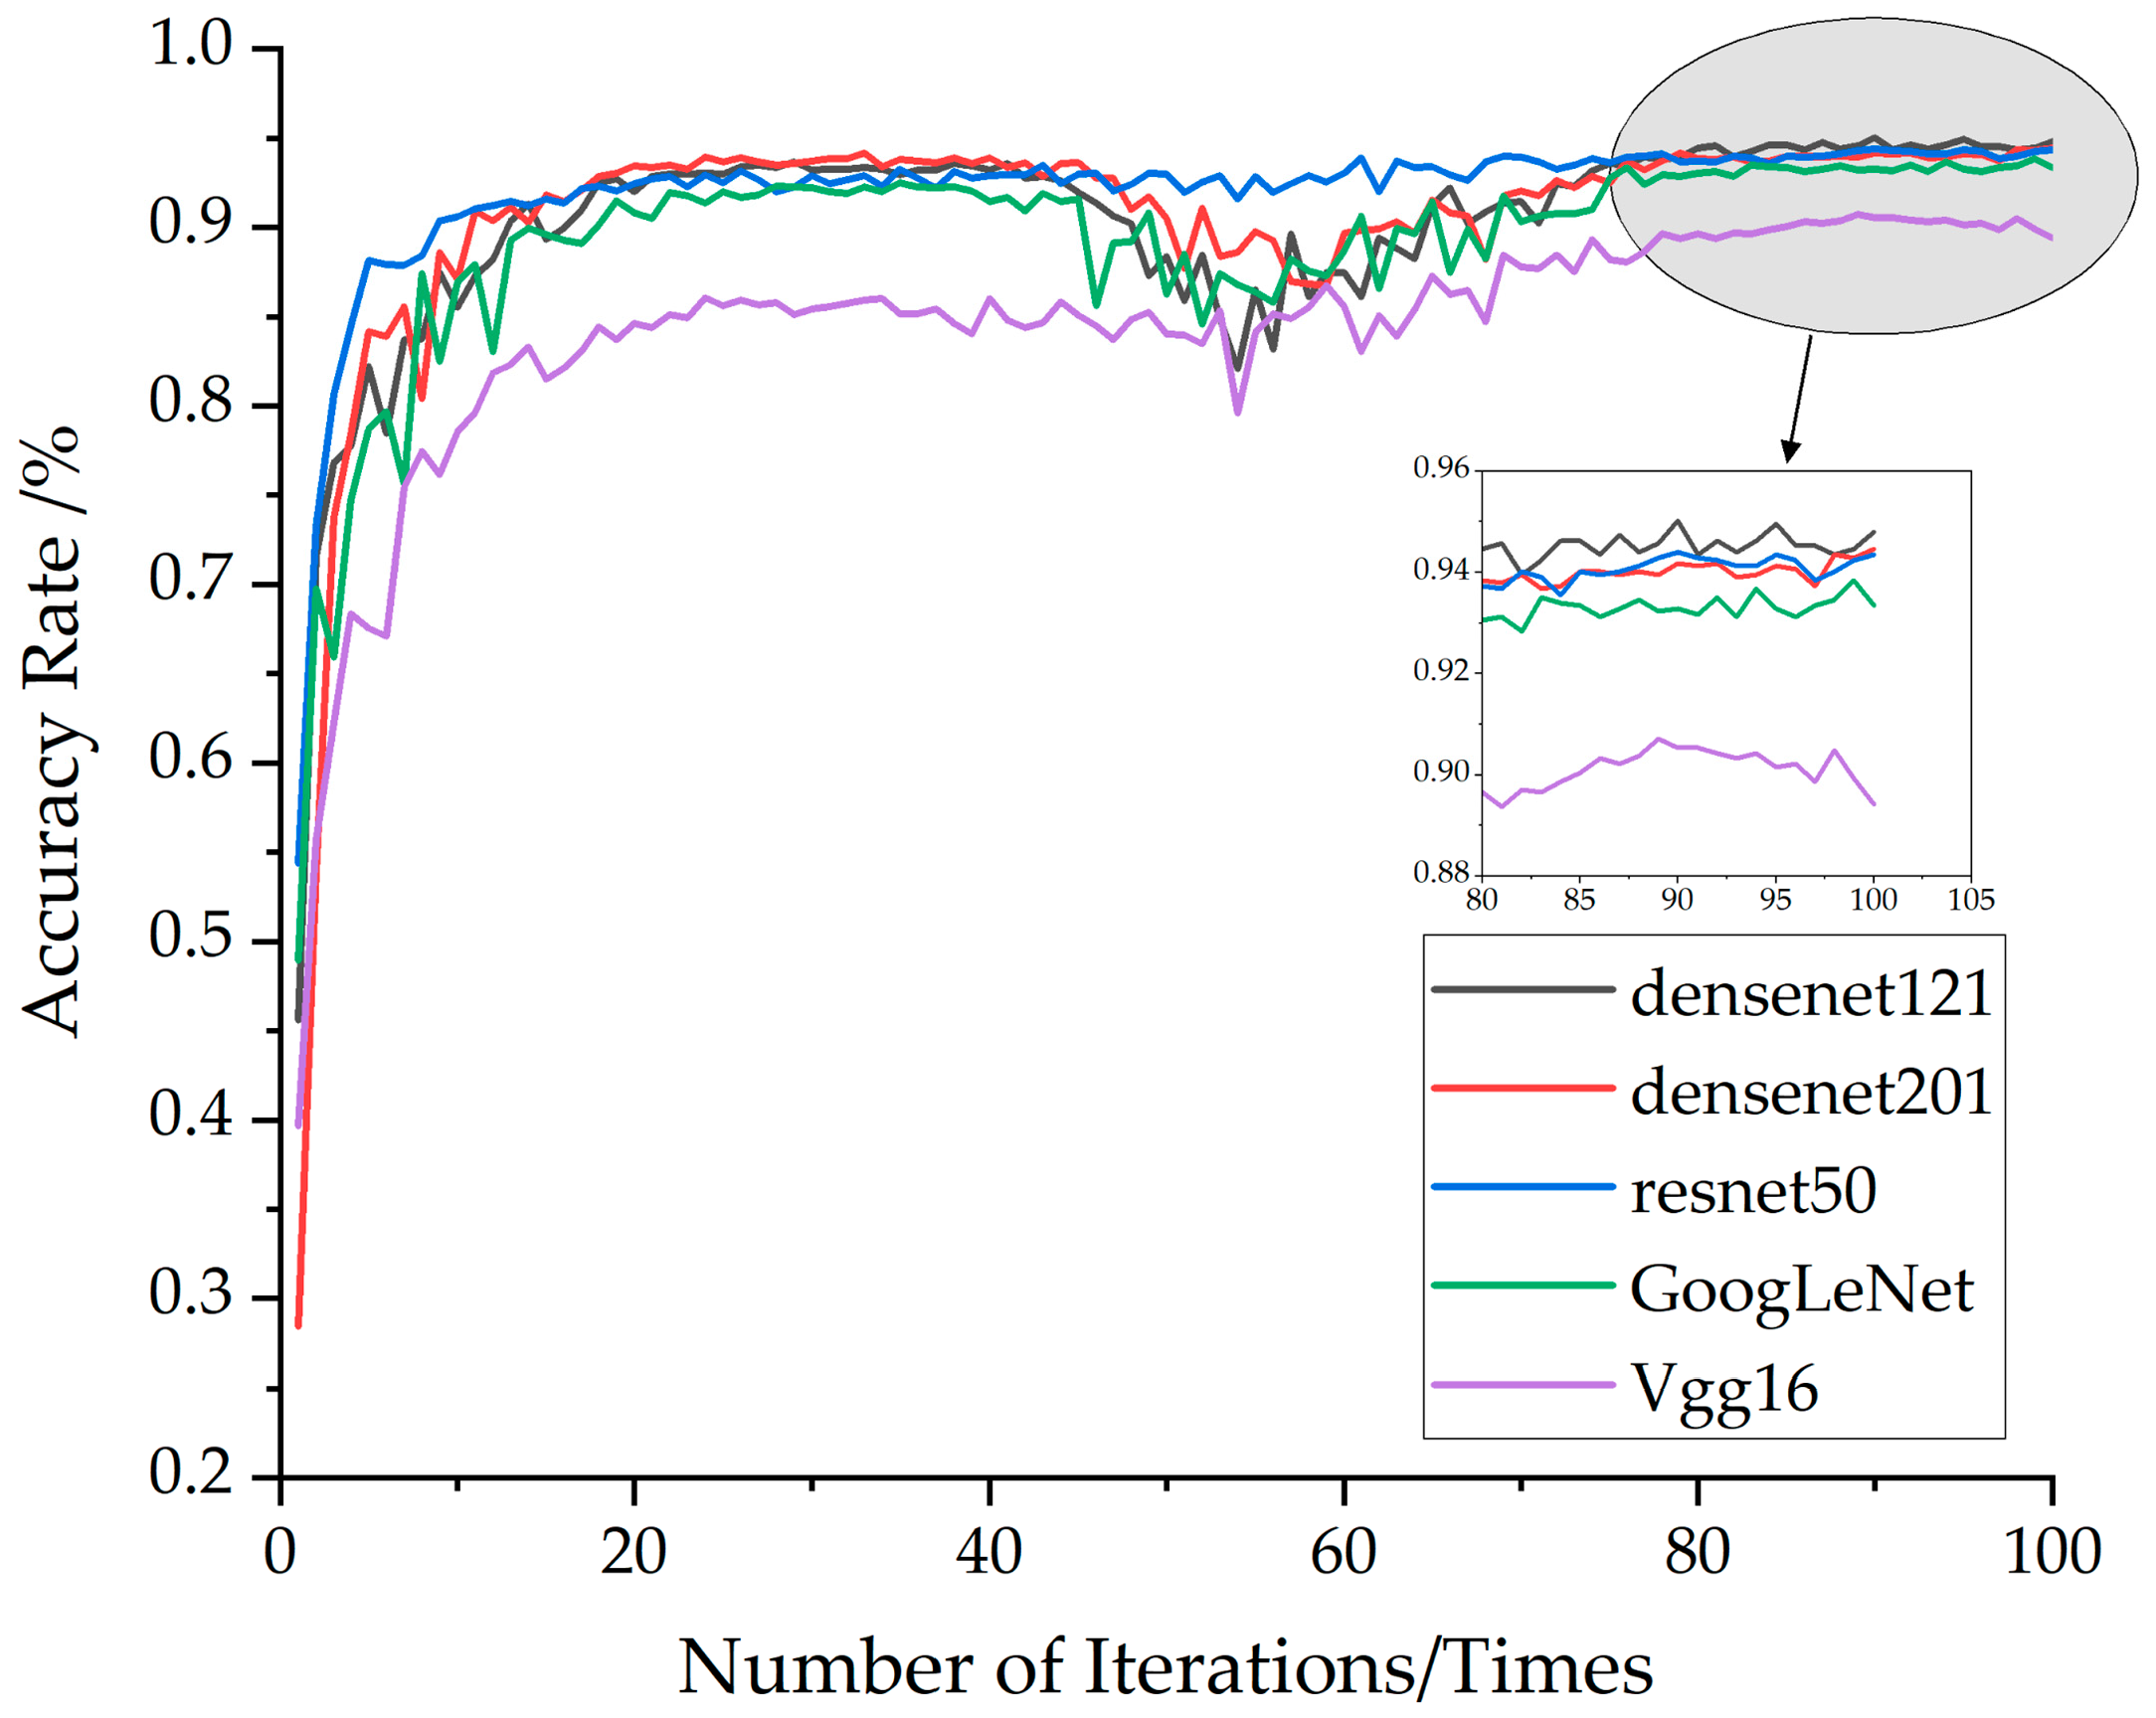
To evaluate the performance differences between DenseNet121 and other mainstream models, this study selected DenseNet201, ResNet50, GoogLeNet, and VGG16 as baseline models for comparison. Each model was trained for 100 epochs. To ensure robustness, each model underwent training five times with random initialization, and the mean accuracy was recorded. Figure 6 illustrates the accuracy curves of the five models during the training process.
As training progressed, the overall performance difference between DenseNet121 and DenseNet201 remains relatively small. However, by the end of training, DenseNet121 achieved both a higher overall accuracy and a higher peak accuracy compared to DenseNet201. Among the five models, ResNet50 demonstrated the most stable performance throughout training, although its average accuracy was slightly lower than that of DenseNet121 in the final stages of training.
In summary, DenseNet121 outperformed the other four models among these five network models. Table 2 presents the classification results of the five models. The metrics precision, recall, and F1-score represent the macro-averaged values of the respective performance metrics across all the categories. The results indicate that VGG16 achieved the lowest classification accuracy on the dataset, with a value of 90.71%. The accuracies of ResNet50 and DenseNet201 were nearly identical, at 94.40% and 94.46%, respectively. DenseNet121 attained the highest accuracy among the five models, reaching 95.02%. These findings suggest that among the five tested models, DenseNet121 exhibited the best overall training performance.

3.3. Wheat Variety Recognition Experiment

The evaluation metrics for the wheat variety recognition test are summarized in Table 3. The SECA-L-DenseNet121 model achieved a recognition accuracy of 97.15%, demonstrating its ability to efficiently and accurately classify field-captured wheat images. This meets the objectives of model improvement and highlights its robust performance.
Specifically, the model exhibited the highest classification performance for wheat stubble, with all three evaluation metrics exceeding 99%. This superior performance may be attributed to the significant morphological differences between wheat stubble and mature wheat varieties. Among the seven wheat varieties, excluding wheat stubble, the proposed model achieved the best recognition results for Yudancheng 339, with an accuracy of 100%, a recall of 96.18%, and an F1-score of 98.05%.
Additionally, the model demonstrated high classification performance for Jinghua 11 and Jimai 38, while its recognition accuracy for Lanmai was relatively lower. This lower performance may be due to the lack of distinct external visual features in Lanmai, which makes differentiation more challenging.
Overall, the improved SECA-L-DenseNet121 model effectively enhances the accuracy of wheat variety classification and recognition, providing crucial support for field crop classification and recognition technologies.
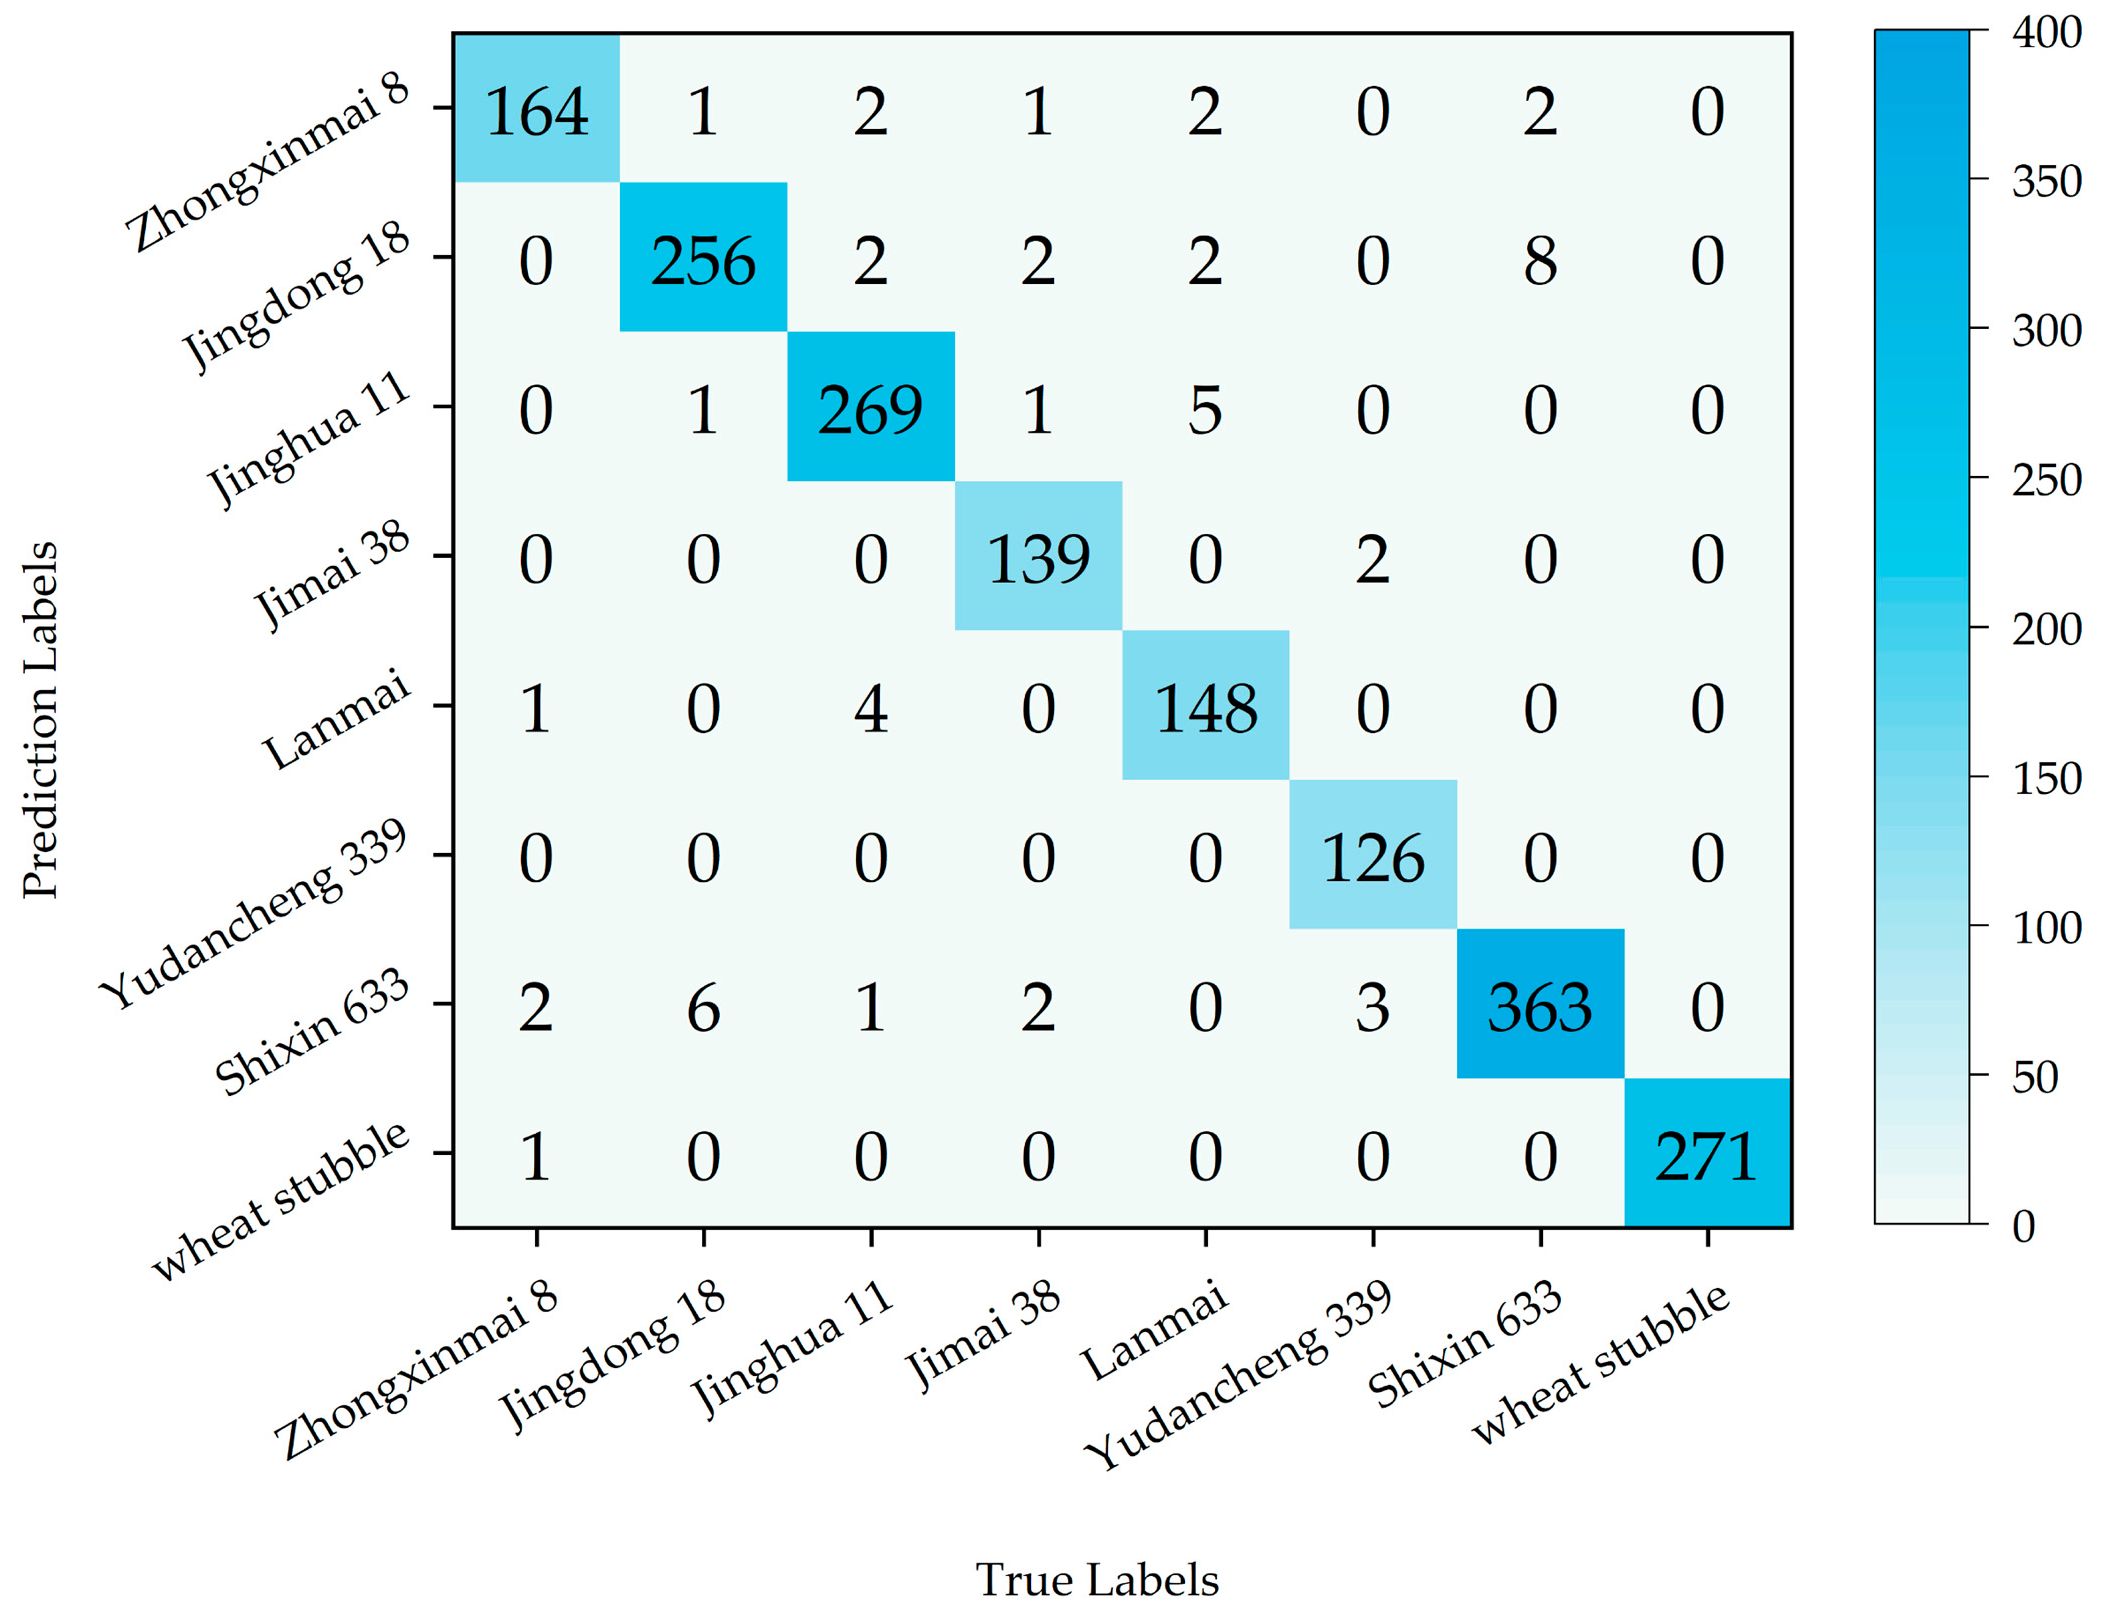
The confusion matrix is a fundamental tool for evaluating the performance of classification models in machine learning and statistical analysis. By comparing the model’s predicted outcomes with the actual labels, it provides a comprehensive assessment of classification effectiveness, enabling a deeper understanding of the model’s strengths and limitations. The confusion matrix for the SECA-L-DenseNet121 model is presented in Figure 7. As shown in Figure 7, the model correctly classified 1736 images, achieving an overall recognition accuracy of 97.15%. The predictions are densely clustered along the diagonal, indicating a high level of classification accuracy. Among all the categories, the model demonstrated the highest classification performance for wheat stubble, correctly identifying all 271 positive samples. Observing the misclassified samples, it is evident that the model encountered challenges in distinguishing Jingdong 18 and Shixin 633. This difficulty may stem from the similarities between these two wheat varieties and other varieties in terms of color, shape, and other morphological characteristics. Such similarities likely reduce the model’s ability to extract distinctive features, thereby increasing the likelihood of misclassification. Overall, the SECA-L-DenseNet121 model effectively identifies field wheat varieties and exhibits strong recognition performance across all the categories. The model demonstrates a high level of accuracy in distinguishing different wheat varieties, further supporting its practical application in automated wheat classification.

3.4. Ablation Experiment

An ablation study is a widely used method for evaluating the impact of different components in a model on its final performance. By systematically removing or modifying specific parts of the model and observing changes in performance, this approach helps identify the most influential components. To assess the effectiveness of the newly introduced modules in the SECA-L-DenseNet121 model, ablation experiments were conducted. The enhanced model was compared against the original model, as well as modified versions incorporating individual modules. By systematically replacing different attention mechanisms and activation functions, variations in classification accuracy were analyzed, providing insights into the contribution of each module to the model’s overall performance.
Figure 8 presents the results of the ablation experiments in a line chart format, systematically evaluating model variants by modifying key components and activation functions (as detailed in Table 4). Each modified architecture was trained and evaluated under identical experimental conditions. As illustrated in Figure 8, all the improved models exhibited similar accuracy trajectories during training. However, in the final training phase, the SECA-L-DenseNet121 model achieved significantly superior recognition accuracy compared to the other variants. A comprehensive quantitative evaluation of these models is summarized in Table 4. The results indicate that replacing the Leaky ReLU activation function with the ReLU activation function in the DenseNet model improved classification accuracy by 0.34 percentage points. Incorporating only the SE attention mechanism increased accuracy by 1.17 percentage points, while introducing only the ECA attention mechanism resulted in a 0.22 percentage point improvement. Notably, when both the SE and ECA attention mechanisms were applied simultaneously, along with replacing the activation function with Leaky ReLU, the model achieved a classification accuracy of 97.15%, representing a 2.13 percentage point increase compared to the baseline DenseNet model.
On the other hand, integrating the dual-attention mechanism led to a 0.5% increase in the model parameters and a 31.6% reduction in the frame rate (FPS) compared to the original architecture. However, considering the heightened accuracy requirements and the near-zero tolerance for misclassification in practical deployment scenarios—combined with the fact that both the increased parameter count and reduced FPS remain within operationally viable thresholds without compromising deployment feasibility—the SECA-L-DenseNet121 model proves to be the most effective choice when evaluated holistically.
Hyperparameters are parameters that are set prior to training and directly influence model performance, training speed, and convergence. Unlike model parameters, hyperparameters are manually selected and are typically optimized through empirical experimentation. Selecting appropriate hyperparameters is crucial for training efficient and accurate deep learning models.
Among all hyperparameters, the learning rate is one of the most critical in deep learning, as it determines the step size of parameter updates along the gradient direction. The learning rate not only affects whether the model can converge to an optimal solution but also impacts the speed and stability of convergence. A learning rate that is too high leads to excessive gradient updates, preventing stable convergence. Conversely, a learning rate that is too low results in slow convergence, potentially causing the training process to terminate prematurely before reaching the optimal solution and increasing the risk of overfitting.
To determine the optimal learning rate for improved performance, experiments were conducted using different learning rate settings to train the SECA-L-DenseNet121 model. The SGD optimizer was employed, with learning rates set to 0.05, 0.01, and 0.001, and weight decay coefficients were set to 0.001, 0.0001, and 0.00001, respectively. All possible combinations of these two hyperparameters were tested systematically during training.
The experimental results are presented in Figure 9. As observed from the figure, the model achieved the best performance when the learning rate was set to 0.01 and the weight decay coefficient was set to 0.0001.

4. Discussion

The application of deep learning technology in the classification and identification of mature field wheat varieties significantly addresses the substantial time and resource consumption associated with manual classification. Moreover, it mitigates the issue of low accuracy caused by subjective human operations. Leveraging deep learning network models for wheat variety identification not only enhances efficiency but also achieves accuracy far superior to manual methods. Consequently, this technology plays a crucial role in wheat variety breeding, field resource management, and crop yield prediction.
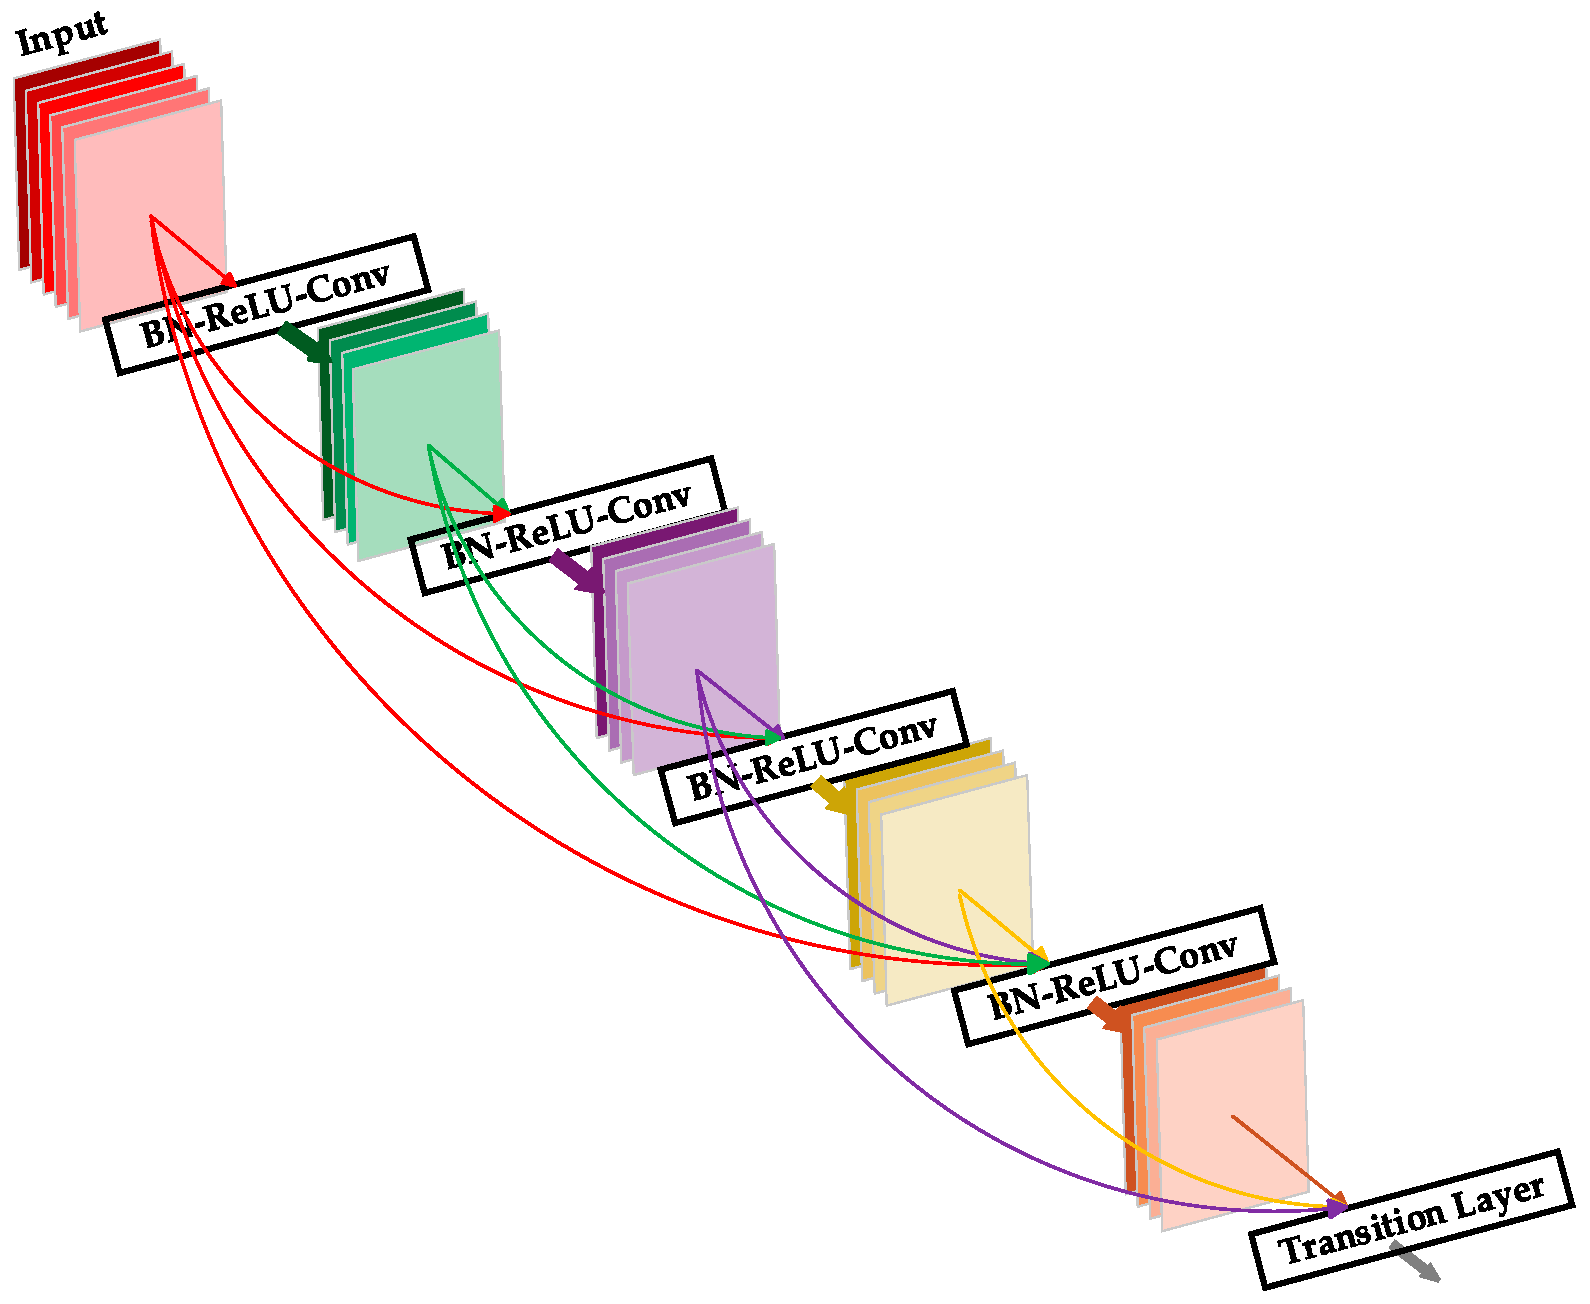
Convolutional neural networks (CNNs) exhibit remarkable advantages in local image feature extraction, effectively capturing critical features from input images to enable precise image classification. Compared to other classification models, DenseNet distinguishes itself through its unique dense connectivity mechanism, which facilitates efficient feature reuse, enhances gradient propagation, mitigates gradient vanishing, and improves feature representation capability and computational efficiency, all while reducing the number of model parameters. These advantages collectively contribute to improved classification accuracy and generalization capability.
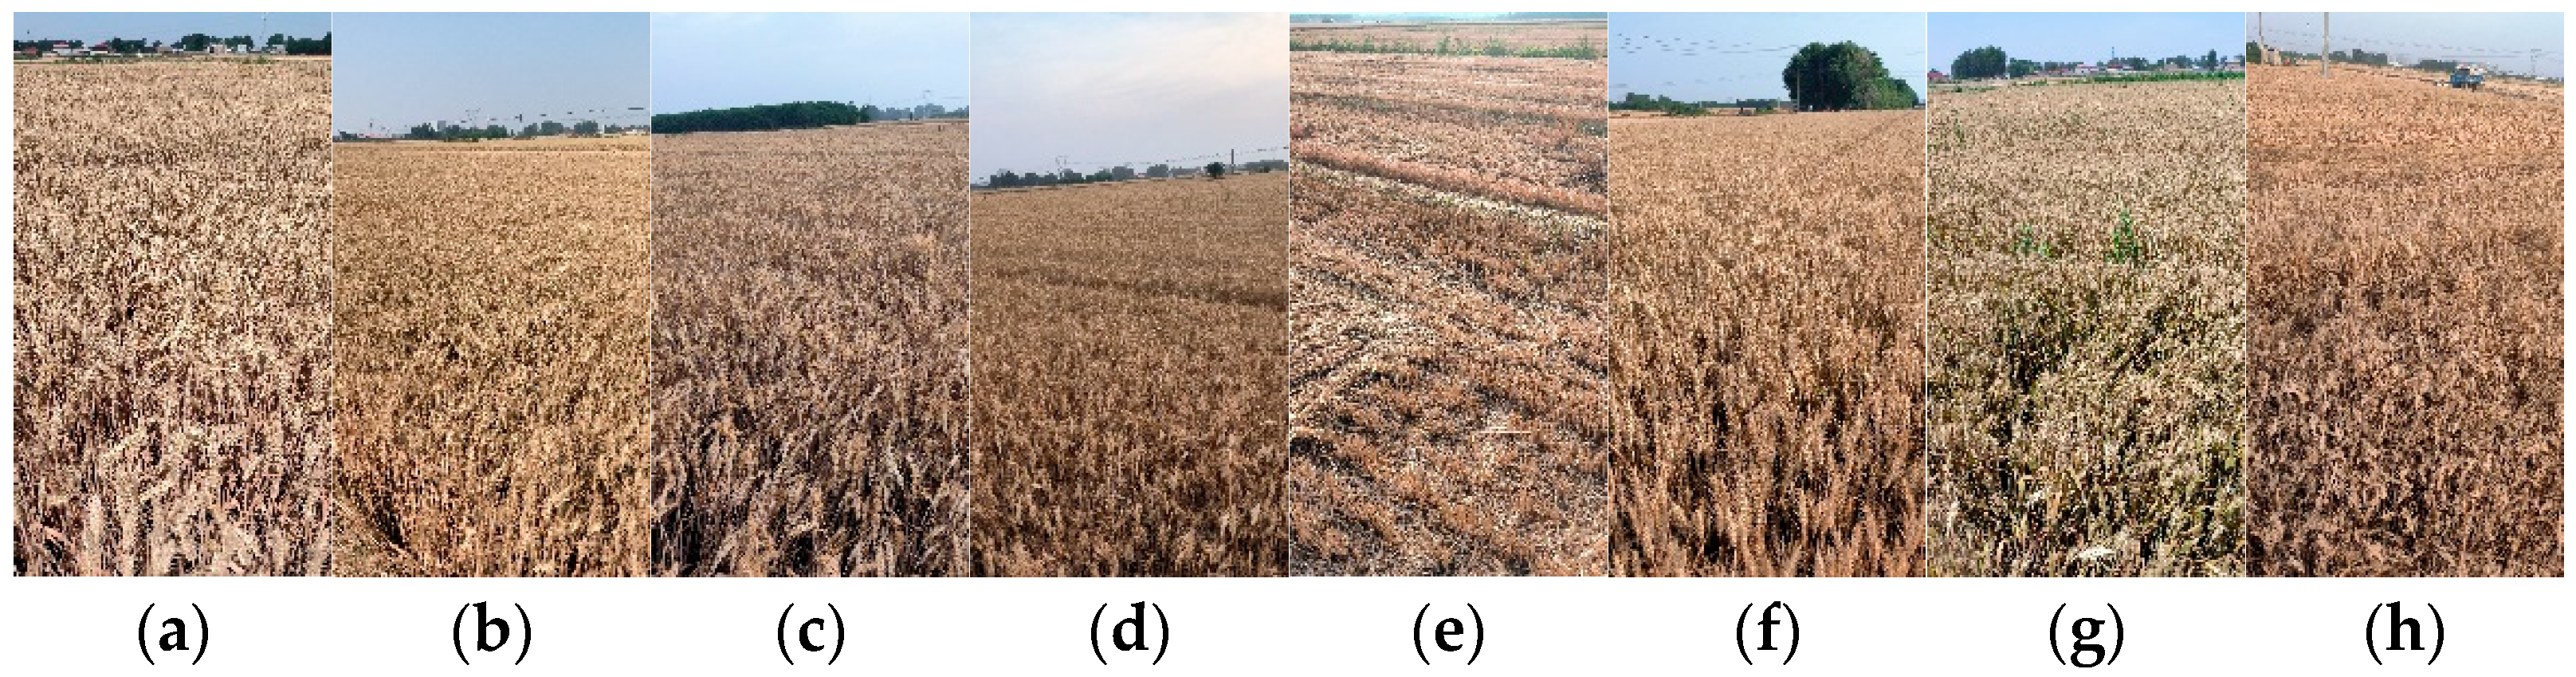
This study collected and constructed an image dataset comprising 8956 images of eight mature wheat varieties. To achieve more precise wheat variety identification, we enhanced the DenseNet model by integrating SE and ECA modules, thereby developing a dual-attention mechanism model named SECA-L-DenseNet. This enhancement enables adaptive reinforcement of critical inter-channel features while suppressing redundant information. Furthermore, we replaced ReLU with Leaky ReLU to effectively mitigate “neuron death” issues, thereby improving model training stability. Additionally, to address the challenge of a limited dataset size, we applied transfer learning by fine-tuning a pre-trained model, enhancing both the generalization ability and convergence speed. The experimental results indicate that the improved model achieved a 2.13 percentage point increase in recognition accuracy, demonstrating a significant improvement over the baseline model.
However, despite the SECA-L-DenseNet model achieving accurate and efficient wheat variety identification under field conditions, several limitations remain that require further refinement before practical deployment. First, for large-scale agricultural applications, it is imperative to expand the dataset by incorporating multispectral imagery from diverse crop types, cultivars, geographical regions, and phenological stages to enhance model robustness. Second, although the dataset was acquired under optimal weather and illumination conditions, real-world implementation necessitates onboard imaging systems installed on harvesters. Under operational conditions, complex interference factors, including dust contamination, illumination variations, and mechanical vibrations, may induce significant discrepancies between field-captured images and training data. While our preprocessing methods partially mitigate these disturbances, model performance degradation under extreme environmental scenarios remains a concern. Finally, given the intended deployment on resource-constrained mobile platforms, optimizing the model’s lightweight architecture without compromising recognition accuracy will be a critical focus of future research.

5. Conclusions

To address the practical challenge of visually distinguishing wheat varieties during field harvesting, this study proposes an enhanced DenseNet-based classification methodology. By integrating dual-attention mechanisms into the DenseNet-121 backbone, we developed the SECA-L-DenseNet model. Experimental validation confirms its feasibility for wheat variety identification, with the following key findings:
(1)
Comparative analyses against classical deep neural networks (e.g., ResNet50, GoogLeNet) demonstrate the superior recognition accuracy of SECA-L-DenseNet, validating both its architectural advantages and the necessity of this research.
(2)
Ablation studies comparing SE-DenseNet, SECA-DenseNet, and other model variants with the original DenseNet-121 reveal consistent accuracy improvements across all the modifications. Notably, the dual-attention SECA-L-DenseNet configuration achieved a 2.13% accuracy increase, reaching 96.87% recall, over the baseline DenseNet, representing the most substantial enhancement. This empirical validation confirms that the synergistic integration of dual-attention mechanisms and Leaky ReLU activation effectively optimizes DenseNet’s performance on our proprietary wheat variety dataset.

Author Contributions

Conceptualization, G.T.; data curation, Z.L. and Y.Z.; formal analysis, Z.L. and G.T.; funding acquisition, G.T.; investigation, Y.Z. and G.T.; methodology, Z.L. and Y.Z.; project administration, G.T.; resources, G.T.; software, Z.L. and Y.Z.; supervision, G.T.; validation, Z.L. and Y.Z.; visualization, Z.L. and Y.Z.; writing—original draft preparation, Z.L. and Y.Z.; writing—review and editing, Y.Z. and G.T. All authors have read and agreed to the published version of the manuscript.

Funding

This research was funded by National Natural Science Foundation of China (U20A20180) and Agricultural Scientific and Technological Achievements Transformation Fund of Hebei (202460104030028).

Institutional Review Board Statement

Not applicable.

Data Availability Statement

The data presented in this study are available upon request from the corresponding author.

Acknowledgments

We thank the editor and reviewers for their helpful suggestions to improve the quality of this manuscript.

Conflicts of Interest

The authors declare no conflicts of interest.

References

  1. Ceyhan, M.; Kartal, Y.; Özkan, K.; Seke, E. Classification of wheat varieties with image-based deep learning. Multimed. Tools Appl. 2024, 83, 9597–9619. [Google Scholar]
  2. Deng, L.; Li, H.; Liu, H.; Zhang, H.; Zhao, Y. Research on Multi-feature Fusion for Support Vector Machine Image Classification Algorithm. In Proceedings of the 2021 IEEE International Conference on Electronic Technology, Communication and Information (ICETCI), Changchun, China, 27–29 August 2021; IEEE: New York, NY, USA, 2021. [Google Scholar] [CrossRef]
  3. Chandrakala, M.; Durga Devi, P. Face Recognition Using Cascading of HOG and LBP Feature Extraction. In Proceedings of the International Conference on Soft Computing and Signal Processing, Hyderabad, India, 18–19 June 2021; pp. 553–562. [Google Scholar]
  4. Jing, L.; Tian, Y. Self-supervised visual feature learning with deep neural networks: A survey. IEEE Trans. Pattern Anal. Mach. Intell. 2020, 43, 4037–4058. [Google Scholar]
  5. Humeau-Heurtier, A. Texture feature extraction methods: A survey. IEEE Access 2019, 7, 8975–9000. [Google Scholar]
  6. Liu, Y.; Pu, H.; Sun, D.-W. Efficient extraction of deep image features using convolutional neural network (CNN) for applications in detecting and analysing complex food matrices. Trends Food Sci. 2021, 113, 193–204. [Google Scholar]
  7. Najafabadi, M.M.; Villanustre, F.; Khoshgoftaar, T.M.; Seliya, N.; Wald, R.; Muharemagic, E. Deep learning applications and challenges in big data analytics. J. Big Data 2015, 2, 1. [Google Scholar] [CrossRef]
  8. Mohyuddin, G.; Khan, M.A.; Haseeb, A.; Mahpara, S.; Waseem, M.; Saleh, A.M. Evaluation of Machine Learning approaches for precision Farming in Smart Agriculture System—A comprehensive Review. IEEE Access 2024, 12, 60155–60184. [Google Scholar]
  9. Paymode, A.S.; Malode, V.B. Transfer learning for multi-crop leaf disease image classification using convolutional neural network VGG. Artif. Intell. Agric. 2022, 6, 23–33. [Google Scholar]
  10. Simonyan, K.; Zisserman, A. Very deep convolutional networks for large-scale image recognition. arXiv 2014, arXiv:1409.1556. [Google Scholar]
  11. Yuan, Y.; Fang, S.; Chen, L. Crop Disease Image Classification Based on Transfer Learning with DCNNs. In Proceedings of the Pattern Recognition and Computer Vision: First Chinese Conference (PRCV 2018), Guangzhou, China, 23–26 November 2018; pp. 457–468. [Google Scholar]
  12. Krizhevsky, A.; Sutskever, I.; Hinton, G.E. ImageNet classification with deep convolutional neural networks. Commun. ACM 2017, 60, 84–90. [Google Scholar] [CrossRef]
  13. Chen, F.; Shen, Y.; Li, G.; Ai, M.; Wang, L.; Ma, H.; He, W. Classification of wheat grain varieties using terahertz spectroscopy and convolutional neural network. J. Food Compos. Anal. 2024, 129, 106060. [Google Scholar]
  14. Bogue, R. Sensing with terahertz radiation: A review of recent progress. Sens. Rev. 2018, 38, 216–222. [Google Scholar] [CrossRef]
  15. Yang, G.; He, Y.; Yang, Y.; Xu, B. Fine-grained image classification for crop disease based on attention mechanism. Front. Plant Sci. 2020, 11, 600854. [Google Scholar]
  16. Sardeshmukh, M.; Chakkaravarthy, M.; Shinde, S.; Chakkaravarthy, D. Crop image classification using convolutional neural network. Multidiscip. Sci. J. 2023, 5, 2023039. [Google Scholar] [CrossRef]
  17. Peng, H.; Xu, H.; Gao, Z.; Zhou, Z.; Tian, X.; Deng, Q.; He, H.; Xian, C. Crop pest image classification based on improved densely connected convolutional network. Front. Plant Sci. 2023, 14, 1133060. [Google Scholar] [CrossRef] [PubMed]
  18. Ma, N.; Zhang, X.; Liu, M.; Sun, J. Activate or not: Learning Customized Activation. In Proceedings of the IEEE/CVF Conference on Computer Vision and Pattern Recognition, Nashville, TN, USA, 20–25 June 2021; pp. 8032–8042. [Google Scholar]
  19. Mu, Y.; Ni, R.; Fu, L.; Luo, T.; Feng, R.; Li, J.; Pan, H.; Wang, Y.; Sun, Y.; Gong, H. DenseNet weed recognition model combining local variance preprocessing and attention mechanism. Front. Plant Sci. 2023, 13, 1041510. [Google Scholar]
  20. Jiang, M.; Feng, C.; Fang, X.; Huang, Q.; Zhang, C.; Shi, X. Rice disease identification method based on attention mechanism and deep dense network. Electronics 2023, 12, 508. [Google Scholar] [CrossRef]
  21. Feng, S.; Yang, Z.; Huang, M.; Wu, Y. Classification of Crop Disasters Based on Densenet. In Proceedings of the 2022 5th International Conference on Pattern Recognition and Artificial Intelligence (PRAI), Chengdu, China, 19–21 August 2022; pp. 252–256. [Google Scholar]
  22. Hu, J.; Shen, L.; Albanie, S.; Sun, G.; Wu, E. Squeeze-and-Excitation Networks. IEEE Trans. Pattern Anal. Mach. Intell. 2020, 42, 2011–2023. [Google Scholar] [CrossRef]
  23. Wang, Q.; Wu, B.; Zhu, P.; Li, P.; Zuo, W.; Hu, Q. ECA-Net: Efficient Channel Attention for Deep Convolutional Neural Networks. In Proceedings of the IEEE/CVF Conference on Computer Vision and Pattern Recognition, Seattle, WA, USA, 13–19 June 2020; pp. 11534–11542. [Google Scholar]
  24. Philipp, G.; Song, D.; Carbonell, J.G. Gradients explode-deep networks are shallow-resnet explained. In Proceedings of the ICLR 2018 Conference, Vancouver, BC, Canada, 30 April–3 May 2018. [Google Scholar]
  25. Jin, X. Analysis of Residual Block in the Resnet for Image Classification. In Proceedings of the 1st International Conference on Data Analysis and Machine Learning, Changsha, China, 28–30 July 2023; pp. 246–250. [Google Scholar]
  26. Huang, G.; Liu, Z.; Van Der Maaten, L.; Weinberger, K.Q. Densely Connected Convolutional Networks. In Proceedings of the IEEE Conference on Computer Vision and Pattern Recognition, Honolulu, HI, USA, 21–26 July 2017; pp. 4700–4708. [Google Scholar]
  27. Niu, Z.; Zhong, G.; Yu, H. A review on the attention mechanism of deep learning. Neurocomputing 2021, 452, 48–62. [Google Scholar] [CrossRef]
  28. Maas, A.L.; Hannun, A.Y.; Ng, A.Y. Rectifier nonlinearities improve neural network acoustic models. Proc. ICML 2013, 30, 3. [Google Scholar]
Figure 1. Examples of wheat variety images. (a) Jimai 38; (b) Jingdong 18; (c) Jinghua 11; (d) Lanmai; (e) wheat stubble; (f) Shixin 633; (g) Yudancheng 339; (h) Zhongxinmai 8.
Agriculture 15 00736 g001
Figure 2. Network structure of DenseNet.
Agriculture 15 00736 g002
Figure 3. Network structure of SE block.
Agriculture 15 00736 g003
Figure 4. Network structure of ECA module.
Agriculture 15 00736 g004
Figure 5. Network structure of SECA-L-DenseNet.
Agriculture 15 00736 g005
Figure 6. Accuracy curves of different models.
Agriculture 15 00736 g006
Figure 7. Confusion matrix of wheat variety test set.
Agriculture 15 00736 g007
Figure 8. Ablation experiment results line chart.
Agriculture 15 00736 g008
Figure 9. Accuracy of the improved SECA-L-DenseNet model under different parameters.
Agriculture 15 00736 g009
Table 1. Wheat dataset sample division table.
Wheat VarietyTraining SetTest SetVerify SetTotal
Zhongxinmai 859016886844
Jingdong 189232641331320
Jinghua 119722781401390
Jimai 3851014574729
Lanmai55115780788
Yudancheng 33945913167657
Shixin 63313083731881869
Wheat stubble9512711371359
Total626417879058956
Table 2. Classification results of the four classification models.
Network ModelPrecision Rate/%Recall Rate/%F1-Score/%Accuracy Rate/%
DenseNet12195.0694.6994.8595.02
DenseNet20194.6194.1394.3594.46
ResNet5094.1593.9894.0494.40
GoogLeNet93.9593.3793.6293.84
Vgg1690.8290.4390.5690.71
Table 3. Experimental results of wheat variety recognition.
Wheat VarietyPrecision Rate/%Recall Rate/%F1-Score/%Accuracy Rate/%
Zhongxinmai 895.3597.6296.4797.15
Jingdong 1894.8196.9795.88
Jinghua 1197.4696.7697.11
Jimai 3898.5895.8697.20
Lanmai96.7394.2795.48
Yudancheng 339100.0096.1898.05
Shixin 63396.2997.3296.80
Wheat stubble99.63100.0099.82
Table 4. Results of the ablation experiment.
Model NameSEECALeaky ReLUAccuracy/%Recall Rate/%F1-Score/%Accuracy Rate/%ParameterFrames Per Second
DenseNet121×××95.0694.6994.8595.027,978,85646.60
SE-DenseNet121××96.4295.7396.0496.198,021,86442.34
ECA-DenseNet121××95.3795.3495.3495.247,979,08832.61
SECA-DenseNet121×96.5196.3796.4296.538,022,09631.06
L-DenseNet121××95.5895.0295.2595.367,978,85649.90
SE-L-DenseNet121×96.5696.0496.2896.258,021,86442.22
ECA-L-DenseNet121×95.2994.9295.0895.197,979,08831.57
SECA-L-DenseNet12197.3696.8797.1097.158,022,09631.87
Note: “√” in the table indicates that the corresponding model contains the module, while “×” indicates that the model does not contain the module.
Disclaimer/Publisher’s Note: The statements, opinions and data contained in all publications are solely those of the individual author(s) and contributor(s) and not of MDPI and/or the editor(s). MDPI and/or the editor(s) disclaim responsibility for any injury to people or property resulting from any ideas, methods, instructions or products referred to in the content.

