1. Introduction
Mastitis is characterised by inflammation of the mammary gland in both humans and animals. The disease can be limited to one or a few mammary glands (uniglandular mastitis) or affect all mammary glands (multiglandular effects, hard udder syndrome). In sows, clinical mastitis often occurs together with metritis and agalactia, a condition known as mastitis, metritis, agalactia (MMA). Acute mastitis symptoms usually occur before or, more commonly, one to two days after farrowing. These symptoms include local inflammation in one or more of the udder complexes. Severely affected udder complexes show swelling, pain, increased temperature, redness, and induration, possibly accompanied by poor general condition, fever, or hypo- or agalactia [
1,
2]. Cases of chronic mastitis, characterised by abscesses and granulomas in the mammary tissue, can reduce milk production and are often seen at or shortly after weaning. These cases often go undiagnosed until slaughter [
1,
3,
4,
5]. Subclinical mastitis refers to cases without visible external signs of inflammation.
While the normal rectal temperature in healthy pregnant sows ranges from
to
[
6,
7,
8,
9], rectal temperatures in healthy lactating sows can vary widely, from
to
[
8,
10]. Another limiting factor may be the use of infrared thermography (IRT) to assess temperature, which has a large measurement uncertainty [
11]. However, as conventional rectal temperature measurement can cause stress and increase infection in breeding sows [
12], field studies are investigating whether non-invasive IRT temperature measurement can be an alternative to rectal temperature measurement [
10]. Although IRT technology seems promising and easy to use, in practice, measurements are extremely uncertain due to various factors that cannot be eliminated. These factors include changes in emissivity due to hair, dirt, moisture, etc., background radiation, and the low accuracy of thermal imagers. The latter can only be
at best, provided the instrument is calibrated against the ITS-90 reference temperature and any necessary corrections are taken into account. In typical cases, the accuracy of IRT cameras is around
, which is unacceptable for reliable measurements in most cases [
13,
14,
15,
16]. The use of low-accuracy IRT cameras without adherence to the IRT measurement protocol is a significant shortcoming of previous studies.
When IRT was used as a diagnostic tool to examine udder health in sows, differences between mean udder-skin temperatures of different categories of sows (e.g., healthy, clinically suspect, and diseased) and correlations between different parameters (e.g., ambient temperature, rectal temperature, and udder-skin temperature) on specific days following/preceding farrowing or weaning were examined. Despite the data being frequently collected in temporal order around farrowing or weaning, the statistical analyses employed solely conventional time-independent statistical methods, to a considerable extent neglecting the natural temporal order of the data. The mean values of the rectal temperature and the udder-skin temperatures of the sows were compared using a variety of time-independent statistical tests, including the
t-test, analysis of variance (ANOVA), Kruskal–Wallis test or Chi-square homogeneity test for independent samples [
1,
10,
17,
18,
19,
20]. The correlations between udder-skin temperatures and other parameters were evaluated using Pearson correlation coefficients [
17,
19,
20,
21], Spearman correlation coefficients [
1], or extended linear mixed models [
22], which are all time-independent statistical methods. Furthermore, a review study [
12] examining the use of IRT in pigs, focusing on environmental, skin and body temperature relationships and the detection of fever and other health problems, reports the use of time-independent statistical methods only, namely Spearman and Pearson correlation coefficients in combination with linear regression. In this article, we address the shortcomings of previous studies and apply statistical methods to analyse time series (i.e., sequences taken at successive equally spaced points in time) of IRT data (as well as rectal temperature measurements) with the aim of extracting potentially meaningful time-dependent characteristics of clinical mastitis in sows that could not be extracted using time-independent statistical methods alone. Importantly, our choice of statistical methods reflects the understanding that radiated heat loss (udder-skin temperature) differs from, and may precede, a detectable rise in rectal temperature.
The present investigation is guided by two fundamental research questions. Firstly, it is examined whether multiglandular mastitis in sows can be detected or predicted at an early stage using only IRT imaging. Secondly, it is assessed whether uniglandular mastitis can be detected or predicted using the same approach. A key novelty of this study is the employment of time-dependent statistical methods on the original IRT time series data, but also, or even more, the use of time-dependent trends as an alternative to the original IRT time series data in order to account for the high variance in normal rectal temperature associated with farrowing and lactation, and to minimise the impact of measurement uncertainty. Appropriate statistical methods and a high-quality IRT camera, utilised in an appropriate manner to ensure minimal measurement uncertainty, will enable a positive response to the first research question. This will be a confirmation that, in lieu of conventional rectal temperature measurements, which are known to be stressful for sows, only udder-skin IRT temperatures, a non-invasive method, can be used to assist in the detection or prediction of multiglandular mastitis in sows. However, definitive conclusions on the second research question concerning the detection/prediction of uniglandular mastitis in sows cannot be drawn due to the study’s limitations, primarily the prophylactic treatment of sows with NSAIDs and the absence of veterinary examination.
2. Materials and Methods
2.1. Aims, Design, and Setting of the Study
The study was carried out on a one-site small pig farm with 80 breeding sows (crossbreed Landrace × Yorkshire) that had a history of high incidence of MMA. The aim of the breeder is to breed pigs with a high welfare standard, as assessed by the Welfare Quality Assessment Protocol for pigs [
23]. The study was carried out as part of regular diagnostics on one of 6 farms participating in the Slovenian Target Research Programme CRP V4-1604 (Animal welfare including health of poultry and pigs in conventional and alternative housing systems). The Ethics Committee that approves and supervises the animal experiments is part of the Administration of the Republic of Slovenia for Food Safety, Veterinary and Plant Protection under the Ministry of Agriculture, Forestry and Food. The content of the above-mentioned research project was supervised by this administrative authority and all participants, procedures, and objectives of the programme were continuously monitored by means of regular reports.
The aim of the study was to investigate whether IRT images of the mammary glands of breeding sows could be used to predict the development of mastitis or detect it as early as possible to prevent agalactia and the consequent loss or death of piglets. While conventional rectal temperature measurement is stressful for breeding sows, IRT temperature measurement is a completely non-invasive method. An early and animal-friendly method of diagnosing mastitis would increase piglet survival and reduce treatment costs and a potential bacterial resistance. The sows were observed from 5 to 9 days before farrowing and from 5 to 9 days after farrowing. They were all on prophylactic treatment for mastitis, so, with some exceptions, they received NSAIDs on the first and third day after farrowing. The days of treatment with NSAIDs are shown in the 4th and 5th column of
Table 1.
For each breeding sow, the temperature of each of her milk complexes was measured separately with a high-quality IRT camera (FLIR T650sc, FLIR Systems, Wilsonville, OR, USA). The detector type was an uncooled FPA microbolometer operating in the spectral range from to , with a noise equivalent temperature difference of and a specified accuracy of of reading or over a temperature range of to , at an ambient temperature from to . Prior to the research measurements, the camera was calibrated at LMK—Laboratory for Metrology and Quality at the Faculty of Electrical Engineering, University of Ljubljana, to confirm its accuracy. For this purpose, the calibration was performed in the range between and , where, for our research, the relevant corrections (correction = true value − measured value) were at , at , and at and these were taken into account when processing the results. The measurement uncertainty of the camera was , which may seem high, but smaller measurement uncertainties are practically impossible to achieve with the technology currently available, with the main limitation or largest contributor to the measurement uncertainty being the camera itself. The camera had a wide-angle lens (), with an FOV of , a spatial resolution of (IFOV), magnification (8×), and a minimum focusing distance of . The emissivity value could be set in 0.01 steps from 0.10 to 1.00. Measurements were corrected for reflected heat flux and optical and atmospheric transmittance. The analysis of the thermal images in the software environment (ResearchIR Max by FLIR Systems, Wilsonville, OR, USA) allowed the analysis of different areas of interest (POIs), e.g., single points, areas, automatic hot/cold spot detection, temperature differences, isotherms, profiles, alarms, etc. The resolution of the camera was pixels, i.e., 307,200 pixels in one thermogram.
For reference, rectal body temperature was measured using a calibrated alcohol thermometer with an expanded uncertainty of .
2.2. Characteristics of Participants
A total of 21 pregnant sows were included in the study. On the basis of regular (at least annual) laboratory testing, the farm was free of at least the following pig diseases: porcine reproductive and respiratory syndrome, Aujeszky’s disease, and classical and African swine fever. The pigs did not show any clinical signs of other diseases and we did not use any method or model related to positive or negative predictive indices for diseases that may be present without or before the appearance of symptoms.
The farrowing unit was located in a closed farm building where all categories of animals were separated in different rooms. This allowed for an “all in/all out” housing system. Ventilation was natural through windows and mechanical through wall fans. Breeding sows were fed commercial diets once daily before farrowing and ad libitum with special commercial diets after farrowing. Water was provided ad libitum.
Table 1 summarises the characteristics of the sows, i.e., age, number of previous farrowings, days of prophylactic treatment with NSAIDs, number of piglets born alive, and number of piglets born dead in the farrowing under study. There were also some particularities about the sows that need to be mentioned. Sow no. 5 got over pneumonia a few days before farrowing. Sows no. 10, 11, and 21 were gilts and farrowed for the first time. Sow no. 13 died the day after farrowing due to bladder failure during farrowing. Sow no. 14 had a non-functional third mammary gland fused to the fourth on the left side. The cluster was therefore measured as a single mammary gland and recorded as the third mammary gland.
2.3. Description of Methodologies
Measurements were taken every day in the morning. Each measurement consisted of several steps. In the first step, we warmed up the IRT camera (FLIR T650sc, FLIR Systems, Wilsonville, OR, USA) by turning it on and leaving it in the maternity ward for at least 30 min. Meanwhile, the air temperature in the farrowing unit and the outside air temperature were measured with the thermometers already installed by the breeder, and the relative humidity in the farrowing unit was measured with a hydrometer. In the second step, we measured each sow’s body or rectal temperature with a calibrated alcohol thermometer from 3
to 5
deep in the rectum for at least one minute. Sometimes, we had to repeat the measurements because of the movement of the sow. In the third step, we started to measure the udder-skin temperature of each sow with the IRT camera. To minimise variations in emissivity, measurements were taken while the sow was standing, but after removing straw and dirt from the udder with a dry paper towel and waiting another 5 min. We took 6 thermal images for each sow. In the final step, thermal images were manually analysed using the ResearchIR software, version Max 4, by FLIR Systems, incorporating relative air humidity and room air temperature. Based on reference [
24], which concluded that ‘bare pig skin emissivity at the shoulder, udder, and ear base was found to be 0.96–0.98’, the emissivity factor for the udder was set to 0.97. The emissivity of 0.97 is so high that the measurement of infrared temperature would only be significantly influenced in the event of a source of thermal radiation with a much higher temperature being directly pointed to the measured site. This was never the case, nor is it expected in any similar circumstances. A difference of
in emissivity can lead to a
variation in the measured temperature of an object at approximately
, assuming a detector wavelength range of 8–14 μm, a detector temperature of
, and an ambient temperature of
. This correction was calculated using a standard procedure commonly employed by calibration laboratories when calibrating direct-reading low-temperature radiation thermometers [
16]. Although not all external factors could be fully controlled, leading to some additional errors in temperature readings, these errors were minor compared to the overall measurement uncertainty of
.
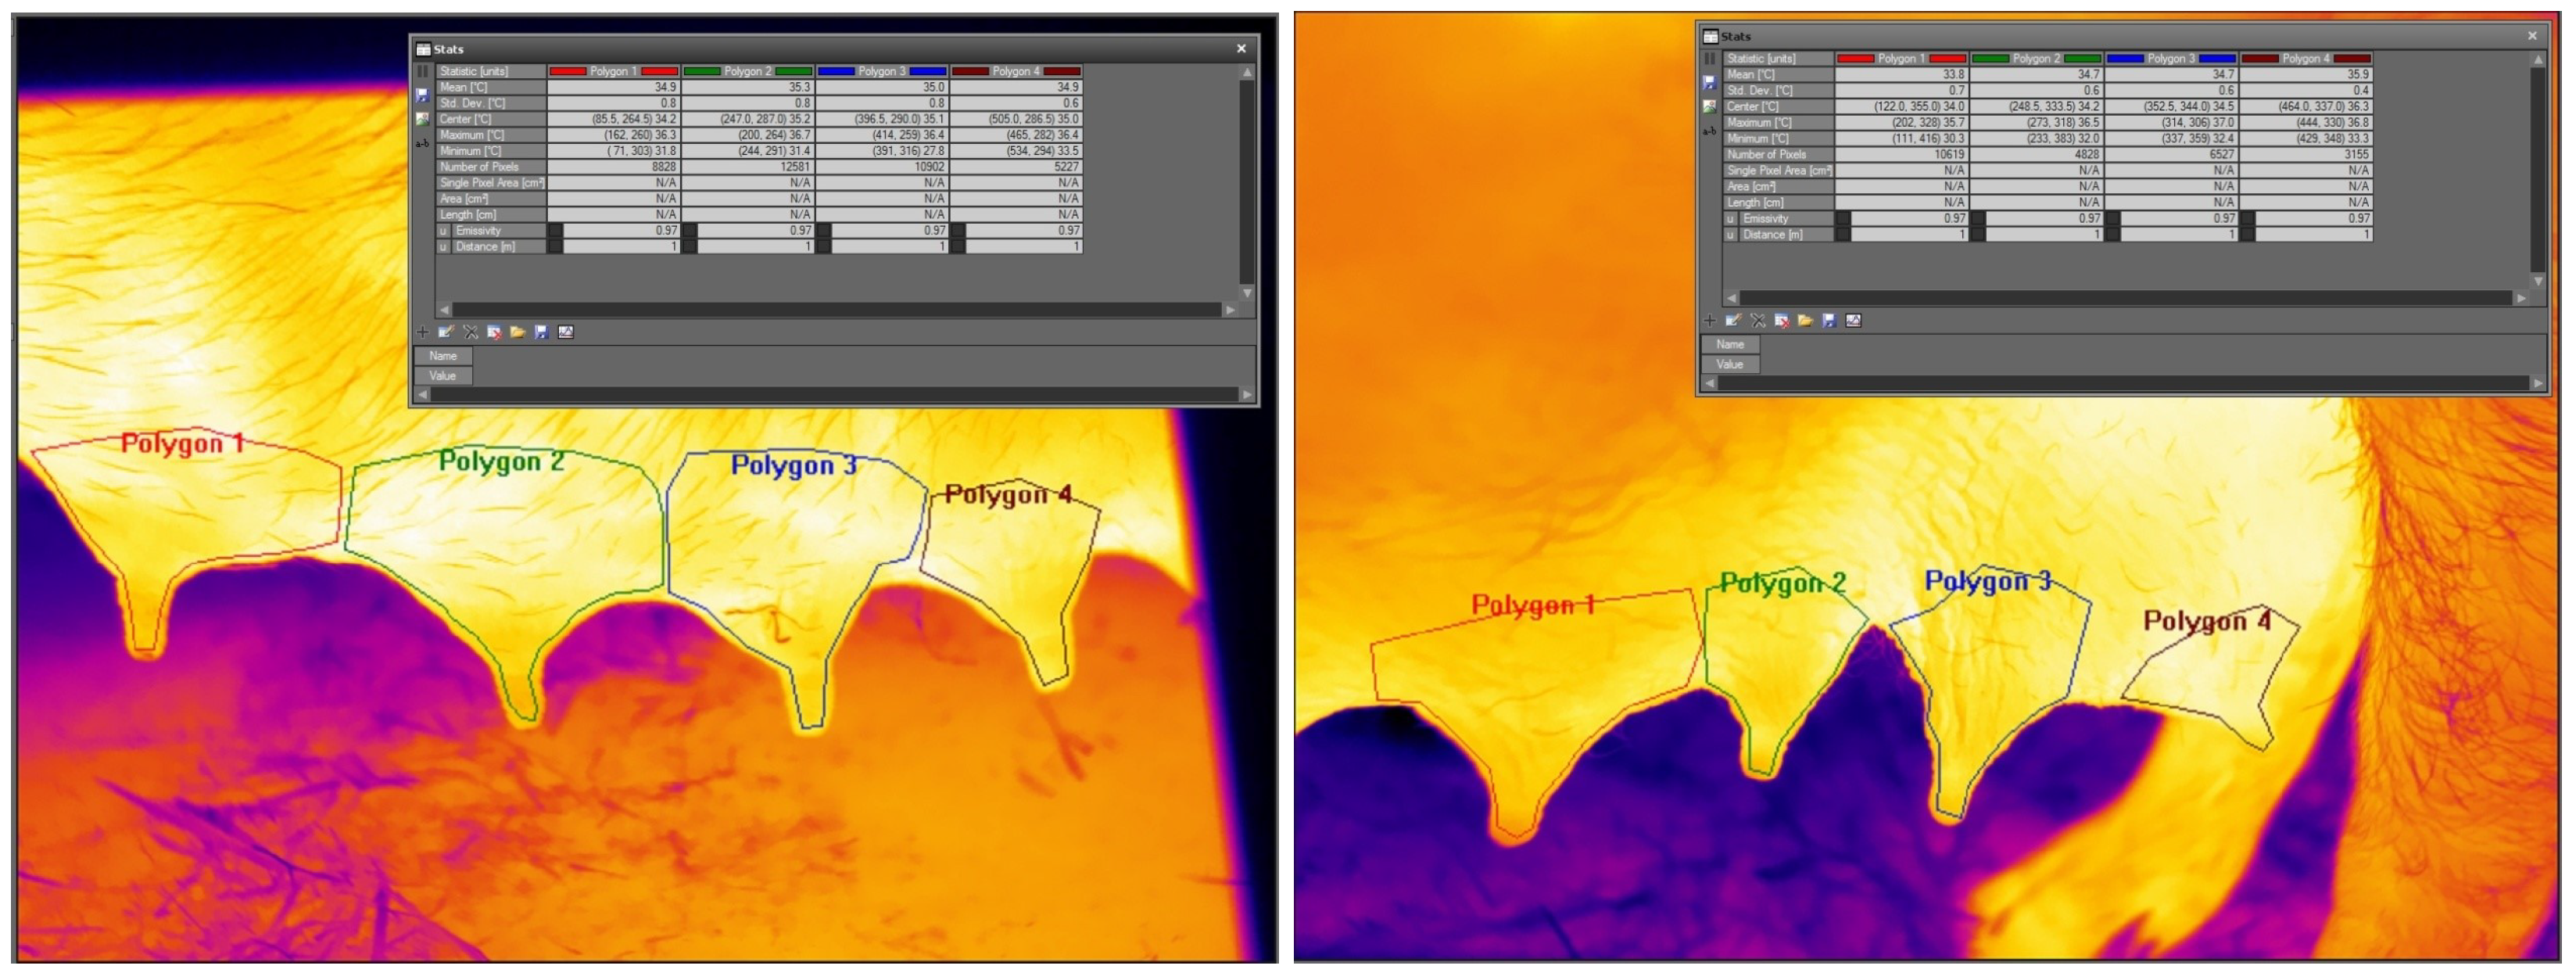
Figure 1 shows the udder-skin temperature analysis for the first four (left subfigure) and the last four (right subfigure) of eight left mammary glands of a sow in the FLIR ResearchIR software, version Max 4, by FLIR Systems, environment. The average, standard deviation, and highest and lowest values are determined with the exact locations in each area.
Important risk factors for uniglandular mastitis are traumatic lesions of the teats and glands or inaccessibility of the teats to the piglets. Piglets suckling the inguinal mammary glands of old sows are often unable to reach the teat during milk ejection, and an unsuckled mammary gland is a candidate for infection. On the other hand, cranial teats appear to be more at risk of trauma [
25]. As uniglandular mastitis is limited to one or a few mammary glands, more likely the inguinal and cranial glands, we will statistically estimate and compare trends in the time series of udder-skin temperatures around individual teats. Increased skin temperature in the first few days after farrowing and/or significant differences in the estimated trends are a sign of an ongoing local inflammation or a local inflammation that was reduced or relieved by the use of NSAIDs. The incidence of multiglandular mastitis, on the other hand, will be based mainly on the time series of rectal temperatures.
2.4. Statistical Methods
All the statistical analyses were performed using R, version 2023.09.1 [
26].
Rather than simply using the Kruskal–Wallis test, the
t-test, ANOVA, or calculating the usual Pearson correlation coefficients, which do not take into account the temporal order of the data, analysis of time series of rectal and IRT temperatures was carried out with respect to the trend caused by farrowing. Non-stationarity of the temperature time series, indicating trends and time-varying variance, was tested using the standard Dickey–Fuller test and the Box–Pierce test. Cox-Stuart trend analysis was then used to detect the presence of a trend regardless of the distribution of the data, i.e., the null hypothesis of no trend was tested against the alternative hypothesis of a monotonic trend. The simple moving average (SMA) was employed to smooth out the impact of measurement uncertainty and potential NSAID-induced temperature skewness, as well as to account for potential time lags between changes in rectal and IRT temperatures, allowing for a clearer identification and estimation of the underlying trend [
27]. Smoothing was achieved through the use of an averaging period of four days.
Cross-correlation analysis of time series or time series trends was used to determine the relationship between the rectal temperature and time-dependent udder-skin temperatures around the teats throughout the observation period. The relationship between two time series was measured for different time shifts/lags, which refer to the distance between two time series (in days). Such an analysis offers the possibility to determine how the lag between a pair of time series affects their relationship in terms of causality, correlations or predictive abilities between the series. Lag 0 means no lag or shift between the series. The cross-correlation at lag 0 calculates a correlation like the Pearson correlation estimate, but by pairing the data at identical times. A cross-correlation value of 1 indicates perfect correlation and −1 indicates perfect anti-correlation of the time series [
27]. All cross-correlation values
with
p-values less than
were considered statistically significant at the 10% level of significance. Cross-correlation coefficients were also calculated only for the second part of the observation period, after farrowing.
3. Results
During the 47 days of measurements conducted on the pig farm, 352 rectal temperature measurements were performed on 21 sows, in addition to 4742 udder-skin temperature measurements, which were taken using a high-quality IRT camera to ensure that the measurement uncertainty was as low as possible.
Table 2 presents the rectal body temperature measurements of the breeding sows in degrees Celsius (
), according to the day of farrowing. The days on which the breeding sows were treated with NSAIDs are indicated by shaded cells. On the first day after farrowing, the highest rectal temperatures were observed in sows no. 8, 10, and 21, with values of
,
, and
, respectively. On the second day after farrowing, the highest rectal temperature was observed in sow no. 11, with a value of
. The rectal temperatures observed during the initial period exhibited a decline in subsequent days, potentially as a result of NSAID treatment.
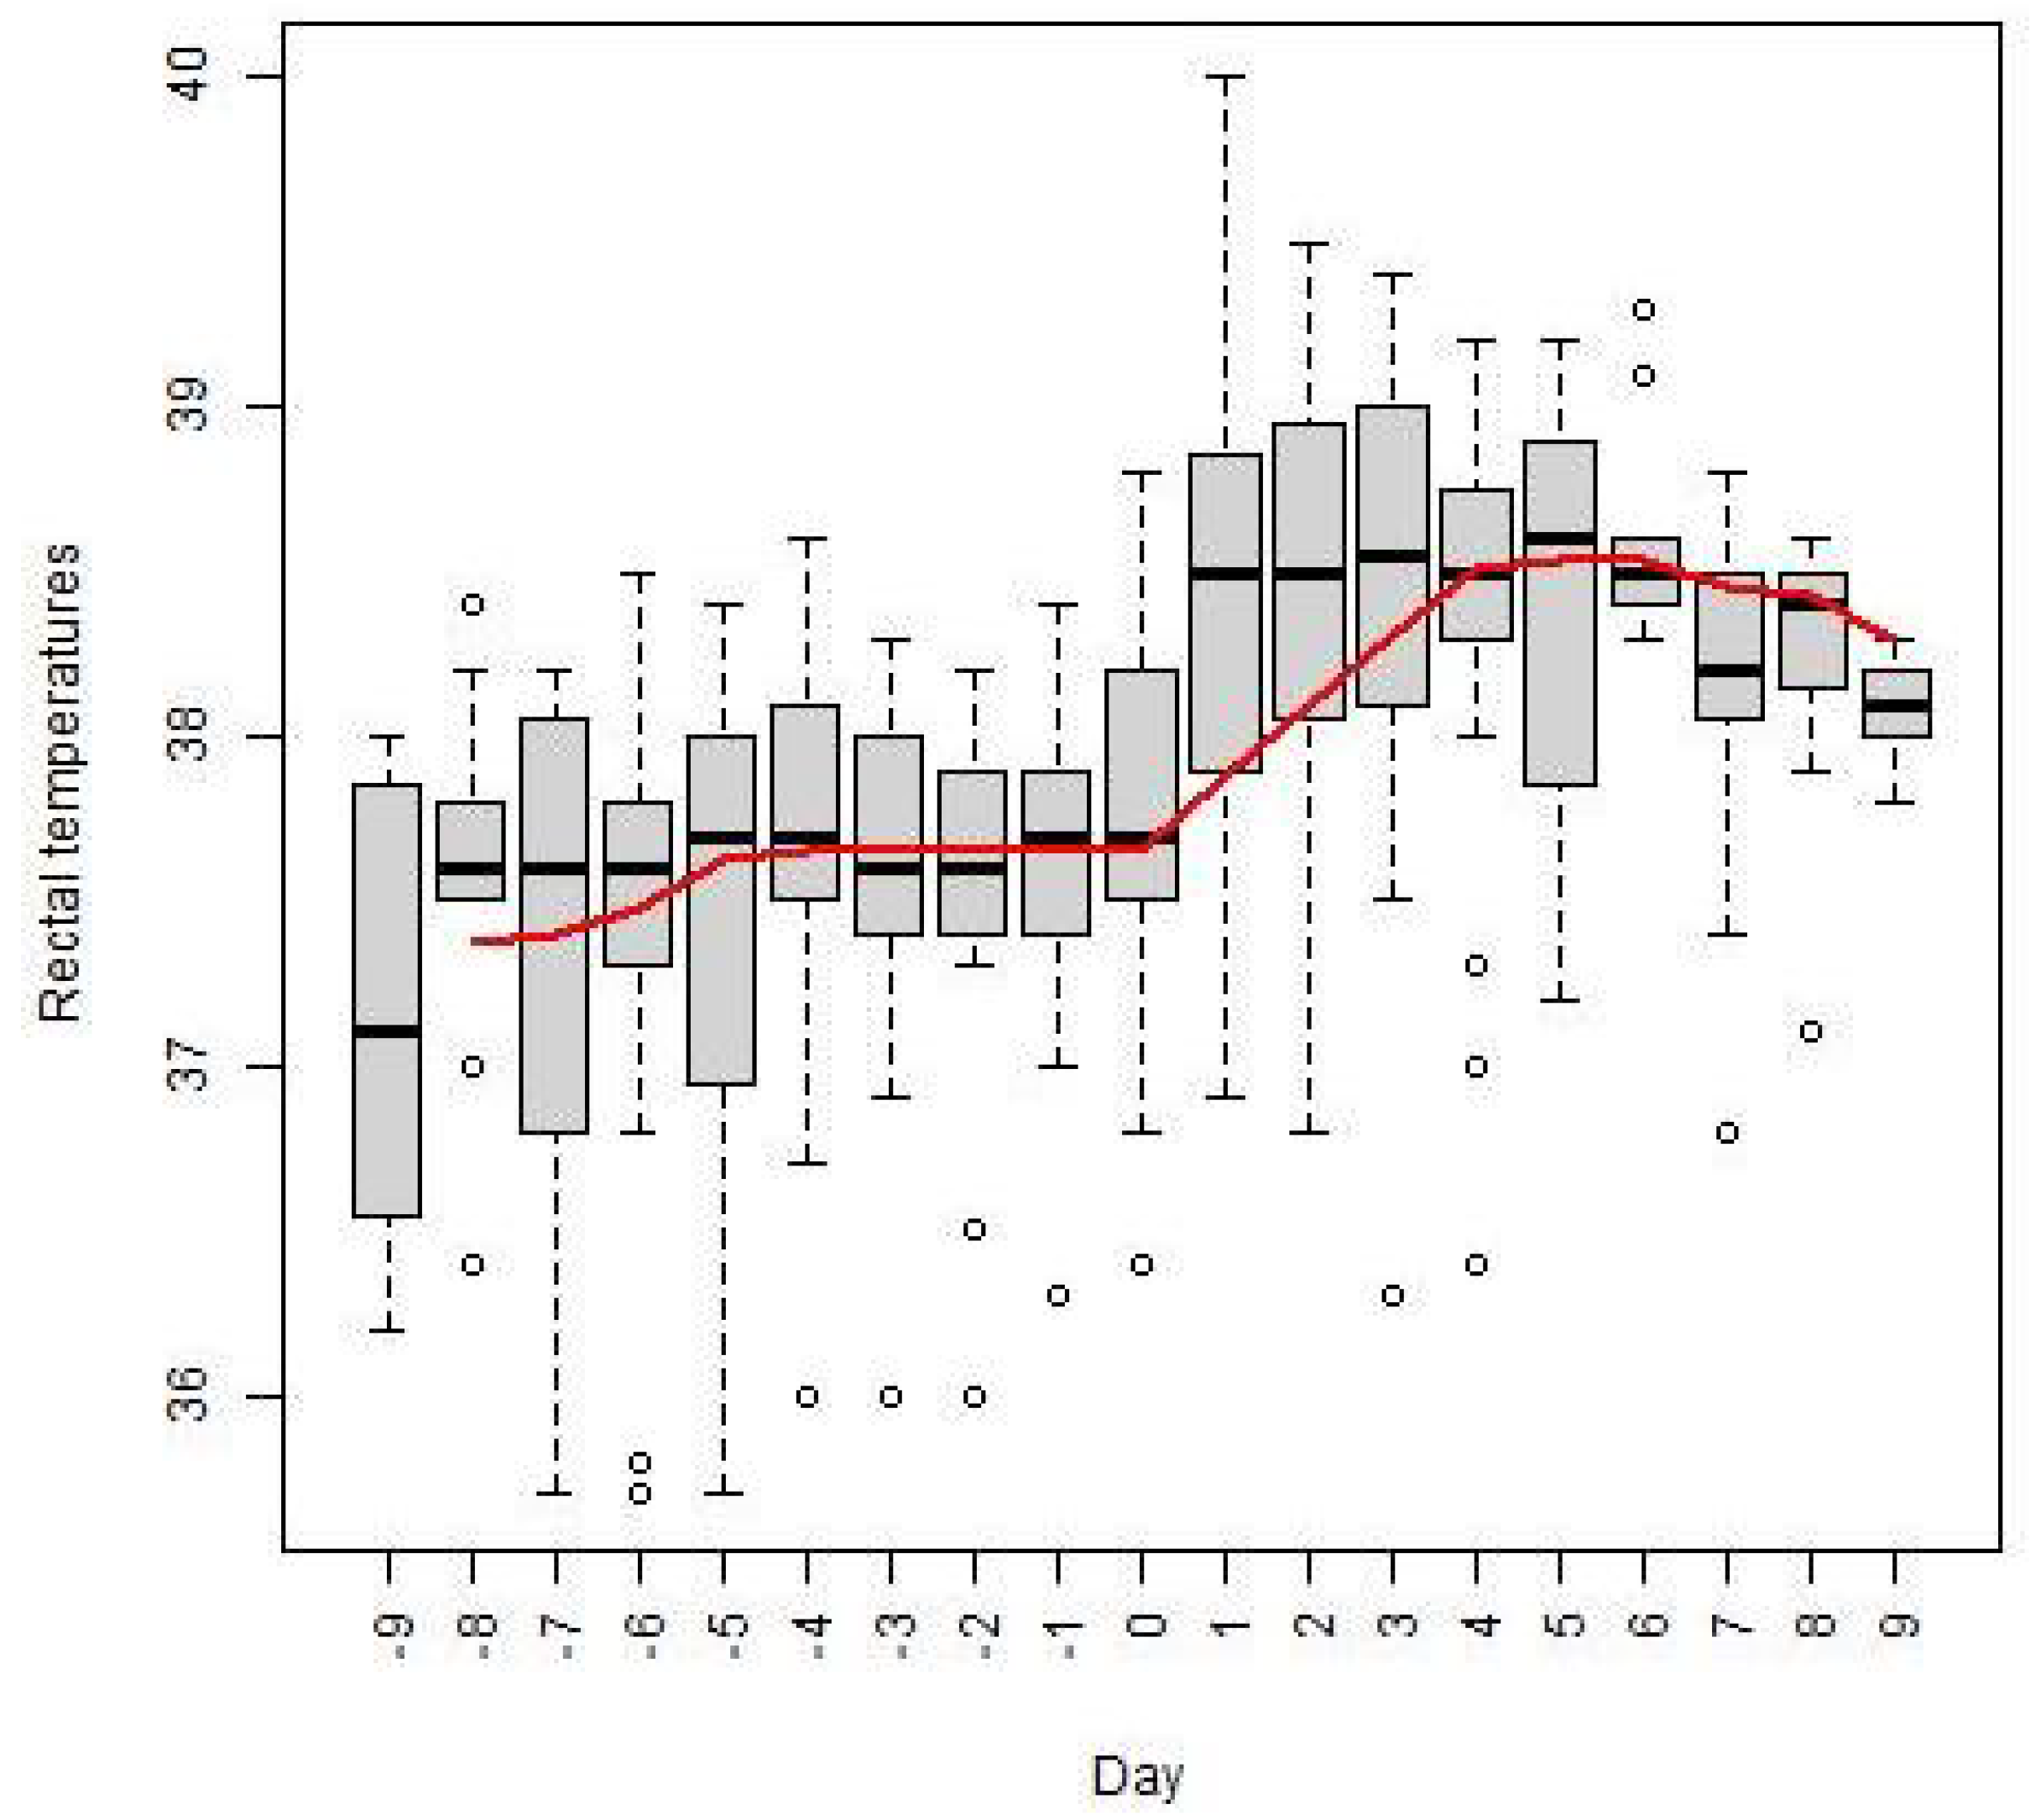
Figure 2 illustrates the effect of farrowing on rectal temperatures using the box-plot series of daily rectal temperatures of all the sows, according to the day of farrowing, from 9 days before farrowing until 9 days after farrowing. The horizontal lines within the boxes denote the daily medians of the rectal temperatures. Non-stationarity of the time series of medians was confirmed by the standard Dickey–Fuller test giving a
p-value of
, and the Cox-Stuart trend test confirmed a monotonic trend, rejecting the null hypothesis of no trend with a
p-value of
. The trend component of the medians of rectal temperatures, obtained by SMA smoothing, is depicted in
Figure 2 as a red line. A significant increase in rectal temperature was observed from the onset of farrowing, with a median rectal temperature of
on the day of farrowing, rising to
on the first day after farrowing. The greatest fluctuation in rectal temperature of individual sows in the early post-farrowing period, from the day before farrowing until the third day after farrowing, was observed in sows no. 2 and 4, with ranges of
and
, respectively. All the rectal temperature ranges of the sows in the early post-farrowing period with the median of
are presented in the second column of
Table 3. The daily means, medians and trend component of the medians of rectal temperatures are also given in
Table 4.
The occurrence of multiglandular mastitis or some other infection that leads to changes in the dynamic fluctuations in body temperature over time can be suspected if the sow’s rectal temperature trend is significantly different from the trend component of the medians of rectal temperature, obtained from the data of all sows. The fourth and fifth columns of
Table 3 present the cross-correlation results by pairing data at identical days of measurement (lag 0) for the second part of the observation period, after farrowing. Considering the entire observation period, a significant difference from the rectal temperature trend was observed only in sows no. 2 with a cross-correlation coefficient of
. In sows no. 2, 3, 8, and 10, a significant difference from the rectal temperature trend was observed post-farrowing. This was indicated by the cross-correlation coefficients and the corresponding
p-values, which were greater than
. Sows no. 2 and 3 were the only subjects to exhibit negative cross-correlation values during the post-farrowing period, with cross-correlation coefficients of
and
, respectively. This indicates an anti-correlation, a relationship in which one temperature increases as the other decreases, and vice versa. The sows in question exhibited no particularities, with the exception of sow no. 10, which was a gilt. The rectal temperature time series of sow no. 13 before farrowing, which died the day after farrowing due to bladder failure, also exhibited a significant difference from the rectal temperature trend (
with
).
On the first day after farrowing, the highest median IRT temperatures of the udder skin were observed in sows no. 10 and 21, with values of
and
, respectively. On the second day after farrowing, the highest median IRT temperatures were observed in sows no. 2, 10, and 21, all with a value of
, while the median temperature of sow no. 12 was
. We also observed the ranges between the maximum and minimum IRT temperature measurements of the udder skins of the sows around the teats, according to the day of farrowing. On the first day after farrowing, the greatest range was observed in sows no. 7 and 8, with values of
and
, respectively. On the second day after farrowing, the greatest range was observed in sow no. 16 with a value of
. In sows no. 7 and 8, the notable increase in the range between the maximum and minimum IRT temperatures of the udder skin observed in the initial period decreased in the subsequent days, potentially as a result of NSAID treatment. Conversely, in sow no. 16, the range increased on the 7th day after farrowing to
. The maximal daily udder-skin temperature ranges of the sows in the early post-farrowing period (from the day before farrowing until the third day after farrowing) with a median of
are presented in the third column of
Table 3.
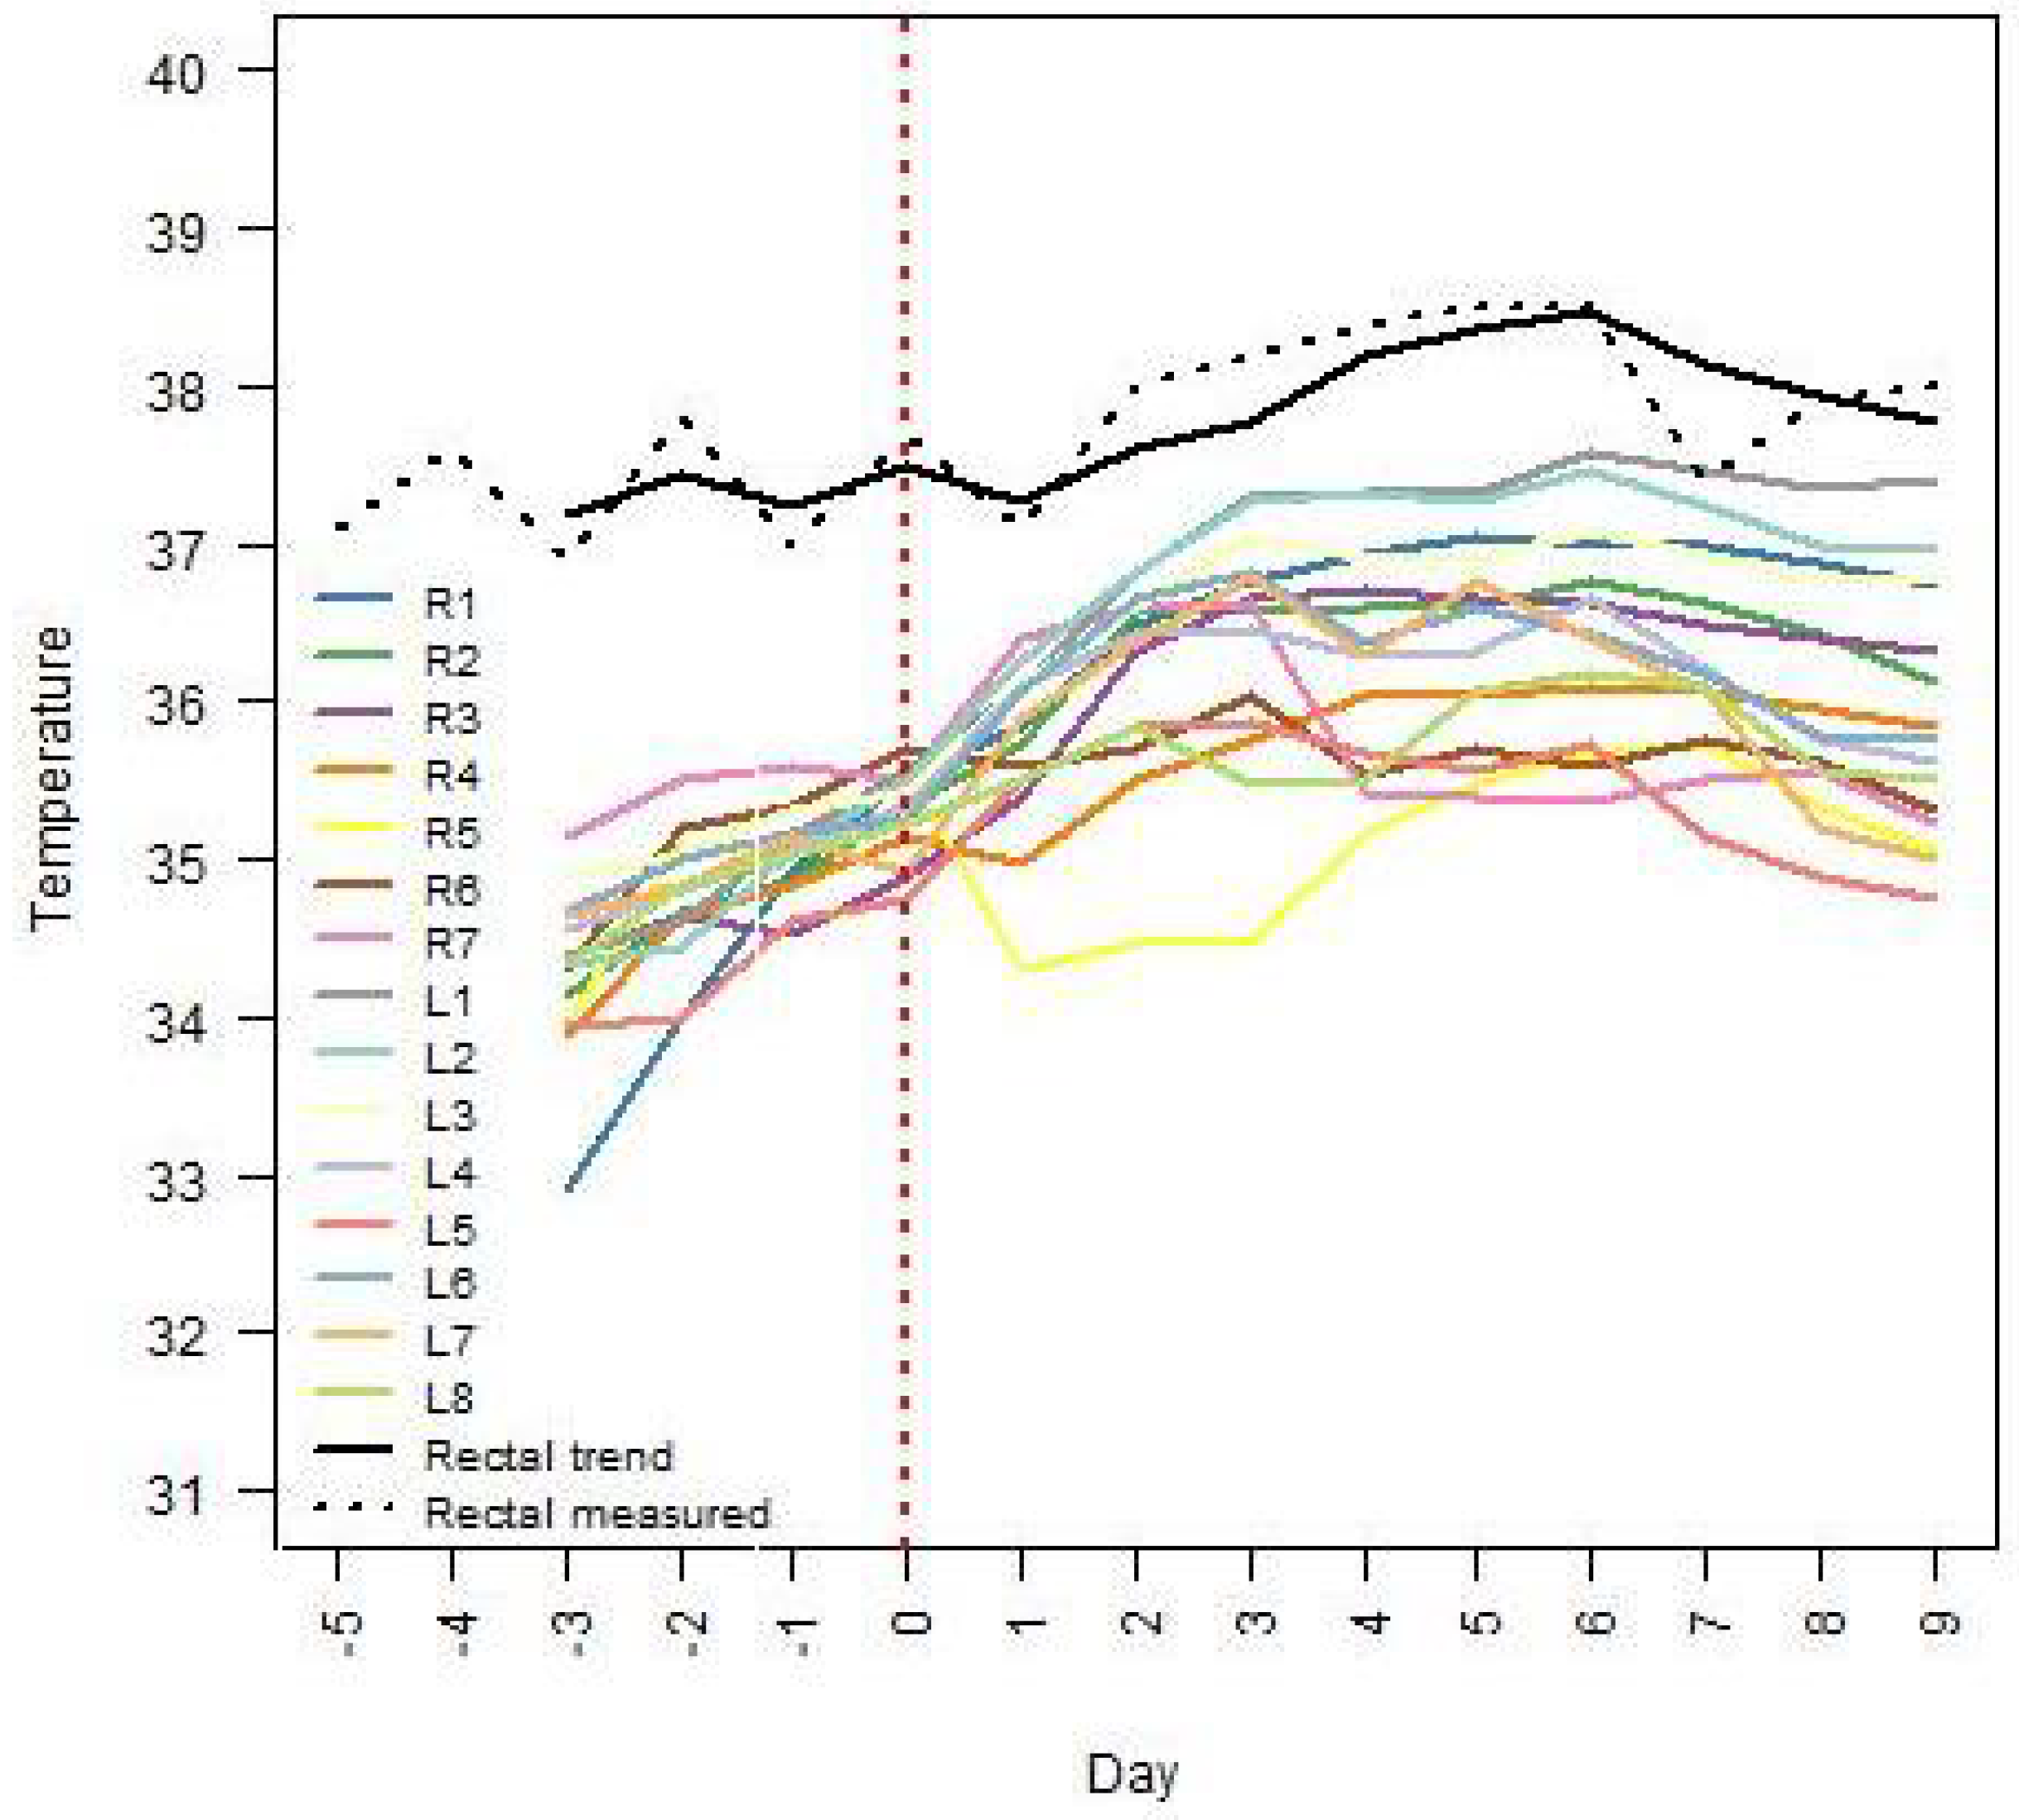
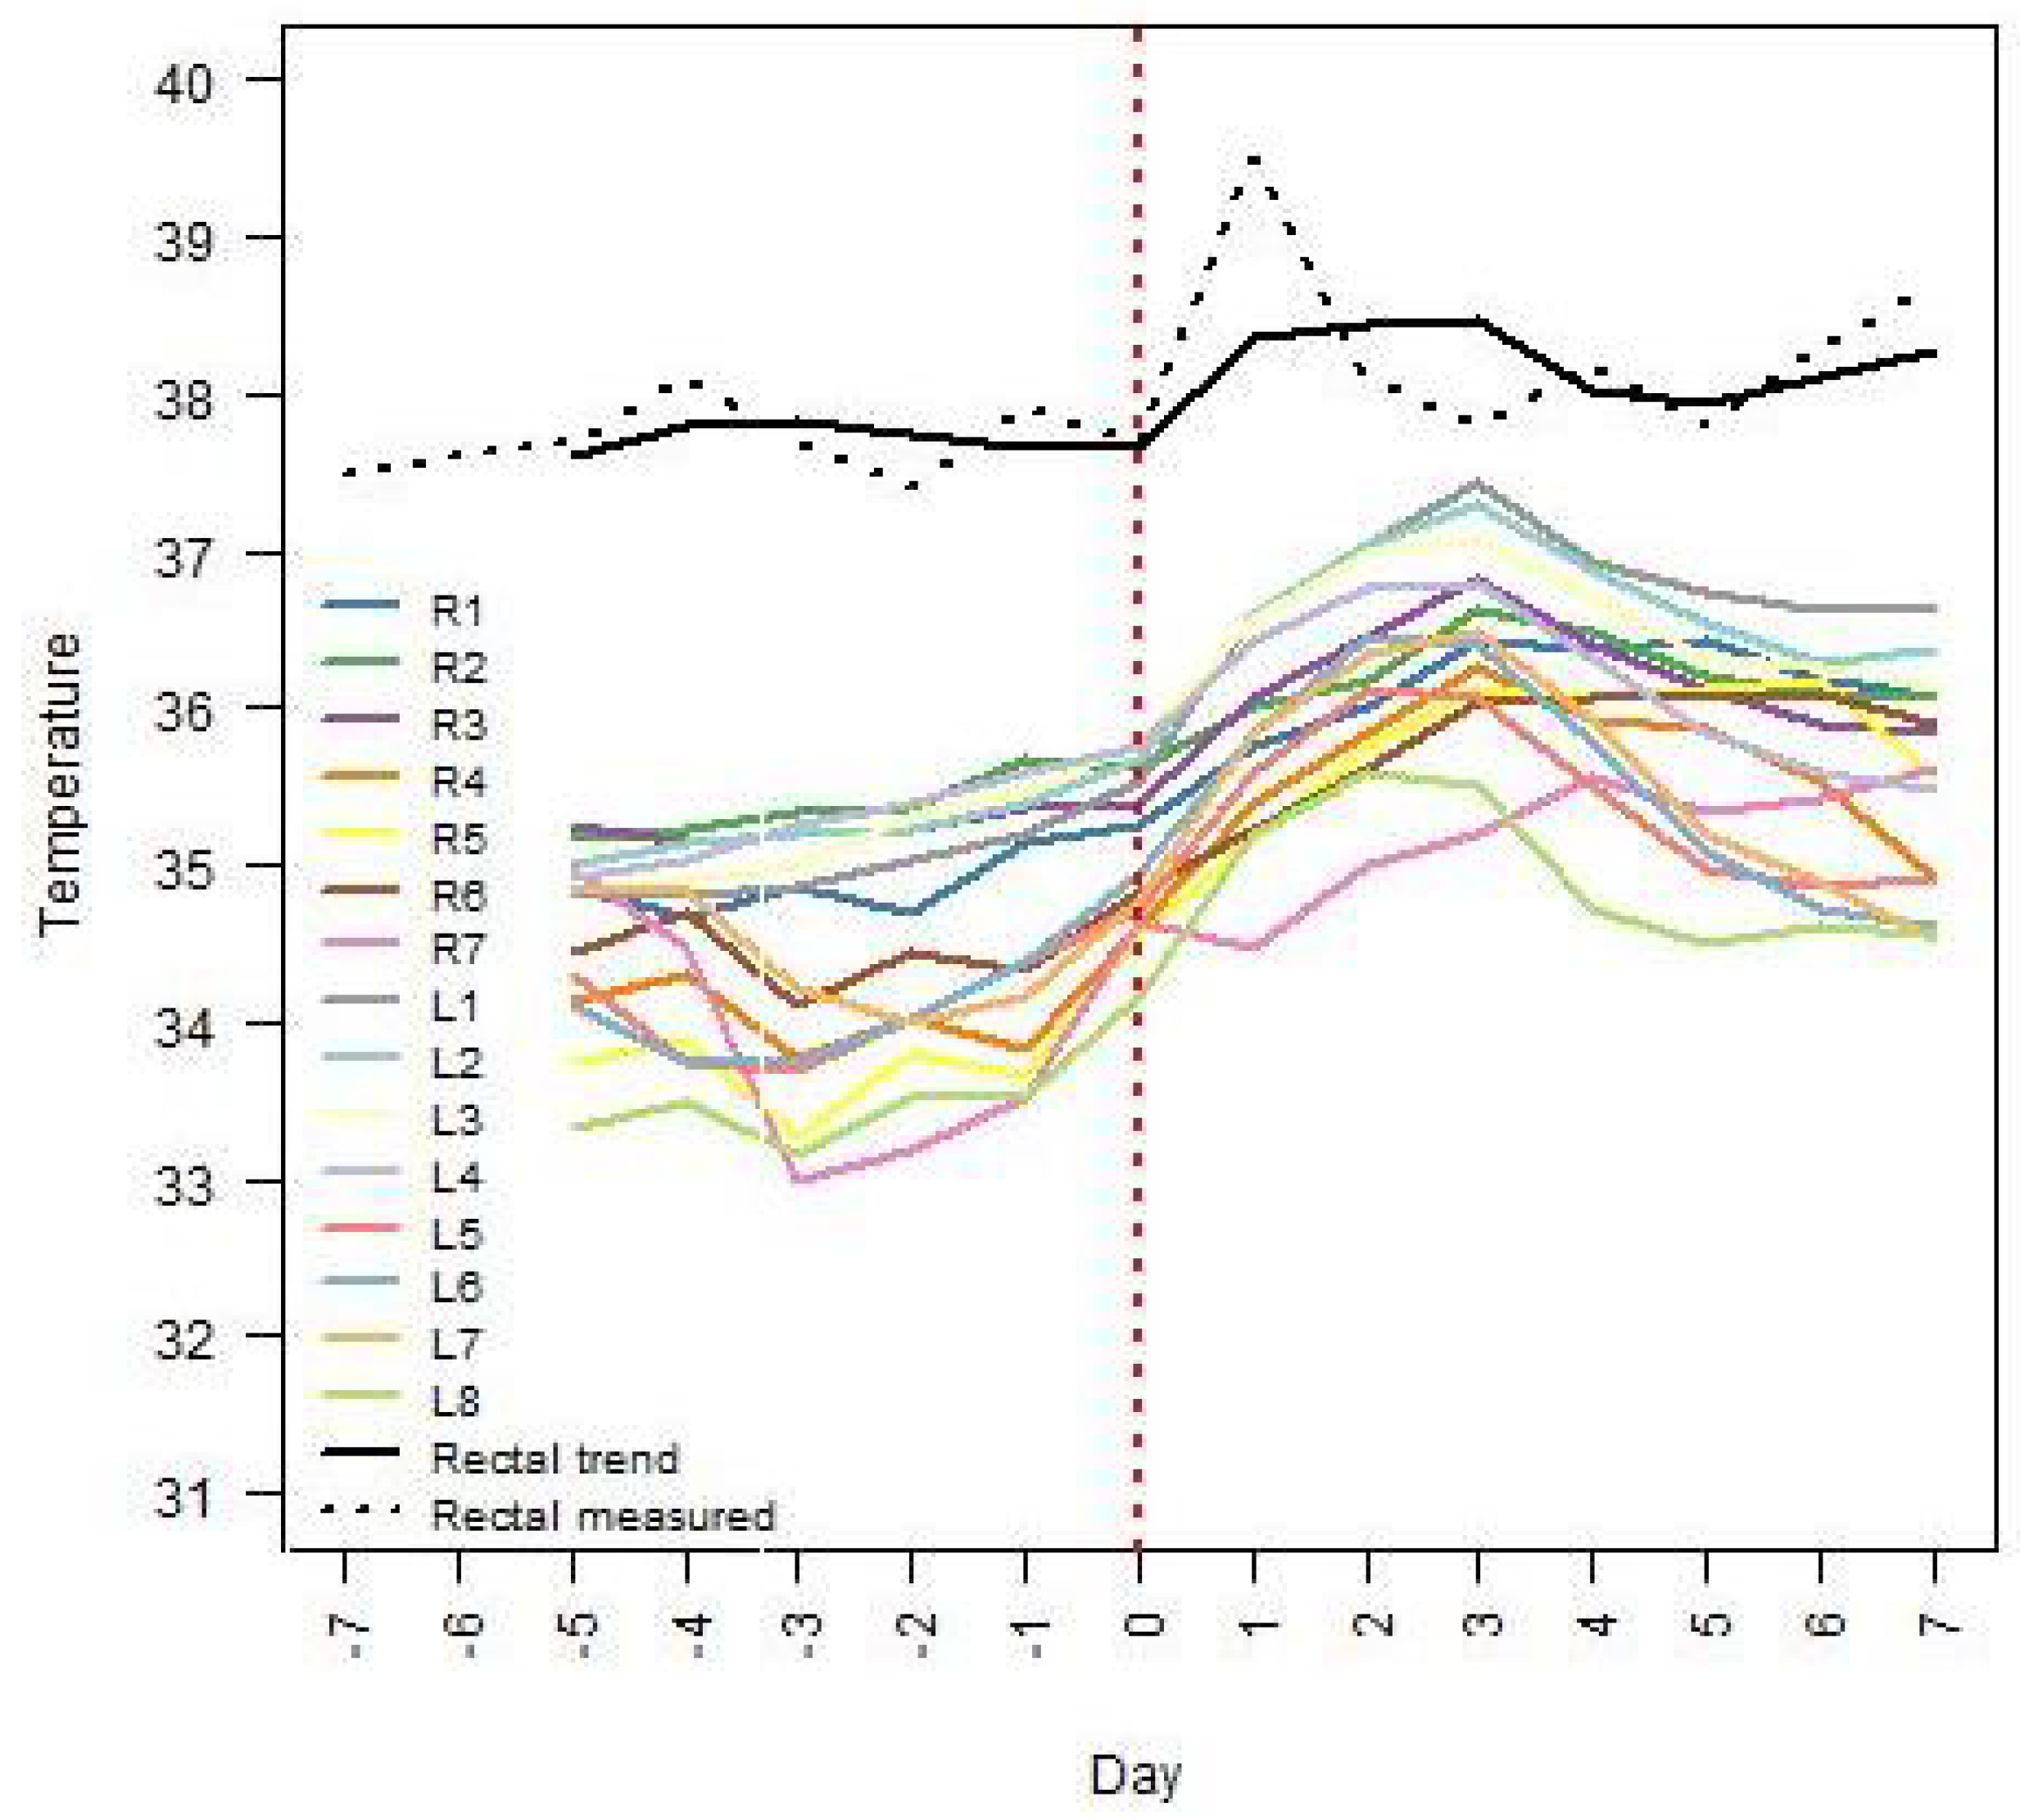
We smoothed out the impact of measurement uncertainty by estimating trends in the IRT time series. Non-stationarity of the time series of the IRT temperature measurements was confirmed for at least one teat for each sow by the standard Dickey–Fuller test, and, for almost all sows, also by the Box–Pierce test, with a
P-value greater than
. To illustrate, the trend components of the IRT temperature time series of the udder skin around the teats, obtained by SMA smoothing, are depicted in
Figure 3 and
Figure 4 for sows no. 7 and 8, respectively. The mammary glands were identified according to the side of the udder (right side: R, left side: L) and numbered from cranial to inguinal. In both figures, the trend component of the rectal temperatures as well as the actual rectal temperature measurements for the selected sow are also displayed. Sow no. 7 had 15 glands and 11 suckling piglets, while sow no. 8 had 15 glands and 16 suckling piglets. In both sows, the highest IRT temperatures after farrowing were measured around the cranial teats (i.e., L1, R1, L2, R2, L3, and R3).
An ongoing local inflammation or a local inflammation that was reduced or relieved by the use of NSAIDs may be suspected if the temperature of the udder skin around some teats differs significantly from that of the udder skin around other teats.
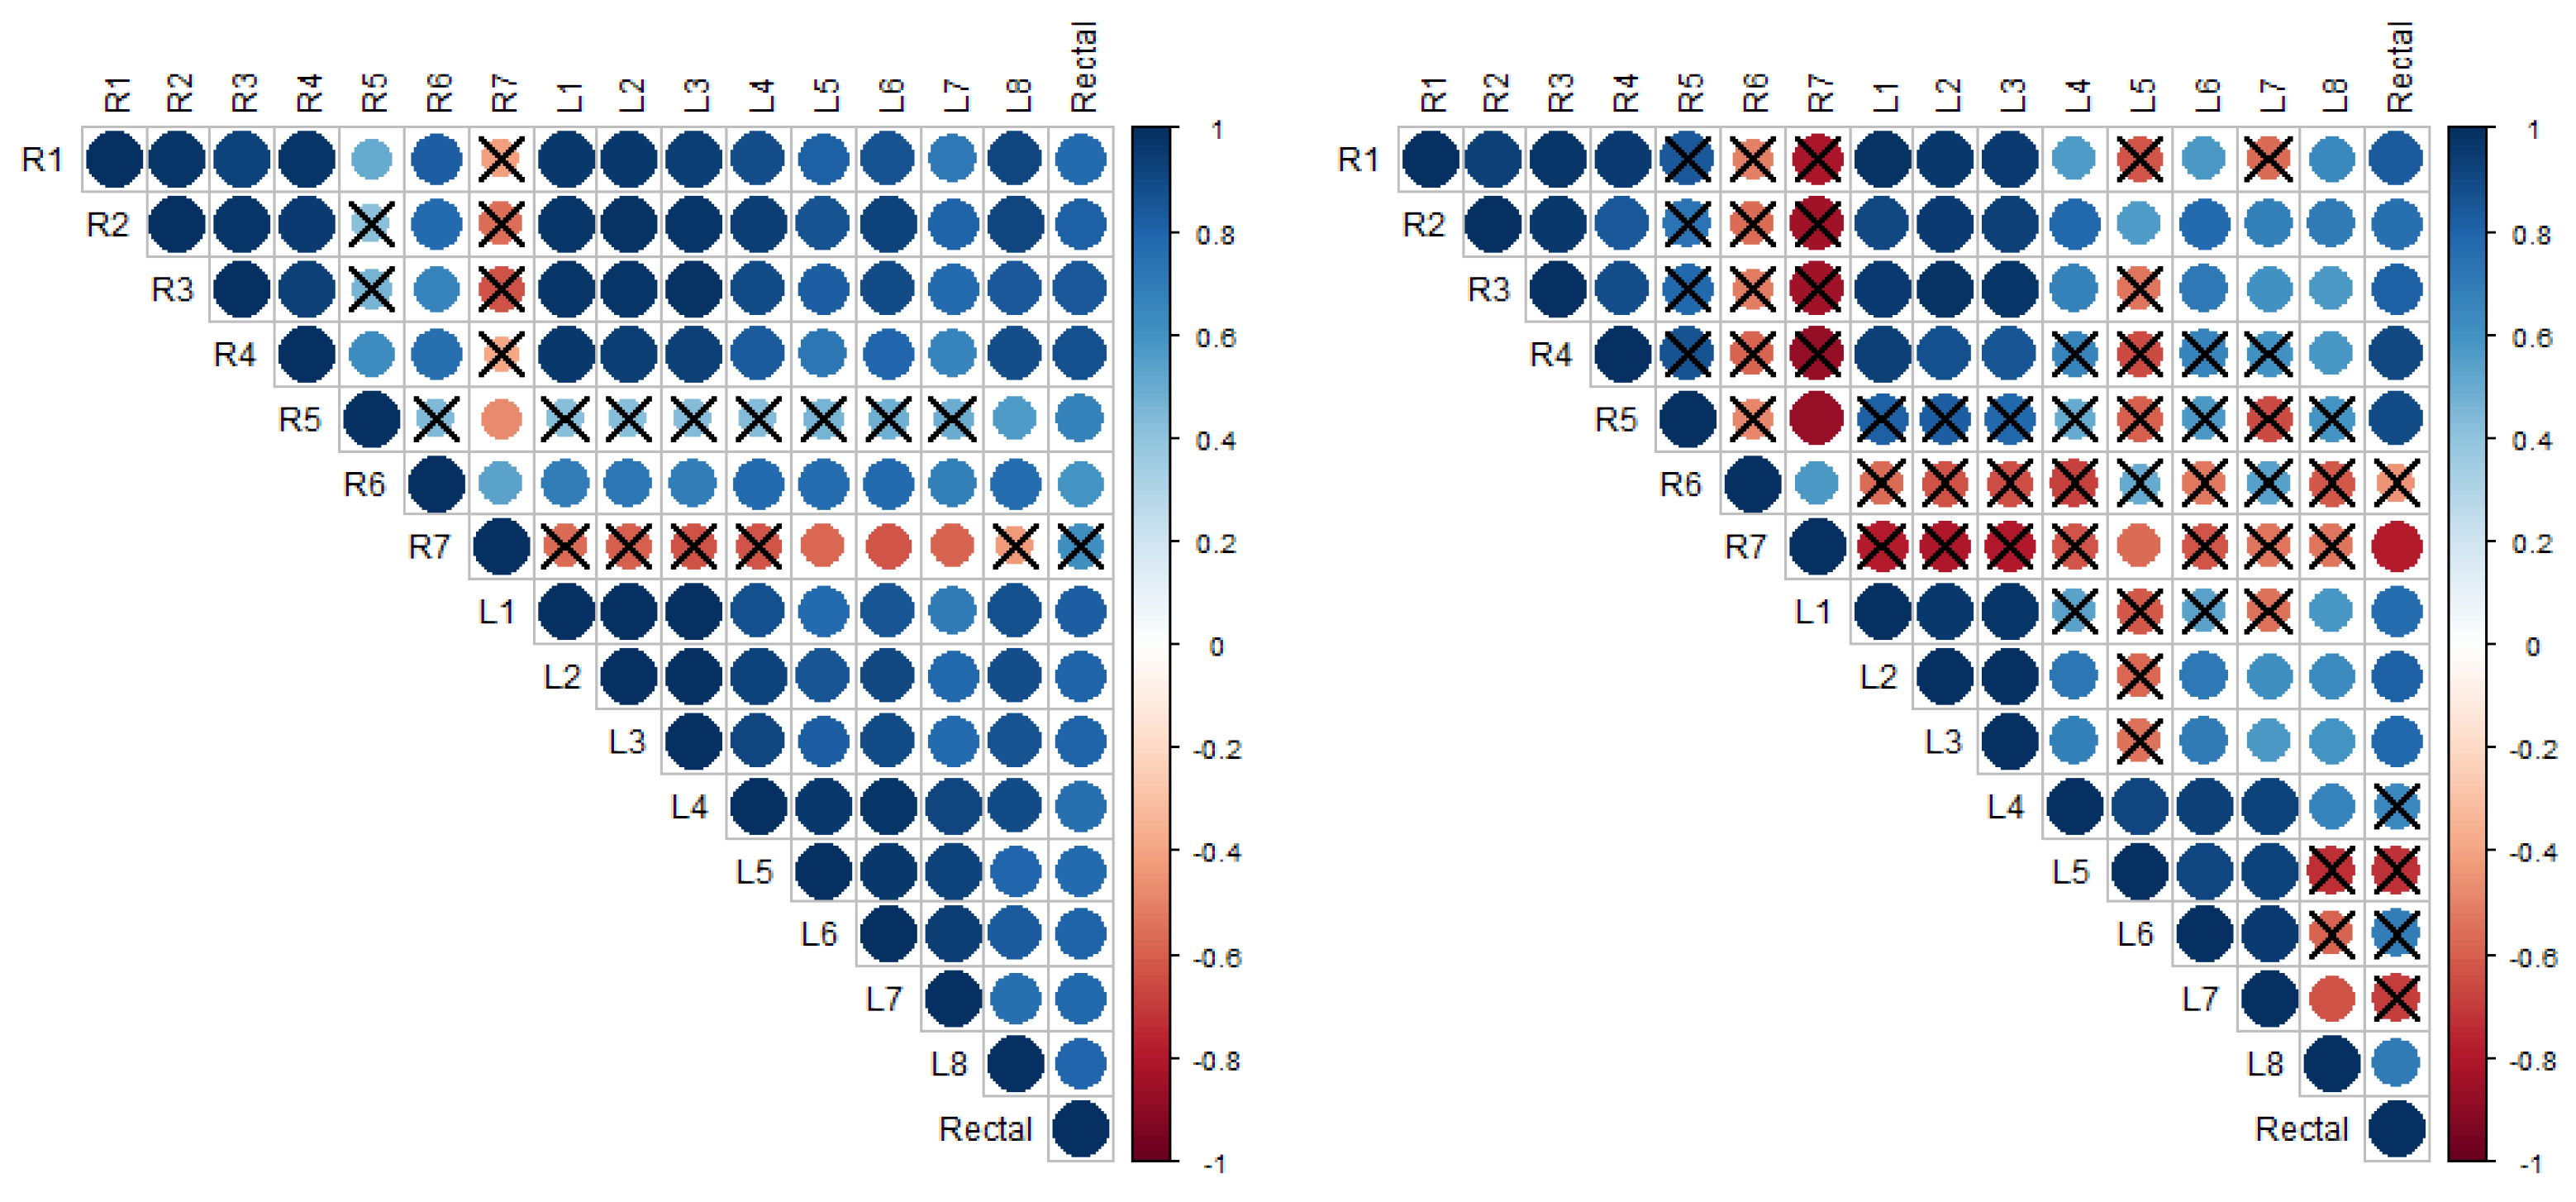
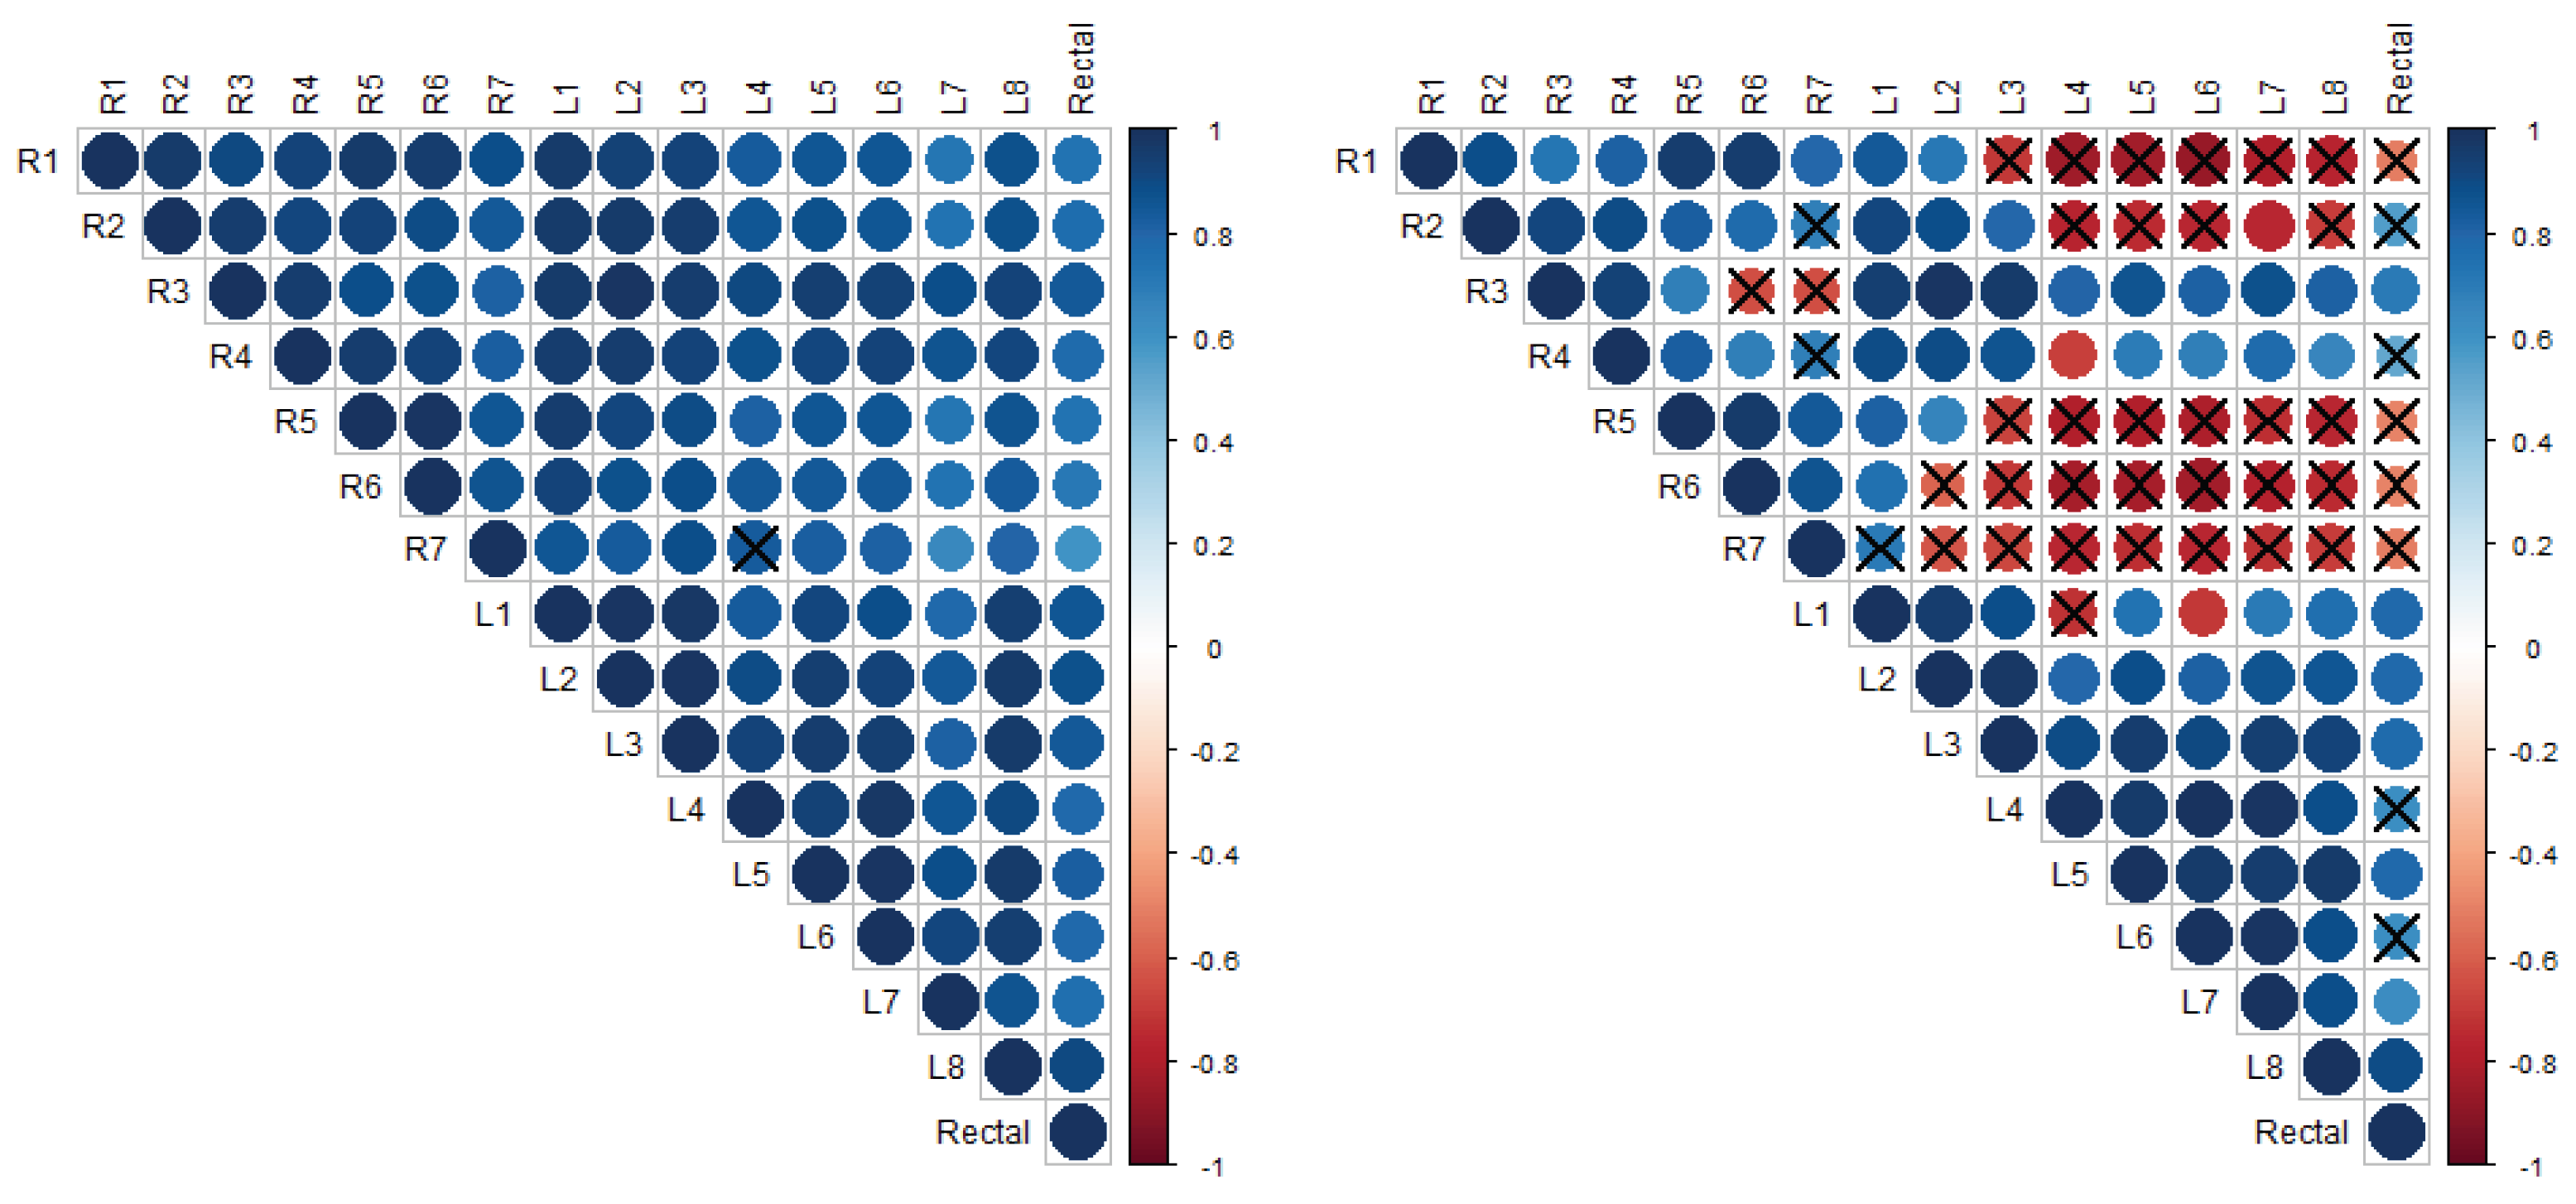
Figure 5 and
Figure 6 present the cross-correlation matrices for trends in mammary skin temperatures and rectal temperatures of sows no. 7 and 8, respectively, for the entire observation period (left matrix) and post-farrowing (right matrix). The data were paired at identical days of measurement (lag 0). In the cross-correlation matrices, the colour blue indicates a positive correlation, while the colour red indicates an anti-correlation. The areas of the coloured circles show the absolute value of the corresponding cross-correlation coefficients. The crosses mark the non-significant coefficients.
Figure 5 shows that the trend of mammary skin temperature around the inguinal teat R7 of sow no. 7, which was among the highest in the first days after farrowing, is statistically different from the trend of rectal temperature and from the trends of mammary skin temperatures around some other teats of that sow throughout the entire observation period, as well as exclusively post-farrowing. One noteworthy exception is the mammary skin temperature around teat R5, which was the lowest in the first days after farrowing and significantly negatively correlated with that of teat R7. The post-farrowing period (right matrix in
Figure 5) is observed to exhibit more differences between the teats when compared to the entire observation period (left matrix in
Figure 5).
Figure 6 illustrates that the temperature of the mammary skin around the teats of sow no. 8 exhibited a significant difference only post-farrowing and not when considering the entire observation period. It is also worth noting that the temperature trends observed on the right side of the udder differed from those observed on the left side. This is illustrated in
Figure 6, where the majority of circles visualising the values of the cross-correlation coefficients between the udder-skin temperature trends around pairs of teats from different sides of the udder (right and left) appear crossed (and in red), indicating that the correlation is not significant. On the other hand, the majority of circles visualising the values of the cross-correlation coefficients between the post-farrowing udder-skin temperature trends around pairs of teats from the same side of the udder appear non-crossed and in blue, indicating a statistically significant positive correlation. Moreover, the value ranges of all the cross-correlation coefficients (91 to 120 per sow) for the post-farrowing udder-skin temperature trends are provided. The minimum and maximum absolute values (together with the corresponding
p-values) for each sow are given in columns 6 and 7 of
Table 3.
It should be noted that only in sows no. 2 and 3, for no pair of teats, a significant correlation in terms of post-farrowing udder-skin temperature trends was observed.
4. Discussion
A general consensus has emerged from several studies conducted over the years that a rectal temperature exceeding approximately
is indicative of MMA in sows. However, a study from 2013 by Sipos et al. [
28] demonstrated that the rectal temperature in pigs is significantly influenced by age and reproductive phase. For example, Sipos et al. (2013) observed that the mean rectal temperature of sows was
on day 113 of gestation, increased to
around farrowing, and reached
during the second week of lactation. Subsequently, it decreased to
on day 1 after weaning [
28]. A recent field study [
10] conducted by the Danish Agriculture & Food Council has also revealed that the rectal temperature of farrowed sows ranges between
and
, indicating a considerable degree of variation. It is therefore evident that a single rectal temperature measurement of the sow cannot be used as the sole indicator for the diagnosis of mastitis. In order to gain a comprehensive understanding of the condition, it is essential to consider a range of additional factors, including anorexia, loss of body control, inflammation of the udder, poor release of milk, reluctance to move, inflammation of the reproductive tract, and susceptibility to opportunistic diseases. Furthermore, the condition of the piglets, including factors such as poor weight gain, weakness, unclean fur, increased crying or other behavioural changes, dehydration, diarrhoea, susceptibility to diseases, and increased mortality, must be monitored as a crucial aspect of the overall assessment.
This study aimed to assess the ability of IRT measurements to detect and predict the development of mastitis in sows, and to determine whether statistical methods that account for the time-dependent nature of the data can enhance the efficacy of IRT measurements in this context. In order to account for the high variance in normal rectal (as well as udder-skin) temperature measurements associated with farrowing and lactation, and to minimise the impact of measurement uncertainty, we proposed the use of time-dependent ranges and trends of temperature measurements. The initial focus was on rectal temperature measurements, given the established superiority of this method over IRT technology (rectal temperature can be measured at least five times more accurately than the udder-skin temperature). In the absence of a gold-standard diagnostic method, we identified suspected cases of multiglandular mastitis using conventional criteria, primarily significant fluctuations in the sow’s body temperature over time. Our initial assessment of the development of mastitis in breeding sows was based on two criteria: (1) a high range of rectal temperature values in the early post-farrowing period (i.e., above the median of ), indicating a sudden increase in rectal temperature due to possible infection, and (2) no correlation between the trend component of the time series of rectal temperatures and the trend component of the time series of daily median rectal temperatures of all observed sows in the entire post-farrowing period (i.e., with P-values of the cross-correlation analysis greater than ), indicating an unusual pattern/flow of rectal temperature values. The two criteria were met by sows no. 2, 8, and 10, all of which received NSAIDs on the first and third day after farrowing, and they showed no unusual features, except that sow no. 10 was a gilt.
Although a recent field study [
10] decisively concluded that the measurement of surface temperature exhibits significant variability and is therefore unsuitable as an alternative to rectal temperature measurement, other studies have yielded inconclusive results [
12,
20]. The objective was to validate the preceding conclusion through the utilisation of more sophisticated and time-dependent statistical methodologies. In other words, the aim was to ascertain whether IRT data alone can be employed to identify the same sows as suspects for multiglandular mastitis, as previously identified through rectal temperature measurement, without the need for additional data. Firstly, considering the median of
of the maximal daily udder-skin temperature ranges of the sows in the early post-farrowing period (column 3 of
Table 3), we found that this value was exceeded by sows no. 8 and 10, with ranges of
and
, respectively, while sow no. 2 exhibited a slightly lower range of
. Nevertheless, seven additional sows (no. 1, 5, 7, 9, 14, 16, and 20) exhibited the median of
, with sows no. 7 and 16 exhibiting maximal daily udder-skin temperature ranges above
. Secondly, a comparison of the trend of rectal temperature and the trends of all the udder-skin temperatures of the same sow in the post-farrowing period (columns 6 and 7 of
Table 3) led to the following conclusions: sow no. 2 exhibited significant differences for all glands, sow no. 8 exhibited significant differences mainly for the glands of the right side of the udder, and sow no. 10 exhibited no significant differences for any glands. Interestingly, only sows no. 2 and 3 did not show any significant correlation between the trend of rectal temperature and the trends of the udder-skin temperatures. Thirdly, a comparison of the trends of the udder-skin temperatures around pairs of teats in the post-farrowing period revealed the following: sow no. 8 exhibited significant differences between the skin temperatures on the right and left sides of the udder, while sows no. 2 and 10 exhibited significantly different trends of skin temperature around one of the inguinal teats (i.e., R7 and R6, respectively) in comparison to the trends of skin temperatures around some other teats of the udder. The latter observation was not uncommon, as it was observed in several sows. The SMA temperature trends were obtained by smoothing with a four-day averaging period, as the four-day choice smoothed the daily zigzag of the initial curves. Fourthly, the median IRT temperatures of the udder skin in the first days after farrowing revealed that sows no. 10 and 8 exhibited the highest values of
and the third-highest value of
on the first day after farrowing, respectively, sows no. 2 and 10 exhibited the highest value of
on the second day after farrowing, and sow no. 2 exhibited the second-highest value of
on the third day after farrowing. Additionally, five other sows (no. 11, 12, 14, 18 and 21) exhibited a value above
in at least one of the first three days after farrowing.
The first and fourth criteria based on IRT measurements of the udder skin lead to similar conclusions as the two criteria for initial assessment of the development of multiglandular mastitis in breeding sows, which are based on rectal temperature. These criteria are (i) a high maximal daily udder-skin temperature range in the early post-farrowing period (i.e., above the median of
), and (ii) a high maximal daily median value of udder-skin temperatures in the early post-farrowing period (e.g., above
). The temperature trends of the udder skin around individual teats did not demonstrate a relationship to our initial assessment criteria for the development of multiglandular mastitis in breeding sows. Nevertheless, the temperature trends of the udder skin may prove to be a highly significant indicator in the detection of uniglandular mastitis when there is no unusual rise of rectal temperature. Unfortunately, due to the prophylactic treatment of sows with NSAIDs, which could reduce or relieve ongoing local inflammation, and the absence of veterinary examination, which meant that no diagnosis of mastitis was made, we were unable to assess whether IRT images of the mammary glands of breeding sows alone could be used to predict the development of uniglandular mastitis or to detect it as early as possible. To achieve this, one would need to “sacrifice” a group of breeding sows and their piglets by withholding prophylactic NSAID treatment. Without this preventive treatment, the sows would lack the necessary support for enhancing their welfare and improving lactation. As a result, the piglets would not receive the benefits of better maternal care, potentially leading to poorer health outcomes for the piglets [
29]. Furthermore, alternative approaches to identifying trend components in temperature time series, such as the weighted moving average method (WMA), polynomial regression, and differencing [
27], could be considered and their respective effects evaluated.
Another objective of this article is to caution users of thermal imagers about their limited accuracy in absolute temperature measurement for both humans and animals. Despite manufacturer claims and overstated technical specifications, thermal imagers lack the precision required for reliable absolute temperature readings. Reference radiation thermometers, which utilize significantly more advanced sensing technology than thermal imagers, achieve an accuracy of
to
in this temperature range under special conditions at NIST, USA. Other national metrology institutes report Calibration Measurement Capabilities (CMCs) of approximately
, including our own laboratory [
13]. Whether measuring absolute or relative temperatures, thermal imagers remain less accurate than radiation thermometers and significantly less accurate than contact thermometers. Consequently, if a detected temperature variation stems from instrument limitations rather than a true physiological change, it may result in misinterpretation rather than reliable early detection.
5. Conclusions
This study primarily focused on within-animal comparisons, analysing repeated rectal and IRT temperature measurements for individual sows, making it more qualitative in nature. Expanding the sample size would strengthen the findings and enhance the study’s overall impact. The main limitations include: (1) the ongoing prophylactic NSAID treatment of breeding sows, (2) the absence of veterinary monitoring, and (3) the high variability in udder-skin temperature readings, largely due to the limited resolution of the IRT camera and measurement conditions.
To address these challenges, this study applies statistical methods to analyse time series of IRT data, aiming to extract meaningful time-dependent characteristics of clinical mastitis in sows that time-independent methods cannot capture. Findings indicate that a large difference between the maximum and minimum daily udder-skin IRT temperature values, along with a high maximal median of daily udder-skin IRT temperatures in the early post-farrowing period (from the day before farrowing to the third day after), is associated with a higher incidence of multiglandular mastitis. This suggests that non-invasive udder-skin IRT temperature measurements could aid in detecting or predicting multiglandular mastitis, providing a less stressful alternative to rectal temperature monitoring. However, no conclusive evidence was found regarding the use of IRT alone to detect uniglandular mastitis, likely due to study limitations such as NSAID prophylaxis and the absence of veterinary examinations. Future research should investigate whether variations in udder-skin temperature trends among glands, as well as deviations from rectal temperature trends, could serve as indicators of uniglandular mastitis. Such studies should incorporate frequent IRT measurements without NSAID prophylaxis and include veterinary assessments—such as evaluating the presence and levels of microbiological infectious agents—to enhance diagnostic accuracy, ultimately reducing unnecessary medication use and its potential negative effects on animal health and farm management.
Building on this, we believe that IRT may also have the potential to detect or predict a significant proportion of subclinical mastitis cases. However, conclusive evidence requires further studies conducted without NSAID prophylaxis and with comprehensive veterinary diagnostics. Given that not all subclinical mastitis cases exhibit significant temperature changes, relying solely on IRT may be insufficient. Therefore, integrating temperature monitoring with other diagnostic methods, such as assessing microbiological infectious agents or measuring somatic cell count in milk, is crucial for accurate identification and effective herd health management.


