Article

Swift Transfer of Lactating Piglet Detection Model Using Semi-Automatic Annotation Under an Unfamiliar Pig Farming Environment

1
College of Intelligent Manufacturing, Anhui Science and Technology University, Chuzhou 233100, China
2
College of Engineering, Nanjing Agricultural University, Nanjing 210031, China
3
Key Laboratory of Smart Farming Technology for Agricultural Animals, Ministry of Agriculture and Rural Affairs, Wuhan 430070, China
4
College of Veterinary Medicine, Nanjing Agricultural University, Nanjing 210014, China
5
College of Artificial Intelligence, Nanjing Agricultural University, Nanjing 210031, China
*
Author to whom correspondence should be addressed.
Agriculture 2025, 15(7), 696; https://doi.org/10.3390/agriculture15070696
Submission received: 27 February 2025 / Revised: 21 March 2025 / Accepted: 22 March 2025 / Published: 25 March 2025

Abstract

Manual annotation of piglet imagery across varied farming environments is labor-intensive. To address this, we propose a semi-automatic approach within an active learning framework that integrates a pre-annotation model for piglet detection. We further examine how data sample composition influences pre-annotation efficiency to enhance the deployment of lactating piglet detection models. Our study utilizes original samples from pig farms in Jingjiang, Suqian, and Sheyang, along with new data from the Yinguang pig farm in Danyang. Using the YOLOv5 framework, we constructed both single and mixed training sets of piglet images, evaluated their performance, and selected the optimal pre-annotation model. This model generated bounding box coordinates on processed new samples, which were subsequently manually refined to train the final model. Results indicate that expanding the dataset and diversifying pigpen scenes significantly improve pre-annotation performance. The best model achieved a test precision of 0.921 on new samples, and after manual calibration, the final model exhibited a training precision of 0.968, a recall of 0.952, and an average precision of 0.979 at the IoU threshold of 0.5. The model demonstrated robust detection under various lighting conditions, with bounding boxes closely conforming to piglet contours, thereby substantially reducing manual labor. This approach is cost-effective for piglet segmentation tasks and offers strong support for advancing smart agricultural technologies.

1. Introduction

The integration of intelligent technologies into swine farming has emerged as a crucial strategy for reducing breeding costs and promoting industry growth. Recent advances in machine vision and artificial intelligence, particularly through deep learning, have become indispensable for tasks such as monitoring pig behavior [1,2,3] and detecting health conditions [4,5,6].
The lactation phase is pivotal in pig development, where the growth performance of nursing piglets significantly influences their subsequent conservation and fattening phases [7,8]. Effective management during this period, which leads to higher survival rates and weaning weights, has been underscored by Blavi et al. [9]
Recent research has increasingly focused on intelligent farming technologies for piglets. For instance, some studies have utilized the DeepLabCut algorithm for piglet pose estimation, enhanced by Kernel Principal Component Analysis (KPCA) to develop a model that captures high-dimensional spatiotemporal features for non-linear trajectory optimization and accurate piglet tracking [10]. Others have employed ResNet as the base network and Faster R-CNN with Extended Network and Affinity Estimation Network as the detection head, creating a piglet multi-object tracking model that achieves a Multiple Object Tracking Accuracy (MOTA) of 97.04% [11].
Addressing the challenges of long-term object tracking, researchers like Ding et al. [12] have applied frame-difference methods to detect changes in the sow’s bed area, developing an FD-CNN network that closely matches manual observations with over 80% similarity. In addition, piglet object detection has been extended to monitor social behaviors such as interactions and play, which, when combined with optical flow methods, effectively detect suckling behaviors [13]. Moreover, three-dimensional convolutional networks are being used to recognize livestock behavior, showcasing further advancements in the field [14].
Despite continuous technological innovations, state-of-the-art object detection methodologies remain heavily reliant on labor-intensive manual annotation processes for training datasets, resulting in substantial operational expenditures. This persistent challenge has driven extensive research into semi-automatic and automated annotation paradigms within computer vision [15,16]. However, while universal annotation frameworks have been rigorously explored across disciplines and personalized systems have demonstrated success in computational linguistics [17,18], their counterparts in precision livestock farming exhibit a notable developmental lag.
Recent studies further emphasize a critical gap in domain-specific automated annotation systems designed for suckling pig detection [19]. Specifically, visual detection research in intelligent agriculture predominantly relies on single-farm datasets, with limited validation of cross-environment generalization capabilities [20,21,22]. Such data homogeneity poses significant deployment challenges, as practitioners struggle to assess model performance in heterogeneous operational contexts (e.g., variable facility architectures or porcine phenotypic variations). These limitations collectively highlight the urgent need for adaptive detection systems capable of rapid environmental adaptation, thereby advancing the scalable deployment of intelligent agricultural technologies [23,24].
When deploying piglet detection models in new farming environments, their performance can diminish, although they may still accurately identify some piglets. The composition of the dataset is critical in determining the effectiveness of object detection networks [25]. By modifying the dataset structure and enhancing the network’s ability to learn piglet features, we can improve model generalizability. Despite its importance, there is limited research on how dataset composition affects the outcomes of piglet object detection in novel environments. To tackle this, our study employs both single and mixed datasets derived from original data collected from three pig farms in Jingjiang, Suqian, and Sheyang, incorporating fresh samples from the Danyang-Yinguang pig farm. Employing the YOLOv5 algorithm, we develop piglet detection models from these diverse datasets and identify the most effective pre-annotation model for piglets. Inspired by the active learning framework [26], we propose a semi-automatic annotation method aimed at piglets, which significantly reduces the labor costs associated with dataset development and enables quick adaptation of the model to the Danyang-Yinguang pig farm. This approach not only enhances efficiency but also broadens the applicability of deep learning models in precision agriculture. This study comprises the following key components:
(1)
The development of a novel semi-automatic labeling methodology tailored for piglet identification.
(2)
The construction of comprehensive piglet target datasets from multiple commercial pig farms.
(3)
A systematic evaluation of the impact of diverse data compositions in piglet imagery on the performance metrics of object detection models.
(4)
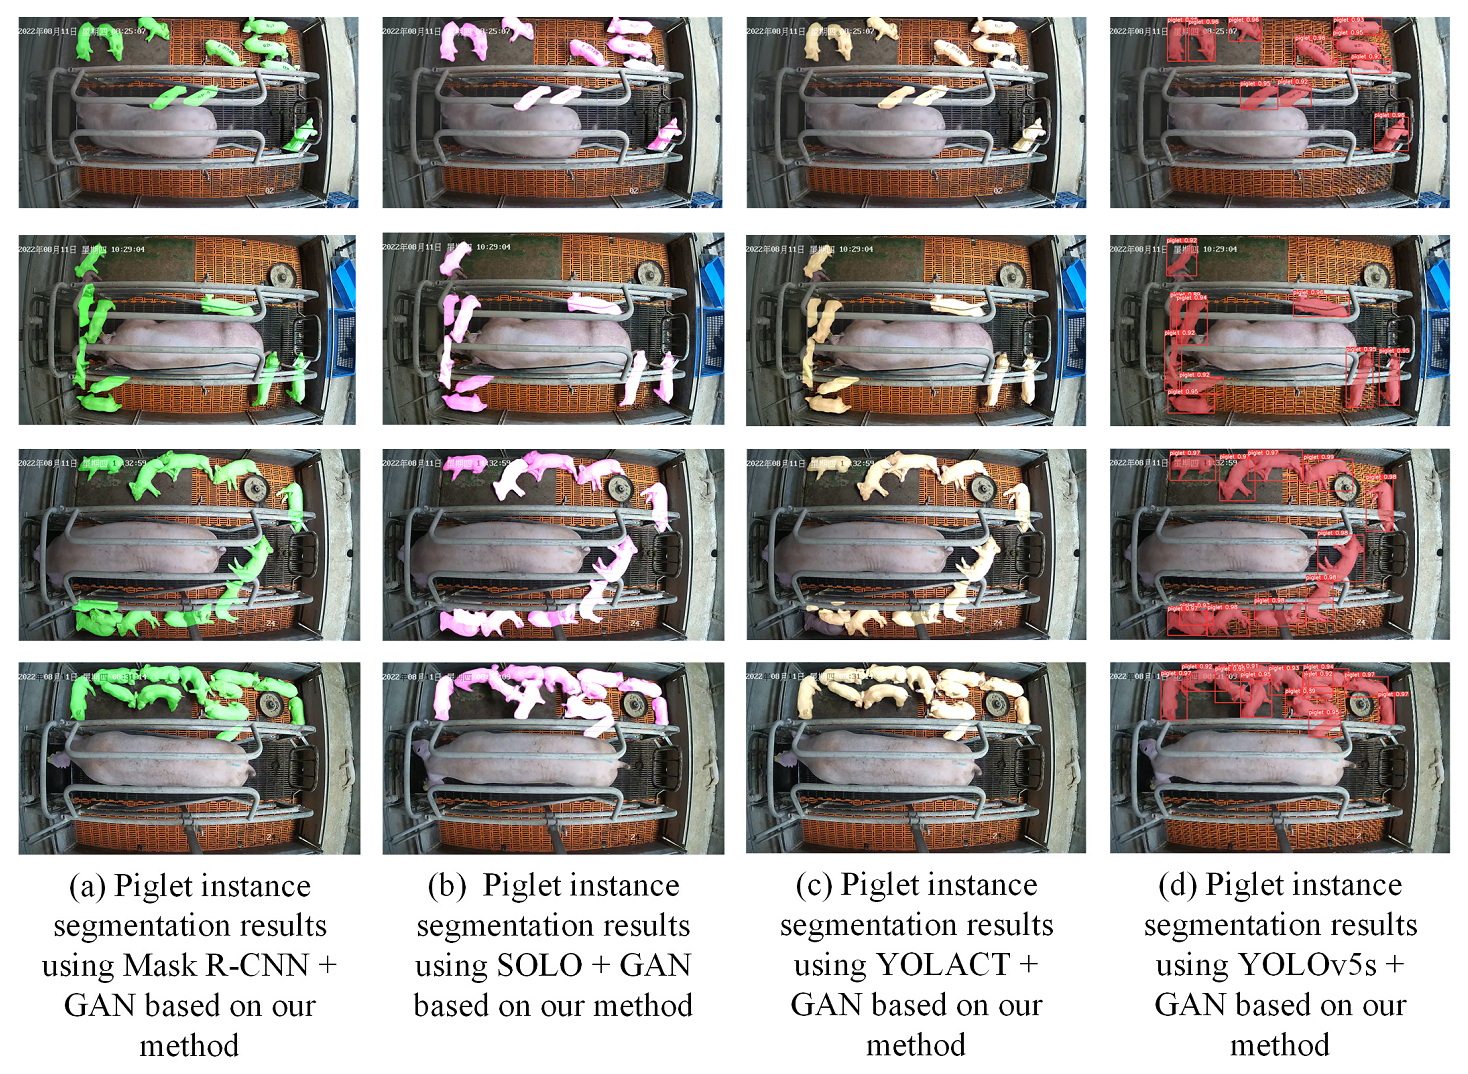
The demonstration of the extensibility of this semi-automatic annotation approach to piglet segmentation tasks, highlighting its potential for broader applications in animal behavior analysis.
By carefully considering challenges such as high annotation costs, environmental adaptability limitations, and cross-farm generalization gaps, this study aims to contribute to a more thoughtful and scalable integration of deep learning technologies in precision livestock farming.

2. Materials and Methods

2.1. Data Collection

The data for this experiment was collected from four pig farms. The data descriptions are as follows:
(1)
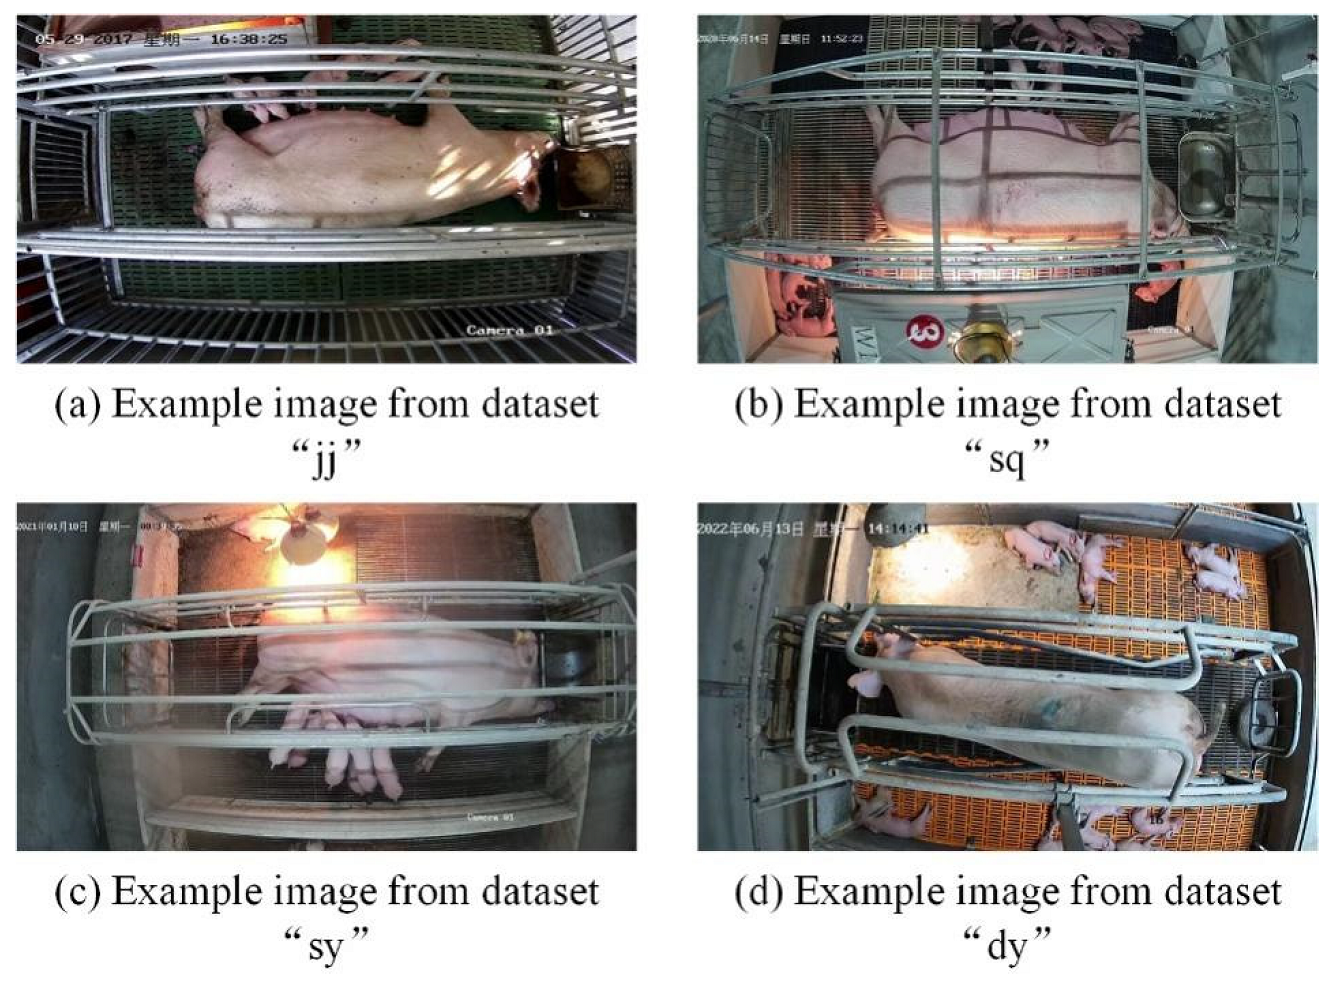
Data from the Jingjiang Pig Farm (abbreviated as “jj”) was acquired at Fengyuan Ecological Agricultural Park Limited Company, located in Jingjiang City, Jiangsu Province. The farm comprises two maternity pig rooms, each equal in size and segmented into six farrowing pens measuring 20 cm × 180 cm each. For surveillance and data collection, a total of 12 Hikvision DS-2CD3135F-l model cameras were installed. These cameras were mounted vertically overhead at a height of 3 m above each farrowing pen, capturing footage over a period from 24 April 2017 to 31 May 2017.
(2)
Data from the Suqian Pig Farm, denoted as “sq” in this study, was collected at the Zhengjie Pig Farm, situated in the Suyu District of Suqian City, Jiangsu Province. Data were collected from a single maternity pig room containing 48 farrowing pens, each measuring 220 cm × 190 cm. Out of these, 12 farrowing pens were equipped with cameras for surveillance. The Hikvision DS-2CD3346WD-I model cameras were mounted vertically overhead at a height of 2.2 m. Video data were recorded over a period from 9 June 2020 to 15 June 2020.
(3)
Data from the Sheyang Pig Farm, referred to as “sy”, was obtained from a single maternity pig room at Kouda Food Co., Ltd., located in Sheyang County, Yancheng City, Jiangsu Province. This room consisted of 40 farrowing pens, each measuring 220 cm × 190 cm. Of these, 10 farrowing pens were outfitted with cameras for data collection purposes, specifically using the Hikvision DS-2CD3346WD-I model. These cameras were mounted vertically overhead at a height of 2.3 m, with video data being recorded from 27 December 2020 to 7 February 2021.
(4)
Data from the Danyang Pig Farm, denoted as “dy”, was gathered from two maternity pig rooms at the Silver Light Pig Farm in Danyang City, Jiangsu Province. Each room contained 24 farrowing pens, measuring 220 cm × 190 cm. Above each of these pens, a camera was installed, amounting to a total of 48 cameras, all of which were the Hikvision DS-2CD3346WD-I model. These cameras were set up vertically overhead at a height of 3 m, capturing video data from 1 June 2022 to 1 July 2022.
Video data were continuously recorded over a 24 h period. The overhead view footage of the pigs was stored on a Hikvision network video recorder (NVR) and later transferred to a PC for detailed analysis. The process for data collection is depicted in Figure 1, and representative images from the data are shown in Figure 2.

2.2. Experimental Environment

The experimental setup for this study was configured using the Ubuntu 18.04 operating system (developed by Canonical Ltd., London, United Kingdom). The training and testing processes were conducted on an NVIDIA RTX 3090 graphics card (manufactured by NVIDIA Corporation, Santa Clara, California, United States). Key software packages employed in the experiment included Python 3.8, PyTorch 1.7, and OpenCV 4.1.

2.3. Dataset Creation

The original training samples, comprising datasets “jj”, “sq”, and “sy”, were utilized for the creation of the training dataset. The “dy” dataset, in contrast, was designated solely for testing purposes. Both the training and test samples were annotated manually.

2.3.1. Manual Data Labeling

The video data of piglets collected from the “jj”, “sq”, and “sy” pig farms underwent a process of framing, during which blurry and significantly interfered images were removed from the dataset. From this refined dataset, a total of 18,000 images (6000 from each of the three pig farms) featuring piglets were randomly chosen as the original training samples. Additionally, 1146 images from the “dy” dataset were selected to serve as the test samples.
The process of dataset annotation was carried out using labeling, an open-source software tool, and the annotations were formatted according to the VOC (Visual Object Classes) standard. Given the challenges posed by significant occlusions and overlapping of piglets in the dataset, specific annotation criteria were established:
(1)
Pigs with more than 50% of their bodies covered and their heads obscured were excluded from the annotation.
(2)
Piglets with more than 80% of their bodies obscured were also not annotated.

2.3.2. Data Set Composition Method

Datasets were constructed using original training samples from each of the three pig farms. For each farm, datasets were created with varying numbers of images: 2000, 3000, 4000, 5000, and 6000. Each of these datasets was further divided into two distinct splits: 90% of the images for training and 10% for validation, and 80% for training with 20% for validation. This process resulted in a total of 30 individual datasets, with each dataset containing data exclusively from one pig farm.
Additionally, different pig farm datasets with the same quantity and ratio were mixed, resulting in 30 datasets combining two pig farms’ data. Beyond these, 10 more datasets were formed by combining images from all three pig farms, bringing the total number of original datasets to 70.
Furthermore, a separate set of 1146 images from the “dy” dataset was manually annotated and designated as the test set for the study.

2.3.3. Data Set Naming Convention

To streamline dataset management and enhance documentation clarity, we established a specific dataset naming convention. The format for naming datasets is “Location and Quantity_Ratio”.
In this format, “Location” denotes the origin of the data, “Quantity” specifies the number of data samples in the dataset, and “Ratio” is a code indicating the split between training and validation sets. The code “91” represents a 9:1 training to validation set ratio, while “82” indicates an 8:2 ratio.
For instance, “sy2000_91” refers to a dataset comprising 2000 samples from the Sheyang pig farm, utilizing a 9:1 training-validation split. Similarly, “sqsyjj9000_91” signifies a combined dataset from Suqian, Shenyang, and Jingjiang pig farms, encompassing a total of 9000 samples with a 9:1 training-validation split.

2.4. Piglet Detection Model Construction

In the evolving landscape of computer vision, object detection technology has been advancing rapidly, fueled by continuous developments in deep learning-based detection models. Object detection methodologies generally fall into three primary categories: two-stage, one-stage, and anchor-free approaches.
Two-stage networks process object detection in two distinct steps: initially, they identify candidate regions for objects, and subsequently, they detect and classify the objects within these regions. Historically, two-stage networks have offered higher detection accuracy, though this came at the cost of slower processing speeds [27]. In contrast, one-stage networks perform object localization and classification simultaneously during feature extraction, providing faster processing times but initially at lower accuracy levels [28,29].
However, recent enhancements in one-stage networks, including the incorporation of mechanisms like focal loss and specialized detection or classification heads, have significantly improved their accuracy, now comparable to or even surpassing that of two-stage networks [7,30]. Anchor-free algorithms, which typically rely on key points [31] or central regions [32,33] for object detection, generally exhibit lower accuracy compared to anchor-based methods.
In the context of smart agriculture, YOLOv5, a renowned one-stage method, offers a balanced compromise between detection speed and accuracy. Its widespread adoption in this field is evidenced by numerous studies [34,35,36]. Meanwhile, YOLOv5s, as a lightweight model, is suitable for real-time detection on embedded devices [37]. Consequently, YOLOv5 was selected as the pre-trained model for the purposes of this research. The relevant parameter configurations for the model can be found in detail at https://github.com/ultralytics/yolov5 (accessed on 26 October 2023).

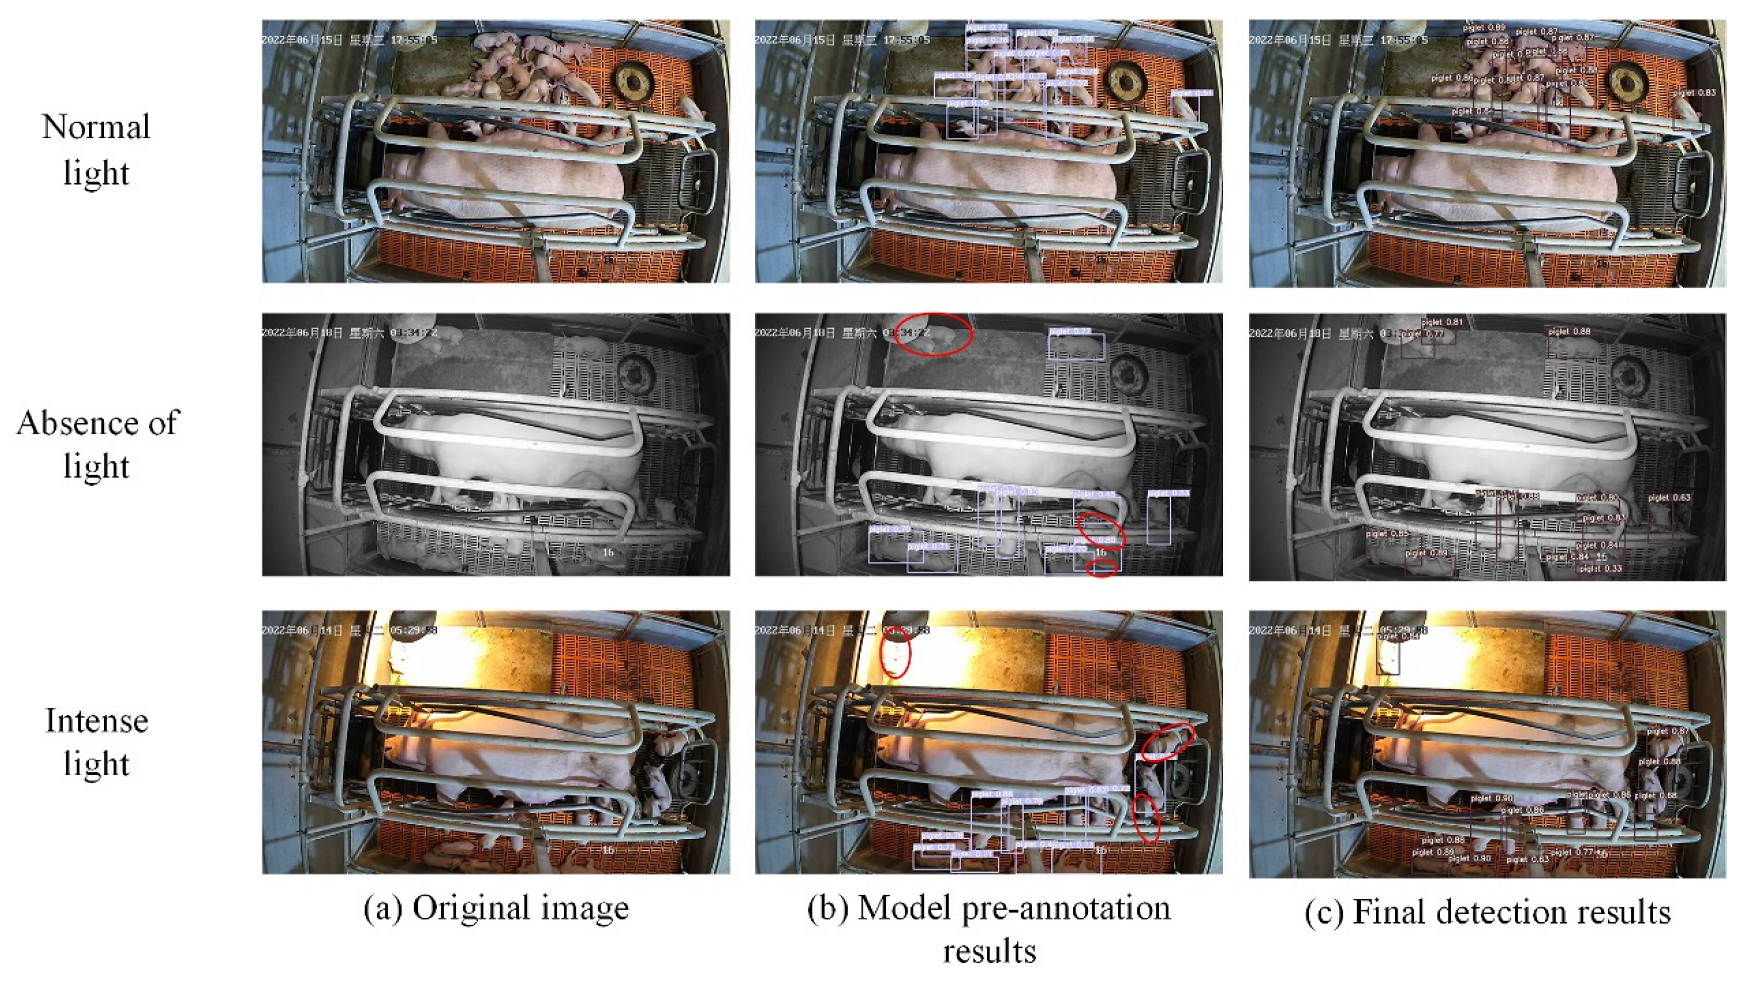
2.5. Semi-Automatic Annotation of Piglet Labels

Active learning, a method that enables algorithms to actively seek expert annotation by selecting specific data for labeling, significantly reduces the burden of manual labeling [38]. The fundamental equation of active learning algorithms can be represented as follows:
A = ( C , L , S , Q , U )
where, C represents the detector, L denotes the labeled samples, S stands for the supervisor responsible for image calibration or annotation, Q is the query function used to retrieve data rich in significant information, and U includes all the unlabeled images.
Adhering to the active learning framework, the semi-automatic piglet labeling method in this study encompasses three primary steps: automatic data splitting, preliminary labeling of new samples, and manual calibration. The integration of active learning algorithm parameters into this semi-automatic labeling process is depicted in Figure 3.
The query function Q is designed to select content-rich images, thereby easing the workload associated with data cleaning and annotation. In our experiment, this function employs a threshold-based method reliant on image similarity, using frame difference to evaluate the similarity between images. It retains images with a similarity below a predetermined threshold to guarantee data diversity and enrich the dataset with varied image information.
Equation (2) describes the frame difference method, while Equation (3) details the binarization of frame difference images, employing the Otsu algorithm to determine the binarization threshold. The similarity calculation is outlined in Equation (4). For this study, we selected a similarity threshold of 0.8.
D k ( x , y ) = I k ( x , y ) I k 1 ( x , y )
P ( x , y ) = 1 , D k ( x , y ) T 0 , D k ( x , y ) < T
F s i m i l a r = 1 P w h i t e W × H
where, Ik denotes the k-th frame image, (x, y) represents pixel coordinates, T stands for the threshold of the image binary, Pwhite is the count of pixels with a value of 1, W indicates the image width, and H signifies the image height.
The YOLOv5 model, trained on original samples, produced a preliminary piglet pre-labeling model. This model was then used to detect piglet targets in new samples, yielding initial coordinates for piglet target boxes. The pre-labeled data were subsequently converted into XML files, imported into the labelImg annotation tool, and manually calibrated to correct any inaccuracies such as false positives or missed detections.

2.6. Evaluation Metrics for Model Detection Performance

In the context of pre-labeling tasks in this study, an excessive quantity of detection boxes can complicate the process of manual calibration. Consequently, detection precision is primarily employed as the chief evaluation metric in this research. Additionally, to avert the risk of model overfitting, recall is also incorporated into the assessment. The formulas used for calculating accuracy and recall are as follows:
P r e c i s i o n = T P T P + F P
R e c a l l = T P T P + F N
where, TP represents true positives, FP represents false positives, and FN represents false negatives.

3. Results

3.1. Automatic Video Splitting and Cleaning Results

The frame difference method is effective in evaluating the similarity between adjacent frames, enabling the removal of data with excessively high similarity. However, as shown in Figure 4, this method may not filter out images damaged due to issues like data loss during recording. The piglet object features in these preserved, yet damaged, portions of the data are often insufficient, rendering them less useful for model training purposes. Consequently, manual intervention is necessary to delete these inadequate data during the annotation process.

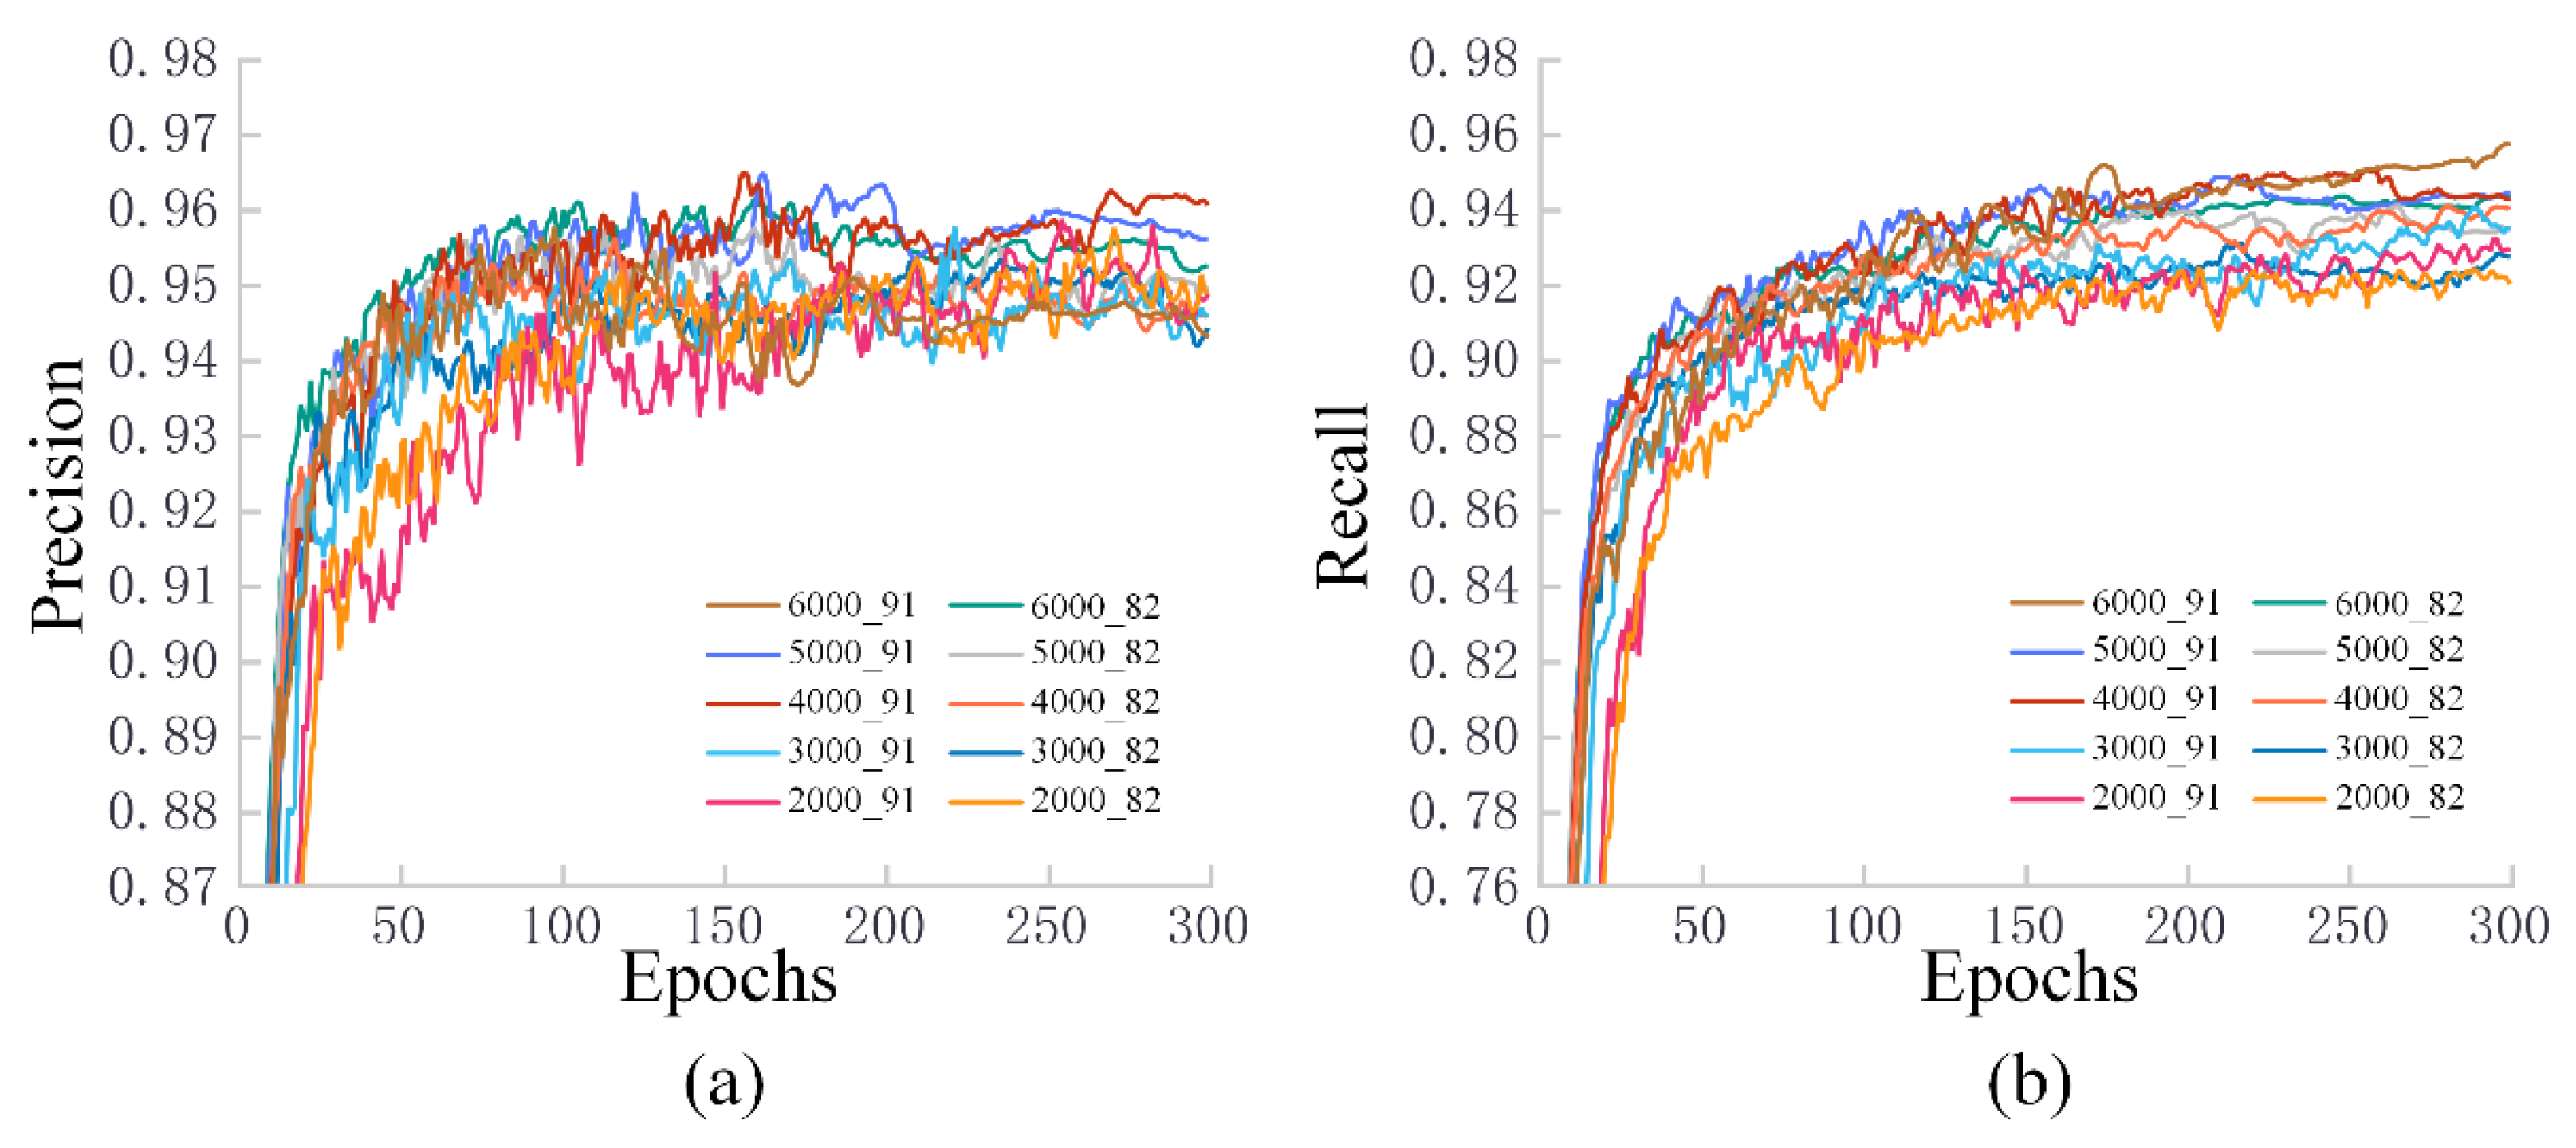
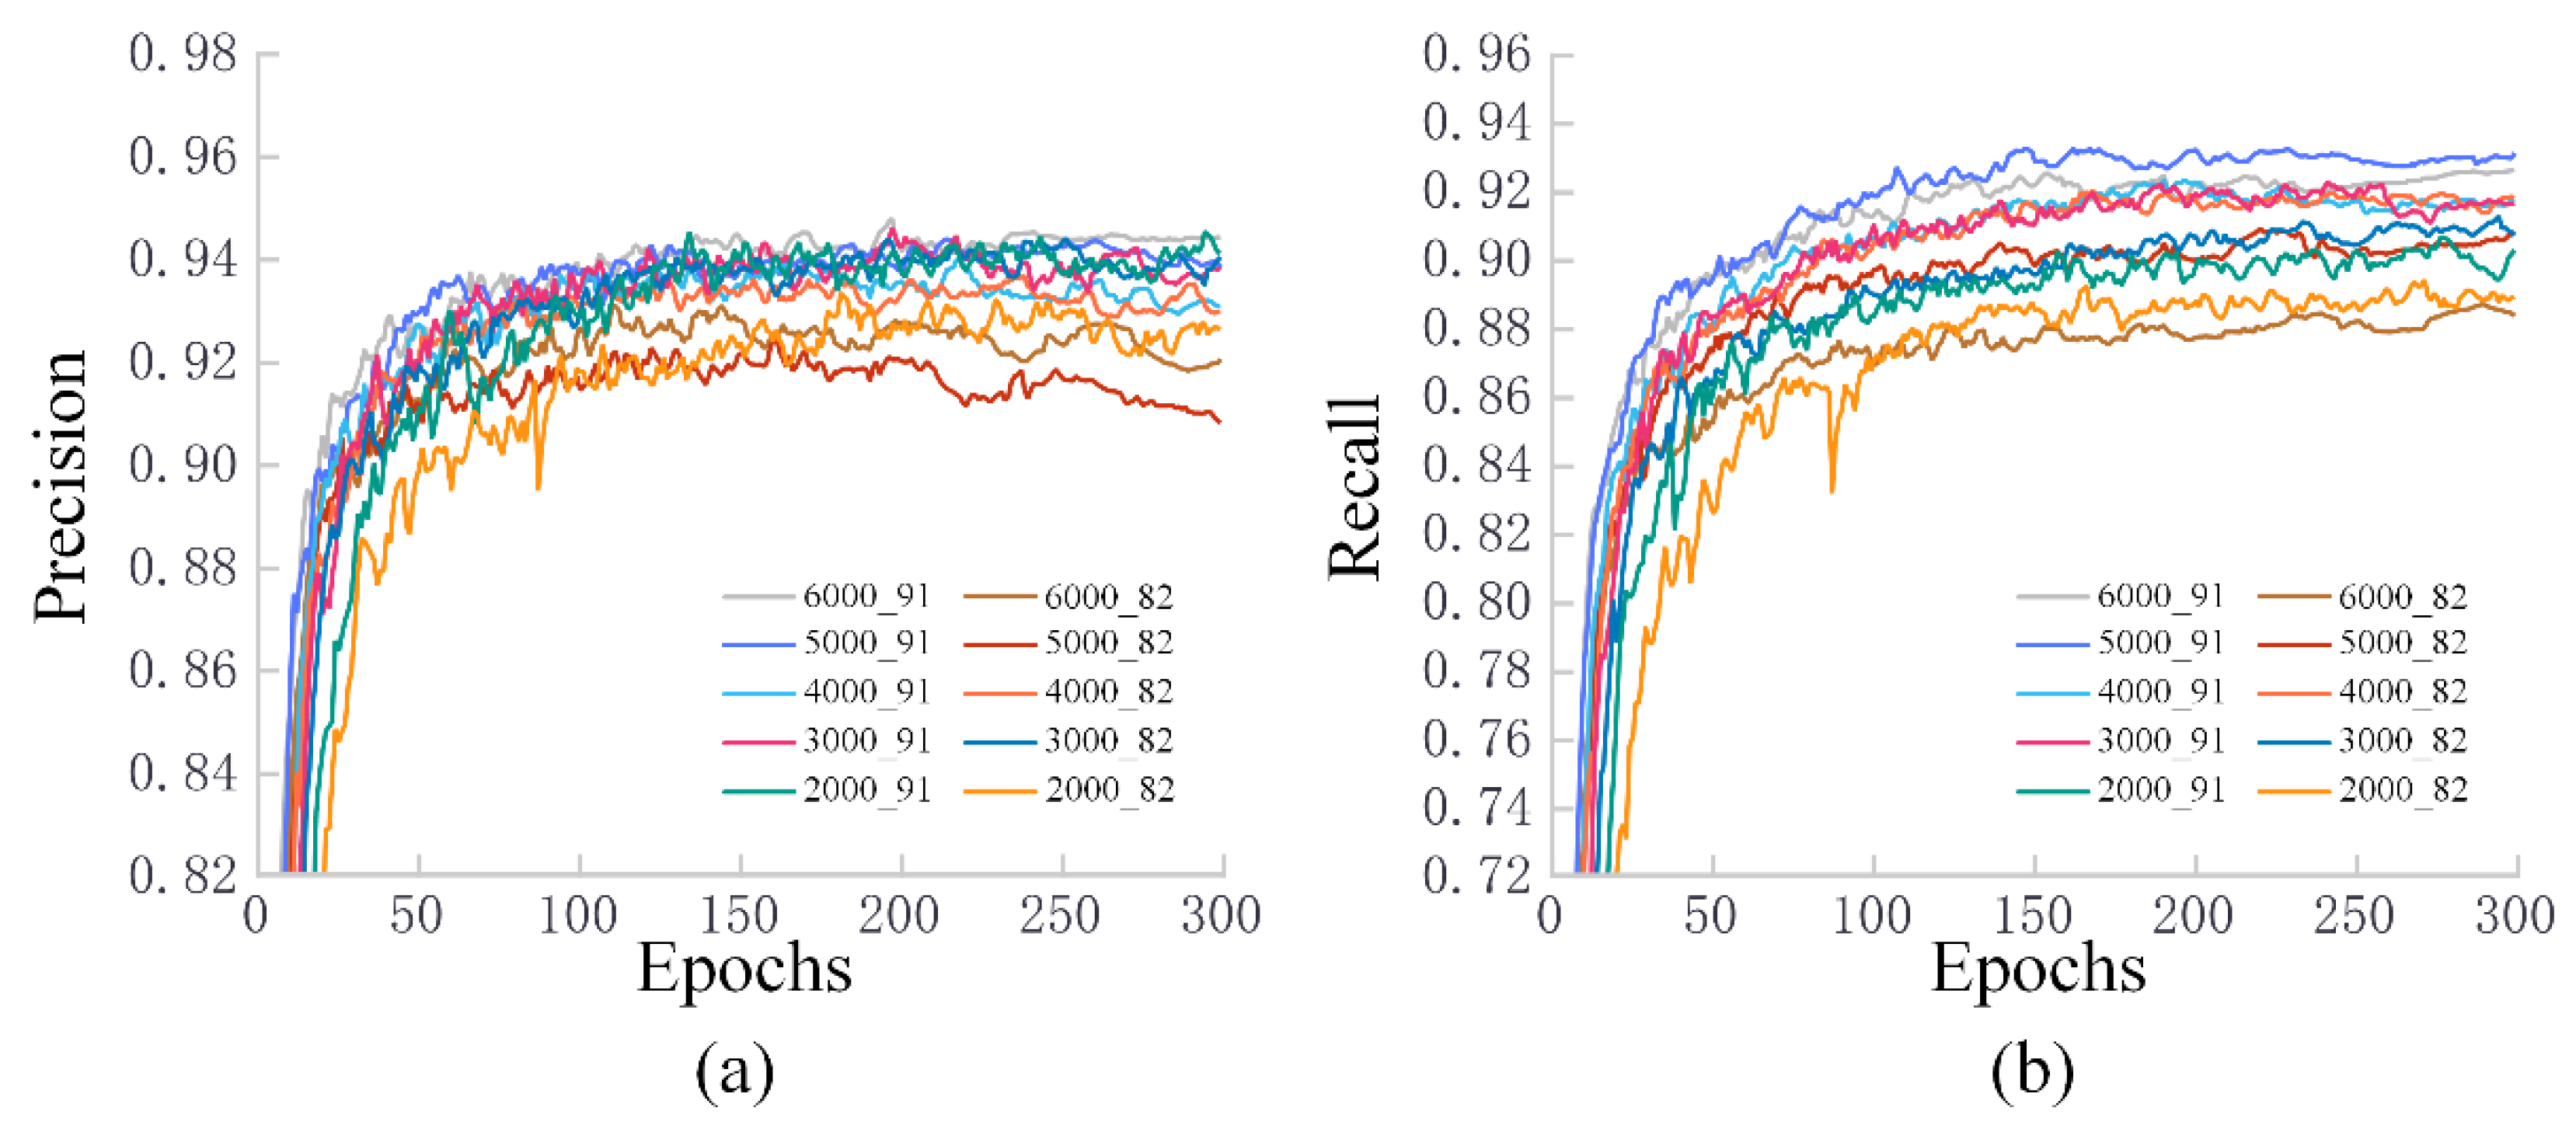
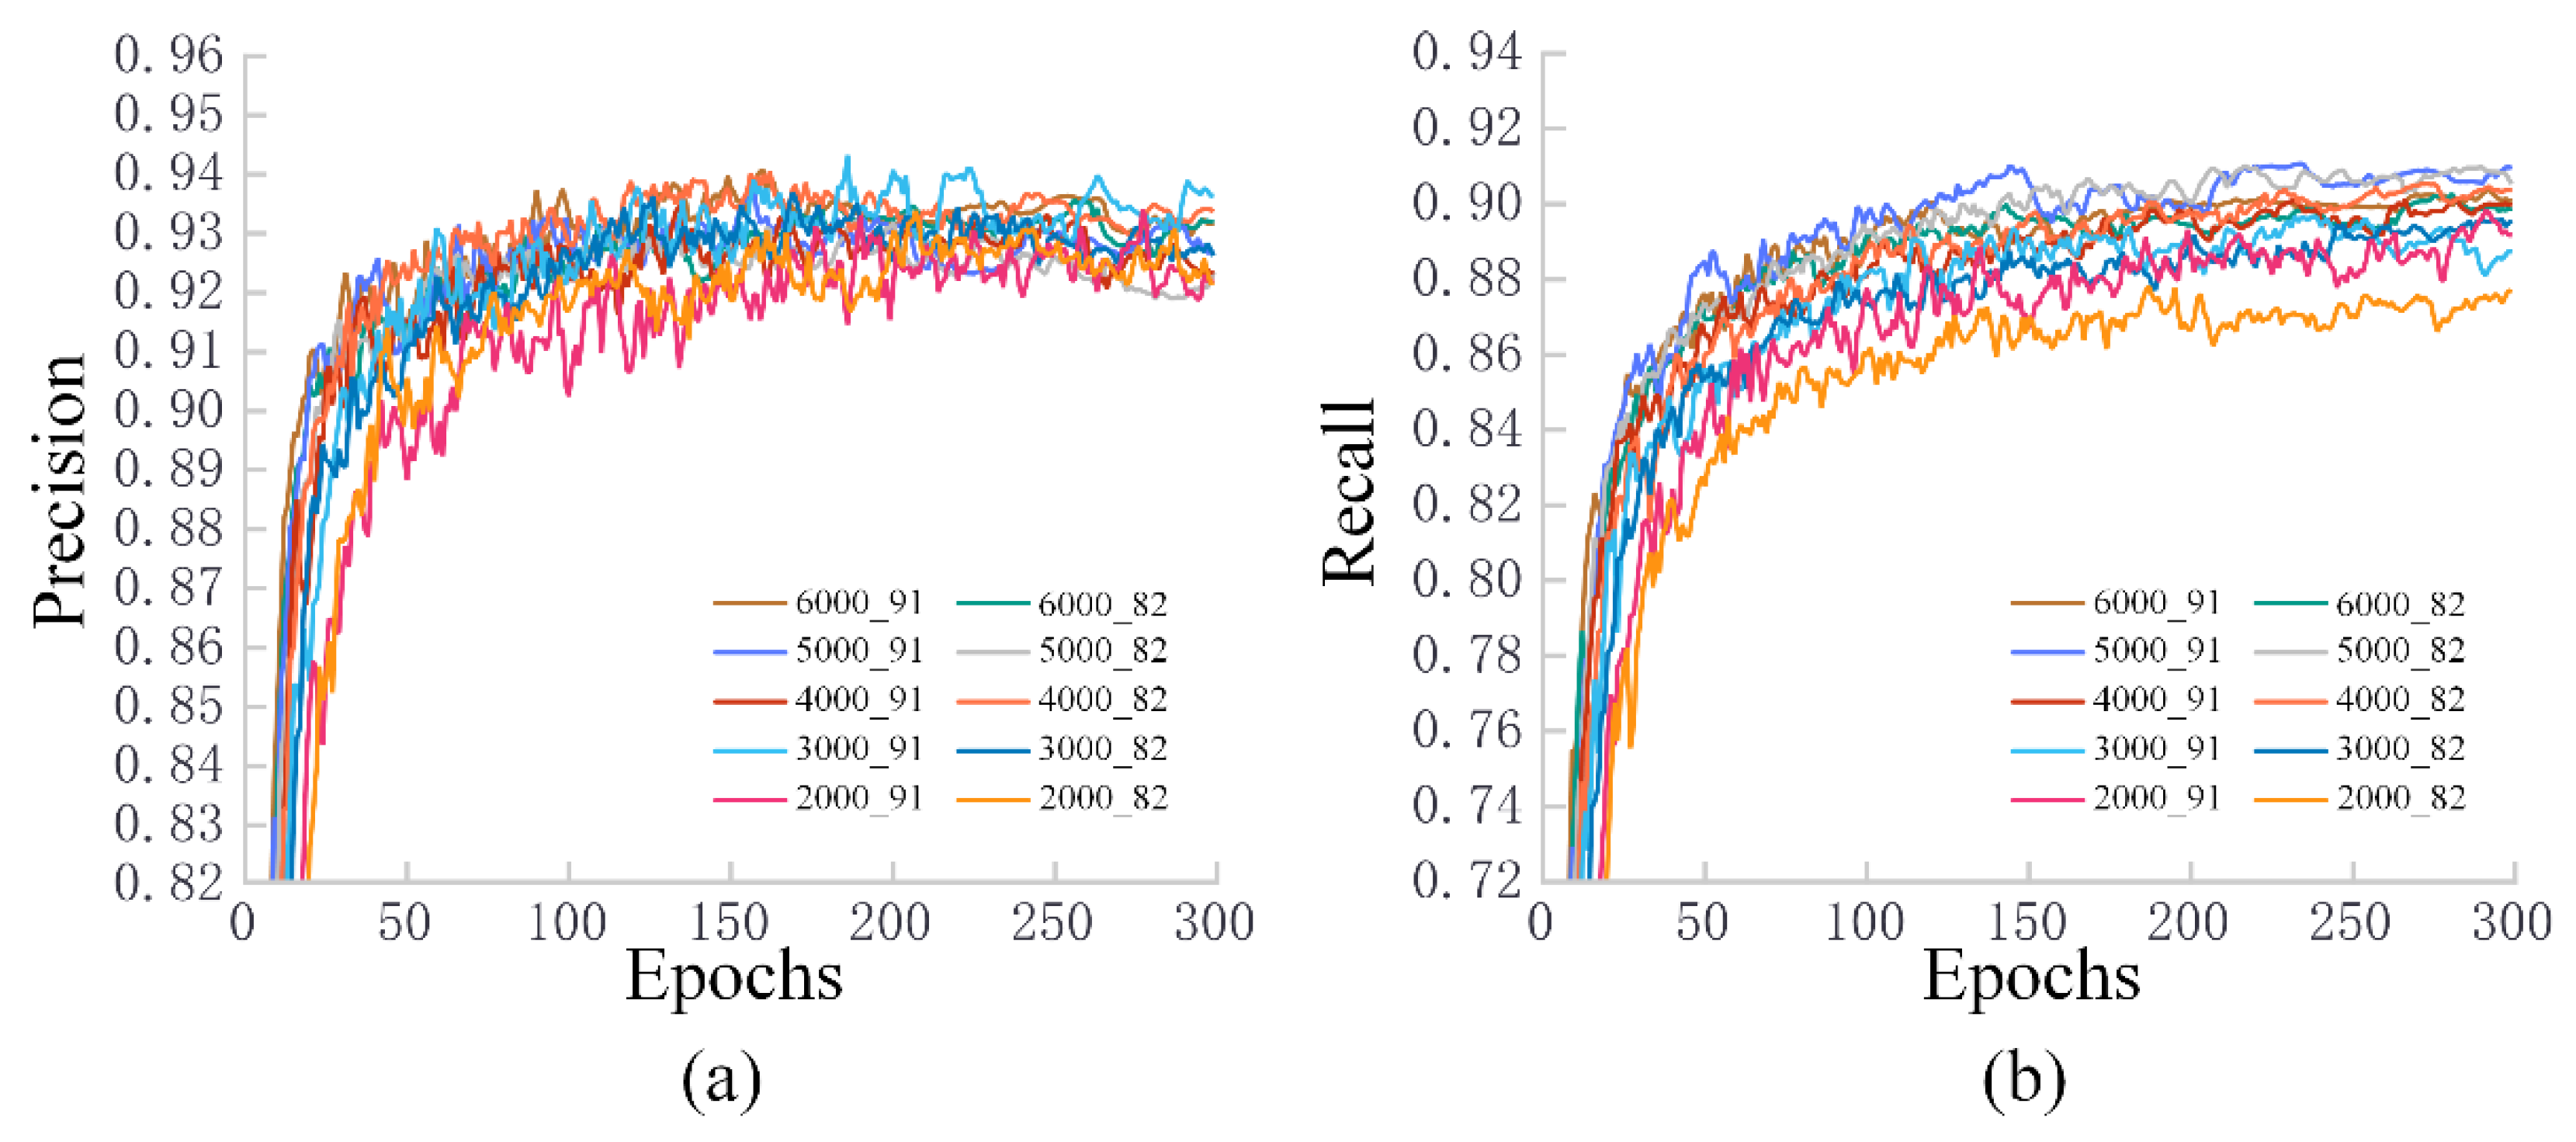
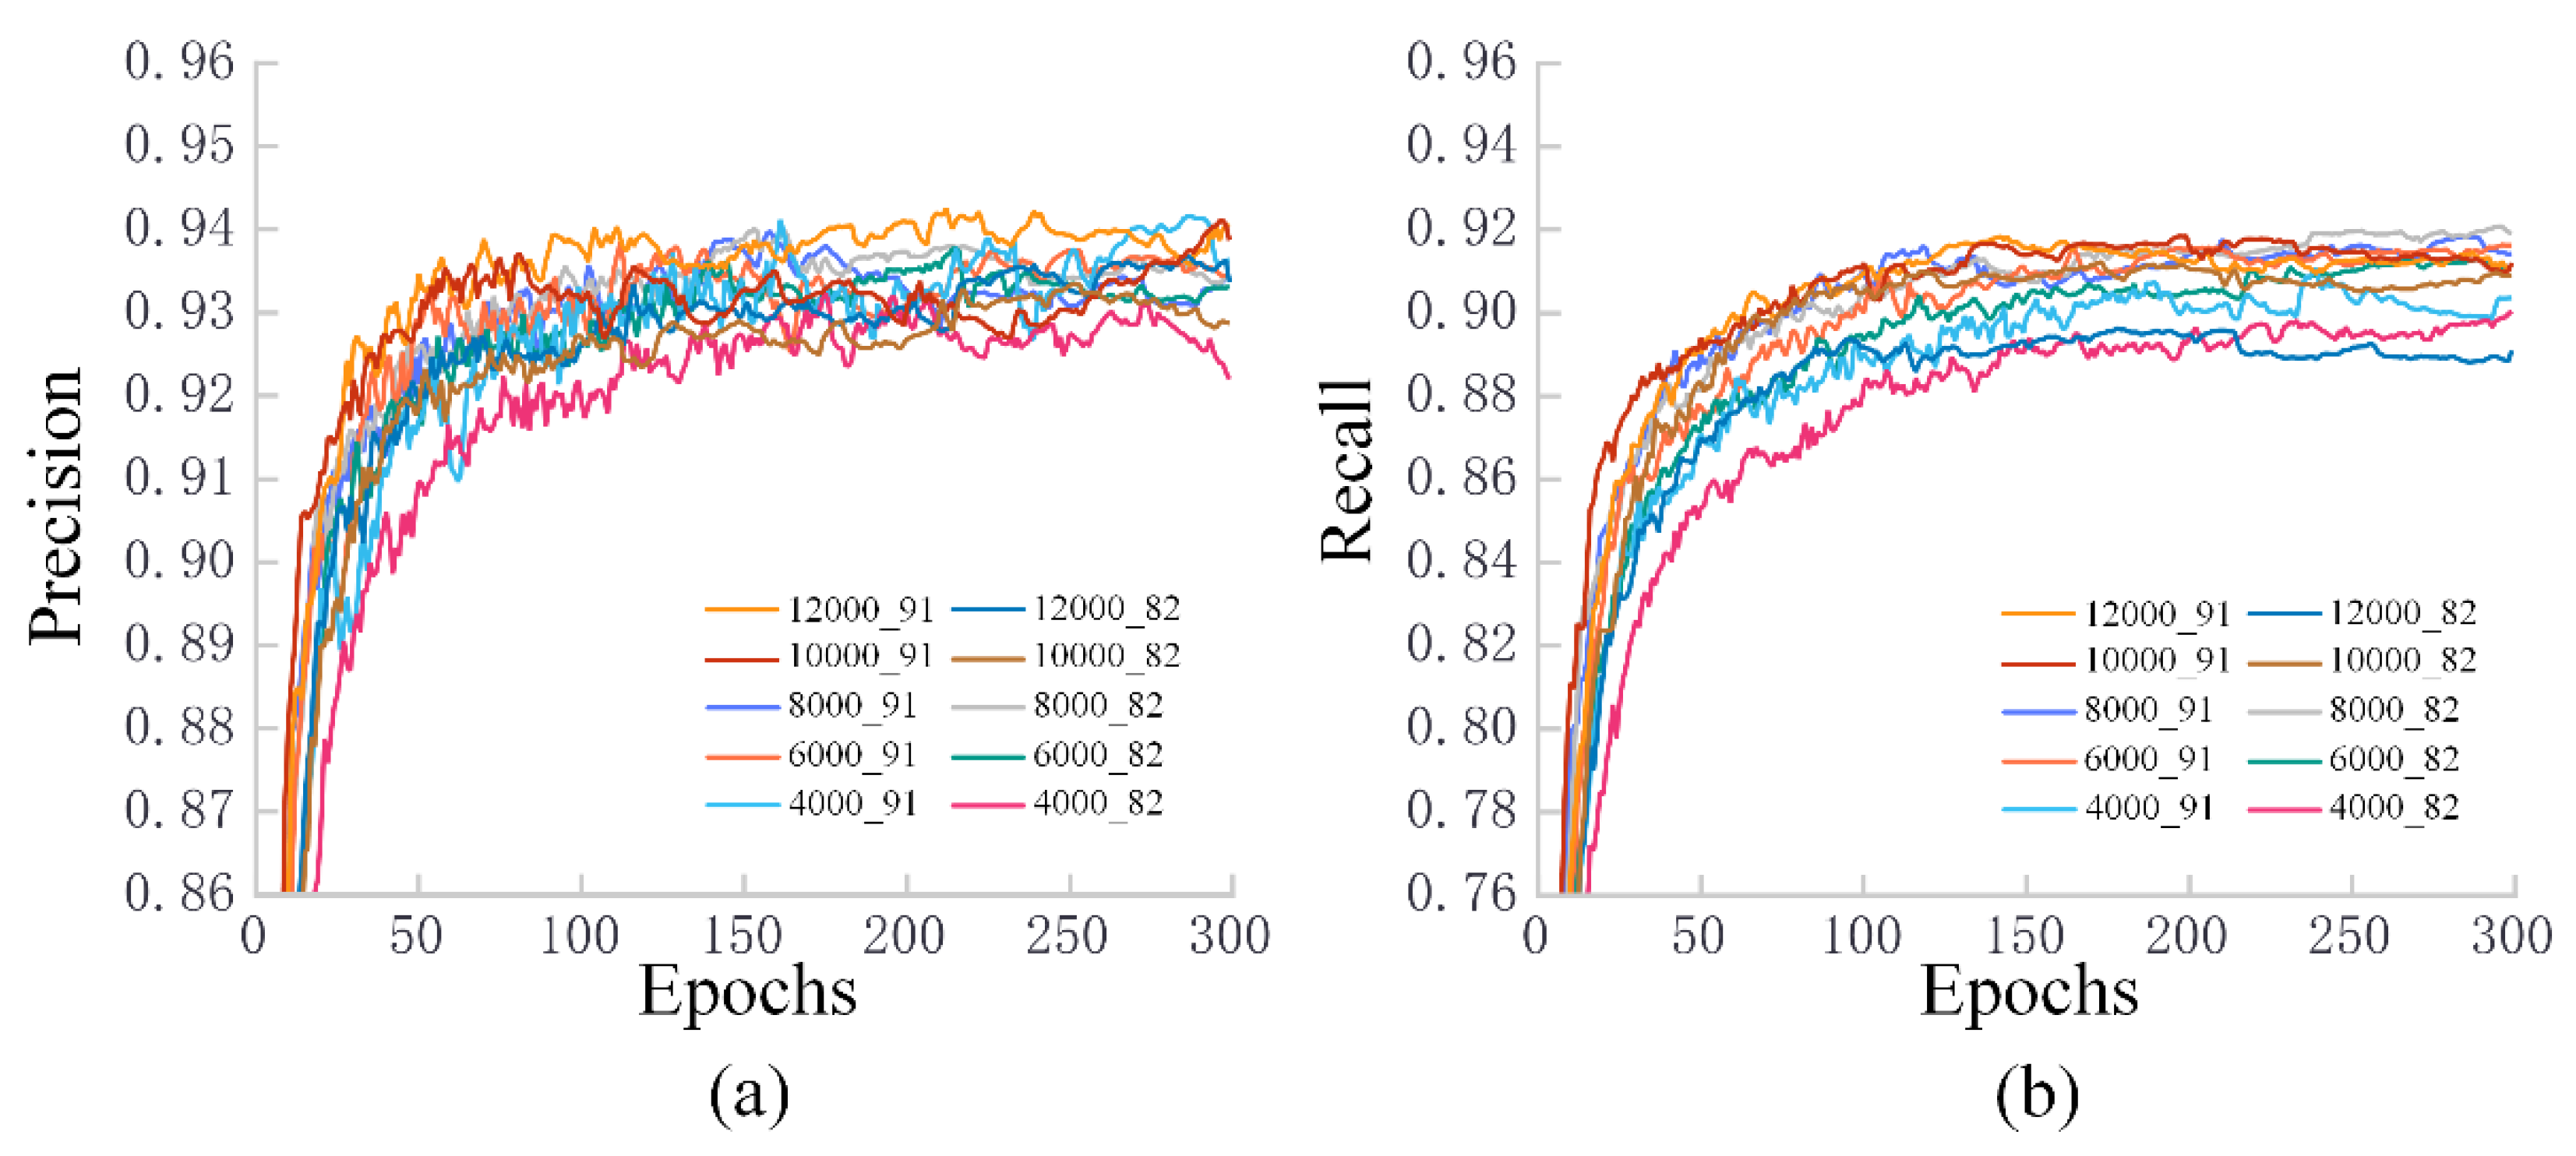
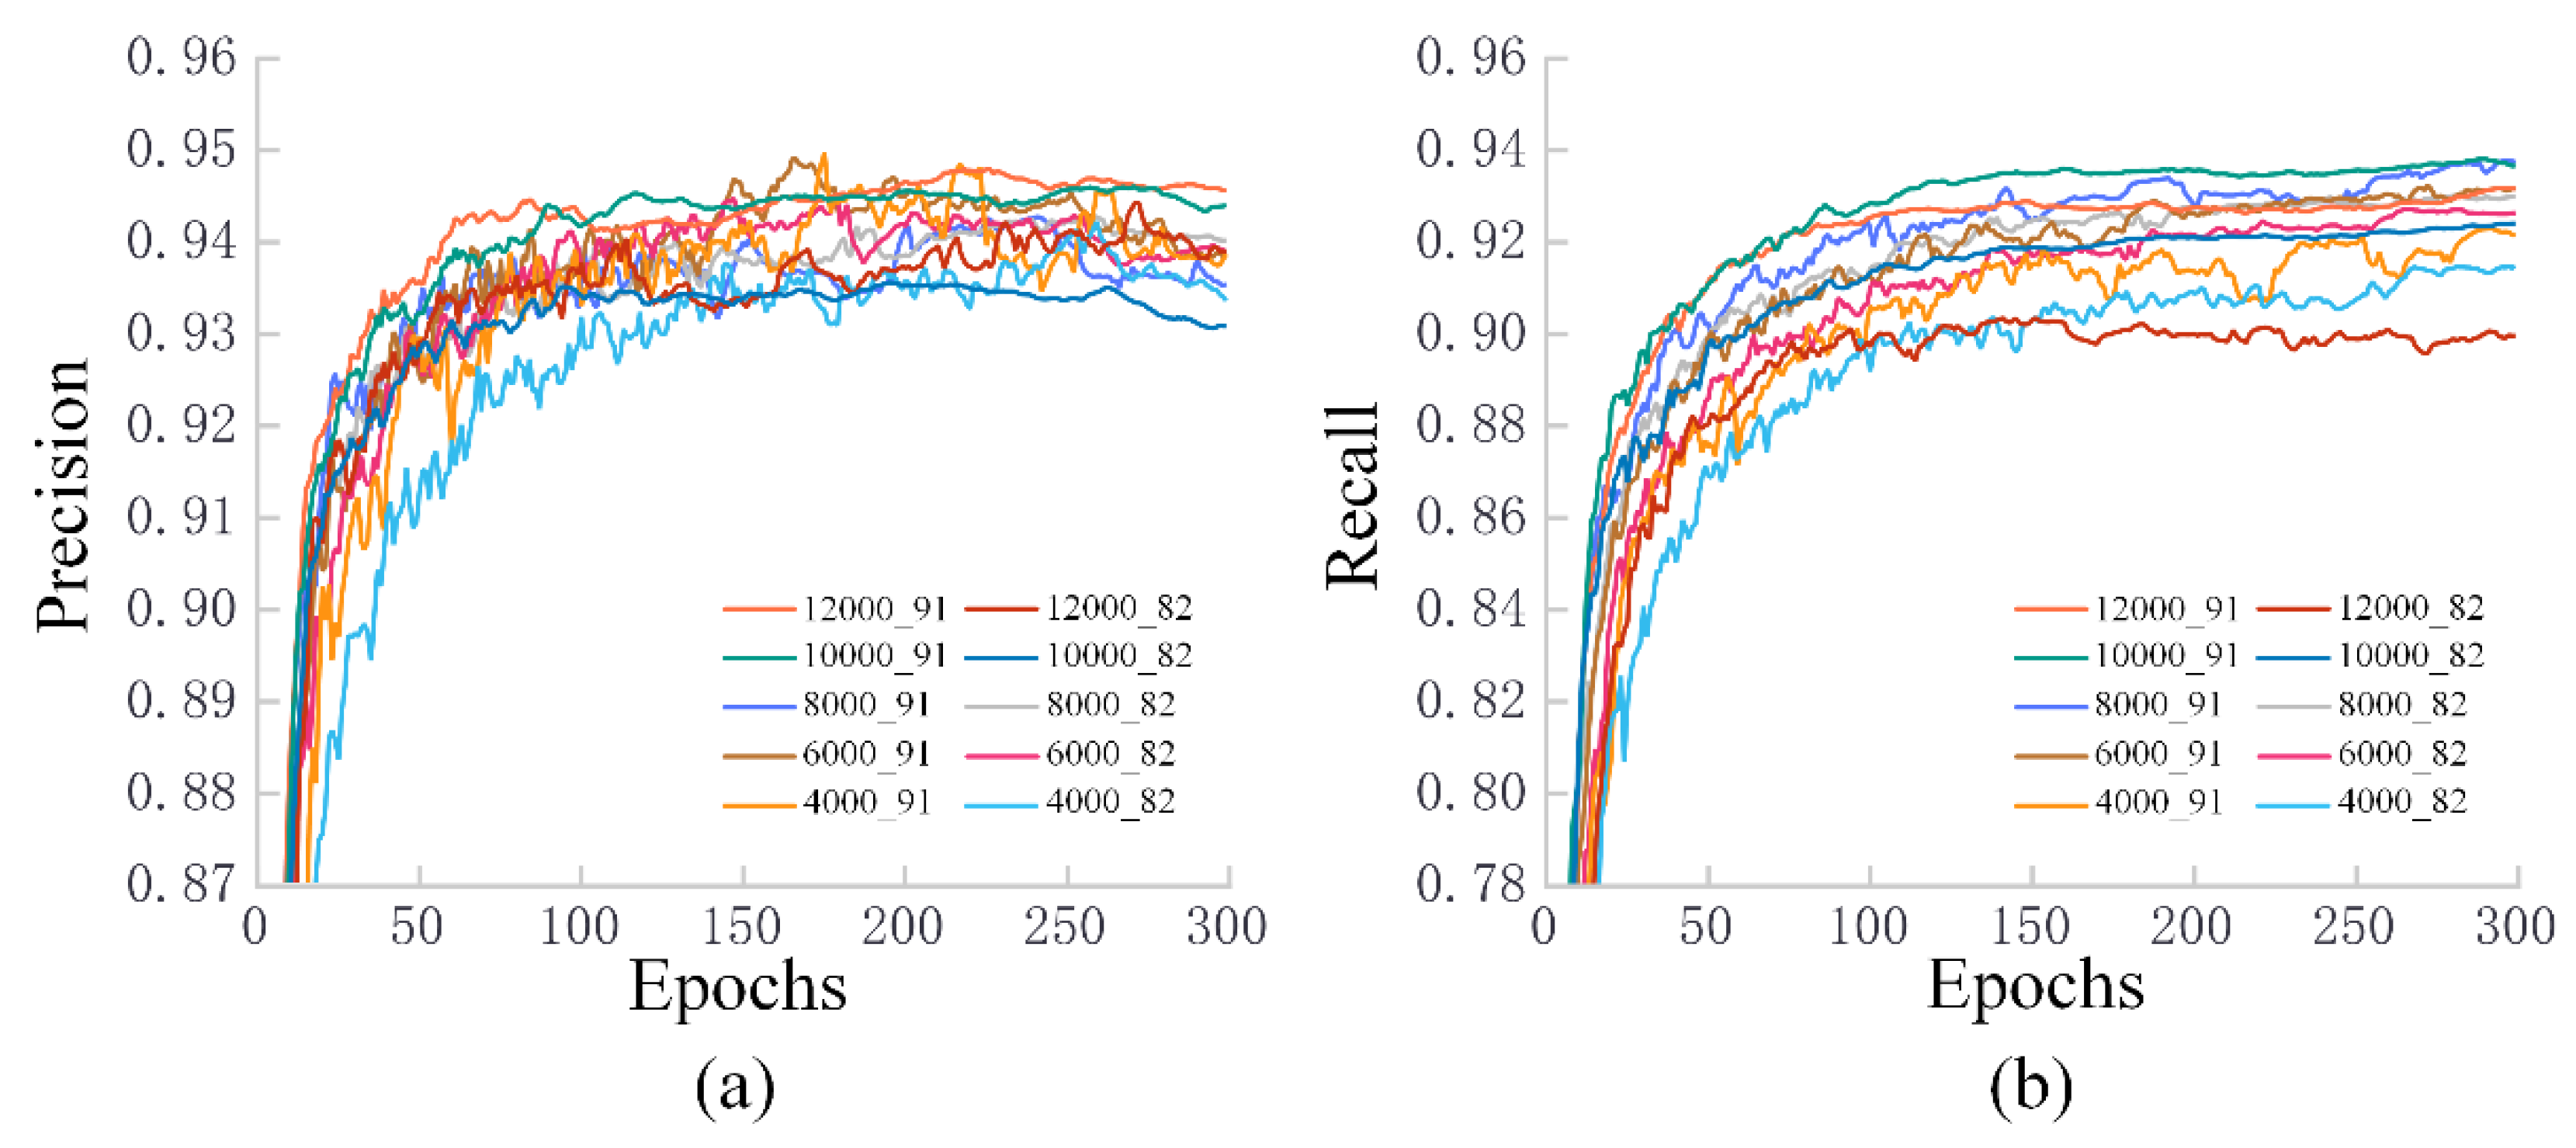
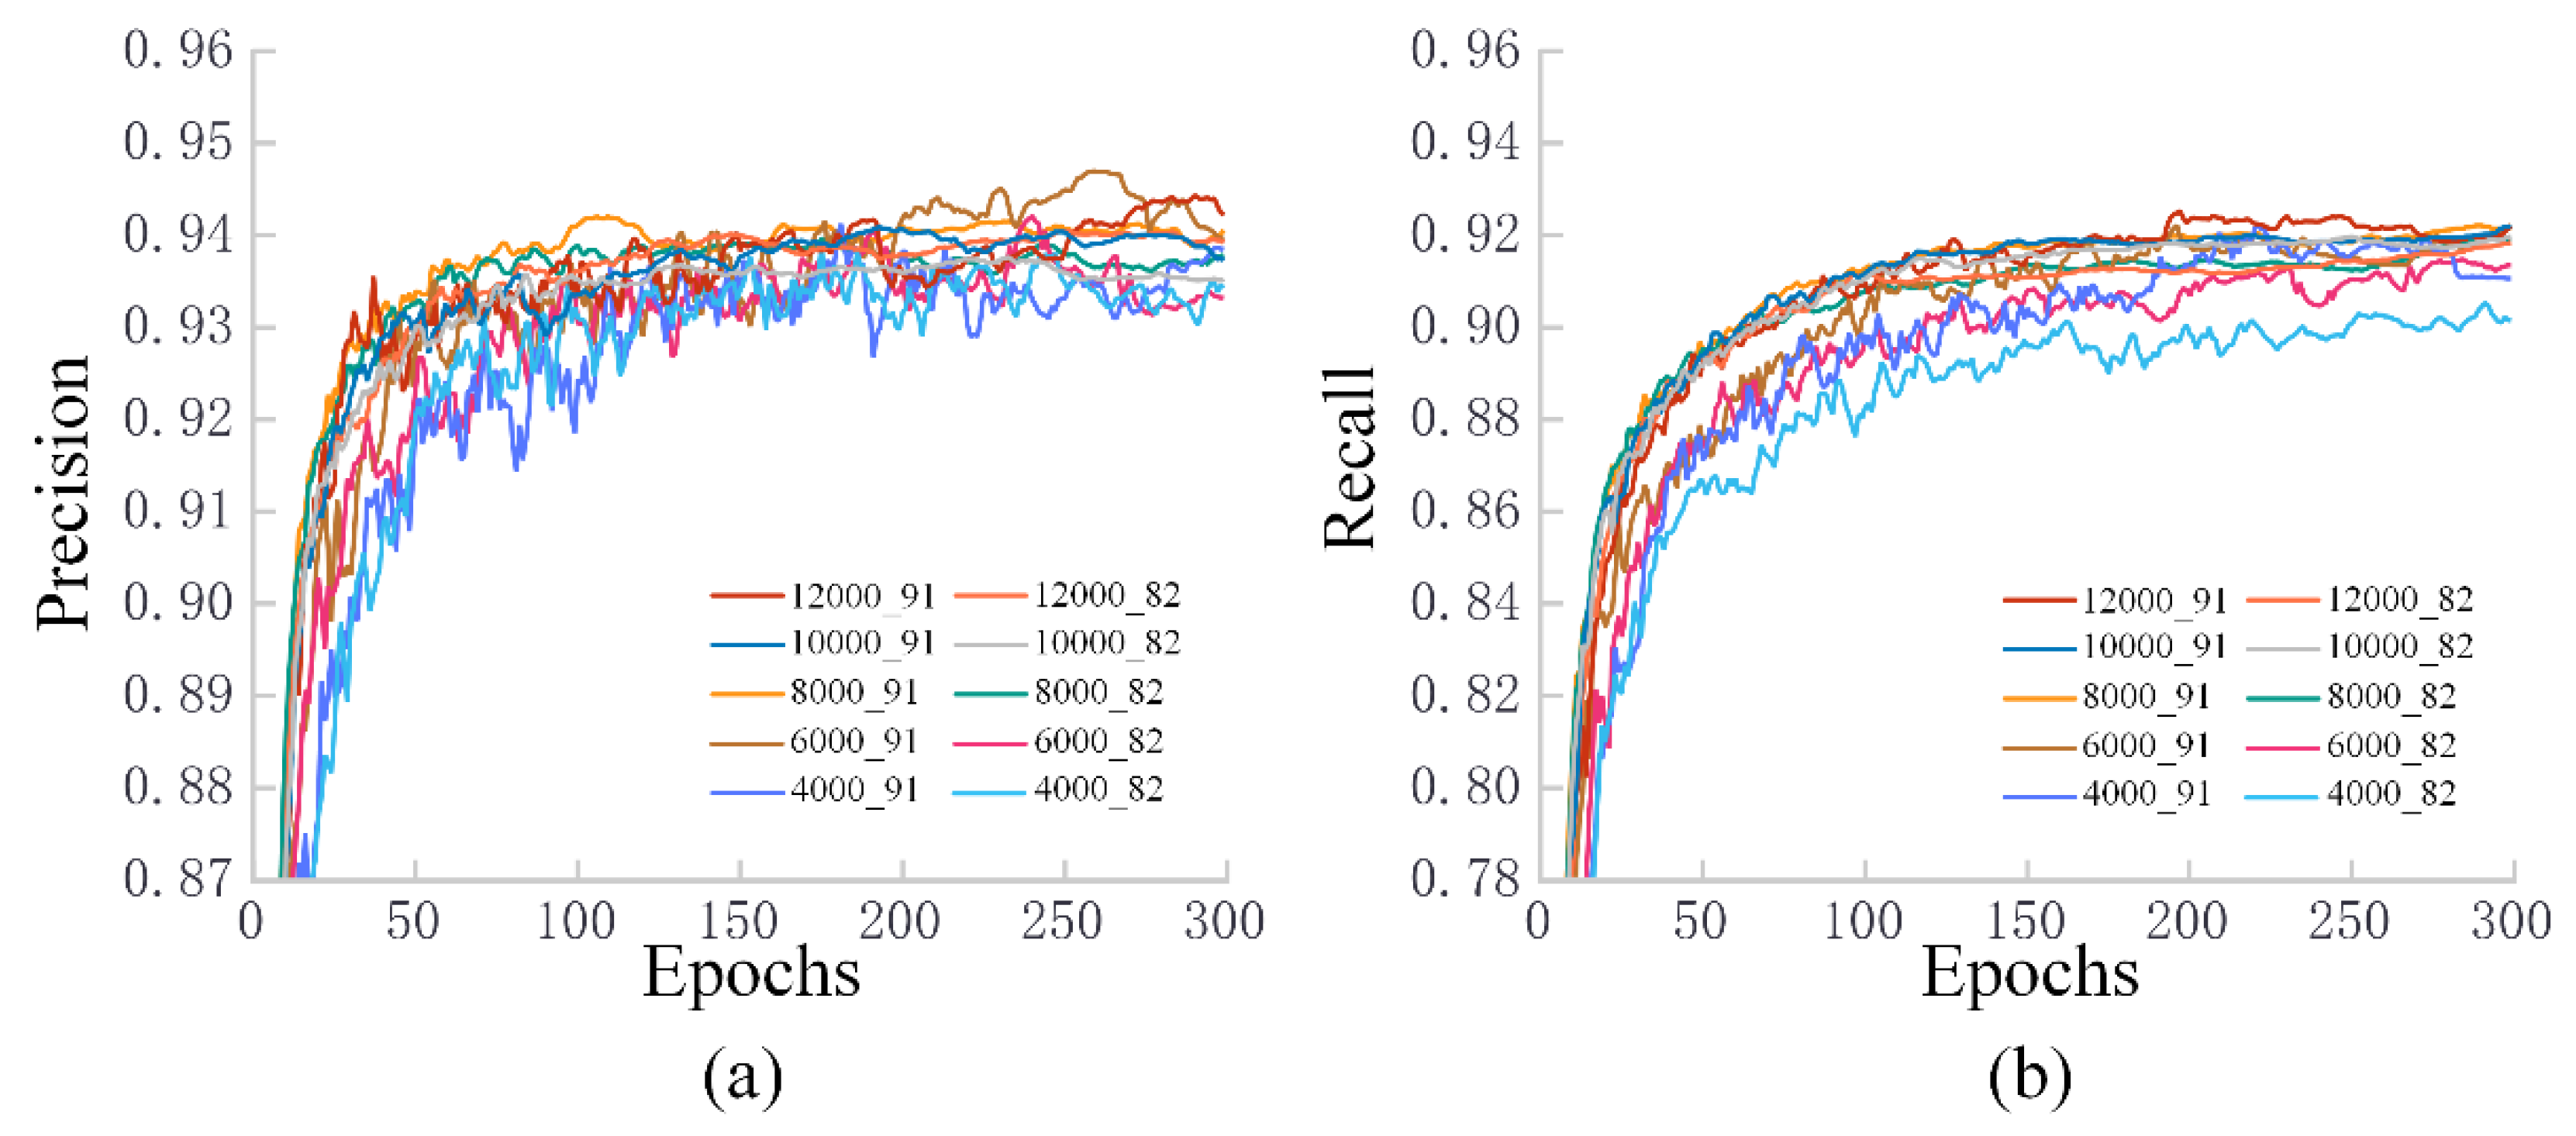
3.2. Training Results for Different Datasets

Separate training sessions were conducted using datasets from the three pig farms labeled as “jj”, “sq”, and “sy”. The visual representations of these training results are displayed in Figure 5, Figure 6, Figure 7, Figure 8, Figure 9, Figure 10 and Figure 11. Based on training accuracy and recall metrics, the optimal training outcomes were selected and are summarized in Table 1, Table 2, Table 3 and Table 4.
The piglet object detection models trained using the YOLOv5s framework consistently achieve accuracies above 0.9. However, as shown in Figure 5, Figure 6, Figure 7, Figure 8, Figure 9, Figure 10 and Figure 11, training precision does not always improve with more iterations. It typically peaks and then declines after around 100–120 epochs. While increasing the dataset size does improve training effectiveness to some extent, the training precision does not show significant continuous improvement as the sample size increases. The difference between the highest and lowest training precision stays within 0.05 for sample sizes ranging from 2000 to 18,000. The impact of dataset size on training precision becomes more apparent when examining individual datasets: for example, the maximum training accuracy reported is 0.959, and the minimum is 0.919, a variation of 0.04. In another instance, the range is between 0.946 and 0.927, a difference of 0.019.
Our study also highlights that within the same dataset size, the training-to-validation set ratio significantly influences the final training outcomes of the piglet object detection model. Generally, a training-to-validation split of 9:1 yields better results than an 8:2 split. As shown in Table 1 and Table 2, for datasets from individual pig farms, training precision under a 9:1 split ratio is consistently higher than under an 8:2 ratio. The most notable difference is observed for the “sq5000” sample, with a precision difference of 0.018. This trend is similarly evident in Table 3 and Table 4 for mixed samples, although the impact of the dataset split ratio on mixed samples is less pronounced compared to individual samples. The largest difference in precision for mixed samples is 0.011 for the “sqjj10000” sample.

3.3. Test Results for Fresh Samples in Different Datasets

After training, the piglet detection model was evaluated using a test set from the Danyang pig farm, with the results detailed in Table 1, Table 2, Table 3 and Table 4, where the highest values for each metric are highlighted in bold.
The outcomes reveal a significant drop in the performance of the lactating piglet detection model on fresh samples compared to its performance during training. This underscores that models performing well in training settings may not necessarily maintain their effectiveness on new, previously unencountered samples. Additionally, as the dataset’s size and diversity increase, the model’s ability to adapt robustly to new samples also improves.
Regarding the precision disparity between the training and test sets, the smallest difference was 0.013 in the “sqsy12000_82” sample, while the largest was 0.474 in the “jj6000_82” sample. Within the same dataset, the test results generally showed a preference for a 9:1 training-to-validation set ratio over an 8:2 ratio, although the differences were relatively minor. Furthermore, this disparity diminishes with the increase in sample size. In Table 3 and Table 4, for instance, the testing accuracy for the “sqsyjj18000” sample remains consistent.
When comparing datasets of equal size, an increase in data variety typically boosts the model’s adaptability to new samples. For example, the testing precision for “syjj4000_91” improved by 0.035 compared to “sy4000_91” and “jj4000_91”. Similarly, for the “sqsyjj6000_91” sample, the testing precision showed an increase of 0.003, 0.094, and 0.353 when compared with “sq6000_91”, “sy6000_91”, and “jj6000_91”, respectively.

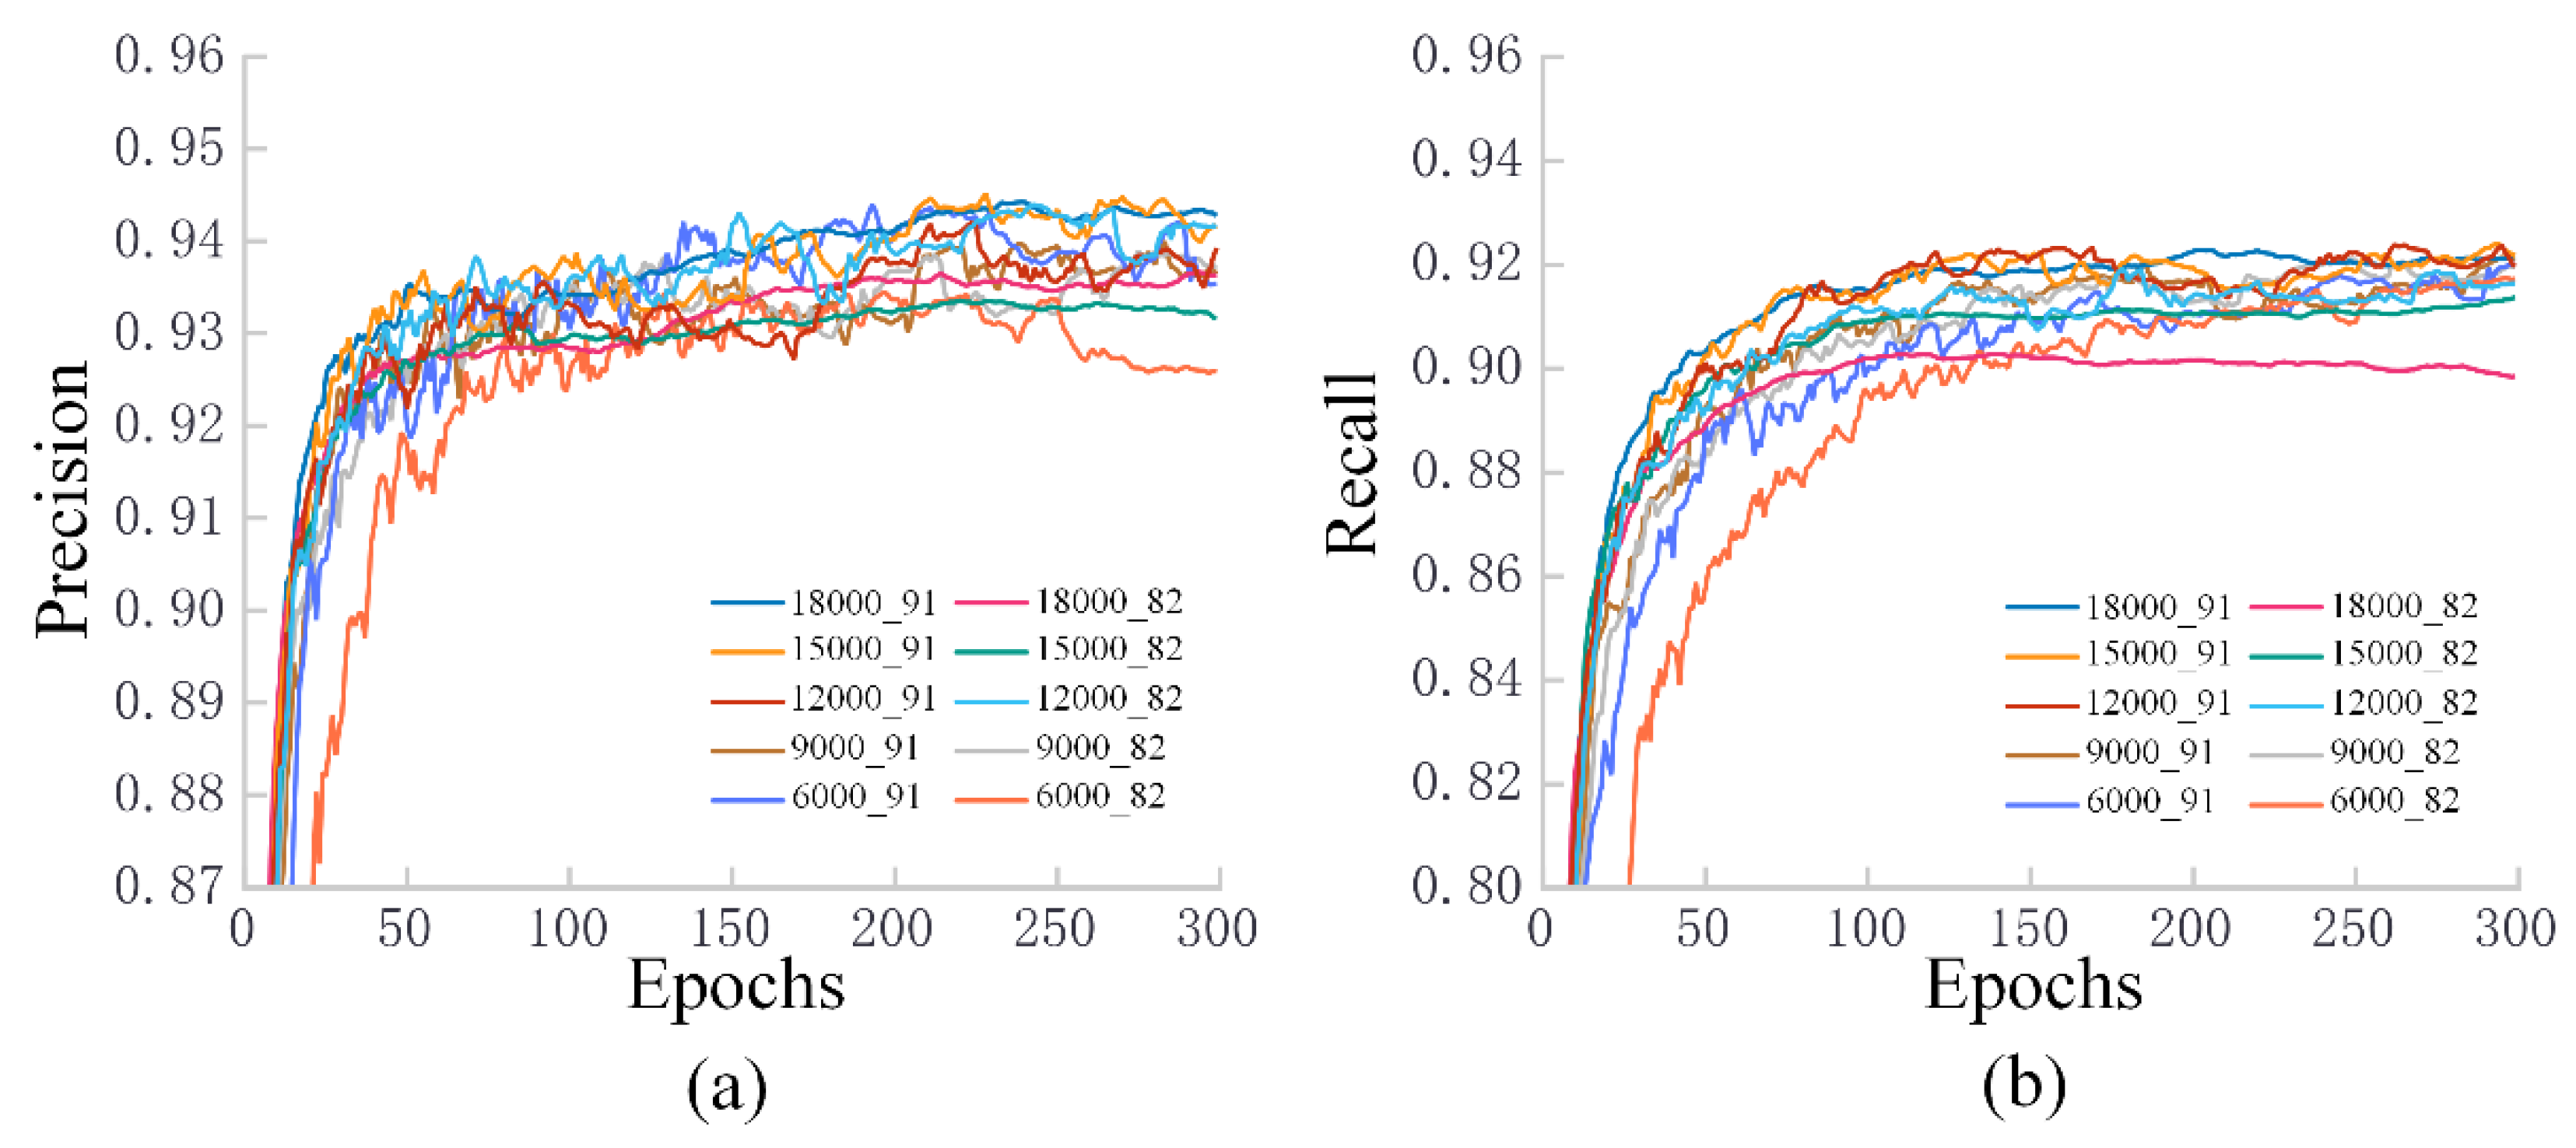
3.4. Training Results of the Semi-Automatic Labeling Model

The piglet detection model, trained with the “sqsyjj18000” dataset, was employed to pre-label 5000 piglet images from the “dy” dataset. These pre-labeled samples were then manually calibrated, and the refined dataset was subsequently trained using the YOLOv5s model. The performance of this newly developed piglet detection model was evaluated using the “dy” test set, with the results detailed in Table 5.
The training results of the model were impressive, consistently achieving a precision exceeding 0.96, a recall rate of approximately 0.95, and a mean Average Precision (mAP) at an Intersection over Union (IoU) of 0.5 surpassing 0.97. These metrics signify the model’s excellent training performance. Furthermore, the testing precision of the model also exceeded 0.96, displaying a negligible discrepancy of no more than 0.005 compared to the training precision. This high level of consistency suggests that the YOLOv5s model is adept at extracting features from datasets annotated via the semi-automatic method. Moreover, the use of a 9:1 data split ratio appears to have significantly contributed to enhancing the model’s robustness.
The outcomes of the piglet object detection exercise are depicted in Figure 12, where red markings highlight instances of missed piglets. Detecting piglets during the lactation period poses challenges due to the presence of additional equipment like heat lamps, which are essential for maintaining optimal growth temperatures. A significant challenge in this context is light interference. The pre-labeled piglet object model was capable of identifying most piglet targets under normal lighting conditions. However, in no-light and strong-light scenarios, the model tended to miss some targets. In contrast, the piglet model trained with the manually calibrated dataset demonstrated superior accuracy in detecting piglets across various lighting conditions, with detection bounding boxes more precisely matching the contours of the piglets.

4. Discussion

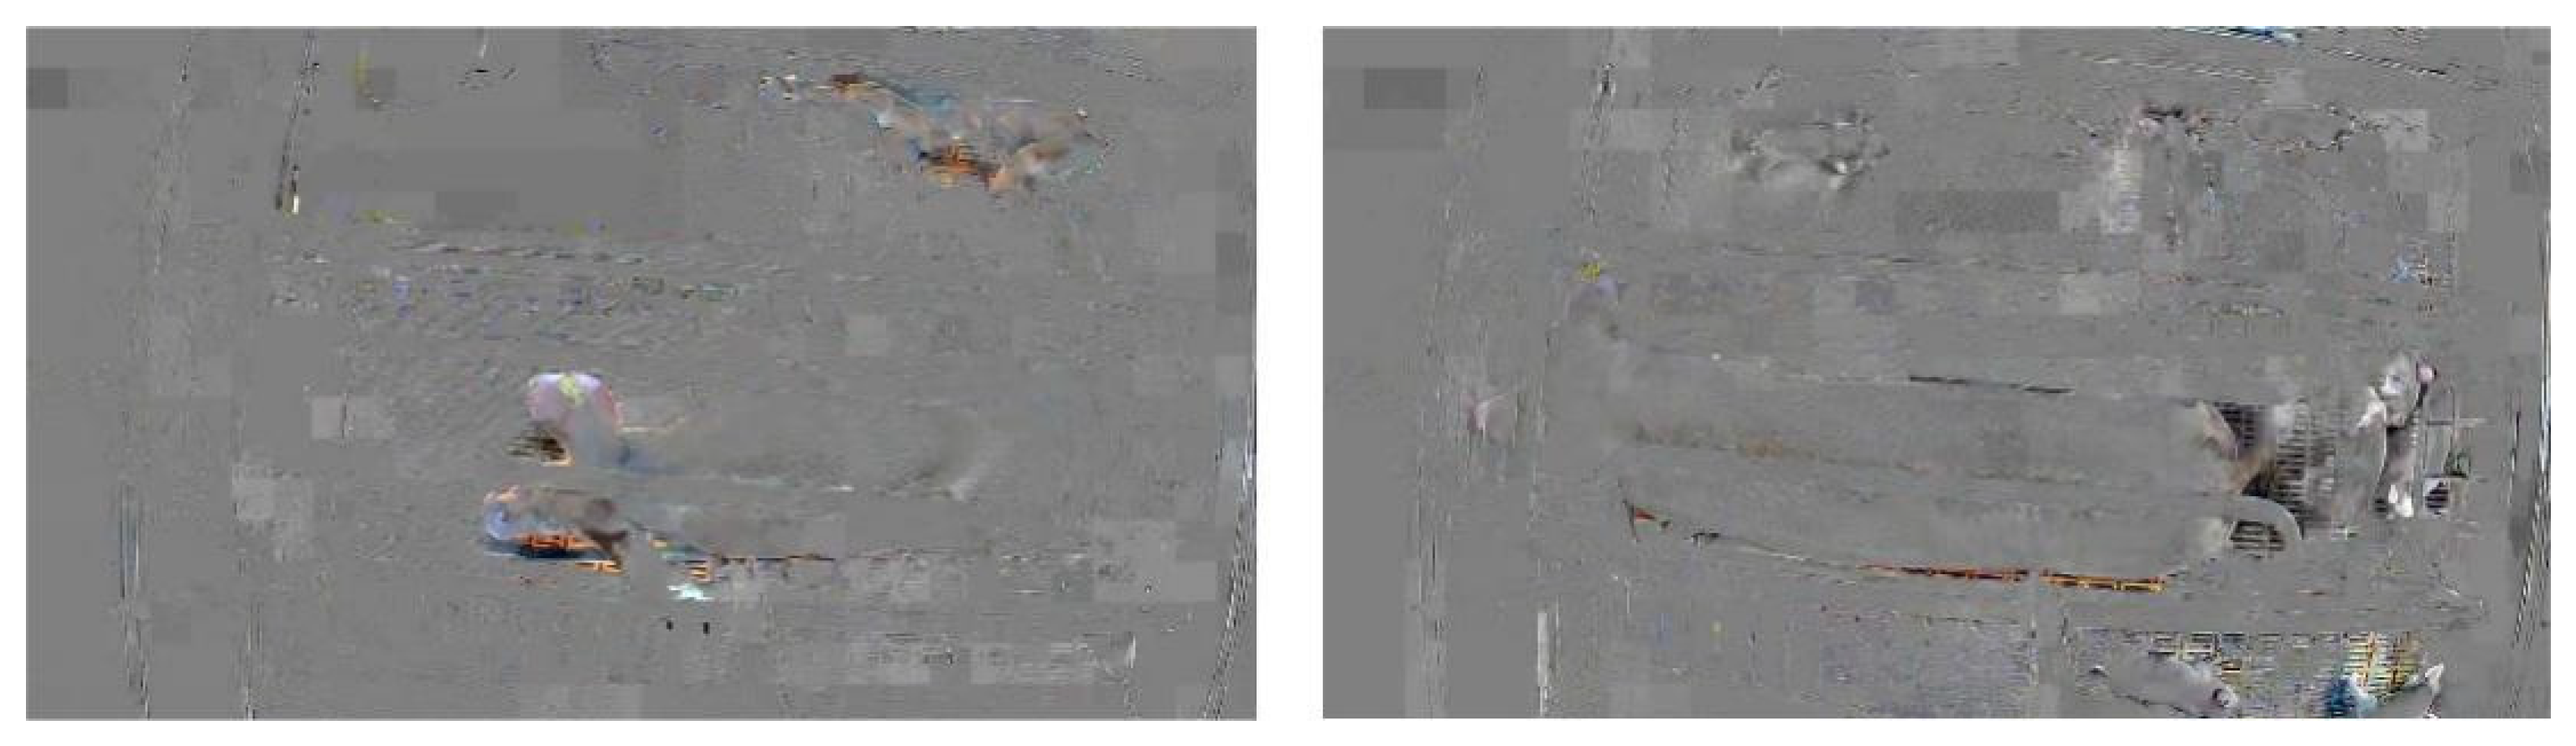
4.1. Reason for Damaged Images

Under optimal conditions, the data collection system is expected to function without issues such as image corruption. However, further investigation determined that the corruption of images was attributable to damaged network cables. Given the specific environment of the pig farm and the noticeable wear and tear on equipment, there is a clear need for higher-quality network cables and improved installation practices. Future efforts will be directed towards these aspects to guarantee the system’s effective operation.

4.2. The Impact of Different Piglet Datasets on Training Results

As shown in Figure 13, in piglet object detection, the relationship between dataset size and training accuracy is generally positive, indicating that increasing the number of training samples enables the model to capture a broader range of target features and thereby improve accuracy. However, an excessively large dataset may complicate feature extraction and increase classification challenges.
Additionally, subjectivity in annotation can affect training outcomes. Despite consistent annotation guidelines, individual differences among annotators may lead to variable labeling of similar piglets, potentially reducing training precision as the dataset grows. Mislabeling and omissions are particularly detrimental to training performance [25].
In our experiment, the piglet detection models “sq5000_82” and “sq6000_82” performed less favorably than “sq4000_82”. Analysis revealed that the “sq” samples were annotated by two individuals, with the data divided into sets of 4000 and 2000 samples. This division contributed to a decline in training effectiveness for “sq5000_82”, whereas “sq6000_82” showed improved performance due to the larger sample size.
Furthermore, employing a 9:1 training-to-validation split in the “sq” dataset yielded more stable training results. This stability might be attributed to the diversity present in the validation set, which, while initially reducing training precision, exerts a diminishing negative impact as the training sample size increases.
Notably, the “dy5000” dataset, which was labeled using our approach, outperformed all fully manually labeled datasets in this experiment. The superiority of the “dy5000” dataset is likely due to the semi-automatic labeling process, which ensured a more consistent labeling style across samples [39]. The specific mechanisms underlying this advantage warrant further investigation.

4.3. The Adaptation of Different Piglet Datasets to Unfamiliar Scenarios

Models demonstrating high training performance do not always translate to equally effective adaptability when applied to new samples. This discrepancy may arise from a lack of complexity in the target features within the training set, potentially preventing the model from fully capturing the distinct characteristics of piglets. For instance, the “jj” dataset’s performance on new samples was markedly inferior compared to the “sq” and “sy” datasets. A closer examination of the dataset attributes revealed that the “jj” dataset possessed a higher degree of image similarity compared to the ’sq’ and “sy” datasets. Detailed analysis revealed that the “jj” dataset had a higher degree of image similarity and featured uniquely designed welfare farrowing crates that differ structurally from standard ones, which contributed to the model’s reduced adaptability.
Furthermore, models trained on datasets derived from multiple pens face greater challenges in accurately fitting piglet features than those trained on single-pen datasets, particularly when sample sizes are small. Increasing the diversity of sow farrowing pen environments in the training dataset tends to reduce the model’s training precision. However, this diversity simultaneously enhances the model’s adaptability to new environments, a trait that becomes more pronounced with larger data volumes. For instance, in the “sqsyjj18000” sample set, the piglet detection model achieved a precision rate exceeding 0.92 on new samples, yet it did not outperform the detection precision on the original samples. This outcome underscores the trade-off between improved model robustness and detection precision.
Large-scale pig farms often display significant uniformity in their background environments, making piglet detection tasks comparable to object detection in a static background. Therefore, developing a rapid model transfer mechanism, which can generate high-precision models tailored to specific pig farms without compromising accuracy due to increased model robustness, is likely a more viable strategy for the real-world application of intelligent technologies in pig farming. This approach effectively balances the need for precise detection with the adaptability required for diverse farm environments.

4.4. The Potential for the Method in Piglet Segmentation

Piglet segmentation has become increasingly significant in intelligent farming [13,40]. However, constructing segmentation datasets requires significantly more effort than target detection. To address this challenge, we explored the feasibility of employing a semi-automatic annotation process for piglet target segmentation. Initially, we manually labeled 120 images, each featuring 5–12 piglets, and trained pre-labeled models using the Mask R-CNN, SOLO, YOLACT, and YOLOv5s networks. These models were used to predict the contour coordinates of piglets in 1000 images, followed by manual corrections. This process resulted in the construction of a piglet segmentation dataset, which was then merged with the architecture of GAN networks to develop a segmentation model specifically for the sucking piglets. The model demonstrated effectiveness in segmenting piglets under occlusion conditions during lactation.
As illustrated in Figure 14, the proposed semi-automatic annotation method accurately delineates piglet contours across different groupings, reducing the cost of manual labeling while maintaining segmentation accuracy. However, due to the extensive workload associated with piglet segmentation annotation, an in-depth investigation has not yet been conducted, and we plan to explore this further in future research.

4.5. Shortcomings and Future Work

The proposed semi-automatic labeling method significantly reduces the manual effort required for dataset annotation, though it still has limitations in full automation. This method has been evaluated on publicly available datasets (https://aistudio.baidu.com/datasetdetail/106525 (accessed on 20 November 2024), https://aistudio.baidu.com/datasetdetail/201481 (accessed on 20 November 2024)), demonstrating a substantial reduction in manual annotation time. Future enhancements will incorporate active learning principles by integrating more effective query functions. Currently dependent on existing piglet detection models, future iterations will also consider unsupervised learning methods for constructing initial piglet pre-labeling models.
Furthermore, the impact of this semi-automatic approach on model training outcomes requires further investigation. Planned experiments will compare semi-automatic and fully manual labeling on identical datasets to determine whether a consistent labeling style can reduce discrepancies and optimize training performance.
In practical applications, the challenge of obtaining production data in advance can be addressed by integrating cloud computing with the current method. This integration would enable existing models to automatically detect real-time images from sow farrowing rooms, generate new data labels, and facilitate online manual calibration. Such a framework not only contributes to building updated datasets but also refines the model, ultimately creating a piglet detection system tailored to the unique environmental conditions encountered. Future research will focus on advancing this technology to further enhance its effectiveness and efficiency.

5. Conclusions

The testing results and discussions from our study revealed two key findings:
(1)
We propose a novel scene transfer approach for suckling piglet object detection that integrates semi-automatic labeling. This technique leverages frame difference analysis to assess the similarity between video frames, selectively incorporating low-similarity images into the training set to reduce data cleaning time. Initially, we employed a preliminary piglet annotation model based on the YOLOv5s network to pre-label new samples, which were subsequently refined through manual corrections. The optimized dataset was then used to retrain the YOLOv5s network, enabling rapid adaptation of the piglet detection model to new environments. It is worth noting that YOLOv5 is utilized solely as the object detector in our method and can be replaced by any superior object detection model.
(2)
The efficacy of pre-labeled datasets significantly impacts the efficiency of semi-automatic labeling, particularly in terms of time cost. To investigate this, we constructed seventy distinct datasets varying in scale, partition ratios, and combinations of data from different pig farms. These datasets were uniformly trained using a consistent deep-learning network, and new samples were evaluated to determine how various factors influenced test outcomes. The experiments demonstrated that strategically augmenting existing datasets, such as increasing the number of samples while enhancing their diversity, could markedly improve the performance of the piglet pre-labeling model. This enhancement, in turn, expedites the transfer process of the piglet detection model to new environments.

Author Contributions

Q.D. (First Author, Corresponding Author): Conceptualization, Methodology, Data Curation, Software, Validation, Writing— Reviewing and Editing. F.Z.: Resources, Funding acquisition. L.L.: Data Curation, Validation. P.L.: Software, Validation. M.S.: Supervision, Resources. All authors have read and agreed to the published version of the manuscript.

Funding

This work was supported by the Open Project Funding of the Key Laboratory of Smart Farming Technology for Agricultural Animals, Ministry of Agriculture and Rural Affairs (Grant Number: KLSFTAA-KF001).

Institutional Review Board Statement

Not applicable.

Data Availability Statement

Dataset available on request from the authors.

Conflicts of Interest

The authors declare no conflicts of interest.

References

  1. Hao, W.; Han, W.; Han, M.; Li, F. A Novel Improved YOLOv3-SC Model for Individual Pig Detection. Sensors 2022, 22, 8792. [Google Scholar] [CrossRef] [PubMed]
  2. Xu, J.; Zhou, S.; Xu, A.; Ye, J.; Zhao, A. Automatic scoring of postures in grouped pigs using depth image and CNN-SVM. Comput. Electron. Agric. 2022, 194, 106746. [Google Scholar]
  3. Yang, Q.; Xiao, D. A review of video-based pig behavior recognition. Appl. Anim. Behav. Sci. 2020, 233, 105146. [Google Scholar] [CrossRef]
  4. Stukelj, M.; Hajdinjak, M.; Pusnik, I. Stress-free measurement of body temperature of pigs by using thermal imaging–Useful fact or wishful thinking. Comput. Electron. Agric. 2022, 193, 106656. [Google Scholar]
  5. Tran, D.D.; Thanh, N.D. Pig Health Abnormality Detection Based on Behavior Patterns in Activity Periods using Deep Learning. Int. J. Adv. Comput. Sci. Appl. 2023, 14. [Google Scholar] [CrossRef]
  6. Wang, S.; Jiang, H.; Qiao, Y.; Jiang, S.; Lin, H.; Sun, Q. The Research Progress of Vision-Based Artificial Intelligence in Smart Pig Farming. Sensors 2022, 22, 6541. [Google Scholar] [CrossRef]
  7. Verdon, M.; Morrison, R.S.; Rault, J.L. Sow and piglet behaviour in group lactation housing from 7 or 14 days post-partum. Appl. Anim. Behav. Sci. 2019, 214, 25–33. [Google Scholar]
  8. Verdon, M.; Morrison, R.S.; Rault, J.L. The welfare and productivity of sows and piglets in group lactation from 7, 10, or 14 d postpartum. J. Anim. Sci. 2020, 98, skaa037. [Google Scholar]
  9. Blavi, L.; Solà-Oriol, D.; Llonch, P.; López-Vergé, S.; Martín-Orúe, S.M.; Pérez, J.F. Management and feeding strategies in early life to increase piglet performance and welfare around weaning: A review. Animals 2021, 11, 302. [Google Scholar] [CrossRef]
  10. Liu, C.; Zhou, H.; Cao, J.; Guo, X.; Su, J.; Wang, L.; Lu, S.; Li, L. Behavior Trajectory Tracking of Piglets Based on DLC-KPCA. Agriculture 2021, 11, 843. [Google Scholar] [CrossRef]
  11. Gan, H.; Ou, M.; Huang, E.; Xu, C.; Li, S.; Li, J.; Liu, K.; Xue, Y. Automated detection and analysis of social behaviors among preweaning piglets using key point-based spatial and temporal features. Comput. Electron. Agric. 2021, 188, 106357. [Google Scholar] [CrossRef]
  12. Ding, Q.A.; Chen, J.; Shen, M.X.; Liu, L.S. Activity detection of suckling piglets based on motion area analysis using frame differences in combination with convolution neural network. Comput. Electron. Agric. 2022, 194, 106741. [Google Scholar]
  13. Yang, A.; Huang, H.; Yang, X.; Li, S.; Chen, C.; Gan, H.; Xue, Y. Automated video analysis of sow nursing behavior based on fully convolutional network and oriented optical flow. Comput. Electron. Agric. 2019, 167, 105048. [Google Scholar]
  14. Wang, Y.; Li, R.; Wang, Z.; Hua, Z.; Jiao, Y.; Duan, Y.; Song, H. E3D: An efficient 3D CNN for the recognition of dairy cow’s basic motion behavior. Comput. Electron. Agric. 2023, 205, 107607. [Google Scholar]
  15. Bianco, S.; Ciocca, G.; Napoletano, P.; Schettini, R. An interactive tool for manual, semi-automatic and automatic video annotation. Comput. Vis. Image Underst. 2015, 131, 88–99. [Google Scholar]
  16. Mamat, N.; Othman, M.F.; Abdulghafor, R.; Alwan, A.A.; Gulzar, Y. Enhancing image annotation technique of fruit classification using a deep learning approach. Sustainability 2023, 15, 901. [Google Scholar] [CrossRef]
  17. Saifullah, S.; Dreżewski, R.; Dwiyanto, F.A.; Aribowo, A.S.; Fauziah, Y.; Cahyana, N.H. Automated text annotation using a semi-supervised approach with meta vectorizer and machine learning algorithms for hate speech detection. Appl. Sci. 2024, 14, 1078. [Google Scholar] [CrossRef]
  18. Su, H.; Yao, Q.; Xiang, L.; Hu, A. Semi-supervised temporal meta learning framework for wind turbine bearing fault diagnosis under limited annotation data. IEEE Trans. Instrum. Meas. 2024, 73, 3512309. [Google Scholar] [CrossRef]
  19. Liu, S.; Zhao, C.; Zhang, H.; Li, Q.; Li, S.; Chen, Y.; Gao, R.; Wang, R.; Li, X. ICNet: A Dual-Branch Instance Segmentation Network for High-Precision Pig Counting. Agriculture 2024, 14, 141. [Google Scholar] [CrossRef]
  20. Xia, X.; Zhang, N.; Guan, Z.; Chai, X.; Ma, S.; Chai, X.; Sun, T. PAB-Mamba-YOLO: VSSM assists in YOLO for aggressive behavior detection among weaned piglets. Artif. Intell. Agric. 2025, 15, 52–66. [Google Scholar]
  21. Zhou, J.; Liu, L.; Jiang, T.; Tian, H.; Shen, M.; Liu, L. A Novel Behavior Detection Method for Sows and Piglets during Lactation Based on an Inspection Robot. Comput. Electron. Agric. 2024, 227, 109613. [Google Scholar]
  22. Luo, Y.; Lin, K.; Xiao, Z.; Lv, E.; Wei, X.; Li, B.; Lu, H.; Zeng, Z. PBR-YOLO: A lightweight piglet multi-behavior recognition algorithm based on improved yolov8. Smart Agric. Technol. 2025, 10, 100785. [Google Scholar] [CrossRef]
  23. Kim, J.; Suh, Y.; Lee, J.; Chae, H.; Ahn, H.; Chung, Y.; Park, D. EmbeddedPigCount: Pig counting with video object detection and tracking on an embedded board. Sensors 2022, 22, 2689. [Google Scholar] [CrossRef] [PubMed]
  24. Neyshabur, B.; Bhojanapalli, S.; McAllester, D.; Srebro, N. Exploring generalization in deep learning. In Proceedings of the 30th Annual Conference on Neural Information Processing Systems 2017, Long Beach, CA, USA, 4–9 December 2017; Advances in Neural Information Processing Systems. Volume 30. [Google Scholar]
  25. Northcutt, C.G.; Athalye, A.; Mueller, J. Pervasive label errors in test sets destabilize machine learning benchmarks. arXiv 2021, arXiv:2103.14749. [Google Scholar]
  26. Zhan, X.; Wang, Q.; Huang, K.H.; Xiong, H.; Dou, D.; Chan, A.B. A comparative survey of deep active learning. arXiv 2022, arXiv:2203.13450. [Google Scholar]
  27. Ren, S.; He, K.; Girshick, R.; Sun, J. Faster R-CNN: Towards real-time object detection with region proposal networks. Adv. Neural Inf. Process. Syst. 2015, 28, 1137–1149. [Google Scholar] [CrossRef]
  28. Liu, W.; Anguelov, D.; Erhan, D.; Szegedy, C.; Reed, S.; Fu, C.Y.; Berg, A.C. SSD: Single shot multibox detector. In Proceedings of the Computer Vision–ECCV 2016: 14th European Conference, Amsterdam, The Netherlands, 11–14 October 2016; Proceedings, Part I 14. Springer International Publishing: Berlin/Heidelberg, Germany, 2016; pp. 21–37. [Google Scholar]
  29. Redmon, J.; Farhadi, A. Yolov3: An incremental improvement. arXiv 2018, arXiv:1804.02767. [Google Scholar]
  30. Bochkovskiy, A.; Wang, C.Y.; Liao HY, M. Yolov4: Optimal speed and accuracy of object detection. arXiv 2020, arXiv:2004.10934. [Google Scholar]
  31. Law, H.; Deng, J. Cornernet: Detecting objects as paired keypoints. In Proceedings of the European Conference on Computer Vision (ECCV), Munich, Germany, 8–14 September 2018; pp. 734–750. [Google Scholar]
  32. Tian, Z.; Shen, C.; Chen, H.; He, T. Fcos: Fully convolutional one-stage object detection. In Proceedings of the IEEE/CVF International Conference on Computer Vision, Seoul, Republic of Korea, 27 October–2 November 2019; pp. 9627–9636. [Google Scholar]
  33. Zhou, X.; Wang, D.; Krähenbühl, P. Objects as points. arXiv 2019, arXiv:1904.07850. [Google Scholar]
  34. Nie, L.; Li, B.; Jiao, F.; Shao, J.; Yang, T.; Liu, Z. ASPP-YOLOv5: A study on constructing pig facial expression recognition for heat stress. Comput. Electron. Agric. 2023, 214, 108346. [Google Scholar]
  35. Zeng, F.; Li, B.; Wang, H.; Zhu, J.; Jia, N.; Zhao, Y.; Zhao, W. Detection of calf abnormal respiratory behavior based on frame difference and improved YOLOv5 method. Comput. Electron. Agric. 2023, 211, 107987. [Google Scholar]
  36. Xu, C.; Wang, Z.; Du, R.; Li, Y.; Li, D.; Chen, Y.; Li, W.; Liu, C. A method for detecting uneaten feed based on improved YOLOv5. Comput. Electron. Agric. 2023, 212, 108101. [Google Scholar]
  37. Shang, Y.; Xu, X.; Jiao, Y.; Wang, Z.; Hua, Z.; Song, H. Using lightweight deep learning algorithm for real-time detection of apple flowers in natural environments. Comput. Electron. Agric. 2023, 207, 107765. [Google Scholar]
  38. Cacciarelli, D.; Kulahci, M. A survey on online active learning. arXiv 2023, arXiv:2302.08893. [Google Scholar]
  39. Yu, W.; Zhu, S.; Yang, T.; Chen, C. Consistency-based active learning for object detection. In Proceedings of the IEEE/CVF Conference on Computer Vision and Pattern Recognition, New Orleans, LA, USA, 18–24 June 2022; pp. 3951–3960. [Google Scholar]
  40. Gan, H.; Ou, M.; Li, C.; Wang, X.; Guo, J.; Mao, A.; Ceballos, M.C.; Parsons, T.D.; Liu, K.; Xue, Y. Automated detection and analysis of piglet suckling behaviour using high-accuracy amodal instance segmentation. Comput. Electron. Agric. 2022, 199, 107162. [Google Scholar]
Figure 1. Data collection system.
Agriculture 15 00696 g001
Figure 2. Examples of images of datasets. (a) “jj” represents Jingjiang Pig Farm; (b) “sq” represents Suqian Pig Farm; (c) “sy” represents Sheyang Pig Farm; (d) “dy” represents Danyang Pig Farm.
Agriculture 15 00696 g002
Figure 3. Training process of piglet detection model based on semi-automatic labeling.
Agriculture 15 00696 g003
Figure 4. Damaged images due to data transmission issues.
Agriculture 15 00696 g004
Figure 5. Training results for the “jj” dataset, where (a) represents the training results for precision, and (b) represents the training results for recall.
Agriculture 15 00696 g005
Figure 6. Training results for the “sq” dataset, where (a) represents the training results for precision, and (b) represents the training results for recall.
Agriculture 15 00696 g006
Figure 7. Training results for the “sy” dataset, where (a) represents the training results for precision, and (b) represents the training results for recall.
Agriculture 15 00696 g007
Figure 8. Training results for the “sqsy” dataset, where (a) represents the training results for precision, and (b) represents the training results for recall.
Agriculture 15 00696 g008
Figure 9. Training results for the “sqjj” dataset, where (a) represents the training results for precision, and (b) represents the training results for recall.
Agriculture 15 00696 g009
Figure 10. Training results for the “syjj” dataset, where (a) represents the training results for precision, and (b) represents the training results for recall.
Agriculture 15 00696 g010
Figure 11. Training results for the “sqsyjj” dataset, where (a) represents the training results for precision, and (b) represents the training results for recall.
Agriculture 15 00696 g011
Figure 12. Visualization of model test results. Piglet detection results under various lighting conditions. Red markings indicate missed detections. The pre-labeled model performed well in normal light but struggled in extreme lighting, while the manually calibrated model provided more precise bounding boxes.
Agriculture 15 00696 g012
Figure 13. Experimental results of our method under various dataset compositions, including different pig farm data combinations and train-validation splits.
Agriculture 15 00696 g013
Figure 14. Impact of the method in this paper on different segmentation models. To validate the generalizability of the proposed method, piglet segmentation was performed using four mainstream segmentation models combined with a GAN network. The proposed method accurately outlines piglet contours across various groups, reducing manual labeling efforts while preserving segmentation accuracy. Pre-trained models predicted contours on a larger dataset, which were then manually refined, leading to a GAN-integrated segmentation model that performs well even under occlusion conditions.
Agriculture 15 00696 g014
Table 1. For the training effect and testing effect of a single pig farm dataset, the ratio of training set to validation set was 9:1 (The bolded numerical values indicate the maximum values).
DatasetsPrecision
(Train|Test)
Recall
(Train|Test)
Map 0.5
(Train|Test)
Map 0.95
(Train|Test)
jj20000.950|0.4870.926|0.3810.958|0.3450.573|0.146
jj30000.951|0.4740.929|0.4060.964|0.3680.605|0.164
jj40000.958|0.5190.949|0.4070.973|0.3940.635|0.184
jj50000.959|0.4890.941|0.3640.974|0.3550.645|0.158
jj60000.955|0.5390.945|0.4200.975|0.4120.652|0.196
sq20000.939|0.7610.891|0.6760.939|0.7050.473|0.296
sq30000.937|0.8050.911|0.7010.945|0.7550.507|0.343
sq40000.934|0.8610.917|0.7260.948|0.8140.515|0.404
sq50000.937|0.8550.933|0.7310.953|0.8130.530|0.411
sq60000.944|0.8690.923|0.7870.957|0.8520.543|0.444
sy20000.921|0.7540.862|0.6080.937|0.6720.509|0.339
sy30000.925|0.7710.884|0.6380.946|0.6390.532|0.334
sy40000.926|0.7550.892|0.6290.951|0.6950.547|0.365
sy50000.930|0.7890.900|0.6220.955|0.7100.561|0.377
sy60000.938|0.7780.895|0.6500.955|0.7190.562|0.379
Table 2. For the training effect and testing effect of a single pig farm dataset, the ratio of training set to validation set was 8:2 (The bolded numerical values indicate the maximum values).
DatasetPrecision
(Train|Test)
Recall
(Train|Test)
Map 0.5
(Train|Test)
Map 0.95
(Train|Test)
jj20000.942|0.5440.923|0.3940.955|0.3850.573|0.157
jj30000.949|0.5630.925|0.4180.960|0.4280.612|0.195
jj40000.949|0.4860.935|0.3900.968|0.3610.625|0.158
jj50000.950|0.5170.937|0.3730.969|0.3730.628|0.165
jj60000.954|0.4800.944|0.4160.973|0.3720.643|0.172
sq20000.928|0.8090.884|0.7070.929|0.7630.458|0.361
sq30000.934|0.8070.898|0.7160.941|0.7650.485|0.369
sq40000.935|0.8110.917|0.7260.945|0.7780.511|0.361
sq50000.919|0.8350.904|0.7440.934|0.8130.479|0.401
sq60000.929|0.8570.877|0.7260.933|0.8050.490|0.409
sy20000.918|0.7570.877|0.5850.934|0.6460.504|0.327
sy30000.930|0.6970.882|0.5770.944|0.6230.529|0.313
sy40000.935|0.7760.901|0.6140.954|0.6910.549|0.360
sy50000.928|0.7760.910|0.6360.951|0.7110.556|0.380
sy60000.928|0.7870.900|0.6150.950|0.6980.559|0.376
Table 3. For the training effect and testing effect of multi pig farms dataset, the ratio of training set to validation set was 9:1 (The bolded numerical values indicate the maximum values).
DatasetsPrecision
(Train|Test)
Recall
(Train|Test)
Map 0.5
(Train|Test)
Map 0.95
(Train|Test)
sqjj40000.943|0.8110.915|0.6850.953|0.7550.534|0.382
sqjj60000.945|0.8360.927|0.7580.956|0.8190.557|0.454
sqjj80000.940|0.8470.931|0.7600.958|0.8270.562|0.465
sqjj100000.946|0.8720.936|0.7530.964|0.8360.601|0.475
sqjj120000.946|0.8890.928|0.7920.965|0.8710.608|0.506
sqsy40000.931|0.8900.899|0.7960.946|0.8710.513|0.495
sqsy60000.936|0.8990.911|0.8050.951|0.8870.537|0.518
sqsy80000.938|0.8970.909|0.8240.953|0.8950.546|0.523
sqsy100000.933|0.9140.915|0.8170.955|0.8900.549|0.510
sqsy120000.938|0.9090.916|0.8380.960|0.9110.563|0.529
syjj40000.938|0.7900.902|0.6790.958|0.7470.552|0.423
syjj60000.930|0.8420.914|0.6870.959|0.7730.583|0.438
syjj80000.939|0.8490.916|0.7280.963|0.8130.594|0.461
syjj100000.939|0.8550.918|0.6860.965|0.7970.618|0.472
syjj120000.940|0.8520.917|0.7170.966|0.8210.619|0.487
sqsyjj60000.937|0.8720.916|0.8090.954|0.8710.541|0.523
sqsyjj90000.933|0.8910.918|0.8330.956|0.8970.561|0.544
sqsyjj120000.936|0.9060.924|0.8290.958|0.9010.571|0.550
sqsyjj150000.939|0.9140.919|0.8240.962|0.9030.578|0.558
sqsyjj180000.941|0.9210.920|0.8400.964|0.9190.604|0.562
Table 4. For the training effect and testing effect of multi pig farms dataset, the ratio of training set to validation set was 8:2 (The bolded numerical values indicate the maximum values).
DatasetsPrecision
(Train|Test)
Recall
(Train|Test)
Map 0.5
(Train|Test)
Map 0.95
(Train|Test)
sqjj40000.935|0.8230.910|0.7280.944|0.7890.521|0.414
sqjj60000.942|0.8210.922|0.7070.953|0.7710.549|0.393
sqjj80000.939|0.8690.928|0.7670.958|0.8410.562|0.464
sqjj100000.935|0.8120.920|0.7210.955|0.7720.573|0.432
sqjj120000.937|0.8730.901|0.7830.952|0.8590.582|0.496
sqsy40000.927|0.8760.896|0.8020.939|0.8690.500|0.493
sqsy60000.933|0.8940.899|0.8080.948|0.8770.525|0.503
sqsy80000.939|0.8870.908|0.8220.953|0.8930.543|0.533
sqsy100000.929|0.8850.908|0.8170.949|0.8910.533|0.530
sqsy120000.931|0.9180.890|0.8200.948|0.9030.536|0.523
syjj40000.938|0.7820.895|0.6610.950|0.7340.549|0.411
syjj60000.933|0.8130.906|0.7010.957|0.7720.576|0.437
syjj80000.935|0.8310.914|0.7200.959|0.8050.588|0.462
syjj100000.937|0.8400.916|0.6820.961|0.7870.612|0.466
syjj120000.940|0.8580.911|0.6930.961|0.8010.613|0.482
sqsyjj60000.932|0.8780.909|0.8010.947|0.8680.533|0.521
sqsyjj90000.933|0.8770.912|0.8340.956|0.8840.555|0.545
sqsyjj120000.934|0.8960.911|0.7900.954|0.8770.566|0.560
sqsyjj150000.933|0.8860.911|0.8040.956|0.8880.579|0.572
sqsyjj180000.935|0.9210.901|0.8240.957|0.9100.585|0.582
Table 5. The results of training and testing for Danyang dataset.
DatasetsPrecision
(Train|Test)
Recall
(Train|Test)
Map 0.5
(Train|Test)
Map 0.95
(Train|Test)
dy5000_910.967|0.9660.949|0.9410.977|0.9770.689|0.678
dy5000_820.968|0.9630.952|0.9380.979|0.9770.696|0.678
Disclaimer/Publisher’s Note: The statements, opinions and data contained in all publications are solely those of the individual author(s) and contributor(s) and not of MDPI and/or the editor(s). MDPI and/or the editor(s) disclaim responsibility for any injury to people or property resulting from any ideas, methods, instructions or products referred to in the content.

