Article

Preparation of Phosphogypsum–Bentonite-Based Slow-Release Potassium Magnesium Sulfate Fertilizer

1
School of Chemistry and Chemical Engineering, Chongqing University, Chongqing 400044, China
2
SDIC Xinjiang Luobupo Postash Co., Ltd., Hami 839099, China
*
Author to whom correspondence should be addressed.
Agriculture 2025, 15(7), 692; https://doi.org/10.3390/agriculture15070692
Submission received: 12 February 2025 / Revised: 20 March 2025 / Accepted: 21 March 2025 / Published: 25 March 2025
(This article belongs to the Section Agricultural Soils)

Abstract

:
The application of slow-release fertilizers is essential for improving fertilizer utilization efficiency and promoting sustainable agricultural development. Unlike traditional single organic polymer-coated or inorganic-coated fertilizers, this study utilized biodegradable modified polyvinyl alcohol (PVA) as a binder and cheap, readily available phosphogypsum–bentonite as an inorganic coating material to develop a novel slow-release potassium magnesium sulfate fertilizer (SRPMSF). This study initially examined the influence of SA dosage on PVA properties. XRD, FTIR, TGA, and water resistance analyses revealed that sodium alginate exhibits good compatibility with polyvinyl alcohol, enhancing its heat and water resistance. Ultimately, PVA–SA-2 (1.2% sodium alginate) was chosen as the optimal binder for SRPMSF production. Furthermore, this study investigated the impact of bentonite on the physical and slow-release properties of the SRPMSF by varying the phosphogypsum-to-bentonite ratio. This experiment included five treatment methods: the treatments consist of SRPMSF-1 (0 g bentonite), SRPMSF-2 (phosphogypsum/bentonite ratio of 4:1), SRPMSF-3 (3:2), SRPMSF-4 (2:3), and SRPMSF-5 (1:4). A control group (PMSF) was also included. The results indicated that, as the bentonite content increased, both the particle size and compressive strength of the coated slow-release fertilizer increased, with the SRPMSF particle sizes ranging from 3.00 to 4.50 mm. The compressive strength of the SRPMSF ranged from 20.85 to 43.78 N, meeting the requirements for industrial production. The soil column leaching method was employed to assess the nutrient release rate of the fertilizers. The experimental results indicated that, compared to the PMSF, the SRPMSF effectively regulated nutrient release. Pot experiments demonstrated that the SRPMSF significantly enhanced garlic seedling growth compared to the PMSF. In conclusion, a new type of slow-release fertilizer with good slow-release performance is prepared in this paper, which can improve the utilization rate of fertilizer and reduce the economic loss and is conducive to the sustainable development of agriculture.

1. Introduction

According to statistical data, under normal conditions, the seasonal utilization rates of fertilizers are 25–40% for nitrogen, 10–25% for phosphorus, and 30–50% for potassium [1]. The low utilization rate of fertilizers not only leads to resource waste but also contributes to environmental pollution. Compared with traditional fertilizers, slow-release fertilizers can improve nutrient utilization efficiency and minimize nutrient loss to the greatest extent possible [2]. The production of slow-release fertilizers is gradually becoming industrialized [3,4,5,6], but most commercial slow-release fertilizer coatings are made of thermoplastic and thermosetting resins, which are expensive and difficult to degrade, and long-term use may cause harm to soil structure [7]. At present, the research on slow-release fertilizers mainly focuses on nitrogen-based formulas [8,9], with limited research on phosphorus, potassium, and trace elements. Therefore, there are few commercially available types of slow-release fertilizers on the market.
Polyvinyl alcohol (PVA) is a water-soluble, biodegradable polymer produced by the hydrolysis of polyvinyl acetate under strong alkaline conditions. Its molecular structure contains numerous hydrophilic hydroxyl groups and intermolecular crosslinks, forming a macromolecular network that can fully degrade into H2O and CO2 [10,11,12]. PVA is known for its excellent biocompatibility, biodegradability, film-forming abilities, gas barrier properties, biophilicity, and mechanical strength [13], making it widely applicable in fields such as biomedicine, food, construction, aerospace, and aviation. However, PVA films exhibit high water absorption, which weakens their mechanical properties [14], thereby reducing the efficacy of slow-release fertilizers coated directly with PVA. Consequently, modifying PVA is essential [15,16,17,18]. Sodium alginate (SA) has favorable biocompatibility and biodegradability [19], but its membranes degrade quickly and lack mechanical strength. PVA, with its abundant hydroxyl groups, can form hydrogen bonds with the carboxyl groups in SA, enhancing water resistance when the two materials are combined into a composite film [20,21].
Phosphogypsum is a by-product generated from the production of phosphoric acid via the wet-process sulfuric acid method. Due to high by-product output and impurities, it is challenging to use phosphogypsum directly, leading to the storage of large quantities. This storage consumes extensive land and poses environmental risks, contaminating soil, groundwater, surface water, and even the atmosphere. Despite these challenges, phosphogypsum contains valuable resources, including sulfur, calcium, phosphorus, and silicon, which are often wasted as solid waste [22,23]. Notably, phosphogypsum is rich in calcium, an essential nutrient that plays a critical role in plant physiology [24]. Studies indicate that phosphogypsum and gypsum are more effective than pyrite in supplying sulfur to crops, enhancing yield and quality [25], and significantly affecting the bioavailability of phosphorus and sulfur [26]. Phosphogypsum has increasingly been utilized in fertilizer production [27,28,29,30,31,32,33]; for example, sulfur-containing ammonium phosphate is produced by incorporating phosphogypsum in large ammonium phosphate plants [34]. Consequently, using phosphogypsum as a coating material for slow-release fertilizers not only offers a sustainable method for its utilization but also enhances fertilizer efficiency and improves soil physicochemical properties. Hilton et al. (2006) applied phosphogypsum as a fertilizer at rates of 100–600 kg/ha and observed significant yield increases in 50 crops [35]. Mesic et al. (2001) reported that phosphogypsum application enhanced maize and winter wheat yields by 10–15% [36]. Sorato et al. (2008) investigated the effects of phosphogypsum on rice and soybeans, demonstrating that it positively influenced sulfur content in leaves and overall yield while also significantly increasing zinc content in leaves when combined with lime [37]. Ghazi et al. (2002) concluded that phosphogypsum enhances soil micronutrient concentrations and significantly improves crop yields in peanuts, fruit trees, rice, maize, and meadowsweet [38]. Michalovicz et al. (2019) demonstrated that Ca and S content in corn, wheat, barley, and bean leaves was improved, while Mg content decreased after PG application [39].
Phosphogypsum has a large particle size and loose texture. Suppose phosphogypsum is used alone as a coating material. In that case, the sealing performance of the prepared fertilizer particles will be poor, the film layer will easily fall off, and the nutrient dissolution rate will be fast. Bentonite has unique properties such as water absorption, expansion, dispersion, suspension, ion exchange, and adsorption. It is widely used as a carrier for slow-release fertilizers to improve the particle strength and slow-release performance of fertilizers [40]. Therefore, compounding phosphogypsum with bentonite can improve the sealing performance of phosphogypsum as a coating material [41].
This study aimed to develop a novel slow-release potassium magnesium sulfate fertilizer (SRPMSF) using modified PVA as a binder and phosphogypsum–bentonite as coating materials to regulate nutrient release. We hypothesized that the SRPMSF would slow the nutrient release of potassium magnesium sulfate compared to a conventional potassium magnesium sulfate fertilizer (PMSF), thereby promoting plant growth. Five different SRPMSF formulations were prepared [42], and their physical properties were analyzed, including particle size distribution, wear resistance, and compressive strength. The soil column leaching experiment confirmed that the SRPMSF effectively controlled nutrient release. Finally, pot experiments with garlic sprouts demonstrated its positive impact on plant growth and development. The SRPMSF preparation process developed in this study is simple and cost-effective, offering a novel solution to the challenges of limited slow-release fertilizer types, high costs, and complex manufacturing methods.

2. Materials and Methods

2.1. Preparation of PVA–SA

Polyvinyl alcohol (PVA) (MACKLIN Biochemical Technology Co., Ltd., Chongqing, China) film exhibits high water absorption. To enhance its water resistance, this study modified PVA using sodium alginate (SA) (MACKLIN Biochemical Technology Co., Ltd., Chongqing, China). In this study, modified PVA was utilized as a binder. Five different PVA–SA adhesives were formulated by varying the sodium alginate dosage, and the PVA–SA with different amounts of sodium alginate added are shown in Table 1.
Polyvinyl alcohol modification was conducted in a digitally controlled constant-temperature water bath (Shanghai Lichen Bangxi Instrument Technology Co., Ltd., Shanghai, China). An amount of polyvinyl alcohol (8%) and distilled water was added to a three-necked flask equipped with a stirrer, condenser, and thermometer. The solution was heated to 90 °C until the polyvinyl alcohol was fully dissolved [43] and then cooled to 60 °C [44,45]. Varying amounts of sodium alginate were then added (Table 1), and the mixture was stirred at a constant temperature for 3 h. The PVA–SA solution was poured into a mold and dried at 60 °C to form a thin film. The best PVA–SA was selected from these five formulas and used in the preparation of the SRPMSF.

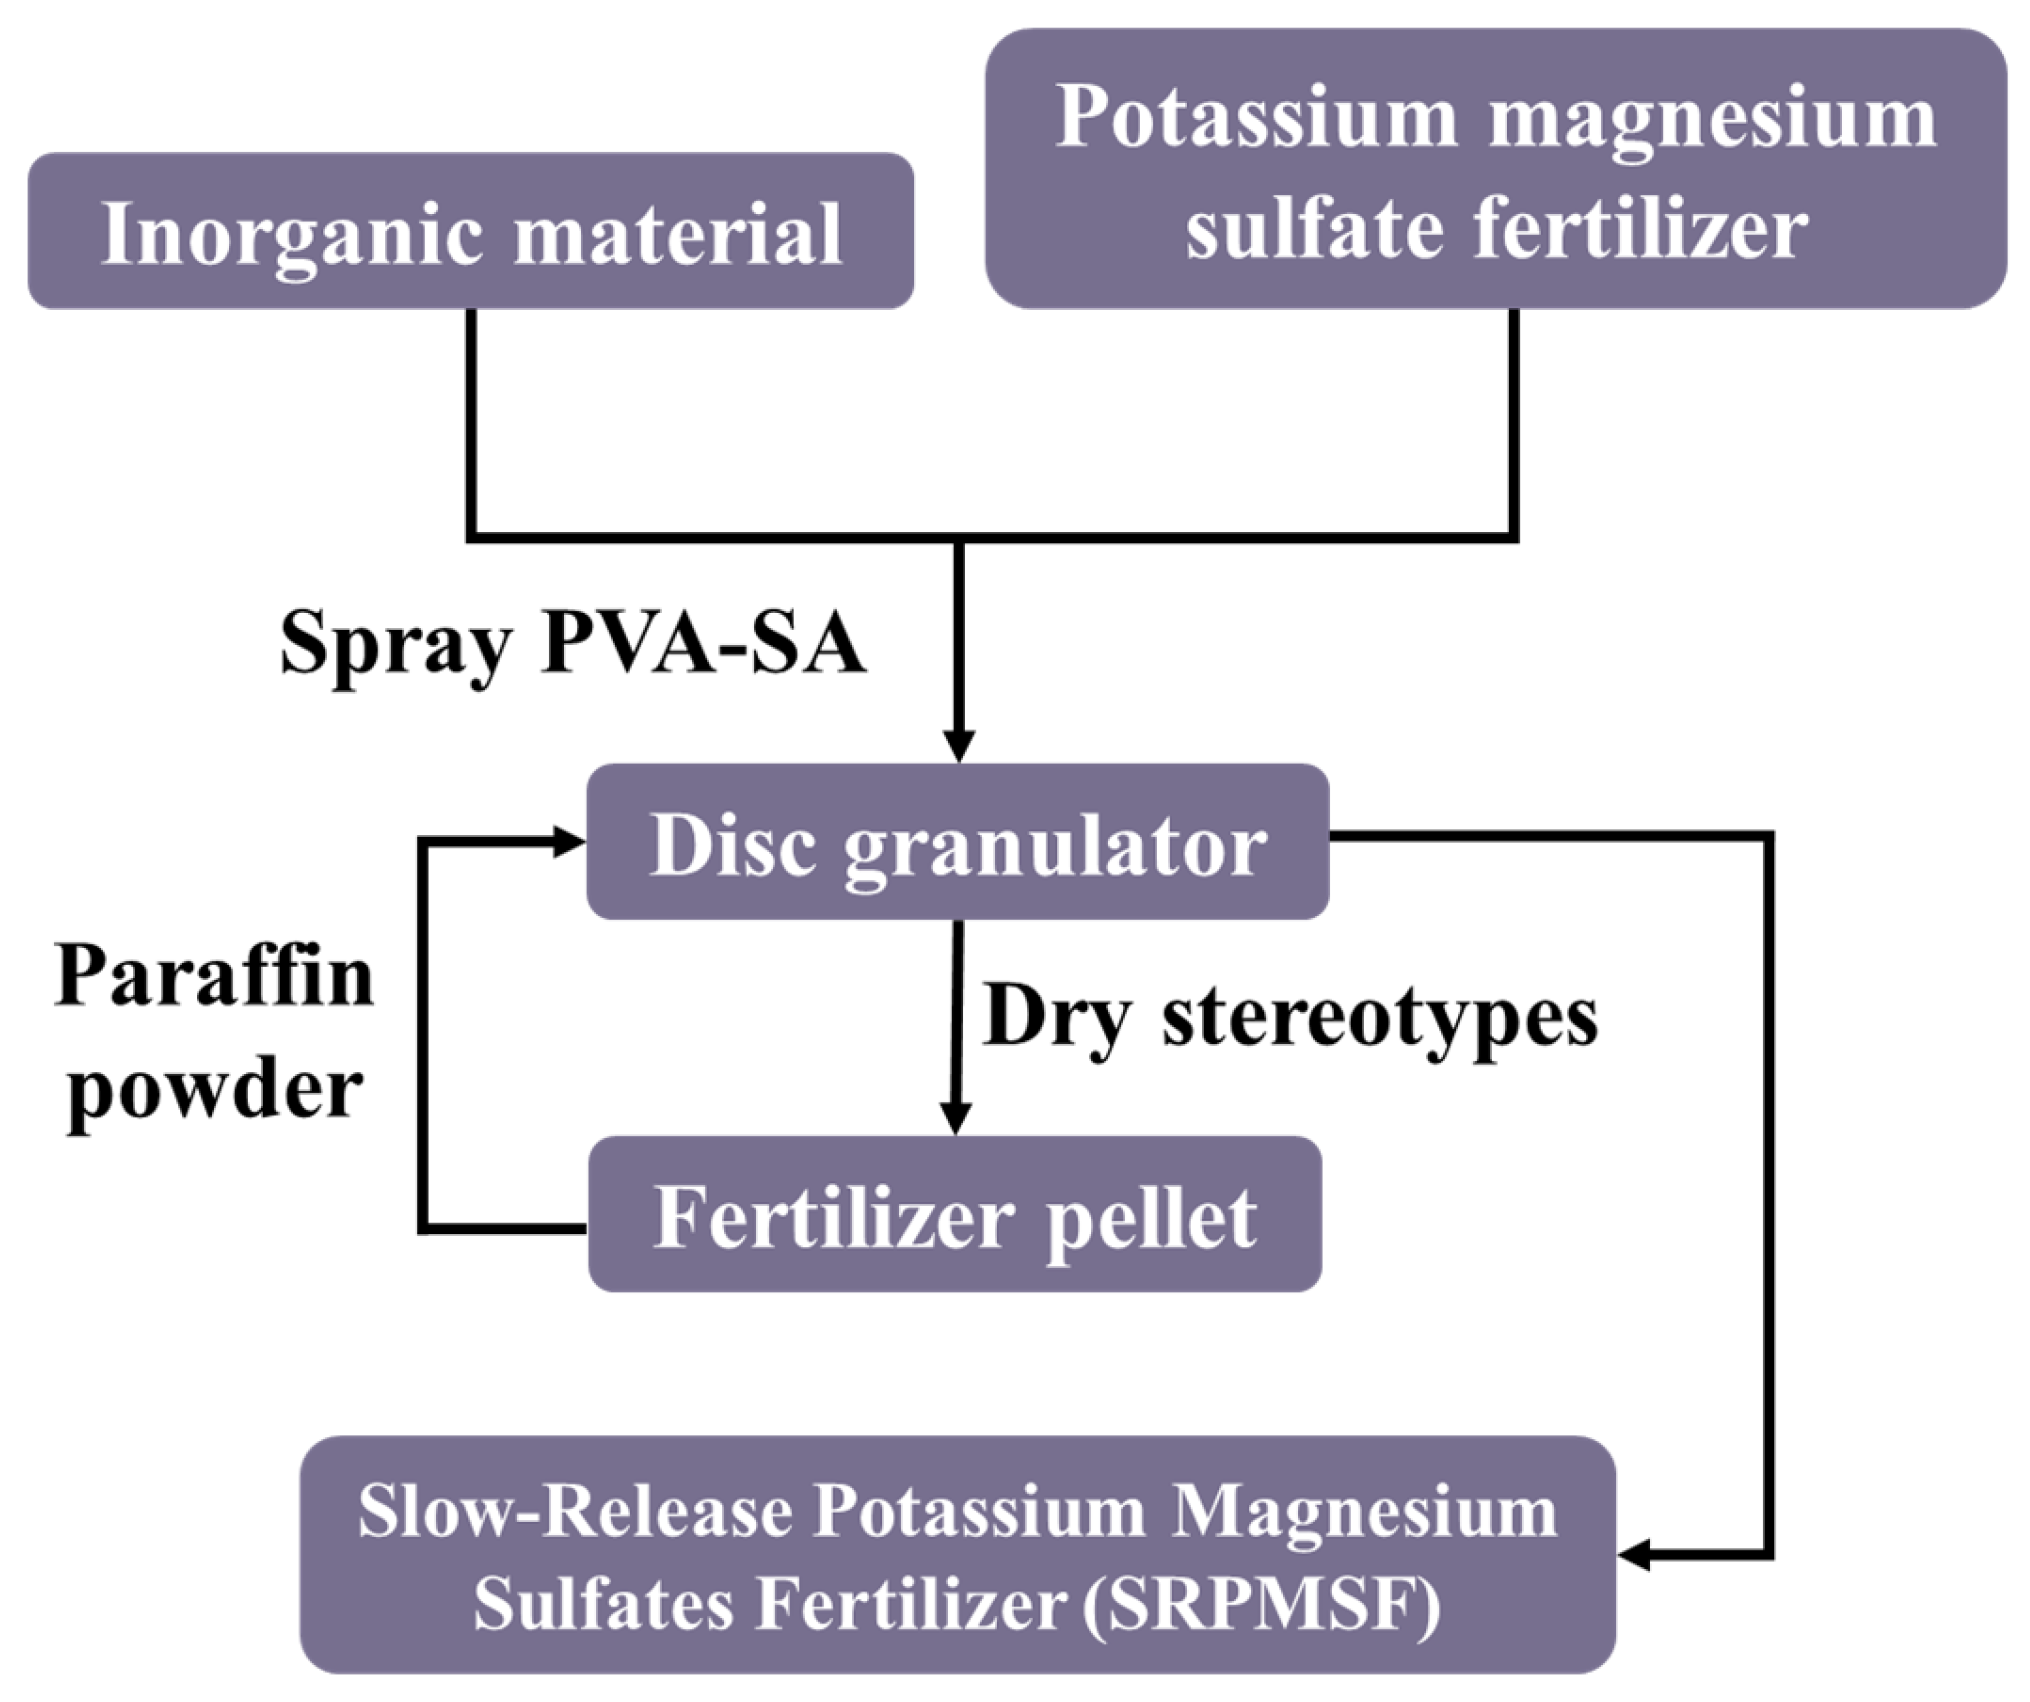
2.2. Preparation of the SRPMSF

To examine the influence of phosphogypsum (Hubei Xingfa Co., Ltd., Yidu, China) and bentonite (Xincheng Mineral Resources Co., Ltd., Shijiazhuang, China) dosage on the performance of the SRPMSF, this experiment includes five treatment methods: the treatments consist of SRPMSF-1 (0 g bentonite), SRPMSF-2 (phosphogypsum/bentonite ratio of 4:1), SRPMSF-3 (3:2), SRPMSF-4 (2:3), and SRPMSF-5 (1:4). A control group (PMSF) was also included (Table 2).
To prepare the five composite fertilizers (Table 2), first, PMSF(SDIC Xinjiang Luobupo Postash Co., Ltd., Hami, China), phosphogypsum, and bentonite, according to Table 2, were separately weighed and premixed, to which 20 mL water at a temperature of 25 °C was added. One-third of the mixed material was placed into the disc granulator (Hua Casting Machinery, 30 cm, Zhengzhou, China), and the speed was set to 40 rpm. While intermittently spraying PVA–SA, the remaining mixed material was gradually added to the granulator. The formed fertilizer was then dried in an oven at 60 °C, and particles with a size range of 1.5–4.5 mm were screened out after cooling. The remaining particles were crushed, mixed with a small amount of water, and stirred evenly. The process was repeated until all particles achieved the desired intermediate size. Before sealing with paraffin, the radiation heating baking lamp (Shenzhen Anhongda Optoelectronics Technology Co., Ltd., Shenzhen, China) was preheated for 5 min. The particles were placed into the disc granulator. Under the heating lamp, the paraffin (Zhengmei Engineering Plastic Co., Ltd., Ningbo, China) melted and adhered to the outermost layer of the fertilizer particles. After processing, the equipment was turned off, and the prepared fertilizers were placed into a sealed bag. The specific preparation process is illustrated in Figure 1. The operational parameters are tabulated in Table 3. All raw materials involved in this study are listed in Table 4.

2.3. Characterization of PVA–SA
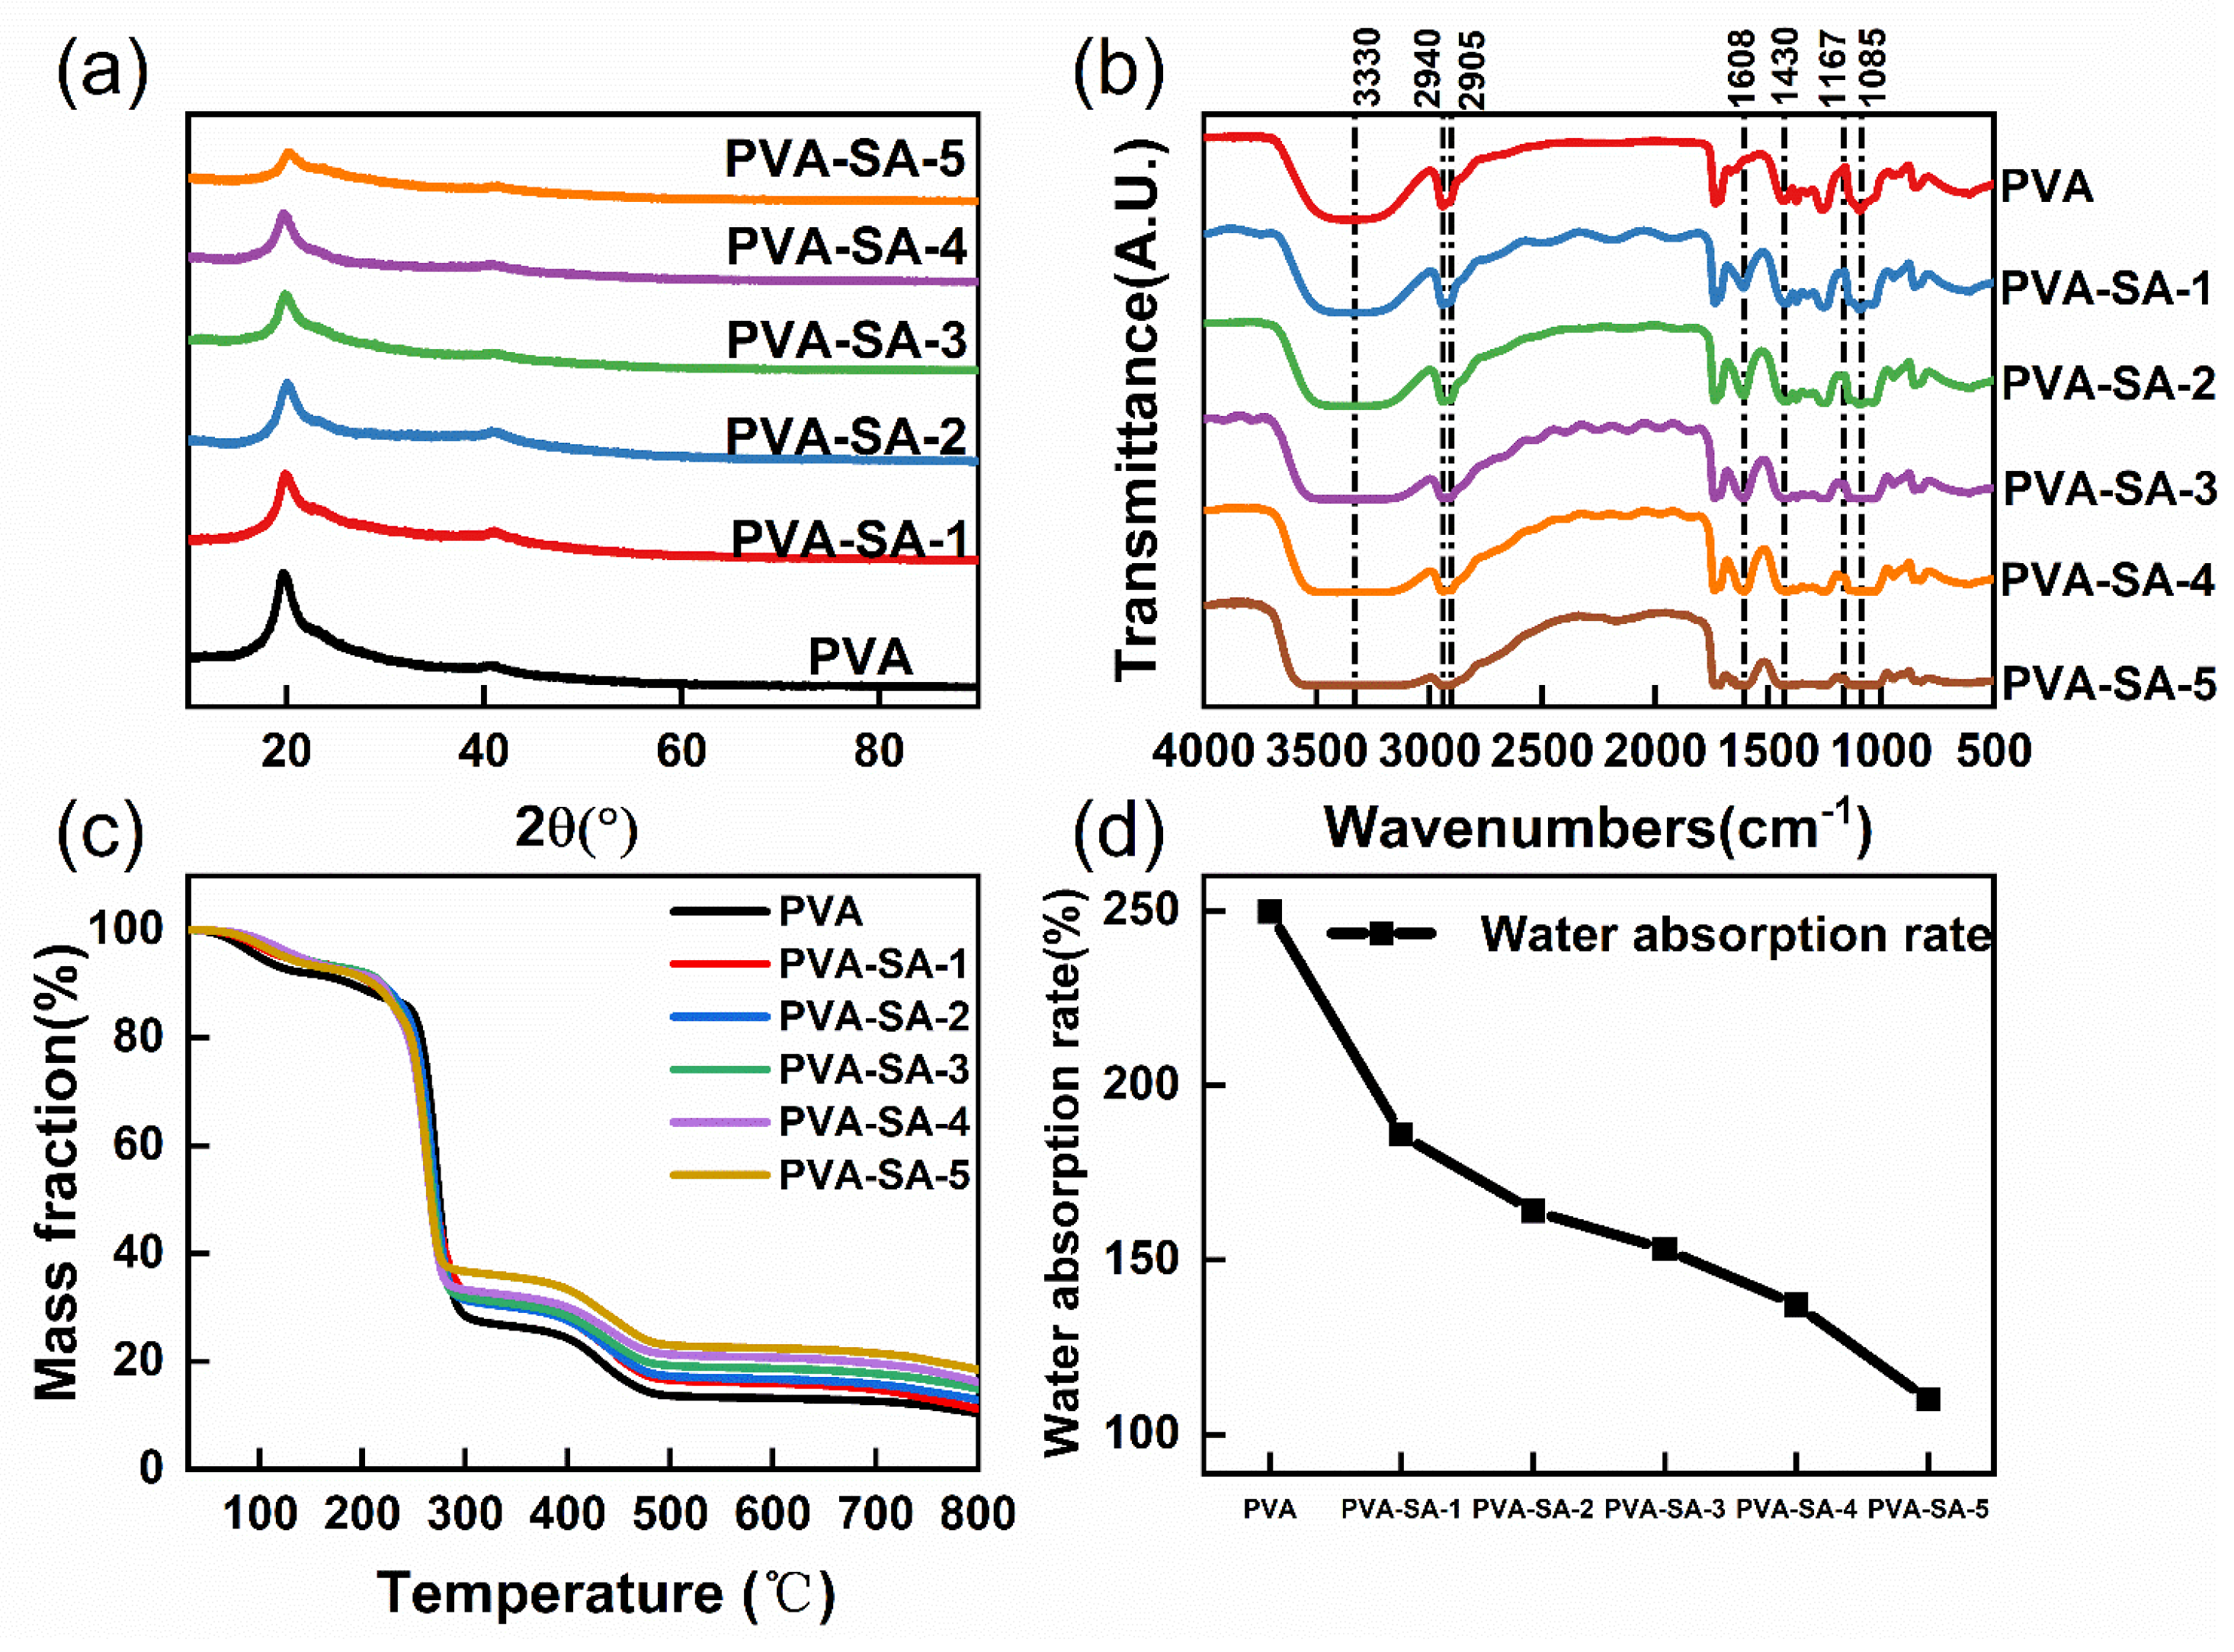
2.3.1. XRD Analysis

In this study, an XRD-6100 X-ray diffractometer (Shimadzu Productions, Kyoto, Japan) was used to conduct a phase analysis of the polyvinyl alcohol-modified films. By analyzing the position and intensity of the characteristic peaks in the diffraction pattern, the crystal phases present in the sample and their relative contents were determined, allowing for the evaluation of changes in the crystal structure of PVA–SA during the modification process. The basic parameters were the following: scanning range of 5–90°, scanning speed of 10°/min, working step size of 0.02°/s, Cu Ka target with λ = 0.1542 nm, and tube voltage and tube current of 40 kV and 40 mA, respectively.

2.3.2. FTIR Analysis

An IRPrestige-21 Fourier Transform Infrared (FTIR) Spectrometer (Hitachi Ltd., Tokyo, Japan) was used to characterize the structure of PVA–SA. Accurate measurements were conducted within the wavelength range of 4000–400 cm−1, identifying functional groups and chemical bond information in the sample through the analysis of characteristic absorption peak positions and intensities.

2.3.3. TGA Analysis

A TGA-2 thermogravimetric analyzer (METTLER TOLEDO, Zurich, Switzerland) was used to assess the thermal stability of PVA–SA. The experiment was conducted under a nitrogen atmosphere at a heating rate of 10 °C/min, ranging from room temperature (25 °C) to 800 °C. By analyzing the temperature-dependent mass loss curve, key parameters, including the thermal decomposition temperature and weight loss rate at each stage, were accurately determined.

2.3.4. Water Absorption Test

The PVA–SA membrane was cut into 3 cm × 3 cm at room temperature, weighed and immersed in water for 24 h, and then taken out, and the membrane surface moisture was absorbed with filter paper and weighed again. The wear resistance was determined according to Equation (1). This procedure was repeated five times for each treatment, and the average value was calculated.
Water   absorption   rate = W 2 W 1 W 1 × 100 %
where W 1 is the weight before water absorption, g; and W 2 is the weight after water absorption, g.

2.4. Determination of the SRPMSF Fertilizer Performance

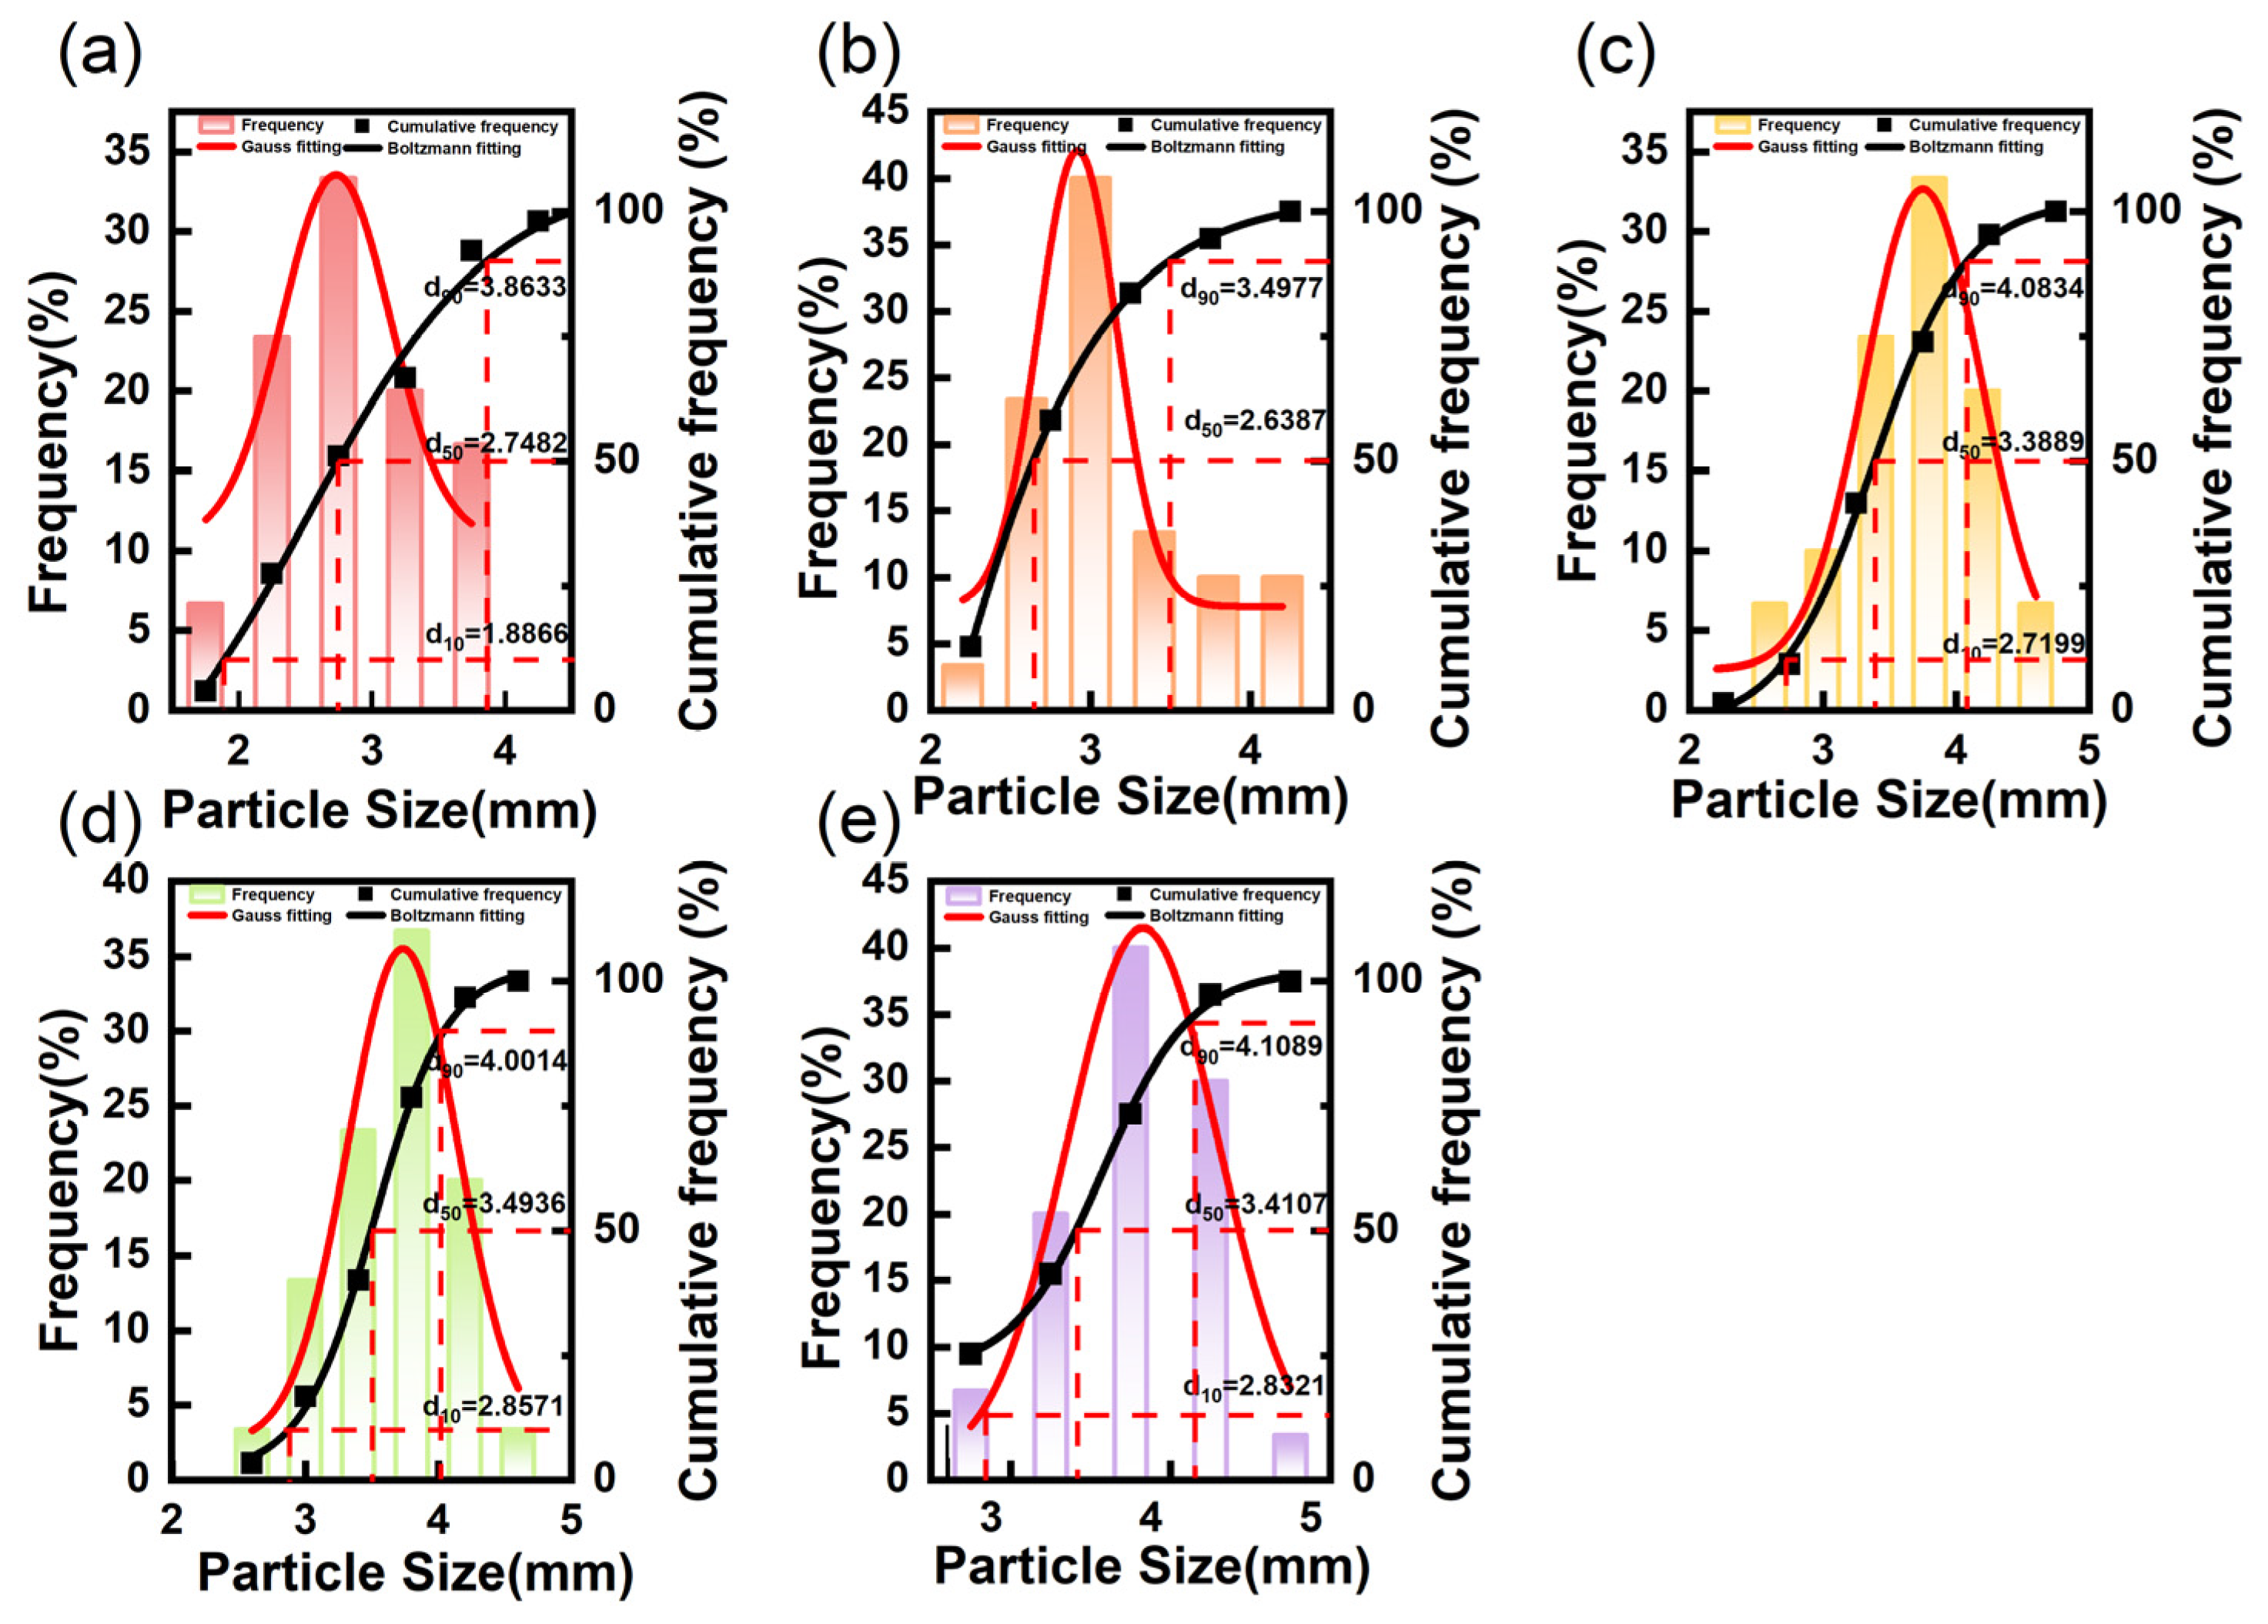
2.4.1. Particle Size Distribution

The uniformity of fertilizer particles is a crucial criterion for evaluating fertilizer quality. To analyze the particle size distribution of the prepared fertilizer, 30 fertilizer particles were randomly selected for each treatment. The size of each particle was measured using vernier calipers. From these measurements, the average particle size and the standard deviation of the fertilizer particles were calculated according to Equation (2). The particle size distribution of the fertilizer particles was plotted as a bar chart in Origin 2021 and fitted with a normal distribution.
Coefficient   of   variation = σ μ × 100 %
where σ is the mean value of the particle size and μ is the standard deviation.

2.4.2. Compressive Strength and Wear Resistance Test

The higher the compressive strength and wear resistance of fertilizers, the greater their hardness, which is more conducive to storage and transportation. Therefore, the compressive strength and wear resistance of the SRPMSF were tested to evaluate its hardness.
Compressive Strength Evaluation: Fertilizer particles were randomly selected, and the compressive strength of each particle was measured using a texture analyzer (SKZ-500) at room temperature. This procedure was repeated five times for each treatment, and the average value was calculated.
Wear Resistance Test: Wear resistance was evaluated by calculating the residual weight ratio, which represents the mass ratio of the coated fertilizer particles after the wear resistance test to their mass before the test. The experimental procedure was as follows. A total of 2.00 g of the prepared fertilizer particles was weighed and placed in a 50 mL conical flask. Five steel balls were added to the mixture, and the flask was sealed. The flask was then placed on a shaking table set to 250 rpm for 30 min. After the test, the particles were sieved using a 1.50 mm stainless steel mesh. The remaining fertilizer particles were weighed, and the wear resistance was analyzed based on the residual weight ratio according to Equation (3). This procedure was repeated five times for each treatment, and the average value was calculated.
Residual   weight   ratio = M 2 M 1 × 100 %
where M 1 is the mass before oscillation, g; and M 2 is the mass after oscillation, g.

2.4.3. Soil Column Leaching Experiments

Leaching Device: The soil was collected from a rural area in Huaian, Jiangsu Province, China. After collection, the soil was sieved through a 2 mm mesh and air-dried at room temperature for three days. Quartz sand (50–80 mesh) was purchased from Chongqing McLean Technology Co., Ltd., Chongqing, China. (CAS: 14808-60-7). The 500 mL empty water bottles were repurposed as the leaching columns. Two layers of 200-mesh nylon netting were placed at the bottom of the bottle, followed by a medium-speed qualitative filter paper to seal the bottom, which was secured tightly with rope. First, 50 g of quartz sand was added to the bottom, followed by 200 g of a 5 g fertilizer–soil mixture. To prevent disturbance of the soil layer, an additional 100 g of quartz sand was added on top of the fertilizer–soil mixture. Once assembled, distilled water was added to saturate the soil until it reached full water content. The soil column was allowed to equilibrate and stabilize for 24 h. After this period, 50 mL of deionized water was added to each soil column for leaching at intervals of 1, 3, 5, 7, 10, 14, 21, 28, 35, 42, 49, and 56 days. The leachate was collected in triangular bottles placed beneath the soil columns until no further water dripped from the columns. The leaching process of the soil columns was conducted in a biochemical incubator (FAITHFUL SPX150BIII, 150 L), with the temperature maintained at 25 °C. This was repeated 3 times for each treatment, and the average value was calculated.
Determination of nutrient concentration in leachate (GB/T 23348-2009 of China): A total of 10.00 g of crushed potassium magnesium sulfate fertilizer was accurately weighed and transferred to a 100 mL beaker. It was dissolved in a small amount of water, the solution was filtered into a 500 mL volumetric flask, the residue was rinsed 5–6 times, and then it was diluted to the mark. Aliquots of 0 mL, 10 mL, 20 mL, 40 mL, 60 mL, 80 mL, 100 mL, and 120 mL were pipetted, and each was diluted to 250 mL in volumetric flasks. The conductivity was measured using a conductivity meter (Taiwan Hengxin Co., Ltd., Taiwan, China) and a standard curve was constructed based on the total nutrient concentration of the potassium magnesium sulfate fertilizer. The conductivity of the extract was measured under the same experimental conditions as the standard curve, and the nutrient concentration was determined based on the standard curve. This was repeated 3 times for each treatment.

2.5. Method for Fitting Nutrient Release Kinetics

The nutrient release rate and characteristic curve of the SRPMSF were mathematically modeled using the first-order kinetics, Langmuir, Elovich, Weibull, and Higuchi equations. The optimal model was determined based on a goodness-of-fit analysis.

2.5.1. First-Order Kinetic Release Kinetics

The first-order kinetic equation presented is an asymmetric growth curve model that describes the relationship between fertilizer nutrient release and time. The first-order kinetic equation model is as follows:
N = N 0 × 1 e x p k × t
where N is the cumulative release rate of nutrients from slow-release fertilizers, %; N 0 is the maximum nutrient release rate, %; k is the release rate constant, d−1; and t is the release time, d.

2.5.2. Langmuir Release Kinetics

The Langmuir equation model is as follows:
N = a × b × t / 1 + b × t
where N is the cumulative release rate of nutrients from slow-release fertilizers, %; t is the release time, d; and a and b are constants in the formula.

2.5.3. Elovich Release Kinetics

The Elovich equation model is as follows:
N = a + b ln t
where N is the cumulative release rate of nutrients from slow-release fertilizers, %; t is the release time, d; and a and b are constants in the formula.

2.5.4. Weibull Release Kinetics

The Weibull equation model is as follows:
N = 1 e x p a t b
where N is the cumulative release rate of nutrients from slow-release fertilizers, %; t is the release time, d; and a and b are constants in the formula.
The Langmuir, Elovich, and Weibull equations discussed above are empirical models used to analyze irregular curves and are widely applied in soil chemical kinetics research. Some researchers have also utilized these models to investigate nutrient release rates in controlled-release fertilizers, achieving good fitting results.

2.5.5. Higuchi Release Kinetics

The Higuchi model is applicable for nutrient release from low water-soluble and soluble fertilizers incorporated in solid or semisolid matrices. The Weibull equation model is as follows:
N = a t 1 2
where N is the cumulative release rate of nutrients from slow-release fertilizers, %; and t is the release time, d; a is the constants in the formula.
The above five equations were fitted using Orgin2021.

2.6. Description of Garlic Sprout Growth Experiment

The experiment was conducted at Chongqing University in Chongqing, China. The study period was from October 2024 to November 2024, a total of 28 days. The soil samples were collected from a rural area in Huaian, Jiangsu Province, China. After collection, the soil was sieved through a 2 mm mesh and air-dried at room temperature for three days before use. Before the study began, an equal amount of soil was placed in each plastic pot, with 5 in each group. The garlic sprout seeds were sourced from Jining City, Shandong Province, China. Garlic of similar size and good appearance were selected and planted with 5 garlic bulbs in each pot. Three treatment groups were designed: no fertilization, application of potassium magnesium sulfate fertilizer, and application of slow-release fertilizer with equivalent nutrient elements, represented by CK, PMSF, and SRPMS, respectively. Five garlic sprouts were planted in each pot for each treatment. The plant height and stem thickness of the garlic sprouts were measured on days 1, 3, 5, 7, 10, 14, and 28, respectively.
Table 5 shows the amount of fertilizer applied to the different groups of garlic sprouts. In order to better compare the effects of the potassium magnesium sulfate fertilizer and slow-release fertilizer on the growth of the garlic sprouts, the experiment ensured that the fertility of the two groups treated with fertilizer was equal.
Plant height was measured using a tape measure, while stem thickness was determined with a vernier caliper. The contents of soluble sugars, soluble proteins, free amino acids, vitamin C, and allicin were determined using the anthrone colorimetric method, the Coomassie Brilliant Blue G-250 colorimetric method, the Indene Triperoxide colorimetric method, UV spectrophotometry, and the phenylhydrazone method, respectively. Each of the above indicators was measured five times, and the average value was calculated.

2.7. Statistical Analysis

All results are presented as means with standard deviation. A statistical analysis was conducted using SPSS 27. One-way ANOVA was performed, followed by Tukey’s test for multiple comparisons. Differences among treatments were considered statistically significant at a threshold of p < 0.05.

3. Results and Discussion

3.1. Modification Analysis of Polyvinyl Alcohol by Sodium Alginate

Figure 2a shows the XRD curve of the PVA–SA blend film. It was found that the addition of SA did not change the position of the peak, but the sharpness of the peak became weaker [46,47]. Therefore, the addition of SA only reduced the crystallinity of PVA and did not change its crystal form. The main reason for the decrease in crystallinity is that PVA originally relied mainly on the—OH side chain for crystallization, but the addition of SA caused the interaction between the upper—OH of the molecule and the—OH of PVA, which inhibited the crystallization of PVA and gradually weakened the XRD peak.
As shown in Figure 2b, the infrared (IR) spectrum of pure PVA film exhibits stretching vibration peaks for -CH and -CH2 groups in the range of 2905–2940 cm−1, along with a crystallization peak at 1167 cm−1 [48]. The broad peak at 3330 cm−1 corresponds to the stretching vibration of -OH, which overlaps with the -CH and -CH2 stretching vibrations, indicating the presence of abundant hydrogen bonds within and between the molecular chains [49]. In the IR spectrum of the PVA–SA blend, the peaks at 1608 cm−1 and 1430 cm−1 represent the symmetric and asymmetric stretching vibrations of the -COO- group, respectively, while the peak at 1085 cm−1 corresponds to the C-O stretching vibration. By comparing the IR spectra of the pure PVA film and the blended film, it is evident that the addition of SA causes a broadening and shift of the hydroxyl stretching vibration peak of PVA towards higher wavenumbers, suggesting that SA disrupts the hydrogen bonds originally formed by PVA. Furthermore, as the SA content increases, the crystallization peak of PVA weakens and nearly disappears, indicating that SA reduces the regularity of the PVA molecular chain arrangement, thus lowering its crystallinity.
Figure 2c displays the TGA curve, illustrating the relationship between the weight-loss rate of the PVA and PVA–SA coating materials and temperature. As shown, the thermal decomposition of PVA occurs in three distinct stages: 30–250 °C (free-water evaporation), 250–450 °C (PVA side-chain breakage), and 450–550 °C (PVA main-chain breakage). The maximum weight-loss rate of the composite film occurs around 250 °C, with the weight loss of modified PVA decreasing from 89.61% to 81.52%. This indicates that the addition of SA to the composite coating material reduces the heat loss by 8.09%. These results suggest that PVA–SA exhibits better thermal stability than pure PVA, with the addition of SA enhancing the thermal stability of the membrane material.
As shown in Figure 2d, the water absorption rate of PVA decreases from 249.78% to 709.96% with the increasing content of SA. The film samples in this series were soaked in distilled water for 24 h, during which they remained soft and transparent and showed no signs of dissolution or delamination. This suggests that the two polymers, SA and PVA, are strongly bound together. PVA molecular chains contain a large number of hydroxyl groups, while SA chains also possess both hydroxyl and carboxyl groups. These groups enable the two polymers to interpenetrate, entangle, and form strong hydrogen bonds, preventing separation in the blended film. As the SA content increases, the water absorption rate of the composite film significantly decreases, indicating that the addition of SA greatly enhances the water resistance of PVA.
In summary, there is a notable interaction between the PVA and SA molecular chains, indicating good compatibility. The addition of SA enhances both the water resistance and thermal stability of PVA. However, excessive SA concentration leads to increased viscosity, which can hinder the solution’s ability to be sprayed effectively. Based on the experiments, PVA–SA-2 was selected as the optimal binder for this study. Compared with traditional inorganic-coated fertilizers, such as those studied by Khairul (2014) [50] and Farahnaz (2015) [51], water is used as the coating material to bond with the fertilizer during the coating preparation process. In this study, modified polyvinyl alcohol (PVA) was employed as a bonding agent between the coating material and fertilizer. This approach not only enhanced the mechanical stability of the particles by leveraging the strong bonding properties of PVA but also delayed nutrient dissolution through functional groups such as hydroxyl groups, offering a novel paradigm for the design of slow-release fertilizer bonding agents. This study explores the use of natural organic polymer materials as binders in the preparation of slow-release fertilizers. Based on preliminary research, polyvinyl alcohol and sodium alginate were selected. Future studies should investigate additional organic natural polymer materials to identify those with superior performance, provided experimental conditions allow.

3.2. Particle Size Distribution of the SRPMSF

The uniformity of fertilizer particles is a crucial criterion for evaluating fertilizer quality, and the fertilizer industry generally classifies particles ranging from 2.00 to 4.00 mm as finished products [52,53]. The particle size statistics of the SRPMSF are presented in Table 6, while the particle size distribution is illustrated in Figure 3. As shown in Table 6, the particle size of the slow-release fertilizer with added bentonite is significantly larger than that of the fertilizer without bentonite addition (p < 0.05). The coefficient of variation in particle size for SRPMSF-3, SRPMSF-4, and SRPMSF-5 is approximately 10%, indicating a relatively high degree of particle uniformity. Furthermore, as illustrated in Figure 3, the particle size distribution of SRPMSF-1 to SRPMSF-5 follows a normal distribution. With an increasing bentonite dosage, the proportion of medium and large particles (≥3.00 mm) gradually increases. The particle size distribution remains relatively concentrated, predominantly within the 3.00–4.00 mm range.

3.3. Wear Resistance and Compressive Strength Test

Table 7 presents the compressive strength and wear resistance of the slow-release potassium magnesium sulfate fertilizers. Higher compressive strength and wear resistance indicate greater hardness, which enhances the suitability of fertilizers for storage and transportation [54,55,56]. The compressive strength of the five fertilizers ranges from 20.85 to 43.78 N. This result demonstrates that all five fertilizers exhibit high strength, meeting the requirements for transportation and storage. The compressive strength of the five fertilizer types follows the order SRPMSF-5 > SRPMSF-4 > SRPMSF-3 > SRPMSF-2 > SRPMSF-1. With increasing bentonite content, compressive strength increases. Compared with SRPMSF-1 (without bentonite), the compressive strength of SRPMSF-2 to SRPMSF-5 increased significantly (p < 0.05); however, no significant difference was observed in the compressive strength among SRPMSF-2 to SRPMSF-5 (p > 0.05). The compressive strength distribution of the slow-release fertilizers prepared by Rashidah et al. (2022) using fly ash-based polymers ranges from 16.1 to 36.4 N [57], while the compressive strength of the starch–polyvinyl alcohol biodegradable slow-release fertilizers developed by Zafar N et al. (2021) varies between 7.04 and 12.08 N [16]. In contrast, the compressive strength of the SRPMSF is within the range of 20.85 to 43.78 N. These findings indicate that the coating method employing modified polyvinyl alcohol bonded with phosphogypsum and bentonite, as used in this study, offers superior advantages for the transportation and storage of fertilizers.
As shown in Table 7, the residual weight ratio of all five types of SRPMSF slow-release fertilizers exceeds 96%, indicating their relatively high wear resistance. The wear resistance ranking follows the order SRPMSF-5 > SRPMSF-4 > SRPMSF-3 > SRPMSF-2 > SRPMSF-1, with no significant difference observed between SRPMSF-3 and SRPMSF-4 (p > 0.05).

3.4. Potassium Magnesium Sulfate Fertilizer Release Behavior in the Column Leaching Study

Figure 4 illustrates the nutrient release from different coating components at various stages, with the ordinary potassium magnesium sulfate fertilizer powder serving as the control group (CK). As shown in Figure 4a, the nutrient release rate of the CK group was 82% on the first day, and its nutrient release rate was significantly higher than that of the SRPMSF groups. Observations from Figure 4b–f indicate that the nutrient release of the SRPMSF groups exhibited a trend of initially increasing and then decreasing. During the initial release of fertilizer nutrients, there is a nutrient lag period during which water takes time to penetrate the coating structure. Therefore, nutrient release from initial fertilizers increases gradually. Once the water reaches saturation, nutrient release reaches its maximum value, followed by a slow-release process. Therefore, the nutrient release of SRPMSF components first increases and then decreases [58,59].
The CK group released nutrients rapidly and almost completely in three days. The nutrient release of SRPMSF-1 decreased from 97.58% to 47.81% in three days, while the nutrient release of SRPMSF-2, SRPMSF-3, SRPMSF-4, and SRPMSF-5 decreased to 27.59%, 21.09%, 15.35%, and 14.43%, respectively. Compared with CK, the release time of the SRPMSF pellets prepared in this study was more than 28 days and up to 56 days (SRPMSF-4), indicating that all groups of fertilizers possessed good slow-release performance. Mohamed et al. (2023) investigated the preparation of lignin–montmorillonite bio composite-encapsulated fertilizers and found that nutrient release in the soil was sustained for up to 32 days [60]. Similarly, Amanda et al. (2021) reported that the release of nutrients from chitosan-encapsulated and water hyacinth crosslinked fertilizers reached equilibrium at 40 days [61]. In the case of the SRPMSF, nutrient release equilibrium was achieved over a prolonged period of 28 to 56 days, indicating that the coating layer effectively regulated the release rate of potassium magnesium sulfate in the soil. Notably, the release duration of the SRPMSF was 5 to 11 times longer than that of conventional potassium magnesium sulfate fertilizers, further highlighting its potential for improved nutrient retention and efficiency.

3.5. Simulation of Nutrient Release Kinetics
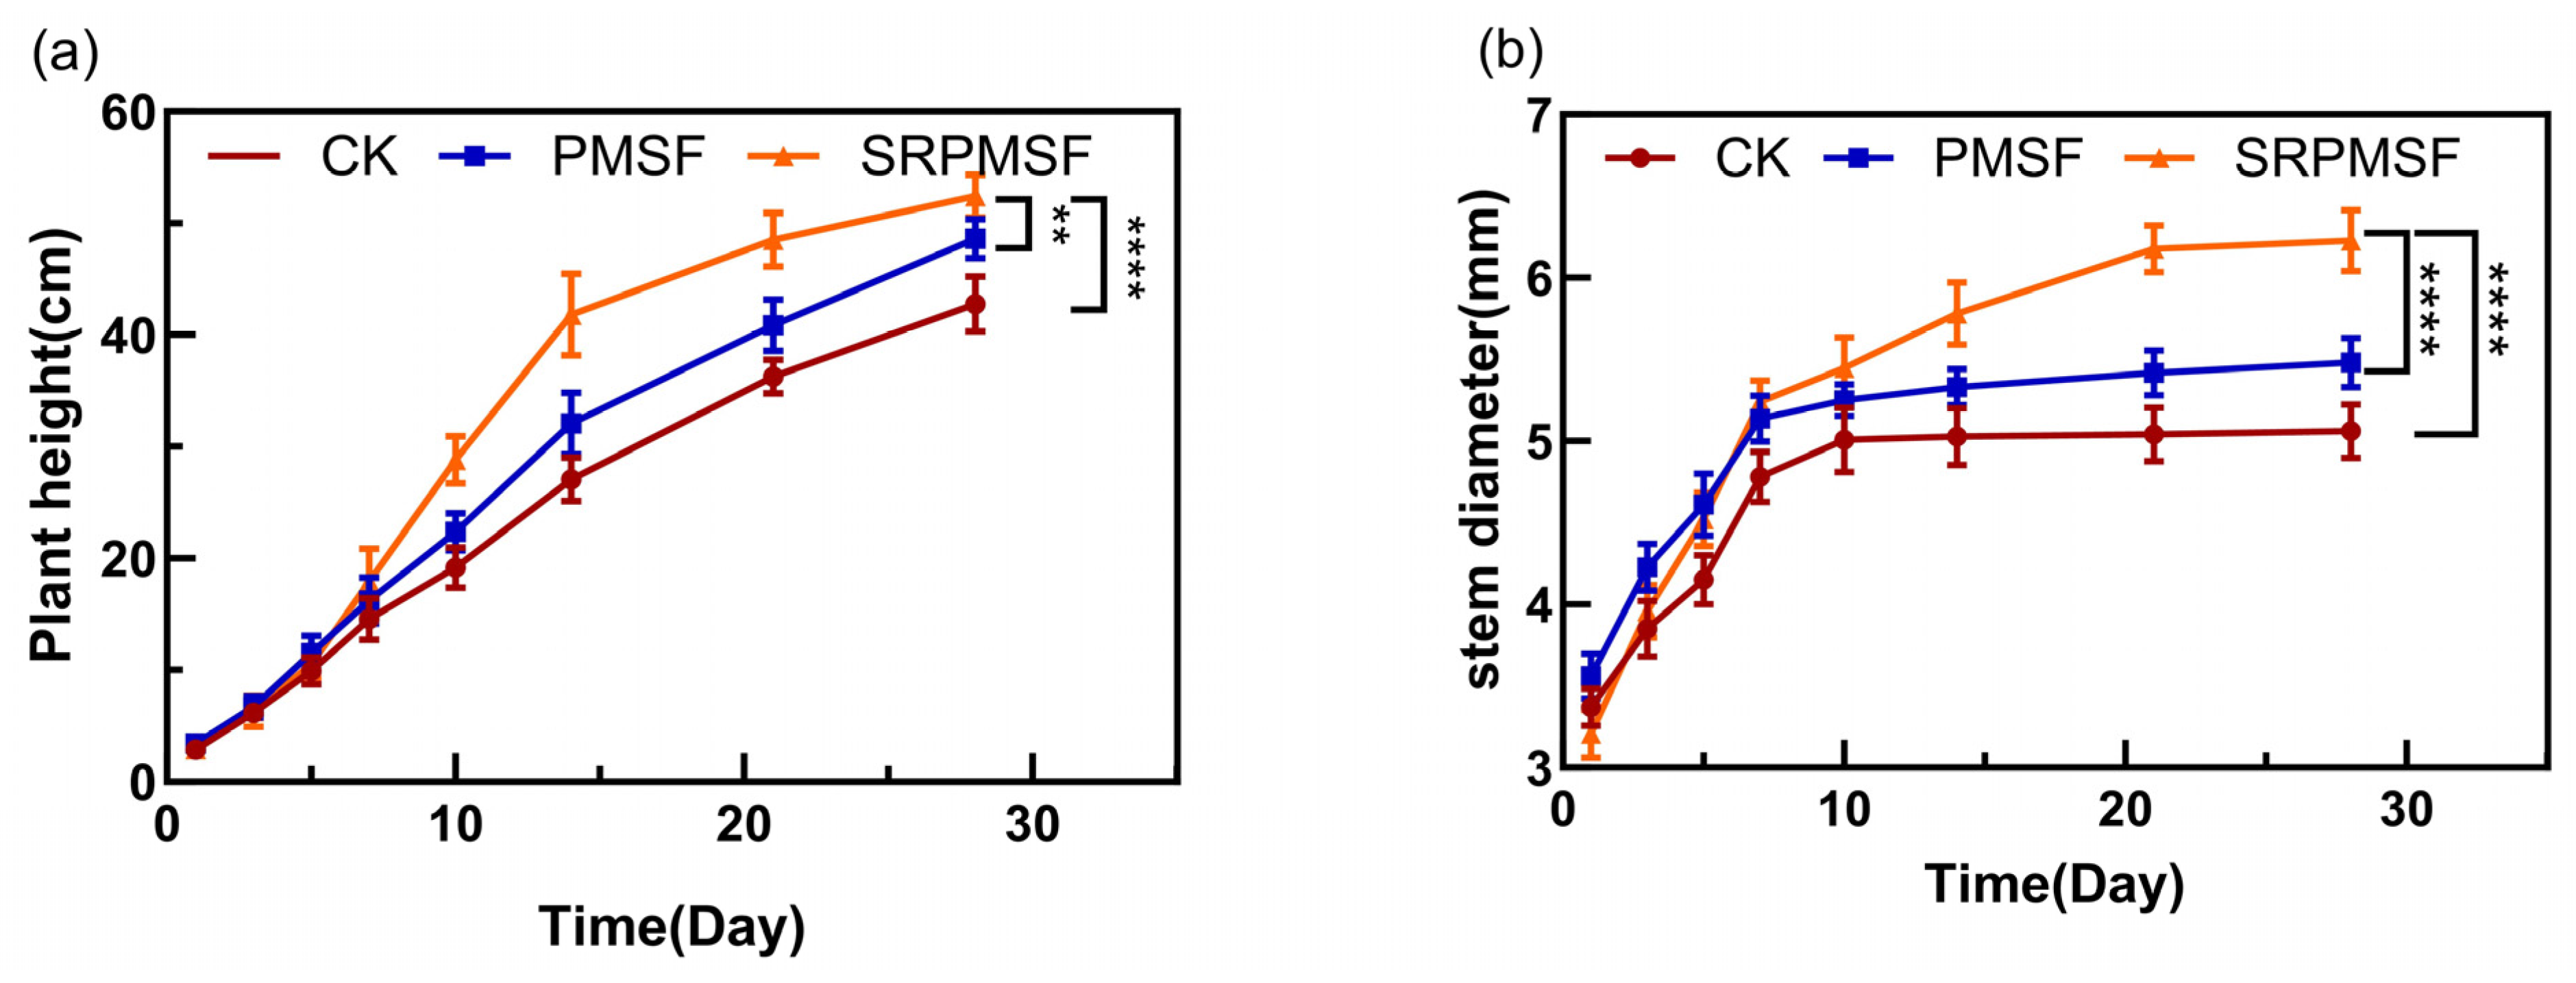
Nutrient release kinetics studies primarily involve the analysis of nutrient release rate versus time and cumulative nutrient release versus time, among others. Researchers commonly apply various kinetic equations to model the nutrient release of slow-release fertilizers. Dong Yan et al. [62] employed the first-order kinetic equation and the Elovich equation to fit the cumulative release of nitrogen nutrients from controlled-release fertilizers in different culture media over time. Their results indicated that the first-order kinetic equation provided the best fit, with the maximum release of nitrogen aligning with the pattern of cumulative nitrogen release. The Higuchi model is a diffusion-dominated release model [63]. Additionally, the Weibull, Langmuir, and Elovich equations are frequently applied in kinetic studies of soil adsorption and desorption. While these equations are empirical and fit growth-type curves, they have been successfully utilized by researchers to model nutrient release from slow-release fertilizers, typically achieving a high degree of fit [64,65].
To further elucidate the nutrient release patterns, the release rates of SRPMSF-2, SRPMSF-3, and SRPMSF-4 were analyzed using first-order kinetic equations, Langmuir equations, Elovich equations, Weibull equations, and Higuchi equations. The results are presented in Table 8 and Figure 5. The correlations of the five nutrient release kinetic models for the three groups of membrane-coated slow-release fertilizers followed the order first-order kinetic model > Langmuir model > Elovich model > Weibull model > Higuchi model. The first-order kinetic model exhibited the highest correlation (R2 > 0.97), suggesting that it is the most suitable model for quantitatively describing the nutrient release rate of the SRPMSF in the soil, followed by the Langmuir model (R2 > 0.96). The correlation coefficients of the Elovich and Weibull models for the three fertilizer groups ranged from 0.94 to 0.97 and 0.92 to 0.94, respectively, indicating that the slow-release rate of the encapsulated fertilizer particles was relatively stable, without rupture of the film layer. In contrast, the Higuchi model, which is diffusion-dominated, yielded lower correlation coefficients for the three groups of membrane-encapsulated slow-release fertilizers (R2 value range of 0.7960–0.8340). This indicates that, although the fertilizer particles show no membrane rupture and the nutrient release is stable, the release process is not governed by a single diffusion mechanism. It is also influenced by factors such as soil temperature, pH, and soil enzyme activity.
In Nguyen’s study (2021) on the nutrient release kinetics of homemade slow-release fertilizers, the Higuchi model (R2 value range of 0.86 to 0.92) exhibited a superior fit compared to other kinetic models [66]. Abedi Koupai (2008) used the first-order, Higuchi, Hixon Crowell, and Korsmeyer Peppas models to evaluate urea release. The first-order model showed the best fit to the experimental data of low-dose urea release (R2 value range from 0.7734 to 0.9659) [67]. Compared with the study by Nguyen and Abedi Koupai, this paper demonstrates higher accuracy (R2 value range of 0.9792–0.9873) in simulating the release behavior of slow-release potassium magnesium sulfate fertilizers. These findings provide a valuable reference for future investigations into the relationship between nutrient release and time in slow-release potassium magnesium sulfate fertilizers in soil.

3.6. Pot Experiment

Compared with the control plants, the application of potassium magnesium sulfate fertilizer or slow-release potassium magnesium sulfate fertilizer significantly increased plant height and stem diameter (p < 0.05) (Figure 6). In the PMSF treatment, plant height increased by 13.65%, whereas in the SRPMSF treatment, it increased by 22.58%, with a significant difference observed between the two groups (p < 0.05). Additionally, compared with the control, the stem diameter of the garlic sprouts increased by 8.30% and 23.12% in the PMSF and SRPMSF treatments, respectively, with a significant difference between these groups (p < 0.05). These results indicate that, compared with conventional potassium magnesium sulfate fertilizer, slow-release potassium magnesium sulfate fertilizer has a more pronounced effect on the growth of garlic sprouts. Furthermore, the beneficial effects of slow-release potassium magnesium sulfate fertilizer application on garlic sprouts are not limited to plant height and stem thickness. As demonstrated in Figure 7, sprouts in the SRPMSF group exhibit more pronounced leaf division, tenderer and greener leaves, a denser morphology, and markedly enhanced growth compared to the other groups.
By measuring the contents of key nutrients, including soluble sugars, soluble proteins, free amino acids, vitamin C, and allicin in garlic sprouts, valuable scientific insights can be provided for evaluating their nutritional and functional characteristics. The application of the different treatments demonstrated that, compared with the control group (CK), the PMSF and SRPMSF significantly enhanced the physicochemical properties of the garlic sprouts (p < 0.05) (Table 9). In the CK group, the soluble sugar content of the garlic sprouts was 1.72%, the soluble protein content was 4.05 mg/g, the free amino acid content was 2.05 mg/g, the vitamin C content was 142.56 µg/g, and the allicin content was 6.16%. The soluble sugar content in the PMSF and SRPMSF treatment groups increased by 13.95% and 43.60%, respectively, while the soluble protein content increased by 63.95% and 99.01%, and the free amino acid content increased by 55.61% and 170.24%, respectively. The statistical analysis indicated significant differences (p < 0.05) in the levels of soluble sugars, soluble proteins, and free amino acids between the two treatments. Furthermore, the vitamin C content in the garlic sprouts treated with the PMSF and SRPMSF increased by 25.40% and 29.34%, respectively, whereas the allicin content increased by 41.72% and 46.59%. However, no significant differences were observed in the vitamin C and allicin contents between the PMSF and SRPMSF (p > 0.05). These findings suggest that, compared with conventional potassium magnesium sulfate fertilizer, slow-release potassium magnesium sulfate fertilizer more effectively enhances nutrient absorption in garlic sprouts, thereby promoting growth and improving overall quality. Due to time constraints, the garlic sprout cultivation period in this study was relatively short. To facilitate the broader application of slow-release potassium magnesium sulfate fertilizers, future research should focus on field trials with a wider range of crops as well as optimizing fertilization methods and adjusting application rates at different growth stages.

4. Conclusions

This study represents the first use of phosphogypsum and bentonite in the coating treatment of a potassium magnesium sulfate fertilizer. Performance analysis and leaching experiments were conducted to compare and study the slow-release properties of different components of the potassium magnesium sulfate fertilizer. The addition of SA enhances both the water resistance and thermal stability of PVA. Based on the experiments, PVA–SA-2 was chosen as the optimal binder for this study, exhibiting a water absorption rate of 164.02%, which decreased by 34.33%. The content of bentonite in the coating component was found to be the primary factor affecting the slow-release properties of the potassium magnesium sulfate fertilizer particles. When the bentonite dosage is 43.2 g, the maximum destructive power of the slow-release potassium magnesium sulfate fertilizer is measured at 43.78 N. When the bentonite content exceeds 31.2 g, nutrient release in the soil can be sustained for up to 56 days. The first-order kinetic equation was found to best represent the relationship between nutrient release and time for slow-release potassium magnesium sulfate fertilizer in soil. Pot experiments demonstrated that the prepared slow-release potassium magnesium sulfate fertilizer promoted garlic seedling growth more effectively than ordinary potassium magnesium sulfate fertilizer. In conclusion, a new type of slow-release fertilizer with good slow-release performance is prepared in this paper, which can improve the utilization rate of fertilizer and reduce economic loss and is conducive to the sustainable development of agriculture.

Author Contributions

Conceptualization, R.L.; Supervision, C.T. and X.F.; Writing—original draft, Z.Z.; Writing—review and editing, Z.Z. and C.H. All authors have read and agreed to the published version of the manuscript.

Funding

This research was funded by SDIC Xinjiang Luobupo Postash Co., Ltd., grant number H20230384.

Institutional Review Board Statement

Not applicable.

Data Availability Statement

The data presented in this study are available on request from the corresponding author due to (specify the reason for the restriction).

Conflicts of Interest

Author Chunxiao Han was employed by the company SDIC Xinjiang Luobupo Postash Co., Ltd. The remaining authors declare that the research was conducted in the absence of any commercial or financial relationships that could be construed as a potential conflict of interest.

References

  1. Vermoesen, E.; Bodé, S.; Brosens, G.; Boeckx, P.; Van Vlierberghe, S. Chemical Strategies Towards Controlled Release in Agriculture. Rev. Chem. Eng. 2024, 2, 247–277. [Google Scholar]
  2. Lu, J.; Cheng, M.; Zhao, C.; Li, B.; Peng, H.; Zhang, Y.; Shao, Q.; Hassan, M. Application of lignin in preparation of slow-release fertilizer: Current status and future perspectives. Ind. Crops Prod. 2022, 176, 114267. [Google Scholar]
  3. Zhai, C.J.; Cui, S.Y.; Zhang, J.; Hu, A.Y.; Huang, Z.P.; Cheng, Y.J. Development status of slow/controlled release fertilizers and their application prospects in agricultural production. J. Agric. 2022, 12, 22. [Google Scholar]
  4. Tan, D.; Jiang, L.; Tan, S.; Zheng, F.; Xu, Y.; Cui, R.; Wang, M.; Shi, J.; Li, G.; Liu, Z. An in situ study of inorganic nitrogen flow under different fertilization treatments on a wheat-maize rotation system surrounding Nansi Lake, China. Agric. Water Manag. 2013, 123, 85–90. [Google Scholar]
  5. Abbasi, M.K.; Tahir, M.M.; Rahim, N. Effect of N fertilizer source and timing on yield and N use efficiency of rainfed maize (Zea mays L.) in Kashmir—Pakistan. Geoderma 2013, 195–196, 87–93. [Google Scholar]
  6. Ding, W.C.; He, P.; Zhou, W. Development strategies of the new-type fertilizer industry in China. J. Plant Nutr. Fertilizers 2023, 29, 201. [Google Scholar]
  7. Zhang, Y.; Ye, C.; Su, Y.; Peng, W.; Lu, R.; Liu, Y.; Huang, H.; He, X.; Yang, M.; Zhu, S. Soil acidification caused by excessive application of nitrogen fertilizer aggravates soil-borne diseases: Evidence from literature review and field trials. Agric. Ecosyst. Environ. 2022, 340, 108176. [Google Scholar]
  8. Cheng, D.D.; Zhao, G.Z.; Bai, T.; Liu, Y.Q. Preparation and nutrient release mechanism of a polymer as slow-release compound fertilizer. J. Chem. Soc. Pak. 2014, 36, 647–653. [Google Scholar]
  9. Li, X.; Li, Q.; Xu, X.; Su, Y.; Yue, Q.; Gao, B. Characterization, swelling, and slow-release properties of a new controlled release fertilizer based on wheat straw cellulose hydrogel. J. Taiwan Inst. Chem. Eng. 2016, 56, 564–572. [Google Scholar]
  10. Boonsuk, P.; Sukolrat, A.; Kaewtatip, K.; Chantarak, S.; Kelarakis, A.; Chaibundit, C. Modified cassava starch/poly(vinyl alcohol) blend films plasticized by glycerol: Structure and properties. J. Appl. Polym. Sci. 2020, 137, 48848. [Google Scholar] [CrossRef]
  11. Edwin, M.A. A review of polyvinyl alcohol derivatives: Promising materials for pharmaceutical and biomedical applications. Afr. J. Pharm. Pharmacol. 2014, 8, 674–684. [Google Scholar]
  12. Sau, S.; Pandit, S.; Kundu, S. Crosslinked poly(vinyl alcohol): Structural, optical, and mechanical properties. Surf. Interfaces 2021, 25, 101198. [Google Scholar]
  13. Panda, P.K.; Sadeghi, K.; Seo, J. Recent advances in poly(vinyl alcohol)/natural polymer based films for food packaging applications: A review. Food Packag. Shelf Life 2022, 33, 100904. [Google Scholar] [CrossRef]
  14. Mittal, A.; Garg, S.; Premi, A.; Premi, A.; Sekhar Giri, A. Synthesis of polyvinyl alcohol/modified starch-based biodegradable nanocomposite films reinforced with starch nanocrystals for packaging applications. Polym. Polym. Compos. 2021, 29, 405–416. [Google Scholar] [CrossRef]
  15. Lum, Y.H.; Shaaban, A.; Mohamad, N.; Dimin, F.; Yatim, N.M. Boric acid modified starch polyvinyl alcohol matrix for slow release fertilizer. e-Polymers 2016, 16, 151–158. [Google Scholar] [CrossRef]
  16. Zafar, N.; Niazi, M.B.; Sher, F.; Khalid, U.; Jahan, Z.; Shah, G.A.; Zia, M. Starch and polyvinyl alcohol encapsulated biodegradable nanocomposites for environment-friendly slow release of urea fertilizer. Chem. Eng. J. Adv. 2021, 7, 100123. [Google Scholar] [CrossRef]
  17. Sofyane, A.; Ablouh, E.; Lahcini, M.; Elmeziane, A.; Khouloud, M.; Kaddami, H.; Raihane, M. Slow-release fertilizers based on starch acetate/glycerol/polyvinyl alcohol biocomposites for sustained nutrient release. Mater. Today Proc. 2021, 36, 74–81. [Google Scholar] [CrossRef]
  18. An, X.; Wu, Z.; Yu, J.; Cravotto, G.; Liu, X.; Yu, B. Copyrolysis of biomass, bentonite, and nutrients as a new strategy for the synthesis of improved biochar-based slow-release fertilizers. ACS Sustain. Chem. Eng. 2020, 8, 3181–3190. [Google Scholar] [CrossRef]
  19. Wang, C.; Song, Z.; Cao, Y.; Han, L.; Yu, Q.; Han, G. Characterization of sodium alginate-carrageenan films prepared by adding peanut shell flavonoids as an antioxidant: Application in chilled pork preservation. Int. J. Biol. Macromol. 2024, 266, 131081. [Google Scholar]
  20. Bierhalz, A.C.K.; Silva, M.A.D.; Braga, M.E.M.; Hermínio, J.C.S.; Kieckbusch, T.G. Effect of calcium and/or barium crosslinking on the physical and antimicrobial properties of natamycin-loaded alginate films. LWT Food Sci. Technol. 2014, 57, 494–501. [Google Scholar] [CrossRef]
  21. Afshar, M.; Dini, G.; Vaezifar, S.; Mehdikhani, M.; Movahedi, B. Preparation and characterization of sodium alginate/polyvinyl alcohol hydrogel containing drug-loaded chitosan nanoparticles as a drug delivery system. J. Drug Deliv. Sci. Technol. 2020, 56, 101530. [Google Scholar]
  22. Blake, L.; Johnston, A.E.; Goulding, K.W.T. Mobilization of aluminium in soil by acid deposition and its uptake by grass cut for hay—A chemical time bomb. Soil Use Manag. 1994, 10, 51–55. [Google Scholar]
  23. Wei, Z.; Deng, Z. Research hotspots and trends of comprehensive utilization of phosphogypsum: Bibliometric analysis. J. Environ. Radioact. 2022, 242, 106778. [Google Scholar] [CrossRef] [PubMed]
  24. Bouray, M.; Moir, J.; Condron, L.; Lehto, N. Impacts of phosphogypsum, soluble fertilizer, and lime amendment of acid soils on the bioavailability of phosphorus and sulphur under lucerne (Medicago sativa). Plants 2020, 9, 883. [Google Scholar] [CrossRef]
  25. Campbell, C.G.; Garrido, F.; Illera, V.; Garcia-Gonzalez, M.T. Transport of Cd, Cu, and Pb in an acid soil amended with phosphogypsum, sugar foam, and phosphoric rock. Appl. Geochem. 2020, 21, 1030–1043. [Google Scholar]
  26. Noh, Y.D.; Komarneni, S.; Park, M. Mineral-based slow-release fertilizers: A review. Korean J. Soil Sci. Fertil. 2015, 48, 1–7. [Google Scholar]
  27. Pliaka, M.; Gaidajis, G. Potential uses of phosphogypsum: A review. J. Hazard. Mater. 2024, 57, 746–763. [Google Scholar] [CrossRef]
  28. Akfas, F.; Elghali, A.; Aboulaich, A.; Munoz, M.; Benzaazoua, M.; Bodinier, J.L. Exploring the potential reuse of phosphogypsum: A waste or a resource. Sci. Total Environ. 2024, 908, 168196. [Google Scholar] [CrossRef]
  29. Matveeva, V.A.; Smirnov, Y.D.; Suchkov, D.V. Industrial processing of phosphogypsum into organomineral fertilizer. Environ. Geochem. Health 2021, 44, 1605–1618. [Google Scholar] [CrossRef]
  30. Trots, N.M.; Borovkova, N.V.; Soloviev, A.A. Efficiency of phosphogypsum in agrocenosis of spring barley. Bull. Samara State Agric. Acad. 2022, 7, 3–11. [Google Scholar]
  31. Zhang, J.; Yu, K.; Yu, M.; Dong, X.; Sarwar, M.T.; Yang, H. Facet-engineering strategy of phosphogypsum for production of mineral slow-release fertilizers with efficient nutrient fixation and delivery. Waste Manag. 2024, 182, 259–270. [Google Scholar] [CrossRef] [PubMed]
  32. Zhantasov, K.; Ziyat, A.; Sarypbekova, N.; Kirgizbayeva, K.; Iztleuov, G.; Zhantasov, M.; Sagitova, G.; Aryn, A. Ecologically friendly, slow-release granular fertilizers with phosphogypsum. Pol. J. Environ. Stud. 2022, 31, 2935–2942. [Google Scholar] [CrossRef] [PubMed]
  33. Gorbunov, A.V.; Frontasyeva, M.V.; Gundorina, S.F.; Onischenko, T.L.; Maksjuta, B.B.; Pal, C.A. Effect of agricultural use of phosphogypsum on trace elements in soils and vegetation. Sci. Total Environ. 1992, 122, 337–346. [Google Scholar] [CrossRef]
  34. Rashad, A.M. Phosphogypsum as a construction material. J. Clean. Prod. 2017, 166, 732–743. [Google Scholar] [CrossRef]
  35. Hilton, J. Phosphogypsum—Management and opportunities for use: Resolving a conflict between negative externality and public good. Int. Fertil. Soc., Proc. 2006, 587, 14–17. [Google Scholar]
  36. Mesić, M. Korekcija suvišne kiselosti tla različitim vapnenim materijalima. Agric. Conspec. Sci. 2001, 66, 75–93. [Google Scholar]
  37. Soratto, R.P.; Crusciol, C.A.C. Dolomite and phosphogypsum surface application effects on annual crops nutrition and yield. Agron. J. 2008, 100, 261–270. [Google Scholar] [CrossRef]
  38. Ghazi, N.; Alkaraki, M. Wheat response to phosphogypsum and mycorrhizal fungi in alkaline soil. J. Plant Nutr. 2002, 25, 873–883. [Google Scholar]
  39. Michalovicz, L.; Müller, M.M.L.; Tormena, C.A.; Dick, W.A.; Vicensi, M.; Meert, L. Soil chemical attributes, nutrient uptake, and yield of no-till crops as affected by phosphogypsum doses and parceling in southern Brazil. Arch. Agron. Soil Sci. 2019, 65, 385–399. [Google Scholar] [CrossRef]
  40. Park, M.; Kim, C.Y.; Lee, D.H.; Choi, C.L.; Choi, J.; Lee, S.R.; Choy, J.H. Intercalation of magnesium-area complex into swelling clay. J. Phys. Chem. Solids 2004, 65, 409–412. [Google Scholar] [CrossRef]
  41. He, Y.; Wu, Z.; Tu, L.; Han, J.; Zhang, G.; Li, C. Encapsulation and characterization of slow-release microbial fertilizer from the composites of bentonite and alginate. Appl. Clay Sci. 2015, 109, 68–75. [Google Scholar]
  42. Pamungkas, R.B.; Jos, B.; Djaeni, M.; Saputri, K.A.D. Granulation processing variables on the physical properties of granule slow-release urea fertilizer. AIP Conf. Proc. 2020, 2197, 100001. [Google Scholar]
  43. Nagarkar, R.; Patel, J. Polyvinyl alcohol: A comprehensive study. Acta Sci. Pharm. Sci. 2019, 3, 34–44. [Google Scholar]
  44. Saarai, A.; Kasparkova, V.; Sedlacek, T.; Saha, P. On the development and characterization of crosslinked sodium alginate/gelatine hydrogels. J. Mech. Behav. Biomed. Mater. 2013, 18, 152–166. [Google Scholar] [PubMed]
  45. Fan, L.; Jiang, L.; Xu, Y.; Zhou, Y.; Shen, Y.; Xie, W.; Long, Z.; Zhou, J. Synthesis and anticoagulant activity of sodium alginate sulfates. Carbohydr. Polym. 2011, 83, 1797–1803. [Google Scholar]
  46. Chen, Q.; Lu, W.; Zhang, W. Preparation and characterization of chitosan coating of slow-release fertilizers. Polym. Mater. Sci. Eng. 2005, 21, 216. [Google Scholar]
  47. Xu, F.; Li, Y.; Wang, X.; Wei, J.; Yang, A. Preparation and characterization of nano-hydroxyapatite/poly(vinyl alcohol) hydrogel biocomposite. J. Mater. Sci. 2004, 39, 5669–5672. [Google Scholar]
  48. Korbag, I.; Mohamed Saleh, S. Studies on the formation of intermolecular interactions and structural characterization of polyvinyl alcohol/lignin film. Int. J. Environ. Stud. 2016, 73, 226–235. [Google Scholar]
  49. Liu, S.; Gao, X.; Fan, H.; Zhang, M.; Waterhouse, G.I.N.; Zhu, S. Green and recyclable graphitic carbon nitride/chitosan/polyvinyl alcohol photocatalytic films with efficient antibacterial activity for fruit packaging. Int. J. Biol. Macromol. 2023, 236, 123974. [Google Scholar]
  50. Ibrahim, K.R.M.; Babadi, F.E.; Yunus, R. Comparative performance of different urea coating materials for slow release. Particuology 2014, 17, 165–172. [Google Scholar]
  51. Babadi, F.E.; Yunus, R.; Rashid, S.A.; Salleh, M.A.M.; Ali, A. New coating formulation for the slow release of urea using a mixture of gypsum and dolomitic limestone. Particuology 2015, 23, 62–67. [Google Scholar]
  52. Tzika, M.; Alexandridou, S.; Kiparissides, C. Evaluation of the morphological and release characteristics of coated fertilizer granules produced in a Wurster fluidized bed. Powder Technol. 2003, 132, 16–24. [Google Scholar]
  53. McCauley, A.; Jones, C.; Jacobsen, J. Commercial fertilizers and soil amendments. Nutrient Manag. Module 2009, 10, 4449–4410. [Google Scholar]
  54. Azeem, B.; KuShaari, K.Z.; Man, Z.; Trinh, T.H. Nutrient release characteristics and coating homogeneity of biopolymer-coated urea as a function of fluidized bed process variables. Can. J. Chem. Eng. 2017, 95, 849–862. [Google Scholar]
  55. Zhang, H.; Xu, C.; Wang, J. Fertilizer strength prediction model based on shape characteristics. IEEE Access 2021, 9, 87007–87023. [Google Scholar]
  56. Avsar, C.; Ulusal, A. Granular fertilizer caking: A research on the performance evaluation of coating agents. Eur. J. Chem. 2021, 12, 273–278. [Google Scholar]
  57. Hamidi, R.M.; Siyal, A.A.; Luukkonen, T.; Shamsuddin, R.M.; Moniruzzaman, M. Fly ash geopolymer as a coating material for controlled-release fertilizer based on granulated urea. RSC Adv. 2022, 12, 33187–33199. [Google Scholar]
  58. Shavit, U.; Shaviv, A.; Shalit, G.; Zaslavsky, D. Release characteristics of a new controlled release fertilizer. J. Control. Release 1997, 43, 131–138. [Google Scholar]
  59. Azeem, B.; KuShaari, K.Z.; Man, Z.B.; Basit, A.; Thanh, T.H. Review on materials & methods to produce controlled release coated urea fertilizer. J. Control. Release 2014, 181, 11–21. [Google Scholar]
  60. Helal, M.I.D.; Tong, Z.; Khater, H.A.; Fathy, M.A.; Ibrahim, F.E.; Li, Y.; Abdelkader, N.H. Modification of fabrication process for prolonged nitrogen release of lignin–montmorillonite biocomposite encapsulated urea. Nanomaterials 2023, 13, 1889. [Google Scholar] [CrossRef]
  61. Silva, I.A.A.; de Macedo, O.F.L.; Cunha, G.C.; Oliveira, R.V.M.; Romão, L.P.C. Using water hyacinth (Eichhornia crassipes) biomass and humic substances to produce urea-based multi-coated slow-release fertilizer. Cellulose 2021, 28, 3691–3701. [Google Scholar]
  62. Yan, D.; Wang, Z. Release characteristics of different N forms in an uncoated slow/controlled release compound fertilizer. Agric. Sci. China 2007, 6, 330–337. [Google Scholar]
  63. Ganetri, I.; Essamlali, Y.; Amadine, O.; Danoun, K.; Aboulhrouz, S.; Zahouily, M. Controlling factors of slow or controlled-release fertilizers. In Controlled Release Fertilizers for Sustainable Agriculture; Academic Press: Cambridge, MA, USA, 2021; pp. 111–129. [Google Scholar]
  64. Rakhmad, F.; Dyah, T.S. Release pattern of ammonium, nitrate, and potassium from Slow-Release Fertilizer (SRF) in the soil. IOP Conf. Ser. Earth Environ. Sci. 2019, 383, 012037. [Google Scholar]
  65. Tong, X.; He, X.; Duan, H.; Han, L.; Huang, G. Evaluation of controlled release urea on the dynamics of nitrate, ammonium, and its nitrogen release in black soils of northeast China. Int. J. Environ. Res. Public Health 2018, 15, 119. [Google Scholar] [CrossRef]
  66. Vo, P.T.; Nguyen, H.T.; Trinh, H.T.; Nguyen, V.M.; Le, A.T.; Tran, H.Q.; Nguyen, T.T.T. The nitrogen slow-release fertilizer based on urea incorporating chitosan and poly(vinyl alcohol) blend. Environ. Technol. Innov. 2021, 22, 101528. [Google Scholar]
  67. Abedi-Koupai, J.; Varshosaz, J.; Mesforoosh, M. Controlled release of microcapsule fertilizer using ethylene vinyl acetate polymer. In Proceedings of the XVIth International Conference on Bioencapsulation, Dublin, Ireland, 4–6 September 2008; pp. 1–4. [Google Scholar]
Figure 1. Synthesis of phosphogypsum–bentonite potassium magnesium sulphate slow-release fertilizer.
Agriculture 15 00692 g001
Figure 2. (a) XRD curves of PVA films with different SA contents; (b) IR spectra of PVA with different SA contents; (c) Thermogravimetric curves of PVA films with different SA contents; (d) Water absorption rate of PVA films with different SA contents.
Agriculture 15 00692 g002
Figure 3. Particle size distribution and cumulative frequency of fertilizer particles in different treatment groups: (a) SRPMSF-1; (b) SRPMSF-2; (c) SRPMSF-3; (d) SRPMSF-4; (e) SRPMSF-5 (dx represents the particle size corresponding to a particle size distribution of x%).
Agriculture 15 00692 g003
Figure 4. Nutrient release rate of slow-release fertilizer at different stages: (a) CK, (b) SRPMSF-1, (c) SRPMSF-2, (d) SRPMSF-3, (e) SRPMSF-4, (f) SRPMSF-5. Error bars represent ±SD.
Agriculture 15 00692 g004
Figure 5. Simulation of nutrient release kinetics from slow-release fertilizer particles: (a) SRPMSF-2, (b) SRPMSF-3, (c) SRPMSF-4.
Agriculture 15 00692 g005
Figure 6. Effect of different treatments on the growth of garlic seedlings: (a) change in seedling height at various stages; (b) change in stem thickness of garlic seedlings at different stages. Error bars represent ±SD. The * represent a significant difference between different treatments (** p < 0.01, **** p < 0.0001).
Agriculture 15 00692 g006
Figure 7. Growth status of garlic sprouts in different treatment groups.
Agriculture 15 00692 g007
Table 1. Formulas with different dosages of sodium alginate.
TreatmentsPVA (%)SA (%)
PVA8.000
PVA–SA-18.000.80
PVA–SA-28.001.20
PVA–SA-38.001.60
PVA–SA-48.002.00
PVA–SA-58.002.40
Table 2. Usage amount of each component in the SRPMSF.
TreatmentsPMSF (g)Phosphogypsum (g)BentoniteMass Ratio Phosphogypsum/Bentonite
PMSF-- -
SRPMSF-112554.00-
SRPMSF-212543.210.84:1
SRPMSF-312532.421.63:2
SRPMSF-412521.632.42:1
SRPMSF-512510.843.21:4
Table 3. Operating parameters for preparing the SRPMSF by disc granulation.
Phosphogypsum particle size (mm)<1.00
Usage amount of PMSF (g)125
Drum speed (rpm)40
Spray PVA–SA (mL)10
Paraffin wax (g)15
Duration time (min) 15
Drying temperature after granulation (°C)60
Drying temperature after paraffin sealingroom temperature
Table 4. The raw materials used in this study.
Full NameSource
Potassium magnesium of sulphate fertilizer SDIC Xinjiang Luobupo Postash Co., Ltd. (Hami, China)
PhosphogypsumHubei Xingfa Co., Ltd. (Yidu, China)
BentoniteXincheng Mineral Resources Co., Ltd. (Shijiazhuang, China)
Polyvinyl alcoholMACKLIN Biochemical Technology Co., Ltd. (Chongqing, China)
Sodium alginateMACKLIN Biochemical Technology Co., Ltd. (Chongqing, China)
Paraffin waxZhengmei Engineering Plastic Co., Ltd. (Ningbo, China)
Table 5. Fertilizer usage for different groups.
No.Potassium Magnesium Sulfate Fertilizer (g/g)The Amount of Fertilizer Used (g)
CK00
PMSF1.005.00
SRPMSF-30.618.20
Table 6. Compressive strength and wear resistance of slow-release fertilizer particles in different treatment groups.
No.Particle Size Distribution
Average/
mm
Variation
Coefficient
SRPMSF-12.856 ± 0.57 c19.75
SRPMSF-23.142 ± 0.54 b16.92
SRPMSF-33.634 ± 0.52 a12.61
SRPMSF-43.668 ± 0.45 a12.12
SRPMSF-53.731 ± 0.44 a11.83
The different superscripted letters represent a significant difference between different treatments (p < 0.05).
Table 7. Compressive strength and wear resistance of the SRPMSF in different treatment groups.
No.Wear ResistanceCompression Resistance Strength (N)
MinimumMaximumResidual
Weight
Ratio (%)
SRPMSF-195.6296.7696.31 ± 0.49 d20.85 ± 3.41 b
SRPMSF-298.2799.3498.79 ± 0.44 c38.75 ± 6.32 a
SRPMSF-399.0899.5099.32 ± 0.17 b40.71 ± 5.71 a
SRPMSF-499.3899.5399.45 ± 0.06 b42.52 ± 8.20 a
SRPMSF-599.8999.9699.93 ± 1.33 a43.78 ± 8.97 a
The different superscripted letters represent a significant difference between different treatments (p < 0.05).
Table 8. Fitting parameters of nutrient release kinetic model.
ModelSimultaneous EquationsParametersSRPMSF-2SRPMSF-3SRPMSF-4
first-order
kinetic
N = N 0 × 1 e x p k × t k0.19070.14640.1199
N00.80140.80950.8085
R20.98360.97920.9873
Langmuir N = a × b × t / 1 + b × t a0.96950.94590.9445
b0.20310.16570.1360
R20.96310.96140.9749
Elovich N = a + b ln t a0.12300.07500.0451
b0.21690.20970.2065
R20.94770.94960.9674
Weibull N = 1 e x p a t b a0.21010.18690.1645
b0.67720.63980.6382
R20.93320.92460.9432
Higuchi N = a t 1 2 a0.16920.14240.1310
R20.81000.79600.8340
N is the cumulative release rate of nutrients from slow-release fertilizers, %; N0 is the maximum nutrient release rate, %; k is the release rate constant, d−1; t is the release time, d; a and b are constants in the formula.
Table 9. Effects of different treatment groups on physiological indexes of garlic seedlings.
No.Soluble Sugar (%)Soluble Protein (mg/g)Free Amino Acid (mg/g)Vitamin C (µg/g)Allicin (%)
CK1.72 ± 0.13 c4.05 ± 0.22 c2.05 ± 0.08 c142.56 ± 3.61 b6.16 ± 0.33 b
PMSF1.96 ± 0.06 b6.64 ± 0.57 b3.19 ± 0.72 b178.77 ± 4.61 a8.73 ± 0.37 a
SRPMSF2.47 ± 0.11 a8.06 ± 0.51 a5.54 ± 0.14 a184.39 ± 5.91 a9.03 ± 0.13 a
The different superscripted letters represent a significant difference between different treatments (p < 0.05).
Disclaimer/Publisher’s Note: The statements, opinions and data contained in all publications are solely those of the individual author(s) and contributor(s) and not of MDPI and/or the editor(s). MDPI and/or the editor(s) disclaim responsibility for any injury to people or property resulting from any ideas, methods, instructions or products referred to in the content.

