


Diagnosis of Macronutrients in Patchouli Leaves and Response to Fertilizers in Inceptisols of Aceh: A Case Study in Aceh Besar Regency, Indonesia


Abstract
1. Introduction
2. Methodology
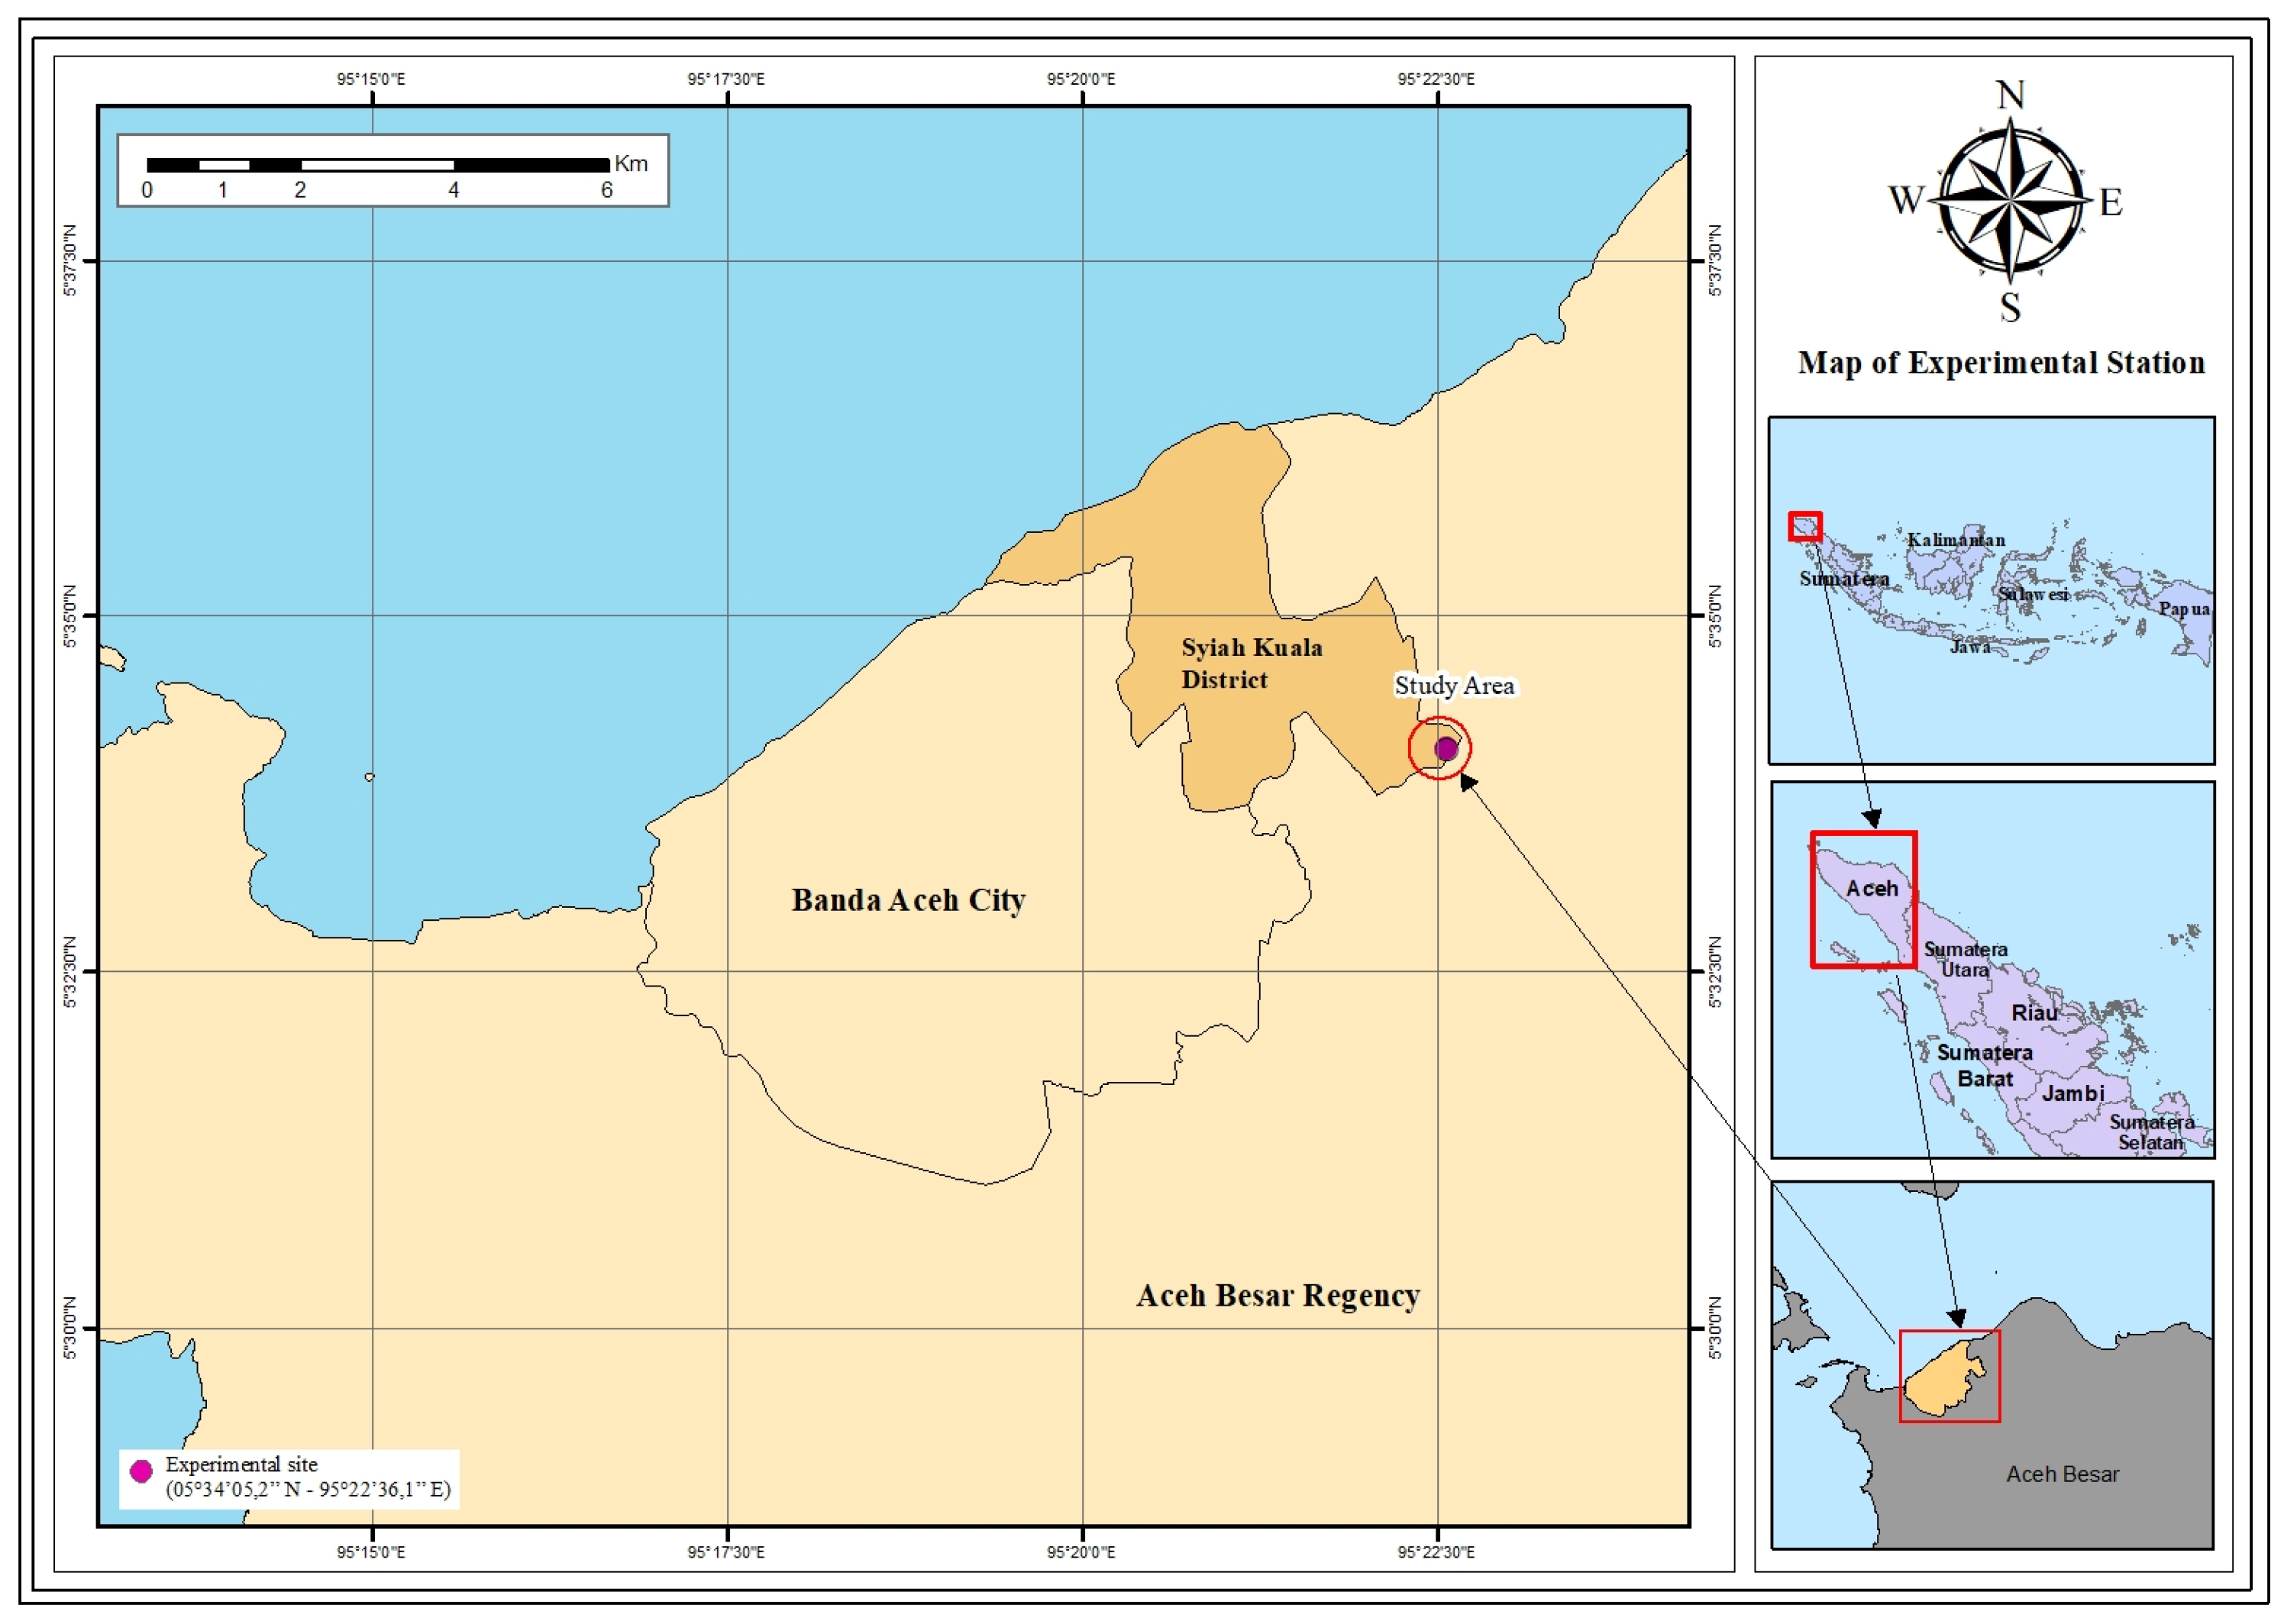
2.1. Location
2.2. Materials
2.3. Treatments and the Experimental Design
2.4. Initial Soil Analysis
2.5. Plant Nutrient Analysis
2.6. Data Analysis
3. Results and Discussion
3.1. Effect of Nutrient Treatment on Leaf Nutrient Content
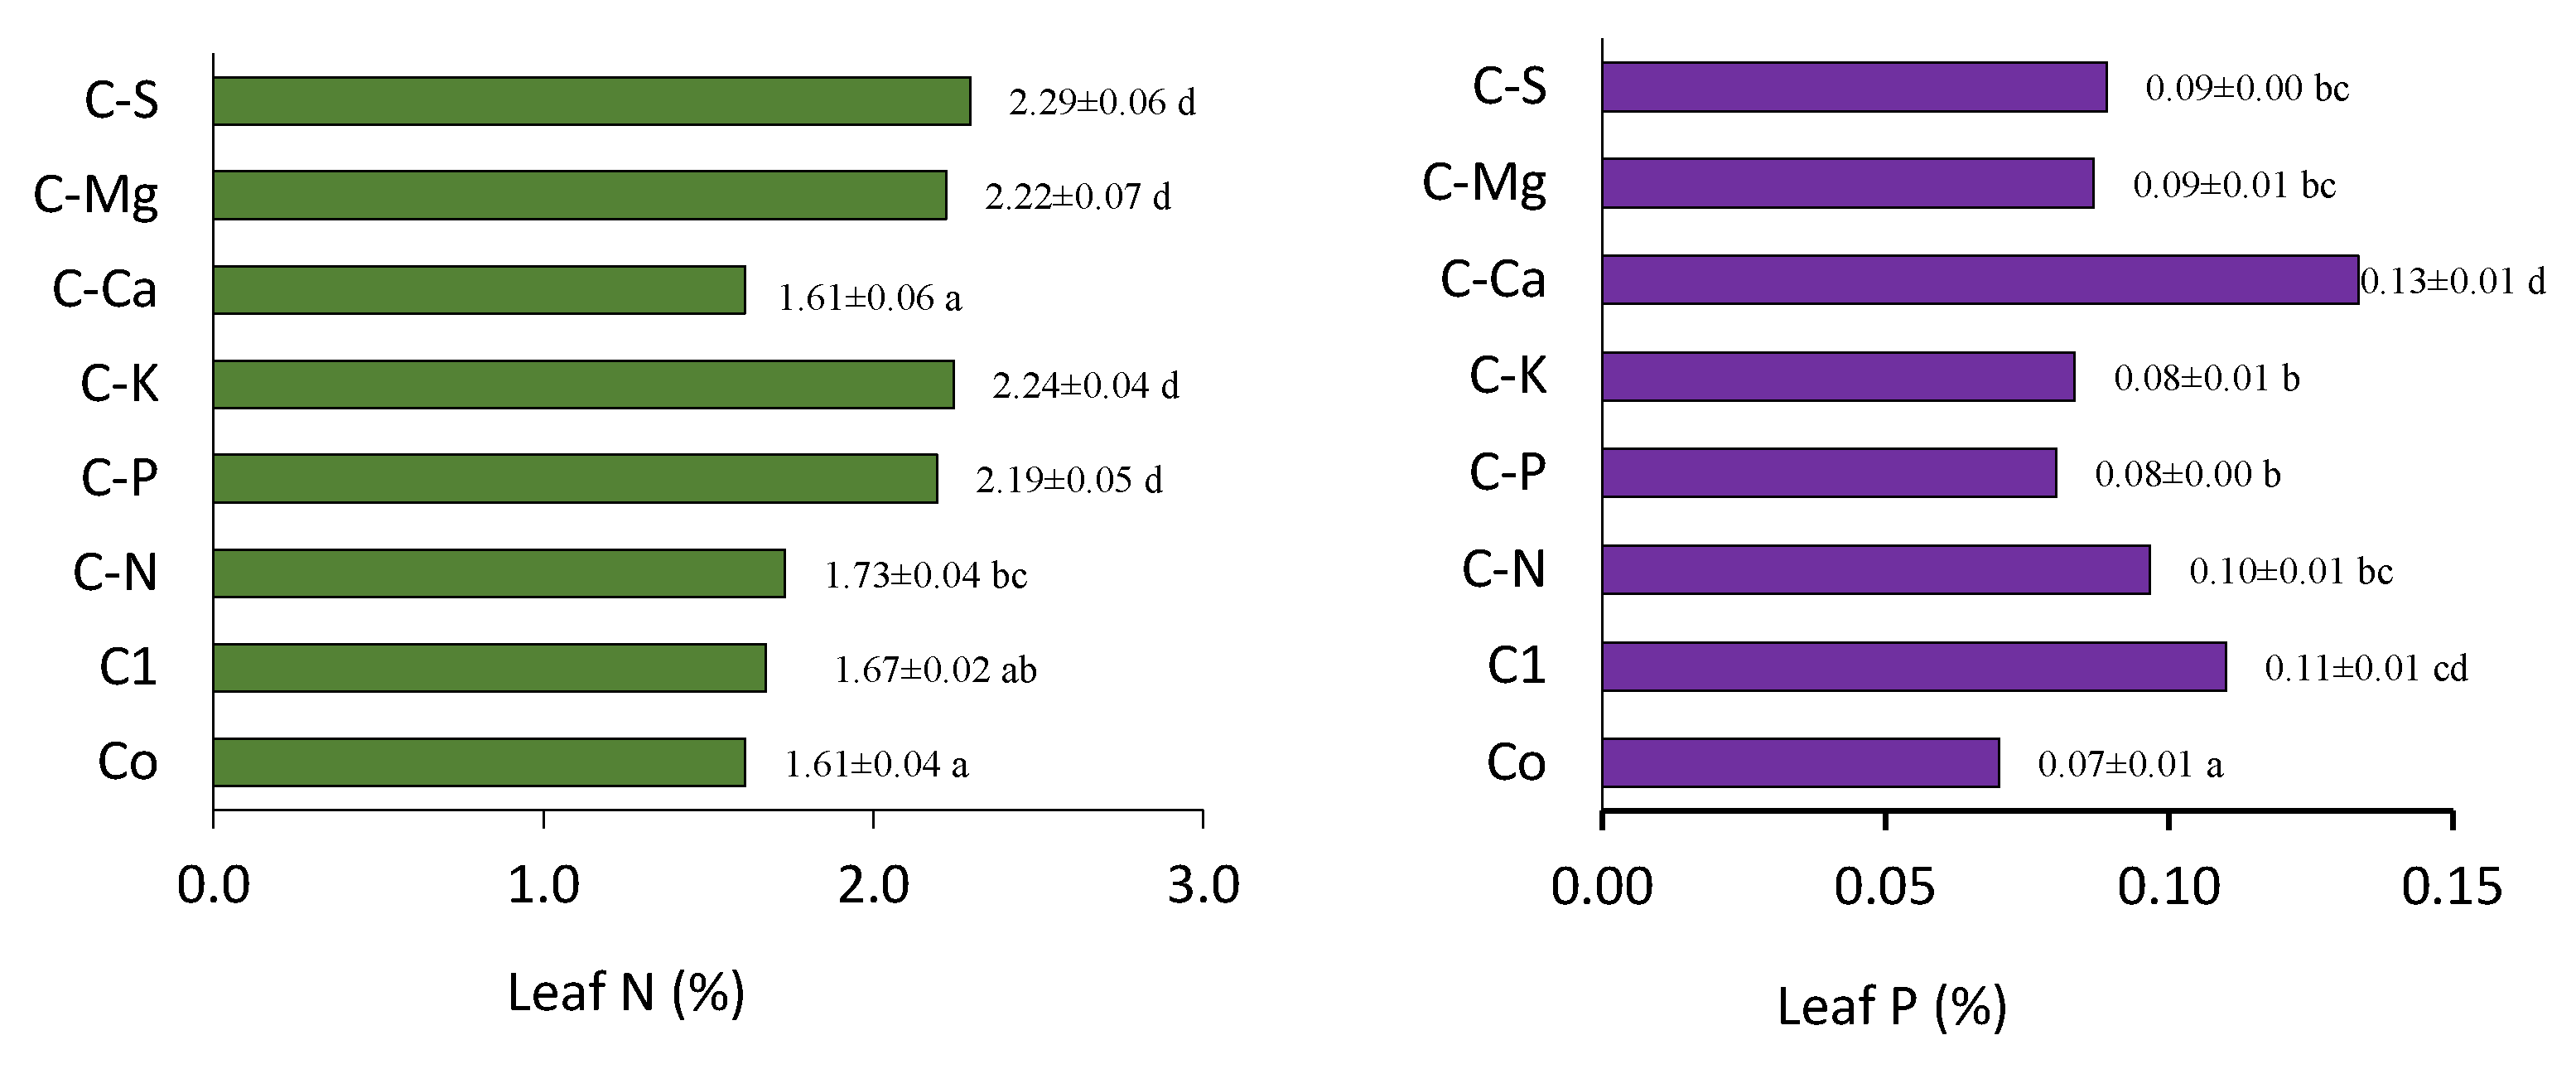
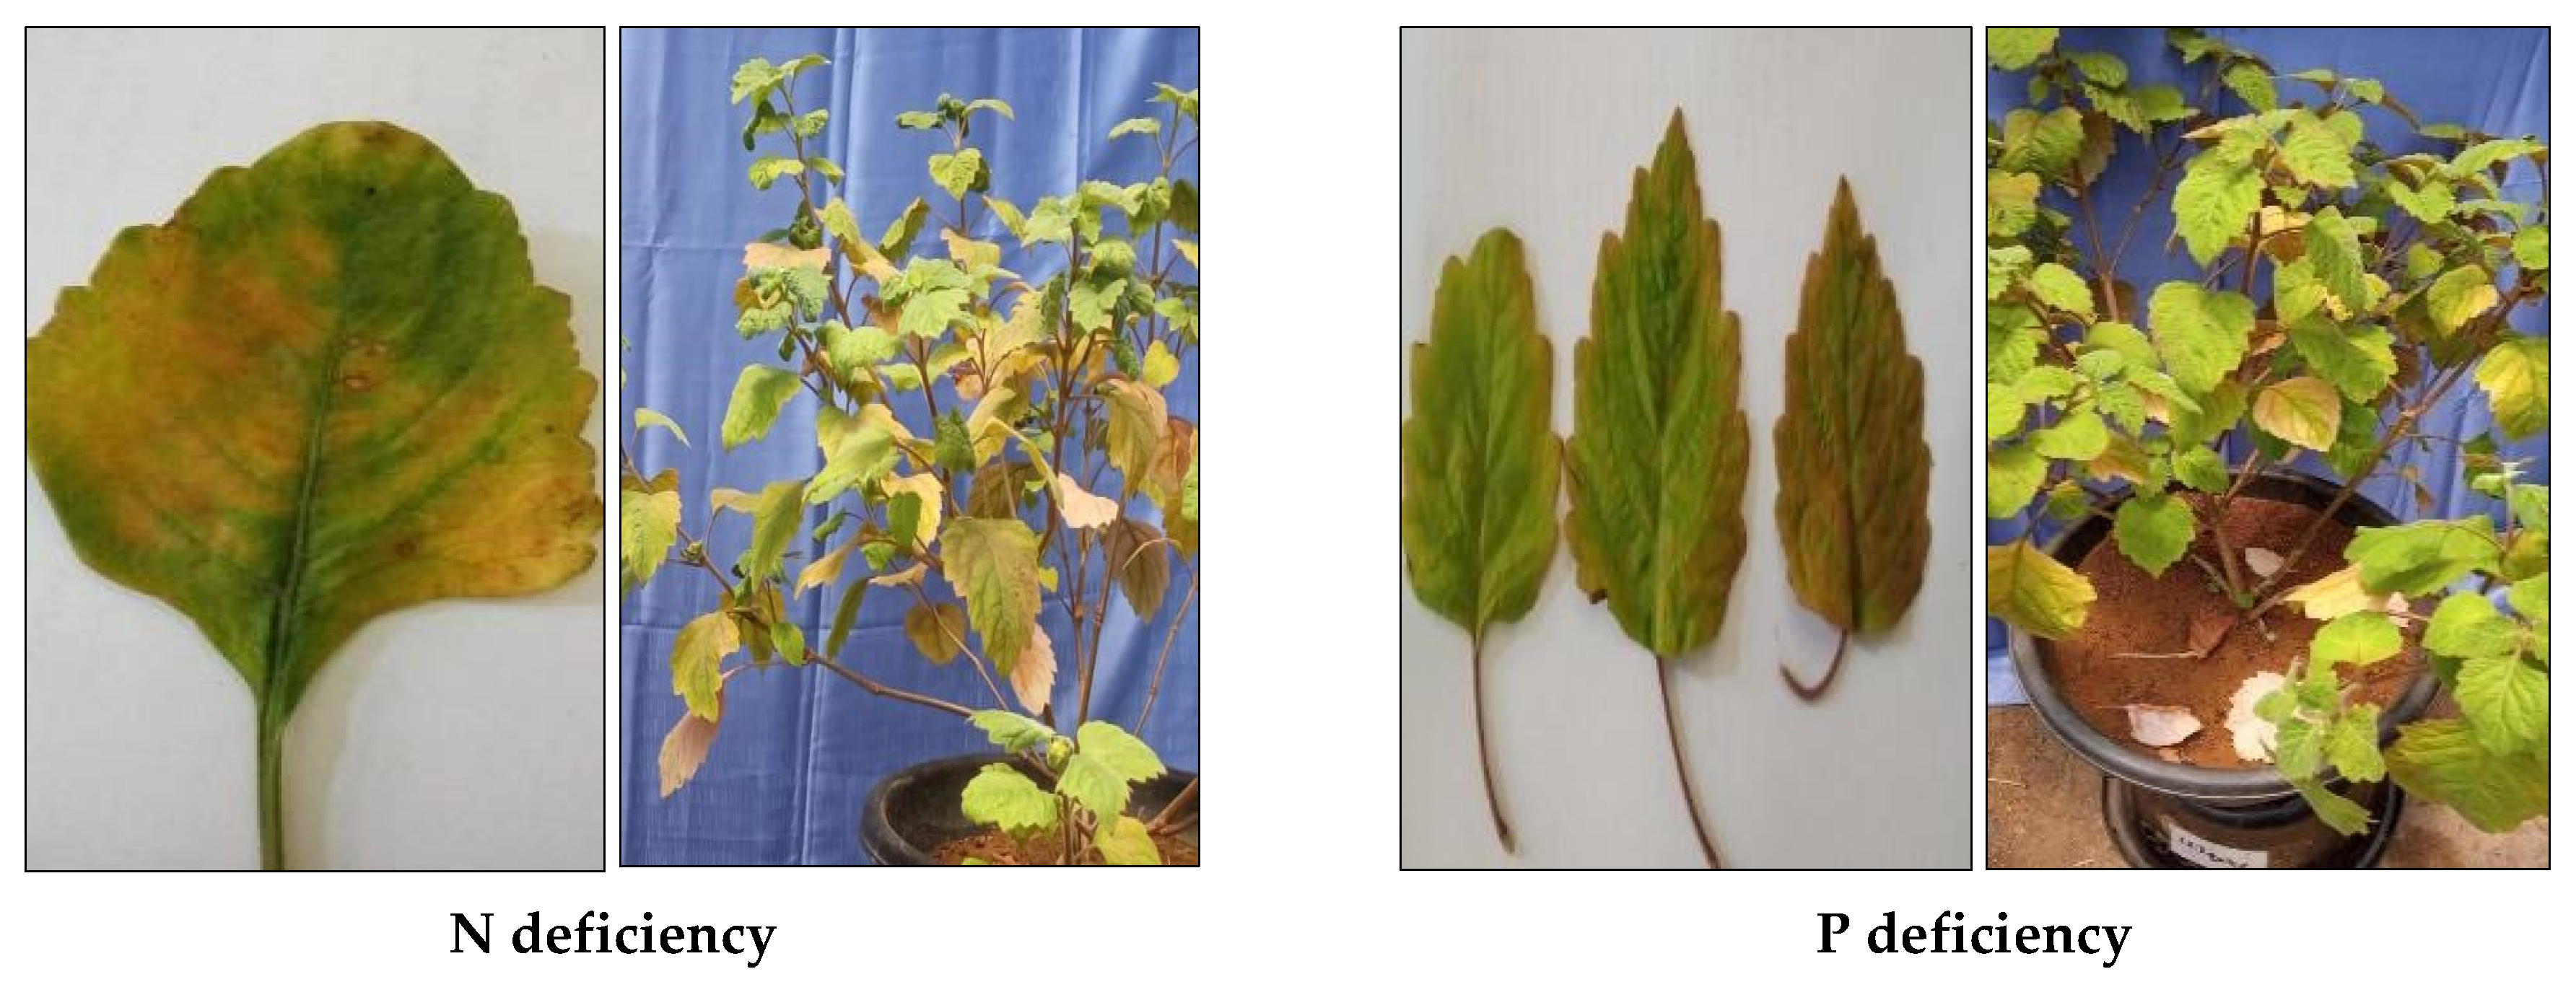
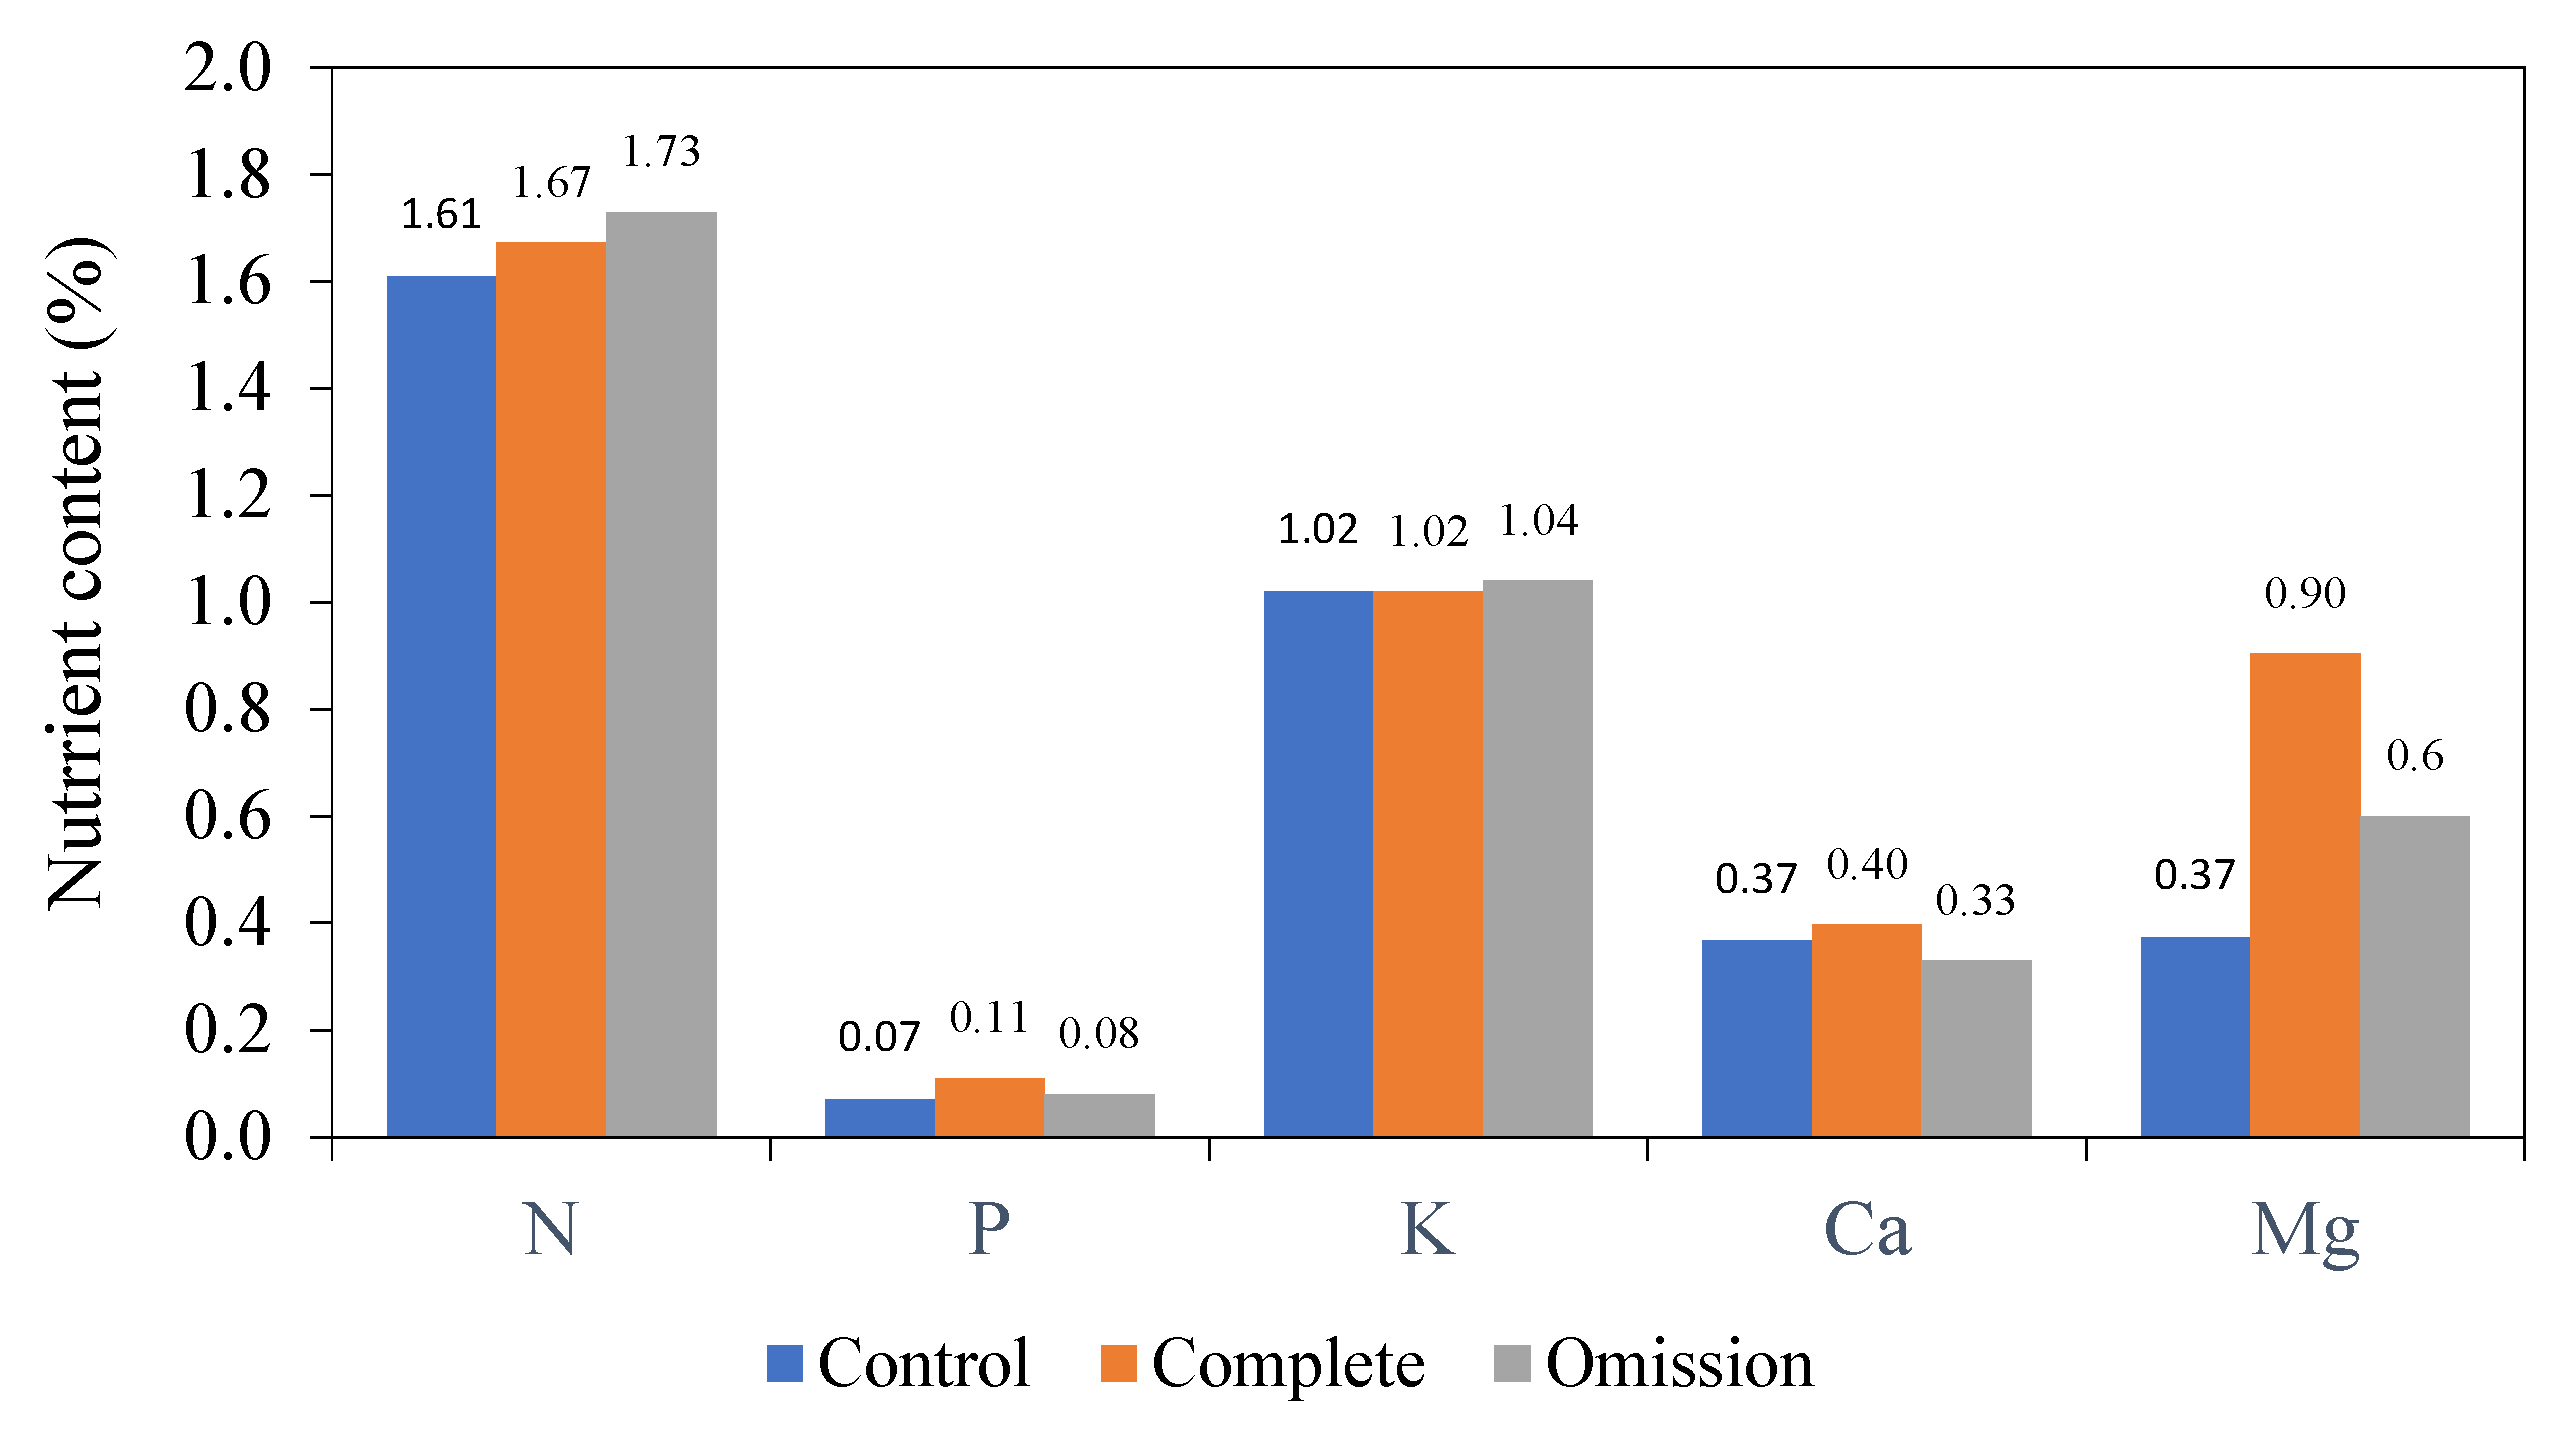
3.1.1. Nitrogen (N) and Phosphorus (P) Content in Leaves
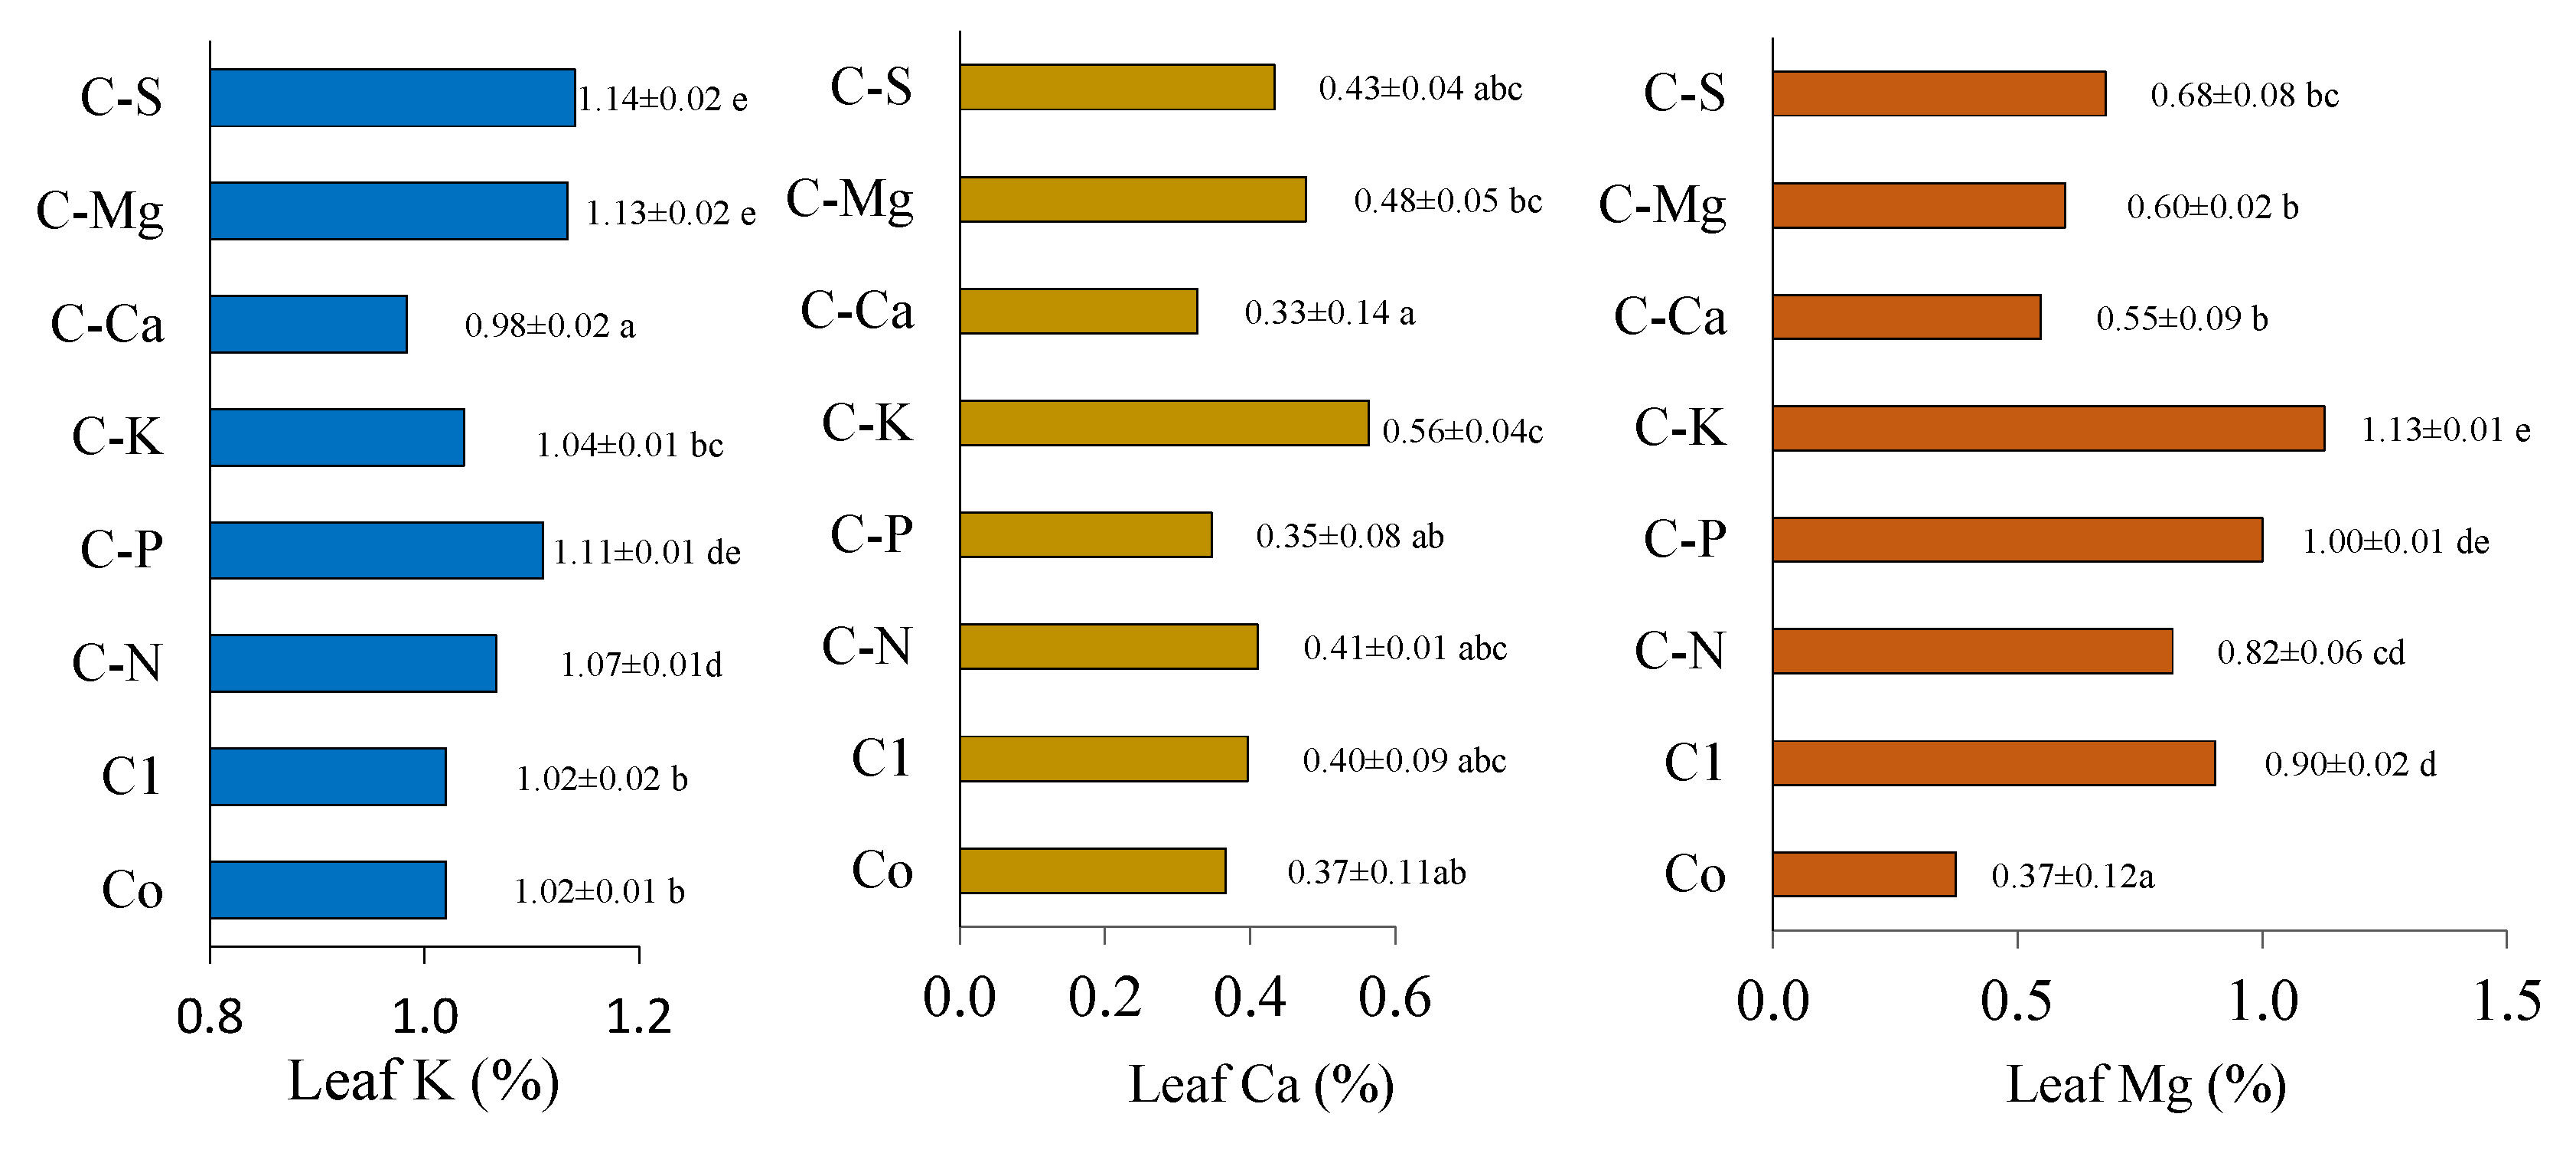
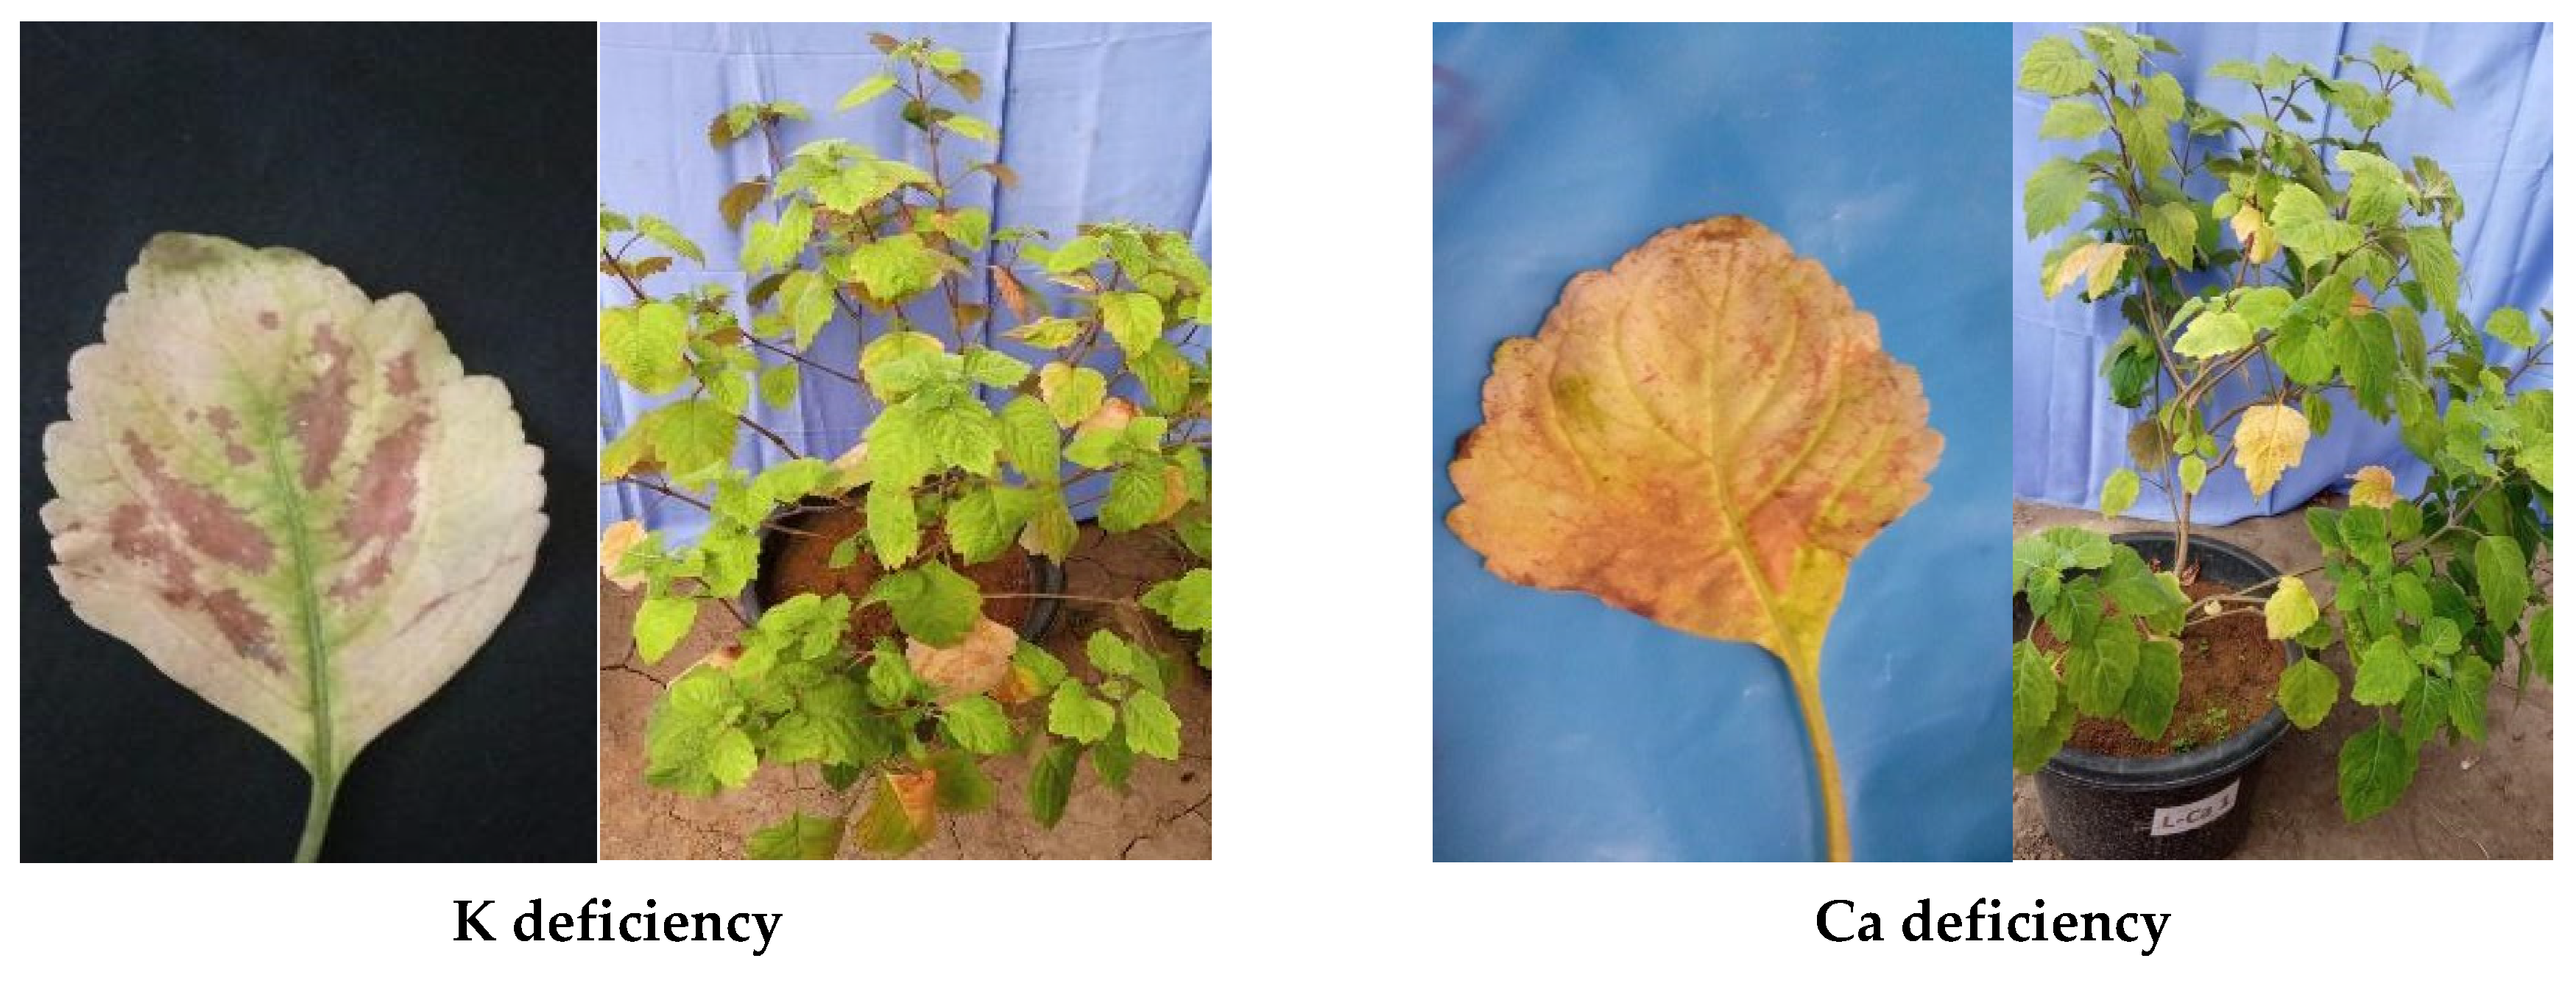
3.1.2. Calcium (Ca), Magnesium (Mg), and Potassium (K) in Leaves
3.1.3. Ratio Between N, P, K, Ca, and Mg in Leaves
3.2. Correlation Matrix Analysis
3.3. Management of Nutrient Cycle
4. Conclusions
Author Contributions
Funding
Institutional Review Board Statement
Data Availability Statement
Acknowledgments
Conflicts of Interest
References
- Zikri, I.; Agussabti; Indra; Kamaruzzaman, S.; Susanti, E.; Mujiburrahmad. Study on sustainable agriculture and dimension of needs”: A case study of patchouli farming in Aceh Jaya. IOP Conference Series. Earth Environ. Sci. 2021, 667, 012038. [Google Scholar]
- Nisa, K.; Sufardi, S.; Rusdi, M.; Indra, I. Soil quality index and patchouli yields on various cropping systems in Aceh Province, Indonesia: Case Study in Aceh Barat Regency. Case Stud. Chem. Environ. Eng. 2024, 10, 100798. [Google Scholar] [CrossRef]
- Ministry of Agriculture. Indonesian Agricultural Production Data (Last Five Years); Indonesian Ministry of Agriculture: Jakarta, Indonesia, 2022. [Google Scholar]
- McLeod, M.K.; Sufardi, S.; Harden, S. Soil fertility constraints and management to increase crop yields in the dryland farming system of Aceh, Indonesia. Soil Res. 2021, 59, 68–82. [Google Scholar] [CrossRef]
- Gonzales-Perez, J.; Sillero-Medina, J.A.; Hueso-Gonzales, P.; Ruiz-Sinoga, J.D.; Peris-Felipo, F.J.; Gayan-Quijano, A.L. Effects of a multifunctional cover crop (LivinGro) quality indicators in Zaragoza, Spain. Land 2025, 14, 27. [Google Scholar] [CrossRef]
- Prastiwi, P.; Sumarni, S.; Slamet, M.; Suntoro, S.; Supriyadi, S. The assessment of soil fertility index for evaluation of rice production in Karanganyar Regency. Mod. Appl. Sci. 2021, 15, 63–72. [Google Scholar] [CrossRef]
- Maurya, S.; Abraham, J.S.; Somasundaram, S.; Toteja, R.; Gupta, R.; Makhija, S. Indicators for assessment of soil quality: A mini-review. Environ. Monit. Assess. 2020, 192, 604. [Google Scholar] [CrossRef] [PubMed]
- Sufardi; Arabia, T.; Khairullah; Karnilawati; Fuadi, Z. Soil physical and chemical properties of several soil orders in sub dryland of Aceh Besar District, Indonesia. In Proceedings of the International Workshop and Seminar “Innovation of Environmental Friendly Agricultural Technology Sustainable Food Self-Sufficiency, Surakarta, Indonesia, 17–18 November 2018. [Google Scholar]
- Sufardi; Darusman; Zaitun; Zakaria, S.; Karmil, T.F. Chemical characteristic and soil fertility status on some Aceh Besar District dryland areas (Indonesia). In Proceedings of the International Conference on Sustainable Agriculture (ICOSA), Yogyakarta, Indonesia, 17–18 January 2017. [Google Scholar]
- Pangestu, R.A.D.; Tahir, M.; Fatahillah, F. Growth response and yield of patchouli clones (Pogostemon Cablin Benth) on various doses of urea applications. J. Agroindustri Perkeb. 2020, 8, 109–119. [Google Scholar] [CrossRef]
- Swamy, M.K.; Mohanty, S.K.; Sinniah, U.R.; Maniyam, A. Evaluation of patchouli (Pogostemon cablin Benth.) cultivars for growth, yield and quality parameters. J. Essent. Oil-Bear. Plants 2015, 18, 826–832. [Google Scholar] [CrossRef]
- Singh, R.; Singh, M.; Srinivas, A.; Rao, E.V.S.P.; Puttanna, K. Assessment of organic and inorganic fertilizers for growth, yield and essential oil quality of industrially important plant patchouli (Pogostemon cablin Benth.). J. Essent. Oil-Bear. Plants 2015, 18, 1–10. [Google Scholar] [CrossRef]
- Lisma, Y.; Baga, L.M.; Burhanuddin, B. Internal and external strategies in improving the value of patchouli agroindustry” (Case Study of Patchouli Industrial Cooperative, Aceh Barat). J. Agrisep 2015, 17, 163–174. [Google Scholar] [CrossRef]
- Pradana, R.S. The role of labor and investment in the production of the patchouli refining industry in Aceh Jaya Regency. J. Agribisnis Sumat. Utara 2020, 13, 1–9. [Google Scholar]
- Nasruddin; Khusrizal; Baidhawi; Rusdi, M. Assessment of land characteristics and recommendation for improvement in patchouli plantations in Aceh Province, Indonesia. Indian J. Agric Res. 2023, 57, 536–542. [Google Scholar]
- Havlin, J.; Heiniger, R. Soil fertility management for better crop production. Agronomy 2020, 10, 1349. [Google Scholar] [CrossRef]
- Magahud, J.C.; Dalumpines, S.L.P.; Lincuna, A.E., Jr.; Estoy, G., Jr. Growth of rice, PSB Rc 82, and status of nutrients in lowland Agusan soil under alternate wetting and drying and minus-one-element conditions. Philippine Sci. Lett. 2019, 12, 107–121. [Google Scholar]
- Sahu, N.; Jatav, G.; Mishra, V.N.; Srivastava, L.K. Farmer’s fertilizer practice and utilizing omission plot techniques to yield maximization in Inceptisols of Bemetara District of Chhattisgarh, India. J. Pharmacogn. Phytochem. 2018, 1, 1028–1030. [Google Scholar]
- Cagasan, U.A.; Jehan, M.; Libre, P.; Santiago, D.A.; Cantoneros, J.A.; Tumaca, C.M.; Pablo, A.; Hamora, G.A. Assessment on the nutrient status of lowland rice soil using minus one element technique (MOET). Eurasian J. Agric. Res. 2020, 4, 1–12. [Google Scholar]
- Syafruddin, S.; Syakur, S.; Saiful, S.; Susanti, E.; Manfarizah, M.; Khalil, M. The Effect of soil orders and mycorrhizal biofertilizer on growth and yield of Aceh’s Organic Patchouli. Sys. Rev. Pharm. 2020, 11, 334–341. [Google Scholar]
- Rosmaiti; Iswahyudi; Indra, S.B. Evaluation of soil fertility status on patchouli cultivation land (Pogostemon cablin Benth.) in Tenggulun District, Aceh Tamiang. IOP Conference Series. Earth Environ. Sci. 2025, 1466, 012005. [Google Scholar]
- Balai Pengujian Standar Instrumen Tanah dan Pupuk. Petunjuk Teknis Analisis Kimia Tanah, Tanaman, Air dan Pupuk, 3rd ed.; Balai Kementrian Pertanian Republik Indonesia: Bogor, Indonesia, 2023. [Google Scholar]
- Sashikala, G.; Reddy, B.R. Practical Handbook on Soil, Plant and Fertiliser Analysis; Brillion Publishing: Delhi, India, 2021. [Google Scholar]
- Jones, J.B., Jr. Plant Nutrition and Soil Fertility Manual, 2nd ed.; CRC Press: Boca Raton, FL, USA, 2012. [Google Scholar]
- Steel, R.G.D.; Torrie, J.H. Principle and Procedures of Statistics; A Biometrical Approach; McGraw-Hill: Detroit, MI, USA, 1980. [Google Scholar]
- Mali, R.; Narkhede, S.; Gawali, A.; Meshram, N.; Rane, A. Effect of biofertilizer and inorganic fertilizers on green and dry foliage, oil content and oil yield of patchouli (Pogostemon cabli Benth). Int. J. Farm Sci. 2023, 13, 21–25. [Google Scholar] [CrossRef]
- Lambers, H.; Chapin, F.S., III; Pons, T.L. Plant Physiology Ecology, 2nd ed.; Springer: Berlin/Heidelberg, Germany, 2008. [Google Scholar]
- Sugiatno, S. Effect of application method and dose of manure on the growth and yield of patchouli plants. J. Agrotropika 2013, 18, 52–55. [Google Scholar]
- Torres-Olivar, V.; Villages-Torres, O.G.; Dominguez-Patino, M.L.; Sotelo-Nava, H.; Rodriguez-Martinez, A.; Melgoza-Aleman, R.M.; Vaidez-Aguilar, L.A.; Tejacal, I.A. Role of nitrogen and nutrients in crop nutrition. J. Agric. Sci. Technol. 2014, B4, 29–37. [Google Scholar]
- Grzebisz, W.; Szczepaniak, W.; Przygocka-Cyna, K.; Biber, M.; Spizewski, T. The sources of nutrients for the growing ear of winter wheat in the critical cereal window. Agronomy 2024, 14, 3018. [Google Scholar] [CrossRef]
- Naz, M.; Afzal, M.R.; Raza, M.A.; Pandey, S.; Qi, S.; Dai, Z.; Du, D. Calcium (Ca2+) signaling in plant: A plant stress perspective. S. Afr. J. Bot. 2024, 169, 464–485. [Google Scholar] [CrossRef]
- Sardan, J.; Penuel, J. Potassium: A neglected nutrient in global change. Glob. Ecol. Biogeogr. 2015, 24, 261–275. [Google Scholar] [CrossRef]
- Havlin, J.L.; Tisdale, S.L.; Nelson, W.L.; Beaton, J.D. Soil Fertility and Fertilizers, 8th ed.; Pearson India Education Services Pvt. Ltd.: Bengaluru, India, 2017. [Google Scholar]
- Nemeño, G.A.; Sanchez, P.B.; Paterno, E.S.; Badayos, R.B.; Cruz, P.C.S. Nutrient dynamics and uptake of rice irrigated lowland and soils of Agusan Del Norte Subjected to episodic flooding. J. Intern. Soil Sci. Am. 2019, 25, 31–44. [Google Scholar]
- Fageria, N.K.; Baligar, V.C.; Jones, C.A. Growth and Mineral Nutrition of Field Crops, 3rd ed.; CRC Press: Boca Raton, FL, USA, 2010. [Google Scholar]
- Mengel, K.; Kirkby, E.A. Principle of Plant Nutrition, 5th ed.; Springer-Science+Business Media, B.V.: Berlin/Heidelberg, Germany, 2001. [Google Scholar]
- Nevasa, S.V.; Khobragade, N.H.; Meshram, N.A.; Thorat, S.B.; Abhale, S.; Jadhav, K.; Patil, A.; Sabale, P.; Chaudhari; Khedkar, S. Influence of biofertilizers and inorganic fertilizer on herbage and oil yield of patchouli (Pogostemon cablin Benth) and soil fertility in lateric soils of Konkan. Int. J. Res. Agron. 2024, 7, 578–580. [Google Scholar] [CrossRef]
- Nasruddin; Harahap, E.M.; Hanum, C.; Siregar, L.A.M. Enhancement of drought tolerance in patchouli (Pogostemon cablin, Benth) by modifying micro-climate and frequency of fertilization. Indian J. Agric. Res. 2020, 54, 501–505. [Google Scholar]
- Jiaying, M.A.; Tingting, C.; Jie, L.; Weimeng, F.U.; Baohua, P.; Guangyan, L.I.; Hubo, L.I.; Juncai, L.I.; Zhihai, W.U.; Longxing, T.; et al. Function of nitrogen, phosphorus and potassium in energy status and their influences on rice growth and development. Rice Sci. 2022, 29, 166–178. [Google Scholar] [CrossRef]
- Mehata, D.K.; Kattel, I.; Sapkota, P.; Ghimire, N.P.; Mehta, R.K. Biofertilizer: A sustainable strategy for organic farming that would increase crop production and soil health. Plant Physiol. Soil Chem. (Ppsc) 2023, 3, 35–39. [Google Scholar] [CrossRef]
- Biswas, S.; Hazra, G.C.; Purakayastha, T.J.; Saha, N.; Mitran, T.; Roy, S.S.; Basak, N.; Mandal, B. Establishment of critical limits of indicators and indices of soil quality in rice-rice cropping systems under different soil orders. Geoderma 2017, 292, 34–48. [Google Scholar] [CrossRef]
- Chimdi, A.; Negasa, D.; Chala, G. Effects of Rhizobium Inoculation and P Fertilizer Levels on Selected Soil Properties, Yield, and Yield Component of Faba Bean (Vicia faba L.)”: The Case of Abuna Gindeberat, West Shewa Zone, Ethiopia. Appl. Environ. Soil Sci. 2022, 22, 3635989. [Google Scholar] [CrossRef]
- Ermias, E.; Laekemariam, F. Effects of organic nutrient sources and NPS fertilizer on the agronomic and economic performance of haricot bean (Phaseolus vulgaris L.) in Southern Ethiopia. Appl. Environ. Soil Sci. 2020, 2020, 8853552. [Google Scholar]
- Kusumastuti, A.; Indrawati, W.; Nurmayanti, S.; Afifah, D.A. Growth and yield of patchouli (Pogostemon cablin Benth) in combination with soil améliorant and fertilizer SP-36. IOP Conf. Ser. Earth Environ. Sci. 2022, 1012, 012051. [Google Scholar] [CrossRef]
- Akpode, C.; Assogba, S.A.; Hoteyi, S.M.I.; Aguegue, M.R.; Agbodjato, N.A.; Adoko, M.Y.; Amogou, O.; Adjnohoun, A.; Baba-Mousa, L. Use of the biostimulant based on the mycorrhizae consortium of the Glomeraceae family in the field to Improve the Production and Nutrienal status of Maize (Zea mays L.) plant in Central Benin. Adv. Microbiol. 2023, 13, 323–345. [Google Scholar] [CrossRef]
- Xing, L.; Niu, X.; Yin, X.; Duan, Z.; Liu, A.; Ma, Y.; Gao, P. Optimizing biochar concentration for mitigating nutrient losses in runoff: An investigation of soil quality improvement and no-point source pollution reduction. Agriculture 2025, 15, 45. [Google Scholar] [CrossRef]

| No | Treatment Code | Treatment Description |
|---|---|---|
| 1 | Co | Without nutrients (not fertilized) |
| 2 | C1 | Complete nutrients of N, P, K, Ca, Mg, and S |
| 3 | C-N | Complete nutrients, without N |
| 4 | C-P | Complete nutrients, without P |
| 5 | C-K | Complete nutrients, without K |
| 6 | C-Ca | Complete nutrients, without Ca |
| 7 | C-Mg | Complete nutrients, without Mg |
| 8 | C-S | Complete nutrients, without S |
| Soil Parameters | Value | Criteria | Soil Parameters | Value | Criteria |
|---|---|---|---|---|---|
| Texture | - | Clay | Exch. Ca (cmol kg−1) | 4.80 | Low |
| Sand (%) | 8.70 | Low | Exch. Mg (cmol kg−1) | 8.00 | High |
| Silt (%) | 26.9 | Medium | Exch. K (cmol kg−1) | 0.43 | Medium |
| Clay (%) | 64.4 | High | Exch. Na (cmol kg−1) | 0.21 | Low |
| pHH2O (1:2.5) | 6.03 | Slightly acid | CEC (cmol kg−1) | 31.8 | High |
| pHKCl (1:2.5) | 5.90 | Slightly acid | BS (%) | 33.7 | Low |
| SOC (%) | 2.39 | Medium | Exch. Al (cmol kg−1) | 0.40 | Low |
| TN (%) | 0.25 | Medium | Total P2O5 (mg 100 g−1) | 56.1 | High |
| Available P (mg kg−1) | 12.5 | High | Total K2O (mg 100 g−1) | 37.9 | Medium |
| EC (mS m−1) | 0.40 | Low |
| Macronutrients | Analysis Methods | Equipment Used |
|---|---|---|
| Nitrogen (N) | Kjeldahl or Dumas method | Kjeldahl distillation, CHNS analyzer |
| Phosphorus (P) | Spectrophotometric, Asam molybdate (colorimetric) | UV-VIS spectrophotometer |
| Potassium (K) | Flame spectrophotometer | Flame photometer/AAS |
| Calcium (Ca) | Atomic absorption spectrophotometer | AAS (atomic spectrophotometer) |
| Magnesium (Mg) | Atomic absorption spectrophotometer | AAS (atomic spectrophotometer) |
| Sulfur (S) | Turbidimetry (formation of CaSO4) | UV-VIS spectrophotometer |
| Sources of Variance | df | F Value | F Table | |||||
|---|---|---|---|---|---|---|---|---|
| N | P | K | Ca | Mg | 0.05 | 0.01 | ||
| Block | 2 | 0.86 | 0.09 | 0.12 | 3.77 | 0.13 | 3.74 | 6.51 |
| Treatments | 7 | 3.68 * | 28.04 ** | 42.6 ** | 3.66 * | 40.5 ** | 2.76 | 4.28 |
| Error | 14 | |||||||
| Total | 23 | |||||||
| Fertilizers Treatment Codes | N:P | N:K | Ca:K | K:Mg | Ca:Mg |
|---|---|---|---|---|---|
| Co | 1:23 | 1:2 | 3:1 | 1:3 | 1:1 |
| C1 | 1:15 | 1:2 | 3:1 | 1:1 | 2:1 |
| C-N | 1:18 | 1:2 | 3:1 | 1:1 | 2:1 |
| C-P | 1:27 | 1:2 | 3:1 | 1:1 | 3:1 |
| C-K | 1:27 | 1:2 | 2:1 | 1:1 | 2:1 |
| C-Ca | 1:12 | 1:2 | 3:1 | 1:2 | 2:1 |
| C-Mg | 1:26 | 1:2 | 2:1 | 1:2 | 1:1 |
| C-S | 1:26 | 1:2 | 3:1 | 1:2 | 1:1 |
| Leaf Nutrient Contents | N | P | K | Ca | Mg |
|---|---|---|---|---|---|
| (g kg−1) | |||||
| N (g kg−1) | 1 | ||||
| P (g kg−1) | −0.449 * | 1 | |||
| K (g kg−1) | 0.760 ** | −0.451 * | 1 | ||
| Ca g kg−1) | 0.415 * | −0.223 | 0.198 | 1 | |
| Mg (g kg−1) | 0.431 * | −0.075 | 0.101 | 0.308 | 1 |
Disclaimer/Publisher’s Note: The statements, opinions and data contained in all publications are solely those of the individual author(s) and contributor(s) and not of MDPI and/or the editor(s). MDPI and/or the editor(s) disclaim responsibility for any injury to people or property resulting from any ideas, methods, instructions or products referred to in the content. |
© 2025 by the authors. Licensee MDPI, Basel, Switzerland. This article is an open access article distributed under the terms and conditions of the Creative Commons Attribution (CC BY) license (https://creativecommons.org/licenses/by/4.0/).
Share and Cite
Zuraida, Z.; Sufardi, S.; Helmi, H.; Jufri, Y. Diagnosis of Macronutrients in Patchouli Leaves and Response to Fertilizers in Inceptisols of Aceh: A Case Study in Aceh Besar Regency, Indonesia. Agriculture 2025, 15, 651. https://doi.org/10.3390/agriculture15060651
Zuraida Z, Sufardi S, Helmi H, Jufri Y. Diagnosis of Macronutrients in Patchouli Leaves and Response to Fertilizers in Inceptisols of Aceh: A Case Study in Aceh Besar Regency, Indonesia. Agriculture. 2025; 15(6):651. https://doi.org/10.3390/agriculture15060651
Chicago/Turabian StyleZuraida, Zuraida, Sufardi Sufardi, Helmi Helmi, and Yadi Jufri. 2025. "Diagnosis of Macronutrients in Patchouli Leaves and Response to Fertilizers in Inceptisols of Aceh: A Case Study in Aceh Besar Regency, Indonesia" Agriculture 15, no. 6: 651. https://doi.org/10.3390/agriculture15060651
APA StyleZuraida, Z., Sufardi, S., Helmi, H., & Jufri, Y. (2025). Diagnosis of Macronutrients in Patchouli Leaves and Response to Fertilizers in Inceptisols of Aceh: A Case Study in Aceh Besar Regency, Indonesia. Agriculture, 15(6), 651. https://doi.org/10.3390/agriculture15060651