Article

Exploring the Root-Associated Bacterial Community of Tomato Plants in Response to Salt Stress

1
Research Centre for Agriculture and Environment, Council for Agricultural Research and Economics (CREA-AA), 50125 Florence, Italy
2
Research Centre for Plant Protection and Certification, Council for Agricultural Research and Economics (CREA-DC), 00156 Rome, Italy
3
Department of Environmental Biology, Sapienza University of Rome, 00185 Rome, Italy
4
Research Centre for Agriculture and Environment, Council for Agricultural Research and Economics (CREA-AA), 00184 Rome, Italy
*
Author to whom correspondence should be addressed.
Agriculture 2025, 15(6), 624; https://doi.org/10.3390/agriculture15060624
Submission received: 31 December 2024 / Revised: 7 March 2025 / Accepted: 13 March 2025 / Published: 15 March 2025
(This article belongs to the Section Agricultural Soils)

Abstract

:
Salinity is one of the main abiotic stresses that limits plant growth. This study addressed how the composition and diversity of root-associated bacterial communities reacts over time to salt-induced stress conditions. To understand its adaptation to soil salinization, the microbiome was studied by total DNA extraction and sequencing, using the Illumina MiSeq platform. Additionally, we evaluated the plant metabolites associated with salt stress (oxylipins, fatty acids (FAs) and hormones) by mass spectrometry. Salinity reduced rhizosphere bacterial diversity in salt-treated plants at 7 and 14 days and triggered a progressive shift of the bacterial structure, starting 7 days after salt stress imposed. The bacterial rhizosphere community became enriched with specific bacteria associated with potential genes involved in the PGP trait and ion homeostasis. For these plants, metabolites that showed higher levels included 9-lipoxygenase (LOX) oxylipins, which were found at days 7 and 14. The results indicated that salinity seems to have induced changes in the rhizosphere bacterial community, with characteristics that may help the plant respond to the imposed stress. Furthermore, our study highlighted the role of 9-LOX oxylipins in responding to salinity stress, providing new insights into the complex plant–microbe interactions under salt stress.

1. Introduction

Increased soil salinity is a significant abiotic stress in agriculture that affects approximately 9.35 × 10⁸ hectares (ha) worldwide, causing major reductions in crop yield and quality, particularly in irrigated regions [1,2,3]. Soil is classified as saline when the concentration of soluble salts, especially sodium (Na+), calcium (Ca2+) and magnesium (Mg2+), reaches the level of electrical conductivity of the saturation extract (ECe) in the plant’s root zone greater than 4 dS m−1 [1,4,5]. Among the compounds that cause soil salinity, the main one that negatively affects plants is sodium chloride (NaCl) [6,7]. The main effects of excessive salts in the soil on plant physiology are connected to the increase of osmotic pressure, resulting in reduced plant ability to adsorb water [8] and ion toxicity through the accumulation of harmful ions, which compete with essential elements such as K+, Ca 2+, and NO3; this leads to reduced nutrient acquisition by the crops. These factors trigger different responses in plants, manifested by a variety of symptoms: inhibited photosynthesis process and lower production of new leaves, increased morphological changes of organs (leaf thickening and succulence, decrease of internode lengths), wilting, drying and even necrosis of organs and entire plants [8,9,10].
Moreover, these salinity-induced factors have an impact on the microbial community of soil, mediated by harmful actions on microbial cells, leading to cell drying and lysis [11]. Despite these events being well documented on free microbial cells cultivated in vitro, such impacts on microbial communities in soil are still not well understood [11,12,13]. These contrasting results in the response of the microbial communities to salt stress are related to the different habitats or context and should be correlated to the salinity level in the soil, soil proprieties, vegetation type and communities’ composition of the studied microorganisms [13]. Thus, a challenge in understanding the effects of salinity on soil microbial communities is the fact that it can be difficult to disentangle the effects of salinity from those of other variables that may co-vary with salinity [14].
Based on their tolerance to soil salinity, plants can be classified into two groups: halophytes are plants adapted to live in saline environments, while glycophytes include plants that tolerate low levels of soil salinity. Many important agricultural crops fall under the glycophytes category [15]. Tomato (Solanum lycopersicum L.) is classified as a glycophytes species, since it is identified as moderately sensitive to salinity, as reported by the Maas and Hoffman (1977) [16] model. Tomato is widely consumed worldwide as a fresh or processed food product. It is commonly cultivated in open field and greenhouse conditions. The main producers are located in the Mediterranean area (Turkey, Egypt, Italy, Spain, and Morocco), with approximately 181 million tons produced from 5 Mha per year, according to the Food and Agriculture Organization Statistics (FAOSTAT) [17]. Nevertheless, the economic importance of tomato cultivation, the increase in soil salinity in many areas occupied by this crop and the economic damage that may result have led researchers to focus their attention on studying the behavior of tomato plants in different salinity conditions [18,19]. Tomato plants, as well as other glycophytes plants, have evolved many physiological, biochemical and molecular mechanisms to adapt to environmental stresses [20,21,22]. Among these, phytohormones, such as cytokinins, abscisic acid (ABA), ethylene (ET), brassinosteroids, jasmonic acid (JA) and salicylic acid (SA), have been recognized as molecules that play a key role in the adaptation to stress conditions [23,24,25]. In the context of salt stress, JA is one of the most studied phytohormones and it plays a key role in mediating the defense response to stress. JA belongs to the group of oxylipins, a broad family of bioactive lipids that result from oxidation of polyunsaturated fatty acid (PUFA), mainly palmitoleic, oleic, linoleic and linolenic acid, via the lipoxygenase (LOX) pathway, dioxygenases pathway (DOX) or spontaneous oxidation [26,27]. Oxylipins comprise other ubiquitous metabolites that are involved in stress response, by regulating stress-induced gene expression and interacting with other signaling pathways in plant cells [27]. However, oxylipins are biosynthesized not only by plants, but also by microorganisms such as fungi and bacteria, in which they have a role in development and communication [28,29]. Several pieces of evidence led to the definition of oxylipins as an inter-kingdom common lipid language. Currently, enormous progress in the study of oxylipins in biotic stress responses has been achieved, while the role of these substances in plant adaptation to abiotic stress conditions has received less attention [30,31,32].
Although plants have multiple adaptation mechanisms, plant microbes’ interaction is essential to the establishment of tolerance. Plants in their natural environment are commonly associated with microorganisms in the phyllosphere and rhizosphere and they are colonized both by endocellular and intracellular microorganisms [33]. In particular, beneficial rhizosphere microorganisms, also called plant growth promoting rhizobacteria (PGPR), are well known in agriculture for suppressing the negative effects of abiotic stresses on plant growth. Several studies have reported that PGPR have a direct effect on primary plant metabolism through the improvement of nutrient uptake by solubilization of inorganic phosphate, nitrogen fixation or through triggering a sequence of signal events from signal perception to metabolic response, leading to stress tolerance [23,33]. PGPR are currently used as alternatives to agrochemicals in agriculture to enhance plant growth, production and abiotic stress tolerance [8,34,35]. However, the defensive role of PGPR against salinity stress is not yet understood [36]. Understanding the intricate mechanisms driving communication between soil, plants and root-associated microorganisms under salinity stress condition is thus critical in order to exploit stress tolerance mechanisms.
The aim of this work was to evaluate the dynamics of root-associated microbial communities of tomato and of the plant’s response to imposed salt stress. For this purpose, the root-associated microbial community was investigated at different times after a salt treatment. Moreover, to understand the mechanisms triggering the defense response in plants, phytohormones (JA and SA) and shared plants’ microbial metabolites (oxylipins and free fatty acids (FFAs)) were evaluated by mass spectrometry. We assumed that changes in rhizosphere microbial communities are important and might be different over time. Additionally, we suggest that, in spite of a dominant ‘noise’ (salinity), such complex environmental factors might regulate the development of soil microbial communities in saline soil.

2. Materials and Methods

2.1. Experimental Trial and Treatments

The trial consisted of a pots experiment with tomato plants (Solanum Lycopersicum L., cv. Cuore di Bue) carried out in a greenhouse under natural light conditions, from April to June 2023. Pots were filled with a commercial growth substrate (Brill Typical, Type 3 special, Agrochimica S.P.A., Bolzano, Italy) as growing medium, made from a mix of 50% “white peat” (poorly decomposed peat, providing better air capacity and drainage), and 50% “black peat” (highly decomposed peat, enhancing water holding and buffering capacity), with 1000 g/m3 of N, P, K added as a fertilizer. Compared to natural soils, this matrix represented a simplified environment that was useful to better highlight any effect on the microbiome due to salt stress. The mix was laid over a bottom layer of expanded clay as a draining bed. The substrate featured 0.4 dS m−1 electrical conductivity (EC), 140 kg m−3 bulk density (BD) and 6.5 pH, 90% total porosity.
Certified tomato seeds were germinated in trays with the same substrate. At the 5th–7th leaf stage, a selected pool of ten uniformly developed seedlings were collected and transplanted in individual 500 mL pots (one plant per pot). The experiments involved two treatments, starting one week after seedling transplantation: (i) a salt stress-inducing treatment (SS) based on a single salt treatment through irrigation with tap water supplemented with NaCl (10 dS m−1); and (ii) a control treatment (CTRL) with no salt application. For each treatment, five plants (replications) were used, with pots arranged randomly to ensure uniform greenhouse condition for plants. In the trial period that followed, until the end of the experiment, all plants were supplied with untreated tap water, in order to keep the growth substrate moisture at the field capacity (FC) level.

2.2. Rhizophere and Leaf Sample Collection

For each treatment, three out of five pots (replicates) were randomly chosen for substrate sampling. Sampling was performed at 1, 7, 14 and 21 days after the salt treatment. For each replicate, four sub-samples were collected and combined into a composite sample. The samples were taken with a spatula near the roots, in the so called ‘peri-rhizosphere’ (hereafter referred to as the “rhizosphere sample”), ensuring the plant roots were not collected, to minimize disturbance to the plant. The rhizosphere sample was used for EC measurement and DNA extraction. For EC measurement, the sample was air-dried and stored in plastic bags at room temperature, while the sample for DNA extraction was immediately stored at −80 °C after sampling. In addition, three replicates samples were collected from the commercial source substrate (hereafter referred to as the “bare sample”) and used as time 0 (T0) of the trial.
At the same time points, leaves of similar dimensions were collected, pooled together (per treatment) in a pre-weighed tin foil, immediately placed in liquid nitrogen to avoid oxidation, and then stored at −80 °C for at least one night. Then leaves were lyophilized, ground in a mortar with liquid nitrogen and stored in 2 mL tubes at −20 °C until the oxylipin extraction.

2.3. EC Measurement of Commercial Substrate

The growth substrate from each treatment was monitored for electrical conductivity (EC), in order to account for possible treatment-induced changes over time. EC was measured on a 1:10 (W:V) soil:water extract after filtration [37]. EC measurement was also performed on the fresh and salt-added water.

2.4. Total DNA Extraction and Illumina Sequencing from Rhizosphere Samples

DNA extraction was performed from 250 mg of each rhizosphere sample using the Soil DNA E.Z.N.A kit and following the manufacturer’s instructions. The quality and quantity of the extracted DNA were checked by 0.8% agarose gel electrophoresis and a Lite Plus NanoDrop spectrophotometer (Thermo Fisher Scientific, Waltham, MA, USA). The bacterial 16S rRNA gene V3-V4 hypervariable regions were sequenced using the primers forward: TACGGGAGGCAGCAG [38] and reverse: CCAGGGTATCTAATCC [39]. Amplicons were purified, quantified and homogenized to obtain sequencing libraries. Then, the libraries were sequenced by Illumina Mi-seq (2 × 300 bp). PCR amplification, purification, quantification, library construction and sequencing were performed by an external company (Eurofins Genomics, Ebersberg, Germany). Sequence files have been submitted in the NCBI sequence read archive (SRA) and are available under the accession number PRJNA1204325.

2.5. Oxylipins, Phytohormones and Fatty Acids Extraction and Analyses

Lyophilized and ground leaves (20 mg) were used to extract FFA, such as saturated fatty acids (SFAs) (from C16:0 to 24:0) and polyunsaturated fatty acids (PUFA) (18:1 to 18:3), 9 and 13 oxylipins, and plant hormones as salicylic and jasmonic acid (SA and JA, respectively), following the method reported in Scala et al. [40]. Briefly, 2 mL of isopropyl alcohol/water/ethyl acetate (1:1:3 v/v) and 0.0025% w/v of butylated hydroxytoluene were added to the samples to avoid peroxidation. Internal standard 9-HODEd4 (Cayman Chemicals, Ann Arbor, MI, USA) was added at the final concentration of 2 µM (calculated on the volume of final resuspension in methanol, 100 µL). Samples were mixed (5 min, 349,375 g), centrifuged (10 min 9447 g at RT) and the clear supernatant was collected in a new 2 mL tube; the extraction procedure was repeated with the remaining pellet, adding 1 mL of ethyl acetate. The collected supernatant was dried under nitrogen stream and the dried samples were resuspended in 100 μL of methanol. Extraction was performed in duplicate for each sample, and each extract was analyzed in three technical replicates. The chromatographic separation and mass spectrometry parameters were set by following the indications reported in Scala et al. (2018) [40]. The extracts were analyzed by HPLC coupled to a Triple Quadrupole (6420 Agilent Technologies, Santa Clara, CA, USA), the oxylipins and hormones were analyzed using the multiple reaction monitoring (MRM) approach, and FFAs were evaluated by single ion monitoring (SIM) method. Data and parameters for FFA, oxylipin and hormone analysis are shown in Tables S1 and S2.

2.6. Metabolomic Statistical Analysis

MRM and SIM data were processed using Mass Hunter Quantitative software (B.07.00 version, Agilent Technologies, Santa Clara, CA, USA) and exported in tabular format. Each variable abundance on the dataset was normalized by the internal STDi abundance (9-HODEd4) using Microsoft Excel and then imported into R studio (version 4.3.1) for statistical analyses. The distribution of samples based on metabolomics variables was analyzed by PCA. Difference in metabolomic pattern between treatments and time were assessed by PERMANOVA. A heatmap was generated using the means of data in each sample, calculated by averaging the biological replicates for each sample. The biological replicates were calculated as the mean of the three technical replicates of the same lipid extract.

2.7. 16S rDNA Statistical Analysis

Sequencing data were downloaded from the sequencing service provider, and reads were inspected for overall quality. Amplicon sequencing analysis produced a total of 3,040,984 forward and reverse reads, with library depth per sample that varied from a minimum of 81,289 reads to a maximum of 151,503. Data were treated similarly to that recently reported in Del Duca et al. [41] using QIIME2 [42]. Briefly, after sequence import in QIIME2, forward and reverse amplification primers were removed in paired end mode using CUTADAPT [43] (version 3.5) (command qiime cutadapt trim-paired, discarding untrimmed reads) while chimera filtering, denoising and ASV picking were performed using DADA2 [44] (command qiime dada2 denoise-paired using the following parameters: --p-trunc-len-f = 280, --p-trunc-len-r = 250, --pmin-overlap = 15). Taxonomy was then assigned using Sklearn [45] (command qiime feature-classifier classify-sklearn with default settings) against the SILVA database [46] (version 138). Data were finally exported in tabular format for use in downstream analyses.
The statistical analyses were performed using R software [47]. Bacterial diversity was estimated using the microbiome package (version 1.22.0) [48]. Alpha diversity in bacterial communities was explored using three indices: species richness (i.e., the number of different ASVs in a sample), evenness index (i.e., the grade of equitability in the distribution of relative abundances of the ASVs in a sample), and Shannon index (i.e., a measure of diversity of the community in a sample) by function ‘alpha’ of the microbiome package. The effects of time and treatment on alpha diversity of bacterial communities were analyzed by one-way ANOVA. Beta-diversity was explored and visualized using principal coordinate analysis (PCoA) ordinations based on the Bray–Curtis dissimilarity, using the ‘transform_sample_counts’ and ‘ordinate’ functions of the phyloseq package. The effects of time and salinity stress on the structure of the bacterial community were tested using permutational multivariate analysis of variance (‘adonis2’ function of the vegan R package) with 999 permutations. Statistical analysis of metagenomic profiles (STAMP) (version 2.1.3) [49] was used to discover the differentially abundant genus taxa between groups, with filtering based on effect size > 1 and p-value < 0.05. A non-parametric t-test was performed in STAMP to identify those genera whose abundance was significantly different between the two groups. Picrust2 analysis was performed on the selected genera to predict the potential different functions in the microbiome between the groups [50]. The correlations among bacterial community diversity, taxa, functional genes and oxylipins content were assessed by Spearman’s correlation.

3. Results

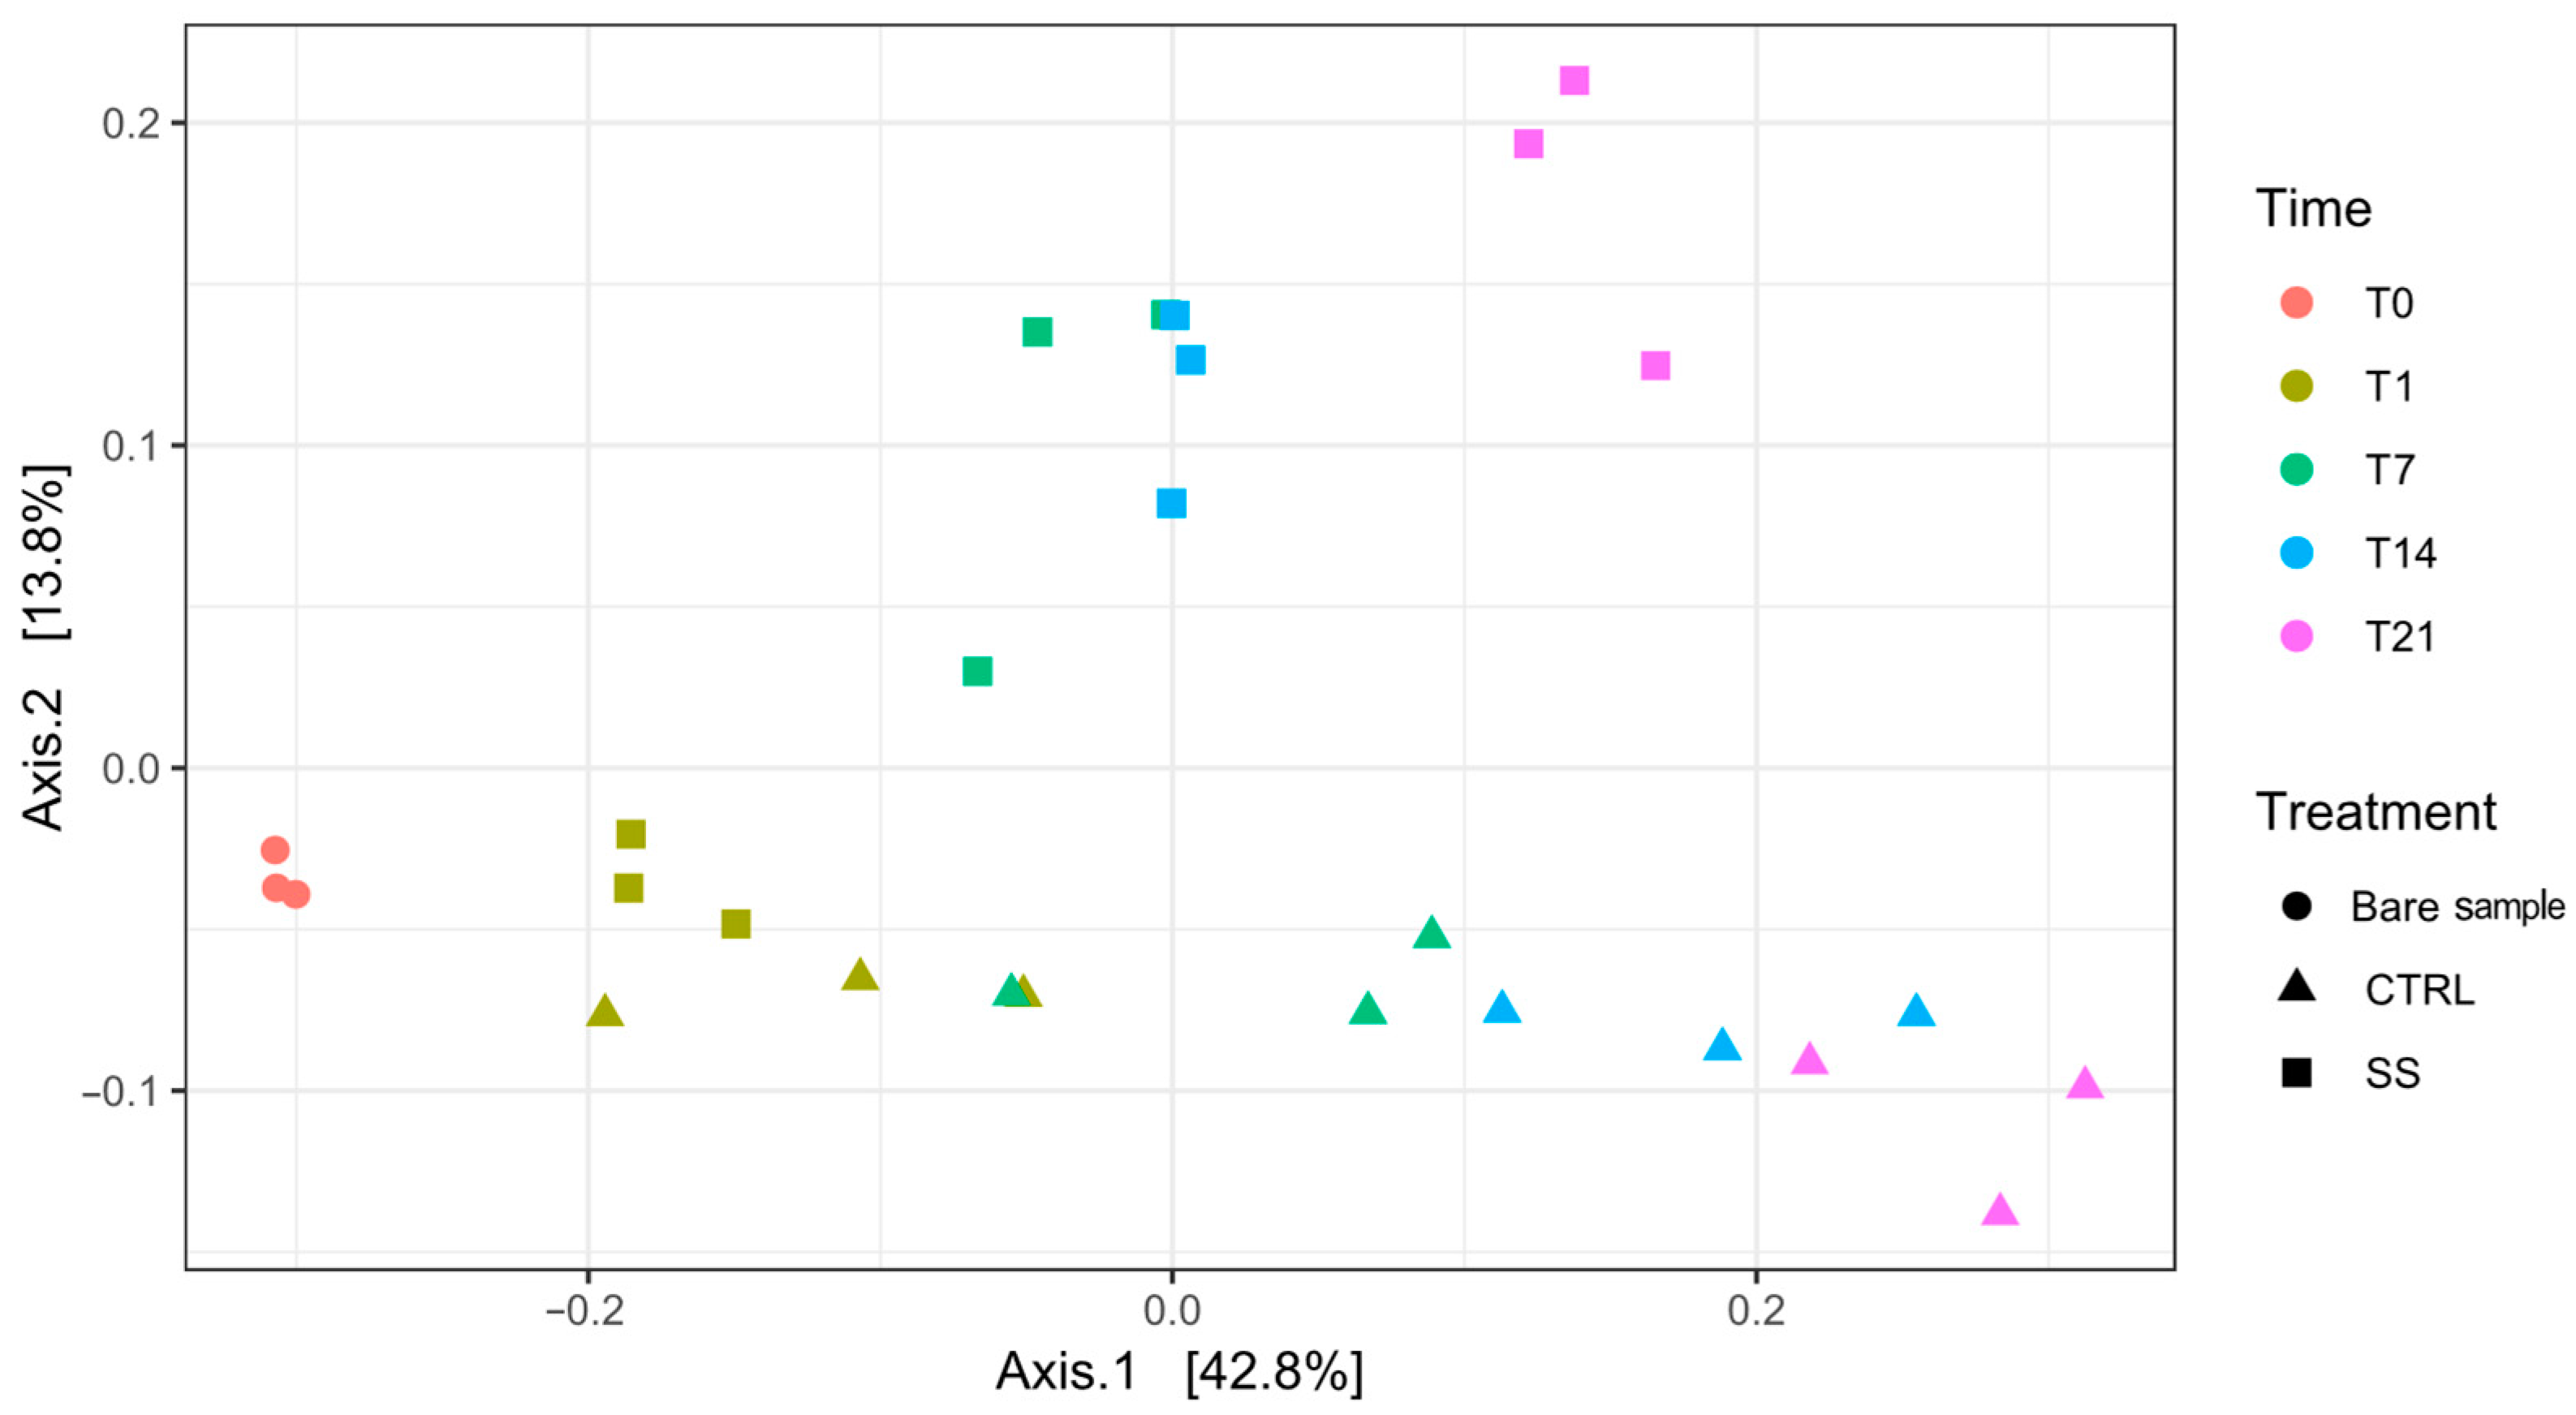
3.1. Biodiversity of Rhizosphere Microbiome

Analysis of alpha diversity revealed a lower Shannon index, evenness and richness of the bare sample (T0) compared to the rhizosphere sample of both salt-treated (SS) and untreated groups (CTRL) (p < 0.01) (Figure 1).
In relation to the bacterial diversity at the time points after the stress treatment (from day 1 to 21), we observed an overall increasing trend in both the CTRL and SS groups, but the diversity indices were significantly different according to time only in the SS group (ANOVA, p < 0.05). Notably, Tukey’s post hoc test analysis on diversity indices over time indicated a significant difference in the Shannon and evenness indices between time point 1 (T1) and other times (p < 0.05). Richness estimated by the observed index revealed no significant differences in ASV number among time points. Results of Tukey’s post hoc test performed on Shannon and Pielou’s evenness by time are reported in Table 1.
Comparing the CTRL and SS groups, the salt treatment consistently led to a lower microbial diversity over time, a trend that was not observed for the CTRL group, as confirmed by the ANOVA test (treatment, p < 0.05). There were no significant differences between the two groups for at the first time point. However, on both days 7 and 14, significant changes in the Shannon and evenness indexes between control and treated groups were supported by the ANOVA results (p < 0.05). The biodiversity reached a comparable level between the groups on day 21.
β diversity was measured to evaluate the differences in community structure between the CTRL and SS groups via principal coordinate analysis (PCoA) using the Bray–Curtis index. As shown by PCoA (Figure 2), a significant separation of samples based on the time points was observed on the first component (explaining 42.8% of variance) and based on treatment on the second component (explaining 13.8% of variance), as supported by PERMANOVA (Time, R2 = 0.49, p = 0.001, Treatment, R2 = 0.33, p = 0.001). Furthermore, the PCoA suggested that, after 1 day (T1) the treatment had no significant effect on the bacterial community structure, as samples from CTRL and SS overlapped, but it also suggested a progressive separation of samples of these groups (indicated by triangle for CTRL and square for SS group) along the subsequent time points (represented by different colors); this was evident from day 7 to day 21, during which there was a maximum differentiation of bacterial communities between the treatments (Figure 2).

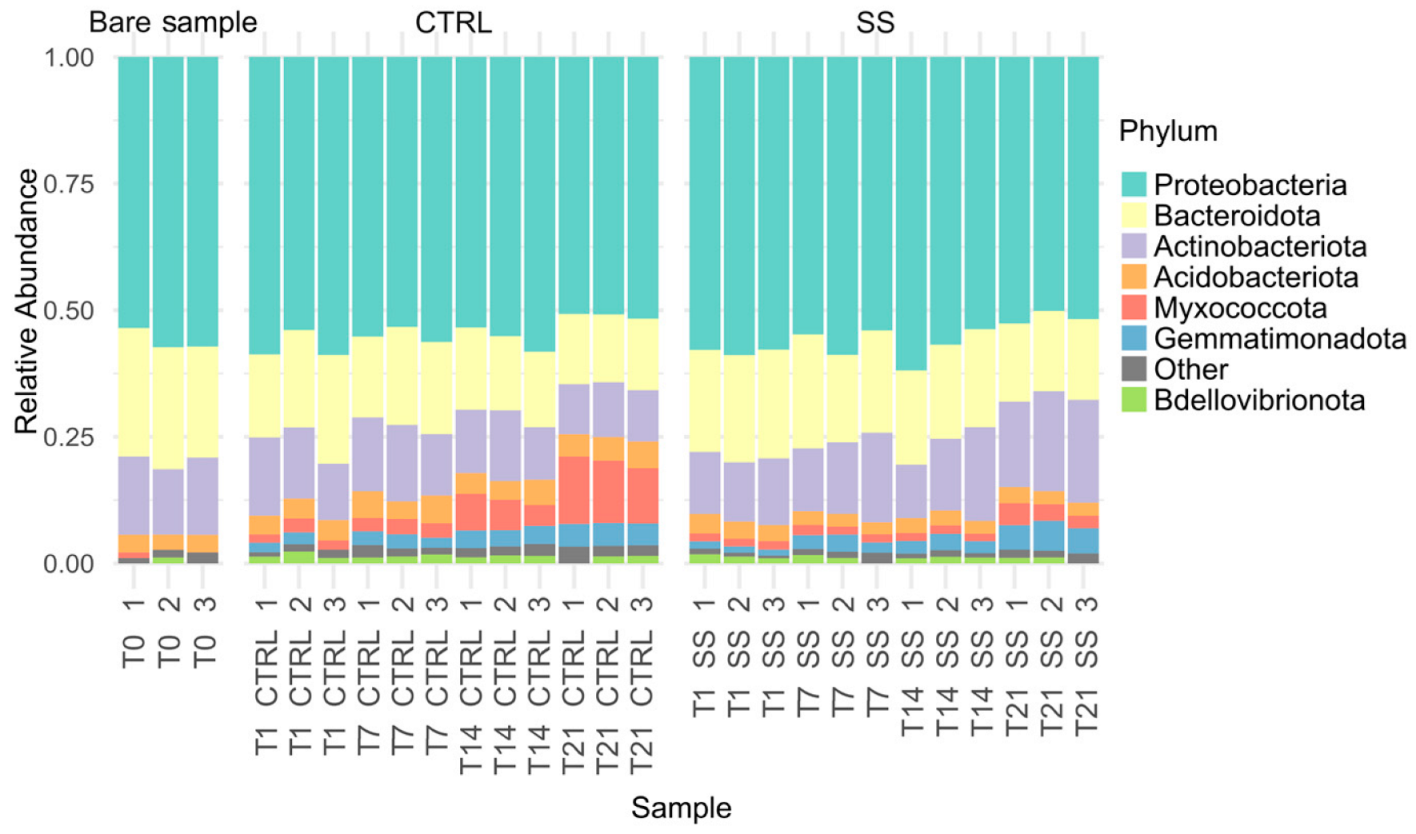
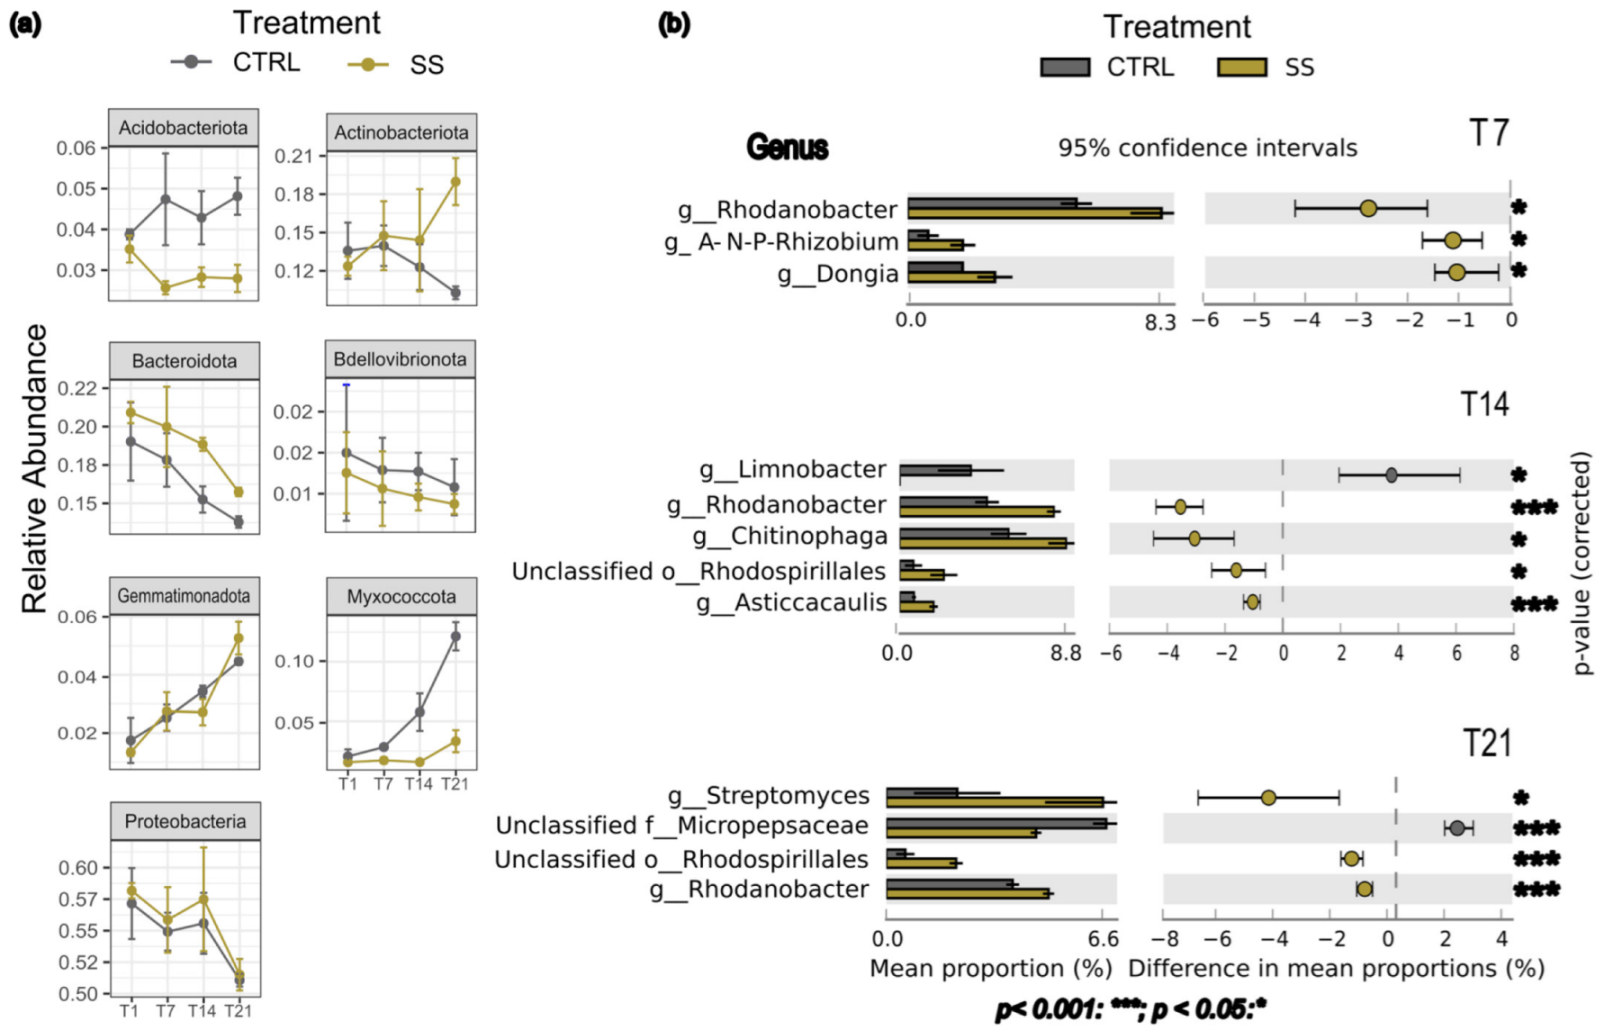
3.2. Differential Abundance of Taxa Among Time Points and Treatment

The effect of salt treatment on bacterial taxa abundance at different taxonomic levels was also investigated to identify specific taxa associated with salt treatment at different time points, by the analysis of 16S rRNA sequencing data. A total of 3683 bacterial ASVs were identified, classified into 28 phyla, 63 classes, 144 orders, 218 families and 318 genera. In all samples, the predominant phyla, showing a relative abundance greater than 1% of the total reads, were Proteobacteria (55.5%), Bacteroidota (18.3%), Actinobacteriodota (13.9%), Acidobacteriota (3.6%), Myxococcota (3.5%), Gemmatimonadota (2.7%) and Bdellovibrionota (1.7%), with a different degree in abundance between bare samples, CTRL and SS groups (Figure 3).
In the bare sample, the phyla showing relative abundance of reads greater than 1% were Proteobacteria (56% of reads), Bacteroidota (23.7%) and Actinobacteriota, (14.5%).
In the CTRL and SS groups, considering all time points (from day 1 to day 21), Proteobacteria was the dominant phylum, constituting the 54.6% and 55.7% of reads in the CTRL and SS group respectively, with little variation among time points. However, the abundance of Bacteroidota, Actinobacteriota and Myxococcota differed between groups. The abundance of Bacteroidota and Actinobacteriota was higher in the SS group (18.8% for Bacteroidota, 15.1% for Actinobacteriota) than the CTRL group (16.4% for Bacteroidota and 12.5% for Actinobacteriota). In addition, Mixococcota abundance was lower in the SS group (2%) than the CTRL group (5.7%). Gemmatimonadota showed no variation between groups, with 3.03% in CTRL and 3.01% in SS (Figure 3).
Considering the dynamics over time (Figure 4a) for each treatment group, Gemmatimonadota (Kruskal–Wallis, p < 0.05 for CTRL, p < 0.05 for SS) and Myxococcota (Kruskal–Wallis p < 0.05 for CTRL) were the only phyla showing a significant increase in relative abundance from day 1 to day 21 in CTRL samples for Myxococcota, and in both groups for Gemmatimonadota. CTRL and SS samples showed a similar increase trend in Gemmatimonadota abundance over time, while for Myxococcota, the two groups started to diverge from day 14, and the increase in this phylum abundance was higher in the CTRL group than in SS. On the other hand, Bdellovibrionota did not show any significant variation in abundance among the time points or between the two groups. A decrease of Proteobacteria and Bacteroidota was observed over time, with a higher abundance of the latter in salt-treated groups compared to CTRL groups becoming evident at days 14 and 21. Compared to day 1, in SS groups, other key changes include a significant increase in Actinobacteriota at day 21 and a decrease in Acidobacteriota at days 7, 14 and 21 compared to the CTRL samples.
Changes in rhizosphere microbiota over time involved differences in several genera. Although there was no significant difference in relative abundance over time between CTRL and SS groups when the analysis was performed at the Proteobacteria phylum level, we found, at genus level, a higher abundance of the Pseudolabrys genus in the SS group at day 21, while Rhodanobacter maintained an increased level of abundance at 7 and 14 days after salinization and decreased at day 21. Other significant changes over time in less abundant taxa included the genera of Gemmatimonadota. Notably, we observed a progressive increase in Longimicrobiaceae in the salt-treated group, which was different on days 7 and 21, while no variation was found in the CTRL group (Figure S1).
Overall, data presented in Figure 4a suggest that a progressive change in the rhizosphere microbiota due to salt treatments was present, in addition to time dependent changes. For this reason, within the phyla that increased the most in the salt-stressed group (Actinobacteria, Bacteroidota and Proteobacteria), we further investigated the abundance at genus level at all time points tested, to identify when and which genera increased or decreased with the salt treatment. For this purpose, we performed statistical analysis of the metagenomic profile (STAMP). Significant differences between treatments were assessed using p-values and effect size parameters.
As shown in Figure 4b based on effect size and p-value, significant changes in abundance between CTRL and SS were detected from days 7 to 21. Chitinophaga, Rhodobacter and Streptomyces genera were found to be in higher proportions in the SS group, compared to the CTRL group. Specifically, the Rhodanobacter genus was enriched in the SS group at days 7, 14 and 21, with higher differences in mean proportions between CTRL and SS detected at days 7 and 14, while Chitinophaga was found to be enriched only on day 14. On day 21, a higher proportion of the Streptomyces genus in was identified in the SS group. Other taxa that were significantly different between the treatments, with minor differences in mean proportions, were Dongia and Rhizobium at day 7, Asticaccalius at day 14 and an unclassified genus of the Rhodospirallies family at days 14 and 21.

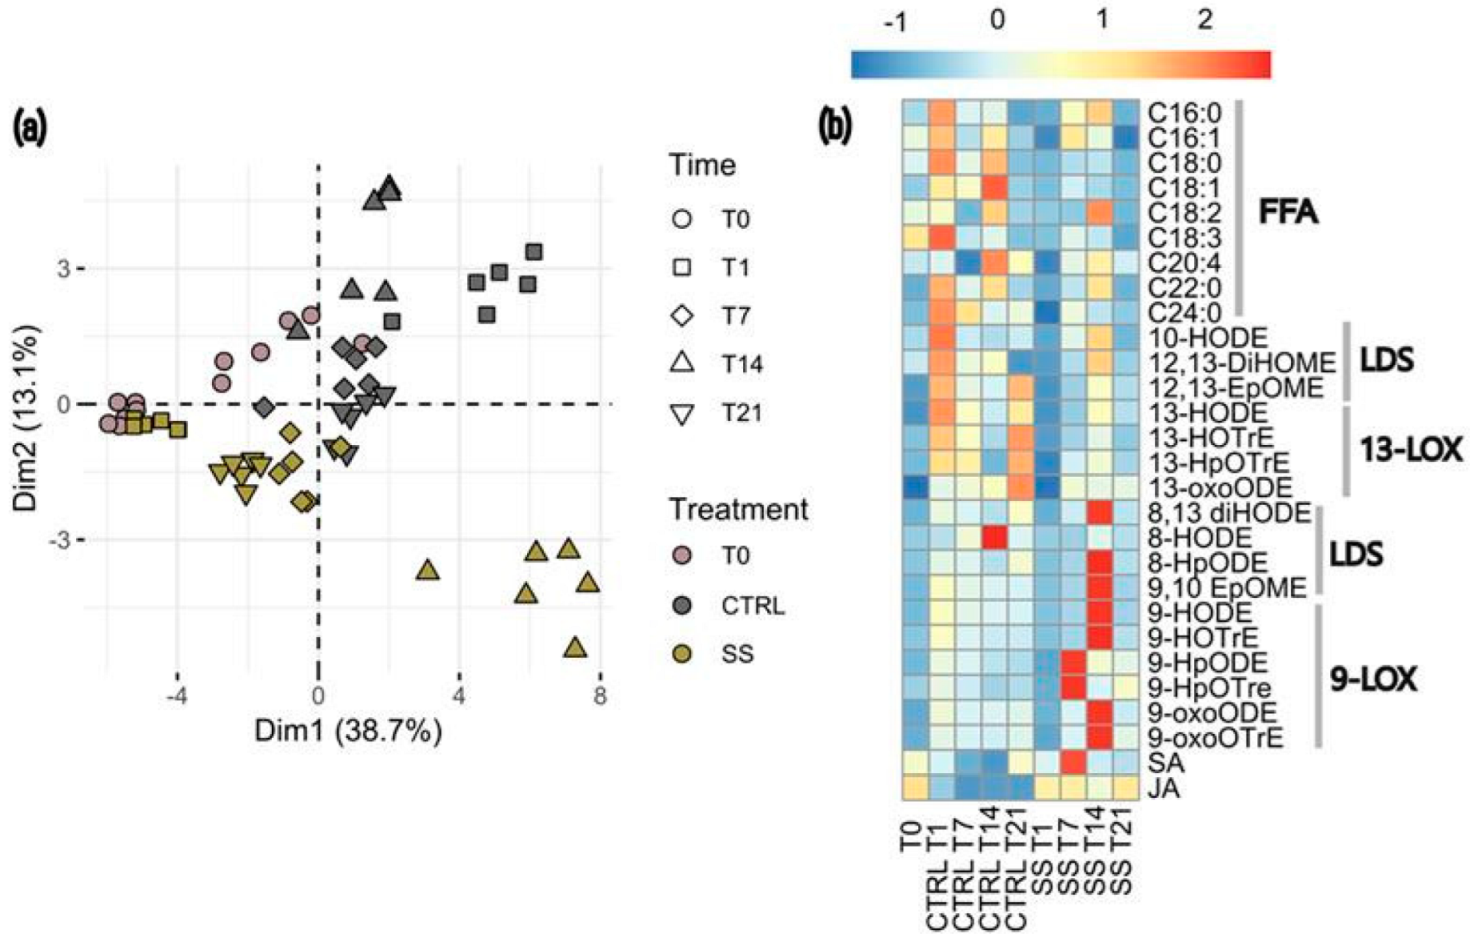
3.3. Changes in Oxylipins, Hormones and Fatty Acids Between Treatments

The results of the principal component analysis (PCA for plant metabolites in relation to time and treatment are reported in Figure 5a. Within each treatment (CTRL or SS), samples collected at different time points (shown as different shapes) were mainly separated by the first principal component (PC1) that explained 38.7% of the variance. In particular, within the SS group, the samples collected at day 14 (up-pointing triangles) grouped separately from all others, while within the CTRL group, samples of day 1 and day 14 (squares and up-pointing triangles) grouped separately from the others. By contrast, the second principal components (PC2) separated the SS and CTRL groups, with a clear difference between SS and CTRL collected at days 1 and 14. Statistical significance was confirmed by PERMANOVA (time: R2 = 0.35192, p < 0.001; treatment: R2 = 0.14156, p < 0.001; time × treatment: R2 = 0.34636, p < 0.001). The heatmap of plant metabolites shown in Figure 5b highlights the metabolites that most differentiated the PCA-separated groups.
Based on the heatmap analysis, for each treatment the metabolomic profile changed over time. Moreover, comparisons of FFA, oxylipins and hormones at the same time point between CTRL and SS plants demonstrated different types and abundance. The CTRL group revealed a higher proportion of free fatty acids (FFA) than saturated fatty acids (SFA, i.e., C16:0 TO C18:0, C22:0 and C24:0), and unsaturated (from C18:1 to C18:3) on days 1 and 14, along with 13-LOX oxylipins, i.e., 13-HODE, 13-OxoODE, 13-HOTre and 13-HpOTre, especially at day 1 and day 21, than the SS group. By comparison, the SS group had a higher abundance of oxylipins from the 9-lipoxygenase (9-LOX) pathway than the CTRL group, with temporal differentiation in the relative abundance of some pathway intermediates. In particular, at day 7, we found a relative dominance of early pathway intermediates, i.e., 9-HPODE and 9-HpOTrE. However, at day 14, samples had a relative dominance of final pathway intermediates, i.e., 9-HpOTrE, 9-OxoOTrE, 9-HODE and 9-OxoODE and a decreased abundance of unsaturated fatty acids, expect for C18:2, compared to the CTRL group. For phytohormone abundance, the SS group had a higher jasmonate (JA) content over the whole experimental period, along with a higher salicylic acid (SA) content on the day 7, compared to the CTRL group. Regarding FFA, accumulation results showed more in the CTRL group, in particular after 1 and 14 days from the salt stress, except for the linoleic acid C18:2, accumulated in the SS group after 14 days. The difference in oxylipins between treatment groups at different time points is reported in Supplementary Table S3. Further details concerning the fatty acids and the enzymes involved in the oxylipins’ biosynthesis are reported in Supplementary Table S4.

3.4. Functional Genes That Potentially Alleviate Salt Stress for Plants

Focusing on those genera that were significantly enriched in salt-stressed groups, we analyzed the differences of their functional traits at 7, 14 and 21 days by PICRUST2 analysis. A total of 4236 KO genes were retrieved. From these, only genes with relative abundance greater than 1% were analyzed. According to the metagenomic data annotated against the KEGG database, at days 7, 14 and 21 we found in all samples the predominant abundance of genes related to genetic information processing (KEGG entry K03088, k02529), as well as to signaling and cellular processes (KEGG entry K02004, K02014, K01990). Moreover, to explore the potential function of genera in alleviating the effect of salt on plant growth, we searched for genes related to plant growth-promoting (PGP) traits and ion concentration regulation, as reported by Zheng, Yanfen, et al. (Figure 6) [51]. We also analyzed genes involved in nitrogen metabolism and phosphorus solubilization.
Comparison of relative abundance between groups at different time points showed that, genera enriched in SS group possessed higher abundance of genes involved in PGP traits and ions homeostasis (Figure 6a). At day 7, significantly higher abundance of genes related to siderophore synthesis (KEGG entry K02362, K02364), exopolysaccharide production (KEGG K16566, K15567, K16568), Na+/ H+ antiporter (K05569, K05570, K05571), K+ H+ antiporter (from K05559 to K05564) was found. This difference was also maintained at days 14 and 21, expect for K+ H+ transporter.
Moreover, we also evaluated the relative abundance of genes involved in nitrogen cycling and phosphate solubilization. In terms of nitrogen cycling, we found that genes retrieved from genera enriched in SS groups were related to the denitrification pathway, while genes responsible for the nitrogen fixation pathway were undetected (Figure 6b). Among these, we observed a significantly higher abundance of genes K00370, K00371 and K00374 at days 14 and 21, related to nitrate reductase, enzyme that convert nitrate to nitrite in the first step of denitrification pathway. In terms of phosphate genes, K04750 (phnB) and K02037 (pstC) increased under salt stress at days 7 and 14. Relative abundance of genes in CTRL and SS group at different time points is reported in Table S5.

3.5. Non-Linear Correlation Analysis Bacterial Genera, Functional Genes and Plant Metabolites

Non-linear correlation analysis was carried out to determine whether and how plant metabolites were correlated with genera, diversity indices and predicted functional genes.
Corrplot results showed the grouping of variables based on correlation coefficients. In general, we found a positive correlation between taxa at the phylum level in the SS groups and genes, and a negative correlation between these in the CTRL group. In detail, phyla such as Bacteroidota, Actinobacteriota and Proteobacteria were positively correlated with many relevant functional genes (Figure S2). At genus level, among genera that were enriched in the salt group, Chitinophaga of Bacteroidota and Rhodanobacter Sticcacalius of the Proteobacteria phylum were positively correlated with all genes. However, the Dongia genus of Proteobacteria phylum and Streptomyces of Actinobacteriota were positively associated with genes related to nitrate reductase (K00370, K00371, K00374), and siderophore production and negatively correlated with the other genes. Regarding phyla that were less abundant in the SS group, Myxoccocota, Acidobacteriota and Gemmatimonadota were negatively correlated with most of the functional genes. More specifically, at genus level (Figure S3), Longimicrobiace and Gemmatimonas of Gemmatimonadota and Devosia, Caulobacter, Dokdonella genera of Proteobacteria were negatively correlated with genes. Interestingly, we found that taxa, genera and genes enriched in the SS group were differentially correlated with oxylipins. Genes that were found to be positively related to Dongia and the genus itself were positively correlated with 9-LOXs oxylipins, while 13-LOXs oxylipins were negatively correlated with genera that were enriched in the salt group and all genes.

4. Discussion

Several studies have shown that salinity impacts the abundance, diversity, composition and functions of rhizosphere microbial communities, highlighting how bacteria exhibit heightened sensitivity to abiotic stresses, resulting in more pronounced effects [52]. However, most studies conducted in pot experiments to evaluate the impact of salinity on the rhizosphere microbial community were carried out under controlled conditions (e.g., pH, humidity, temperature), evaluating the effect only at the end of the trial and thus revealing a single time frame. In addition, the time from salt application to growth substrate sampling for analysis of the bacterial communities averaged about 30 days. [53,54]. Thus, little is known about early variation of the microbial community in response to salinity. Here, we evaluated the effect of salt stress on the short-term response of the microbial community (21 days) to address the following questions: (i) How do bacterial communities change in response to salt stress? (ii) When does this response occur over time, focusing on different time points after salt stress? (iii) How does salinity influence plant metabolism?

4.1. Short-Term Rhizosphere Bacterial Community Changes Under Salt Stress

According to our results, rhizosphere bacterial diversity and evenness were decreased by salt stress, 7 and 14 days after salt application. This could be explained by salt’s direct effect, resulting in higher extracellular osmotic pressure impacting the activity and/or survival of several microbial species [8,55]. According to Zhou et al., this assumption is consistent with the lower richness found under salt stress [55]. As expected, we observed that bacterial community richness under salt-treated and untreated treatments was higher than in the bare sample (T0). This result was not surprising because, as is well known, the rhizosphere behaves as a nutrient-rich niche, a hotspot for biogeochemical transformation, harboring PGPR communities that play an important role in promoting plant growth [56]. This finding was also confirmed by Thompson et al. [57], who demonstrated that host associated bacterial communities did not always have high richness, suggesting that the host is a key factor in differentiating microbial communities. In addition, studies have reported that soil salinity showed a strong effect on microbial community dissimilarity [57]. Accordingly, in our study, the Bray–Curtis dissimilarities gradually increased from day 7 to 21 between salt-treated and untreated groups. In contrast, there was no recovery in the bacterial community structure after stress, showing a low resilience to the induced stress. Based on these results, we can hypothesize that salinity has created a critical environmental pressure, selecting salt-tolerant bacterial strains that can improve the plant’s adaptability to stress [6,56]. Additionally, this selection likely occurs upstream of the further selection imposed by the rhizosphere initially, and later by the plant tissues, on soil microbial communities [8,58].
Proteobacteria, Bacteroidota, Actinobacteriodota, Acidobacteriota, Myxococcota, Gemmatimonadota and Bdellovibrionota were the predominant phyla in this study. Among them, Acidobacteriota and Myxoccota were the most affected by salt stress. This finding agrees with results reported by Shi et al. [58]. These contrasting trends between salt-treated and untreated groups could be attributed to their well-known predatory strategy and the formation of fruiting bodies. It appears that the presence of some phyla in the untreated substrate is a necessary condition for their proliferation, indicating that environmental factors may influence species distribution. Furthermore, their higher abundance was only found in the plant-associated (rhizosphere) sample and not in the original sample (T0), indicating that the abundance of Myxococcota is not associated with salt, but with the presence of plants. This finding agrees with the results of Bao et al. (2024) [59]. Evidently, the assortment and distribution of phyla in a plant–soil system depends on very complex factors, such as environmental parameters and nutrient availability. We did not explore such environmental factors, as we carried out this experiment under “naturally” non-controlled conditions. Still, we can assume that in the untreated sample, different factors drive the distribution and proliferation of microorganisms. However, under salt stress, it is plausible that the dominant rhizosphere bacteria change to highly salt-tolerant bacteria (or bacteria that can survive in extreme environments) with the ability to alter the rhizosphere environment to make it more conducive to plant growth [13,60].
Indeed, in our study, Actinobacteriota and Bacteroidota seemed to play a key role in various nutrient cycling and biogeochemical processes that increased under salt stress, which is in agreement with previous research [4,55,61]. Actinobacteria are ubiquitous and considered competent members of the rhizosphere for their ability to promote plant growth and survive various extreme environmental conditions (high temperatures, pH, salinity and drought) [62,63,64]. Among various actinobacterial members, Streptomyces bacteria are commonly found in soils and can colonize the rhizosphere and root tissues with PGP activity. In particular, Streptomyces has been shown to improve nitrogen availability for plants by activating enzymes that are critical for nitrogen metabolism, such as glutamine synthetase, glutamate synthetase and nitrate reductase [65]. This makes their enrichment in the rhizosphere key for improving the environmental adaptability of microbial communities [66]. Thus, their presence in our study further supports the evidence that the plant–soil system reacted to imposed salinity stress by shaping the community structure through the enrichment of halotolerant taxa that are capable of helping plants to alleviate the effects of abiotic stresses. Overall, looking at the results of the salt-treated group, we can also say that the sensitivity to salinity might depend on other factors, such as plant roots, presence of organic matter, nutrient availability, and poor or less nutrient availability to the micro- and macro-structure of growth substrate layers.

4.2. How Bacterial Communties Reacted over Time Under Salt Stress

The trend over time of the enriched taxa changed differently in response to salt stress. For example, the relative abundance of members of Bacteroidota phylum was consistently higher in the salt-treated rhizosphere group after 1 day from the induced stress. However, the trend over time of their abundance followed the same decreasing trend of the untreated group. By applying the ecological concept to these phyla, Bacteroidota appeared to exhibit saprotrophic attributes. Therefore, we can assume that their abundance declined due to the decreasing availability of carbon in the growth substrate, as observed by Fierer and colleagues in soil [67]. Microbial metabolism is determined by several factors, among which the microbial community structure and environmental factors are key components. Only Actinobacteria showed an opposite trend between the salt-treated and untreated groups over time, with higher abundance in the late, stressed period for the salt-treated group and lower abundance for the untreated group. This trend suggested an oligotrophs trait, which refers to bacteria that predominate when substrate quality and/or quantity declines over time and harsh environmental conditions prevail. These tendencies were in line with those found by Zhang et al. at a specific concentration of salinity [68]. This might be associated with the fact that bacteria belonging to Actinobacteriota have a high proportion of carbohydrate activity (CAZymes), which can degrade organic carbon in nutrient-poor soils [69].
Furthermore, although the Proteobacteria phylum did not exhibit significant variation following the application of salinity, Rhodanobacter and Asticcacaulis genera members were found to be significantly more abundant in the salt group compared to the untreated group. This observation is in accordance with the results previously reported by Canfora et al. [4], which demonstrated that the classification of taxa (salinity related and not related) performed by different studies [61,70,71] is a dangerous approach, especially for taxa such as Proteobacteria that contain genera and species with extremely different physiologies and very broad geographical distributions. Different authors have reported that the Rhodanobacter genus confers tolerance to plants against osmotic stress induced by salt [70,72]. Moreover, the higher abundance of Asticcacaulis found in the salt-treated group was in accordance with their higher abundance in costal saline soil, as reported by Shang, X. C., et al. [73]. This preliminary part of the results demonstrated that ), the salt level imposed (10 dS m−1), in association with other factors (pH, nutrient availability, and interaction with the plant) induced an adaptation of the rhizosphere bacterial community through enrichment of specific taxa.

4.3. Effect of Salt-Induced Stress on Plant Metabolism

Concerning plant metabolism, we focused our attention on oxylipin metabolites. Oxylipins, a diverse class of oxidized fatty acids, play crucial roles in various biological processes across different organisms. These signaling molecules arise from the enzymatic or non-enzymatic oxidation of polyunsaturated fatty acids (PUFAs) and encompass many compounds (Table S4). In plants, oxylipins, particularly JA, are key regulators of development and immunity. JA and SA, are phytohormones involved in plants’ response to stress. Apart the antagonistic role developed by SA toward JA in reactions against biotrophic pathogens [74], this hormone is active in the reaction of plant to several stresses, including abiotic stresses. For instance, SA can enhance proline accumulation in plants subjected to abiotic stresses, including drought, salinity and heat [75]. In our study, JA and SA hormones were present in the salt-treated group. While the abundance of JA was consistently higher at all time points, SA was found 7 days after the stress was imposed. This is in accordance with previous studies highlighting the key role of SA in defense responses against different abiotic stresses, including salinity [76,77]. Beyond jasmonates, other plant oxylipins, synthesized through various enzymatic pathways, contribute to plant defense onset to various biotic and abiotic stresses. These compounds exhibit diverse functions, ranging from direct antimicrobial activity against pathogens to attracting beneficial microorganisms for biocontrol [30]. However, their role to the alleviation of the effect of abiotic stress has only been emphasized in recent years.
In our study, these metabolites showed changes in their abundance between the early and later stage of the salt stress response in tomato plants. In untreated plants, fatty acids exhibited higher abundance on days 1 and 14, while 13-LOX-derived oxylipins accumulated more prominently on days 1 and 21. These fluctuations may be linked to normal physiological growth processes. In salt-treated plants, the analyzed compounds showed lower accumulation on days 1 and 7, suggesting that the free fatty acids (FFAs) pool might be utilized to enhance membrane permeability. Notably, plants exposed to salt stress displayed an increase in 9-LOX oxylipins between days 7 and 14, indicating that lipid oxidation-derived oxylipins could serve as cellular oxidation signals, potentially contributing to redox homeostasis. Moreover, on day 14, a slight increase in certain unsaturated FFAs was observed, possibly released from membrane lipids to improve membrane fluidity. However, across the analyzed time points, FFA levels in stressed plants remained lower than in the untreated group, likely reflecting an alteration in membrane fluidity [30,78,79].
These findings suggested that salinity stress imposed a reprogramming of the plant metabolic profile, with the activation in the SS plant of preferential metabolic pathways that could be involved in plant defense responses to salt stress. These observations are supported by previous studies in which authors showed the involvement of the 9- LOX pathway in tomato cell suspension cultures’ adaptation after salt stress [80]. Moreover, the abundance of oxylipins may be due not only to plants, but they could also be synthesized by microorganisms, such as fungi and bacteria, in which they play a role in development and communication [28,29]. Moreover, the modification of the metabolites’ pattern during the last phase of the plant response suggested that the metabolite-induced response was influenced by the accumulation of toxic ions that appeared in the last phase of salinity stress [81].
Considering that these metabolic responses were obtained from plants kept under “naturally” non-controlled conditions, it is necessary to confirm their role through further targeted experiments. Overall, the results obtained showed how, although the salt treatment was applied once, a divergence of microbial community structure occurred between untreated and salt-treated groups in the subsequent time points. Simultaneously, a higher accumulation of 9-LOX oxylipins in the salt-treated group at 7 and 14 days was observed, suggesting a role for the plant in selecting specific genera in the rhizosphere that are capable of helping the plant in adverse environments. The functional profile predicted for the bacterial genera increased under salt stress at 7, 14 and 21 days, and revealed significant differences in potential functional properties. In the salt-treated group there was a higher abundance of genes involved in nitrogen and phosphorus metabolism, that may reflect the need for nutrient cycling under salt environments. Among genes involved in nitrogen metabolism, an interestingly increased level of nitrogen reductase, K00374 (narI, narV), was found from day 7 to 21, suggesting a role in salt stress tolerance. This finding was in accordance with the findings observed by Lee et al. [82], in which nitrate reductase enhancement increased the resistance of Arabidopsis to salt stress.
Regarding genes encoding proteins involved in PGP traits (e.g., phosphate solubilization), and Na+ concentration regulation, these were enriched in the salt-treated group, compared to the untreated group. Other studies have reported that many plant-associated microbes, especially PGPR, have ACC deaminase, IAA biosynthesis, phosphatase, siderophore production, nitrogen fixation, and antioxidant enzymes, which can improve the salt tolerance of their host [55]. Considering that the salt concentration in the growth substrate was stable over time, these findings suggest that plants actively enrich microbes that have the potential to help them to alleviate salt stress. Moreover, a higher abundance of ion regulation-related genes was found in the SS group, which might contribute to maintaining ion homeostasis, thus mitigating the stress exerted by a high-salinity environment [51,71]. In particular, the abundance of the K+/H+ antiporter gene was significantly higher in the salt-treated group than untreated group at 7 and 14 days, with a slight decrease on day 21. The K+/H+ antiporter is responsible for expelling K+ from the cell. Under salt stress, low K+ status on the cytosol might induce the formation of reactive oxygen species (ROS), which can lead to programmed cell death (PCD), while the high ratio K+/Na+ is essential for salt tolerance [83]. The higher abundance of the K+/H+ antiporter gene might suggest an involvement of selected genera in increasing the content of K+ available for plant uptake, resulting in a high ratio of K+/Na+, which is essential for salt tolerance [51,84]. This could be another strategy for root microbes to help their host to alleviate salt stress

5. Conclusions

These findings showed how the native growth substrate bacterial community may be affected by salt stress in the short term. The identification of bacterial groups associated with plant metabolic responses under salt stress conditions suggests the potential to exploit these specific taxa for the formulation of innovative and effective bioinoculants to mitigate stress and promote plant growth. To achieve this, it is imperative to gain a deeper understanding of the assembly rules and interactions within the bacterial community under stress conditions and to harness the naturally occurring interactions between plants and beneficial bacteria that support plant growth. Therefore, future experiments will be conducted under controlled conditions to further minimize the potential influence of environmental variables and to specifically correlate the plant’s metabolic response with microbiome changes in the soil induced by salt stress.

Supplementary Materials

The following supporting information can be downloaded at: https://www.mdpi.com/article/10.3390/agriculture15060624/s1. Figure S1: Changes in the abundance of genera over time; Figure S2: Corrplot showing the results of non-linear correlation analysis among diversity, taxa at phyla level, genes and oxylipins content. Figure S3: Corrplot showing the results of non-linear correlation analysis among diversity, taxa at genus level, genes and oxylipins content. Table S1: MRM and SIM conditions for HPLC-MS/MS analysis for oxylipins, hormones and fatty acids. Table S2: Data reporting the average oxylipin content for each sample per treatment and at different time points. Table S3: Table reporting the significance (p-value) of individual oxylipins for treatment at different time points. Table S4: In the table are summarized the fatty acids and the enzymes involved in oxylipin biosynthesis. Table S5: Relative abundance of genes related to PGP trait, ion concentration regulation and nitrogen and phosphorus metabolism at days 7, 14 and 21.

Author Contributions

Conceptualization, S.M. and V.S.; methodology A.E., S.M., V.S., M.R. and G.V.; formal analysis, A.E. and F.V.; investigation, A.E., S.M. and V.S.; resources, S.M. and V.S.; writing—original draft preparation, A.E.; writing—review and editing, A.E., F.V., L.C., M.B., M.R., G.V., S.D.D., S.M. and V.S.; supervision, S.M.; project administration, S.M. and V.S.; funding acquisition, S.M. and V.S. All authors have read and agreed to the published version of the manuscript.

Funding

This research was funded by the National Center for Technology in Agriculture (Agritech), Spoke 1, Task 1.2.4 (CUP: C23C22000450006) and Excalibur Horizon 2020, grant number 817946.

Institutional Review Board Statement

Not applicable.

Informed Consent Statement

Not applicable.

Data Availability Statement

Data are contained within the article or Supplementary Materials.

Conflicts of Interest

The authors declare no conflicts of interest.

Abbreviations

The following abbreviations are used in this manuscript:
JAJasmonic acid
SASalicylic acid
MRMMultiple reaction monitoring
SIMSingle ion monitoring
FFAFree fatty acid
PUFAPolyunsaturated fatty acid
SFASaturated fatty acid
9-HODE9-hydroxyoctadecenoic acid
9-HpODE9-hydroperoxyoctadienoic acid
9-HpOTre9-hydroperoxyoctatrienoic acid
9-HOTre9-oxo-octadecatrienoic acid
9-OxoDE9-oxo-octadecenoic acid
9-OxoTrE9-oxo-octadecatrienoic acid
13-HODE13-hydroxyoctadecenoic acid
13-HOTre13-OH-9Z,11E,15Z-octadecatrienoic acid
13- HpOTre13-hydroperoxy-9,11E,15Z-octadecatrienoic acid
13-OxoDE13-oxo-octadecenoic acid
13-OxoTrE13-oxo-octadecatrienoic acid
C16:0Palmitic acid
C16:1Palmitoleic acid
C18:0Stearic acid
C18:1Oleic acid
C18:2Linoleic acid
C18:3α-Linolenic acid
C20:4Arachidonic acid
C22:0Decosanoic acid
C24:0Lignoceric acid
10-HODE10-hydroxyoctadecenoic acid
12,13-DiHOME12,13-dihydroxyoctamonoenoic acid
12,13-EpOME12,13-dihydroxyoctamonoenoic acid
8,13 diHODE8,13-dihydroxy-9,11-octadecadienoic acid
8-HODE8-hydroxyoctadecenoic acid
8-HpODE8-hydroperoxyoctadienoic acid
9,10-EpOME9,10-epoxyoctamonoenoic acid

References

  1. Manuel, R.; Machado, A.; Serralheiro, R.P.; Alvino, A.; Freire, M.I.; Ferreira, R. Soil Salinity: Effect on Vegetable Crop Growth. Management Practices to Prevent and Mitigate Soil Salinization. Horticulturae 2017, 3, 30. [Google Scholar] [CrossRef]
  2. Shrivastava, P.; Kumar, R. Soil Salinity: A Serious Environmental Issue and Plant Growth Promoting Bacteria as One of the Tools for Its Alleviation. Saudi J. Biol. Sci. 2015, 22, 123–131. [Google Scholar] [CrossRef]
  3. Sliti, A.; Singh, V.; Pande, A.; Shin, J.-H. Soil Microbial Holobiont Interplay and Its Role in Protecting Plants against Salinity Stress. Pedosphere 2024, 35, 97–115. [Google Scholar] [CrossRef]
  4. Canfora, L.; Bacci, G.; Pinzari, F.; Lo Papa, G.; Dazzi, C.; Benedetti, A. Salinity and Bacterial Diversity: To What Extent Does the Concentration of Salt Affect the Bacterial Community in a Saline Soil? PLoS ONE 2014, 9, e106662. [Google Scholar] [CrossRef] [PubMed]
  5. Richards, L.A. Diagnosis and Improvement of Saline and Alkali Soils. Soil Sci. 1954, 78, 154. [Google Scholar] [CrossRef]
  6. Flowers, T.J.; Munns, R.; Colmer, T.D. Sodium Chloride Toxicity and the Cellular Basis of Salt Tolerance in Halophytes. Ann. Bot. 2015, 115, 419–431. [Google Scholar] [CrossRef]
  7. Yadav, S.; Irfan, M.D.; Ahmad, A.; Hayat, S. Causes of Salinity and Plant Manifestations to Salt Stress: A Review. J. Environ. Biol. 2011, 32, 667–685. [Google Scholar]
  8. Otlewska, A.; Migliore, M.; Dybka-Stępień, K.; Manfredini, A.; Struszczyk-Świta, K.; Napoli, R.; Białkowska, A.; Canfora, L.; Pinzari, F. When Salt Meddles Between Plant, Soil, and Microorganisms. Front. Plant Sci. 2020, 11, 553087. [Google Scholar] [CrossRef] [PubMed]
  9. Kumar, A.; Verma, J.P. Does Plant—Microbe Interaction Confer Stress Tolerance in Plants: A Review? Microbiol. Res. 2018, 207, 41–52. [Google Scholar] [CrossRef]
  10. Parida, A.K.; Das, A.B. Salt Tolerance and Salinity Effects on Plants: A Review. Ecotoxicol. Environ. Saf. 2005, 60, 324–349. [Google Scholar] [CrossRef]
  11. Rath, K.M.; Murphy, D.N.; Rousk, J. The Microbial Community Size, Structure, and Process Rates along Natural Gradients of Soil Salinity. Soil Biol. Biochem. 2019, 138, 107607. [Google Scholar] [CrossRef]
  12. Haj-Amor, Z.; Araya, T.; Kim, D.G.; Bouri, S.; Lee, J.; Ghiloufi, W.; Yang, Y.; Kang, H.; Jhariya, M.K.; Banerjee, A.; et al. Soil Salinity and Its Associated Effects on Soil Microorganisms, Greenhouse Gas Emissions, Crop Yield, Biodiversity and Desertification: A Review. Sci. Total Environ. 2022, 843, 156946. [Google Scholar] [CrossRef] [PubMed]
  13. Zhang, G.; Bai, J.; Zhai, Y.; Jia, J.; Zhao, Q.; Wang, W.; Hu, X. Microbial Diversity and Functions in Saline Soils: A Review from a Biogeochemical Perspective. J. Adv. Res. 2024, 59, 129–140. [Google Scholar] [CrossRef]
  14. Rath, K.M.; Fierer, N.; Murphy, D.V.; Rousk, J. Linking Bacterial Community Composition to Soil Salinity along Environmental Gradients. ISME J. 2019, 13, 836–846. [Google Scholar] [CrossRef]
  15. Katerji, N.; Van Hoorn, J.W.; Hamdy, A.; Mastrorilli, M. Salinity Effect on Crop Development and Yield, Analysis of Salt Tolerance According to Several Classification Methods. Agric. Water Manag. 2003, 62, 37–66. [Google Scholar] [CrossRef]
  16. Maas, E.V.; Hoffman, G.J. Crop salt tolerance—Current assessment. J. Irrig. Drain. Div. 1977, 103, 115–134. [Google Scholar] [CrossRef]
  17. Panno, S.; Davino, S.; Caruso, A.G.; Bertacca, S.; Crnogorac, A.; Mandić, A.; Noris, E.; Matić, S. A Review of the Most Common and Economically Important Diseases That Undermine the Cultivation of Tomato Crop in the Mediterranean Basin. Agronomy 2021, 11, 2188. [Google Scholar] [CrossRef]
  18. Roșca, M.; Mihalache, G.; Stoleru, V. Tomato Responses to Salinity Stress: From Morphological Traits to Genetic Changes. Front. Plant Sci. 2023, 14, 1118383. [Google Scholar] [CrossRef]
  19. Cuartero, J.; Fernández-Muñoz, R. Tomato and Salinity. Sci. Hortic. 1998, 78, 83–125. [Google Scholar] [CrossRef]
  20. Munns, R.; Tester, M. Mechanisms of Salinity Tolerance. Annu. Rev. Plant Biol. 2008, 59, 651–681. [Google Scholar] [CrossRef]
  21. Deinlein, U.; Stephan, A.B.; Horie, T.; Luo, W.; Xu, G.; Schroeder, J.I. Plant Salt-Tolerance Mechanisms. Trends Plant Sci. 2014, 19, 371–379. [Google Scholar] [CrossRef]
  22. Meng, X.; Zhou, J.; Sui, N. Mechanisms of Salt Tolerance in Halophytes: Current Understanding and Recent Advances. Open Life Sci. 2018, 13, 149. [Google Scholar] [CrossRef]
  23. Liu, S.; Tian, Y.; Jia, M.; Lu, X.; Yue, L.; Zhao, X.; Jin, W.; Wang, Y.; Zhang, Y.; Xie, Z.; et al. Induction of Salt Tolerance in Arabidopsis Thaliana by Volatiles from Bacillus Amyloliquefaciens FZB42 via the Jasmonic Acid Signaling Pathway. Front. Microbiol. 2020, 11, 562934. [Google Scholar] [CrossRef]
  24. Pedranzani, H.; Racagni, G.; Alemano, S.; Miersch, O.; Ramírez, I.; Peña-Cortés, H.; Taleisnik, E.; Machado-Domenech, E.; Abdala, G. Salt Tolerant Tomato Plants Show Increased Levels of Jasmonic Acid. Plant Growth Regul. 2003, 41, 149–158. [Google Scholar] [CrossRef]
  25. Ali, M.S.; Baek, K.H. Jasmonic Acid Signaling Pathway in Response to Abiotic Stresses in Plants. Int. J. Mol. Sci. 2020, 21, 621. [Google Scholar] [CrossRef] [PubMed]
  26. Khan, T.; Shah, L.R.; Mir, N.; Gulzar, G.; Mushtaq, B.; Rashid, R.; Afroza, B. The Roles of Oxylipins in Plant Systemic Resistance. In Phyto-Oxylipins; CRC Press: Boca Raton, FL, USA, 2023; pp. 151–173. [Google Scholar] [CrossRef]
  27. Savchenko, T.V.; Zastrijnaja, O.M.; Klimov, V.V. Oxylipins and Plant Abiotic Stress Resistance. Biochemistry 2014, 79, 362–375. [Google Scholar] [CrossRef]
  28. Christensen, S.A.; Kolomiets, M.V. The Lipid Language of Plant-Fungal Interactions. Fungal Genet. Biol. 2011, 48, 4–14. [Google Scholar] [CrossRef] [PubMed]
  29. Martínez, E.; Cosnahan, R.K.; Wu, M.; Gadila, S.K.; Quick, E.B.; Mobley, J.A.; Campos-Gómez, J. Oxylipins Mediate Cell-to-Cell Communication in Pseudomonas Aeruginosa. Commun. Biol. 2019, 2, 66. [Google Scholar] [CrossRef]
  30. Beccaccioli, M.; Pucci, N.; Salustri, M.; Scortichini, M.; Zaccaria, M.; Momeni, B.; Loreti, S.; Reverberi, M.; Scala, V. Fungal and Bacterial Oxylipins Are Signals for Intra- and Inter-Cellular Communication within Plant Disease. Front. Plant Sci. 2022, 13, 823233. [Google Scholar] [CrossRef]
  31. Liang, Y.; Huang, Y.; Liu, C.; Chen, K.; Li, M. Functions and Interaction of Plant Lipid Signalling under Abiotic Stresses. Plant Biol. 2023, 25, 361–378. [Google Scholar] [CrossRef]
  32. Blée, E. Impact of Phyto-Oxylipins in Plant Defense. Trends Plant Sci. 2002, 7, 315–322. [Google Scholar] [CrossRef] [PubMed]
  33. Goswami, D.; Thakker, J.N.; Dhandhukia, P.C. Portraying Mechanics of Plant Growth Promoting Rhizobacteria (PGPR): A Review. Cogent Food Agric. 2016, 2, 1127500. [Google Scholar] [CrossRef]
  34. Vurukonda, S.S.K.P.; Vardharajula, S.; Shrivastava, M.; SkZ, A. Enhancement of Drought Stress Tolerance in Crops by Plant Growth Promoting Rhizobacteria. Microbiol. Res. 2016, 184, 13–24. [Google Scholar] [CrossRef]
  35. Kumar, A.; Patel, J.S.; Meena, V.S.; Ramteke, P.W. Plant Growth-Promoting Rhizobacteria: Strategies to Improve Abiotic Stresses under Sustainable Agriculture. J. Plant Nutr. 2019, 42, 1402–1415. [Google Scholar] [CrossRef]
  36. Hoque, M.N.; Hannan, A.; Imran, S.; Paul, N.C.; Mondal, M.F.; Sadhin, M.M.R.; Bristi, J.M.; Dola, F.S.; Hanif, M.A.; Ye, W.; et al. Plant Growth-Promoting Rhizobacteria-Mediated Adaptive Responses of Plants Under Salinity Stress. J. Plant Growth Regul. 2022, 42, 1307–1326. [Google Scholar] [CrossRef]
  37. Trinchera, A.; Leita, L.; Sequi, P. Ministero delle Politiche Agricole e Forestali. Osservatorio Nazionale Pedologico e per la Qualità del Suolo Agricolo e Forestale; Consiglio per la Ricerca e la Sperimentazione in Agricoltura; Istituto Sperimentale per la Nutrizione delle Piante. In Metodi Di Analisi per i Fertilizzanti; Consiglio per la Ricerca e la Sperimentazione in Agricoltura: Rome, Italy, 2006. [Google Scholar]
  38. Turner, S.; Pryer, K.M.; Miao, V.P.W.; Palmer, J.D. Investigating Deep Phylogenetic Relationships among Cyanobacteria and Plastids by Small Subunit RRNA Sequence Analysis. J. Eukaryot. Microbiol. 1999, 46, 327–338. [Google Scholar] [CrossRef]
  39. Kisand, V.; Cuadros, R.; Wikner, J. Phylogeny of Culturable Estuarine Bacteria Catabolizing Riverine Organic Matter in the Northern Baltic Sea. Appl. Environ. Microbiol. 2002, 68, 379. [Google Scholar] [CrossRef] [PubMed]
  40. Scala, V.; Reverberi, M.; Salustri, M.; Pucci, N.; Modesti, V.; Lucchesi, S.; Loreti, S. Lipid Profile of Xylella Fastidiosa Subsp. pauca Associated With the Olive Quick Decline Syndrome. Front. Microbiol. 2018, 9, 1839. [Google Scholar] [CrossRef]
  41. Del Duca, S.; Mocali, S.; Vitali, F.; Fabiani, A.; Cucu, M.A.; Valboa, G.; d’Errico, G.; Binazzi, F.; Storchi, P.; Perria, R.; et al. Impacts of Soil Management and Sustainable Plant Protection Strategies on Soil Biodiversity in a Sangiovese Vineyard. Land 2024, 13, 599. [Google Scholar] [CrossRef]
  42. Bolyen, E.; Rideout, J.R.; Dillon, M.R.; Bokulich, N.A.; Abnet, C.C.; Al-Ghalith, G.A.; Alexander, H.; Alm, E.J.; Arumugam, M.; Asnicar, F.; et al. Reproducible, Interactive, Scalable and Extensible Microbiome Data Science Using QIIME 2. Nat. Biotechnol. 2019, 37, 852–857. [Google Scholar] [CrossRef]
  43. Martin, M. Cutadapt Removes Adapter Sequences from High-Throughput Sequencing Reads. EMBnet J. 2011, 17, 10–12. [Google Scholar] [CrossRef]
  44. Callahan, B.J.; McMurdie, P.J.; Rosen, M.J.; Han, A.W.; Johnson, A.J.A.; Holmes, S.P. DADA2: High-Resolution Sample Inference from Illumina Amplicon Data. Nat. Methods 2016, 13, 581–583. [Google Scholar] [CrossRef]
  45. Bokulich, N.A.; Kaehler, B.D.; Rideout, J.R.; Dillon, M.; Bolyen, E.; Knight, R.; Huttley, G.A.; Gregory Caporaso, J. Optimizing Taxonomic Classification of Marker-Gene Amplicon Sequences with QIIME 2′s Q2-Feature-Classifier Plugin. Microbiome 2018, 6, 90. [Google Scholar] [CrossRef] [PubMed]
  46. Quast, C.; Pruesse, E.; Yilmaz, P.; Gerken, J.; Schweer, T.; Yarza, P.; Peplies, J.; Glöckner, F.O. The SILVA Ribosomal RNA Gene Database Project: Improved Data Processing and Web-Based Tools. Nucleic Acids Res. 2013, 41, D590–D596. [Google Scholar] [CrossRef] [PubMed]
  47. R Core Team. R: A Language and Environment for Statistical Computing; R Foundation for Statistical Computing: Vienna, Austria, 2016. [Google Scholar]
  48. Lahti, L.; Shetty, S. Tools for Microbiome Analysis in R. Microbiome Package. 2018. Available online: https://microbiome.github.io/tutorials (accessed on 30 December 2024).
  49. Parks, D.H.; Tyson, G.W.; Hugenholtz, P.; Beiko, R.G. STAMP: Statistical Analysis of Taxonomic and Functional Profiles. Bioinformatics 2014, 30, 3123–3124. [Google Scholar] [CrossRef] [PubMed]
  50. Douglas, G.M.; Maffei, V.J.; Zaneveld, J.R.; Yurgel, S.N.; Brown, J.R.; Taylor, C.M.; Huttenhower, C.; Langille, M.G.I. PICRUSt2 for Prediction of Metagenome Functions. Nat. Biotechnol. 2020, 38, 685–688. [Google Scholar] [CrossRef]
  51. Zheng, Y.; Xu, Z.; Liu, H.; Liu, Y.; Zhou, Y.; Meng, C.; Ma, S.; Xie, Z.; Li, Y.; Zhang, C.-S. Patterns in the Microbial Community of Salt-Tolerant Plants and the Functional Genes Associated with Salt Stress Alleviation. Microbiol. Spectr. 2021, 9, e0076721. [Google Scholar] [CrossRef]
  52. Thiem, D.; Gołebiewski, M.; Hulisz, P.; Piernik, A.; Hrynkiewicz, K. How Does Salinity Shape Bacterial and Fungal Microbiomes of Alnus Glutinosa Roots? Front. Microbiol. 2018, 9, 318754. [Google Scholar] [CrossRef]
  53. Schmitz, L.; Yan, Z.; Schneijderberg, M.; de Roij, M.; Pijnenburg, R.; Zheng, Q.; Franken, C.; Dechesne, A.; Trindade, L.M.; van Velzen, R.; et al. Synthetic Bacterial Community Derived from a Desert Rhizosphere Confers Salt Stress Resilience to Tomato in the Presence of a Soil Microbiome. ISME J. 2022, 16, 1907–1920. [Google Scholar] [CrossRef]
  54. Yaghoubi Khanghahi, M.; Crecchio, C.; Verbruggen, E. Shifts in the Rhizosphere and Endosphere Colonizing Bacterial Communities Under Drought and Salinity Stress as Affected by a Biofertilizer Consortium. Microb. Ecol. 2022, 84, 483–495. [Google Scholar] [CrossRef]
  55. Zhou, Y.; He, Z.; Lin, Q.; Lin, Y.; Long, K.; Xie, Z.; Hu, W. Salt Stress Affects the Bacterial Communities in Rhizosphere Soil of Rice. Front. Microbiol. 2024, 15, 1505368. [Google Scholar] [CrossRef]
  56. Philippot, L.; Hallin, S.; Börjesson, G.; Baggs, E.M. Biochemical Cycling in the Rhizosphere Having an Impact on Global Change. Plant Soil 2008, 321, 61–81. [Google Scholar] [CrossRef]
  57. Thompson, L.R.; Sanders, J.G.; McDonald, D.; Amir, A.; Ladau, J.; Locey, K.J.; Prill, R.J.; Tripathi, A.; Gibbons, S.M.; Ackermann, G.; et al. A Communal Catalogue Reveals Earth’s Multiscale Microbial Diversity. Nature 2017, 551, 457–463. [Google Scholar] [CrossRef] [PubMed]
  58. Shi, X.; Zhao, X.; Ren, J.; Dong, J.; Zhang, H.; Dong, Q.; Jiang, C.; Zhong, C.; Zhou, Y.; Yu, H. Influence of Peanut, Sorghum, and Soil Salinity on Microbial Community Composition in Interspecific Interaction Zone. Front. Microbiol. 2021, 12, 678250. [Google Scholar] [CrossRef] [PubMed]
  59. Bao, Y.; Ma, B.; McLaughlin, N.B.; Niu, Y.; Wang, D.; Liu, H.; Li, M.; Sun, Z. The Impact of Salinization on Soil Bacterial Diversity, Yield and Quality of Glycyrrhiza Uralensis Fisch. Front. Microbiol. 2024, 15, 1448301. [Google Scholar] [CrossRef]
  60. Li, H.; La, S.; Zhang, X.; Gao, L.; Tian, Y. Salt-Induced Recruitment of Specific Root-Associated Bacterial Consortium Capable of Enhancing Plant Adaptability to Salt Stress. ISME J. 2021, 15, 2865–2882. [Google Scholar] [CrossRef]
  61. Ma, B.; Gong, J. A Meta-Analysis of the Publicly Available Bacterial and Archaeal Sequence Diversity in Saline Soils. World J. Microbiol. Biotechnol. 2013, 29, 2325–2334. [Google Scholar] [CrossRef] [PubMed]
  62. Jog, R.; Pandya, M.; Nareshkumar, G.; Rajkumar, S. Mechanism of Phosphate Solubilization and Antifungal Activity of Streptomyces Spp. Isolated from Wheat Roots and Rhizosphere and Their Application in Improving Plant Growth. Microbiology 2014, 160, 778–788. [Google Scholar] [CrossRef]
  63. Thilagam, R.; Hemalatha, N. Plant Growth Promotion and Chilli Anthracnose Disease Suppression Ability of Rhizosphere Soil Actinobacteria. J. Appl. Microbiol. 2019, 126, 1835–1849. [Google Scholar] [CrossRef]
  64. Yadav, A.N.; Verma, P.; Kumar, S.; Kumar, V.; Kumar, M.; Kumari Sugitha, T.C.; Singh, B.P.; Saxena, A.K.; Dhaliwal, H.S. Actinobacteria from Rhizosphere: Molecular Diversity, Distributions, and Potential Biotechnological Applications. In New and Future Developments in Microbial Biotechnology and Bioengineering: Actinobacteria: Diversity and Biotechnological Applications; Elsevier: Amsterdam, The Netherlands, 2018; pp. 13–41. [Google Scholar] [CrossRef]
  65. Narsing Rao, M.P.; Lohmaneeratana, K.; Bunyoo, C.; Thamchaipenet, A. Actinobacteria–Plant Interactions in Alleviating Abiotic Stress. Plants 2022, 11, 2976. [Google Scholar] [CrossRef]
  66. Vacheron, J.; Desbrosses, G.; Bouffaud, M.L.; Touraine, B.; Moënne-Loccoz, Y.; Muller, D.; Legendre, L.; Wisniewski-Dyé, F.; Prigent-Combaret, C. Plant Growth-Promoting Rhizobacteria and Root System Functioning. Front. Plant Sci. 2013, 4, 356. [Google Scholar] [CrossRef]
  67. Fierer, N.; Bradford, M.A.; Jackson, R.B. Toward an Ecological Classification of Soil Bacteria. Ecology 2007, 88, 1354–1364. [Google Scholar] [CrossRef]
  68. Zhang, G.; Bai, J.; Jia, J.; Wang, W.; Wang, D.; Zhao, Q.; Wang, C.; Chen, G. Soil Microbial Communities Regulate the Threshold Effect of Salinity Stress on SOM Decomposition in Coastal Salt Marshes. Fundam. Res. 2023, 3, 868–879. [Google Scholar] [CrossRef] [PubMed]
  69. Bao, Y.; Dolfing, J.; Guo, Z.; Chen, R.; Wu, M.; Li, Z.; Lin, X.; Feng, Y. Important Ecophysiological Roles of Non-Dominant Actinobacteria in Plant Residue Decomposition, Especially in Less Fertile Soils. Microbiome 2021, 9, 84. [Google Scholar] [CrossRef]
  70. Benlloch, S.; López-López, A.; Casamayor, E.O.; Øvreås, L.; Goddard, V.; Daae, F.L.; Smerdon, G.; Massana, R.; Joint, I.; Thingstad, F.; et al. Prokaryotic Genetic Diversity throughout the Salinity Gradient of a Coastal Solar Saltern. Environ. Microbiol. 2002, 4, 349–360. [Google Scholar] [CrossRef]
  71. Lozupone, C.A.; Knight, R. Global Patterns in Bacterial Diversity. Proc. Natl. Acad. Sci. USA 2007, 104, 11436–11440. [Google Scholar] [CrossRef] [PubMed]
  72. Woo, H.; Kim, I.; Chhetri, G.; Park, S.; Lee, H.; Yook, S.; Seo, T. Two Novel Bacterial Species, Rhodanobacter lycopersici sp. nov. and Rhodanobacter geophilus sp. nov., Isolated from the Rhizosphere of Solanum lycopersicum with Plant Growth-Promoting Traits. Microorganisms 2024, 12, 2227. [Google Scholar] [CrossRef]
  73. Shang, X.C.; Zhang, M.; Zhang, Y.; Hou, X.; Yang, L. Waste Seaweed Compost and Rhizosphere Bacteria Pseudomonas Koreensis Promote Tomato Seedlings Growth by Benefiting Properties, Enzyme Activities and Rhizosphere Bacterial Community in Coastal Saline Soil of Yellow River Delta, China. Waste Manag. 2023, 172, 33–42. [Google Scholar] [CrossRef] [PubMed]
  74. Roychowdhury, R.; Mishra, S.; Anand, G.; Dalal, D.; Gupta, R.; Kumar, A.; Gupta, R. Decoding the Molecular Mechanism Underlying Salicylic Acid (SA)-Mediated Plant Immunity: An Integrated Overview from Its Biosynthesis to the Mode of Action. Physiol. Plant 2024, 176, e14399. [Google Scholar] [CrossRef]
  75. Elsisi, M.; Elshiekh, M.; Sabry, N.; Aziz, M.; Attia, K.; Islam, F.; Chen, J.; Abdelrahman, M. The Genetic Orchestra of Salicylic Acid in Plant Resilience to Climate Change Induced Abiotic Stress: Critical Review. Stress Biol. 2024, 4, 31. [Google Scholar] [CrossRef]
  76. Borsani, O.; Valpuesta, V.; Botella, M.A. Evidence for a Role of Salicylic Acid in the Oxidative Damage Generated by NaCl and Osmotic Stress in Arabidopsis Seedlings. Plant Physiol. 2001, 126, 1024–1030. [Google Scholar] [CrossRef]
  77. Yasin Ashraf, M.; Ashraf, M.; Akhtar, M.; Mahmood, K.; Saleem, M. Improvement in Yield, Quality and Reduction in Fruit Drop in Kinnow (Citrus Reticulata Blanco) by Exogenous Application of Plant Growth Regulators, Potassium and Zinc. Pak. J. Bot 2013, 45, 433–440. [Google Scholar]
  78. Salama, K.H.A.; Mansour, M.M.F.; Ali, F.Z.M.; Abou-Hadid, A.F. NaCl-Induced Changes in Plasma Membrane Lipids and Proteins of Zea Mays L. Cultivars Differing in Their Response to Salinity. Acta Physiol. Plant 2007, 29, 351–359. [Google Scholar] [CrossRef]
  79. Guo, Q.; Liu, L.; Barkla, B.J. Membrane Lipid Remodeling in Response to Salinity. Int. J. Mol. Sci. 2019, 20, 4264. [Google Scholar] [CrossRef]
  80. Molina, A.; Bueno, P.; Marín, M.C.; Rodríguez-Rosales, M.P.; Belver, A.; Venema, K.; Donaire, J.P. Involvement of Endogenous Salicylic Acid Content, Lipoxygenase and Antioxidant Enzyme Activities in the Response of Tomato Cell Suspension Cultures to NaCl. New Phytol. 2002, 156, 409–415. [Google Scholar] [CrossRef]
  81. Ghanem, M.E.; Ghars, M.A.; Frettinger, P.; Pérez-Alfocea, F.; Lutts, S.; Wathelet, J.P.; du Jardin, P.; Fauconnier, M.L. Organ-Dependent Oxylipin Signature in Leaves and Roots of Salinized Tomato Plants (Solanum lycopersicum). J. Plant Physiol. 2012, 169, 1090–1101. [Google Scholar] [CrossRef] [PubMed]
  82. Lee, S.; Choi, J.H.; Truong, H.A.; Lee, Y.J.; Lee, H. Enhanced Nitrate Reductase Activity Offers Arabidopsis Ecotype Landsberg Erecta Better Salt Stress Resistance than Col-0. Plant Biol. 2022, 24, 854–862. [Google Scholar] [CrossRef]
  83. Shabala, S. Salinity and Programmed Cell Death: Unravelling Mechanisms for Ion Specific Signalling. J. Exp. Bot. 2009, 60, 709–712. [Google Scholar] [CrossRef]
  84. Radchenko, M.V.; Waditee, R.; Oshimi, S.; Fukuhara, M.; Takabe, T.; Nakamura, T. Cloning, Functional Expression and Primary Characterization of Vibrio Parahaemolyticus K+/H+ Antiporter Genes in Escherichia coli. Mol. Microbiol. 2006, 59, 651–663. [Google Scholar] [CrossRef]
Figure 1. Shannon, Pielou’s evenness and Observed alpha diversity indices of the bacterial community in the bare sample, control (CTRL) and salt (SS) rhizosphere groups before (T0, bare sample) and 1, 7, 14, 21 days after salt treatment.
Agriculture 15 00624 g001
Figure 2. Principal coordinate analysis (PCoA) based on Bray-Curtis dissimilarities of bacterial communities from the bare sample, untreated (CTRL) and salt-treated (SS) rhizosphere groups at different time points after treatment application. Bare sample, CTRL and SS are indicated as circles, triangles and squares, respectively. Time points are indicated by different colors.
Agriculture 15 00624 g002
Figure 3. Taxonomic composition at the phylum level of the substrate samples at different time points, separated based on the treatment. Phyla with read frequencies lower than 0.01 of the whole community are reported as “Other”.
Agriculture 15 00624 g003
Figure 4. Changes in the taxonomic composition of bacterial communities. (a) Time dependent changes of phyla in untreated (CTRL) and salt-treated groups (SS) with relative abundance of ASV greater than 0.01 (b): Extended error bar showing difference in mean proportion of bacterial genus belonging to phyla that became more abundant in SS at days 7, 14 and 21 from CTRL and SS, filtered by effect size 1 in STAMP. Effect size for each taxon is indicated as difference in mean proportion and black bars highlight the 95% confidence intervals for each analysis. p-values were determined using White’s non-parametric t-test on STAMP software. Error bars on the mean proportion barplot represent standard deviation.
Agriculture 15 00624 g004
Figure 5. Distribution of oxylipins in all leaf samples (a) Principal component analysis (PCA) of the leaf samples on the basis of metabolite compounds measured at different time points and between treatments. Time points are indicated with different shapes. CTRL and SS are indicated by gray and brown, respectively. The samples at T0 are colored in violet; (b) Heatmap showing visualization of average level content and type of metabolites within treated and control groups among time points. Data were normalized by variables.
Agriculture 15 00624 g005
Figure 6. Functional genes involved in plant growth promoting (PGP) traits and ions homeostasis. (a) Heatmap showing the relative abundance of genes involved in plant growth promotion and ion regulation concentrations in CTR and SS groups at different time points. At each time point, differences between relative abundance of genes in the SS and CTR groups were assessed with a t-test. (b) Diagram of the nitrogen cycle reporting the distribution of genes and relative enzymes (KEGG level 1) involved in nitrogen cycling. Undetected genes are indicated in gray. Differences in the abundance of genes related to specific reactions is indicated by an increase in the size of the arrows.
Agriculture 15 00624 g006
Table 1. Shannon and Pielou’s evenness indices compared between different time points in the SS group. Differences were assessed with Tukey’s post hoc test.
ComparisonShannon IndexPielou’s Evenness
Diffp SigDiffp Sig
Time 7–Time 10.1587463*0.017834536ns
Time 14–Time 10.1960060*0.024326297*
Time 21–Time 10.2796129**0.033348564**
Time 14–Time 70.0372597ns0.006491761ns
Time 21–Time 70.1208666ns0.015514028ns
Time 21–Time 140.0836069ns0.009022267ns
*: p < 0.05; **: p < 0.01; ns: p > 0.05.
Disclaimer/Publisher’s Note: The statements, opinions and data contained in all publications are solely those of the individual author(s) and contributor(s) and not of MDPI and/or the editor(s). MDPI and/or the editor(s) disclaim responsibility for any injury to people or property resulting from any ideas, methods, instructions or products referred to in the content.

