Article

Spatio-Temporal Evolution of Net Ecosystem Productivity and Its Influencing Factors in Northwest China, 1982–2022

1
Yinshanbeilu Grassland Eco-Hydrology National Observation and Research Station, China Institute of Water Resources and Hydropower Research, Beijing 100038, China
2
China South-to-North Water Diversion Corporation Limited, Beijing 100038, China
3
College of Water Conservancy, North China University of Water Resources and Electric Power, Zhengzhou 450045, China
*
Author to whom correspondence should be addressed.
Agriculture 2025, 15(6), 613; https://doi.org/10.3390/agriculture15060613
Submission received: 25 January 2025 / Revised: 2 March 2025 / Accepted: 6 March 2025 / Published: 13 March 2025

Abstract

:
The carbon cycle in terrestrial ecosystems is a crucial component of the global carbon cycle, and drought is increasingly recognized as a significant stressor impacting their carbon sink function. Net ecosystem productivity (NEP), which is a key indicator of carbon sink capacity, is closely related to vegetation Net Primary Productivity (NPP), derived using the Carnegie-Ames-Stanford Approach (CASA) model. However, there is limited research on desert grassland ecosystems, which offer unique insights due to their long-term data series. The relationship between NEP and drought is complex and can vary depending on the intensity, duration, and frequency of drought events. NEP is an indicator of carbon exchange between ecosystems and the atmosphere, and it is closely related to vegetation productivity and soil respiration. Drought is known to negatively affect vegetation growth, reducing its ability to sequester carbon, thus decreasing NEP. Prolonged drought conditions can lead to a decrease in vegetation NPP, which in turn affects the overall carbon balance of ecosystems. This study employs the improved CASA model, using remote sensing, climate, and land use data to estimate vegetation NPP in desert grasslands and then calculate NEP. The Standardized Precipitation Evapotranspiration Index (SPEI), based on precipitation and evapotranspiration data, was used to assess the wetness and dryness of the desert grassland ecosystem, allowing for an investigation of the relationship between vegetation productivity and drought. The results show that (1) from 1982 to 2022, the distribution pattern of NEP in the Inner Mongolia desert grassland ecosystem showed a gradual increase from southwest to northeast, with a multi-year average value of 29.41 gCm⁻2. The carbon sink area (NEP > 0) accounted for 67.99%, and the overall regional growth rate was 0.2364 gcm−2yr−1, In addition, the area with increasing NEP accounted for 35.40% of the total area (p < 0.05); (2) using the SPEI to characterize drought changes in the Inner Mongolia desert grassland ecosystems, the region as a whole was mainly affected by light drought. Spatially, the cumulative effect was primarily driven by short-term drought (1–2 months), covering 54.5% of the total area, with a relatively fast response rate; (3) analyzing the driving factors of NEP using the Geographical detector, the results showed that annual average precipitation had the greatest influence on NEP in the Inner Mongolian desert grassland ecosystem. Interaction analysis revealed that the combined effect of most factors was stronger than the effect of a single factor, and the interaction of two factors had a higher explanatory power for NEP. This study demonstrates that NEP in the desert grassland ecosystem has increased significantly from 1982 to 2022, and that drought, as characterized by the SPEI, has a clear influence on vegetation productivity, particularly in areas experiencing short-term drought. Future research could focus on extending this analysis to other desert ecosystems and incorporating additional environmental variables to further refine the understanding of carbon dynamics under drought conditions. This research is significant for improving our understanding of carbon cycling in desert grasslands, which are sensitive to climate variability and drought. The insights gained can help inform strategies for mitigating climate change and enhancing carbon sequestration in arid regions.

1. Introduction

Carbon cycling in terrestrial ecosystems is a key component of the global carbon cycle [1], which spans the atmosphere, hydrosphere, and lithosphere. This process reflects regional climatic conditions and the influence of human activities [2]. Vegetation, a crucial component of terrestrial ecosystems, plays a key role in regulating the carbon balance [3]. Through photosynthesis, vegetation absorbs and sequesters carbon, making it the most significant natural carbon sink [4]. Enhancing the vegetation carbon sink is an effective strategy to mitigate rising atmospheric carbon dioxide levels and global warming, and is also essential for achieving carbon neutrality [5]. Many studies have identified key indicators for assessing the carbon sink capacity of vegetation, such as gross primary productivity (GPP), net primary productivity (NPP), and net ecosystem productivity (NEP). NEP represents the difference between vegetation NPP and heterotrophic respiration, reflecting the net carbon exchange between terrestrial ecosystems and the atmosphere. It is a crucial indicator for determining the carbon sources and sinks of a region [6]. As a key variable in the vegetation carbon cycle, NEP not only reveals the growth dynamics of vegetation in natural environments but also provides a crucial basis for quantitatively assessing the carbon sequestration potential of regional vegetation [7]. In other words, studying the changing characteristics of vegetation NEP and its response to the climate is essential for accurately predicting the terrestrial carbon sink under climate change.
Drought is a significant stressor affecting the current carbon sink function of terrestrial ecosystems [8]. In the context of global warming, both the frequency and intensity of droughts have increased [9,10]. A growing body of research identifies drought as a key factor influencing the functioning of carbon sinks in terrestrial ecosystems at both regional and global scales. It has a dramatic impact on vegetation growth and drives profound changes in ecosystem structure and function [11,12]. Numerous studies have shown that an increase in the intensity, frequency, and duration of droughts is likely to cause significant negative impacts on the functional structure of terrestrial ecosystems, potentially shifting ecosystem carbon sinks to carbon sources [8,13]. For example, the exceptional drought of 2003 led to an unusual carbon source in the atmosphere in Europe, offsetting the net ecosystem carbon sequestration of the previous four years [11]. Extreme droughts have also led to a significant decline in global NPP over the past decade [14]. Deng et al. found that parts of the Loess Plateau and the Tibetan Plateau experienced the most severe losses from 2000 to 2015, as measured through NEP, GPP, and other metrics [15]. Extreme droughts in Northern Europe in 2018 reduced NEP by more than 50 g·m⁻2·yr⁻1 in over half of the study areas [16]. Drought events are responsible for more than half of the anomalies in the ecosystem carbon cycle. Therefore, understanding the response mechanisms of terrestrial ecosystem carbon cycle processes to droughts is crucial for assessing the carbon sequestration capacity of terrestrial ecosystems in the context of global warming.
The use of a drought index to quantify drought effects is an effective assessment method. Commonly used drought indices include the Standardized Precipitation Index (SPI) [17], Palmer Drought Severity Index (PDSI) [18], Standardized Runoff Index (SRI) [19], Standardized Soil Moisture Index (SSMI) [20], and Standardized Precipitation Evapotranspiration Index (SPEI) [21]. However, the PDSI is only applicable to arid and semi-arid regions and cannot monitor droughts at multiple scales [22]. While it can capture long-term droughts, it is not suitable for flash droughts [23]. The SPI, on the other hand, has been widely used due to its ease of computation and ability to monitor droughts at multiple timescales; however, it only accounts for the effects of precipitation [24] and does not consider other factors, such as evapotranspiration. The SPEI, which combines the effects of precipitation and evapotranspiration on drought while maintaining the sensitivity of the SPI and PDSI to temperature and precipitation, is characterized by multiple timescales and spatial comparisons. It has been widely applied to study the effects of drought on vegetation productivity [25].
Grassland ecosystems, one of the most widely distributed terrestrial ecosystems, account for more than 40% of global terrestrial ecosystems [26]. They play a crucial role in maintaining the terrestrial carbon balance, improving regional microclimates, and protecting biodiversity [9,27]. Previous studies have shown that precipitation anomalies and temperature changes are the primary causes of drought in grassland ecosystems, making drought a key factor contributing to changes in ecosystem structure and function [28,29]. However, despite the importance of grassland ecosystems in the global carbon cycle, research specifically focusing on NEP in desert grasslands remains limited. Most studies on NEP in grassland ecosystems have either focused on more stable or less arid regions, or have been short-term and localized, leaving a significant gap in our understanding of long-term and large-scale NEP dynamics in desert grasslands [30,31]. Therefore, gaining a deeper understanding of the spatial and temporal changes in NEP within desert grassland ecosystems, especially in arid and semi-arid regions like Inner Mongolia, as well as its relationship with drought, holds significant practical and scientific value. This research aims to fill these gaps by providing a comprehensive, long-term assessment of NEP in desert grasslands, shedding light on how climate change and drought influence carbon sequestration in these fragile ecosystems. The desert grassland in the northern foothills of the Yinshan Mountains in Inner Mongolia spans approximately 112,000 km2. This fragile ecosystem lies at the boundary between grassland and desert and serves as a transition zone from the Yinshan Mountains to the Mongolian Plateau, as well as from a semi-arid to an arid climate. Its unique geographic location makes it particularly significant. As a fragile grassland ecosystem located at the boundary between grassland and desert, the desert grassland ecosystem is highly sensitive to both human activities and climate change. Although research on NEP began earlier, studies focusing on NEP in the desert grasslands of Inner Mongolia remain limited, particularly those that are long-term, large-scale, and multi-scale.
This paper utilizes remote sensing data to analyze the temporal trends and spatial distribution characteristics of NEP in the desert grasslands of Inner Mongolia from 1982 to 2022, as well as the influencing factors. Based on this analysis, the impacts of climate change and human activities on NEP are further explored. The main research content of this paper is structured around the following key points: (1) the spatial and temporal distribution pattern of NEP in Inner Mongolian desert grassland ecosystems from 1982 to 2022; (2) the impact of drought on vegetation productivity in these ecosystems during the same period; and (3) the driving mechanisms of NEP in Mongolian desert grassland ecosystems from 1982 to 2022. The findings of this research can provide valuable insights for ecological protection and restoration in dry regions.

2. Study Area and Datasets
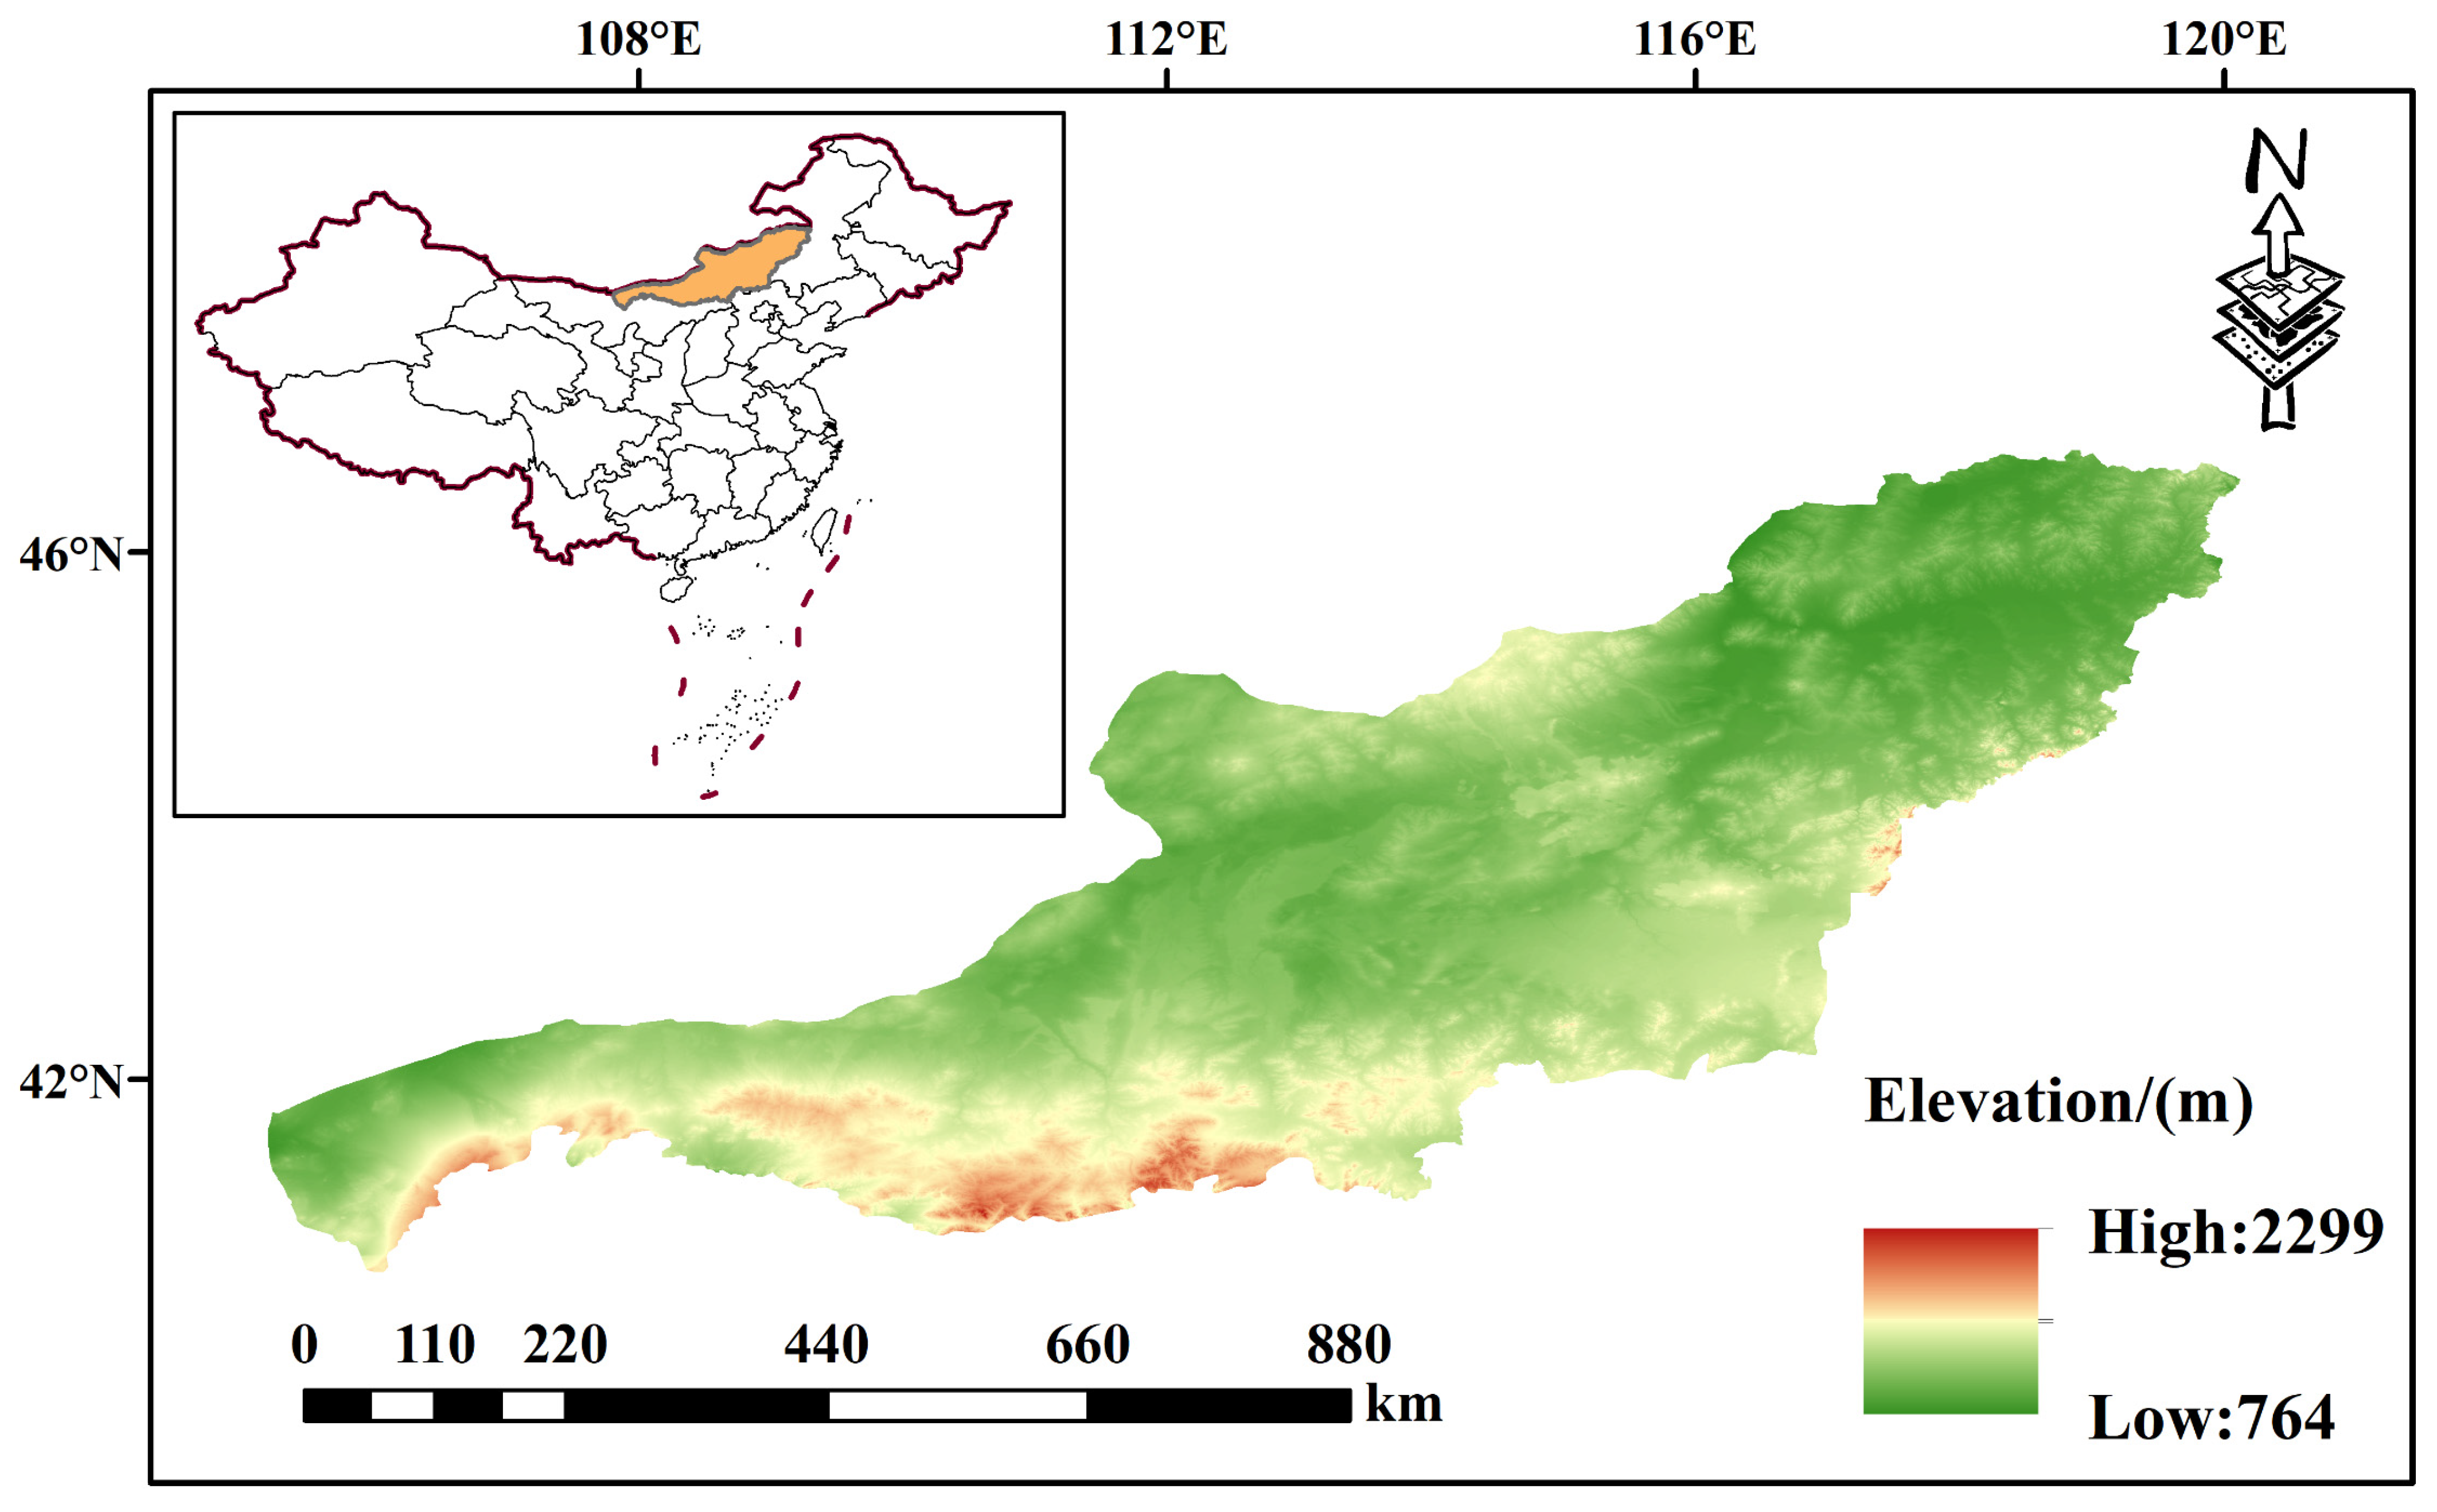
2.1. Study Area

This paper focuses on the desert grassland in the northern foothills of the Yinshan Mountains as the study area. The region is located between 40°20′–42°40′ N latitude and 109°16′–110°16′ E longitude, within the town of Xilamuren in the southeastern part of Damao Banner, Baotou City. The study area covers approximately 112,000 square kilometers. Situated at the edge of the Mongolian Plateau, it marks the transition zone between the Yinshan Mountains and the Inner Mongolia Plateau. The area has a temperate continental monsoon climate, characterized by dry and windy conditions in spring and fall, concentrated rainfall in summer, and cold, dry winters. The average annual precipitation is 225.5 mm, with the majority falling in July and August, accounting for 76–80% of the total yearly precipitation. The annual humidity ranges from 0.13 to 0.31, while the average annual temperature is 2.5 °C. The region enjoys an average of 3100 to 3300 h of sunshine annually, and the frost-free period lasts approximately 83 days. The average annual evaporation is 2227.3 mm, nearly 7.9 times the amount of precipitation. The average annual wind speed is 4.5 m/s, with a maximum wind speed of 27.0 m/s. The prevailing wind direction throughout the year is from the north and northwest. These climatic parameters are derived from weather station data collected in the region from 2002 to the present (https://www.nmmks.com/) (accessed on 10 September 2024). An overview of the study area is provided in Figure 1.

2.2. Data Sources

The data used in this paper include meteorological data, land use data, and vegetation remote sensing data. The sources and specific details of these datasets are provided in Table 1. To maintain spatial and temporal consistency across datasets with varying spatial resolutions, all datasets were resampled to a 1 km × 1 km resolution using nearest neighbor interpolation. This resampling was necessary to ensure uniformity across the data, as datasets with higher spatial resolutions, such as the NDVI (0.0833° × 0.0833°), solar radiation (0.1° × 0.1°), and NPP (500 m × 500 m), were used in the analysis. Additionally, since the CASA model was used to simulate NPP and derive NEP data, all input data (CLCD, NDVI, temperature, precipitation, and solar radiation) had to have consistent spatial resolution to ensure smooth model operation. Resampling to 1 km × 1 km allowed for accurate spatial comparisons and prevented potential biases due to differing resolution scales. The MOD17A3H dataset was employed to verify the accuracy of the CASA model.

3. Methodology

3.1. CASA Model

Net ecosystem productivity (NEP) is a key indicator of whether an ecosystem functions as a carbon sink or a carbon source, representing the carbon exchange process between the ecosystem and the atmosphere. It is defined as the difference between vegetation net primary productivity (NPP) and soil heterotrophic respiration (Rh), expressed as follows [32]:
N E P x , t = N P P x , t R h x , t
where NEP(x,t) denotes the net ecosystem productivity of vegetation (gCm−2) of elephant x in month t, NPP(x,t) denotes the net primary productivity of vegetation (gCm−2) of elephant x in month t, and Rh(x,t) denotes the heterotrophic respiration of soil (gCm−2) of elephant x in month t. The ecosystem is a carbon sink when NEP > 0, and a carbon source when NEP < 0.
The Carnegie–Ames–Stanford Approach (CASA) model is a light energy utilization model that integrates remotely sensed data, temperature, precipitation, solar radiation, and vegetation type [33]. It assumes that vegetation productivity is primarily driven by solar radiation (APAR), temperature, and moisture, which influence photosynthesis and growth. The model is well suited for estimating net primary productivity (NPP) in desert grasslands, where long-term remote sensing data are abundant and environmental conditions are highly variable. However, it assumes a linear relationship between APAR and NPP, which may not capture the nonlinear dynamics of vegetation growth under extreme conditions like droughts or heatwaves.
Additionally, the model uses fixed light energy conversion efficiency (ε) to estimate NPP, which may not account for variations in vegetation type or stress factors, such as drought, that influence photosynthesis. The CASA model does not explicitly consider factors like soil texture or nutrient availability, which can significantly affect vegetation growth in arid environments. While these limitations are acknowledged, the model remains valuable for understanding vegetation productivity and carbon sequestration in desert ecosystems.
APAR (Absorbed Photosynthetically Active Radiation) is a key variable in the CASA model, representing the fraction of solar radiation absorbed by plants that drives photosynthesis. The amount of APAR available for vegetation growth is crucial for ecosystem productivity. NPP (Net Primary Productivity) is estimated by multiplying APAR with the light energy conversion efficiency (ε), indicating the carbon fixed by plants. As a key indicator of ecosystem productivity, NPP reflects an ecosystem’s potential to sequester carbon. NEP (Net Ecosystem Productivity) builds on NPP by considering soil respiration, providing a comprehensive measure of the carbon sink or source of an ecosystem. NEP is essential for evaluating carbon balance and understanding how drought affects carbon sequestration.
For NPP simulation, we combined monthly mean temperature, precipitation, solar radiation, NDVI, and vegetation type to estimate the NPP of desert grassland ecosystems in Inner Mongolia using the improved CASA model, which is calculated as follows [34]:
N P P x , t = A P A R x , t × ε x , t
where APAR(x,t) denotes the light energy absorbed by pixel x in month t (MJ/m2), and ε(x,t) represents the light energy utilization of pixel x in month t (gC/MJ).
Determining Rh is crucial for estimating regional carbon sinks and sources. Since no universal model has been established for the study area, this paper adopts a model that has yielded better results in the Northwest Dry and Early Zones, as well as in the Qinghai, Gansu, and Shaanxi Provinces, to estimate soil heterotrophic respiration. The formula is calculated as follows [35]:
R h x , t = 0.22 × exp 0.0912 T x , t + ln 0.3145 P x , t + 1 × 30 × 46.5 %
where T(x,t) represents the average temperature (°C) of pixel x in month t, and P(x,t) represents the average precipitation (mm) of pixel x in month t.

3.2. Drought Index

The Standardized Precipitation Evapotranspiration Index (SPEI) is a widely used quantitative index for measuring water balance, where a larger SPEI value indicates wetter conditions and a smaller value indicates drier conditions. Compared with other drought indices, SPEI is more effective for the quantitative assessment of drought. It combines the temperature sensitivity of the Palmer Drought Severity Index (PDSI) with the multi-temporal scale of the Standardized Precipitation Index (SPI). It also offers the advantage of multiple time scales, as seen in the Standardized Precipitation Index (SPI), making it suitable for assessing wet and dry conditions in the context of global warming [36].
Therefore, in this paper, SPEI was used to quantify the wet and dry conditions of the desert grassland ecosystem in Inner Mongolia. The monthly moisture deficit was used to quantify regional aridity, and the numerical series (the difference between precipitation and potential evapotranspiration) was fitted to a log-logistic probability distribution, which was then transformed into a standard normal distribution to determine the final SPEI value. In this paper, monthly-scale precipitation and potential evapotranspiration data were used to calculate the SPEI for a monthly dataset with a spatial resolution of 1 km × 1 km. The methodology for calculating the SPEI is based on [21], and Equations (4)–(8) are adopted directly from this reference:
D i = P i P E T i
where i is month; Di is the difference between monthly precipitation and potential evapotranspiration, mm; Pi is monthly precipitation, mm; PETi is monthly potential evapotranspiration, mm.
Construct the cumulative water surplus and deficit series X with meteorological significance at different time scales:
X i k = i k + 1 i D i
where k is the time scale, k = 1, 2, …, 12.
Use the three-parameter log-logistic probability distribution function to fit the Xik sequence and calculate the probability density function f(x) and probability distribution function F(x). The formula is as follows:
f x = β α x γ α β 1 1 + x γ α β 2
F x = 1 + α x γ β 1
where α, β, and γ are the scale, shape, and origin parameters, respectively.
Standardize the probability distribution function F(x) to obtain the corresponding SPEI sequence. The formula is as follows:
S P E I = W C 0 + C 1 W + C 2 W 2 1 + d 1 W + d 2 W 2 + d 3 W 3
wherein, when P ≤ 0.5, P = 1 − F(x); when P > 0.5, P = F(x); the other parameters are C0 = 2.515517, C1 = 0.802853, C2 = 0.010328, d1 = 1.432788, d2 = 0.189269, and d3 = 0.001308.
The drought characterization index was calculated based on the SPEI, with drought frequency, drought duration, and drought severity selected for drought assessment. Drought frequency was defined as the ratio of the number of drought events to the number of years in the study period, drought duration was defined as the total number of consecutive drought months, and drought severity was defined as the sum of the SPEI values for all drought months in a given period. The drought classes were categorized based on SPEI values, with classification criteria referencing previous studies. These classification standards are presented in Table 2.

3.3. Quantification of Accumulative Effects of Drought

Ecosystem productivity typically exhibits a cumulative response to drought, with vegetation growth responding cumulatively to drought over a specific period. To investigate the time-lag effect of drought in the desert grassland ecosystems of Inner Mongolia, this study uses the correlation coefficients between the SPEI and NEP at the 1–12-month scales to assess the cumulative impact of drought on net ecosystem productivity (NEP). The larger the absolute value of the correlation coefficient for a given month, the stronger the cumulative effect of drought on ecosystem productivity. The formula is as follows [39]:
R i = max c o r r N E P , S P E I i , 1 i 12
where Ri represents the maximum correlation coefficient between SPEI and NEP at i monthly scales; SPEIi represents the SPEI value at i monthly scales.

3.4. Trend Analysis

The Theil–Sen median analysis, combined with the Mann–Kendall test, is an effective and robust method for determining trends in time series data. This approach has been widely used to assess trends in climatic and hydrological data [40]. The Theil–Sen median analysis is a nonparametric statistical method for calculating stable trends which is insensitive to measurement errors and discrete data, making it well suited to indicate long-term trends in NEP at the quadrant scale. The formula for Theil–Sen’s method is as follows [41]:
S l o p e N E P = Median x j x i j i , j > i
where SlopeNEP is the slope value estimated by Theil–Sen; x represents the NEP value for each year (or month) in this study; i and j are different years (or months) between 1982 and 2022. A SlopeNEP < 0 indicates a decreasing trend in NEP, whereas SlopeNEP > 0 indicates an increasing trend in NEP.
The Mann–Kendall test is a nonparametric statistical test that does not require the measurements to follow a normal distribution, and missing values and outliers have a minimal effect on the structure. Therefore, it is widely used to test the significance of trends in long-time-series data. The Mann–Kendall test is calculated using the following formula [42]:
Z = S V S S > 0 0 S = 0 S + 1 V S S < 0
S = i = 1 n 1 j = i + 1 n S i g n x j x i
S i g n x j x i = 1 x j x i < 0 0 x j x i = 0 1 x j x i > 0
V S = n n 1 2 n + 5 18
where Z is the standardized test statistic; n is the number of time series data; and Sign denotes the function sign. When n ≥ 8, the test statistic S is approximately normally distributed with the following mean and variance: if Z is > Z1−α/2 at the α level, it means that the hypothesis that there is no trend is rejected, and there is a significant trend change in NEP on the time series. Z1−α/2 is the value corresponding to the distribution table of the standardized normal distribution function at the α confidence level. When |Z| is greater than 1.65, 1.96, and 2.58, it means that the trend passes the 90%, 95%, and 99% significance tests, respectively.

3.5. Geographical Detector

The geographical detector is a statistical method used to identify spatial variations and uncover the factors driving these differences. Geoprobes primarily include four types: the factor detector, interaction detector, risk detector, and ecological detector [43]. This study employs the factor and interaction detectors to investigate the factors influencing geographic elements.

3.5.1. Parameter Optimization

To calculate the q-value of each influencing factor under different classification methods and numbers of classifications, this study uses the GD package in R for geodetector analysis. The classification methods employed include equal spacing, natural breaks, quantile, geometric spacing, and standard deviation. These methods are applied to identify the combinations that yield the highest q-value for each factor, enabling optimal spatial discretization.

3.5.2. Factor Detector

Factor detection focuses on identifying the spatial dissimilarity of NEP and determining the extent to which a factor (X) explains this dissimilarity. This is measured by the q-value, which is calculated using the following formula [44]:
q = 1 h 1 L N h σ h 2 N σ 2
where q is the explanatory power of each driver for the spatial distribution of NEP; q is between 0 and 1, and the larger q is, the stronger the explanatory power for NEP. h and L are the categorizations of the variable Y(NEP); Nh is the number of cells in class h; N is the number of cells in the whole region; σ h 2 is the variance in the change in NEP for class h; σ2 is the variance in the change in NEP for the whole region.

3.5.3. Interaction Detector

Interaction detection is primarily used to identify interactions between different drivers (X), specifically to assess whether the combined effects of factors X1 and X2 increase or decrease the explanatory power of the dependent variable Y, or if their effects on Y are independent of one another. The synergistic relationships between the drivers are summarized in Table 3.

4. Results

4.1. Spatial and Temporal Distribution Pattern of NEP in Inner Mongolian Desert Grassland Ecosystems

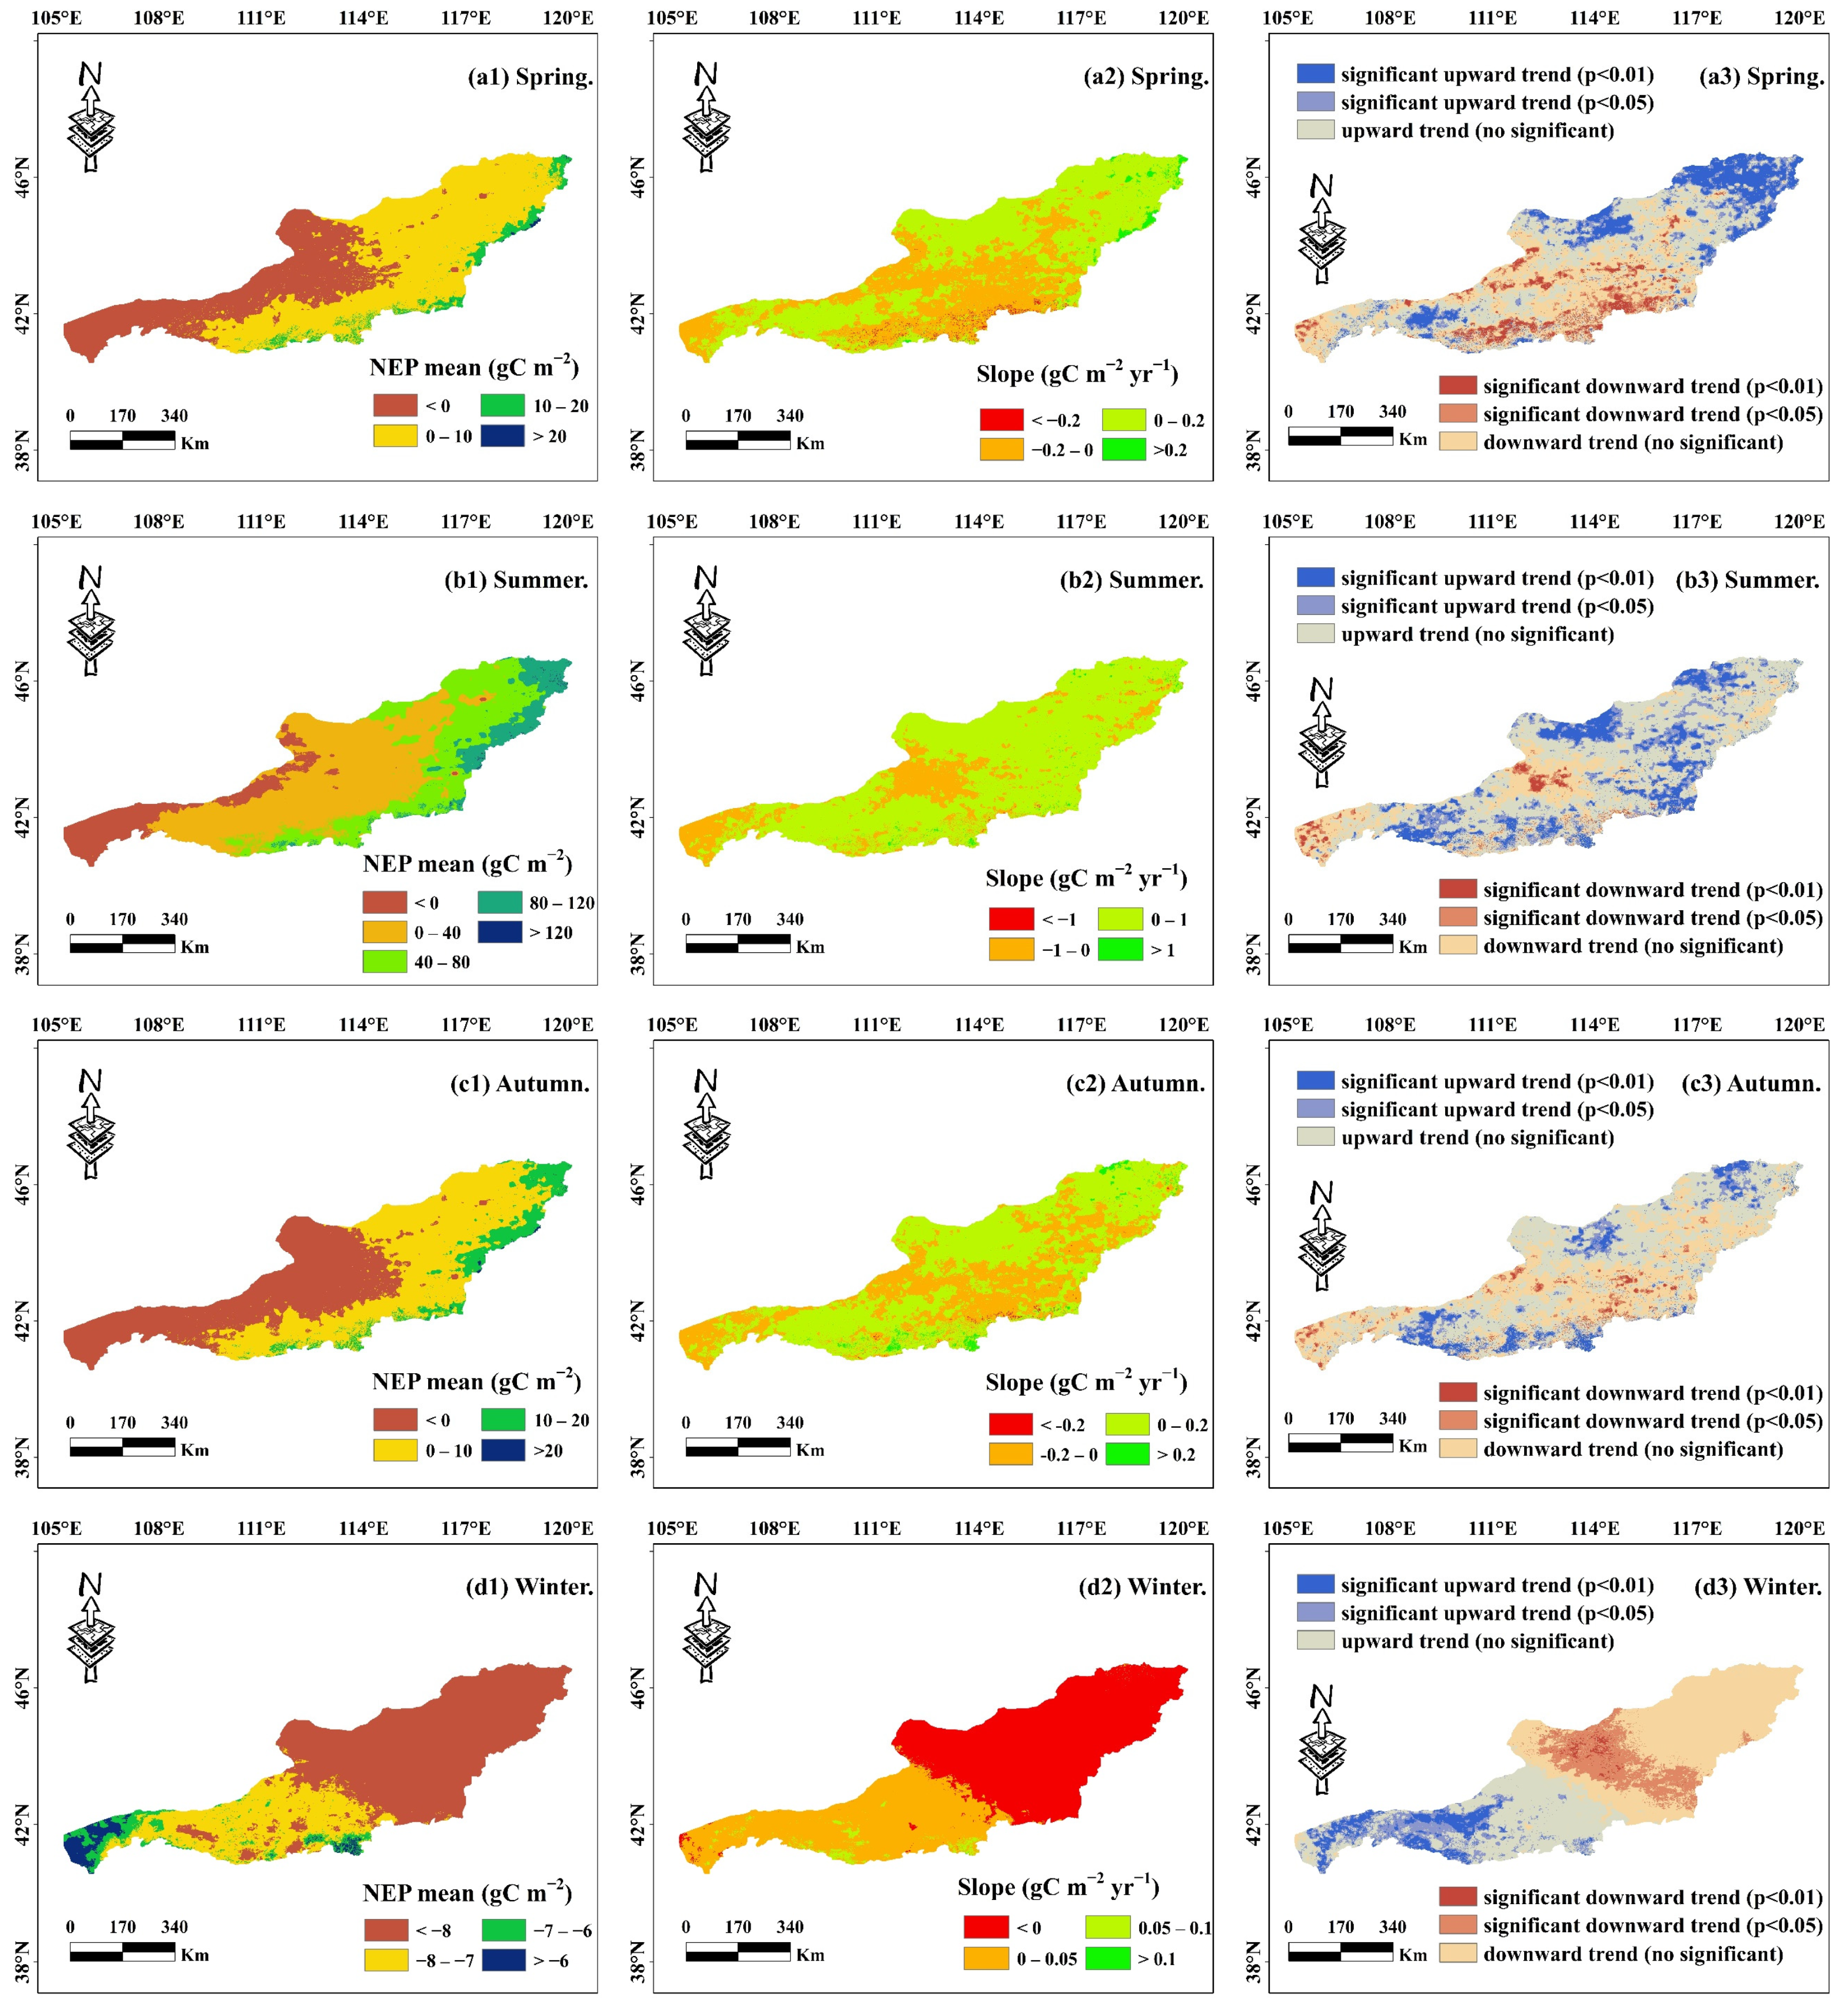
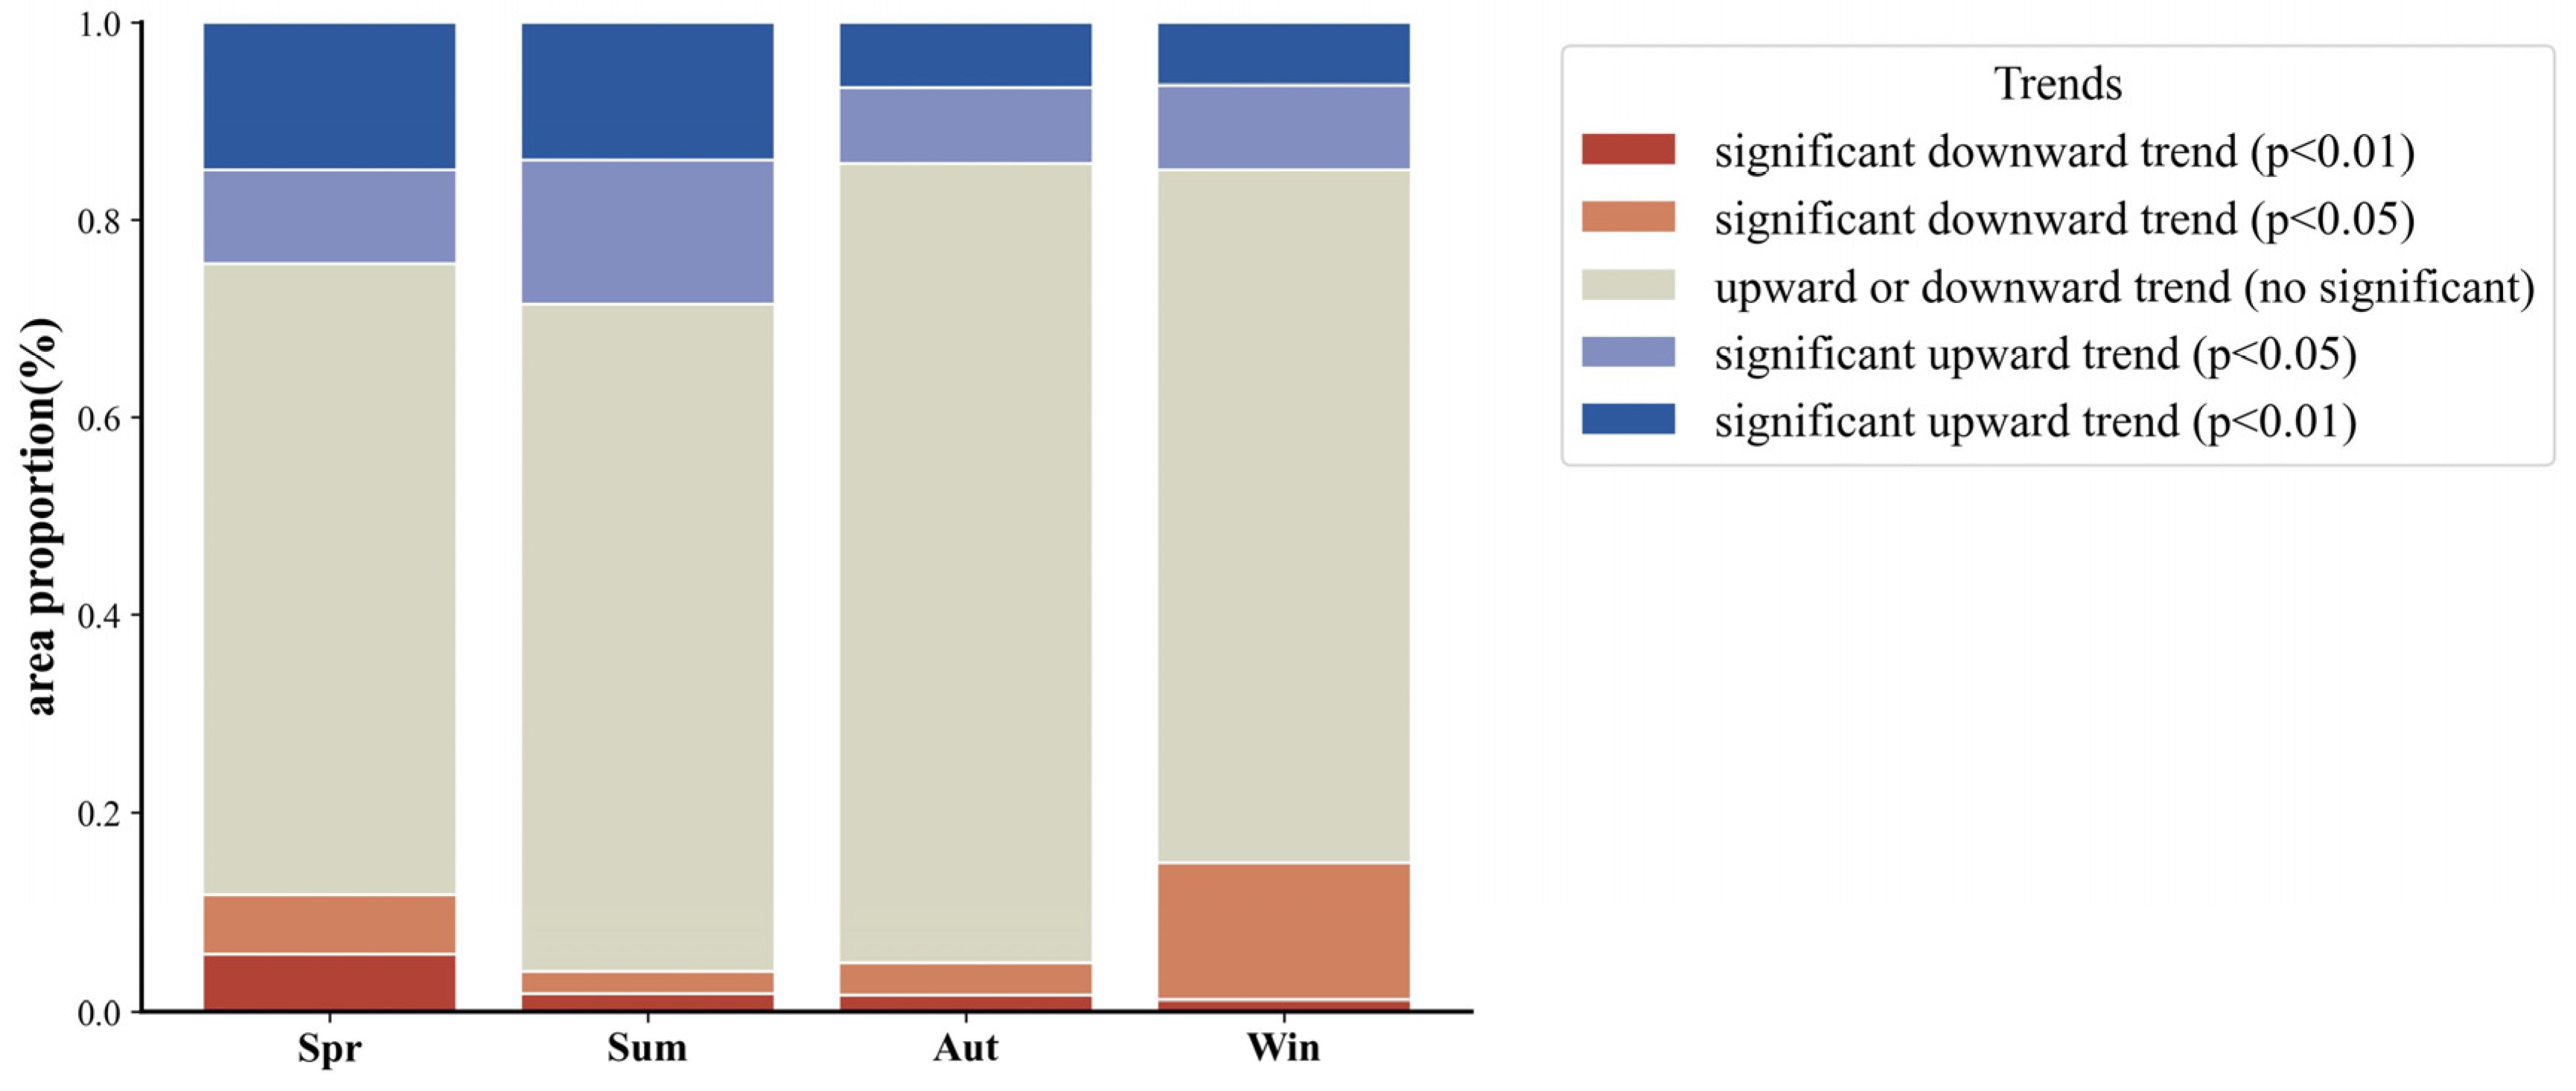
4.1.1. Spatial and Temporal Distribution of Annual and Seasonal NEP

The distribution of annual average NEP in the Inner Mongolia desert grassland ecosystems from 1982 to 2022 is shown in Figure 2(a1). NEP increases gradually from southwest to northeast across the study area. The long-term average NEP is 29.41 gCm−2, with carbon sink areas (NEP > 0) covering 67.99% and carbon source areas (NEP < 0) covering 32.01%. High NEP values are concentrated in the northeastern region. Low NEP values are mainly found in the western part of the study area.
The interannual variation trend of the average annual NEP from 1982 to 2022 is shown in Figure 2(a2,a3). The total NEP showed a significant increasing trend (the growth rate was 0.2364 gcm−2yr−1), and 35.40% of the area NEP showed an increasing trend, of which 19.86% of the area increased significantly (p < 0.01), mainly distributed in the western and central parts of the study area. The area with no significant change in NEP accounted for 59.59%, mainly distributed in the western part of the study area. Only 5.01% of the area NEP decreased significantly, located in the western (near the border) and central parts of the study area.
The seasonal distribution of NEP in the Inner Mongolian desert grassland ecosystems from 1982 to 2022 is shown in Figure 3(a1,b1,c1,d1). The spatial distribution patterns of spring, summer, and autumn align with the annual average NEP, showing a gradual increase from southwest to northeast. In contrast, the winter NEP decreases gradually from southwest to northeast. The proportion of carbon sinks (NEP > 0) in each season follows a trend of first increasing and then decreasing, with values of 63.92%, 86.97%, 57.18%, and 0%.
The inter-annual trend of NEP across the four seasons from 1982 to 2022 is shown in Figure 3(a2,b2,c2,d2). An increasing trend in NEP was observed in all seasons, though growth rates varied (the overall growth rate was 0.0213 gcm−2yr−1, 0.1804 gcm−2yr−1, 0.0223 gcm−2yr−1, and0.0066 gcm−2yr−1, respectively). Combining Figure 3(a3, b3, c3, d3) and Figure 4, we can get the following conclusions: the greatest increase occurred in summer, with 28.47% of the area showing increased NEP, of which 13.92% was a significant increase (p < 0.01), mainly distributed in the central part of the study area, and the area with no significant change in NEP accounted for 67.57% of the total area. The smallest increase occurred in winter, with an increase of 14.92% of the area, of which 6.33% of the area had a significant increase in NEP (p < 0.01)., mainly distributed in the southwest of the study area, and the area with no significant change in NEP accounted for 70.16%.
Seasonal variations in NEP are linked to the vegetation growth cycle. In spring, as temperatures rise and precipitation increases, the maximum NEP reaches 30.38 gCm−2. Summer, with more favorable climatic conditions, shows a significant increase in NEP, with a maximum value of 142.64 gCm−2 and an average value of 32.91 gCm−2, while the minimum NEP reaches −21.43 gCm−2. In autumn, as temperatures decrease and vegetation growth slows, NEP declines, with the maximum value dropping to 28.87 gCm−2. Winter, with harsher climatic conditions, results in the lowest NEP, with a maximum value of −4.02 gCm−2. Overall, average NEP is the highest in summer, lower in spring and autumn, and the lowest in winter.

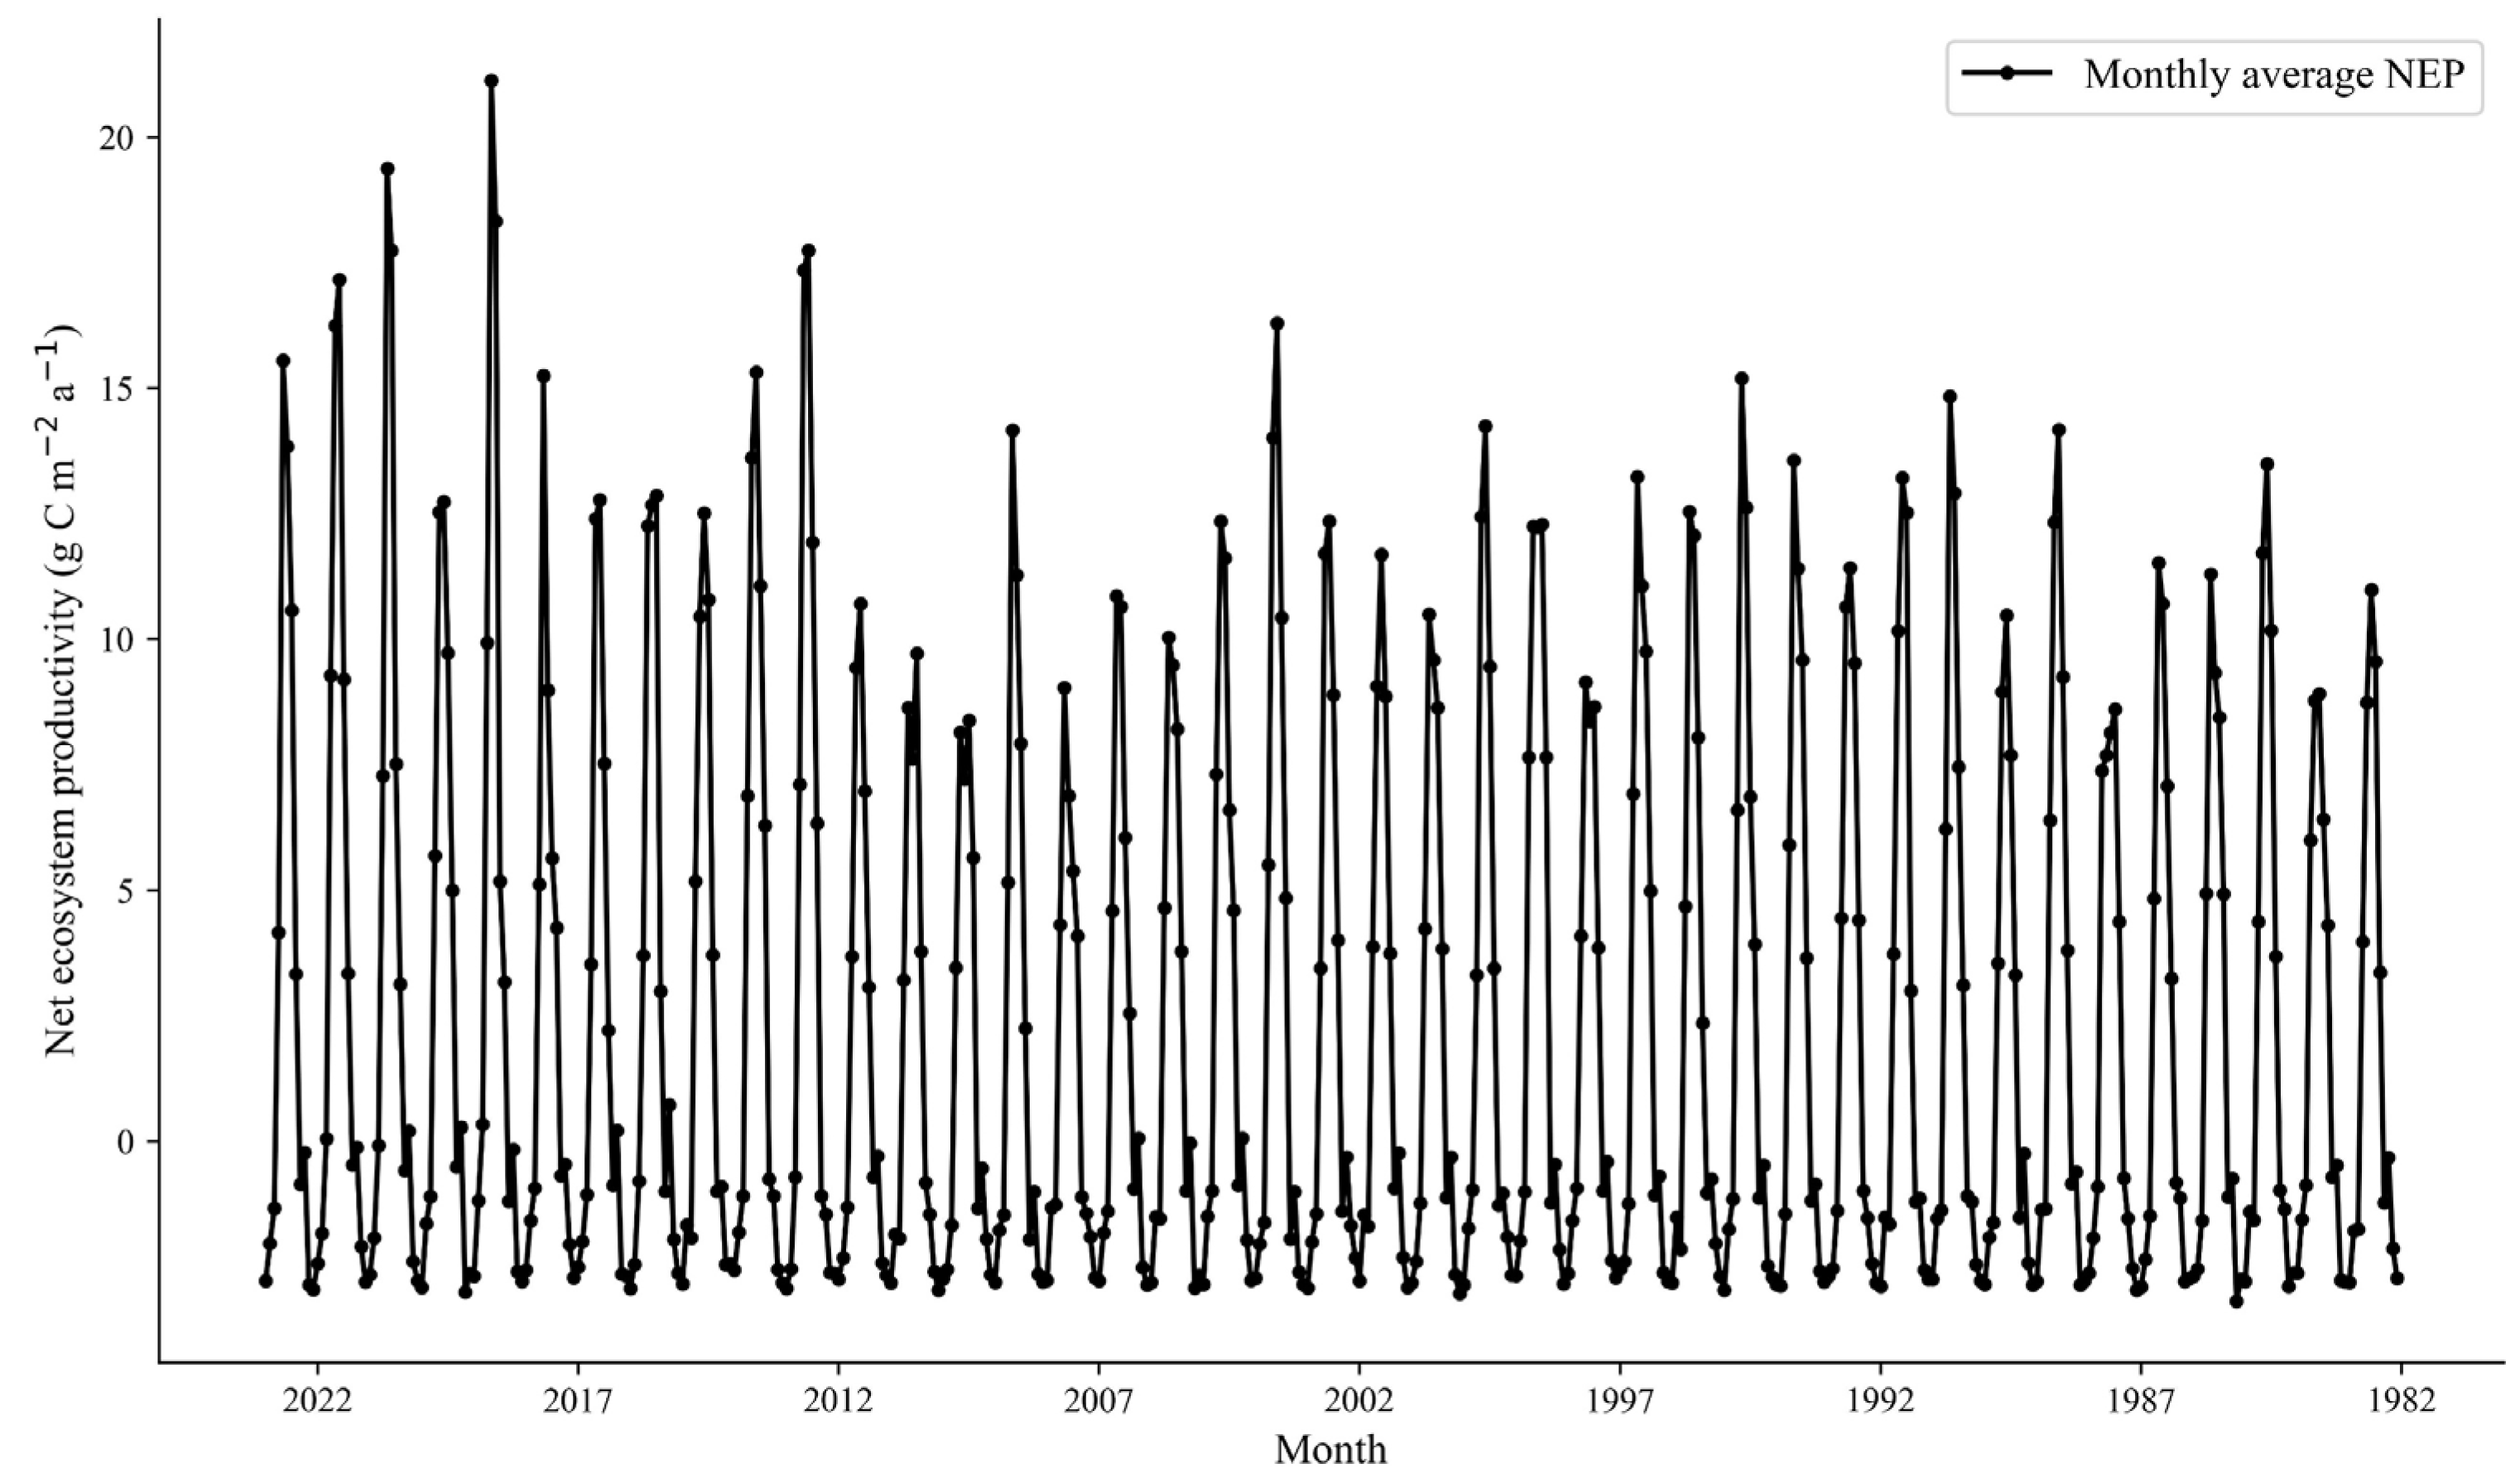
4.1.2. Spatial and Temporal Distribution of Monthly NEP

The distribution pattern of monthly NEP in the Inner Mongolian desert grassland ecosystems from 1982 to 2022 is shown in Figure 5. The intra-annual variation in NEP closely follows the vegetation growth cycle. The distribution pattern of monthly average NEP from April to October is consistent with the annual and seasonal averages for spring, summer, and fall. The characteristic values of monthly average NEP are presented in Table 4. From April to August, the mean NEP gradually increases, reaching a peak of 12.17 gCm−2 in August. Afterward, the mean NEP gradually decreases, falling below 0 gCm−2 from October to February, mirroring the winter NEP distribution pattern.
From Table 4, the area proportions of carbon sinks and carbon sources vary across the months. The average NEP increases from 3.93 gCm−2 in March to May, with the carbon sink area reaching 89.18% in May. From June to August, the proportion of carbon sinks remained stable, while the mean NEP steadily increased, peaking at 12.17 gCm−2. From September to November, both the mean NEP and the proportion of carbon sink areas decreased. From December to February, the mean NEP became negative, and the entire study area acted as a carbon source.
The interannual trends of monthly NEP changes in the Inner Mongolian desert grassland ecosystems from 1982 to 2022 are shown in Figure 6. The NEP trends in January and December show no significant variation. In contrast, the trends in February, September, and November exhibit a gradual shift towards significant increases or decreases. The trends in the remaining months generally follow the yearly NEP pattern, with spring, summer, and autumn showing an overall increasing trajectory, although the rate of increase varies slightly by month.
The largest NEP increase occurred in August, with 37.14% of the area showing significant growth. The carbon sink areas (NEP > 0) in April and October, though accounting for less than 10% of the area with the monthly average NEP, showed significant increases in 19.24% and 36.75% of their respective areas. March exhibited a similar trend. Overall, the significant NEP increase from March to October contributed more substantially to the annual NEP growth, while January, February, and November to December showed little significant change.

4.2. Drought Assessment and Its Cumulative Effects on Vegetation Productivity

4.2.1. Drought Assessment

Based on the SPEI index, drought indicators were selected to characterize the drought changes in the desert grassland ecosystems of Inner Mongolia, as shown in Figure 7. The results indicate that the frequency of mild drought was the highest across the entire region from 1982 to 2022, with a relatively uniform distribution. The spatial patterns of moderate and severe droughts, however, show lower frequencies in the central part of the region, with droughts being more frequent on the two sides. The frequency of extreme drought is clearly differentiated within the region, with a higher frequency in the west and a lower frequency in the east. However, the drought duration shows a different pattern. The duration of mild droughts reaches a maximum of 100 but is more evenly distributed across the region. In contrast, the duration of moderate and severe droughts is higher on both sides of the region, reaching 78 and 44, respectively. The frequency, duration, and severity of extreme droughts are consistent, with more severe conditions occurring predominantly in the western part of the region. In terms of drought severity, the region as a whole is more affected by mild droughts, while moderate and severe droughts exhibit distinct spatial distributions.

4.2.2. Cumulative Effects of Drought on Vegetation Productivity

As shown in Figure 8, from 1982 to 2022, there was a cumulative effect of drought on the desert grassland ecosystems of Inner Mongolia, with NEP showing a positive correlation with the cumulative SPEI from a spatial perspective. The cumulative effect was predominantly short-term (1–2 months), accounting for 54.5% of the area, with a faster response rate, mainly concentrated in the central and eastern parts of the region. In contrast, some areas in the western part exhibited longer cumulative effects, concentrated in the 6–12 month period. The correlation coefficients between cumulative months and NEP varied significantly across the region, with most areas showing weak correlation, suggesting that the cumulative response of NEP to drought is weaker in these regions and may be influenced by other factors, such as temperature or land use changes.

4.3. Drivers of NEP Spatial Differentiation in Inner Mongolian Desert Grassland Ecosystems

4.3.1. Construction of Impact Factors

The formation of carbon sinks and sources results from a combination of factors. To further investigate the driving forces behind vegetation NEP, this study employs a geodetector to quantitatively analyze the spatial differentiation of NEP in the desert grassland ecosystems of Inner Mongolia, focusing on factor detection, interaction detection, and other aspects. Taking into account the specific conditions of the study area, this paper thoroughly considers the attribute characteristics of multiple driving factors and their impact on NEP changes. According to the climate characteristics of the selected region and relevant literature, several driving factors such as precipitation, temperature, solar radiation, and DEM are selected (as shown in Table 5). These factors are discretized, and data from 1990, 2000, 2010, and 2020 are used as the basis for a comprehensive analysis of the driving mechanisms behind NEP.

4.3.2. Factors Detection

The results of the factor detection are shown in Figure 9. The influence of the seven driving factors on NEP is ranked as follows: annual average precipitation > annual average solar radiation > annual average temperature > annual average potential evapotranspiration > annual average soil moisture > land use type > elevation. This indicates that annual average precipitation has the strongest influence on the NEP of desert grassland ecosystems in Inner Mongolia, with an average value of 0.6147, making it the primary factor driving the NEP of vegetation in the study area. Average annual precipitation determines the soil moisture status. Excessively high precipitation can lead to the decay of the vegetation root system, while insufficient precipitation may cause drought-induced vegetation death, both of which limit vegetation growth and development. These changes, in turn, can cause fluctuations in vegetation NEP. The effect of annual average solar radiation on NEP ranked second, making it the second most important factor influencing the distribution of vegetation NEP. Increased solar radiation promotes photosynthesis, thereby enhancing vegetation NEP. However, the magnitude of change in solar radiation over the years was relatively small, resulting in a lesser impact on vegetation NEP compared to precipitation. Additionally, the effects of average annual temperature and potential evapotranspiration on vegetation NEP were 0.5173 and 0.4588, respectively. Rising temperatures contribute to increased photosynthesis and respiration efficiency, which in turn boosts vegetation carbon sequestration capacity. Some studies also suggest that higher temperatures extend the growing season, further enhancing NEP. Potential evapotranspiration also affects NEP because actual precipitation less than the explained potential evapotranspiration will cause water shortage in vegetation, thus reducing photosynthesis. The smallest impact on vegetation NEP came from elevation, which was influenced by the study area’s limited size, placing it as the least significant factor.

4.3.3. Interaction Detector

The results of the interaction probes are shown in Figure 10. Through the interaction analysis of pairs of driving factors, it is evident that the combined effect of two factors is generally greater than the effect of any single factor acting alone. The joint action of these factors provides a higher explanatory power for vegetation NEP. Among the factor interactions evaluated from 1990 to 2020, the interaction between mean annual precipitation and mean annual solar radiation, as well as mean annual temperature, had the highest explanatory power for NEP, with q-values exceeding 0.8. The interaction between mean annual precipitation and land use type, elevation, and potential evapotranspiration showed a decreasing trend. The explanatory power of NEP from the interaction between mean annual solar radiation and land use type, elevation, potential evapotranspiration, and soil moisture fluctuated within a certain range. Interactions between mean annual temperature and other factors exhibited an increasing and then decreasing trend. The interactions between potential evapotranspiration and land use type, as well as elevation, remained stable around 0.5, while the interactions between land use type and elevation were the weakest, with q-values ranging from 0.2 to 0.3.
Given the explanatory power of the drivers on NEP, the q value of the interaction of mean annual precipitation with other factors was larger, mainly because the interaction of climatic factors promotes the growth of vegetation and the accumulation of NEP, whereas the interaction of land use type with elevation was the smallest, probably because the influence of elevation and land use type on NEP was small in the factor detection, and also because it was related to the extent of the study area.

5. Discussion

5.1. Cross-Validation of Data on Net Primary Productivity NPP

In this study, the improved CASA model developed by Zhu et al. was used to estimate the vegetation NPP of the desert grassland ecosystems in Inner Mongolia [34]. However, the estimation of vegetation NEP still carries inherent uncertainty due to the complexity of the ecosystem’s carbon cycling process, which is influenced by a multitude of factors. There are two primary methods for validating the accuracy of regional vegetation NPP estimation results: the first is the direct measurement method, which assesses accuracy by comparing the estimated values with observed measurements; the second is cross-comparison, which involves comparing the estimated values with datasets with already verified accuracy. Considering the difficulty in obtaining measured vegetation NPP data for the desert grassland ecosystems in Inner Mongolia, this study uses the MOD17A3H vegetation net primary productivity (NPP) dataset as a reference. It selects the NPP data for 2000, 2010, and 2020 and applies the cross-comparison method to evaluate the accuracy of the NPP estimates generated by the CASA model.
The test results are shown in Figure 11. Overall, the NPP values estimated by the CASA model are slightly lower than the MODIS NPP values, and the two datasets are significantly correlated, with R2 values of 0.83, 0.85, and 0.85 for the selected years of 2000, 2010, and 2020, respectively. To further assess the uncertainty in the CASA model estimates, we calculated the Root Mean Square Error (RMSE) and Mean Absolute Error (MAE) between the model estimates and the MOD17A3H dataset, with RMSE values of 66.77, 100.42, and 112.20 for the years 2000, 2010, and 2020, respectively. These results indicate that the model provides reliable estimates of vegetation NPP. The selection of these specific years was based on the need to avoid potential validation bias caused by using adjacent years, which may not fully capture long-term trends. Therefore, we chose a 10-year interval to provide a more robust assessment. It is also worth noting that while the MOD17A3H dataset has been widely used and validated in various regions, regional differences may still exist, which we acknowledge as a potential limitation of this study.
Although the RMSE values are relatively large, this is largely due to the difference in the absolute values between the CASA model estimates and the MOD17A3H dataset. While both datasets exhibit similar data distribution patterns, as reflected in the high R2 values, the absolute values of NPP derived from the two sources differ significantly. This discrepancy leads to a higher RMSE value, but does not necessarily undermine the reliability of the model’s performance.

5.2. Analysis of NEP Trends and Driving Factors in Inner Mongolian Desert Grassland Ecosystems

The seasonal analysis of Net Ecosystem Productivity (NEP) in Inner Mongolia’s desert grassland ecosystem reveals significant fluctuations but an overall upward trend in carbon sink capacity, especially during the spring, summer, and fall seasons (as shown in Figure 12). The annual mean NEP shows a spatial alignment with the NEP patterns of summer and fall, reflecting the ecosystem’s carbon sink status. Intra-annual variations follow the plant growth cycle, with the spring, summer, and fall seasons being the primary drivers, showing a cyclic process of “start-development-end”. In summer, the peak in precipitation boosts vegetation growth, significantly enhancing carbon sequestration. Fall, with the combination of precipitation and temperature, promotes the accumulation of organic matter, further increasing carbon sink potential. In contrast, winter, due to low temperatures and other meteorological factors, leads to plant dormancy, and the ecosystem shifts to a carbon source, showing a marked decrease in photosynthesis and ecosystem productivity.
Seasonal NEP trends reveal notable differences in growth rates: the carbon sink increases by 0.2364 gCm⁻2 yr⁻1, with spring, summer, and fall showing growth rates of 0.0213 gCm⁻2 yr⁻1, 0.1804 gCm⁻2 yr⁻1, and 0.0223 gCm⁻2 yr⁻1, respectively. Summer is the most influential, contributing the most to the overall NEP increase. Winter, with the slowest growth rate of 0.0066 gCm⁻2 yr⁻1, reflects the dormant period where carbon sequestration is significantly reduced.
Driver analysis using geographical detectors revealed that average annual precipitation had the greatest impact on NEP, consistent with previous studies [46,47], and precipitation in the Inner Mongolian desert grassland is concentrated in July and August, accounting for 76% to 80% of the annual total. With summer being the critical season for vegetation growth, higher summer precipitation promotes vegetation growth, enhancing carbon sequestration. The second and third most influential factors are average annual solar radiation and temperature. Increased solar radiation enhances photosynthesis and organic compound production, while higher temperatures accelerate soil moisture evaporation and increase the rate of photosynthetic utilization, promoting NEP accumulation. Overall, precipitation and solar radiation foster vegetation growth during spring and summer, while precipitation and temperature combinations extend organic matter accumulation during the fall.
These seasonal dynamics not only impact carbon sequestration but also have significant implications for ecosystem services such as soil protection and biodiversity. In summer, increased precipitation boosts vegetation growth, supporting biodiversity and providing critical habitats for various species. Plant root systems also contribute to soil conservation by reducing erosion and improving water retention. In fall, the accumulation of organic matter enhances soil fertility, supporting long-term vegetation growth and carbon storage, thus mitigating climate change. In contrast, winter’s decrease in NEP exposes soil to increased erosion, potentially affecting soil health and carbon content.

5.3. Effects of Drought on Carbon Sinks in Desert Grassland Ecosystems of Inner Mongolia

The effects of drought on carbon sinks in desert grassland ecosystems are complex and exhibit time lags. Drought-induced water stress can impair vegetation growth, alter its physiological properties, and eventually lead to mortality and ecosystem degradation [48]. Even after drought ends, vegetation recovery and carbon fixation may take time. Under prolonged drought conditions, the carbon sequestration capacity of vegetation remains persistently lower than normal, leading to cumulative drought effects. These effects result from extended water shortages that inhibit vegetation productivity and can spread to surrounding areas, particularly in desert grassland ecosystems where vegetation is highly sensitive to water stress [49,50].
Liang et al. used GPP and SPEI to assess drought’s cumulative effects on vegetation productivity, finding that prolonged drought significantly reduces vegetation growth, particularly when multiple drought events compound over time [51]. Similar studies in semi-arid and arid regions highlight that repeated droughts reduce vegetation productivity and carbon sequestration capacity [52]. Our findings align with these observations: the cumulative impact of drought on vegetation NEP from 1982 to 2022 was predominantly short-term (1–2 months), indicating that while the ecosystem can recover quickly from drought impacts, frequent and prolonged droughts hinder long-term recovery. Some studies have noted that increasing drought intensity and duration in recent decades have led to more persistent declines in vegetation productivity in desert areas [53,54].
We chose both short-term (1–2 months) and long-term (6–12 months) drought periods to capture both immediate and cumulative drought effects on vegetation productivity and carbon sequestration. Short-term droughts reflect quick responses in NEP to water stress, while long-term droughts highlight sustained effects on ecosystem functions. This distinction enhances understanding of how drought duration impacts ecosystem carbon dynamics. Our drought frequency and duration analysis supports this, showing mild droughts occurring most frequently, while moderate and severe droughts were more common in the region’s eastern and western parts.
Spatial patterns of drought-induced NEP changes further support the idea that drought impacts vary across regions. The central area, more prone to short-term droughts, showed faster NEP recovery, while the western area, experiencing prolonged droughts, exhibited longer-lasting impacts on carbon sequestration. This regional variation is consistent with other studies on desert ecosystems, which have found that areas exposed to prolonged droughts are less likely to recover quickly [49,55]. These results highlight the importance of considering both drought frequency and duration in understanding long-term carbon sequestration effects.
Lastly, analysis of average monthly NEP values revealed impulsive changes (Figure 13). This aligns with cumulative drought effects, where carbon sequestration capacity initially increases in response to short-term droughts but struggles to accumulate over time due to frequent droughts. These findings suggest that while ecosystems recover quickly from short-term droughts, repeated droughts limit the ability to build long-term carbon stocks, supporting previous studies on desertification and ecosystem resilience [56].

5.4. Uncertainties and Limitations

During the long-term estimation of NEP, changes in CO2 concentration were not considered. The increase in CO2 levels could affect NPP estimates derived from the CASA model and soil heterotrophic respiration, thus influencing the accuracy of carbon sequestration capacity estimates and introducing potential uncertainty. Future research could improve the accuracy of net productivity and soil heterotrophic respiration estimates in conjunction with changes in carbon dioxide concentration to reduce this uncertainty.
Secondly, in terms of drought evaluation, the study employed traditional drought assessment methods. While the analysis based on the SPEI provides insights into the spatial and temporal trends of drought, using a three-dimensional clustering approach to identify drought characteristics and reveal the dynamic spatiotemporal evolution of droughts could yield more accurate results. Therefore, future research could consider employing more advanced drought recognition methods to enhance the precision and depth of drought analysis.
Lastly, when investigating the driving factors of NEP, this study focused primarily on climate factors and did not incorporate human activities (e.g., land use) into the analysis. Human activities, particularly land use changes, could significantly affect NEP. Therefore, future studies should consider these anthropogenic factors and assess their combined impact on NEP.

6. Conclusions

This study analyzes the trends and driving mechanisms of net ecosystem productivity (NEP) in the desert grasslands of Inner Mongolia from 1982 to 2022, focusing on the impact of drought on ecosystem carbon sink functions. The main findings are as follows:
(1)
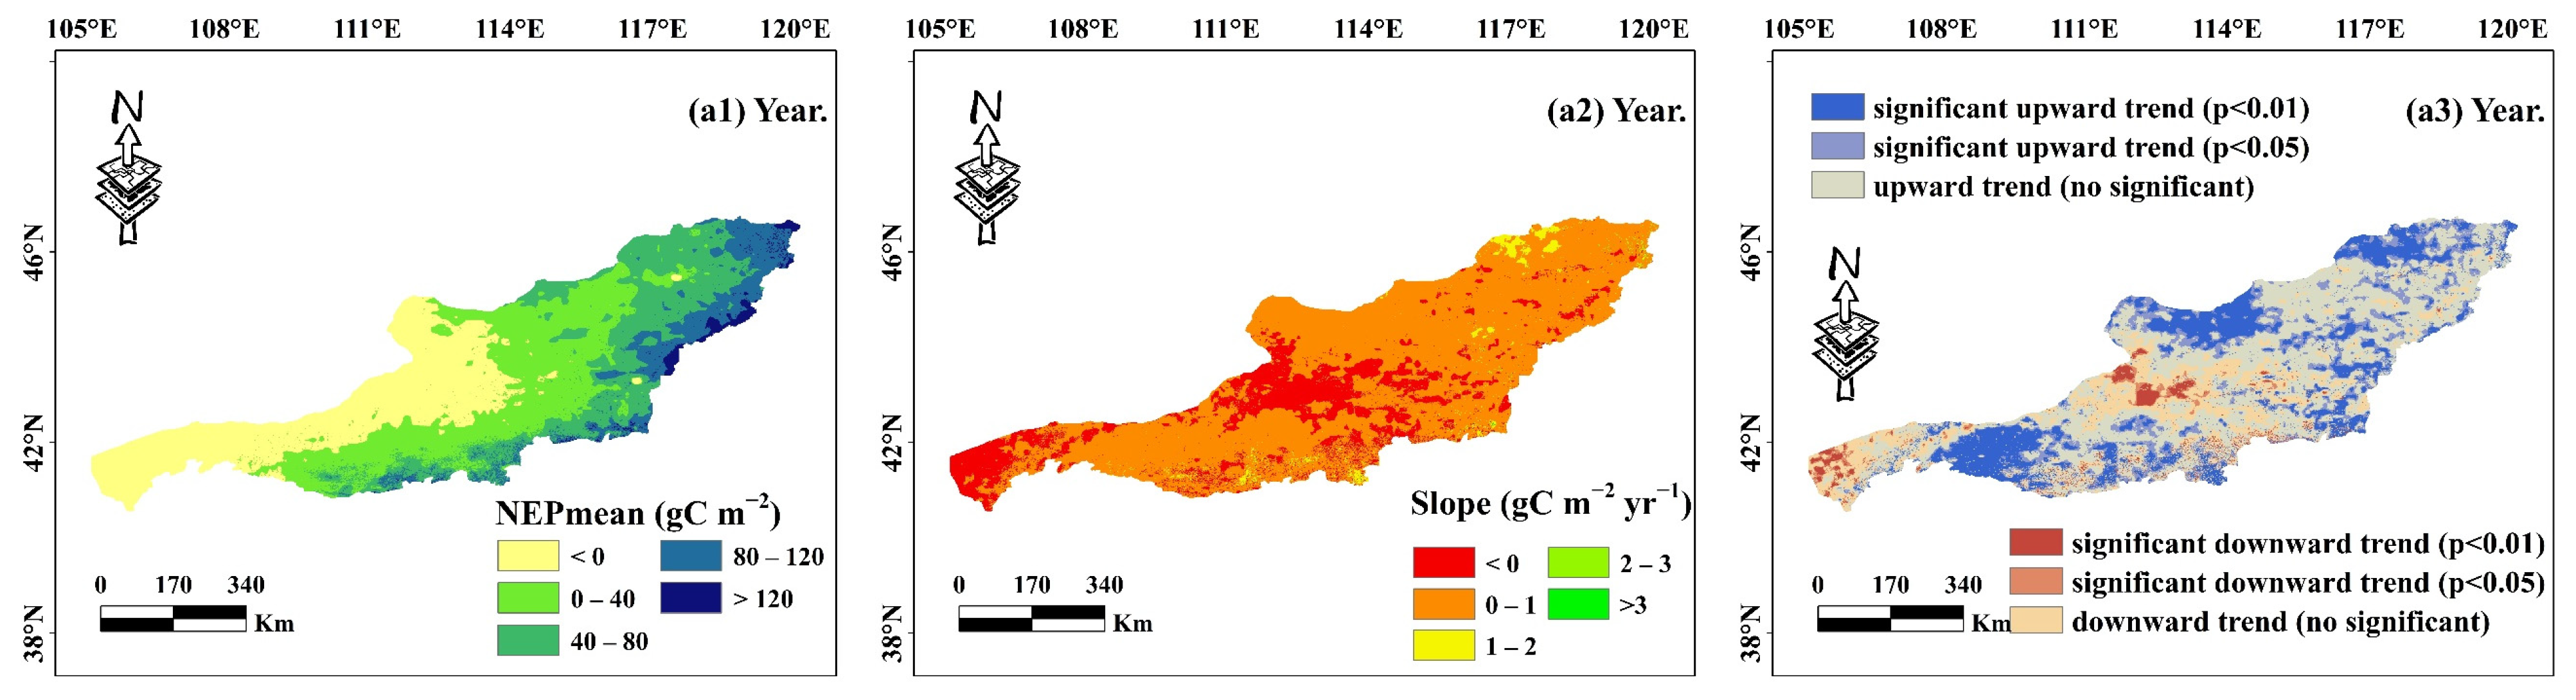
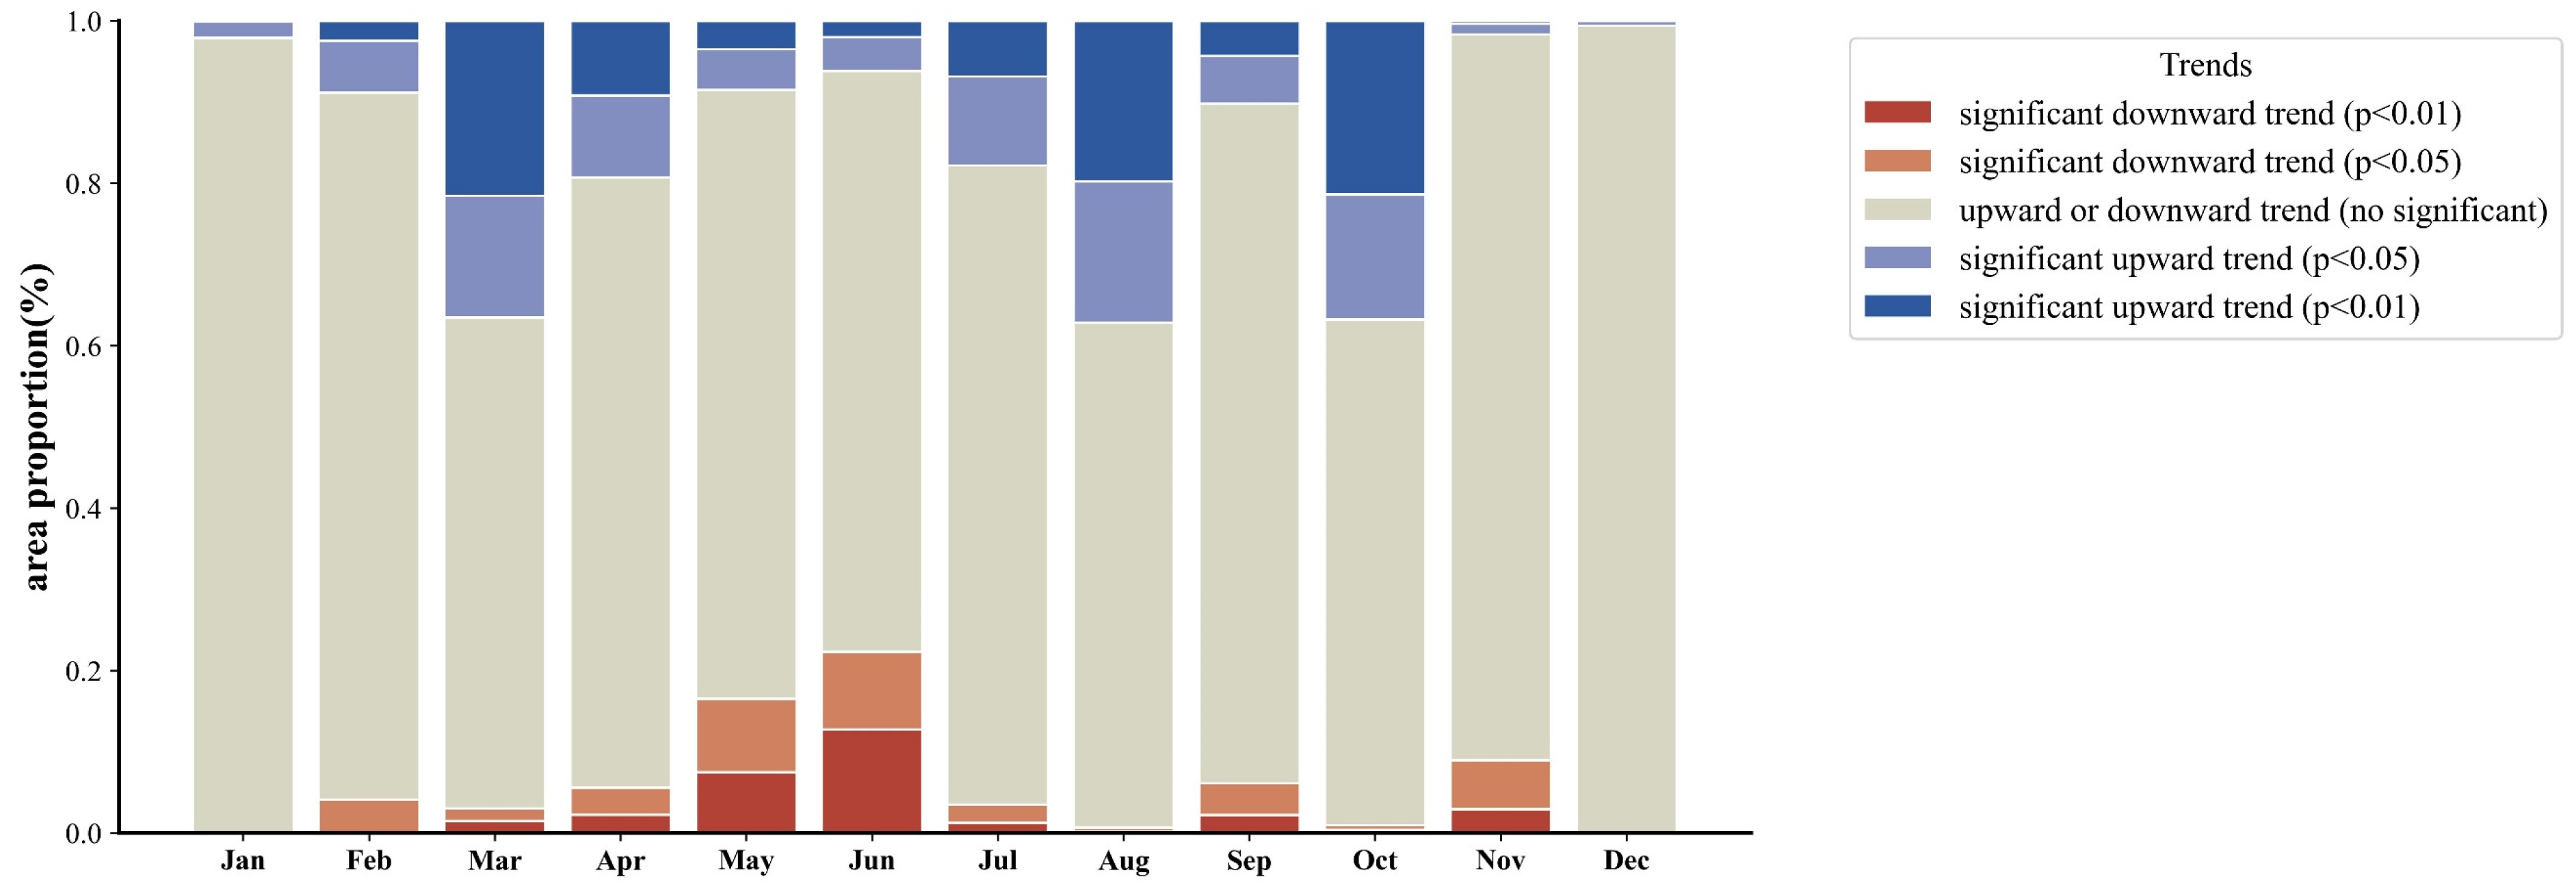
The NEP distribution in the desert grassland ecosystem exhibited a gradual increase from southwest to northeast, with a multi-year average of 29.41 gC m−2. The carbon sink area (NEP > 0) covered 67.99% of the total area, while the carbon source area (NEP < 0) accounted for 32.01%. From 1982, the overall NEP showed a significant upward trend, with 35.40% of the area experiencing increased NEP, 59.59% showing no significant change, and only 5.01% exhibiting a significant decrease.
(2)
The Standardized Precipitation Evapotranspiration Index (SPEI) was employed to assess drought patterns in the region. The spatial distribution of moderate and severe droughts was similar in frequency, whereas exceptional droughts showed distinct regional variations. The duration of mild droughts was more evenly distributed compared to moderate and severe droughts. Overall, mild droughts had the most widespread impact.
(3)
Over the study period, drought had a cumulative effect on the desert grassland ecosystem, primarily in the short term (1–2 months), affecting 54.5% of the area. This indicates a swift ecosystem response, particularly in the central and eastern parts of the inland river region.
(4)
Geoprobes identified the key drivers of NEP, with mean annual precipitation exerting the strongest influence, followed by mean annual solar radiation, temperature, potential evapotranspiration, soil moisture, land use type, and elevation. Notably, combined effects of multiple factors generally surpassed the influence of individual factors, with two-factor interactions explaining a higher proportion of NEP variability.

Author Contributions

Conceptualization, Y.W. and K.F.; methodology, K.F. and H.Y.; data curation, H.Y.; writing—original draft preparation, H.Y.; writing—review and editing, K.F. and Y.W.; visualization, H.Y.; supervision, K.F. and F.W.; project administration, Y.L. and Z.Z.; funding acquisition, W.Z. and Z.X. All authors have read and agreed to the published version of the manuscript.

Funding

This research was supported by Yinshanbeilu Grassland Eco-Hydrology National Observation and Research Station, China Institute of Water Resources and Hydropower Research (grant number YSS202316), Natural Science Foundation of Inner Mongolia Autonomous Region of china (2024QN04012), National Natural Science Fund of China (grant number 42301024 and 52179015), Science and Technology Projects in Henan Province (grant number 242102321114).

Institutional Review Board Statement

Not applicable.

Data Availability Statement

The data presented in this study are available on request from the corresponding author because the data are part of an ongoing research project and contains sensitive or proprietary information that is not publicly accessible at this stage.

Acknowledgments

The authors would like to thank North China University of Water Resources and Electric Power for providing laboratory space for the research. Additionally, the authors would like to express their gratitude to the journal editors for their patience in communication and valuable guidance during the review process.

Conflicts of Interest

Author Zhichao Xu was employed by the company China South-to-North Water Diversion Corporation Limited. The remaining authors declare that the research was conducted in the absence of any commercial or financial relationships that could be construed as a potential conflict of interest.

References

  1. Ballantyne, A.P.; Alden, C.B.; Miller, J.B.; Tans, P.P.; White, J.W.C. Increase in observed net carbon dioxide uptake by land and oceans during the past 50 years. Nature 2012, 488, 70–72. [Google Scholar] [CrossRef]
  2. Regnier, P.; Resplandy, L.; Najjar, R.G.; Ciais, P. The land-to-ocean loops of the global carbon cycle. Nature 2022, 603, 401–410. [Google Scholar] [CrossRef] [PubMed]
  3. Cao, S.; He, Y.; Zhang, L.; Sun, Q.; Zhang, Y.; Li, H.; Wei, X.; Liu, Y. Spatiotemporal dynamics of vegetation net ecosystem productivity and its response to drought in Northwest China. GIScience Remote Sens. 2023, 60, 2194597. [Google Scholar] [CrossRef]
  4. Zhang, M.; Yuan, N.; Lin, H.; Liu, Y.; Zhang, H. Quantitative estimation of the factors impacting spatiotemporal variation in NPP in the Dongting Lake wetlands using Landsat time series data for the last two decades. Ecol. Indic. 2022, 135, 108544. [Google Scholar] [CrossRef]
  5. Wang, C.; Zhao, W.; Zhang, Y. The Change in Net Ecosystem Productivity and its Driving Mechanism in a Mountain Ecosystem of Arid Regions, Northwest China. Remote Sens. 2022, 14, 4046. [Google Scholar] [CrossRef]
  6. Fernández-Martínez, M.; Vicca, S.; Janssens, I.A.; Sardans, J.; Luyssaert, S.; Campioli, M.; Chapin Iii, F.S.; Ciais, P.; Malhi, Y.; Obersteiner, M.; et al. Nutrient availability as the key regulator of global forest carbon balance. Nat. Clim. Change 2014, 4, 471–476. [Google Scholar] [CrossRef]
  7. Dong, S.; Ren, W.; Dong, X.; Lei, F.; Wang, X.-C.; Xie, L.; Zhou, X. Decoupling the Impacts of Climate Change and Human Activities on Terrestrial Vegetation Carbon Sink. Remote Sens. 2024, 16, 4417. [Google Scholar] [CrossRef]
  8. Piao, S.; Zhang, X.; Chen, A.; Liu, Q.; Lian, X.; Wang, X.; Peng, S.; Wu, X. The impacts of climate extremes on the terrestrial carbon cycle: A review. Sci. China Earth Sci. 2019, 62, 1551–1563. [Google Scholar] [CrossRef]
  9. Wang, R.; Gamon, J.A.; Emmerton, C.A.; Springer, K.R.; Yu, R.; Hmimina, G. Detecting intra- and inter-annual variability in gross primary productivity of a North American grassland using MODIS MAIAC data. Agric. For. Meteorol. 2020, 281, 107859. [Google Scholar] [CrossRef]
  10. Faiz, M.A.; Zhang, Y.; Zhang, X.; Ma, N.; Aryal, S.K.; Ha, T.T.V.; Baig, F.; Naz, F. A composite drought index developed for detecting large-scale drought characteristics. J. Hydrol. 2022, 605, 127308. [Google Scholar] [CrossRef]
  11. Ciais, P.; Reichstein, M.; Viovy, N.; Granier, A.; Ogée, J.; Allard, V.; Aubinet, M.; Buchmann, N.; Bernhofer, C.; Carrara, A. Europe-wide reduction in primary productivity caused by the heat and drought in 2003. Nature 2005, 437, 529–533. [Google Scholar] [CrossRef] [PubMed]
  12. Zscheischler, J.; Mahecha, M.D.; Von Buttlar, J.; Harmeling, S.; Jung, M.; Rammig, A.; Randerson, J.T.; Schölkopf, B.; Seneviratne, S.I.; Tomelleri, E. A few extreme events dominate global interannual variability in gross primary production. Environ. Res. Lett. 2014, 9, 035001. [Google Scholar] [CrossRef]
  13. Zhao, M.; Running, S.W. Drought-Induced Reduction in Global Terrestrial Net Primary Production from 2000 Through 2009. Science 2010, 329, 940–943. [Google Scholar] [CrossRef] [PubMed]
  14. Huang, X.; Zhen, Z.; Zhao, W.; Wang, X. Forest carbon sink in North China increased in recent two decades, but decreased in extreme drought years. GIScience Remote Sens. 2024, 61, 2383040. [Google Scholar] [CrossRef]
  15. Deng, Y.; Wang, X.; Wang, K.; Ciais, P.; Tang, S.; Jin, L.; Li, L.; Piao, S. Responses of vegetation greenness and carbon cycle to extreme droughts in China. Agric. For. Meteorol. 2021, 298, 108307. [Google Scholar] [CrossRef]
  16. Lindroth, A.; Holst, J.; Linderson, M.-L.; Aurela, M.; Biermann, T.; Heliasz, M.; Chi, J.; Ibrom, A.; Kolari, P.; Klemedtsson, L. Effects of drought and meteorological forcing on carbon and water fluxes in Nordic forests during the dry summer of 2018. Philos. Trans. R. Soc. B 2020, 375, 20190516. [Google Scholar] [CrossRef]
  17. McKee, T.B.; Doesken, N.J.; Kleist, J. The relationship of drought frequency and duration to time scales. In Proceedings of the 8th Conference on Applied Climatology, Anaheim, CA, USA, 17–22 January 1993; pp. 179–183. [Google Scholar]
  18. Palmer, W.C. Meteorological Drought; US Department of Commerce, Weather Bureau: Silver Spring, MD, USA, 1965; Volume 30. [Google Scholar]
  19. Shukla, S.; Wood, A.W. Use of a standardized runoff index for characterizing hydrologic drought. Geophys. Res. Lett. 2008, 35, L02405. [Google Scholar] [CrossRef]
  20. Hao, Z.; AghaKouchak, A. Multivariate Standardized Drought Index: A parametric multi-index model. Adv. Water Resour. 2013, 57, 12–18. [Google Scholar] [CrossRef]
  21. Vicente-Serrano, S.M.; Beguería, S.; López-Moreno, J.I. A Multiscalar Drought Index Sensitive to Global Warming: The Standardized Precipitation Evapotranspiration Index. J. Clim. 2010, 23, 1696–1718. [Google Scholar] [CrossRef]
  22. Ali, Z.; Hussain, I.; Faisal, M.; Almanjahie, I.M.; Ahmad, I.; Khan, D.M.; Grzegorczyk, M.; Qamar, S. A Probabilistic Weighted Joint Aggregative Drought Index (PWJADI) criterion for drought monitoring systems. Tellus A Dyn. Meteorol. Oceanogr. 2019, 71, 1588584. [Google Scholar] [CrossRef]
  23. Afshar, M.H.; Bulut, B.; Duzenli, E.; Amjad, M.; Yilmaz, M.T. Global spatiotemporal consistency between meteorological and soil moisture drought indices. Agric. For. Meteorol. 2022, 316, 108848. [Google Scholar] [CrossRef]
  24. Zhang, B.; He, C.; Burnham, M.; Zhang, L. Evaluating the coupling effects of climate aridity and vegetation restoration on soil erosion over the Loess Plateau in China. Sci. Total Environ. 2016, 539, 436–449. [Google Scholar] [CrossRef] [PubMed]
  25. Wang, S.; Li, R.; Wu, Y.; Zhao, S. Effects of multi-temporal scale drought on vegetation dynamics in Inner Mongolia from 1982 to 2015, China. Ecol. Indic. 2022, 136, 108666. [Google Scholar] [CrossRef]
  26. Cai, Y.; Akiyama, H. Nitrogen loss factors of nitrogen trace gas emissions and leaching from excreta patches in grassland ecosystems: A summary of available data. Sci. Total Environ. 2016, 572, 185–195. [Google Scholar] [CrossRef]
  27. Gang, C.; Li, J.; Ju, W.; Chen, J. The comparisons of carbon sink/source of Chinese grassland ecosystem using different approaches. In Proceedings of the 2011 International Conference on Remote Sensing, Environment and Transportation Engineering, Nanjing, China, 24–26 June 2011; pp. 841–844. [Google Scholar] [CrossRef]
  28. Wang, Q.; Liu, X.; Wang, Z.; Zhao, L.; Zhang, Q.-p.J.G.E. Conservation. Time scale selection and periodicity analysis of grassland drought monitoring index in Inner Mongolia. Glob. Ecol. Conserv. 2022, 36, e02138. [Google Scholar] [CrossRef]
  29. Wang, Q.; Yang, Y.; Liu, Y.; Tong, L.; Zhang, Q.-P.; Li, J. Assessing the Impacts of Drought on Grassland Net Primary Production at the Global Scale. Sci. Rep. 2019, 9, 14041. [Google Scholar] [CrossRef]
  30. Sun, J.; Du, W. Effects of precipitation and temperature on net primary productivity and precipitation use efficiency across China’s grasslands. GIScience Remote Sens. 2017, 54, 881–897. [Google Scholar] [CrossRef]
  31. Sun, C.-m.; Zhong, X.-c.; Chen, C.; Gu, T.; Chen, W. Evaluating the grassland net primary productivity of southern China from 2000 to 2011 using a new climate productivity model. J. Integr. Agric. 2016, 15, 1638–1644. [Google Scholar] [CrossRef]
  32. Chen, S.; Huang, Y.; Zou, J.; Shi, Y.; Lu, Y.; Zhang, W.; Hu, Z. Interannual variability in soil respiration from terrestrial ecosystems in China and its response to climate change. Sci. China Earth Sci. 2012, 55, 2091–2098. [Google Scholar] [CrossRef]
  33. Potter, C.S.; Randerson, J.T.; Field, C.B.; Matson, P.A.; Vitousek, P.M.; Mooney, H.A.; Klooster, S.A. Terrestrial ecosystem production: A process model based on global satellite and surface data. Glob. Biogeochem. Cycles 1993, 7, 811–841. [Google Scholar] [CrossRef]
  34. Zhu, W.-Q.; Pan, Y.-Z.; Zhang, J.-S. Estimation of net primary productivity of Chinese terrestrial vegetation based on remote sensing. Chin. J. Plant Ecol. 2007, 31, 413. [Google Scholar] [CrossRef]
  35. Pei, Z.-Y.; Ouyang, H.; Zhou, C.-P.; Xu, X.-L. Carbon Balance in an Alpine Steppe in the Qinghai-Tibet Plateau. J. Integr. Plant Biol. 2009, 51, 521–526. [Google Scholar] [CrossRef] [PubMed]
  36. Liu, Q.; Yang, S.; Li, S.; Zhang, H.; Zhang, J.; Fan, H. The optimal applications of scPDSI and SPEI in characterizing meteorological drought, agricultural drought and terrestrial water availability on a global scale. Sci. Total Environ. 2024, 952, 175933. [Google Scholar] [CrossRef]
  37. Potopová, V.; Štěpánek, P.; Možný, M.; Türkott, L.; Soukup, J. Performance of the standardised precipitation evapotranspiration index at various lags for agricultural drought risk assessment in the Czech Republic. Agric. For. Meteorol. 2015, 202, 26–38. [Google Scholar] [CrossRef]
  38. Liu, X.; Yu, S.; Yang, Z.; Dong, J.; Peng, J. The first global multi-timescale daily SPEI dataset from 1982 to 2021. Sci. Data 2024, 11, 123. [Google Scholar] [CrossRef]
  39. Peng, J.; Wu, C.; Zhang, X.; Wang, X.; Gonsamo, A. Satellite detection of cumulative and lagged effects of drought on autumn leaf senescence over the Northern Hemisphere. Glob. Chang. Biol. 2019, 25, 2174–2188. [Google Scholar] [CrossRef]
  40. Gupta, N.; Mahato, P.K.; Patel, J.; Omar, P.J.; Tripathi, R.P. Chapter 30—Understanding trend and its variability of rainfall and temperature over Patna (Bihar). Curr. Dir. Water Scarcity Res. 2022, 7, 533–543. [Google Scholar] [CrossRef]
  41. Sen, P.K. Estimates of the regression coefficient based on Kendall’s tau. J. Am. Stat. Assoc. 1968, 63, 1379–1389. [Google Scholar] [CrossRef]
  42. Yin, Y.; Xu, C.-Y.; Chen, H.; Li, L.; Xu, H.; Li, H.; Jain, S.K. Trend and concentration characteristics of precipitation and related climatic teleconnections from 1982 to 2010 in the Beas River basin, India. Glob. Planet. Chang. 2016, 145, 116–129. [Google Scholar] [CrossRef]
  43. Song, Y.; Wang, J.; Ge, Y.; Xu, C. An optimal parameters-based geographical detector model enhances geographic characteristics of explanatory variables for spatial heterogeneity analysis: Cases with different types of spatial data. GIScience Remote Sens. 2020, 57, 593–610. [Google Scholar] [CrossRef]
  44. Luo, L.; Li, Y.; Ma, W.; Rong, J.; Wei, J.; Cui, Y.; Qu, T. Temporal–Spatial Dynamics and Collaborative Effects of Cropland Resilience in China. Land 2025, 14, 108. [Google Scholar] [CrossRef]
  45. Liu, C.; Li, W.; Wang, W.; Zhou, H.; Liang, T.; Hou, F.; Xu, J.; Xue, P. Quantitative spatial analysis of vegetation dynamics and potential driving factors in a typical alpine region on the northeastern Tibetan Plateau using the Google Earth Engine. CATENA 2021, 206, 105500. [Google Scholar] [CrossRef]
  46. Dai, E.F.; Huang, Y.; Wu, Z.; Zhao, D.S. Analysis of spatio-temporal features of a carbon source/sink and its relationship to climatic factors in the Inner Mongolia grassland ecosystem. J. Geogr. Sci. 2016, 26, 297–312. [Google Scholar] [CrossRef]
  47. Zhang, R.; Zhao, X.Y.; Zuo, X.A.; Qu, H.; Degen, A.A.; Luo, Y.Y.; Ma, X.J.; Chen, M.; Liu, L.X.; Chen, J.L. Impacts of Precipitation on Ecosystem Carbon Fluxes in Desert-Grasslands in Inner Mongolia, China. J. Geophys. Res.-Atmos. 2019, 124, 1266–1276. [Google Scholar] [CrossRef]
  48. Zarei, A.R.; Shabani, A.; Moghimi, M.M. Accuracy Assessment of the SPEI, RDI and SPI Drought Indices in Regions of Iran with Different Climate Conditions. Pure Appl. Geophys. 2021, 178, 1387–1403. [Google Scholar] [CrossRef]
  49. Schwalm, C.R.; Anderegg, W.R.L.; Michalak, A.M.; Fisher, J.B.; Biondi, F.; Koch, G.; Litvak, M.; Ogle, K.; Shaw, J.D.; Wolf, A.; et al. Global patterns of drought recovery. Nature 2017, 548, 202–205. [Google Scholar] [CrossRef]
  50. Jiao, T.; Williams, C.A.; De Kauwe, M.G.; Schwalm, C.R.; Medlyn, B.E. Patterns of post-drought recovery are strongly influenced by drought duration, frequency, post-drought wetness, and bioclimatic setting. Glob. Chang. Biol. 2021, 27, 4630–4643. [Google Scholar] [CrossRef]
  51. Zheng, L.; Lu, J.; Chen, X. Drought offsets the vegetation greenness-induced gross primary productivity from 1982 to 2018 in China. J. Hydrol. 2024, 632, 130881. [Google Scholar] [CrossRef]
  52. Sun, J.; Zhang, Q.; Xu, Y.J.; Liu, X.; Chen, L.; Zhang, G.; Wu, Y. Will drought evolution accelerate under future climate? J. Hydrol. 2025, 650, 132552. [Google Scholar] [CrossRef]
  53. Smith, T.; Traxl, D.; Boers, N. Empirical evidence for recent global shifts in vegetation resilience. Nat. Clim. Chang. 2022, 12, 477–484. [Google Scholar] [CrossRef]
  54. Lu, M.; Sun, H.; Yang, Y.; Xue, J.; Ling, H.; Zhang, H.; Zhang, W. Assessing recovery time of ecosystems in China: Insights into flash drought impacts on gross primary productivity. Hydrol. Earth Syst. Sci. 2025, 29, 613–625. [Google Scholar] [CrossRef]
  55. Zhang, Y.; Liu, X.; Jiao, W.; Wu, X.; Zeng, X.; Zhao, L.; Wang, L.; Guo, J.; Xing, X.; Hong, Y. Spatial Heterogeneity of Vegetation Resilience Changes to Different Drought Types. Earth’s Future 2023, 11, e2022EF003108. [Google Scholar] [CrossRef]
  56. Wu, T.; Xu, L.; Chen, N. Spatial pattern and attribution of ecosystem drought recovery in China. J. Hydrol. 2024, 638, 131578. [Google Scholar] [CrossRef]
Figure 1. Location map of the desert grasslands at the northern foot of the Yinshan Mountains in Inner Mongolia.
Agriculture 15 00613 g001
Figure 2. Patterns and trends of annual mean NEP distribution in desert grassland ecosystems in Inner Mongolia, 1982–2022. (a1) represents the multi-year average of NEP; (a2) represents the Theil–Sen trend chart of NEP, and (a3) represents the Theil–Sen trend results through the Mann-Kendall test.
Agriculture 15 00613 g002
Figure 3. Seasonal NEP distribution patterns and trends in Inner Mongolian desert grassland ecosystems, 1982–2022. (a1d1) represent the average values of NEP in each season; (a2d2) represent the Theil-Sen trend diagram of NEP in each season; (a3d3) represent the Theil-Sen trend results of each season through the Mann-Kendall test.
Agriculture 15 00613 g003
Figure 4. Seasonal trends in area share graphs.
Agriculture 15 00613 g004
Figure 5. Patterns of monthly mean NEP distribution in Inner Mongolian desert grassland ecosystems, 1982–2022. (al) represent different months in order.
Agriculture 15 00613 g005
Figure 6. Monthly trends in area share graphs.
Agriculture 15 00613 g006
Figure 7. Drought characteristics of desert grassland ecosystems in Inner Mongolia, 1982–2022. Different rows represent different drought levels, and different columns represent different drought characteristics.
Agriculture 15 00613 g007
Figure 8. Spatial distribution of cumulative effects of NEP on desert grassland ecosystems in Inner Mongolia, 1982–2022. (a) Cumulative time distribution, (b) Correlation coefficient distribution, (c) Area proportion of each cumulative month.
Agriculture 15 00613 g008
Figure 9. Factor detection results.
Agriculture 15 00613 g009
Figure 10. Explanatory power of the interaction detection of two-by-two driving factors. (ad) represent the explanatory power of two-by-two driving factors of NEP in 1990, 2000, 2010, and 2020, respectively.
Agriculture 15 00613 g010
Figure 11. Accuracy verification of CASA simulated NPP and MODIS NPP. (ac) represent 2000, 2010, and 2020, respectively.
Agriculture 15 00613 g011
Figure 12. Annual and seasonal average NEP values and their changing trends of the desert steppe ecosystem in Inner Mongolia from 1982 to 2022.
Agriculture 15 00613 g012
Figure 13. Mean monthly NEP values and their trends in Inner Mongolia desert grassland ecosystems, 1982–2022.
Agriculture 15 00613 g013
Table 1. Data and sources used in this study.
DataAcquired TimeResolutionData Source
CLCD1985–20230.00027° × 0.00027°Annual China Land Cover Dataset (https://zenodo.org) (accessed on 7 August 2024)
DEM/0.009° × 0.009°National Cryosphere Desert Data
Center (https://data.tpdc.ac.cn) (accessed on 6 June 2024)
NDVI1981–20220.0833° × 0.0833°EARTHDATA
(https://daac.ornl.gov) (accessed on 12 August 2024)
Precipitation and
Temperature
1901–20220.009° × 0.009°National Cryosphere Desert Data
Center (https://data.tpdc.ac.cn) (accessed on 10 August 2024)
Solar Radiation1950–20230.1° × 0.1°(https://cds.climate.copernicus.eu) (accessed on 22 August 2024)
NPP2000–20220.0045° × 0.0045°(https://lpdaac.usgs.gov/products/mod17a3hgfv061/) (accessed on 8 April 2024)
Table 2. SPEI classification [37,38].
Drought GradeDrought TypeSPEI Value
1NormalSPEI > −0.5
2Mild drought−1.0 < SPEI ≤ −0.5
3Moderate drought−1.5 < SPEI ≤ −1.0
4Severe drought−2.0 < SPEI ≤ −1.5
5Extreme droughtSPEI ≤ −2.0
Table 3. Relationship between drivers [45].
InteractionBase of Assessment
Weaken, nonlinearq(X1∩X2) < Min[q(X1),q(X2)]
Weaken, univariateMin[q(X1),q(X1)] < q(X1∩X2) < Max[q(X1),q(X2)]
Enhance, bivariateq(X1∩X2) > Max[q(X1),q(X2)]
Independentq(X1∩X2) = q(X1) + q(X2)
Enhance, nonlinearq(X1∩X2) > q(X1) + q(X2)
Table 4. Monthly average NEP eigenvalue.
MonthMIN (gCm−2)MEAN (gCm−2)MAX (gCm−2)Percentage of Carbon Sink Areas (NEP > 0)
January−3.10−2.751.850
February−3.22−2.450.130
March−3.74−0.594.0016.30%
April−4.69−1.023.868.45%
May−5.103.9325.8989.18%
June−6.708.7649.7086.84%
July−7.6811.9753.3183.05%
August−7.0812.1747.8789.86%
September−5.635.2726.5189.01%
October−4.67−1.234.169.19%
November−3.47−1.890.560
December−3.31−2.76−1.620
Table 5. Driving factors of NEP.
Driver FactorsCodesUnits
Land use typeX1/
ElevationX2m
Potential evapotranspirationX3mm
Average annual precipitationX4mm
Soil moistureX5m3·m−3
Average annual solar radiationX6W/m2
Average annual temperatureX7
Disclaimer/Publisher’s Note: The statements, opinions and data contained in all publications are solely those of the individual author(s) and contributor(s) and not of MDPI and/or the editor(s). MDPI and/or the editor(s) disclaim responsibility for any injury to people or property resulting from any ideas, methods, instructions or products referred to in the content.

