Article

Quantifying the Impact of Fertilizer-Induced Reactive Nitrogen Emissions on Surface Ozone Formation in China: Insights from FEST-C* and CMAQ Simulations

1
State Key Laboratory of Black Soils Conservation and Utilization, Northeast Institute of Geography and Agroecology, Chinese Academy of Sciences, Changchun 130102, China
2
University of Chinese Academy of Sciences, Beijing 100049, China
3
State Key Laboratory of Urban Water Resource and Environment, Harbin Institute of Technology, Harbin 150090, China
*
Author to whom correspondence should be addressed.
These authors contributed equally to this work.
Agriculture 2025, 15(6), 612; https://doi.org/10.3390/agriculture15060612
Submission received: 20 December 2024 / Revised: 11 March 2025 / Accepted: 12 March 2025 / Published: 13 March 2025
(This article belongs to the Section Agricultural Systems and Management)

Abstract

:
The emissions of reactive nitrogen (Nr) from cropland links the pedosphere and atmosphere, playing a crucial role in the Earth’s nitrogen cycle while significantly impacting regional climate change, air quality, and human health. Among various Nr species, nitrogen oxide (NO) and nitrous acid (HONO) have garnered increasing attention as critical precursors to surface ozone (O3) formation due to their participation in photochemical reactions. While most studies focus on Nr emissions from soils, the specific contributions of cropland Nr emissions considering planting activities to regional O3 pollution remain insufficiently investigated. This study applied the enhanced process-based agroecological model (FEST-C*) coupled with the air quality (CMAQ) model to quantify cropland Nr emissions and assess their contributions to regional O3 formation across China in June 2020. The simulated results indicated that the fertilizer-induced total Nr emission was estimated at 1.26 Tg in China, with NO emissions accounting for 0.66 Tg and HONO emissions for 0.60 Tg. North China was identified as a hotspot for cropland Nr emissions, contributing 43% of the national total. The peak emissions of cropland NO and HONO occurred in June, with emissions of 169 and 192 Gg, respectively. Cropland Nr emissions contributed approximately 8% to the national monthly mean MDA8 O3 concentration, with localized enhancements exceeding 9% in agricultural hotspots in summer. North China experienced the largest MDA8 O3 increase, reaching 11.71 μg m−3, primarily due to intensive fertilizer application and favorable climatic conditions. Conversely, reductions in nighttime hourly O3 concentrations were observed in southern North China and northern Southeast China due to the rapid titration of O3 via NO. In this study, the contributions of cropland Nr emissions to MDA8 O3 concentrations across different regions of China have been further constrained. Incorporating cropland Nr emissions into the CMAQ model improved simulation accuracy and reduced mean biases in MDA8 O3 predictions. This study offers a detailed quantification of the contribution of cropland Nr emissions in regional ozone formation across China and highlights the critical need to address cropland NO and HONO emissions in air quality management strategies.

1. Introduction

Surface O3 is a major atmospheric pollutant that poses a considerable threat to the environmental, human health, and the climate [1,2,3,4]. It is mainly produced through sunlight-driven chemical reactions involving volatile organic compounds (VOCs) and nitrogen oxides (NOx) [5]. These precursors are emitted from anthropogenic activities such as petroleum and natural gas extraction, the combustion of fossil fuels, chemical and industrial processes, solvent applications, residential boilers, and agricultural fertilization and pesticides [6,7,8,9], as well as biogenic sources like forests, vegetation, biomass burning, and soil bacteria [10,11,12,13].
Reactive nitrogen species (Nr, including NH3, N2O, NOx, HONO, and N2O5) are key precursors to surface O3 formation and play a significant role in atmospheric chemistry [14]. Soil is a major source of Nr emissions, predominantly emitting NH3, N2O, NO, and HONO [15]. NH3 is the sole alkaline gas, and N2O is an important greenhouse gas in the atmosphere, having received extensive attention in previous studies [16,17], while NO and HONO remain insufficiently investigated, especially from cropland [18,19,20,21]. Cropland NO and HONO emissions primarily stem from the biological processes in the soil [22] and are influenced by human activities like fertilization and irrigation and natural factors such as precipitation and temperature [23,24]. It is well established that soil emissions contribute to 12% to 20% of global NOx emissions, with over 40% of this amount originating from agricultural sources [14]. In California, the United States, soil Nr emissions are a significant contributor to NOx and O3 pollution, contributing to a 176.5% increase in surface NO2 concentrations and resulting in an additional 23.0% increase in surface O3 levels [25,26]. Long-term field observations in China have also validated that soil Nr emissions accelerate in summer ozone increase and notably decrease the sensitivity of O3 to anthropogenic emissions [27]. Unregulated soil Nr emissions impeded a NO2 decrease in rural areas and offset the national efforts in China to mitigate NO2 and O3 levels by 20.9% and 15.4%, respectively, from 2011 to 2020 [28].
China is the world’s largest consumer of fertilizers [29], with fertilizer-induced Nr emissions exerting a notable influence on regional O3 pollution formation and receiving widespread attention [20,30,31]. Due to the absence of complete temporal profiles for fertilizer-driven Nr emissions, the quantitative assessment of the impact of Nr emissions on regional O3 pollution formation was impeded until 2021 [27,32]. Recent studies have increasingly utilized mechanistic representations of the biogeochemical processes, such as Yienger–Levy parameterization and Berkeley–Dalhousie Soil NOx Parameterization (BDSNP) in models like GEOS-Chem, WRF-Chem, and Model of Emissions of Gases and Aerosols from Nature (MEGAN) to calculate soil NOx emissions and assess their impacts on air quality in China [15,31,33,34,35]. The latest research has estimated soil NOx and HONO emissions and evaluated the impact of soil Nr emissions on O3 pollution, and temperature rises by integrating an updated soil Nr emissions scheme within the WRF-Chem model [36]. These studies have indicated that the increase in soil Nr emissions could significantly counteract the reductions in NO2 and O3 achieved by clean air policies. However, current methodologies treat NO and HONO as a part of the total soil available N without distinguishing between the fractions of soil N present as organic N, NH4, or NO3 [37]. Furthermore, these parametric schemes treat soil NO and HONO emissions as constant factors across diverse ecosystems based on global literature and field estimates [38,39]. These deficiencies resulted in significant uncertainties in NO and HONO emissions estimates and their contribution to regional O3 formation. While current studies have explored the impact of soil NO and/or HONO on air quality, comprehensive research on cropland Nr emissions that fully account for anthropogenic management activities remains scarce.
To address this gap, we simulated cropland NO and HONO emissions across China in 2020 using FEST-C*. The FEST-C* model has been previously applied by Luo et al. (2022) [40] to simulate Nr emissions from fertilized soils over the continental United States. This work is the second to apply FEST-C* over China and the first to use FEST-C*-derived Nr emissions in air quality simulations. We applied the CMAQ model to quantify their impact on regional O3 formation in June 2020. The objectives of this study were (1) to estimate the spatial and temporal distribution of cropland NO and HONO emissions in China, and (2) to assess their contributions to regional O3 formation. The remainder of this paper is organized as follows: Section 2 describes the data and methodologies; Section 3 analyzes and discusses the cropland Nr emissions, model performance, the impact on regional O3 formation, and limitations and uncertainties; and the conclusions are presented in Section 4.

2. Data and Methodology

Figure 1 presents the schematic diagram of this study. To simulate Nr emissions from cropland, we first adapted a process-based agroecological model (FEST-C*) for China. We processed land use, crops, soils, climate and meteorological data, and N input in China to drive the FEST-C* model. The model was then used to simulate NO and HONO emissions of China, which were subsequently incorporated as input for the CMAQ simulations.

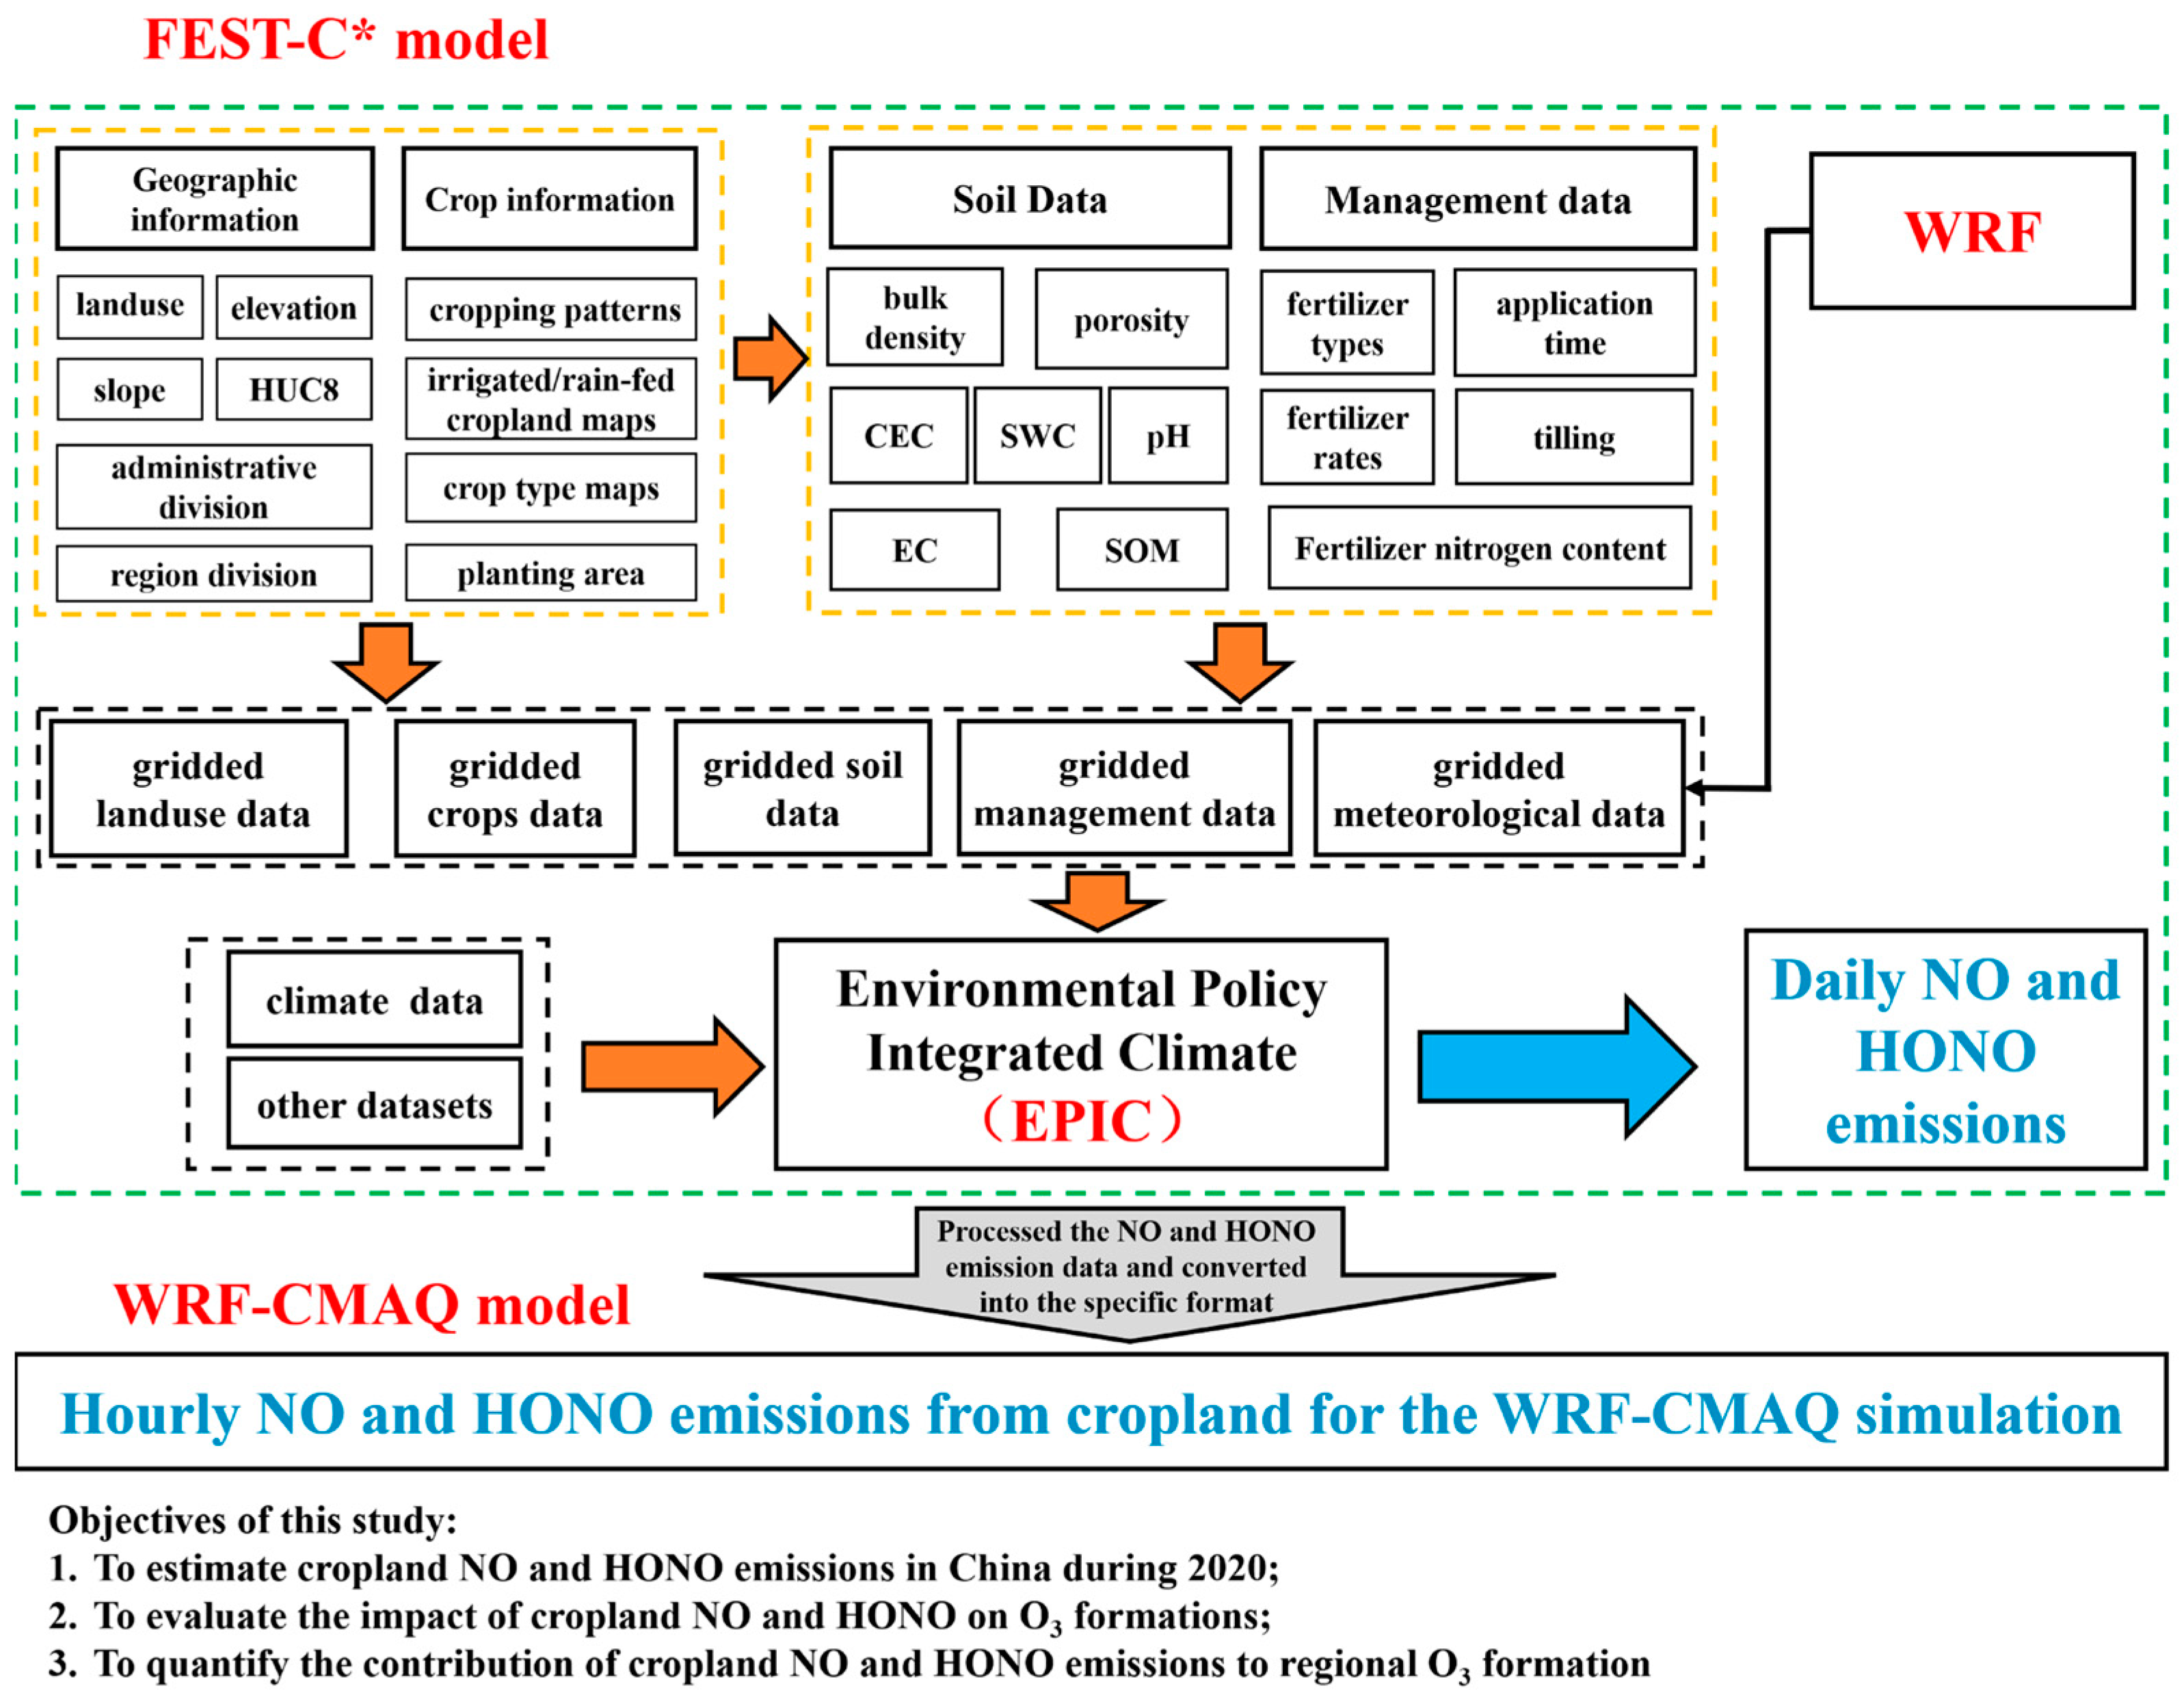
2.1. Model Description and Configurations

FEST-C* is a process-based agroecological model developed by Luo et al. [40]. Unlike traditional schemes with empirical formulas such as the YL95 (Equation (1)) [41], BDSNP [42], and BDISNP [24] (Equations (2)–(5)), FEST-C* incorporates comprehensive biogeochemical processes of microbial nitrification and denitrification (Equations (6)–(14)) to constrain uncertainties in daily NO and HONO emissions from soil carbon, nitrogen, and phosphorus cycles on agricultural lands by accounting for atmospheric conditions and management practices [43].
F N N O Y L = f w d A b i o m e ( w d ) ,           T s o i l × P ( p r e c i p i t a t i o n ) × C R F ( L A I ,   S A I )
where f w d A b i o m e ( w d ) ,   T s o i l represents the emissions factor, which depend on whether the soil is wet) or dry. The wet factor is appliedwhen rainfall exceeds 1 cm within the preceding two weeks. The factor is further influenced by temperature ( T s o i l ).
F N N O B D S N P = A b i o m e N a v a i l × f T × g θ × P l d r y × 1 C R F
where N a v a i l represents the fertilizer N, the standing pool N, and deposited N; A b i o m e coefficients are the functions of N a v a i l ; f T and g θ are the temperature and soil moisture dependencies, respectively, where θ is water-filled pore space; P l d r y is the pulsing factor depending on dry spell length; and C R F is the canopy reduction factor.
F N H O N O = F N , o p t H O N O × f T × f S W C
f T = e E a R T T o p t 1 T
f S W C = 1.04 × e x p e S W C 11.32586 5.27335 S W C 11.32586 5.27335 + 1
where F N , o p t H O N O represents the optimal flux of soil HONO; the factors of f T and f S W C account for the influence of soil temperature and water content, respectively; E a denotes the activation energy of HONO; R is the universal gas constant; and T o p t is the temperature at which the optimal flux is emitted.
F N O = F n t N O + F d t N O
F n t N O = F n t N 2 O r N O N 2 O s o i l   p o r o s i t y , s o i l   m o i s t u r e , s o i l   t e x t u r e P l e n g t h   o f   d r y   p e r i o d   C R F L A I , m e t e r o l o g y w i n d   s p e e d ,   s u r f a c e   p r e s s u r e , s u r f a c e   a i r   t e m p e r a t u r e ,   s u r f a c e   r a d i a t i o n , s n o w   c o v e r , c l o u d   f r a c t i o n                 1 f r , max H O N O f S W C
F d t N O = F d t N 2 O r N O N 2 O s o i l   p o r o s i t y ,   s o i l   m o i s t u r e ,   s o i l   t e x t u r e
where F n t N O , F d t N O , and F d t N 2 O are NO emission flux from nitrification and denitrification and N2O emission flux from the denitrification process, respectively. P l e n g t h   o f   d r y   p e r i o d is the pulsing effect of NO emission triggered by re-wetting after the drying period. C R F is the canopy reduction, which is mainly affected by leaf area index and meteorological factors.
F N 2 O = F n t N 2 O + F d t N 2 O
F n t N 2 O = F n i t 2 %
F d t N 2 O = R d e n , m a x W D f N O 3 f r e s p i r a t i o n f m o i s t u r e   f r N 2 O   f N O 3 ,   f r e s p i r a t i o n , f m o i s t u r e
F n i t =   W N H 3 1 e k v o l + k n i t d t d t 1 f v o l
where F N 2 O represents the total N2O emissions from microbial nitrification and denitrification ( k g   N   h a 1   d 1 ). It is expressed as a function of the empirical maximum denitrification rate ( R d e n , m a x   ), soil nitrate ( f N O 3 ), soil respiration ( f r e s p i r a t i o n ), and soil moisture ( f m o i s t u r e ).
F n t H O N O = F n t N O f r , max H O N O f S W C
f S W C = W F P S 0.1 ,   W F P S 0.10 0.4 W F P S 0.4 0.1 ,   0.1 < W F P S 0.40 0 ,   W F P S > 0.4
where F n t H O N O and F n t N O are the emission fluxes of HONO and NO from nitrification, respectively; f r , max H O N O is the maximum value of HONO in the soil nitrification process, which is 0.429 [11]; and f S W C is the soil water content factor, which reflects the effect of soil pore water content on HONO emissions.
FEST-C* integrates the EPIC, WRF, and CMAQ model with land use and agricultural management, inducing an approach for evaluating the effects of fertilizer-induced Nr emissions on air quality. FEST-C* outputs daily Nr emissions from rain-fed and irrigated crops. Detailed model framework and formulations of Nr calculations are provided by Luo et al. [40].
WRFv4.3 (https://www.mmm.ucar.edu/wrf-model-general, last access: 10 November 2024) and CMAQv5.3.3 (https://www.epa.gov/cmaq, last access: 10 November 2024) were used to simulate the meteorology and atmospheric ozone concentrations across China (Figure 2). The simulation domain encompassed the entirety of China (62°~143° E, 14°~58° N) with a grid resolution of 27 km, utilizing a Lambert conformal conic projection centered at 37° N and 103° E. These simulations were conducted with a horizontal resolution of 27 km with 30 vertical levels.
Table 1 lists the parameterization schemes and data for WRF and CMAQ simulations. The Rapid Radiative Transfer Model for General Circulation Models (RRTMG) for both longwave and shortwave radiation schemes [44], the Morrison scheme for the cloud microphysics scheme [45], the Asymmetric Convective Model (ACM2) for the planetary boundary layer scheme [46], the Kain–Fritsch scheme for weather prediction models to simulate deep convection and precipitation processes [47], the Pleim–Xiu Land Surface Model for the surface scheme and the land surface process scheme [48], and the Xu–Randall method for convective processes [49] were selected for the WRF model, respectively. The aerosol mechanism and aqueous-phase chemistry used in CMAQ were the AERO6 and CB06, respectively. Two scenarios with and without considering cropland Nr emissions were conducted in June 2020 to explore the impact of cropland Nr emissions on surface O3 formation in China. We chose June as that is when intensive fertilizer-induced Nr emissions and severe ozone pollution have been observed [31,50]. In this study, we evaluated the impact of cropland Nr emissions on O3 formation at both the national and regional levels across China. The six regions (Figure 2) represent diverse socioeconomic, geo-climatic conditions, and various crop types and rotation practices [51]. These regions include Northeast China (NE), Northwest China (NW), North China (NC), Southeast China (SE), Southwest China (SW), and the Tibetan Plateau (TP).

2.2. Data Sources

The input data of the FEST-C* model include land use, crops, soils, climate and meteorological information, and N input. Land use data from the China Land Cover Dataset [54] (http://doi.org/10.5281/zenodo.4417810, last access: 9 November 2024) were utilized in this study. The data provide 10 landcover categories in which the “Cropland” category was the input for the BELD4 Data Generation tool in FEST-C* [55]. Crop-related data, including crop types, cropping intensity, and irrigated/rain-fed crops, were from the latest publicly available data. The Harmonized World Soil Database version 2.0 [56] (https://gaez.fao.org/pages/hwsd, last access: 11 November 2024) was used to provide soil data at 1 km resolution. The climate dataset used in the model spin-up stage was from the National Climatic Data Center, National Oceanic and Atmospheric Administration (ftp://ftp.ncdc.noaa.gov/pub/data/noaa/isd-lite/, last access: 12 November 2024). This dataset provides historical climate data, while daily meteorological data used in the year-specific simulation were from METCRO2D files generated by MCIP using WRF outputs. N input data were from China Statistical Yearbooks, China Rural Statistical Yearbooks, and fertilizer application recommendations.
Anthropogenic emissions were sourced from the Multi-resolution Emission Inventory model for Climate and air pollution research (MEIC, http://meicmodel.org.cn/?page_id=560, last access: 10 October 2024) for China in 2020 and the Emissions Database for Global Atmospheric Research (EDGAR, https://edgar.jrc.ec.europa.eu/, last access: 10 November 2024) for regions outside China in 2018. These databases provide pollutant emissions from various sectors, including industrial, energy system, transportation, residential, and agricultural sources with spatial resolutions of 0.25° and 0.1°, respectively. Cropland Nr emissions were simulated in China during 2020 using FEST-C* as mentioned in Section 2.1. VOCs emissions from biogenic sources and biogenic NOx emissions excluding cropland were calculated using MEGAN v3.0, (https://bai.ess.uci.edu/megan/, last access: 11 November 2024). Open biomass burning emissions are adopted from the Fire INventory from NCAR version (FINN, version 1.5, https://www2.acom.ucar.edu/modeling/finn-fire-inventory-ncar, last access: 11 November 2024). The allocation of emission data was performed using linear interpolation. These anthropogenic emission data were matched to the simulation domain, intercepted to calculate area ratios, and weighted to allocate emissions for each model grid [57].
The meteorological ICs and lateral BCs for this study were obtained from the National Center for Environmental Prediction Final Analysis datasets (http://rda.ucar.edu/datasets/ds083.2, last access: 11 November 2024). These data have a horizontal resolution of 1° × 1° and an interval of 6 h. Chemical ICs/lateral BCs for CMAQ simulations were downscaled from the Whole Atmosphere Community Climate Model (https://data.rda.ucar.edu/, last access: 11 November 2024) by using the mozart2camx (https://www.camx.com/download/support-software/, last access: 21 November 2024) and mozbc (https://www.acom.ucar.edu/wrf-chem/download.shtml, last access: 21 November 2024) tools, respectively.

2.3. Ground-Based Observation

The China National Environmental Monitoring Center (CNEMC, https://quotsoft.net/air, last access: 20 November 2024) provided hourly O3 concentration to evaluate the model performance in simulating surface O3. The maximum daily 8 h averaged ozone (MDA8 O3) concentrations were calculated using Pythonv3.12.2.

2.4. Data Analysis

In this study, statistical metrics including Pearson correlation coefficient (R), mean bias (MB), root mean squared error (RMSE), normalized mean bias (NMB), and normalized mean error (NME) were selected to evaluate hourly and MDA8 O3 concentrations across different regions of China.
The BASE and InNr scenarios were established to quantify the contribution of cropland Nr emissions on O3 concentrations. The BASE scenario only included anthropogenic emissions except for croplands, while InNr scenario included NO and HONO emissions from croplands as estimated by FEST-C*. We calculated the difference of O3 concentrations between the InNr and BASE scenarios (InNr–BASE). These differences indicate the impact of cropland Nr emissions on surface ozone. Also, we further quantified the promotion or inhibition of surface O3 formation due to fertilizer-induced Nr emissions to the surface O3 concentration by calculating the ratio of the difference to the O3 concentration simulated under the BASE scenario.

3. Results and Discussion

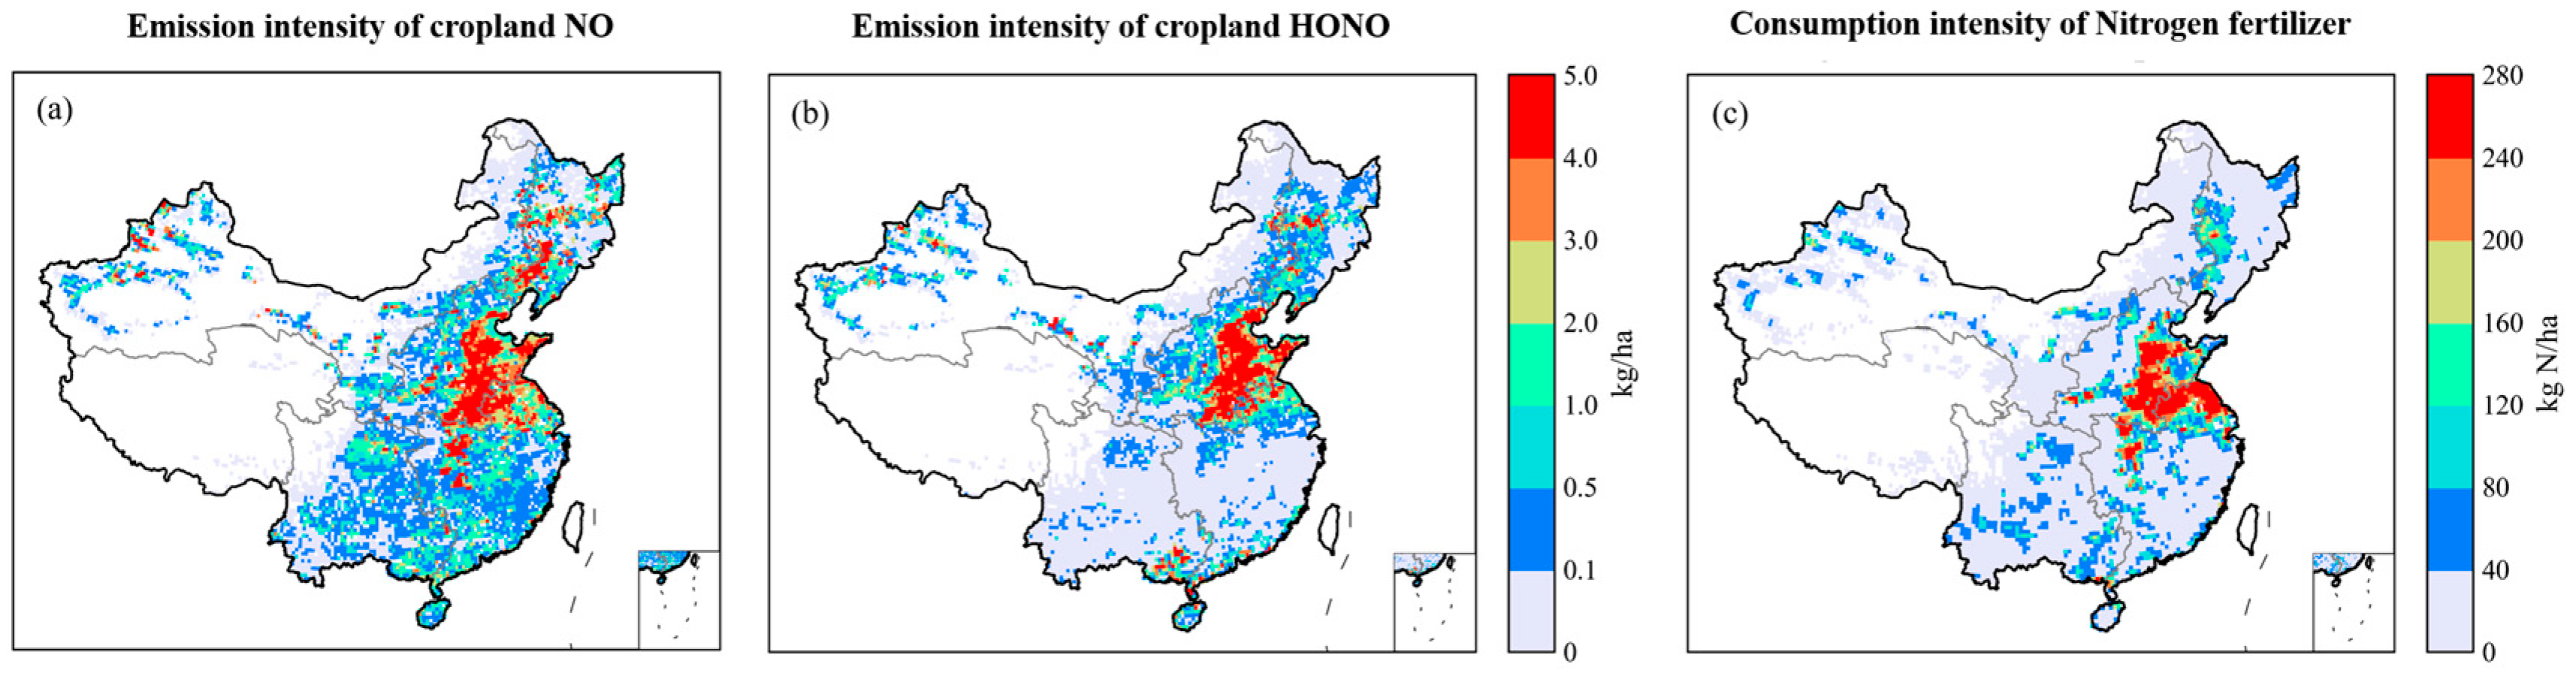
3.1. Cropland Nr Emissions in China

Total fertilizer-induced Nr emissions simulated by FEST-C* in China during 2020 were 1.26 Tg, with 43% (0.54 Tg) of them emitted in the NC region, followed by SE (23%), SW (13%), NE (10%), NW (7%), and TP (4%) (Table 2). NO and HONO emissions were comparable across most regions, including NE, NW, SW, and TP, ranging from 0.02 to 0.09 Tg. However, NO emissions in SE (0.19 Tg) exceeded those in NC (0.10 Tg), whereas HONO emissions in SE (0.24 Tg) were lower than in NC (0.30 Tg).
The spatial distribution of cropland Nr emissions varied significantly across different regions of China (Figure 3). The eastern NC region (>7 kg/ha) and northern SE region (>5 kg/ha) emerged as hotspots for Nr emissions, followed by certain areas in NE, NW, and SW. In eastern NC, estimated NO (Figure 3a) and HONO (Figure 3b) emissions reached 0.21 and 0.26 Tg yr−1, accounting for 35% and 48% of the national total emissions, respectively. In contrast, Nr emissions were minimal in regions such as most TP, the western NW, and the northwestern SW. These patterns of Nr emissions were predominantly attributable to N fertilizer application in cropland. In 2020, China applied a total of 25.89 Tg N in N fertilizers, with over 65% concentrated in major grain-producing regions, including the North China Plain (NCP) (30.2%), northern SE (20.4%), and western NE (15.6%) (Figure 3c). The high fertilizer consumption in these regions contributed significantly to their elevated Nr emissions. Interestingly, specific areas such as the central and eastern NCP exhibited NO and HONO emissions comparable to the central part of the region, with values exceeding 5 kg/ha. However, the fertilization intensity in these areas was notably lower than in the central NCP. This suggested that Nr emissions in these regions were influenced by additional factors, which will be discussed further in this section.
In 2020, cropland Nr emissions in China exhibited a bimodal temporal pattern, with notable peaks in June (361 Gg) and October (280 Gg) (Figure 4). Cropland NO emissions nearly tripled from 71 Gg to 192 Gg during January and June before sharply declining to 80 Gg in September. November and December recorded the lowest NO emissions, contributing just 3% and 2% of the annual total NO emissions. The emission trends in cropland HONO were consistent with those of NO. These variations were largely attributed to the crop rotation systems in China and corresponding FC in croplands. For example, high FC levels in May in NE China, June and October in NC, and parts of SE China led to high NO and HONO emissions of 21, 48, 37 Gg, and 7, 65, and 49 Gg in the corresponding periods, respectively. An increase of 2.1 Tg in FC from February to March resulted in NO and HONO emissions increasing by 77% and 145%, respectively. Similar fertilizer-induced NO and HONO emissions trends were observed from April to May. These emission trends have also been confirmed in previous studies [20,32,58].
However, except for FC, cropland NO and HONO emissions were also significantly affected by other factors such as soil moisture and temperature. For instance, despite a 3% increase in FC from January to February, NO and HONO emissions decreased by 16% and 62%, respectively. This reduction was attributed to the suppression nitrification by soil ammonia-oxidizing archaea and soil ammonia-oxidizing bacteria, which was driven by increased soil moisture under a low (11 °C) soil temperature [59,60,61]. Moreover, although the peak FC in May (5.4 Tg N) exceeded that in June (4.4 Tg N), NO and HONO emissions in May were 36% and 38% lower. Similarly, while FC decreased by over 88% from June to August, NO and HONO emissions declined by only 48% and 76%. These findings indicated that NO and HONO emissions during non-fertilization periods were more dominated by soil temperature and moisture than by FC. Although May had the highest fertilizer application during seeding (Figure 4), cropland Nr emissions were not higher than those in June because of the effects of other factors except for fertilization, such as soil temperature. Huang et al. [31] indicated that cropland Nr emissions in June were in North China due to fertilization before the pre-planting period, affecting regional O3 formation. Therefore, we chose to quantify the contribution of cropland Nr emissions to O3 concentration this month in the following section.

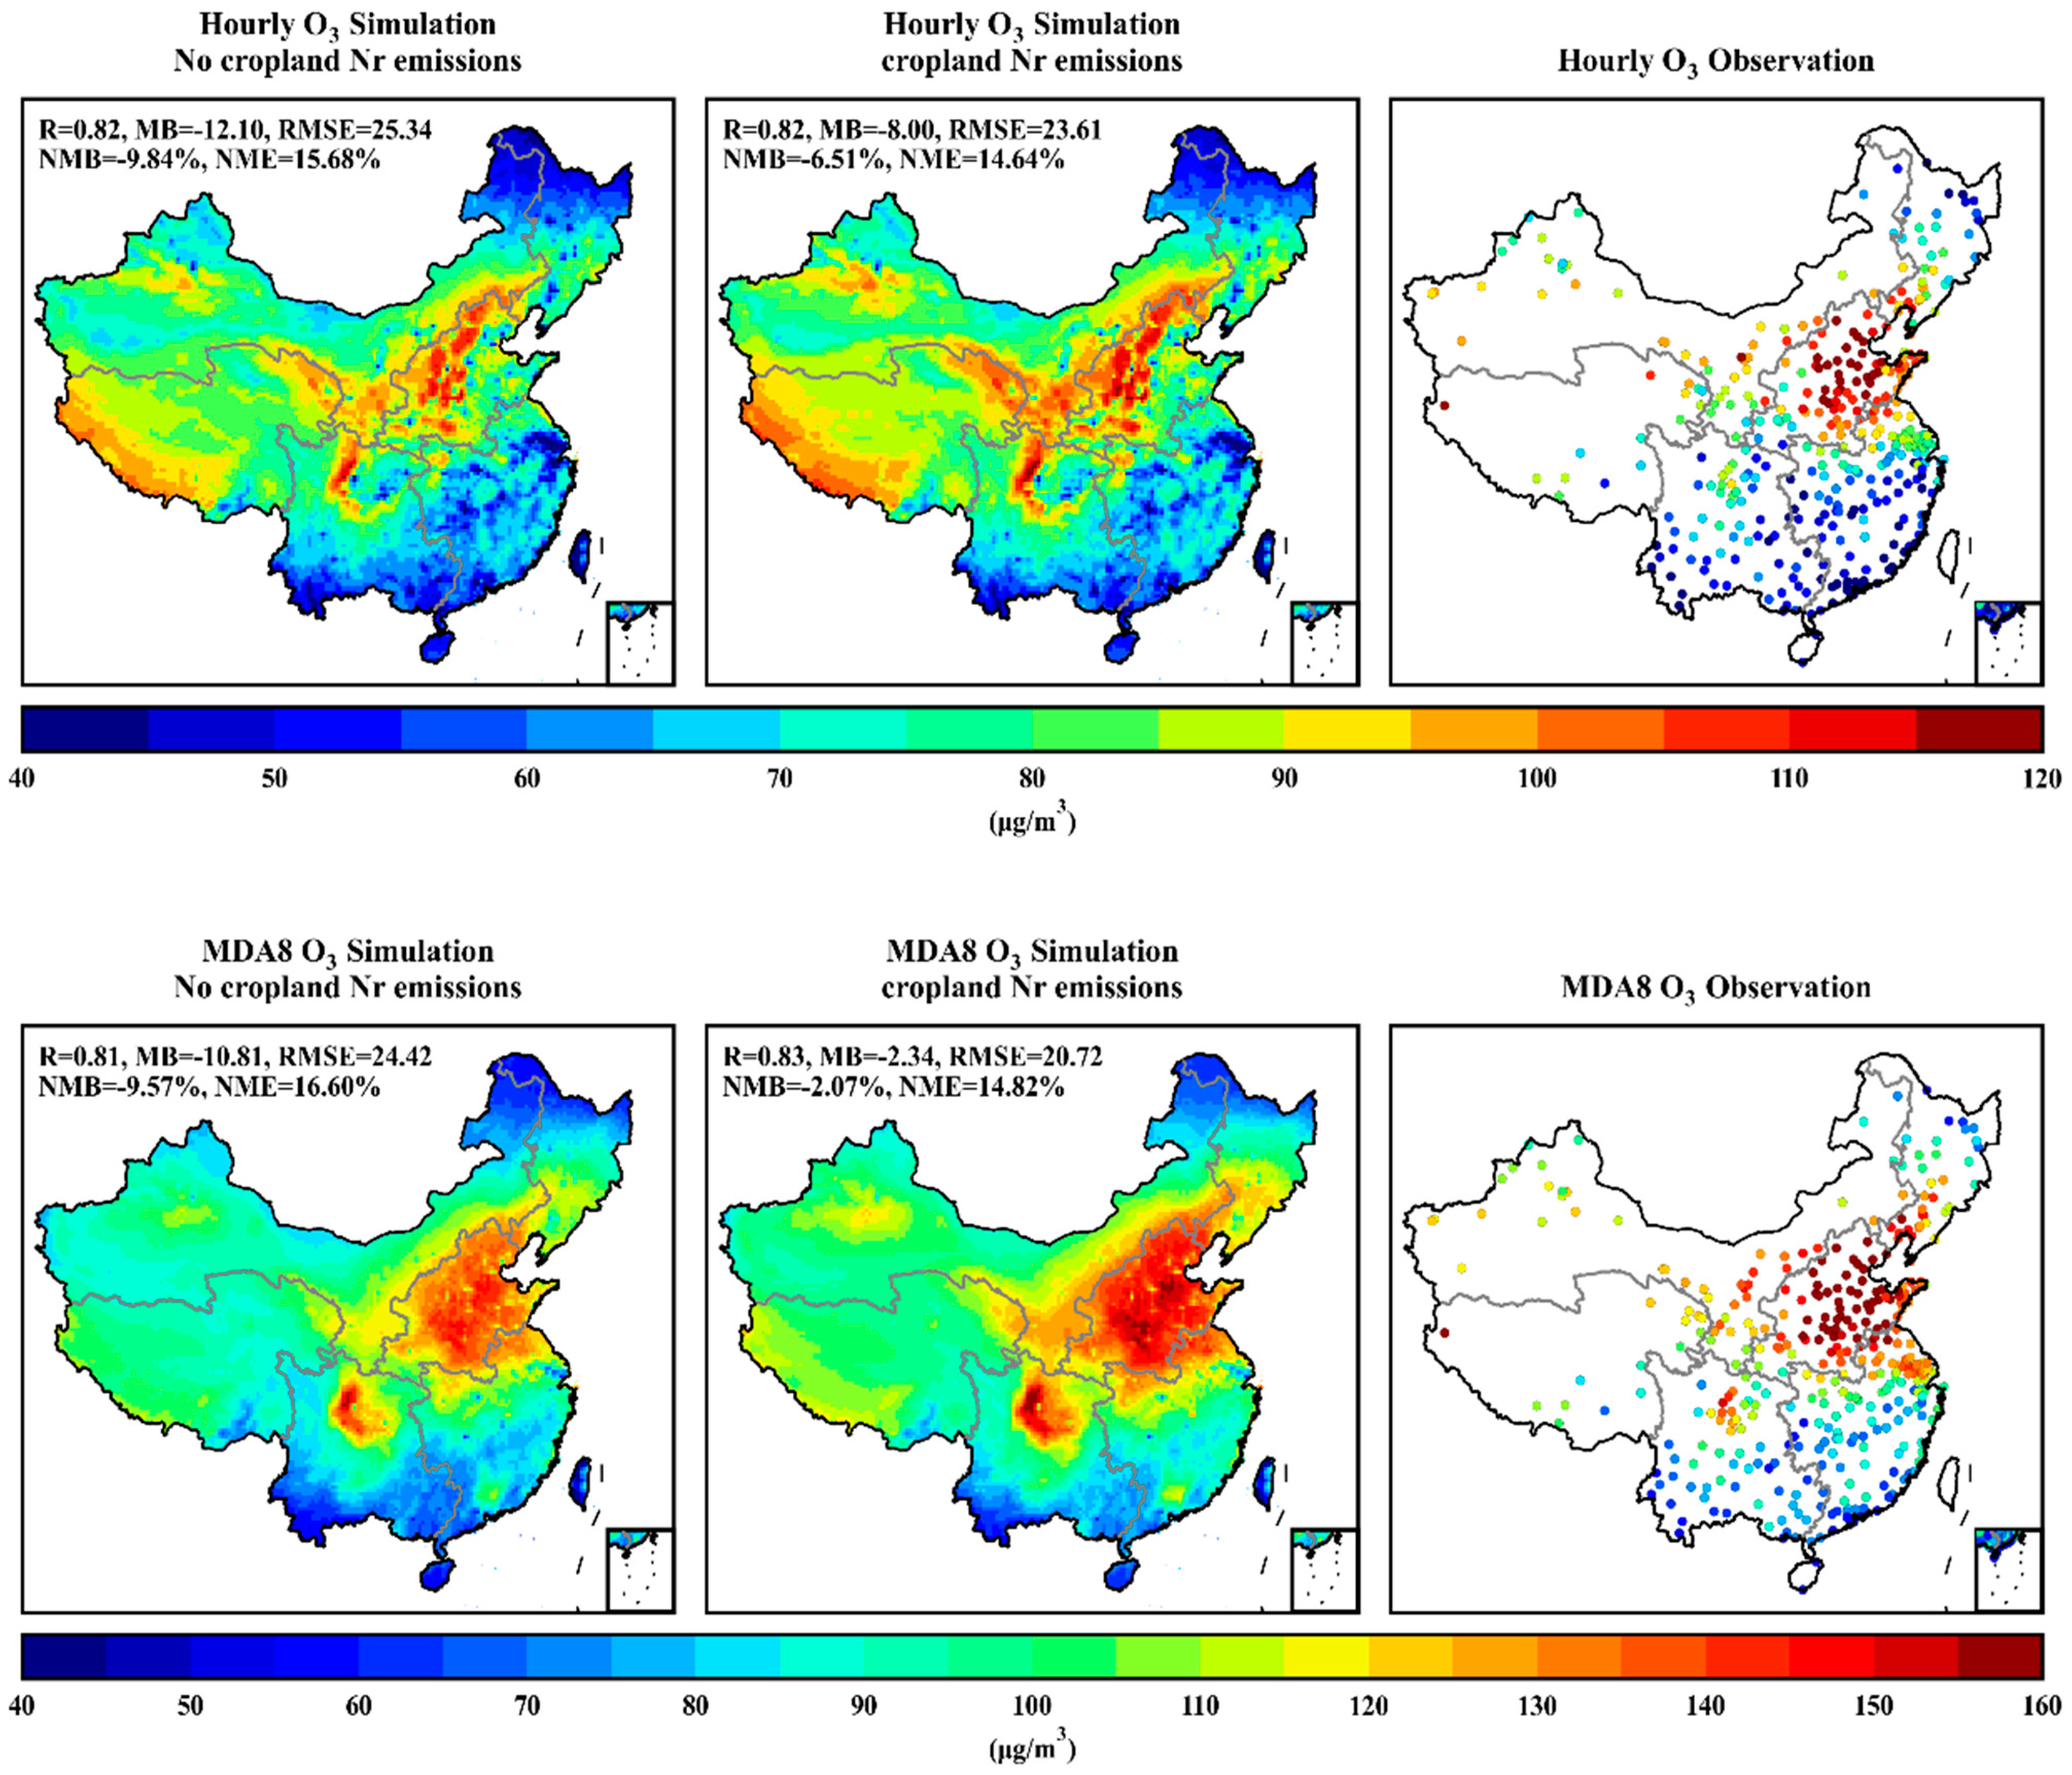
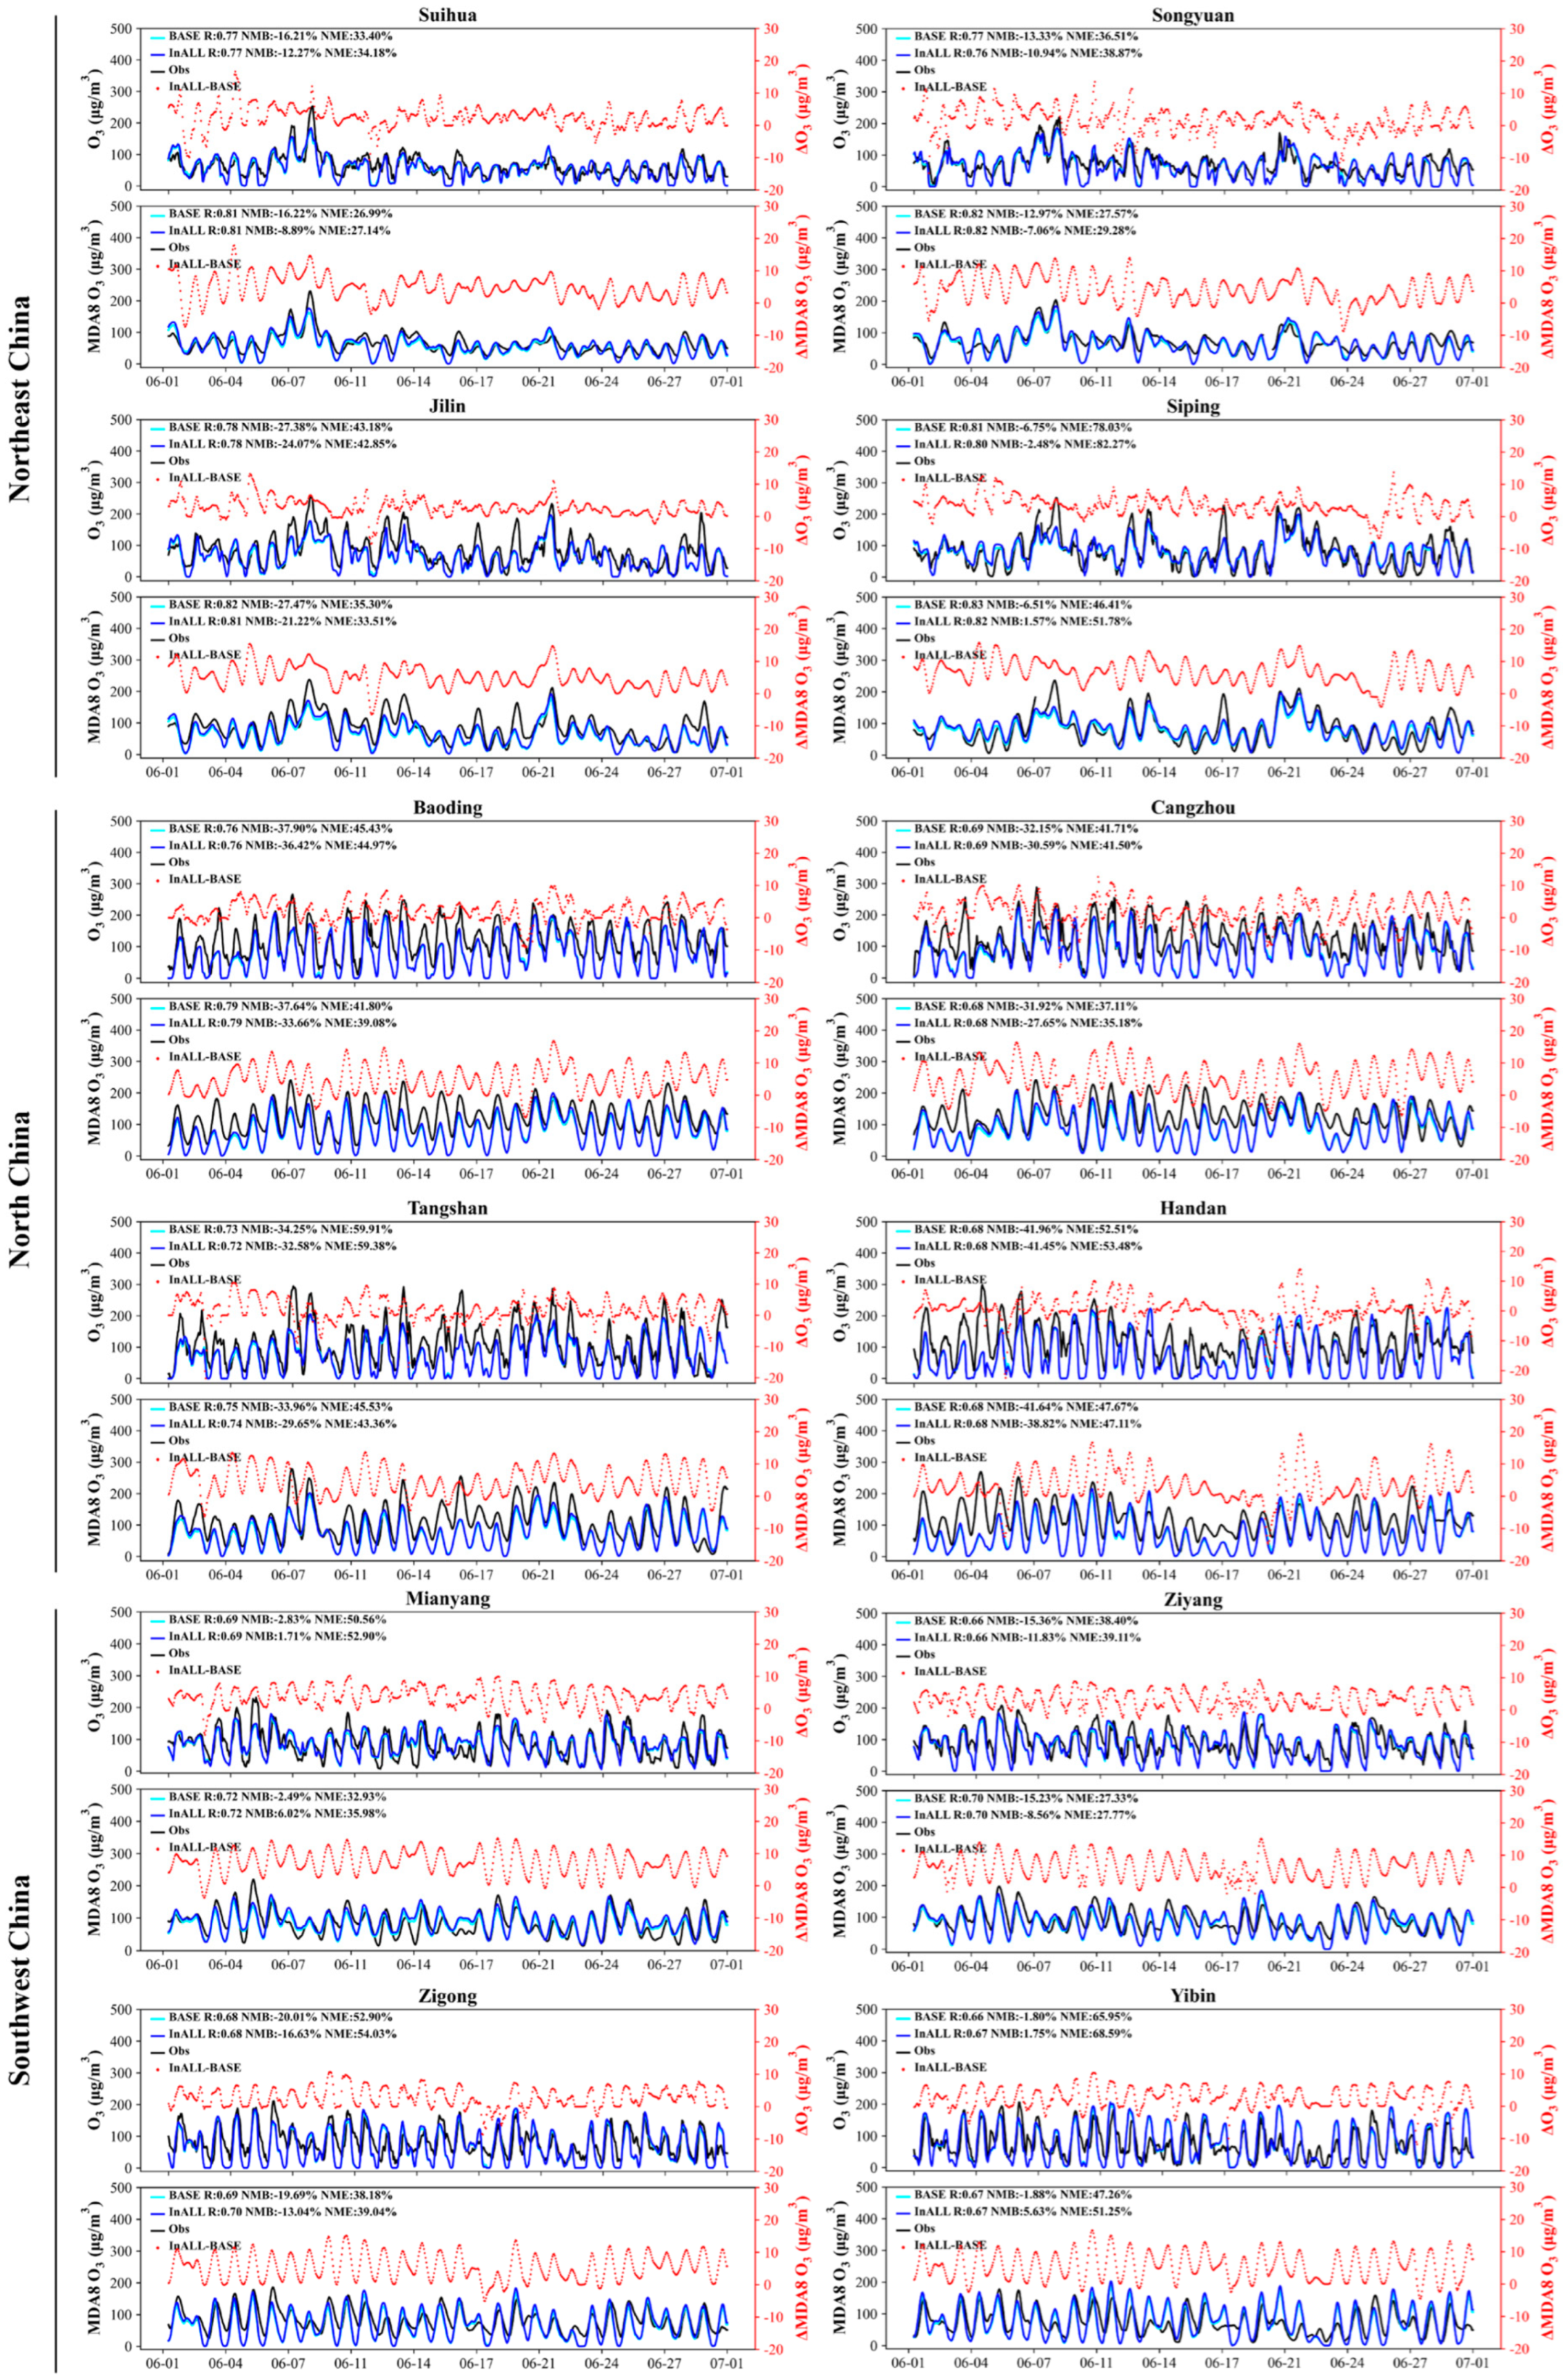
3.2. Evaluation of CMAQ Model Performance

Figure 5 presents the spatial distribution of monthly average O3 and MDA8 O3 concentrations from CNEMC observations and simulations under BASE and InNr scenarios for June 2020 in China to evaluate the model performance. Both simulations captured the hotspots of hourly O3 and MDA8 O3 in the NCP region and Sichuan Basin, consistent with observed data and indicative of extensive agricultural activities.
Under the BASE scenario, simulations significantly underestimated hourly O3 and MDA8 O3 concentrations by 12.10 μg m−3 (NMB: −9.84%) and 10.81 μg m−3 (NMB: −9.57%), respectively, with the central NCP showing notable underestimations of 40 μg m−3 for hourly O3 and 20 μg m−3 for MDA8 O3. Incorporating cropland Nr emissions (InNr scenario) improved the model performance in simulating hourly O3 and MDA8 O3, reducing MB to −8.00 and −2.34 μg m−3. The model performed optimally in the NCP region under the InNr scenario, with a negative mean bias of 20 μg m−3 for MDA8 O3 in June 2020. Conversely, the performance was poorer in regions such as southeastern SW, southern SE, and most of the TP.
This study found that cropland Nr emissions significantly impacted regional O3 formation in China during June 2020, primarily concentrated in the NC region and some parts of SW and NE, as described in Section 3.1. To further assess the influence of cropland Nr emissions on O3 formation, we selected agriculture-dominated cities in these regions, such as Suihua, Songyuan, Jilin, and Siping in the NE region, Baoding, Cangzhou, Tangshan, and Handan in the NC region, and Mianyang, Ziyang, Zigong, and Yibin in the SW region, and analyzed the hourly variation in simulated and observed O3 and MDA8 O3 under the BASE and InNr scenarios (Figure 6).
Our results indicated that the variations in simulated hourly O3 and MDA8 O3 during this period were consistent with the corresponding observed hourly O3 and MDA8 O3 variations in the four cities, with correlation coefficients exceeding 0.68. In the Baoding, Cangzhou, and Tangshan of the NC region, similar hourly O3 and MDA8 O3 variations were found, and peak concentrations were observed on 7 June, 13 June, and 16 June, respectively. During these periods, the hourly O3 concentrations exceeded 250 μg m−3, which was 25% higher than the national Level II standard (200 μg m−3, https://www.mee.gov.cn/ywgz/fgbz/bz/bzfb/, last access: 26 November 2024). Compared with the BASE scenario, the monthly O3 and MDA8 O3 concentrations under the InNr scenario in these cities increased by approximately 4 and 7 μg m−3, respectively, underscoring the influence of fertilizer-induced emissions on O3 formation. However, the simulated hourly O3 and MDA8 O3 concentrations exhibited a normalized mean bias ranging from −29% to −40% across the three cities. These underestimations may arise from simplifying complex chemical mechanisms, physical processes, and input data uncertainties, such as emission inventories. In Mianyang, Sichuan Basin, the average hourly O3 and MDA8 O3 concentrations in June were 83.7 and 84.7 μg m−3, respectively. The simulated average hourly O3 and MDA8 O3 concentrations under the InNr scenario were 85.1 μg m−3 and 88.7 μg m−3, 5% and 9% higher than the those under the BASE scenario.

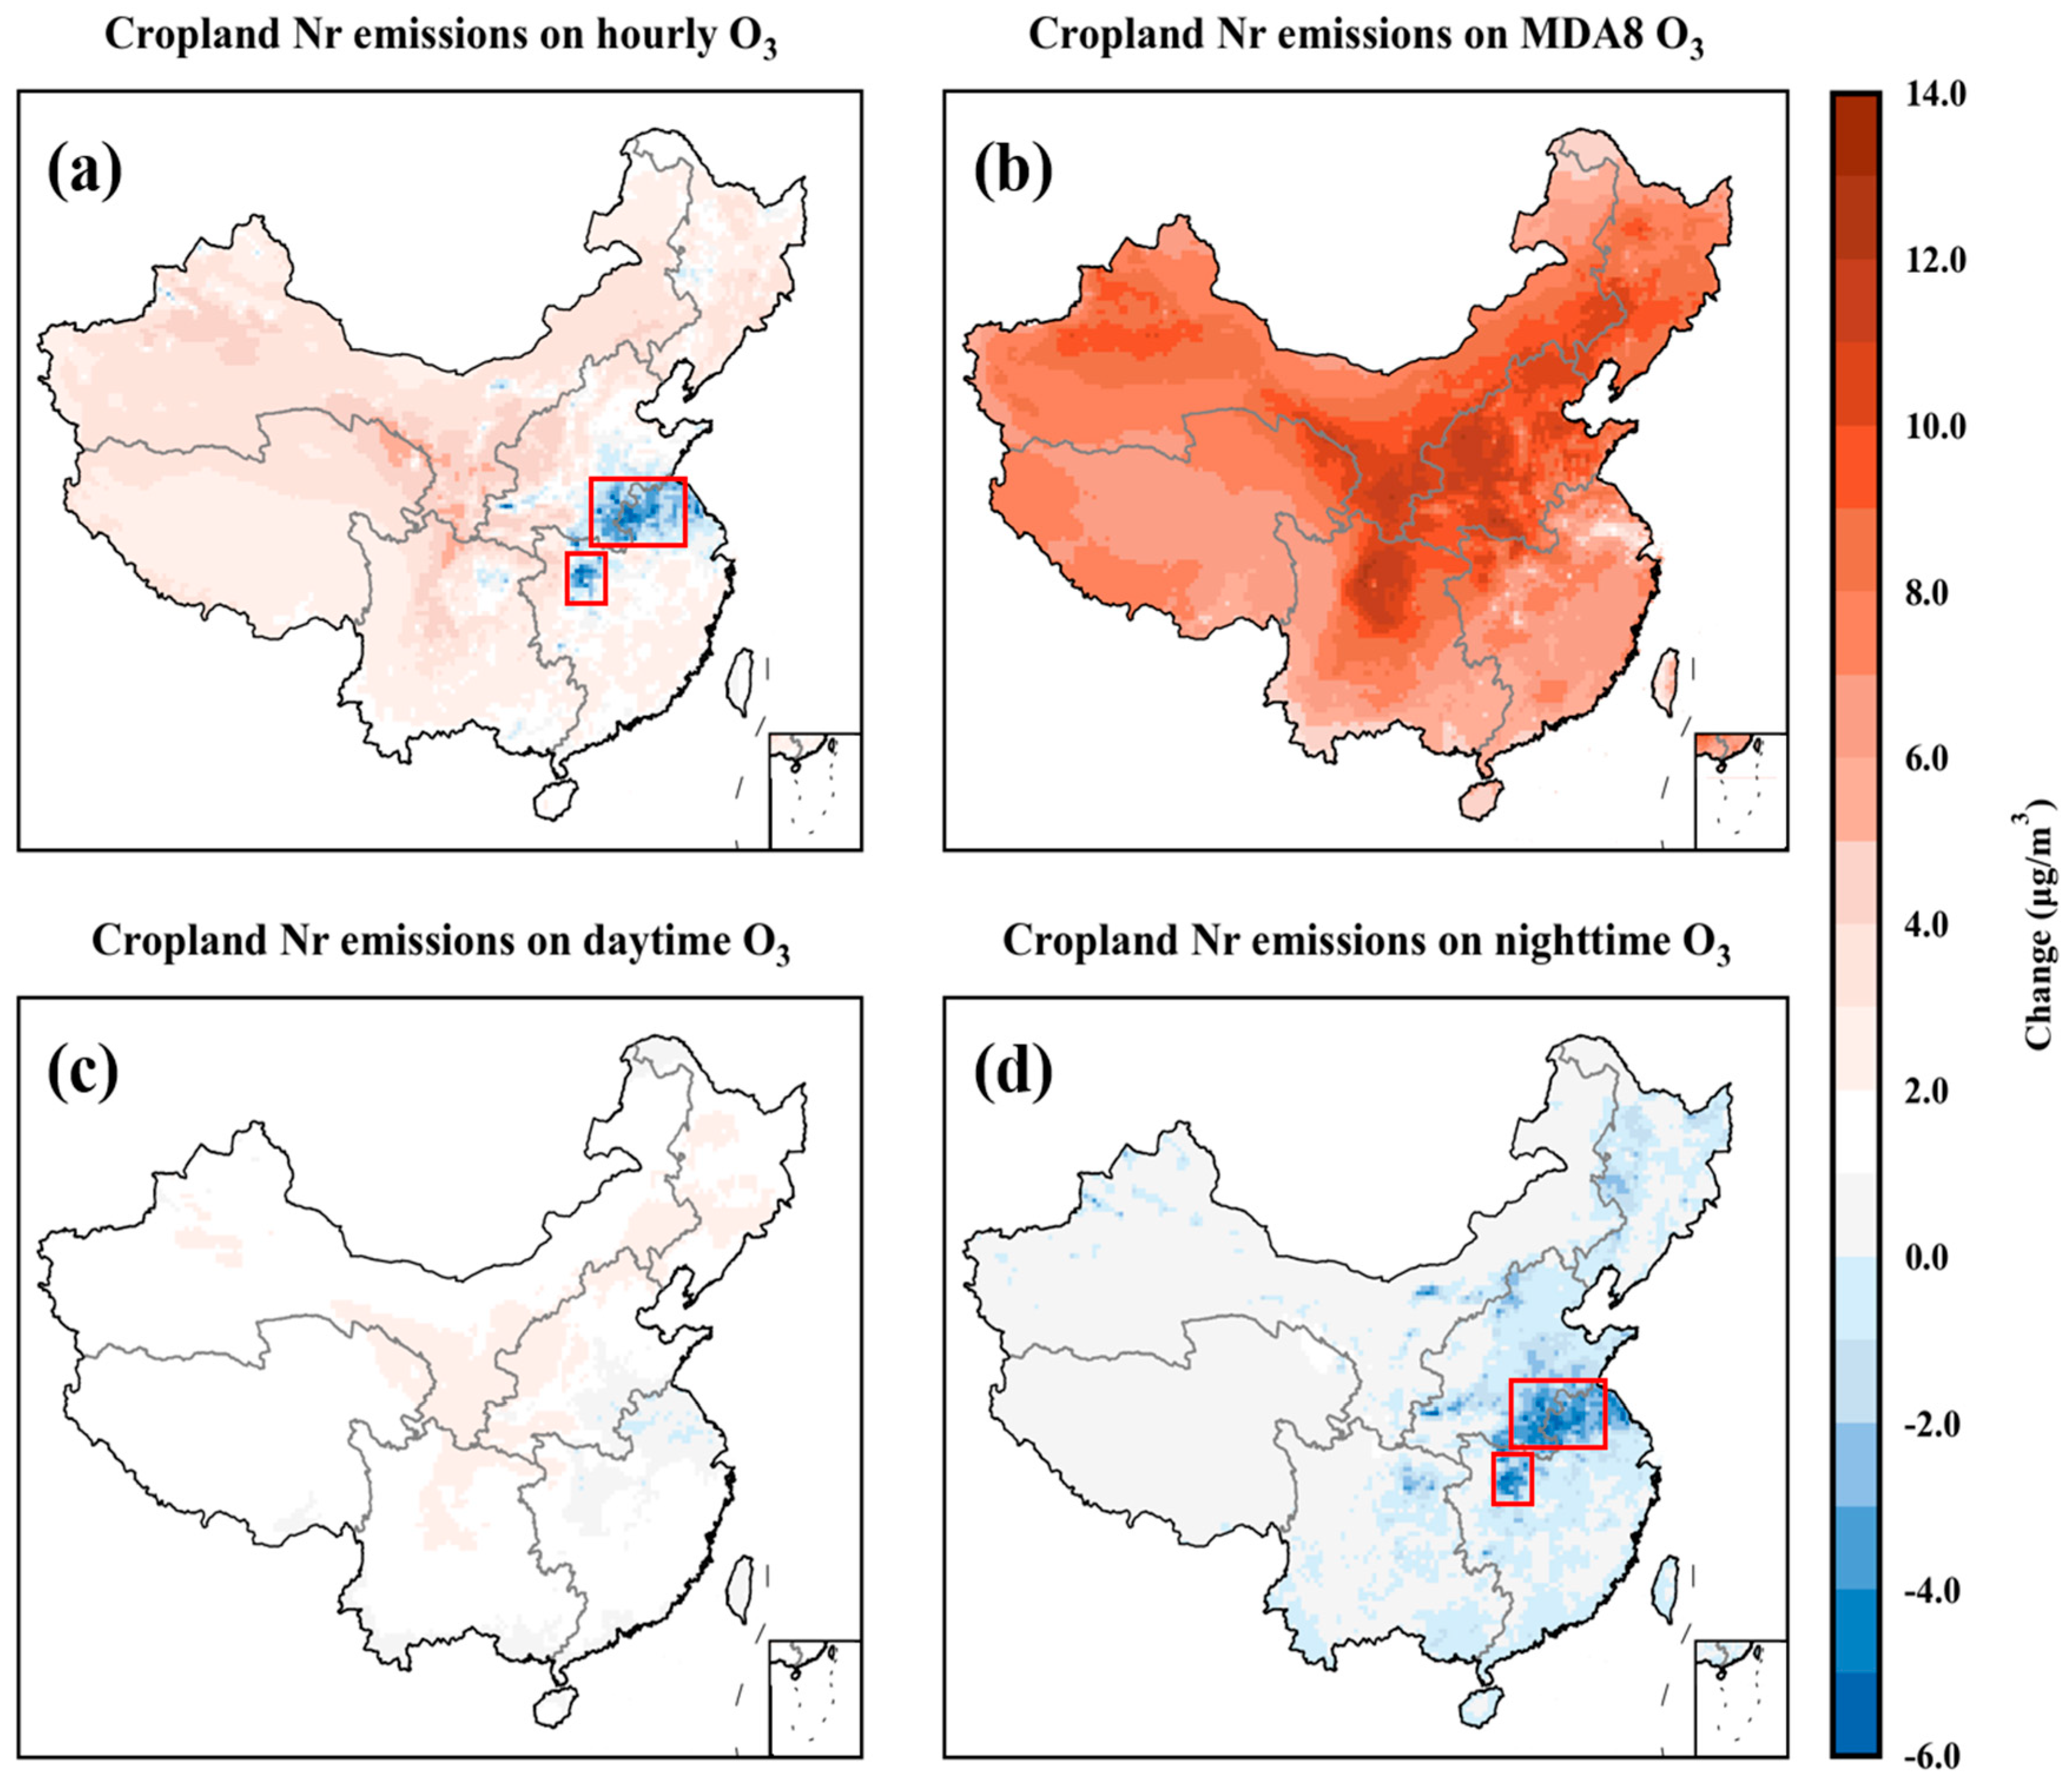
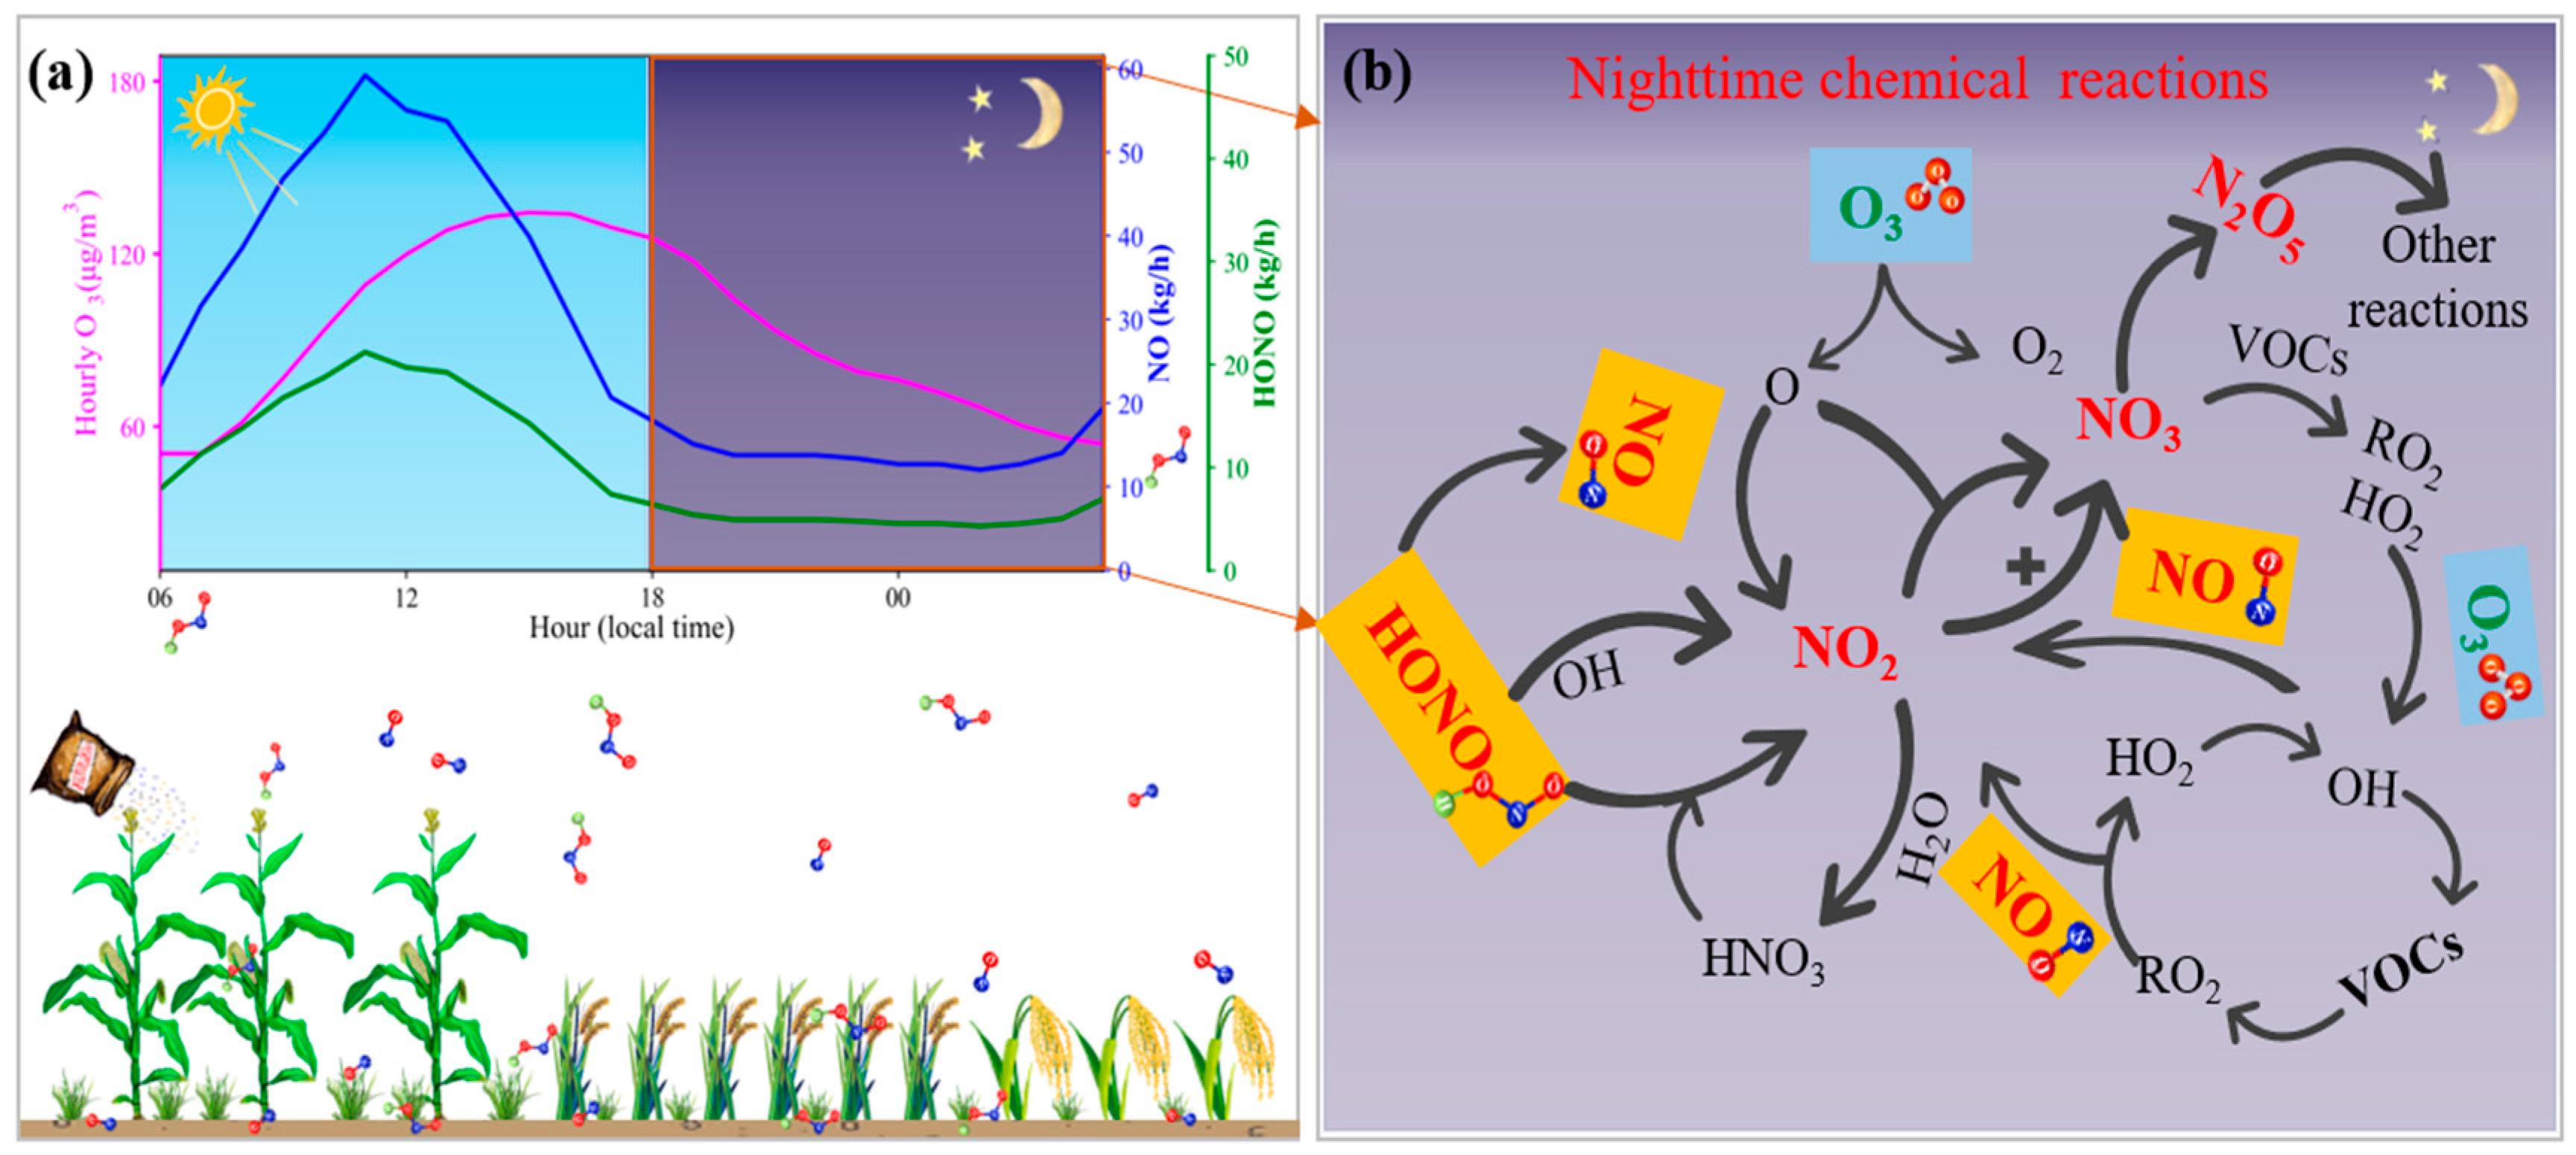
3.3. Impact of Cropland Nr Emissions on Regional Ozone Formation

To quantify the impact of cropland NO and HONO emissions on O3 formation, the spatial distribution of the differences between simulated hourly O3 and MDA8 O3 was depicted in Figure 7. Elevated ∆MDA8 O3 (>10 μg m−3) (Figure 7b) concentrations were predominantly observed in most of the NC region, in parts of the NW and SW regions, and in northern SE, corresponding closely to regions with high cropland Nr emissions. These findings were also confirmed by Sha et al. [36], who showed that soil Nr emissions significantly influence surface O3 in the FWP and Beijing–Tianjin–Hebei (BTH) region. In the northwestern part of the NCP, cropland Nr emissions increased MDA8 O3 concentrations by 6–14 μg m−3, respectively, which were 3–5 times higher than those in non-agricultural areas. This notable increase can be attributed to the intensive fertilization preceding the crop planting stage, which releases substantial Nr emissions. Wang et al. [34] reported that cropland NOx emissions contributed 27.7% of surface NO2 and elevated MDA8 O3 by an average of 8 μg m−3 in the NCP region. Two critical factors led to North China becoming the region where cropland NO and HONO emissions have the most significant impact on O3 formation. Previous studies have shown that cropland NO and HONO emissions were concentrated in North China, contributing more than 40% and 60% of the total NO and HONO emissions [62]. North China is a hotspot for NOx and VOCs emissions from both industrial activities and motor vehicles. After fertilization, the rate of ·OH generation from HONO photolysis significantly exceeds the ·OH generation rate from O3 photolysis, with the maximum ratio reaching 4.7 [63]. This accelerates the conversion of NOx and VOCs into O3, leading to a more significant impact of cropland NO and HONO emissions on O3 formation in North China compared to other regions. Notably, while cropland Nr emissions increased hourly O3 concentrations by 2 μg m−3 to 6 μg m−3 across most areas of China, a significant inhibitory effect was observed in the southern NC and the northern SE (Figure 7a). To investigate this phenomenon, we analyzed the spatial distribution of average hourly O3 concentrations during daytime and nighttime and found that the inhibitory effect occurred primarily at night (Figure 7c,d). This inhibitory effect was also confirmed by Shen et al. [33] and Chen et al. [64], who showed that the soil NO emissions increased the atmospheric NOx concentrations and caused the O3 concentration to decrease by 2 μg m−3 to 10 μg m−3 in eastern China. Song et al. [65] and Niu et al. [66] suggested that the nocturnal titration of surface O3 by NO, leading to the formation of nitrate radicals (NO3), played a key role in reducing O3 concentrations. Additionally, HONO can undergo conversion into NO through non-photolytic pathways, further increasing atmospheric NO levels and accelerating the reaction of O3 with NO (Figure 8).
To further investigate ozone responses to cropland Nr emissions at the region level, we analyzed monthly simulated hourly O3 and MDA8 O3 concentrations and the contribution of cropland Nr emissions to the surface O3 concentration across different regions of China in June 2020 (Table 3). Under the BASE scenario, hourly O3 concentrations ranged from 65.66 μg m−3 to 89.03 μg m−3. The NC and TP regions exhibited the highest O3 concentrations, with monthly concentrations of 89.03 μg m−3 and 86.95 μg m−3, respectively, followed by NW (78.39 μg m−3), SW (70.62 μg m−3), NE (65.66 μg m−3), and SE (65.64 μg m−3). Similar regional patterns were observed for MDA8 O3 concentrations. The NC region recorded the maximum MDA8 O3 concentration of 127.41 μg m−3, representing a 38.4% increase over hourly O3 levels.
Under the InNr scenario, national average hourly O3 and MDA8 O3 concentrations in June increased by 2.63 µg m−3 and 7.87 µg m−3, respectively, compared to the BASE scenario, highlighting the positive impact of cropland Nr emissions on surface ozone formation. Regionally, NC and NW showed the highest enhancements in MDA8 O3 concentrations, with increases of 11.71 µg m−3 and 8.05 µg m−3, exceeding the national averages of 48% and 3%, respectively. In contrast, the SE, SW, NE, and TP regions displayed smaller increases, with MDA8 O3 remaining below 7.20 µg m−3. Regarding regional variation in hourly O3 concentrations, the largest increases were in the NW and TP regions, with enhancements of 3.34 µg m−3 and 3.03 µg m−3, respectively, followed by SW (2.59 µg m−3), NE (2.39 µg m−3), NC (1.76 µg m−3), and SE (1.19 µg m−3). These regional differences can be attributed primarily to variations in fertilization intensity. Sha et al. [36] reported that Nr emissions from fertilization during the planting season contributed to a 16% increase in MDA8 O3 concentrations in the BTH region. Notably, the regional increments in hourly O3 concentrations due to cropland Nr emissions differed significantly from those of MDA8 O3. For instance, while the NC region exhibited the largest increase in MDA8 O3, its hourly O3 increment was lower compared to other regions, such as NW, TP, SW, and NE. This discrepancy can be explained by the inhibitory effect of cropland Nr emissions on hourly O3 production in the NC region, where NO rapidly titrates O3 at night. In contrast, MDA8 O3, which reflects the maximum daily 8 h average ozone concentration, is more relevant to human health impacts and less affected by nocturnal titration processes.

3.4. Comparison with Previous Studies

The magnitudes of cropland NO and HONO emissions in this study were compared with estimates from previous studies employing bottom-up, top-down, or data-driven approaches [67,68,69,70,71,72,73,74,75,76]. The NO emission estimates estimated in our study were 0.66 Tg, falling within the range of 0.36–1.09 Tg reported by earlier research. However, simulated HONO emissions were approximately three times lower than those reported by Wu et al. [67]. This discrepancy likely arises from earlier statistical models lacking the detailed parameterization of soil temperature effects on HONO emissions, introducing greater uncertainty into HONO estimates.
A limited number of studies have been conducted to quantify the contribution of fertilizer-induced Nr emissions to regional O3 pollution, particularly in cropland-dominated areas where such emissions are closely linked to fertilization practices (Table 4). Existing studies have assessed the impact of NO and/or HONO emissions from agricultural soils on O3 formation. For instance, Lu et al. (2021) [27] utilized a mechanistic parameterization of soil NO emissions with multiple air quality models and found that cropland NO emissions contributed 3.7% to MDA8 O3 concentrations in the NCP. Similarly, Huang et al. [31] used the BFM and OSAT model to demonstrate that soil NO emissions contributed 5.7% to MDA8 O3 concentrations in June. However, Shen et al. [33] demonstrated that omitting soil NO emissions could lead to a reduction of more than 30% in O3 concentrations across various regions of China, which was 8 and 5 times higher than the estimates of Lu et al. [27] and Huang et al. [31], respectively. This discrepancy primarily arises from Shen et al. [33] underestimating the simulated O3 concentrations (50 µg m−3) in July 2017 under the BASE scenario compared to the O3 concentrations obtained by other studies (130 µg m−3).
Except for the single effect of NO to O3 formation, Sha et al. [36] assessed the combined influence of Nr (including NO and HONO) on O3 pollution. Their findings indicated that soil Nr emissions increased MDA8 O3 by 17.2% and 16.9% in the FWP and BTH regions, respectively, surpassing the effects of NO or HONO alone. In this study, cropland Nr emissions were found to contribute 8.0% and 9.2% to MDA8 O3 in China and NC, respectively, which were comparable to the findings of Tan et al. [15], who reported that soil Nr emissions increased MDA8 O3 by 10.1% and 9.7% in China and the NCP, respectively. However, these estimates were significantly lower than the 16.9% reported by Sha et al. [36]. These inconsistencies can be attributed to the lower cropland Nr emissions applied in our study due to a 12% reduction in nitrogen fertilizer inputs from 2018 to 2020 (https://www.stats.gov.cn/sj/ndsj/, last access: 28 November 2024). Variations in model parameterization schemes may also lead to discrepancies among studies. Therefore, to improve the accuracy of simulated cropland Nr emissions and their impact on O3 formation, there is an urgent need for the continuous and dynamic observations of Nr fluxes in agricultural areas to better validate and refine model outputs.

3.5. Limitations and Uncertainties

Although the major findings of this study highlight the contribution of cropland Nr emissions to surface ozone concentrations across different regions of China, substantial uncertainties remain in the current model estimates of cropland HONO emissions. For instance, the formation of cropland HONO is a complex process involving both abiotic and biotic pathways and is influenced by a multitude of factors such as soil type, soil acidity, soil temperature, and microbial activity. However, the FEST-C* model adopts simplified representations of these intricate processes. Specifically, HONO emissions are estimated based on NO emissions and adjusted using a water-filled pore space (WFPS) function. This function assumes a linear increase in HONO emissions when WFPS ≤ 0.10 and a linear decrease when 0.10 < WFPS ≤ 0.40 [40]. This approach fails to account for the nuanced interactions between soil moisture and temperature. For example, Wu et al. [59] demonstrated that HONO emissions are significantly affected by the combined effects of soil moisture and temperature, which exhibit a Gaussian distribution. Consequently, relying solely on soil moisture as an indicator may not accurately capture the dynamic variations in HONO emissions.
Additionally, the effects of microbial species and their denitrification intensities on HONO emissions are not effectively parameterized in the current FEST-C* model, which may increase the uncertainty in HONO estimates. Future research should prioritize optimizing the parameterization mechanisms for NO and HONO production by various denitrifying microbiomes within the FEST-C* model to enhance its predictive accuracy. Furthermore, manure application was also not incorporated in the cropland Nr emission simulations. Integrating detailed data on manure use from livestock farming into the FEST-C* model is essential to reduce uncertainties in NO and HONO estimations. Another critical limitation is the scarcity of comprehensive observational data for validating simulated NO and HONO emissions. Continuous field measurements of NO and HONO fluxes should be conducted to establish robust datasets for model validation. These efforts will help improve the reliability of simulated cropland Nr emissions and their contributions to regional ozone formation, thereby supporting the development of more effective air quality management and mitigation strategies.

4. Conclusions

Because of the continuous growth of the global population, the extensive application of fertilizers is necessary to ensure sufficient food production; however, this results in substantial Nr emissions during cropland planting, significantly impacting the regional air quality. This study presents a comprehensive analysis of cropland Nr emissions and their impact on O3 formation across different regions of China in June 2020, utilizing the enhanced process-based agroecological model (FEST-C*) integrated with the Eulerian air quality model (CMAQ). Fertilizer-driven total Nr emission were estimated at 1.26 Tg, with North China accounting for 43% of the total. Cropland Nr emissions contributed about 8% to the national monthly MDA8 O3 concentration, with localized increases exceeding 11.71 μg m−3 in agricultural hotspots. The region most impacted by cropland Nr emissions in terms of MDA8 O3 concentration was North China, followed by Northwest China, Southeast China, Southwest China, Northeast China, and the Tibetan Plateau. The contributions of cropland Nr emissions to regional MDA8 O3 in these regions ranges from 7% to 10%, reflecting the regional variability influenced by fertilization intensity, soil conditions, and climatic factors. Notably, cropland Nr emissions led to reductions in hourly O3 concentrations of 2–6 μg m−3 in southern North China and northern Southeast China, primarily during nighttime. This reduction was attributed to the extensive nocturnal titration of surface O3 by NO, resulting in the formation of nitrate radicals. Combined with previous studies, the impact of cropland Nr emissions on regional MDA8 O3 has been constrained to approximately 8%, within the range of 3% to 17%. These findings will offer valuable insights into developing strategies to balance agricultural production, fertilizer usage, and environmental pollution mitigation in China.

Author Contributions

Conceptualization, A.X., X.Z. and M.Z.; Methodology, X.Z. and M.Z.; Investigation, A.X. and X.Z.; Writing—original draft, M.Z.; Writing—review and editing, A.X. and X.Z.; Software, M.Z., C.G. and S.X.; Validation, A.X., X.Z., H.Z. and S.Z.; Funding acquisition: A.X. and X.Z. All authors have read and agreed to the published version of the manuscript.

Funding

This work was supported by the Youth Innovation Promotion Association of Chinese Academy of Sciences, China [No. 2022230], the National Natural Science Foundation of China [Nos. 42371154, 42171142, 42305171], the Talent Program of Chinese Academy of Sciences, the Natural Science Foundation of Jilin Province [No. YDZJ202301ZYTS237], and the National Key Research and Development Program of China [No. 2017YFC0212304].

Institutional Review Board Statement

Not applicable.

Data Availability Statement

All data will be made available on request.

Conflicts of Interest

The authors declared that they have no conflicts of interest.

References

  1. Ainsworth, E.A.; Yendrek, C.R.; Sitch, S. The effects of tropospheric ozone on net primary productivity and implications for climate change. Annu. Rev. Plant Biol. 2012, 63, 637–661. [Google Scholar] [CrossRef]
  2. Lefohn, A.S.; Malley, C.S.; Smith, L. Tropospheric ozone assessment report: Global ozone metrics for climate change, human health, and crop/ecosystem research. Elem. Sci. Anth. 2018, 6, 27. [Google Scholar] [CrossRef]
  3. Lu, X.; Zhang, L.; Wang, X. Rapid increases in warm-season surface ozone and resulting health impact in China since 2013. Environ. Sci. Technol. Lett. 2020, 7, 240–247. [Google Scholar] [CrossRef]
  4. Prather, M.; Zhu, X. Lifetimes and timescales of tropospheric ozone: Global metrics for climate change, human health, and crop/ecosystem research. Elem. Sci. Anthr. 2024, 12, 00112. [Google Scholar] [CrossRef]
  5. Atkinson, R. Atmospheric chemistry of VOCs and NOx. Atmos. Environ. 2000, 34, 2063–2101. [Google Scholar] [CrossRef]
  6. Rajabi, H.; Mosleh, M.H.; Mandal, P. Emissions of volatile organic compounds from crude oil processing–Global emission inventory and environmental release. Sci. Total Environ. 2020, 727, 138654. [Google Scholar] [CrossRef]
  7. Panchasara, H.; Samrat, N.H.; Islam, N. Greenhouse gas emissions trends and mitigation measures in Australian agriculture sector—A review. Agriculture 2021, 11, 85. [Google Scholar] [CrossRef]
  8. Zhang, Q.; Liu, P.; Wang, Y. Unveiling the underestimated direct emissions of nitrous acid (HONO). Proc. Nat. Acad. Sci. USA 2023, 120, e2302048120. [Google Scholar] [CrossRef]
  9. Cech, R.; Leisch, F.; Zaller, J.G. Pesticide use and associated greenhouse gas emissions in sugar beet, apples, and viticulture in Austria from 2000 to 2019. Agriculture 2022, 12, 879. [Google Scholar] [CrossRef]
  10. Koppmann, R.; Von Czapiewski, K.; Reid, S. A review of biomass burning emissions, part I: Gaseous emissions of carbon monoxide, methane, volatile organic compounds, and nitrogen containing compounds. Atmos. Chem. Phys. 2005, 5, 10455–10516. [Google Scholar]
  11. Oswald, R.; Behrendt, T.; Ermel, M. HONO emissions from soil bacteria as a major source of atmospheric reactive nitrogen. Science 2013, 341, 1233–1235. [Google Scholar] [CrossRef] [PubMed]
  12. Nie, W.; Ding, A.; Xie, Y.N. Influence of biomass burning plumes on HONO chemistry in eastern China. Atmos. Chem. Phys. 2015, 15, 1147–1159. [Google Scholar] [CrossRef]
  13. Theys, N.; Volkamer, R.; Müller, F. Global nitrous acid emissions and levels of regional oxidants enhanced by wildfires. Nat. Geosci. 2020, 13, 681–686. [Google Scholar] [CrossRef]
  14. Wolfe, A.H.; Patz, J.A. Reactive nitrogen and human health: Acute and long-term implications. Ambio 2002, 31, 120–125. [Google Scholar] [CrossRef]
  15. Tan, W.; Wang, H.; Su, J. Soil emissions of reactive nitrogen accelerate summertime surface ozone increases in the North China Plain. Environ. Sci. Technol. 2023, 57, 12782–12793. [Google Scholar] [CrossRef]
  16. Emmerling, C.; Krein, A.; Junk, J. Meta-analysis of strategies to reduce NH3 emissions from slurries in European agriculture and consequences for greenhouse gas emissions. Agronomy 2020, 10, 1633. [Google Scholar] [CrossRef]
  17. Wang, C.; Amon, B.; Schulz, K. Factors that influence nitrous oxide emissions from agricultural soils as well as their representation in simulation models: A review. Agronomy 2021, 11, 770. [Google Scholar] [CrossRef]
  18. Schindlbacher, A.; Zechmeister-Boltenstern, S.; Butterbach-Bahl, K. Effects of soil moisture and temperature on NO, NO2, and N2O emissions from European forest soils. J. Geophys. Res.-Atmos. 2004, 109, D17. [Google Scholar] [CrossRef]
  19. Chang, W.L.; Brown, S.S.; Stutz, J.; Middlebrook, A.M.; Bahreini, R.; Wagner, N.L. Evaluating N2O5 heterogeneous hydrolysis parameterizations for CalNex 2010. J. Geophys. Res.-Atmos. 2016, 121, 5051–5070. [Google Scholar] [CrossRef]
  20. Li, Y.; Wang, X.; Wu, Z. Atmospheric nitrous acid (HONO) in an alternate process of haze pollution and ozone pollution in urban Beijing in summertime: Variations, sources and contribution to atmospheric photochemistry. Atmos. Res. 2021, 260, 105689. [Google Scholar] [CrossRef]
  21. Wang, Y.; Wang, Y.; Li, Q. Soil Emissions of Reactive Oxidized Nitrogen Reduce the Effectiveness of Anthropogenic Source Control in China. Environ. Sci. Technol. 2024, 58, 21015–21024. [Google Scholar] [CrossRef]
  22. Bhattarai, H.R.; Wanek, W.; Siljanen, H.M.P. Denitrification is the major nitrous acid production pathway in boreal agricultural soils. Commun. Earth Environ. 2021, 2, 54. [Google Scholar] [CrossRef]
  23. Liu, S.; Lin, F.; Wu, S. A meta-analysis of fertilizer-induced soil NO and combined NO+ N2O emissions. Glob. Change Biol. 2017, 23, 2520–2532. [Google Scholar] [CrossRef]
  24. Wang, Y. Improved modelling of soil NOx emissions in a high temperature agricultural region: Role of background emissions on NO2 trend over the US. Environ. Res. Lett. 2021, 16, 084061. [Google Scholar] [CrossRef]
  25. Almaraz, M.; Bai, E.; Wang, C. Agriculture is a major source of NOx pollution in California. Sci. Adv. 2018, 4, eaao3477. [Google Scholar] [CrossRef]
  26. Sha, T.; Ma, X.; Zhang, H. Impacts of Soil NO x Emission on O3 Air Quality in Rural California. Environ. Sci. Technol. 2021, 55, 7113–7122. [Google Scholar] [CrossRef]
  27. Lu, X.; Ye, X.; Zhou, M. The underappreciated role of agricultural soil nitrogen oxide emissions in ozone pollution regulation in North China. Nat. Commun. 2021, 12, 5021. [Google Scholar] [CrossRef]
  28. Wang, Y.; Fu, X.; Wang, T. Large contribution of nitrous acid to soil-emitted reactive oxidized nitrogen and its effect on air quality. Environ. Sci. Technol. 2023, 57, 3516–3526. [Google Scholar] [CrossRef]
  29. Cui, X.; Guo, L.; Li, C. The total biomass nitrogen reservoir and its potential of replacing chemical fertilizers in China. Renew. Sustain. Energy Rev. 2021, 135, 110215. [Google Scholar] [CrossRef]
  30. Liu, X.; Tai, A.P.K.; Fung, K.M. Responses of surface ozone to future agricultural ammonia emissions and subsequent nitrogen deposition through terrestrial ecosystem changes. Atmos. Chem. Phys. 2021, 21, 17743–17758. [Google Scholar] [CrossRef]
  31. Huang, L.; Fang, J.; Liao, J. Insights into soil NO emissions and the contribution to surface ozone formation in China. Atmos. Chem. Phys. 2023, 23, 14919–14932. [Google Scholar] [CrossRef]
  32. Xue, C.; Ye, C.; Lu, K. Reducing Soil-Emitted Nitrous Acid as a Feasible Strategy for Tackling Ozone Pollution. Environ. Sci. Technol. 2024, 58, 9227–9235. [Google Scholar] [CrossRef]
  33. Shen, Y.; Xiao, Z.; Wang, Y. Impacts of agricultural soil NOx emissions on O3 over mainland China. J. Geophys. Res.-Atmos. 2023, 128, e2022D037986. [Google Scholar] [CrossRef]
  34. Wang, R.; Bei, N.; Wu, J. Cropland nitrogen dioxide emissions and effects on the ozone pollution in the North China plain. Environ. Pollut. 2022, 294, 118617. [Google Scholar] [CrossRef]
  35. Fan, M.Y.; Hong, Y.; Zhang, Y.L. Increasing nonfossil fuel contributions to atmospheric nitrate in urban China from observation to prediction. Environ. Sci. Technol. 2023, 57, 18172–18182. [Google Scholar] [CrossRef]
  36. Sha, T.; Yang, S.; Chen, Q. Large contributions of soil emissions to the atmospheric nitrogen budget and their impacts on air quality and temperature rise in North China. Atmos. Chem. Phys. 2024, 24, 8441–8455. [Google Scholar] [CrossRef]
  37. Rasool, Q.Z.; Zhang, R.; Lash, B. Enhanced representation of soil NO emissions in the Community Multiscale Air Quality (CMAQ) model version 5.0. 2. Geosci. Model. Dev. 2016, 9, 3177–3197. [Google Scholar] [CrossRef]
  38. Souri, A.H.; Choi, Y.; Jeon, W. Constraining NOx emissions using satellite NO2 measurements during 2013 DISCOVER-AQ Texas campaign. Atmos. Environ. 2016, 131, 371–381. [Google Scholar] [CrossRef]
  39. Rasool, Q.Z.; Bash, J.O.; Cohan, D.S. Mechanistic representation of soil nitrogen emissions in the Community Multiscale Air Quality (CMAQ) model v 5.1. Geosci. Model. Dev. 2019, 12, 849–878. [Google Scholar] [CrossRef]
  40. Luo, L.; Ran, L.; Rasool, Q.Z.; Cohan, D.S. Integrated modeling of US agricultural soil emissions of reactive nitrogen and associated impacts on air pollution, health, and climate. Environ. Sci. Technol. 2022, 56, 9265–9276. [Google Scholar] [CrossRef]
  41. Yienger, J.; Levy, H. Empirical model of global soil-biogenic NOx emissions. J. Geophys. Res.-Atmos. 1995, 100, 11447–11464. [Google Scholar] [CrossRef]
  42. Hudman, R.C.; Moore, N.E.; Mebust, A.K.; Martin, R.V.; Russell, A.R.; Valin, L.C.; Cohen, R.C. Steps towards a mechanistic model of global soil nitric oxide emissions: Implementation and space based-constraints. Atmos. Chem. Phys. 2012, 12, 7779–7795. [Google Scholar] [CrossRef]
  43. Ran, L.; Yuan, Y.; Cooter, E.; Benson, V.; Yang, D.; Pleim, J.; Wang, R.; Williams, J. An integrated agriculture, atmosphere, and hydrology modeling system for ecosystem assessments. Adv. Model. Earth Syst. 2019, 11, 4645–4668. [Google Scholar] [CrossRef]
  44. Iacono, M.; Delamere, S.; Mlawer, E. Radiative forcing by long-lived greenhouse gases: Calculations with the AER radiative transfer models. J. Geophys. Res.-Atmos. 2008, 113, D13. [Google Scholar] [CrossRef]
  45. Morrison, H.; Gettelman, A. A new two-moment bulk stratiform cloud microphysics scheme in the Community Atmosphere Model, version 3 (CAM3). Part I: Description and numerical tests. J. Clim. 2008, 21, 3642–3659. [Google Scholar] [CrossRef]
  46. Pleim, J.E. A combined local and nonlocal closure model for the atmospheric boundary layer. Part II: Application and evaluation in a mesoscale meteorological model. J. Appl. Meteorol. Clim. 2007, 46, 1396–1409. [Google Scholar] [CrossRef]
  47. Kain, J.S. The Kain–Fritsch convective parameterization: An update. J. Appl. Meteorol. 2004, 43, 170–181. [Google Scholar] [CrossRef]
  48. Pleim, J.E.; Xiu, A. Development and testing of a surface flux and planetary boundary layer model for application in mesoscale models. J. Appl. Meteorol. 1995, 34, 16–32. [Google Scholar] [CrossRef]
  49. Xu, K.M.; Randall, D.A. A semiempirical cloudiness parameterization for use in climate models. J. Atmos. Sci. 1996, 53, 3084–3102. [Google Scholar] [CrossRef]
  50. Jiang, Y.; Wang, S.; Xing, J.; Zhao, B.; Li, S.; Chang, X.; Zhang, S.; Dong, Z. Ambient fine particulate matter and ozone pollution in China: Synergy in anthropogenic emissions and atmospheric processes. Environ. Res. Lett. 2022, 17, 123001. [Google Scholar] [CrossRef]
  51. Xu, W.; Luo, X.; Pan, Y.; Zhang, L.; Tang, A.; Shen, J.; Liu, X. Quantifying atmospheric nitrogen deposition through a nationwide monitoring network across China. Atmos. Chem. Phys. 2015, 15, 12345–12360. [Google Scholar] [CrossRef]
  52. Zheng, B.; Cheng, J.; Geng, G. Mapping anthropogenic emissions in China at 1 km spatial resolution and its application in air quality modeling. Sci. Bull. 2021, 66, 612–620. [Google Scholar] [CrossRef]
  53. Crippa, M.; Guizzardi, D.; Muntean, M. Gridded emissions of air pollutants for the period 1970–2012 within EDGAR v4. 3.2. Earth Syst. Sci. Data 2018, 10, 1987–2013. [Google Scholar] [CrossRef]
  54. Yang, J.; Huang, X. 30 m annual land cover and its dynamics in China from 1990 to 2019. Earth Syst. Sci. Data 2021, 13, 3907–3925. [Google Scholar] [CrossRef]
  55. Ran, L.; Cooter, E.; Yang, D.; Benson, V.; Yuan, Y.P.; Hanna, A.; Garcia, V. User’s Guide for the Fertilizer Emission Scenario Tool for CMAQ (FEST-C) Version 1.4. Community Modeling and Analysis System. Available online: https://www.cmascenter.org/fest-c/ (accessed on 10 November 2024).
  56. Nachtergaele, F.; van Velthuizen, H.; Verelst, L.; Wiberg, D.; Henry, M.; Chiozza, F. Harmonized World Soil Database Version 2.0M. 2023. Available online: https://www.fao.org/soils-portal/data-hub/soil-maps-and-databases/harmonized-world-soil-database-v20/en/ (accessed on 23 November 2024).
  57. Wang, K.; Gao, C.; Wu, K. ISAT v2. 0: An integrated tool for nested-domain configurations and model-ready emission inventories for WRF-AQM. Geosci. Model. Dev. 2023, 16, 1961–1973. [Google Scholar] [CrossRef]
  58. Gan, C.; Li, B.; Dong, J. Atmospheric HONO emissions in China: Unraveling the spatiotemporal patterns and their key influencing factors. Environ. Pollut. 2024, 343, 123228. [Google Scholar] [CrossRef]
  59. Wu, D.M.; Xia, Y.L.; Hou, L.; Liu, M. The mechanisms of HONO emissions from soil: A review. Chin. J. Eco-Agric. 2018, 26, 190–194. [Google Scholar]
  60. Ermel, M.; Behrendt, T.; Oswald, R. Hydroxylamine released by nitrifying microorganisms is a precursor for HONO emission from drying soils. Sci. Rep. 2018, 8, 1877. [Google Scholar] [CrossRef]
  61. Song, Y.; Wu, D.; Ju, X. Nitrite stimulates HONO and NOx but not N2O emissions in Chinese agricultural soils during nitrification. Sci. Total Environ. 2023, 902, 166451. [Google Scholar] [CrossRef]
  62. Zhang, M.D.; Zhang, X.L.; Gao, C.; Zhao, H.M.; Zhang, S.C.; Xie, S.J.; Ran, L.M.; Xiu, A.J. Reactive nitrogen emissions from cropland and their dominant driving factors in China. Sci. Total Environ. 2025, 968, 178919. [Google Scholar] [CrossRef]
  63. Xue, C.; Ye, C.; Zhang, C. Evidence for strong HONO emission from fertilized agricultural fields and its remarkable impact on regional O3 pollution in the summer North China Plain. ACS Earth Space Chem. 2021, 5, 340–347. [Google Scholar] [CrossRef]
  64. Chen, W.; Guenther, A.B.; Jia, S. Synergistic effects of biogenic volatile organic compounds and soil nitric oxide emissions on summertime ozone formation in China. Sci. Total Environ. 2022, 828, 154218. [Google Scholar] [CrossRef]
  65. Song, X.; Li, X.B.; Yuan, B. Elucidating key factors in regulating budgets of ozone and its precursors in atmospheric boundary layer. NPJ Clim. Atmos. Sci. 2024, 7, 262. [Google Scholar] [CrossRef]
  66. Niu, Y.; Huang, X.; Wang, H.; Wang, S.; Lin, X.; Chen, Y. Effects of nighttime heterogeneous reactions on the formation of secondary aerosols and ozone in the Pearl River Delta. Sci. Bull. 2022, 67, 2060–2068. [Google Scholar] [CrossRef]
  67. Wu, D.; Zhang, J.; Wang, M.; An, J.; Wang, R.; Haider, H.; Ri, X.; Huang, Y.; Zhang, Q.; Zhou, F.; et al. Global and regional patterns of soil nitrous acid emissions and their acceleration of rural photochemical reactions. Geophys. Res. Atmos. 2022, 127, e2021D036379. [Google Scholar] [CrossRef]
  68. Wang, M.; Kroeze, C.; Strokal, M.; Ma, L. Reactive nitrogen losses from China’s food system for the shared socioeconomic pathways (SSPs). Sci. Total Environ. 2017, 605, 884–893. [Google Scholar] [CrossRef]
  69. Gu, B.; Ju, X.; Chang, J.; Ge, Y.; Vitousek, P.M. Integrated reactive nitrogen budgets and future trends in China. Proc. Natl. Acad. Sci. USA 2015, 112, 8792–8797. [Google Scholar] [CrossRef]
  70. Wu, H.; Wang, S.; Gao, L.; Zhang, L.; Yuan, Z.; Fan, T.; Huang, L. Nutrient-derived environmental impacts in Chinese agriculture during 1978–2015. Environ. Manag. 2018, 217, 762–774. [Google Scholar] [CrossRef]
  71. Cui, S.; Shi, Y.; Groffman, P.M.; Schlesinger, W.H.; Zhu, Y.G. Centennial-scale analysis of the creation and fate of reactive nitrogen in China (1910–2010). Proc. Natl. Acad. Sci. USA 2013, 110, 2052–2057. [Google Scholar] [CrossRef]
  72. Huang, Y.; Li, D. Soil nitric oxide emissions from terrestrial ecosystems in China: A synthesis of modeling and measurements. Sci. Rep. 2014, 4, 7406. [Google Scholar] [CrossRef]
  73. Lin, J.; Khanna, N.; Liu, X.; Teng, F.; Wang, X. China’s non-CO2 greenhouse gas emissions: Future trajectories and mitigation options and potential. Sci. Rep. 2019, 9, 16095. [Google Scholar] [CrossRef]
  74. Xu, P.; Chen, A.; Houlton, B.Z.; Zeng, Z.; Wei, S.; Zhao, C.; Zheng, Y. Spatial variation of reactive nitrogen emissions from China’s croplands codetermined by regional urbanization and its feedback to global climate change. Geophys. Res. Lett. 2020, 47, e2019GL086551. [Google Scholar] [CrossRef]
  75. Shen, Y.; Xiao, Z.; Wang, Y. Multisource remote sensing based estimation of soil NOx emissions from fertilized cropland at high-resolution: Spatio-temporal patterns and impacts. J. Geophys. Res.-Atmos. 2022, 127, e2022JD036741. [Google Scholar] [CrossRef]
  76. Ma, R.; Yu, K.; Xiao, S.; Liu, S.; Ciais, P.; Zou, J. Data-driven estimates of fertilizer-induced soil NH3, NO and N2O emissions from croplands in China and their climate change impacts. Glob. Change Biol. 2022, 28, 1008–1022. [Google Scholar] [CrossRef]
Figure 1. Schematic diagram of this study.
Agriculture 15 00612 g001
Figure 2. (a) Regional divisions and spatial distribution of cropping systems in China and (b) the percentage of nitrogen fertilizer consumption (FC) and cultivated area (CA) across various regions.
Agriculture 15 00612 g002
Figure 3. Spatial distribution of (a) NO emission intensities, (b) HONO emission intensities, and (c) nitrogen fertilizer consumption for croplands in China during 2020.
Agriculture 15 00612 g003
Figure 4. Monthly variations in NO and HONO emissions, nitrogen fertilizer consumption, soil temperature, and soil moisture in China during 2020.
Agriculture 15 00612 g004
Figure 5. Spatial distributions of simulated and observed hourly O3 and MDA8 O3 with and without considering cropland Nr emissions across China in June 2020.
Agriculture 15 00612 g005
Figure 6. Temporal variations in simulated and observed hourly O3 and MDA8 O3 with and without cropland Nr emissions in some agriculture-dominated cities of China during June 2020.
Agriculture 15 00612 g006
Figure 7. Spatial distribution of ∆O3 (a) and ∆MDA8 O3 (b) with and without cropland Nr emissions, along with ∆O3 during daytime (c) and nighttime (d) across China in June 2020. Red boxes emphasize the critical areas where hourly O3 decreases due to cropland Nr emissions.
Agriculture 15 00612 g007
Figure 8. (a) Monthly diurnal variations in observed ozone concentrations and simulated cropland NO and HONO emissions in southern NC of China during June and (b) the major chemical transformations among surface ozone and cropland Nr species at nighttime.
Agriculture 15 00612 g008
Table 1. Model configurations and inputs for the WRF-CMAQ model.
CategoriesDescriptionSchemes and Data
DomainGrid numbers190 (x) × 170 (y)
Horizontal resolution27 km
Vertical layers30 levels
Physics parameterizationShortwave radiationRRTMG [44]
Longwave radiationRRTMG [44]
Cloud microphysicsMorrison [45]
Planetary boundary layerACM2 [46]
CumulusKain–Fritsch [47]
SurfacePleim–Xiu [48]
Land surfacePleim–Xiu LSM [48]
ICloudXu–Randall [49]
Chemistry schemeAerosol mechanismAERO6
Gas-phase chemistryCB6
EmissionsAnthropogenic emissionMEIC (2020) [52], EDGAR (2018) [53]
Dust emissionForoutan
Sea-salt emissionGong
Input dataMeteorological ICs and BCsFNL
Chemical ICs and BCsWACCM
Table 2. Cropland Nr emissions (Tg) across different regions of China during 2020.
RegionNOHONONr
Northeast China (NE)0.060.070.13
Northwest China (NW)0.060.030.09
North China (NC)0.240.300.54
Southeast China (SE)0.190.100.29
Southwest China (SW)0.090.070.16
Tibetan Plateau (TP)0.020.030.05
Total China0.660.601.26
Table 3. Monthly average concentrations (µg m−3) of hourly O3 and MDA8 O3 with and without cropland Nr emissions and the contribution (%) of cropland Nr emissions to hourly O3 and MDA8 O3 across different regions of China in June 2020.
RegionHourly O3MDA8 O3
BASEInNrInNr-BASE(InNr-BASE)/BASEBASEInNrInNr-BASE(InNr-BASE)/BASE
NE65.6668.052.393.6591.0097.716.717.37
NW78.3981.743.344.2794.31102.368.058.54
NC89.0390.781.761.97127.41139.1211.719.19
SE65.6466.831.191.8192.3199.457.147.73
SW70.6273.212.593.6686.9093.716.817.84
TP86.9589.983.033.4995.40102.206.807.13
Total China77.0079.632.633.4297.89105.767.877.97
Table 4. Comparison of the contributions of soil and cropland Nr emissions to MDA8 O3 across different regions of China in this study and previous studies.
SpeciesSourcesMethodsRegionsSimulation PeriodsContributions to MDA8 O3 EnhancementReferences
NOSoilBDSNP + CAMxChinaJune 20185.7%[31]
YL95 +
WRF-Chem
NW,
NC,
NE,
SW
July 201732.5%,
38.3%,
41.9%,
31.2%
[33]
CroplandBDSNP +
GEOS-Chem
NCPJuly 20173.7%[27]
BDSNP +
WRF-Chem
NCP,
BTH
24 May−7 June 20205.4%,
4.2%
[34]
Nr
(NO + HONO)
SoilBDISNP +
GEOS-Chem
China,
NCP
June−July 20199.7%,
10.1%
[15]
BDISNP +
WRF-Chem
BTH,
FWP
July 201816.9%,
17.2%
[36]
CroplandFEST-C* +
CMAQ
China,
NC
June 20208.0%,
9.2%
This study
Disclaimer/Publisher’s Note: The statements, opinions and data contained in all publications are solely those of the individual author(s) and contributor(s) and not of MDPI and/or the editor(s). MDPI and/or the editor(s) disclaim responsibility for any injury to people or property resulting from any ideas, methods, instructions or products referred to in the content.

