1. Introduction
Food inflation and the turbulence it creates in Türkiye, an important agricultural country, put political decision-makers in a difficult position when formulating solutions. The country has undergone a long transition to a market economy, yet non-market interventions continue to cause significant food price volatility. Furthermore, the large gap between farmgate prices and market prices signals an unsustainable agricultural sector. The increase in agricultural input prices in developing countries, including Türkiye, and the extent to which this is reflected in food prices are among the key concerns of both consumers and policymakers.
Countries transitioning to a market economy and developing nations face similar challenges due to globalization. While trying to ensure food security and reduce the proportional share of food expenditures in household income, these countries must also tackle domestic sectoral inefficiencies and external shocks. External factors, such as expanding foreign trade, global environmental changes, extreme weather conditions, geopolitical conflicts, and oil price fluctuations, have forced countries to adopt more resilient agricultural policies [
1,
2]. Additionally, shifting consumption preferences for cereals have intensified these challenges. The increasing use of crops for biofuels, the rising demand for cereals in animal feed, and the growing dependence on agricultural chemicals and energy inputs to enhance productivity have further amplified price volatility [
3,
4].
A significant portion of the rise in domestic food prices in Türkiye is attributed to increases in the import prices of agricultural raw materials and global market fluctuations. Another contributing factor is the rise in international agricultural commodity prices, which increases the opportunity cost of domestic agricultural production [
5]. With Türkiye’s recent economic growth, rising national income and expanding domestic demand have further fuelled the demand for food products. Between 2004 and 2015, the average annual increase in food prices in Türkiye was 9.51%, exceeding the average inflation rate of 8.31% during the same period. In 2007, 2014, and 2015, food prices increased by approximately three percentage points above the overall inflation rate [
6]. All these above-mentioned factors may result in asymmetric impacts on agricultural prices. Asymmetric price impact refers to a market phenomenon where prices do not adjust symmetrically to positive and negative cost shocks. In other words, price increases in input costs or wholesale prices are passed on to consumers more quickly or fully than price decreases, leading to an imbalance in price adjustments [
7,
8,
9].
Addressing these issues and determining effective intervention points requires time series analysis based on macroeconomic data [
10]. The macroeconomic indicators relevant to this study fall within the category of essential goods, such as agriculture and food, where frequent market interventions are observed. Governments implement policies to stabilize prices in response to shifting economic conditions, geopolitical risks, inflationary pressures, and market expectations [
11]. However, while these policies aim to prevent sharp price fluctuations, they often result in artificial market conditions that may exacerbate asymmetric price effects [
12].
This study examines the wheat market, a sector frequently subject to state intervention, as wheat accounts for 60.6% of cereal production in Türkiye. Although wheat has low added value, cereal products still contribute 10.5% to the total agricultural output [
13]. Additionally, a significant portion of agricultural employment is tied to cereal production, making it crucial for rural development and economic stability.
Among cereals, barley is one of the primary substitutes for wheat, with a cultivation area covering 28.4% of Türkiye’s agricultural land. Together, wheat and barley production constitute a substantial portion of Türkiye’s agricultural economy. The key factors influencing wheat prices include historical price trends, wheat production volume, barley prices, diesel prices, and DAP fertilizer prices. To determine which factors have the greatest impact, time series analysis was applied.
To capture the asymmetric nature of cereal price volatility, this study employs a Vector Autoregressive (VAR) model. The findings offer valuable insights for policymakers, as Türkiye faces rising domestic food prices and must develop effective strategies to manage its agricultural policies while mitigating the adverse effects of global and domestic economic factors. Understanding the causes of price volatility in essential agricultural products and identifying both individual and combined effects of agricultural inputs are critical starting points for policy formulation.
This study contributes to the literature in three key areas: behavioural, technical, and policy perspectives. Unlike previous studies that use crude oil prices as agricultural input parameters, this study focuses on diesel and fertilizer prices to address the lack of behavioural variables in time series models. The importance of these specific input costs has been highlighted in recent research. For instance, the author of [
14] analyses the impact of fertilizer and fuel price fluctuations on the profitability of selected agricultural crops and emphasizes their significant role in shaping agricultural production costs. However, the direct effects of diesel price changes on agricultural price dynamics remain underexplored, which this study aims to address. Additionally, unlike previous studies that primarily focus on causality between variables or the effects of lagged values, this study investigates the dual effects of explanatory variables. This approach allows for a more comprehensive understanding of how multiple agricultural input factors interact simultaneously. The use of impulse response functions in this study further strengthens its contribution by analysing dynamic interactions between variables and identifying both symmetric and asymmetric relationships in price transmission mechanisms. The importance of asymmetric price transmission in agricultural markets has been widely discussed in the literature. The authors of [
15] examine asymmetric price transmission between agricultural input and output prices in Greece, utilizing impulse response functions to assess the impact of price shocks. Their findings confirm that price increases and decreases do not transmit symmetrically, which is a key concern for policymakers. This study builds upon their work by extending the analysis to diesel and fertilizer prices in the Turkish agricultural market, thereby providing new empirical insights into input price asymmetries and their implications for agricultural sustainability. By integrating behavioural input cost variables, analysing dual explanatory variable effects, and employing impulse response functions to assess price transmission asymmetries, the current study contributes to filling existing gaps in the agricultural economic literature.
Furthermore, the sustainability of agriculture in Türkiye is closely linked to agricultural input prices. This study tests the hypothesis that macroeconomic policies contribute to inflationary pressures, that agricultural prices do not provide sufficient incentives for producers, and that agricultural production is not sustainable under current conditions. Additionally, it examines whether agricultural input prices have symmetric effects on wheat prices. The model developed in this study allows us to test whether positive input price shocks have a stronger impact on wheat prices than negative shocks.
H1. The amount of wheat production in Türkiye is dependent on wheat prices.
H2. Agricultural input prices have a symmetrical effect on wheat prices.
H3. Positive input price shocks have a stronger effect on wheat prices compared to negative shocks.
In light of these multifaceted challenges, this study seeks to explore the asymmetric effects of global and national factors on domestic farmgate prices in Türkiye. By focusing on key input prices—such as diesel, fertilizers, and substitute crop prices—this research aims to provide a more nuanced understanding of price dynamics in the agricultural sector. Using a VAR model, this study will examine whether positive input price shocks have a stronger influence on wheat prices compared to negative shocks. This analysis will offer new insights into the behavioural and structural factors driving food inflation in Türkiye and help inform evidence-based policy recommendations.
2. Materials and Methods
Time series data obtained from FAOSTAT and the Turkish Statistical Institute were used as the study material. As the main determiners of wheat price, wheat production amount, diesel price, and fertilizer price were accepted. As an advantage offered by the VAR model, the price of barley as a substitute for wheat was added to the model. The price of wheat and barley per ton, the price of fertilizer per ton, the price of diesel per litre, and the amount of barley production in tons were used, and the log-transformed data of 1980–2023 were analysed. The sources, related time periods, and units of the data used in this research are shown in
Table 1.
When agricultural product prices and the prices of wheat, which are also the subject of the study, are examined in the historical process, it will be seen that they result from the past values of the series itself and/or random shocks. However, as agricultural production displays a behavioural characteristic, it is also dependent on the changes in other series as well as its own dynamics. Traditionally, if section data are studied in econometrics, it is possible to reach a common solution with simultaneous equation models. However, the requirement that a common variable must be present for the solution of equation systems makes it impossible to run many analyses. In a VAR model, this does not pose a problem, and the model enables multivariate analyses within the time series econometrics. The VAR model is technically supported by many studies as well. However, the selection reason of the model for this study was due to its suitability in capturing the dynamic interrelationships among multiple time series variables, which aligns with the core objectives of this research [
16,
17]. The VAR model allows for a comprehensive examination of both the short-term and long-term causal relationships between wheat prices, agricultural input prices (such as diesel and fertilizer), and other relevant variables. This method facilitates the investigation of impulse response functions and variance decompositions, which are essential for understanding asymmetric price effects in agricultural markets. The selection of a VAR model was not arbitrary but was driven by the specific research questions posed in this study. One of the key knowledge gaps in the existing literature pertains to the dual effects of explanatory variables, which our study aims to address through a robust methodological approach. By focusing on the interactions between agricultural input prices and wheat prices, our research offers valuable insights into the complexities of agricultural price dynamics. Importantly, the use of a VAR model also enables us to assess both direct and indirect effects, a critical contribution to the literature that enhances the precision of policy recommendations aimed at achieving sustainable agricultural development. Through the application of the VAR model, this study provides a more nuanced understanding of how economic, environmental, and policy factors interact to shape wheat prices, thereby addressing both theoretical and practical gaps in the existing research.
There is a large body of literature investigating research questions and hypotheses similar to those used in the current study. For instance, the different variables include global and national factors. Energy prices, exchange rates, climate change impacts, and oil prices are some of the variables examined in various studies. With the effect of globalization, countries have become much closer to each other in terms of foreign trade. Increased trade volume has increased the effects of international problems on domestic issues. Global and national factors can impact domestic food prices by affecting the cost of production as well as the demand and supply of food products [
10]. In the literature, it is accepted that oil prices are an inducing factor for agricultural product prices. It is recognized that oil prices are in a linear relationship with food or agricultural product prices in models established in various studies [
18,
19]; some researchers have suggested that oil prices, for example, show asymmetric characteristics and that models established with the assumption that they have symmetric effects will not be valid [
11,
20,
21,
22,
23,
24,
25]. Accordingly, asymmetric effects may arise from costs in resource allocation, uncertainties, price and wage rigidities, characteristics of the lax competition market, the stocking habits of retailers in the markets, and different interventions of governments in price increases. In the presence of an asymmetric effect, a prominent issue is whether increases in agricultural input prices will disrupt agricultural production. Studies researching the importance of reducing the difference between farmgate prices and market prices through structural policies or policy changes may come to the agenda. A similar asymmetric impact was discovered by the authors of [
26]. They found that positive shock to oil rents leads to a negative shock to industrial value added, indicating the existence of unidirectional causality. Some researchers have suggested that it is commodity prices that trigger oil prices. Ref. [
3] investigated the role of speculation in driving crude oil price variation after controlling for other influencing factors. The crude oil price shocks were triggered by agricultural commodity markets such as maize and wheat. In addition, an interconnection was found between crude oil and these commodity markets induced by ethanol production. Ref. [
27] evaluated the price transmission from world oil prices to basic agricultural commodity prices (maize, soybeans, and wheat) using weekly data from 1994 to 2010 and used both linear and non-linear Granger causality methods to determine the causality links between these variables. In the linear Granger causality analysis performed, it was revealed that oil and agricultural commodity prices did not cause one another, and the non-linear Granger causality test revealed that there were non-linear causality relationships between oil and agricultural commodity prices. It was stated that oil prices led to a non-linear causality toward corn and soybeans. Although the study by the author of [
27] did not address the substitution of products, it evaluated different products with oil prices [
28]. One of the researchers who argued that the inflationary effects of goods and input markets other than crude oil prices are also effective on global food prices investigated domestic food prices by econometric time series analysis, using Wavelet Coherence, Quantile-on-Quantile Regression (QQR), and Granger Causality in Quantiles (GCQs). It was found that food prices have major impacts on inflation increases. The researchers stressed the importance of exchange rate pricing on agricultural inputs. They state that an important concern is lowering the country’s risk to stabilize foreign exchange rates and boost international investment inflows. In our study, diesel prices were used instead of oil prices in order to include behavioural effects in the analysis. There is also literature explaining the deficiency at this point. In fact, crude oil series, influenced by non-agricultural uses, can obscure behavioural effects. In contrast, diesel prices provide an indicator of energy costs. The authors of [
29] stress the effects of diesel prices on changes in agricultural commodity prices in Bulgaria. Their studies include retail prices of some agricultural commodities, rather than farmgate product prices, such as cow’s milk and chicken eggs, which improves accuracy. Likewise, [
30] reported similar views.
Stating the importance of fertilization in meeting global food needs, the authors of [
31] proposed a new method by evaluating long-term regional sustainable nitrogen inputs with macroeconomic data; they derived a response function with the model they obtained and stated that they contributed to the determination of the most appropriate fertilization amount globally. They contributed to domestic land management with the macroeconomic data they used. Input use in agricultural production is important due to both the nature of production and ensuring the access of the increasing population to basic food resources, and it has become inevitable to use them. However, the increasing need for food due to the above-mentioned reasons and both the use of agricultural inputs and the fact that the raw material prices required to produce them have become dependent on the developments in the global economy explains the importance of both global and national factors. In the present study, fertilizer input was included in the analyses to emphasize its importance. Studies explaining the importance of fertilization are carried out in various geographies. Ref. [
32] investigates the reason why the global fertilizer market is particularly vulnerable to supply shocks and suggests that international conflicts affect the global fertilizer distribution through foreign trade. Especially the export restrictions have had serious impacts on a number of vulnerable countries: Mongolia, trapped between Russian and Chinese policies, has seen 98% of its fertilizer supply restricted, Nicaragua 80%, Ecuador 74%, Côte d’Ivoire 63%, Cameroon 60%, and Azerbaijan 43%, among others. In fact, we understand that fertilization, which seems important on a microscale, creates a price squeeze on the global side.
One of the researchers who suggested that changes in agricultural input prices had structural consequences [
33], explained in their model, using the panel regression technique, that price spikes in 2007–2008, 2010–2011, and 2021–2022 led to a decrease in the number of people gaining under USD 3,20 daily, in underdeveloped countries; however, they suggested that rising food prices led to an increase in demand for unskilled labour. For this reason, they suggested that the demand for labour and other agricultural inputs should be carefully studied to promote short-term agricultural supply responses.
The use of agricultural products in producing energy is also a subject affecting food prices in many aspects. The authors of [
34], in their nationwide study, examined the effects of market factors on U.S. food prices in a cointegration framework. The study, by using the Johansen multivariate cointegration test and a vector error-correction model, focuses on the assessment of the short- and long-run linkages between changes in U.S. food prices and changes in prices of energy and agricultural commodities, ethanol production, and exchange rates. In the causal linkages (short-run dynamics), food prices are negatively correlated with lagged food prices and exchange rates but positively correlated with commodity prices. Commodity prices are negatively correlated with exchange rates, but they are positively correlated with food prices and lagged commodity prices. Unlike the long-run results, however, energy prices are found to have little influence on food and commodity prices. The study reported that the food price is significantly affected by lagged changes in commodity prices, which are also influenced by the lagged changes in food prices. The above-mentioned studies provide clues about asymmetric price transmission. Meyer and the authors of [
9] produced a paper to support the current study. The authors of [
9] underscore that, while much research has focused on asymmetric price transmission, there remains a gap regarding the investigation of the dual effects of explanatory variables on price formation. Their review highlights the need for studies that examine both direct and indirect (dual) influences, supporting our claim that further research on dual effects is essential for a comprehensive understanding of agricultural price dynamics [
9].
It is a common phenomenon that time series must be stationary so that econometrically significant relationships between variables in time series analyses can be obtained. The most significant assumption in a regression analysis including time series data is that the time series handled is stationary. Regarding general terms, if its mean value and variance are constant in time and the covariance value between two periods depends not on the main period when this covariance is calculated but on the distance between the two periods, this time series is stationary [
35]. A time series with these characteristics is known as weakly stationary. If not the first two moments of a time series (that is, the mean and variance) do not show a change in time, but all moments do, the series is definitely stationary. The difference is taken if the variables are non-stationary, and the series are rendered stationary. As the co-transformation data between data disappear through taking the difference, inferences are made through action–reaction functions and causality analyses rather than evaluations in the classical regression analysis. Although various methods have been developed to understand the stationarity of series, the Augmented Dickey–Fuller (ADF) and the Phillips–Perron tests stand out with their superior aspects [
36].
The most basic autoregressive model, which shows the difference between both sides of the Dickey–Fuller equations, the model to which the cutoff effect and deterministic trend effect are added, and the expanded model obtained through the inclusion of lagged values of the dependent variable in the model are presented in Equations (1)–(3) below.
In the equation,
shows the time series whose stationarity is tested,
refers to the coefficients that determine whether there is a systematic trend in the time series, and
expresses the random error term. In other words,
is a series with a zero mean and
variance of random variables with independent and normal distribution. The hypotheses to be established in the investigation of the stationarity of
Yt are as follows:
If
, the
Yt time series approximates a stationary time series when t is
. If
, the time series is not stationary. Another method for understanding if a time series is stationary or not is the Phillips–Perron test. Along with the development of times series theory, new models and tests have been/are being developed to repair the faulty aspects of each model. In the Dickey–Fuller test, it is assumed that the distribution of random errors (shocks) is statistically independent and has a constant variance. In other words, it is assumed that there is no autocorrelation between shocks. Phillips–Perron (PP) developed a new non-parametric test for unit roots. As in the ADF test, the PP test can be developed for three different regression models. However, the simplest model is to be presented here:
The main problem in the use of the ADF test is the selection of the lag length. The power and dimension properties of the ADF test are rather sensitive to the number of lags included in the model. Here, the aim is to include error terms in the model that would be sufficient to eliminate autocorrelation. The methods used in determining the appropriate lag number in autoregressive processes are methods such as the Akaike information criterion (AIC), the Schwart information criterion (SIC), and the Hannan–Quin (HQ) information criterion. The AIC and SIC criteria are the methods used the most in practice. In order to determine the appropriate lag number, the AIC and SIC information criteria should have the smallest values. In this study, these criteria were considered. The
VAR model was developed by the author of [
37], and the model is based on the Granger causality test. If there are two internal variables in the model, each variable is associated with the lag values until a certain period of both itself and the other internal variables. As stated in [
38], the general form of the VAR (p) model with a
k variable and
p lag is as follows:
In Equation (6), and are error terms. The lagged values of X1t affect X2t′, while the lagged values of X2t affect X1t. In this model, there are only lagged values on the right side of the equations, and parameter estimations can be made with the least squares method.
The following equation system can be examined to better explain our model, whose theoretical framework is drawn. If x
1,t =whprice
t, x
2,t =whpr
t, x
3,t =bapr
t, x
4,t =dappr
t, and x
5,t = dieselpr
t, the reduced-form VAR(2) model is given as follows:
where
ai represents the intercept for equation
i,
aij,k is the coefficient on the
jth variable at lag
k in equation
i, and
εi,t is the white noise error term for equation
i. Expanding each equation explicitly for our variables, a new equation system is given in Equation (8). The equation for lwhprice is as follows:
| lwhpricet = a1 + b11,1lwhpricet−1+ b12,1lwhprt−1 + b13,1lbaprt−1 + b14,1ldapprt−1 + b15,1ldieselprt−1 + b11,2lwhpricet−2 + b12,2lwhprt−2 + b13,2lbaprt−2 + b14,2ldapprt−2 + b15,2ldieselprt−2 + ε1,t | (8) |
| The equation for lwhpr is as follows: |
| lwhprt = a2 + b21,1lwhpricet−1+ b22,1lwhprt−1 + b23,1lbaprt−1 + b24,1ldapprt−1 + b25,1ldieselprt−1 + b21,2lwhpricet−2 + b22,2lwhprt−2 + b23,2lbaprt−2 + b24,2ldapprt−2 + b25,2ldieselprt−2 + ε2,t |
| The equation for lbapr is as follows: |
| lbaprt = a3 + b31,1lwhpricet−1+ b32,1lwhprt−1 + b33,1lbaprt−1 + b34,1ldapprt−1 + b35,1ldieselprt−1 + b31,2lwhpricet−2 + b32,2lwhprt−2 + b33,2lbaprt−2 + b34,2ldapprt−2 + b35,2ldieselprt−2 + ε3,t |
| The equation for ldappr is as follows: |
| ldapprt = a4 + b41,1lwhpricet−1+ b42,1lwhprt−1 + b43,1lbaprt−1 + b44,1dapprt−1 + b45,1ldieselprt−1 + b41,2lwhpricet−2 + b42,2lwhprt−2 + b43,2lbaprt−2 + b44,2ldapprt−2 + b45,2ldieselprt−2 + ε4,t |
| The equation for ldieselpr is as follows: |
| ldieselprt = a5 + b51,1lwhpricet−1+ b52,1lwhprt−1 + b53,1lbaprt−1 + b54,1dapprt−1 + b55,1ldieselprt−1 + b51,2lwhpricet−2 + b52,2lwhprt−2 + b53,2lbaprt−2 + b54,2ldapprt−2 + b55,2ldieselprt−2 + ε5,t |
For a constant and trend VAR model, when a deterministic time trend is added, a new equation system is provided in Equation (9). The equation for lwhprice is as follows:
| lwhpricet = a1 + δt + b11,1lwhpricet−1+ b12,1lwhprt−1 + b13,1lbaprt−1 + b14,1ldapprt−1 + b15,1ldieselprt−1 + b11,2lwhpricet−2 + b12,2lwhprt−2 + b13,2lbaprt−2 + b14,2ldapprt−2 + b15,2ldieselprt−2 + ε1,t | (9) |
| The equation for lwhpr is as follows: |
| lwhprt = a2 + δt + b21,1lwhpricet−1+ b22,1lwhprt−1 + b23,1lbaprt−1 + b24,1ldapprt−1 + b25,1ldieselprt−1 + b21,2lwhpricet−2 + b22,2lwhprt−2 + b23,2lbaprt−2 + b24,2ldapprt−2 + b25,2ldieselprt−2 + ε2,t |
| The equation for lbapr is as follows: |
| lbaprt = a3 + δt + b31,1lwhpricet−1+ b32,1lwhprt−1 + b33,1lbaprt−1 + b34,1ldapprt−1 + b35,1ldieselprt−1 + b31,2lwhpricet−2 + b32,2lwhprt−2 + b33,2lbaprt−2 + b34,2ldapprt−2 + b35,2ldieselprt−2 + ε3,t |
| The equation for ldappr is as follows: |
| ldapprt = a4 + δt + b41,1lwhpricet−1+ b42,1lwhprt−1 + b43,1lbaprt−1 + b44,1dapprt−1 + b45,1ldieselprt−1 + b41,2lwhpricet−2 + b42,2lwhprt−2 + b43,2lbaprt−2 + b44,2ldapprt−2 + b45,2ldieselprt−2 + ε4,t |
| The equation for ldieselpr is as follows: |
| ldieselprt = a5 + δt + b51,1lwhpricet−1+ b52,1lwhprt−1 + b53,1lbaprt−1 + b54,1dapprt−1 + b55,1ldieselprt−1 + b51,2lwhpricet−2 + b52,2lwhprt−2 + b53,2lbaprt−2 + b54,2ldapprt−2 + b55,2ldieselprt−2 + ε5,t |
where “δ
t” represents the deterministic trend component.
3. Results
The logarithmic wheat price (lwhprice), logarithmic wheat production amount (lwhpr), logarithmic barley price (lbapr), logarithmic fertilizer price (ldappr), and logarithmic diesel price (ldieselpr) were accepted as explanatory variables. EViews 12 software was employed for VAR analysis, and the stationarity analyses of the series were performed first.
To assess the stationarity of the series after applying first-order differencing, the Augmented Dickey–Fuller (ADF) and Phillips–Perron (PP) tests were conducted. The test results and first-order differencing for the model with a constant and trend specification are presented in
Table 2a,b.
The series having a unit root shows that it is not stationary. Whether the variables of lwhprice, lwhprdamnt, lbaprice, ldapprice, and ldieselprice had a unit root at the logarithmic level, that is, whether they had a stationary structure and whether they showed a distribution around a certain mean value, was tested through the ADF and PP tests. As a result of the tests applied, it was seen that none of the variables were stationary at their logarithmic levels and that they were stationary at the first difference in logarithmic values (∆). The significance levels of the coefficients were lower than critical values (1%, 5%, and 10%).
In the case of faulty determination of lag length, inconsistent results from these two analyses emerge in action–reaction analyses and variance discrimination stages. If the lag length is higher than it should be, it may increase the mean error squares of estimations. In addition, the probability of parameter estimation variance to be higher can emerge. If the lag length is calculated as smaller than it should be, error terms with autocorrelation may occur [
39]. As can be seen in
Table 3, both criteria considered in this study (AIC and SIC) suggested a lag length of 2. At lower lag lengths, heteroskedasticity and serial correlation problems were encountered in the residues of the model.
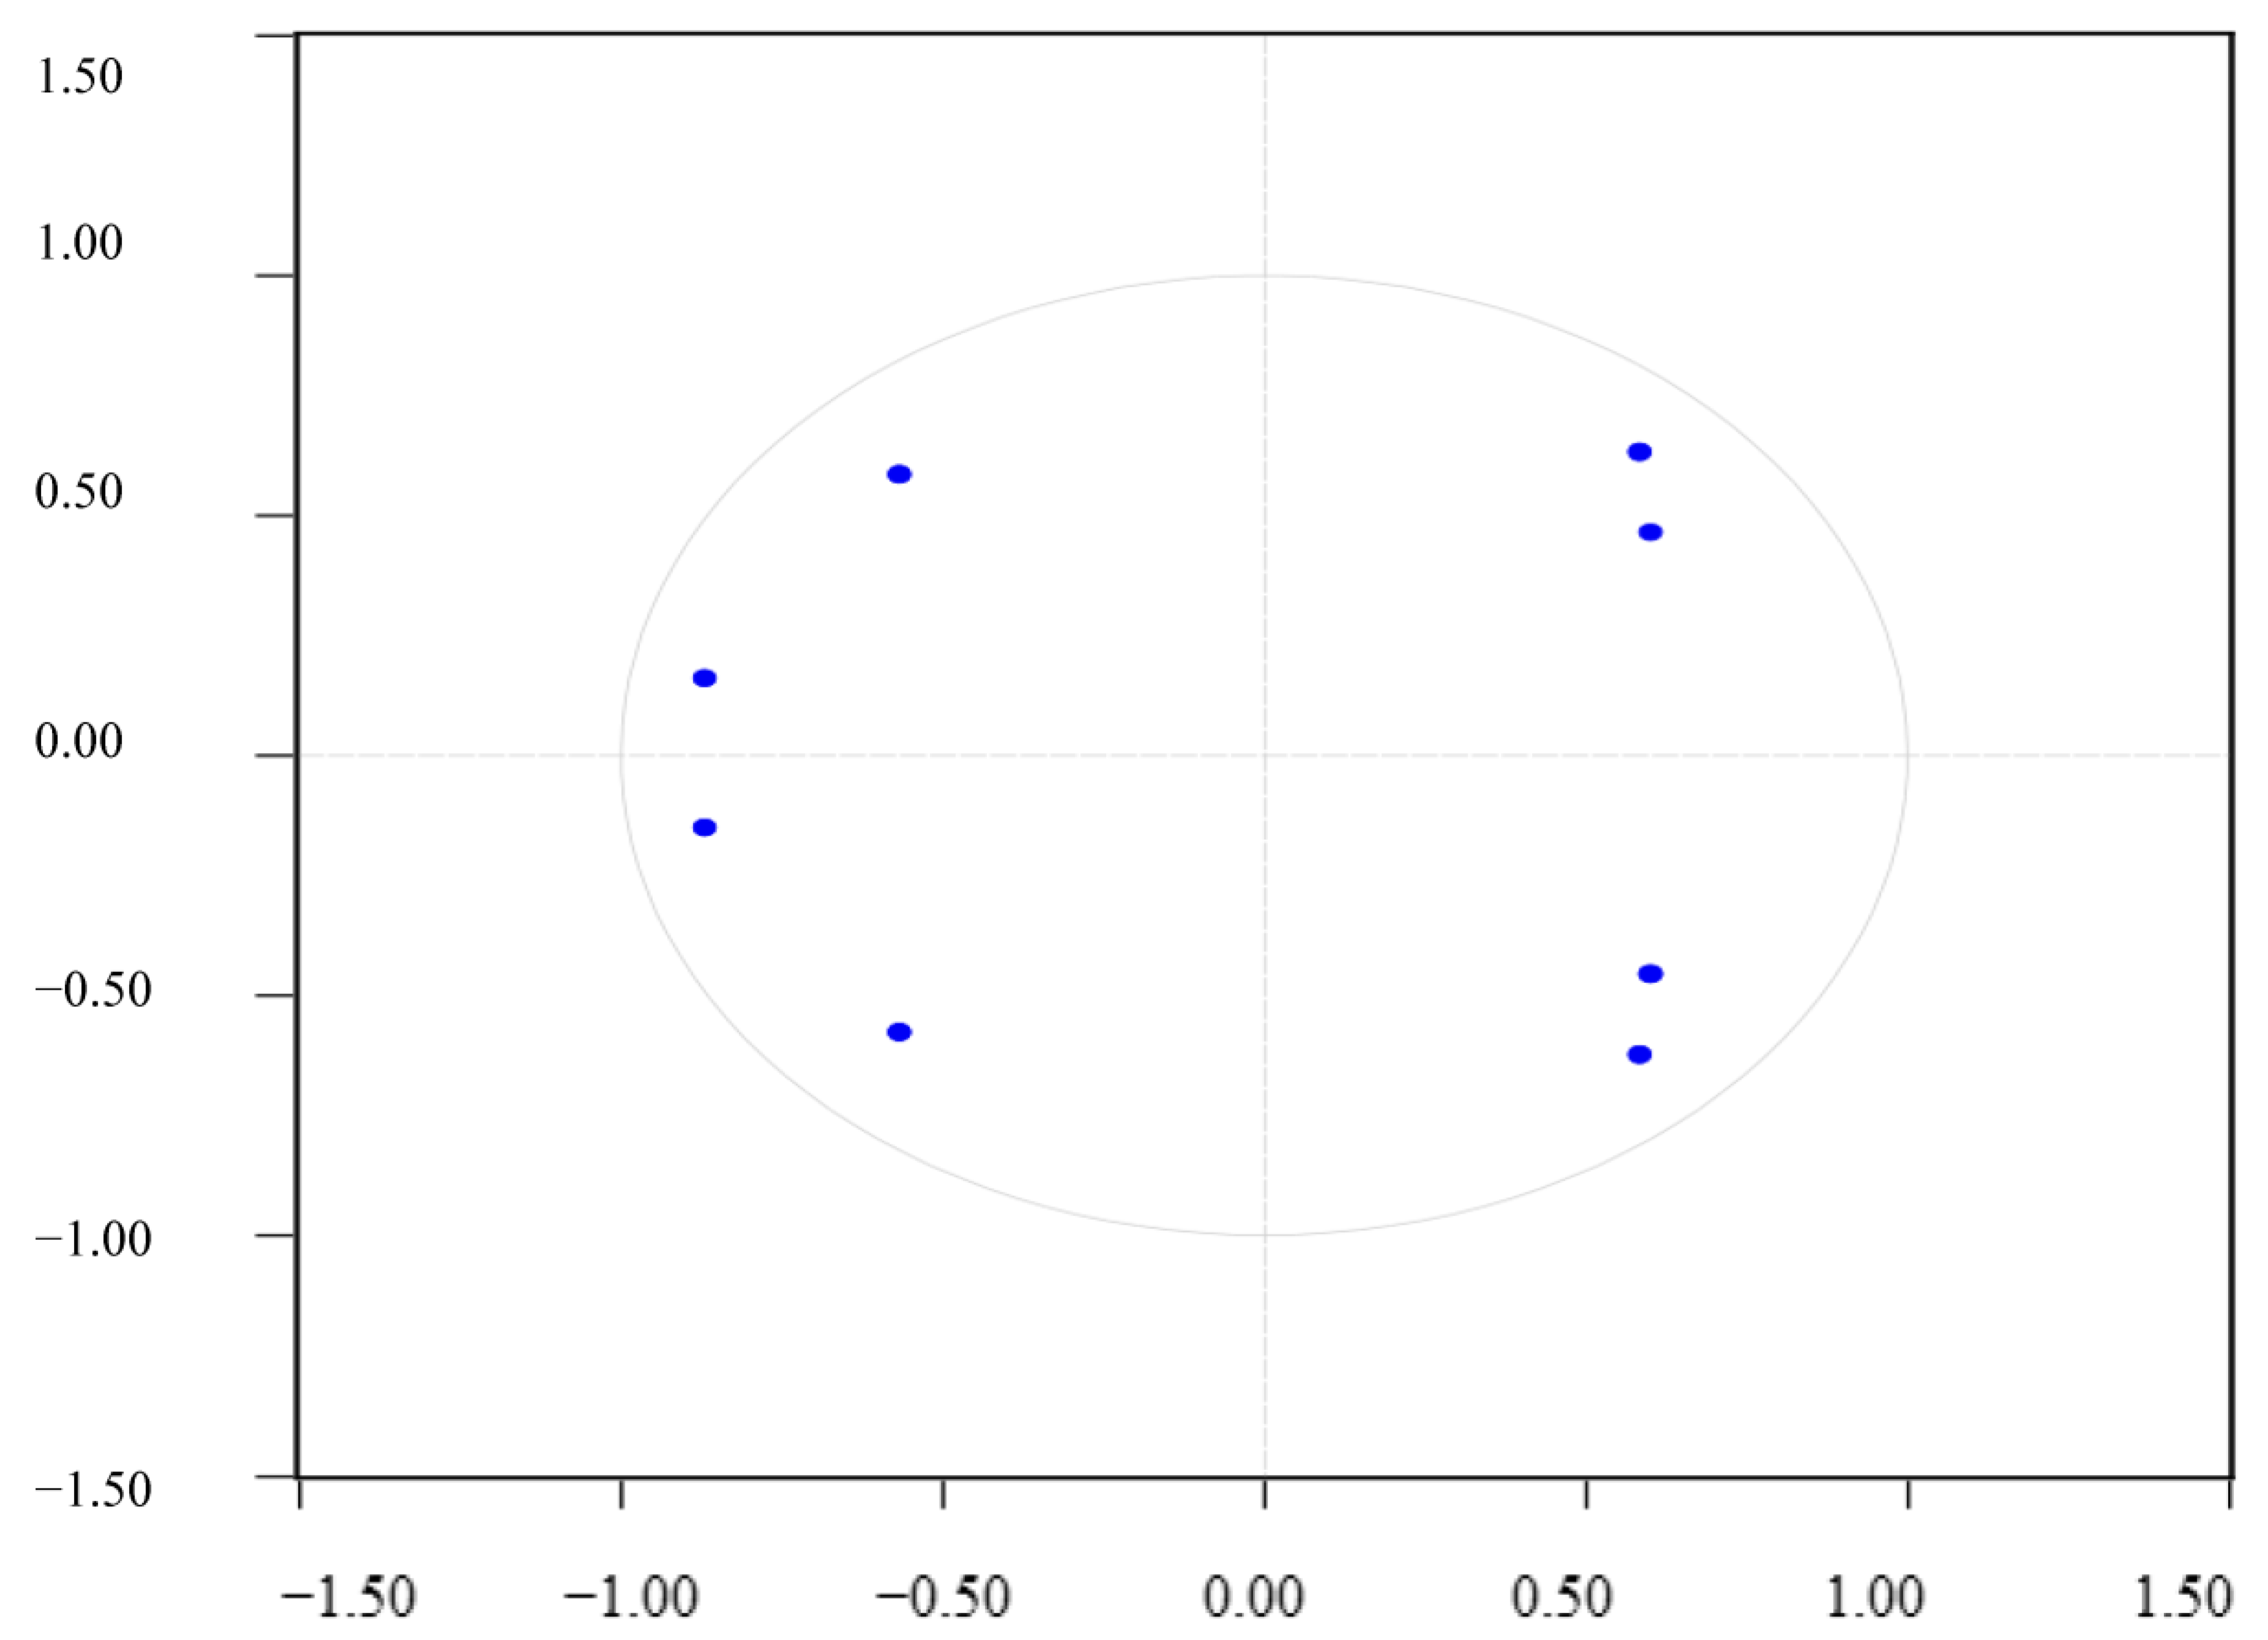
Regarding the investigation of whether the VAR (2) model created for the variables included in the model was stationary, as the distribution of the reverse roots of the AR characteristic polynomial was inside the unit circle, it can be stated that the established VAR model had a stationary structure (
Figure 1). All moduli calculated by EViews software were smaller than the unit value in terms of absolute value. However, in this study, the unit circle view of the characteristic roots is presented.
Estimation results regarding the VAR (2) model established according to the determined lag length are presented in
Table 4. The table shows the coefficients of 5 equations. In the equation regarding the wheat price (whpr) variable, one-period lagged wheat production (whprd
(t−1)) has a negative and statistically significant effect at a 0.01 error level. In the same equation, the positive effect of the 2-period lagged fertilizer price variable (dapr
(t−2)) at a 0.10 error level and the negative effect of the 2-period lagged diesel prices at a 0.05 error level are seen. In the equation for the wheat production amount (whprd), the 1-period lagged wheat price (whpr
(t−1)) has a significant and negative effect at a 0.05 error level, the 1-period lagged barley price (bapr
(t−1)) has a significant and positive effect at a 0.10 error level, and the 2-period lagged diesel price variable (dieselpr
(t−2)) has a significant and negative effect at a 0.10 error level. In the equation for the barley price (bapr), as an important substitute for wheat, the 2-period lagged wheat price (whpr
(t−2)) has a positive effect at a 0.05 error level, 1-period lagged wheat production (whprd
(t−1)) has a negative effect at a 0.01 error level, the 2-period lagged barley price (bapr
(t−2)) has a negative effect at a 0.05 error level, and the 2-period lagged diesel price variable (dieselpr
(t−2)) has a negative effect at a 0.10 error level. Fertilizer, which is an important agricultural chemical, and its price (dapr) and the diesel price, which is an important input in agricultural production, are related to the variables examined at various significance and lag levels.
The
R2 values of the model indicate moderate explanatory power of the variables. However, it is important to consider the complexity of economic relationships and the presence of potential unobserved factors influencing the dependent variable. There are some reasons for this stated in [
40]. Economic and market-related data are often influenced by a multitude of factors, some of which may not be fully captured in our model due to data limitations. Factors such as policy changes, external shocks, and behavioural responses could contribute to unexplained variance. Omitted variable bias could be a concern, as agricultural and market dynamics are influenced by various macroeconomic and climatic factors. Yet, we have made efforts to include key explanatory variables based on theoretical foundations and data availability. In addition, the adjusted
R2 provides a more reliable measure of model fit by accounting for the number of predictors. In our case, the adjusted
R2 remains within an acceptable range, reinforcing that the model maintains explanatory power despite potential omitted influences. It is worth noting that, in economic research, particularly in time series models,
R2 values are often lower than in controlled experimental settings. The focus should be on the significance of the relationships rather than solely on
R2. The robustness of our findings is further supported by diagnostic tests and the overall model performance.
In the present study, the Granger causality analysis was performed to understand the causality relationship between the variables. Our results indicate that wheat production Granger-causes wheat prices, meaning that past values of wheat production significantly influence the prediction of future wheat prices. This finding reflects the natural relationship between production levels and price formation. However, in developing countries such as Türkiye, where agricultural subsidies and government interventions are prevalent, the connection between supply levels and price fluctuations may not always follow a parallel trend. If an increase in production does not lead to a decline in prices, market regulations, import policies, and global price fluctuations may be distorting this relationship. Agricultural policies should be designed to protect producers from price volatility while maintaining a functional market mechanism. Our findings show that barley prices Granger-cause wheat production, indicating that past barley price fluctuations have a meaningful impact on future wheat production levels. Since barley and wheat are often substitute crops, farmers may decide between cultivating wheat or barley depending on market prices. For policymakers, this suggests that, instead of focusing on individual crops, a comprehensive approach to grain markets should be adopted. In Türkiye, particularly, government purchase programs and subsidies can disrupt farmers’ decisions, leading to large-scale shifts in production patterns. Our results also indicate that wheat prices Granger-cause barley prices, meaning that past wheat price fluctuations significantly influence future barley prices. When wheat prices increase, wheat consumption may decline, and both producers and consumers may shift toward alternative, lower-cost grains. However, since the elasticity coefficient for producers abandoning wheat production may not be equal to the cross-price elasticity of consumers, this mismatch could create price spikes in wheat markets. Rising wheat prices, in turn, increase demand for barley, causing its price to rise as well. This result confirms the strong substitution effects between grain commodities and highlights the direct linkages between wheat and barley markets. It underscores the interconnected nature of agricultural markets and suggests that policymakers should not treat commodities in isolation but rather develop integrated strategies. Any decision affecting the wheat market (e.g., import policies, price support mechanisms) will inevitably have spillover effects on other grains, such as barley. Therefore, a holistic approach considering inter-commodity relationships should be adopted in policy design. Our results suggest a borderline significant relationship at the 5% level but stronger causality at the 10% significance level between barley prices and wheat production. Farmers adjust their wheat planting decisions based on barley price fluctuations. As previously discussed, substitution effects between grains should be carefully considered in policymaking. A joint analysis of wheat and barley price movements can aid policymakers in designing more effective agricultural strategies. Our results indicate that fertilizer prices Granger-cause wheat production, meaning that fluctuations in fertilizer prices have a direct impact on wheat production levels. Since fertilizer is one of the most essential inputs for increasing crop yields, rising fertilizer costs can force farmers to reduce fertilizer usage, ultimately leading to lower production levels. Given that Türkiye’s agricultural lands already face challenges related to insufficient fertilization [
41], a more sensitive agricultural policy approach is needed for this input. Fertilizer subsidies and incentive programs can help reduce cost pressures on producers. A more detailed assessment of how rising production costs affect wheat prices in Türkiye should be conducted. Our results suggest that diesel prices Granger-cause wheat prices, implying that fluctuations in diesel costs directly impact wheat price formation. Since farm machinery, transportation, and irrigation systems heavily rely on diesel, higher diesel prices increase both production and transportation costs, ultimately pushing wheat prices upward. Diesel subsidies and energy efficiency policies in agricultural production should be considered. Measures should be taken to ensure that diesel price volatility does not directly harm agricultural production, particularly in rural areas. In Türkiye, where small-scale family farms engage in ecological agriculture, the impact of rising diesel prices should be carefully managed. Our results show that diesel prices Granger-cause barley prices, with a more significant effect at the 10% significance level. Transportation and logistics costs play a crucial role in agricultural price fluctuations, particularly for bulk commodities like barley. As noted above in
Table 5, barley prices are directly influenced by transportation costs, which can lead to sudden price surges or drops in the market. Government policies should focus on targeted fuel subsidies for agricultural transportation. Since large-scale producers and cooperatives already benefit from economies of scale in transportation, projects should be developed to support small-scale family farms, which face higher relative transportation costs. In
Table 5, our results indicate that diesel prices Granger-cause fertilizer prices, meaning that fluctuations in diesel costs significantly determine fertilizer price movements. Since fertilizer production and transportation require high energy consumption, rising diesel prices push fertilizer costs upward. The production process of chemical fertilizers is heavily dependent on the petrochemical industry, meaning that fuel price fluctuations directly impact fertilizer prices. While this may not be directly controlled through agricultural policies, it poses a major supply chain issue. Inter-ministerial coordination is needed to develop a sustainable fertilization system that stabilizes input costs for farmers.
VAR analysis provides explanatory information about determining the relationships between variables. Variance decomposition analysis is a part of this analysis and shows the ratio between the movements resulting from the shocks of a variable itself and the changes resulting from the shocks of other variables. As seen in
Table 6, the wheat prices are determined in the short term by their own shocks. A total of 100% of the change in the standard deviation of the wheat price in the first period results from itself. At the end of 10 periods, 54.1% of the wheat price variable is explained by itself, 8.45% by the wheat production amount, 1.56% by the fertilizer prices, 13.1% by the barley prices, and 22.79% by the diesel prices.
After the VAR model was obtained, impulse response functions were examined. Impulse response functions reflect the effect of one-standard-deviation shock in one of the random error terms on the present and future values of internal variables. In addition, it is stated that long-run equilibrium relationships can be identified through impulse response functions within a structural VAR framework without the necessity of cointegration tests [
42,
43]. In VAR analyses, impulse response functions have a great share in determining the dynamic interaction between the variables under examination and identifying symmetric relations [
44]. The most effective variable on a macroeconomic quantity is determined with variance decomposition, and whether this effective variable can be used as a policy tool is determined with impulse response functions [
45].
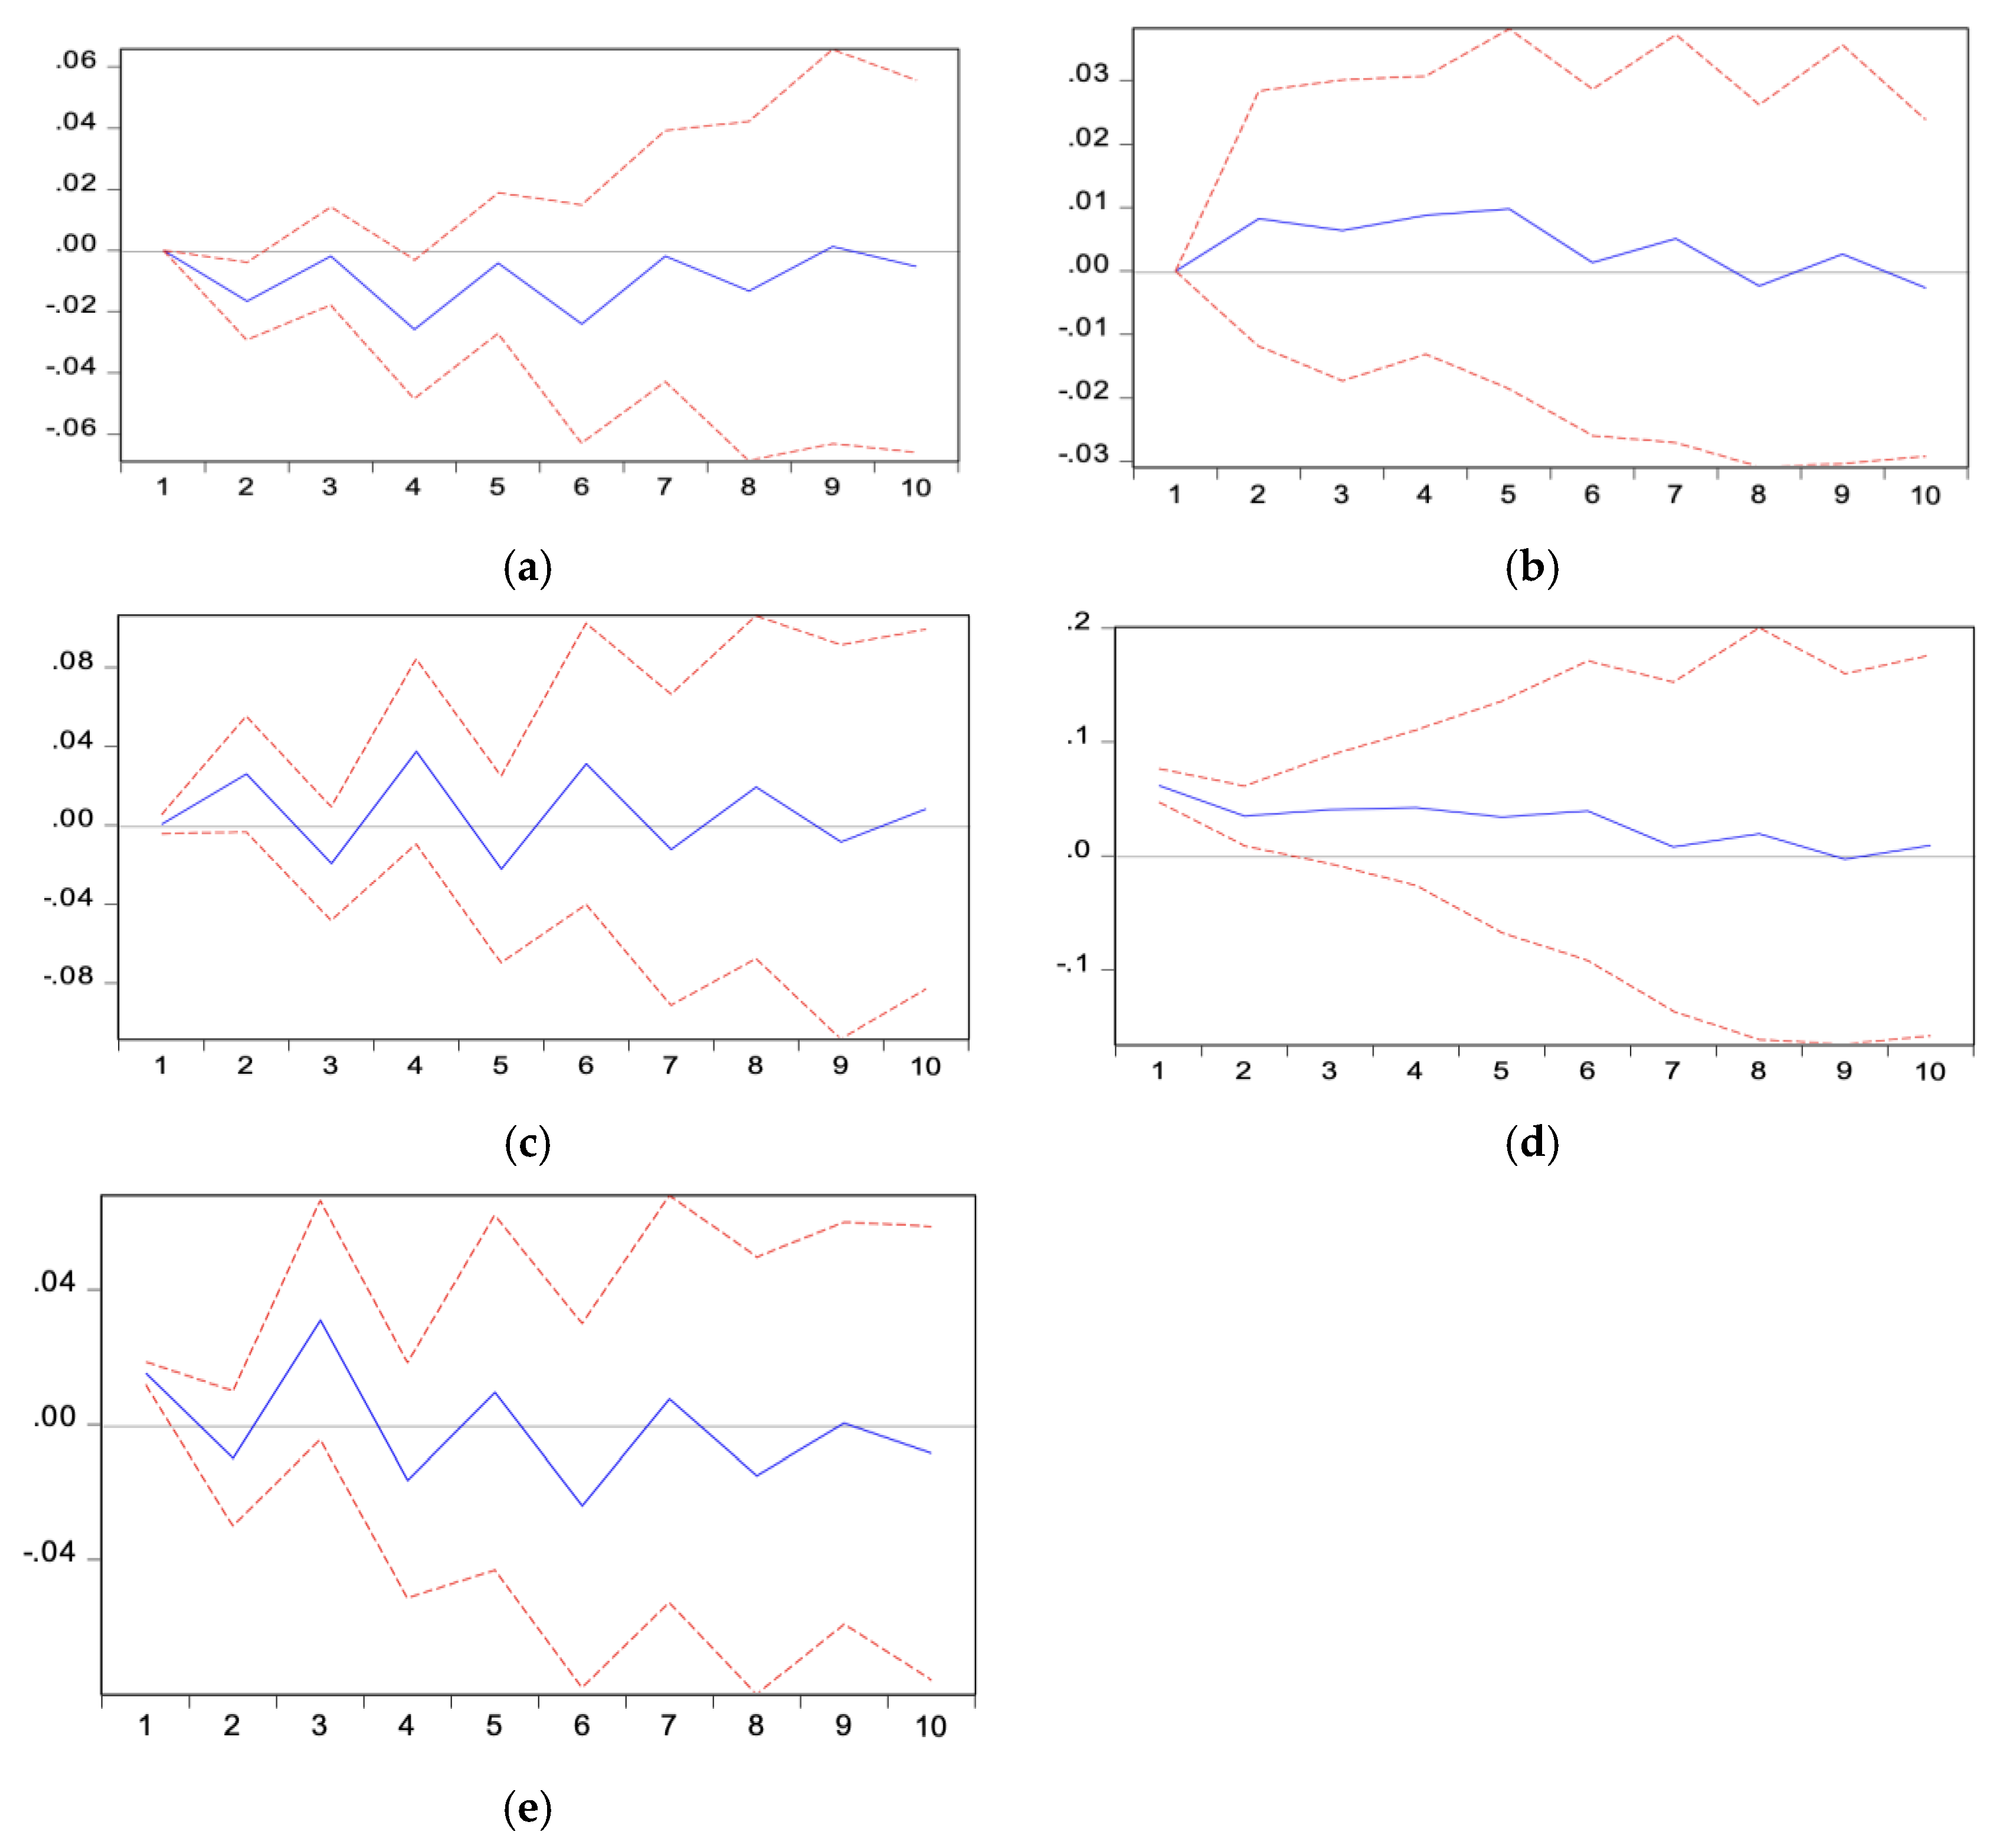
Figure 2 presents the graphic representation of impulse response functions. Although not all relationships are included here, the results that could be important for the study are presented in the graphs. In (a) panel of
Figure 2, the reaction of the wheat price to wheat production is shown. In other words, when a random shock is given to wheat production, the effect of this shock on the wheat price is addressed. According to the results obtained, it is understood that a shock experienced in wheat production has a reverse relationship with the price and that this effect disappears after two periods. Impulse response analyses should not be confused with causality analyses. Although they provide clues regarding causality, interpretations focus on random shocks. In panel (b) of
Figure 2, the effect of a one-period shock given to the fertilizer prices on the wheat prices is displayed. A one-standard-deviation shock given to the fertilizer prices has a positive effect on the wheat prices for seven periods, and this effect disappears in the eighth period. Panel (c) of
Figure 2 shows that a one-standard-deviation shock given to the diesel prices affects the wheat prices positively for the first two periods, negatively in the third period, positively in the fourth period, and negatively in the fifth period and disappears after this period. It is seen in panel (d) of
Figure 2 that a one-standard-deviation shock given to the barley prices positively affects the wheat prices in the first seven periods and then disappears. Panel (3) of
Figure 2 shows that a one-standard-deviation shock given to the wheat price variable affects the wheat price variable, that is, itself, positively in the first period, negatively in the second period, positively in the third period, and negatively in the fourth period and then disappears.
In addition to the individual effects of the variables, their common effect on the dependent variable can provide insight to researchers.
Table 7 indicates the impact of the double effect of the series on the wheat price series depending on Wald Tests.
Table 7a,b present the test results of the dual effect of barley prices and wheat production on wheat prices. As the dual effect probability of barley prices and wheat production is
p = 0.016 < 0.05, the first lag coefficients have a common effect on wheat prices. However, this dual effect disappears in the second lag with a test statistic of
p = 0.539 > 0.05. When
Table 7c,d are examined, the test statistics of
p = 0.286 > 0.05 and
p = 0.093 > 0.05 indicate that the fertilizer and diesel prices do not have a dual effect on wheat prices.
In the literature, the authors of [
9] attribute the source of the asymmetry to the non-competitive market structure, market players arranging themselves to the market conditions, dietary costs of the households, public interventions, and asymmetric information. At this point, the first hypothesis of the study is rejected. The sustainability of agriculture in Türkiye is associated with agricultural input prices. The result stated in the first hypothesis is not obtained in Granger causality. The cause of wheat production in Türkiye is the wheat price. However, it was observed that the wheat production amount did not affect wheat prices, that wheat prices were not determined by market economy conditions, and that an attempt was made to achieve agricultural sustainability through interventions in agricultural prices. Thus, it can be claimed that agricultural sustainability (continuity) in Türkiye is achieved through artificial ways. The absence of causality between the wheat production amount and its price emerged bilaterally as barley price/wheat production/barley price. Here, it can be stated that the determination of input and substitute prices in market conditions supports our thesis above. As a result of the study, the hypothesis that “agricultural input prices have a symmetric effect on wheat prices” is rejected. When the reaction of wheat prices to the shocks in fertilizer prices was examined, the reaction to negative shocks was found to be higher, and the reaction to positive shocks was determined to be more moderate. When the reaction of wheat prices to shocks in diesel prices was examined, the reaction to negative shocks was higher, and the reaction to positive shocks was more moderate. Similarly, the hypothesis that “positive input price shocks are stronger than negative shocks on wheat prices” was also rejected. It is possible to claim that there exist asymmetric relationships between these two agricultural inputs. A similar situation was not determined in other shock conditions (barley price/barley price; wheat production/wheat production; wheat price/wheat price).
Our findings confirm that wheat prices are influenced by input costs such as diesel and fertilizer prices, as well as substitution effects with barley prices. These results align with previous studies that highlight the cost-push inflation in agricultural markets due to rising input costs [
4,
5]. Our results were parallel with [
46]’s results; they demonstrated that diesel fuel and urea fertilizer are among the largest energy consumers in wheat production, directly influencing production costs and market prices. Policy suggestions exist because of this result. Instead of broad-based subsidies, governments should focus on dynamic pricing mechanisms that provide support only when input costs exceed a critical threshold. Fuel and fertilizer price stabilization funds can help smooth out price fluctuations and prevent asymmetric cost pass-through.
Several studies have examined the impact of energy costs on agricultural price formation. For instance, the authors of [
3] found that oil price fluctuations significantly affect grain prices, supporting our result that diesel price shocks propagate through agricultural supply chains. However, unlike [
3], our study focuses specifically on diesel prices rather than crude oil prices, as diesel is the primary fuel used in agricultural production. This methodological refinement provides a more accurate representation of agricultural cost dynamics.
In terms of asymmetric price transmission, some researchers found strong evidence that supports our findings. Even if the authors of [
47] investigated the tail dependence structure and extreme risk spillover effects between international agricultural futures and spot markets in other agricultural production markets, in soybean and maize markets, their findings indicate asymmetric risk spillover effects, suggesting that downside risk spillovers are significantly stronger than upside ones. While their study did not find a significant difference in strength between the two risk spillover effects for wheat, it highlights the importance of understanding asymmetric effects in agricultural markets. Additionally, the authors of [
9] emphasize the role of asymmetric price transmission in agricultural markets, arguing that market structure, public interventions, and input price rigidity contribute to price asymmetries. Our study supports this view, demonstrating that negative shocks in fertilizer and diesel prices have a stronger impact on wheat prices than positive shocks. This suggests that farmers and market intermediaries respond more aggressively to cost increases than to cost reductions, likely due to market frictions and contractual rigidities. These studies corroborate our results, indicating that fluctuations in input prices, such as diesel and fertilizers, lead to asymmetric responses in wheat prices. This asymmetry can be attributed to factors like the market power of suppliers, production cost stickiness, and risk aversion among producers. The asymmetric response of wheat prices to input cost changes suggests that price increases in inputs lead to more pronounced increases in wheat prices compared to the effect of input price decreases. This phenomenon may result from non-competitive market structures and the reluctance of suppliers to reduce prices even when input costs decline. Such behaviour can exacerbate price volatility and pose challenges for both producers and consumers in the agricultural sector.
By examining impulse response functions, we stress the asymmetric response of wheat prices to changes in input costs. A negative shock in fertilizer prices leads to a 7.1% increase in wheat prices, whereas a positive shock results in only a 3.4% rise. Similarly, a negative shock in diesel prices causes a 5.8% increase in wheat prices, while a positive shock leads to just a 2.6% rise. These asymmetric effects suggest that price reductions in inputs do not fully translate into price decreases in agricultural products. Several factors may explain this phenomenon. In terms of the market power of suppliers, fertilizer and diesel markets in Türkiye may exhibit oligopolistic characteristics, where a few dominant suppliers adjust prices more rigidly downward than upward. Farmers may not immediately benefit from lower input prices due to pre-existing contracts, storage costs, and delayed supply chain adjustments, and these create production cost stickiness for small-scale family businesses in rural Turkey. The other impact is due to risk and uncertainties. Even when input prices decline, farmers may hesitate to lower output prices due to future price volatility and production risks. These findings align with the asymmetric price transmission theory discussed in [
9] and suggest that policymakers should consider structural inefficiencies when designing agricultural market interventions. Policymakers should address oligopolistic structures in fertilizer and fuel markets to ensure competitive pricing and reduce price stickiness. Strengthening antitrust regulations and market transparency can help prevent price manipulation by dominant suppliers. Encouraging crop insurance programs that factor in input price volatility can help farmers manage financial risks. Establishing forward contracting mechanisms for fuel and fertilizer can allow farmers to lock in lower prices in advance, reducing cost uncertainties. While previous research has analysed grain price volatility due to international trade policies [
12], our study contributes by showing that domestic policy interventions, such as fuel and fertilizer subsidies, also play a crucial role in price stabilization efforts. In this regard, our findings align with [
11], which argues that government policies often create artificial economic environments that may not be sustainable in the long run. Reducing excessive government intervention in price formation can help improve market efficiency and price discovery mechanisms. Strengthening market integration with global agricultural commodity markets can ensure greater price stability in the long run.
4. Conclusions
This study examines the time series behaviour of wheat prices and related variables in Türkiye, testing multiple hypotheses to understand short-term and asymmetric effects. The analysis incorporated wheat prices, wheat production, barley prices, fertilizer prices, and diesel prices. After confirming that the variables were non-stationary when level but stationary when the first differences arose through unit root tests, a VAR(2) model was employed. The Granger causality test, impulse response functions, and variance decomposition analysis provided insights into the dynamic interrelationships between these variables. Diagnostic tests confirmed the absence of heteroscedasticity and autocorrelation issues, and the model was found to be structurally stable based on the AR characteristic polynomial inverse roots.
One key contribution of this study is the explicit use of farmgate prices instead of market prices, minimizing distortions caused by supply chain disruptions. Additionally, diesel prices were preferred over crude oil prices to better capture behavioural attitudes to agricultural production costs, given that crude oil has extensive non-agricultural applications. These methodological choices enhance the relevance of our findings for agricultural policy. Policymakers in Türkiye should closely monitor the asymmetric foreign and domestic influences on wheat prices, which remain critical for food security and economic stability. These factors include global political shocks, exchange rate fluctuations, cereal demand for biofuel production, climate change, and potential supply-side asymmetries in wheat production.
The results showed that Granger causality is remarkable. Energy prices have a direct impact on agricultural production costs. When diesel prices increase, both transportation costs and input costs rise, leading to higher final product prices. There is a strong substitution effect between grain markets. Wheat and barley prices influence each other, so market regulations should be designed with a holistic approach rather than targeting individual commodities. Agricultural support policies should be aligned with energy pricing mechanisms. Volatility in fuel and fertilizer prices can reduce farmers’ profit margins, making direct cost subsidies or tax reductions viable policy options.
Findings suggest that agricultural production in Türkiye does not operate entirely under market-driven conditions. The sustainability of agricultural production relies heavily on government interventions, which attempt to stabilize prices but may introduce unintended distortions in the long run. Market-disrupting policies, such as excessive subsidies and artificial price controls, can generate asymmetries and inefficiencies that hinder sectoral competitiveness.
For policymakers in developing countries, the findings highlight a crucial lesson, i.e., the use of structural reforms instead of interventionist policies that distort market signals. These kinds of reforms that enhance market functionality should be prioritized. Agricultural policies should be designed to foster rural development, encourage efficiency-driven price stability, and integrate market-based risk management mechanisms. A well-functioning market-based agricultural system will provide a more sustainable foundation for long-term food security and reduce dependency on unpredictable policy interventions.
While this study provides valuable insights into wheat price dynamics, certain limitations should be acknowledged: This study does not explicitly incorporate climate variability, trade restrictions, or global supply chain shocks, which may also affect wheat prices. While the VAR(2) model effectively captures short-term dynamics, a Structural VAR (SVAR) or Nonlinear Autoregressive Distributed Lag (NARDL) model could provide deeper insights into asymmetric responses to price shocks. The absence of a cointegration analysis limits the ability to examine long-term equilibrium relationships; thus, future studies could incorporate Johansen cointegration tests or error-correction models.
Although this study’s results do not suggest a purely political view, there are also strategies that need to be implemented in the agricultural policy area. Investigating the role of precision agriculture, smart farming technologies, and supply chain digitalization in stabilizing wheat production and prices could provide a forward-looking perspective. Exploring how the adoption of renewable energy sources and sustainable farming practices affects production costs and market prices would add a crucial environmental dimension to policy discussions. Future research could incorporate behavioural economics approaches to understand how farmers, traders, and consumers react to price shocks and policy changes in macroeconomic analyses. Analysing market power concentration and price transmission mechanisms in Türkiye’s wheat market would help assess whether structural reforms are needed to improve competition and efficiency. By expanding on these areas, future studies can build upon the current findings and contribute to more resilient and data-driven agricultural policies in Türkiye and beyond.


