Abstract
To minimize environmental damage, conserve global diminishing fertilizer reserves, all while maximizing food production, it is essential that farmers apply phosphate fertilizers at the optimal rate. The purpose of this study is to assess grower attitudes and behavior, with respect to proper application of phosphorus, and to investigate how certain exogenous factors might influence such applications. Data were analyzed from a survey conducted in North Carolina, USA, with 122 farmer participants. The findings reveal that annual phosphorus applications consistently exceed recommendations, which indicates overapplication, leading to economic inefficiency and environmental concerns. Overapplication is neither due to knowledge gaps in nutrient concentrations in the soil nor the lack of interest in soil sampling, as 99% of farmers submit soil tests as frequently or more frequently than every two years. Only 36% of growers indicated that they would not apply phosphorus if their soil report indicated that levels were sufficient, and that none was required. Additionally, overapplication is not strongly influenced by price effects, as only nine percent of growers abandoned applications in 2021, following a dramatic spike doubling fertilizer prices. The adoption of reduced phosphate fertilization will depend on strong local trusted technical assistance and continued extension education.
1. Introduction
The need for exhaustible resources is only as great as the creative solution that mankind constructs for that resource. As a result, the demand for such resources will come and go as technology progresses and disappears. The changing demands for mined resources, due to technological invention, have been occurring since the earliest documented history through the present day. For example, in the Stone Age, obsidian was extremely valuable and was sought after for tools and weaponry, but it was later replaced by bronze [1]. A modern example can be seen in the case of mercury. Mercury was once very expensive because it had a wide range of industrial uses, including in thermometers. Yet, as a result of technological innovation, mercury was replaced with other materials, and is now half the price it once was [2]. However, in stark contrast to the many resources that may fluctuate throughout time, phosphorus (P) stands as one exhaustible resource that will almost certainly have a sustained demand because the essential and irreplaceable role of P in living organisms cannot be replaced by any human advancement or technological developments. The need for P fertilizers arises because most soils cannot supply enough P naturally to sustain crop yields. Moreover, there is increasing pressure on those yields, as a growing population requires higher rates of food production [3]. Permanent deviations from the long-term upward trend in P consumption are historically rare and unlikely to ever occur if world populations continue to grow [4]. Such a sustained demand requires continual exploration of efficient uses for this critical element.
The increased demands for food production, coupled with the complex dynamics of soil P, necessitates that society prioritizes the efficient use of P. Phosphorus fertilization has low efficiency because it is easily “fixed”, meaning that it is strongly bound to the soil particles becoming less available for plant use [5]. The P that accumulates in the soil from these processes is known as “legacy P” [5], which is an inefficient use of the nutrient because plants are not always able to access the stored P at the rates that are needed. The typical response by farmers to this issue is persistent additional P applications year after year in order to meet yearly plant needs of available P, resulting in the accumulation of legacy P in the soil.
In light of these soil chemistry dynamics, one avenue for exploration into an efficient use of P revolves around fertilizer application [4]. Due to the critical need for adequate levels of P for plant production, it may be common for many growers and recommending bodies to err on the side of overapplication. Bias toward overapplication will reduce any risks of yield losses due to nutrient needs. Many soil test labs and/or agricultural consultants or businesses may inherently bias their soil test recommendations toward overapplication of fertilizer, in order to avoid risking yield losses when exact nutrient application needs are unknown [6,7]. However, accurate P needs for plants can be determined through extensive soil test correlation and calibration studies that define the critical soil test value (CSTV), the P required for crop production without risking any yield losses, and the fertilizer requirements for each beginning soil test level [8,9]. Currently, different states around the United States have different approaches to how fertilizer should be applied [10]. Nevertheless, the reality is that many growers and recommending bodies may apply and advise over that critical value, as a safety procedure, in order to avoid risk of lower crop yields, despite the availability of testing. These overapplications represent economic inefficiencies. The consequences of such economic inefficiencies are reduced profits for farmers, increased food costs for consumers, waste of a limited, finite natural resource, and significant environmental damage such as water [3,5,7,10].
Although the CSTVs of P have been established in North Carolina and are continuing to be revised as agricultural technology progresses [6,9,11], current agricultural practices may not coincide with the economically ideal level of P application. This survey aims to quantify how close is the reality of management decisions to the North Carolina CSTV. This study also seeks to understand reasons for overapplication of P through a case study which includes survey data acquired from 122 North Carolina farmers. To better understand the future of P usage, this survey also evaluates how the price of P fertilizer affects P use.
2. Materials and Methods
We developed an online farmer survey to explore producer P fertilizer behavior in North Carolina. The survey was submitted to and approved by the North Carolina State University Institutional Review Board, and then distributed to farmers in February of 2023. This survey included questions about soil sampling, soil testing, and decision-making on fertilizer applications. The survey included nineteen total questions, which included demographic information selections, quantitative measures, and two open-ended questions (Supplementary Materials). Surveys were distributed through random and targeted recruitment of row-crop producers. Specifically, the NC Soybean Association sent emails to their member and advertised the survey in their newsletter. The Corn Growers Association of NC provided their listserv, where we sent emails to farmers. Additionally, 40 county-level cooperative extension agents were asked to send survey invitations to their farmers, and farmers were invited to participate during county-level extension training. Farmers were presented with the option to complete the survey via an online link or QR code, and they had the option to opt out at any moment while responding to the survey. The responses were anonymous. We used Excel to calculate descriptive statistics on the quantitative measures, which are presented below.
In total, 122 farmers who reside in 45 of the 100 counties in North Carolina participated in this study. The largest concentration of participants was in the Coastal Plain region (Figure 1). Farms in the Coastal Plain counties predominantly grow row crops such as corn (Zea mays), soybean (Glycine max), wheat (Triticum aestivum), and cotton (Gossypium hirsutum), as compared to the Piedmont and Mountain regions that are predominately pasture and haylands [12]. Approximately half of the participants (51%) reside on farms larger than 1000 acres, despite the fact that the average farm size in North Carolina is 190 acres. Only 4.3% of farms in NC are larger than 1000 acres [12]. Among respondents, 80% grow a corn–soybean rotation, and 54% of all farmers also include wheat in this rotation. Thus, this survey is representative of larger operations and high-acreage farms in the North Carolina Coastal Plain. However, other Coastal Plain cropping systems include cotton and peanut rotation (18%), or sweet potato–tobacco rotations (17%). Regardless of physiographic location, less than 10% of the survey participants grow other crops such as hay, Irish potato, Christmas trees, and vegetables.
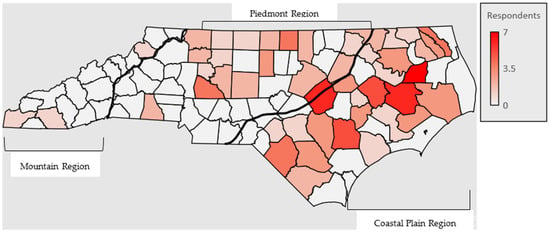
Figure 1.
Map of survey participants in each county of North Carolina ranging from 0 to 7 participants in each county.
3. Results and Discussion
3.1. North Carolina Soil Phosphorus Problem
The agronomic consensus method for determining the right amount of P fertilizers is to perform soil analysis, recommending the rate of fertilizer based on the current amount of P already available in the soil compared to the reference amounts required [13,14]. This procedure results in null or small rates of fertilizer application recommended for high-fertility soils, and higher rates of P fertilization recommended in soils with low fertility. Soil P varies with time, and previous fertilization can result in legacy P. Therefore, it is recommended to obtain the soil analyzed frequently (2–4 years) to promote adjustments in the fertilization program. Technically, following the recommendations will avoid the accumulation of legacy P in the soil, as no fertilizer will be recommended when the soil P is above the reference values (critical soil test value) for each crop.
In North Carolina, the official recommendations for fertilizer applications are published by the North Carolina Department of Agriculture and Consumer Services (NCDA&CS). Soil testing is free to farmers most of the year [9]. The NCDA&CS recommends that farmers test sandy soils every other year and clay soils once every three years [9]. This frequency is intended to ensure that the fertilization program will be revised to avoid under- or over-fertilization. Our survey revealed that 99% of participants in this study follow or exceed the recommendation for the frequency of soil sampling (Figure 2), indicating that the farmers’ sampling frequency provides adequate recommendations. These results indicate more frequent sampling than another study [15] that surveyed farmers about their soil sampling practices; 98% of farmers in the states evaluated (North Carolina, Missouri, and Ohio) were sampled within a five-year framework. However, despite the sampling frequency indicated in this survey, thirty-six percent of counties in North Carolina have soil P levels exceeding 100 mg/kg Mehlich-3 extractable [16], which is two times higher than the CSTV; one county has a mean soil P concentration 188 mg P/kg which is over three times higher than the CSTV. It is well documented that it is common to observe soils with P levels much higher than the recommended amount [16,17].
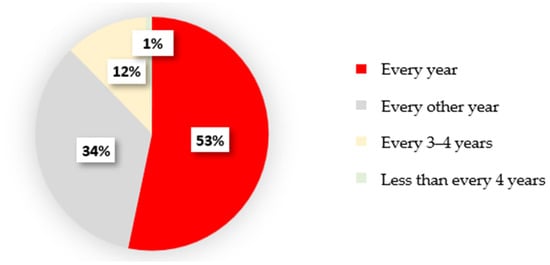
Figure 2.
Frequency of soil testing reported by NC farmers taken from a sample of 122 respondents.
The frequency of soil testing by North Carolina farmers indicates this is a standard procedure in the state, and there are plenty of options for this service. The NCDA&CS offers this service at a low cost or free of charge for NC citizens, and there are at least four private laboratories offering soil analysis services. In our survey, 48% of respondents indicated they use NCDA&CS laboratory, while 52% of respondents indicated they use “other laboratories” for soil analysis. We do not have access to information about the number of soil samples analyzed by the private labs, but the NCDA&CS analyzes about 300,000 soil samples per year [16], indicating a high adoption of this procedure by farmers. Most soil testing services, including NCDA&CS, will provide fertilizer recommendations based on the soil test results and the accompanying crop information.
Although farmers in this survey are well informed on the status of P in their soils by frequent soil test reports, as seen by the frequent soil testing, these farmers are still reporting soil test P levels above what is required to support crop growth (CSTV). The CSTV of P for row crops is 50 mg/kg, and no P fertilizer application is recommended for these crops in soils with P contents greater than this value [6]. In the present survey, when farmers were asked about the range of P level in their soils, the mean soil test P level reported by participants was 80 mg/kg, with 40% of participants farming soil with a range of P level 51–75/kg (Figure 3). Miller et al. [16] found that the average soil P concentration for corn growers was 103 mg/kg for soil analyzed by the NCDA in the years 2017–2019. The Miller et al. [16] analysis suggests that P concentrations in our survey may be underreported.
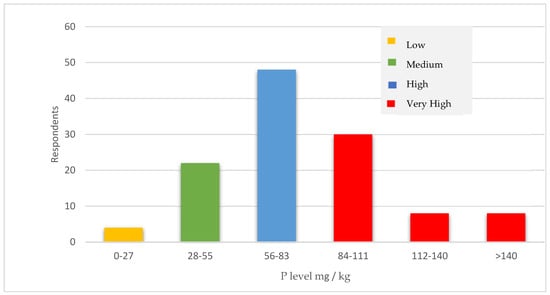
Figure 3.
Range of soil phosphorus in mg/kg reported by all survey participants.
3.2. Why Is Overapplication of Phosphate Fertilizers Occurring?
When growers submit soil samples for testing, the NCDA&CS reports fertilizer recommendations based on the CSTV. However, this study found that only 42% of farmers reported that they apply P based on the soil test report recommendations, while 58% of farmers apply at a rate that is different than what is recommended by the soil test report (Figure 4). Of the 58% of farmers who adjust the rate, 26% of them base their rates on information from fertilizer dealers or crop consultants, and 74% of the respondents choose to do so based on their own experience (Figure 4). These results are consistent with the findings of O’Connell and Osmond [15], who reported that when North Carolina farmers were asked “who makes your nutrient management decisions”, 45% indicated “informal consultants”. This category of “informal consultants” comprises self, friends, and family, with self being the largest contributor. In the present survey, 15% of farmers reported that they apply P based on advice from crop consultants or fertilizer dealers, which is consistent with O’Connell and Osmond [15], who determined that 20% of farmers in North Carolina use paid consultants. It is worth noting that the use of crop consultants varies greatly by state. For example, in the O’Connell and Osmond [15] study, 64% of farmers in Ohio used paid consultants to help make fertilizer decisions. On the other hand, only 3% of farmers use paid consultants in Missouri. A regional study in Michigan found that 70% of farmers use their fertilizer dealers as a source of information, while only 30% of farmers use their university resources [18].
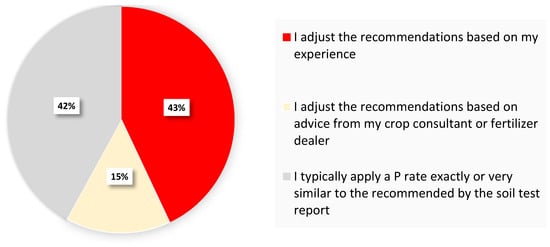
Figure 4.
Participants’ response to the question, “Do you strictly follow the recommendations of phosphorus indicated in the soil test report or do you adjust the rates based on your own experience?”.
Nearly 2/3 of the respondents (64%) will apply at least some P fertilizer when the soil test report recommends no additional P application (Figure 5). This result contrasts with the information presented in Figure 4, where 42% of farmers indicate that they follow the recommended rate of P on their soil test report. A possible explanation for overfertilization was posited by Sheriff [19]; they mention that it may be in the best interest of farmers to apply more P than was recommended due to the potential for better yields than expected. Currently, the NCDA&CS and NC State University recommendations do not incorporate variations in weather or growing conditions. Because the recommendations are based on averages and assume average growing conditions, in seasons with above average growing conditions optimal P for plant uptake of P may be greater, and farmers may account for this when adjusting the recommendations based on their own experience. However, Gatiboni et al. [6] demonstrated that all these factors are already considered in the P recommendations for North Carolina. These authors indicated that the critical historical values for row crops in NC vary between 11 and 35 mg/kg in the Coastal Plain, but the recommendations were set at 50 mg/kg to avoid under-fertilization that could limit the crop yields. However, a recent study conducted by Morales et al. [11] found 48 mg/kg as the average adequate value for corn and soybeans in the Coastal Plain region of NC, which is close to the recommended value but reinforces the appropriateness of the current P cut-off value. When compared to other Southeastern states in the US, North Carolina had the highest recommendations and ranges for P in for corn and warm season [7], but this was lowered in 2021 to reflect state-level science-based information [6].
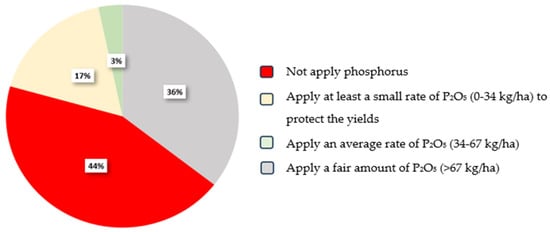
Figure 5.
Phosphorus application rate chosen by all survey participants if a soil test indicates no additional phosphorus fertilizer is needed.
The average soil test P level was determined for each of the four groups of participants who responded to the question highlighted in Figure 4 about the source of information for management decisions. There is no relationship between soil test P and fertilizer decision making, nor was there a difference in those who applied based on their experience, dealer recommendations, or official recommendations. This implies that sources of information for management decisions are not directly responsible for the rate of P fertilizer applied by farmers. There was also no relationship found between the size of the farm and the soil test P level. There was also no correlation found between the type of lab that the soil samples are sent to and the P reported. One explanation for the propensity to overapply P is the perception by one-half of the growers that the previous year’s omissions of P applications led to various deficiency symptoms. All of these findings are consistent with those of Osmond et al. [20], who showed that there is no relationship between P application decisions and soil test P in a study conducted on two river basins in North Carolina. The results of this study, combined with the previous work of Osmond et al. [21], show that farmers are likely making decisions ignoring the soil test report and applying P regardless of sufficiency.
Uncertainty about the weather and overestimation of yield requirements may play a critical role in farmer decisions on P applications. If farmers are overestimating their yield potential for that season, then the farmer may believe that more fertilizer would be required than the recommended rate. If more farmers overestimate their yields than farmers who underestimate their yields, more P will be applied than what is optimal, thus contributing to legacy P buildup. While it may be in the best interest of recommending bodies to ensure that no yield losses are due to soil fertility, many growers may also believe that it is in their best interest to over-apply as well, resulting in “compounding conservatism”, an overapplication of an already overestimated value. This is an economic inefficiency occurring because current recommendations err on the side of overapplication of P. The risk management implemented in the recommendations to avoid yield losses is exacerbated by farmers behaving in a similar manner.
Sheriff [19] argued that there are scenarios where the overapplication of nutrients is because (1) a farmer does not believe the fertilizer recommendation will maximize yields; (2) the use of other nutrients as substitutes; (3) failure to appreciate the true opportunity costs of farm inputs; (4) and uncertainty about how weather and soil characteristics may affect the recommended rate of a fertilizer. In the case of P, no other nutrients can be used as substitutions. Beyond weather variations and the perceived potential for increased yields, there are other factors related to downside risk that may lead to decisions to apply even when it is not recommended. Sheriff [19] argues that one reason farmers may be deviating from the recommended rate is because of uncertainty that the recommendations are representative of their field and yields. Similarly, Houser [22] describes how nitrogen is often overapplied in corn as a form of insurance N, or in the case of P, “insurance P”. It was found in this study that despite a mean soil test P level of 76 mg/kg, many growers are likely to apply pre-plant P at means of 44.5 kg ha−1 of P2O5 for soybean, 47.1 kg ha−1 for wheat, 40.69 kg ha−1 for cotton, and the highest for corn at 59.5 kg ha−1 (Figure 6). Preplant P is still utilized by farmers as “insurance” to add a layer of safety [23]. In addition to pre-plant P, the use of another extra P fertilization is a common practice among NC corn farmers. Starter P is a small rate of P added close to seeds at planting, aiming to promote faster seedling growth, a claim that is not backed up by local research results. In the present survey, 52% of respondents who grow corn use starter P fertilizers at an average rate of 32.5 kg ha−1 of P2O5). These results show a compounding conservatism where fertilizer recommendations are higher than what the scientifically established CSTV is because recommendations are on the side of caution not to risk yield losses and then is compounded by farmers also applying more than the recommendation to once again not risk yield losses.
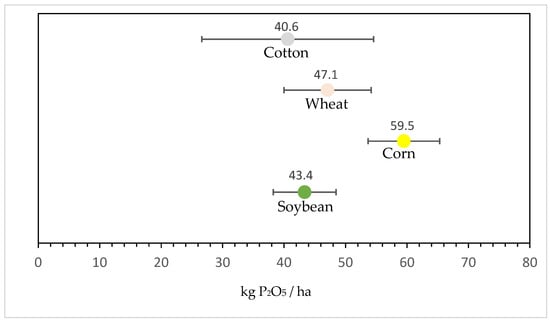
Figure 6.
Kg of P2O5 applied per ha as a pre-plant fertilizer for each crop, error bars indicate the lower and upper confidence interval.
Another explanation for soil test P recommendations and farmer application rates being divergent is that most producers used the same amount of fertilizer for every field of a given crop in order to streamline planting operations. Osmond et al. [24] demonstrated that this was true of farmers both in the Tar-Pamlico River Basin and the Jordan Lake watershed. In the Tar-Pamlico River Basin, 87% of 173 farmers fertilized their same crops with the identical amount of fertilizer regardless of the soil test P or the amount of N required. Likewise, 93% of 129 producers used the same fertilizer mixture on different fields of the same crop in the Jordan Lake watershed [24]. Farmers have a limited amount of time to plant their crops, and time management is often an overlooked component of their decision-making [24].
Thirty-eight percent of the farmers noted plant deficiency symptoms when P fertilizers were not applied. This large number of participants who claim to have seen P deficiency issues may be an indicator that many farmers fear that there will be harm to the plant yields when P fertilizers are not applied. This could explain why many farmers apply some P even when soil test levels show sufficiency (Figure 5). However, it was found that the mean soil test P level of those who had noted visual symptoms was the same as those who had not. These results could suggest inconsistency between the soil testing results and the occurrence of P deficiency in plants; however, the visual symptoms of P deficiency in plants can be confounded with symptoms caused by cold temperatures or plant diseases. Cahill et al. [25], working in North Carolina, found there to be no difference in visual plant deficiencies between soils receiving P versus those that did not when soil test P was high. Thus, farmers may be misidentifying P deficiency, which contributes to their behavior of adding P fertilizers when the soil test report does not recommend it. This may be an explanation for grower responses in this study. Those who identified symptoms of P deficiency with soils already high in P are likely mistaking it for another issue unrelated to P fertility.
There are several reasons why the soil test phosphorus levels in North Carolina are so high [16]. The use of animal manure as fertilizers and the production of tobacco and vegetables have all contributed to the state’s historically high soil test P levels [7,16]. Animal manures are normally used at rates needed to provide the nitrogen needed by crops, resulting in P application above the crop requirements. Fields used for tobacco and vegetable production have been fertilized at high P levels. But when evaluating manures and other organic fertilizers, they played a minor role in soil test P levels, according to the results of this survey. Half of the survey participants do not apply any manure or other organic fertilizers. The mean P level of those who applied ‘none’ was 77 mg/kg, while the mean P level of those who applied poultry litter was 90 mg/kg, with swine lagoon at 69 mg/kg, and other organic fertilizer at 63 mg/kg. This suggests that organic fertilizer decisions may contribute to some variation in P levels, but overall P test levels remain high across participants regardless of the use of organic fertilizers or their organic fertilizer selection. This contrasts with the findings of Miller et al. [16], who showed a strong correlation between soil P and locations with intensive livestock production. Regarding the effect of tobacco production on soil P levels, the mean P level for participants who grew tobacco was 94 mg/kg, and 50% reported that they followed recommendations. The NCDA&CS estimates that 85% of soils with tobacco production have soil test P above 50 mg/kg [26]. As only about 16.8 kg ha−1 of P are removed when the leaves are harvested, even if fertilization is halted, the high P levels are only slowly able to decrease each season. This could be one explanation for why those who follow the recommendations still maintain high P levels.
3.3. Future Use and Price Sensitivity of Phosphorus Fertilizers
Some studies consider the accumulation of P in the soil as an opportunity for growers to use stored soil P in times of increased fertilizer price [1,4]. For example, when the price of fertilizer is low, a farmer could apply higher rates of P than the expected crop removal for that year and rely on the excess P to remain in the soil for future years when the price of P fertilizers may be higher. However, in reality, the majority of North Carolina farmers are not adjusting their fertilizer rates at all despite the recent price increases. In 2021, the price of P fertilizers rose sharply and sustained high costs through the duration of 2022, almost quadrupling the costs of P fertilizers [27]. When asked if this price change influenced their decision to apply, only 9.1% of farmers chose not to apply P due to the price increases (Figure 7). Over half (52%) of farmers maintained their full P rates despite the spike in fertilizer prices. This shows that P fertilizer is a commodity insensitive to price change, as also demonstrated by Al Rawashdeh [28]. Farmers who reduced their rate of P were asked if they will compensate by applying more in future fertilizations, and 69% indicated that they intend to apply more P when the prices of fertilizer drop. The results of this survey indicate that some farmers do use the soil as a P bank when the price of fertilizer is high, as was also found by Wellmer and Scholz [1], but the majority of North Carolina farmers are not changing their fertilizer application habits based on higher prices.
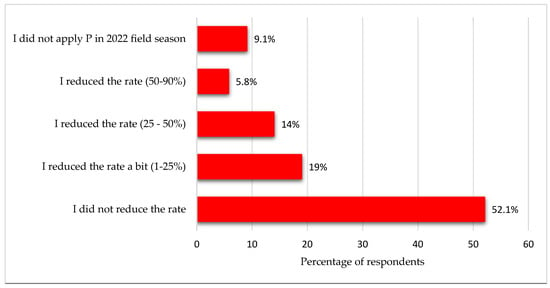
Figure 7.
Percentage of farmers who adjusted their phosphorus application rate in 2022 due to high fertilizer prices.
There are many variables in farming that can cause yield losses that are outside of grower control, such as weather. Fertilizer applications are a known, controllable cost, and P fertilizers represent less than 5% of the costs for farmers, making up only a small fraction. The behavior of farmers shown in this study indicated that they are not willing to risk any yield losses due to lack of fertility and prefer to incur the cost of applying excess fertilizer over risking losing yields. Growers prefer to incur the known and manageable costs of purchasing excess fertilizer as a safety procedure. Survey respondents were asked, “How do you perceive that future price changes in fertilizer might influence your phosphorus applications?” and were given an opportunity to write out short answer responses as qualitative data. Here are examples of some of the responses that indicated farmers are not willing to risk any yield losses due to lack of fertility: “got to have the fertility to have a crop”, “will apply what is needed”, “will change it very little”, “Probably not you have to keep the levels correct cutting out phosphorus cuts out yield”, “prices won’t affect my decision”. It is important to highlight that farmers do not want to take on the perceived risk of yield loss from decreasing fertilizer rates even when there is a null risk of lack of P compromising their yields [20].
3.4. Ineffective and Effective Solutions
Finding a set of solutions to over-application is an ongoing challenge to balance both carrots and sticks. The “sticks” might include government-imposed regulations or taxes designed to compel farmers to use a prescribed application rate [29]. Yet this study shows that taxation of P fertilizers as an incentive to reduce usage will be ineffective, as marginal price increases do not affect fertilizer behavior. Thus, a Pigouvian tax, which is a tax burdened by producers to incentivize less use (in this case, fertilizer) to correct overuse, is implemented as an attempt to correct this inefficiency. A Pigovian tax will not be effective in the case of P fertilizers because P fertilizers are not price sensitive, meaning that a tax will not correct the use. Furthermore, this could also have implications on the price of food, which would add to the cost burden to all consumers, and specifically have the greatest impact on the economically disadvantaged [30]. This can also be seen in an example in Sweden, where Söderholm and Christiernsson [31] found that fertilizer taxes increased production costs and created competitive disadvantages for domestic agriculture, ultimately impacting consumers through higher food prices. Taxation of P fertilizer resources would be an ineffective solution for the reduction in fertilizer use and a burden to consumers. Moreover, regulatory strategies requiring more extensive monitoring are more costly to farmers, more difficult to implement, and often pull farmers in competing directions that diminish the intended impact of the regulation [32].
The preferred set of solutions requires finding voluntary measures—the right set of “carrots”—to encourage farmers to apply P at the recommended rates, and that may turn on supporting technical assistance from those that farmers trust the most. O’Connell and Osmond [15] compared three states, Missouri, Ohio, and North Carolina, asking farmers the question, “Who would you trust to help you evaluate how well you farm operation is doing at keeping nutrients out of waterways”. They found that only 5% of Ohio farmers selected extension compared to North Carolina, where 15% of farmers selected extension as a trusted source. In this same study, North Carolina farmers indicated significantly more willingness and excitement to reduce nutrient loss from their farms than Ohio farmers indicated. This shows that there is potentially a benefit to the extension services provided by the state that are often overlooked, as it is often mistaken for being a service without ties to profits. However, there may be major economic and environmental benefits hidden that a state receives from investing in extension services. The adoption of reduced P fertilization will depend on a strong local trusted technical assistance, continued extension education, and the use of farmer-to-farmer examples [24].
4. Conclusions
The results of this study show that farmers underestimate their soil test P levels, and continue to apply P fertilizers when it is unnecessary, deviating from the official state recommendations. The consequences of this overapplication are soil test P values that are too high, potentially causing environmental damage, the depletion of our precious finite resources, and a reduction in farmer profits. Overapplication is not due to a lack of information about soil test P levels, as 99% of all farmers indicated they are soil sampling as frequently or more frequently than the NCDA recommends. Nevertheless, many farmers report that they add additional P fertilizer on top of what the state extension program recommends, leading to a P application beyond the critical soil test P level. Compounding conservatism occurs where a P buffer is added by the farmers to a rate that already includes a buffer, as set by NCDA&CS and NC State University. This case of compounding conservatism occurs because both growers and recommending bodies want to avoid any possible risk of yield loss, due to a known and controllable variable, in this case, lack of fertility. Lastly, this study found that P fertilizer is price insensitive, with only a few farmers intending to change their P application, even at price increases of almost 6X.
Phosphorous is an essential and irreplaceable finite resource. Consequently, P resources need to be used as efficiently as possible, in order to support a growing population. However, the findings of this study indicate that P resources are not being used efficiently. One solution that has been proposed is a Pigouvian tax, which serves as a disincentive for use. Due to the fertilizer price insensitivity reported in this study, a Pigovian tax is not recommended as it will not adjust the market inefficiencies. Instead, the most beneficial outcome can occur through continued state extension resources devoted to education and farmer relations. This opportunity can lead to an “everyone wins” scenario where farmers will benefit from a reduction in unneeded input costs. Future research has the opportunity to forge collaborations that can address the challenge of finding and implementing the right uses of this valuable resource. All current and future world citizens will benefit from the protection of the environment and water resources as well as the conservation of our limited fertilizer reserves, which are needed for global food security.
Supplementary Materials
The following supporting information can be downloaded at: https://www.mdpi.com/article/10.3390/agriculture15060606/s1.
Author Contributions
L.K.K.: Conceptualization, methodology, formal analysis, investigation, data curation, writing—original draft, and writing—review and editing; L.G.: Conceptualization, methodology, writing—review and editing, resources, supervision, and funding acquisition; D.L.O.: Conceptualization, methodology, and writing—review &editing; A.-M.M.: Writing—review and editing, conceptualization, funding acquisition; A.J.: Writing—review and editing; O.W.D.: Writing—review & editing. All authors have read and agreed to the published version of the manuscript.
Funding
This work was supported by the STEPS Center, a US National Science Foundation Science and Technology Center (CBET-2019435). OWD was supported by the USDA National Institute of Food and Agriculture, Hatch project NC02951.
Institutional Review Board Statement
The study was conducted according to the guidelines of the Declaration of Helsinki, and approved by the Institutional Review Board at North Carolina State University as exempt, protocol code 25630 approved on 30 January 2023.
Data Availability Statement
The data presented in this study are available on request from the corresponding author. The data are not publicly available to protect the privacy of the survey respondents.
Acknowledgments
This research was supported by the Science and Technology for Phosphorus sustainability (STEPS Center), North Carolina county extension agents, North Carolina Soybean Producers Association, Corn Growers Association of North Carolina.
Conflicts of Interest
The authors declare no conflicts of interest.
References
- Wellmer, F.-W.; Scholz, R.W. Peak minerals: What can we learn from the history of mineral economics and the cases of gold and phosphorus? Miner. Econ. 2016, 30, 73–93. [Google Scholar] [CrossRef]
- Davis, K. From Miracle Metal to Global Health Risk: A 100-Year History of Mercury Prices and Production. Geovisualist. 2014. Available online: https://geovisualist.com/2014/02/23/from-miracle-metal-to-global-health-risk-a-100-year-history-of-mercury-prices-and-production/ (accessed on 19 February 2025).
- Fukase, E.; Martin, W. Economic Growth, Convergence, and World Food Demand and Supply; World Bank: Washington, DC, USA, 2020. [Google Scholar] [CrossRef]
- Mew, M.C. Phosphate rock costs, prices and resources interaction. Sci. Total Environ. 2016, 542, 1008–1012. [Google Scholar] [CrossRef]
- Shober, A.L.; Simpson, Z.P.; Jarvie, H.P.; Macrae, M.L.; Kleinman, P.J.A.; Haygarth, P.M.; Kulesza, S.; Gatiboni, L.; Davies, J. Toward a transdisciplinary and unifying definition of legacy phosphorus. J. Environ. Qual. 2024; online ahead of print. [Google Scholar] [CrossRef]
- Gatiboni, L.; Hardy, D.; Osmond, D. Changes in the Phosphorus Fertilizer Recommendations for Corn, Soybean, and Small Grains in North Carolina; NC State Extension Publications: Raleigh NC, USA, 2021; Available online: https://content.ces.ncsu.edu/changes-in-phosphorus-fertilizer-recommendations-for-corn-soybean-and-small-grains (accessed on 3 February 2025).
- Zhang, H.; Antonangelo, J.; Grove, J.; Osmond, D.; Slaton, N.A.; Alford, S.; Florence, R.; Huluka, G.; Hardy, D.H.; Lessl, J.; et al. Variation in Soil-test-based Phosphorus and Potassium Rate Recommendations Across the Southern USA. Soil Sci. Soc. Am. J. 2021, 85, 975–988. [Google Scholar] [CrossRef]
- Culman, S.; Fulford, A.; LaBarge, G.; Watters, H.; Lindsey, L.E.; Dorrance, A.; Deiss, L. Probability of crop response to phosphorus and potassium fertilizer: Lessons from 45 years of Ohio Trials. Soil Sci. Soc. Am. J. 2023, 87, 1207–1220. [Google Scholar] [CrossRef]
- Hardy, D.H.; Tucker, M.R.; Stokes, C.E. Crop Fertilization Based on North Carolina Soil Tests; North Carolina Department of Agriculture, Agronomic Division: Raleigh, NC, USA, 2012.
- Lyons, S.E.; Clark, J.D.; Osmond, D.L.; Parvej, M.R.; Pearce, A.W.; Slaton, N.A.; Spargo, J.T. Current status of US soil test phosphorus and potassium recommendations and analytical methods. Soil Sci. Soc. Am. J. 2023, 87, 985–998. [Google Scholar] [CrossRef]
- Morales, N.; Gatiboni, L.; Osmond, D.; Vann, R.; Kulesza, S.; Crozier, C.; Hardy, D. Critical soil test values of phosphorus and potassium for soybean and corn in three long-term trials in North Carolina. Soil Sci. Soc. Am. J. 2023, 87, 278–290. [Google Scholar] [CrossRef]
- U.S. Department of Agriculture, National Agriculture Statistics Service. 2022 Census of Agriculture, Volume 1, Chapter 1, Table 71: Summary by Farm. 2022. Available online: https://www.nass.usda.gov/Publications/AgCensus/2022/Full_Report/Volume_1,_Chapter_1_State_Level/North_Carolina/st37_1_071_071.pdf (accessed on 3 February 2025).
- Lyons, S.E.; Osmond, D.L.; Slaton, N.A.; Spargo, J.T.; Kleinman, P.J.A.; Arthur, D.K. FRST: A National Soil Testing Database to Improve Soil Fertility Recommendations. Agric. Environ. Lett. 2020, 5, e20008. [Google Scholar] [CrossRef]
- McGrath, J.M.; Spargo, J.; Penn, C.J. Soil Fertility and Plant Nutrition. In Encyclopedia of Agriculture and Food Systems; Academic Press: Cambridge, MA, USA, 2014; pp. 166–184. [Google Scholar] [CrossRef]
- O’Connell, C.; Osmond, D. Why soil testing is not enough: A mixed methods study of farmer nutrient management decision-making among U.S. producers. J. Environ. Manag. 2022, 314, 115027. [Google Scholar] [CrossRef] [PubMed]
- Miller, S.; Kulesza, S.; Gatiboni, L.; Hardy, D.; Sharara, M. Implications of current soil phosphorus levels for manureshed analysis in North Carolina. Soil Sci. Soc. Am. J. 2024, 88, 1374–1385. [Google Scholar] [CrossRef]
- Johnson, A.M.; Osmond, D.L.; Hodges, S.C. Predicted Impact and Evaluation of North Carolina’s Phosphorus Indexing Tool. J. Environ. Qual. 2005, 34, 1801–1810. [Google Scholar] [CrossRef] [PubMed]
- Stuart, D.; Denny, R.; Houser, M.; Reimer, A.P.; Marquart-Pyatt, S. Farmer selection of sources of information for nitrogen management in the US Midwest: Implications for environmental programs. Land Use Policy 2018, 70, 289–297. [Google Scholar] [CrossRef]
- Sheriff, G. Efficient waste? why farmers over-apply nutrients and the implications for policy design. Rev. Agric. Econ. 2005, 27, 542–557. [Google Scholar] [CrossRef]
- Osmond, D.L.; Hoag, D.L.; Luloff, A.E.; Meals, D.W.; Neas, K. Farmers’ use of nutrient management: Lessons from Watershed Case Studies. J. Environ. Qual. 2015, 44, 382–390. [Google Scholar] [CrossRef]
- Osmond, D.L.; Neas, K.; Johnson, A.M.; Cahill, S.L. Fertilizer Use in Regulated River Basins: Is it What We Think? J. Contemp. Water Res. Educ. 2013, 151, 20–26. [Google Scholar] [CrossRef]
- Houser, M. Farmer motivations for excess nitrogen use in the U.S. corn belt. Case Stud. Environ. 2022, 6, 1688823. [Google Scholar] [CrossRef]
- Gatiboni, L.; Osmond, D.; Hardy, D.; Kulesza, S. Starter Phosphorus Fertilizer and Additives in North Carolina Soils: Use, Placement, and Plant Response; NC State Extension Publications: Raleigh NC, USA, 2020; Available online: https://content.ces.ncsu.edu/starter-phosphorus-fertilizer-and-additives-in-nc-soils-use-placement-and-plant-response (accessed on 3 February 2025).
- Osmond, D.; Meals, D.; Hoag, D.; Arabi, M.; Luloff, A.; Jennings, G.; McFarland, M.; Spooner, J.; Sharpley, A.; Line, D. Improving conservation practices programming to protect water quality in agricultural watersheds: Lessons learned from the National Institute of Food and Agriculture-Conservation Effects Assessment Project. J. Soil Water Conserv. 2012, 67, 122A–127A. [Google Scholar] [CrossRef]
- Cahill, S.; Johnson, A.; Osmond, D.; Hardy, D. Response of Corn and Cotton to Starter Phosphorus on Soils Testing Very High in Phosphorus. Agron. J. 2008, 100, 537–542. [Google Scholar] [CrossRef]
- Hardy, D.H.; Tucker, M.R.; Stokes, C.E. Crop Fertilization Based on North Carolina Soil Tests; North Carolina Department of Agriculture, Agronomic Division: Raleigh, NC, USA, 2019; pp. 33–38.
- Brownlie, W.J.; Sutton, M.A.; Cordell, D.; Reay, D.S.; Heal, K.V.; Withers, P.J.; Vanderbeck, I.; Spears, B.M. Phosphorus price spikes: A wake-up call for phosphorus resilience. Front. Sustain. Food Syst. 2023, 7, 1088776. [Google Scholar] [CrossRef]
- Al Rawashdeh, R. Estimating short-run (SR) and long-run (LR) demand elasticities of Phosphate. Miner. Econ. 2022, 36, 239–253. [Google Scholar] [CrossRef]
- Wardropper, C.B.; Genskow, K.; Lavoie, A.; Franklin, D.; Usher, E.; Wilke, A.; Arbuckle, J.; Jackson-Smith, D.; Prokopy, L.; Rissman, A. Policy Process and Problem Framing for State Nutrient Reduction Strategies in the US Upper Mississippi River Basin. J. Soil Water Conserv. 2023, 78, 70–81. [Google Scholar] [CrossRef]
- Johansson, R.C.; Kaplan, J.D.; Peters, M. Fertilizer Taxes and the Environment. In Economic Research Service; USDA: Washington, DC, USA, 2004. [Google Scholar]
- Söderholm, P.; Christiernsson, B. Impacts of Environmental Policy Instruments on Agricultural Practices: Lessons from Sweden; Nordic Council of Ministers: Copenhagen, Denmark, 2008. [Google Scholar]
- Baur, P. When Farmers Are Pulled in Too Many Directions: Comparing Institutional Drivers of Food Safety and Environmental Sustainability in California Agriculture. In Social Innovation and Sustainability Transition; Desa, G., Jia, X., Eds.; Springer Nature: Cham, Switzerland, 2022; pp. 241–260. [Google Scholar] [CrossRef]
Disclaimer/Publisher’s Note: The statements, opinions and data contained in all publications are solely those of the individual author(s) and contributor(s) and not of MDPI and/or the editor(s). MDPI and/or the editor(s) disclaim responsibility for any injury to people or property resulting from any ideas, methods, instructions or products referred to in the content. |
© 2025 by the authors. Licensee MDPI, Basel, Switzerland. This article is an open access article distributed under the terms and conditions of the Creative Commons Attribution (CC BY) license (https://creativecommons.org/licenses/by/4.0/).