Article

The Potential of Green Hydrogen and Power-to-X to Decarbonize the Fertilizer Industry in Jordan

1
Mechatronics Engineering Department, German Jordanian University, Madaba Street, Amman 11180, Jordan
2
Hydrogen and Green Energy Hub, German Jordanian University, Madaba Street, Amman 11180, Jordan
*
Author to whom correspondence should be addressed.
Agriculture 2025, 15(6), 608; https://doi.org/10.3390/agriculture15060608
Submission received: 20 February 2025 / Revised: 7 March 2025 / Accepted: 11 March 2025 / Published: 12 March 2025

Abstract

Considering economic and environmental aspects, this study explored the potential of replacing urea imports in Jordan with local production utilizing green hydrogen, considering agricultural land distribution, fertilizer need, and hydrogen demand. The analysis estimated the 2023 urea imports at approximately 13,991.37 tons and evaluated the corresponding costs under various market scenarios. The cost of urea imports was projected to range between USD 6.30 million and USD 8.39 million; domestic production using green hydrogen would cost significantly more, ranging from USD 30.37 million to USD 70.85 million. Despite the economic challenges, transitioning to green hydrogen would achieve a 100% reduction in CO2 emissions, eliminating 48,739.87 tons of CO2 annually. Considering the Jordanian case, an SWOT analysis was conducted to highlight the potential transition strengths, such as environmental benefits and energy independence, alongside weaknesses, such as high initial costs and infrastructure gaps. A competitive analysis was conducted to determine the competition of green hydrogen-based ammonia compared to conventional methods. Further, the analysis identified opportunities, advancements in green hydrogen technology, and potential policy support. Threats were assessed considering global competition and market dynamics.

1. Introduction

Fertilizers play a crucial role in global food security by replenishing essential nutrients in the soil, thereby increasing crop yields and improving agricultural productivity [1]. The rapid expansion of the global population has intensified the demand for fertilizers, which are fundamental for sustaining large-scale food production in meeting the accelerating global demand [2]. However, the production of fertilizers, especially nitrogen- and ammonia-based ones, is highly energy-intensive and primarily relies on fossil fuel-derived hydrogen, obtained through steam methane reforming (SMR), a process which contributes significantly to greenhouse gas emissions [3].
Green hydrogen and Power-to-X (PtX) technologies have received substantial global attention as key solutions to decarbonize numerous sectors worldwide due to their potential to provide versatile and eco-friendly chemical feedstocks and energy carriers [4]. Power-to-X (PtX) technologies refer to the processes in which hydrogen can react with nitrogen, carbon dioxide, or carbon monoxide to produce chemical alternatives crucial to effectively integrating green hydrogen into various sectors. PtX technologies enable the conversion of green hydrogen into viable fuels and chemical feedstocks such as green ammonia, electro-methane, synthetic gas, and many more sustainable alternatives [5,6].
According to the International Renewable Energy Agency (IRENA) [7], hydrogen can cover 12% of the global final energy demand while mitigating 10% of global emissions [7]. Furthermore, the International Energy Agency [8] predicts that the demand for low-carbon Hydrogen will reach 520 Mega-ton (Mt) by 2050 to decarbonize and partially cover the energy demand for key sectors such as electricity, oil refinery, transport, industry, buildings, and agriculture [8].
Green hydrogen can be utilized directly or indirectly in numerous sectors by integrating it into PtX technologies [9,10,11]. The fertilizer industry is one of the largest contributors to global greenhouse gas emissions, primarily due to ammonia production. Traditional ammonia synthesis relies on the Haber–Bosch process, which is heavily dependent on fossil fuels, leading to significant CO2 emissions. With the increasing need for sustainable agricultural practices, green hydrogen presents a viable alternative, allowing the production of low-emission ammonia through electrolysis-powered hydrogen generation. This study evaluates the feasibility of implementing Power-to-X (PtX) technologies in Jordan’s fertilizer industry to reduce reliance on imported urea and lower emissions [12]. The green hydrogen and PtX value chain has substantial potential to decarbonize the global energy landscape while promoting economic development and resilience for all nations. In 2023, global emissions reached 57.1 Giga-ton of carbon dioxide equivalent (GtCO2-eq), increasing by 1.3% from 2022. Among many root causes, this increase indicates a bounce-back post COVID-19 and showcases that global efforts to counter climate change are not being strictly followed. Figure 1 presents the sectoral breakdown of global emissions in 2023, where land use, land-use change, and forestry are abbreviated (LULUCF) [13].
Ahrens, F. et al. [14] conducted a study to assess the decarbonization potential of green hydrogen in the German agriculture sector. The study concluded that green hydrogen can potentially reduce CO2 emissions from this sector by 33%, 48%, and 63% across three different scenarios, indicating a significant positive impact of utilizing green hydrogen as a source of green ammonia for fertilizer production [14].
Nonetheless, research on the decarbonization potential of the agriculture sector via green hydrogen technologies still falls behind compared to other sectors, even though the agriculture sector is responsible for a significant number of harmful emissions. Therefore, this paper aims to address the potential of green hydrogen and PtX to decarbonize the agriculture sector in Jordan, focusing on the micro and macro scale of the agricultural market.
To date, many studies have been conducted worldwide to assess the decarbonization potential of green hydrogen and PtX in different sectors, including the power sector [15,16,17,18,19], the transportation sector [20,21,22,23], the industrial sector [24,25,26,27,28], the oil refinery sector [29,30,31], and the building sector [32,33,34], and other industrial processes, such as cement production and steel reforming [35,36,37,38,39,40]. To assess the environmental and energetic benefits of integrating renewable energy and green hydrogen technologies in a petrochemical refinery deployed in Yanbu, Saudi Arabia, the authors found that the proposed integrated system could save 414 tons of CO2 equivalent emissions per day while maintaining high energetic and energetic efficiencies of 82.4% and 55.5%, respectively [41].
According to the Food and Agriculture Organization of the United Nations [42], the agricultural sector is a cornerstone of global food security; however, it is considered one of the main contributors to greenhouse gas emissions. In 2018, global emissions due to agriculture were 9.3 billion tons of Co2 equivalent, accounting for 10–12% of global emissions [42]. In 2023, the agricultural sector was responsible for 11% of global greenhouse gas emissions. The agri-food industry’s emissions mainly come from soil, ice cultivation, and fertilizer use [43].
Fertilizer production plays a crucial role in the global carbon footprint, associated with GHG emissions equivalent to 720 million tons of carbon annually, especially nitrogen-based fertilizers, as they rely on energy-intensive processes and conventional sources. The primary component in fertilizers is ammonia, usually produced through methods which emit large amounts of carbon dioxide, threatening the agriculture sector’s sustainability [44].
Ammonia is essential for agricultural productivity as it is a raw material for nitrogen fertilizers. Nitrogen is one of the most essential nutrients for plant growth and crop yields. Hydrogen is another key component of fertilizers. Currently, ammonia production relies on natural gas as a hydrogen source [45].
Hydrogen is involved in the production process of ammonia, particularly in ammonia synthesis. It can be produced using a chemical reaction known as the Haber–Bosch process, in which hydrogen reacts with nitrogen under high pressure and temperature to form ammonia (NH3). The ammonia production process can become carbon-neutral by replacing natural gas with green hydrogen in the Haber–Bosh process [46], helping the transition to more sustainable farming practices and decreasing the impacts of conventional fertilizers. This shift can be crucial in countries like Jordan, as agriculture is one of the mainstay sectors of the economy. Still, it faces many challenges, such as water scarcity and using conventional imported fertilizers. As a result, adopting green hydrogen technology can support self-reliance in the agriculture sector [47].
Due to their high nitrogen content, ammonia-based fertilizers are widely used in agriculture. Four types of fertilizers are directly produced from ammonia. Ammonium nitrate (NH4NO3) is one of these kinds of fertilizer, synthesized through the reaction of ammonia with nitric acid; this reaction results in a highly soluble compound with 34% nitrogen content, which can be considered a nutrient for rapid plant uptake. Another type of ammonia-derived fertilizer is ammonium sulfate ((NH4)2SO4), produced by neutralizing ammonia with sulfuric acid. Sulfate ammonium provides 21% nitrogen and 24% sulfur, essential for crops like canola and legumes. Moreover, it is particularly beneficial for soil deficient in sulfur. However, it has a lower nitrogen content compared to other types [48].
Another widely used fertilizer is urea ((NH2)2CO). Urea is produced by the direct reaction between ammonia and carbon dioxide under high pressure and temperature conditions. It contains 46% nitrogen, making it the most concentrated nitrogen fertilizer. Urea allows for soil application, and foliar sprays can be blended with other fertilizers. Despite its advantages, some challenges are related to volatilization losses when left on the soil without incorporation. The fourth type of fertilizer is anhydrous ammonia, which is ammonia in its purest form, with 82% nitrogen content, the highest out of all fertilizers. Anhydrous ammonia is cost-effective for large-scale farming operations. However, its pressurized state and toxicity require extreme care [48,49,50].
The Jordanian population has significantly increased over the past two decades, from 5.6 million in 2004 to 11.6 million in April 2024 [51]. Jordan is considered a net food-importing country, with 98% of its consumables imported from abroad. These include rice, fruits, cheese, beef, and food preparation [52]. The Jordanian agriculture sector faces several challenges, including severe water scarcity, increased urbanization, and a lack of agricultural land within the country, as a significant portion of Jordan’s territories consists of arid desert [53,54]. Still, the sector is pivotal in supporting the Jordanian economy by contributing 5.9% of the GDP in 2022 [52]. This contribution is due to the sector’s ability to reinforce food security while providing employment opportunities for inhabitants across the country [55].
Land use in Jordan is marked by changing patterns, primarily in the form of urbanization, which plays a significant role in the conversion of agricultural land. This shift is driven by population growth, climate change, and growing water scarcity. Jordan’s total area is 89,342 km2, of which 88,802 km2 is land and 540 km2 is water. Jordan is generally considered a low-rainfall region with an annual rainfall of less than 200 mm, as around 86% of the country’s land is a desert. Only 9.98% of Jordan’s land is classified as agricultural land (=8864 km2) by Jordanian authorities. Further, roughly only 3.1% of Jordan’s lands have been cultivated (=2800 km2) on average between 2005 and 2023. Out of the cultivated areas in Jordan, around 1680 km2 (=60%) is rainfed, while around 1120 km2 (=40%) is irrigated. Figure 2 shows the total land use in Jordan, focusing on agricultural land classification, with percentages for each section [56,57].
The primary source of ammonia in Jordan is import, as the country lacks large-scale production facilities. It is a key component in producing nitrogen-based fertilizers such as urea and ammonium nitrate, and it is extensively used in agriculture to enhance soil fertility and crop yields. The growing demand for ammonia in these sectors underscores its significance in Jordan’s economy. However, this dependency on imported ammonia poses challenges related to supply chain stability and greenhouse gas emissions, highlighting the need for sustainable and localized ammonia production solutions in the future. The domestic demand for ammonia in Jordan is approximately 450,000 tons annually [58].
There are six categories of fertilizers used in Jordan, split between chemical and organic. The first category is nitrogen-based fertilizers, essential for promoting plant growth and leaf development. One example is urea, which contains a high amount of nitrogen. The second category is phosphorus fertilizers, which enhance root growth and support flow, such as SSP, TSP, and DAP. In addition, compound (NPK) fertilizers provide a balanced combination of essential nutrients, enhancing crop productivity and quality. Moreover, organic and micronutrient fertilizers supply essential micronutrients like zinc, iron, and manganese [59,60]. The consumption of fertilizers from 2009 to 2022 in Jordan is shown in Figure 3. The chart shows fluctuations over 14 years of fertilizer consumption in Jordan. In 2010, a peak value of 313.359 thousand tons was reached. The trend gradually declined, as consumption dropped to 85.75 thousand tons in 2022 [61,62].
Jordan produces only a fraction of its fertilizer needs domestically and meets the rest of the demand by heavily relying on imports. This reliance is causing many economic, logistical, and environmental challenges, affecting the sustainability of the agricultural sector [63].
According to recent data, Jordan imported 112 shipments of fertilizers between 2023 and 2024, marking a growth rate of −2%. However, import trends fluctuate. In February 2024, Jordan’s fertilizer imports surged by 120% compared to the previous year. Turkey, India, and Mexico are the primary sources of Jordan’s fertilizer imports, supplying the country with various fertilizers [64].
The global shift toward sustainable energy has increased interest in renewable energy (RE) resources and green hydrogen production. With its substantial renewable energy potential, Jordan is well positioned to contribute to this transition. These resources are pivotal for the country’s energy transition and provide the foundation for green hydrogen production. Jordan experiences one of the highest solar radiation levels globally, receiving 5–7 kWh/m2/day. The country enjoys more than 300 sunny days annually, which makes Jordan ideal for solar energy projects. Key solar installations include the Ma’an Solar Park and the Shams Ma’an Project, which contribute significantly to the country’s renewable energy capacity [65]. Wind energy is another abundant resource in Jordan. The country’s topography, especially in areas like Tafila, Irbid, and the Jordan Valley, offers wind speeds ranging from 7 to 11 m/s. Notable projects such as the Tafila Wind Farm have demonstrated the feasibility of large-scale wind energy production, with the Tafila project alone having a capacity of 117 MW [66]. Jordan has made significant strides in integrating renewable energy into its electricity grid. In 2024, renewable energy accounted for over 20% of the national electricity mix. Policies such as the Renewable Energy and Energy Efficiency Law have encouraged investments in renewable energy projects, making Jordan a regional leader in RE deployment [67]. The abundance of renewable energy resources positions Jordan as a potential hub for green hydrogen production. Green hydrogen, produced through electrolysis powered by renewable electricity, offers a sustainable solution for decarbonizing various sectors [68].

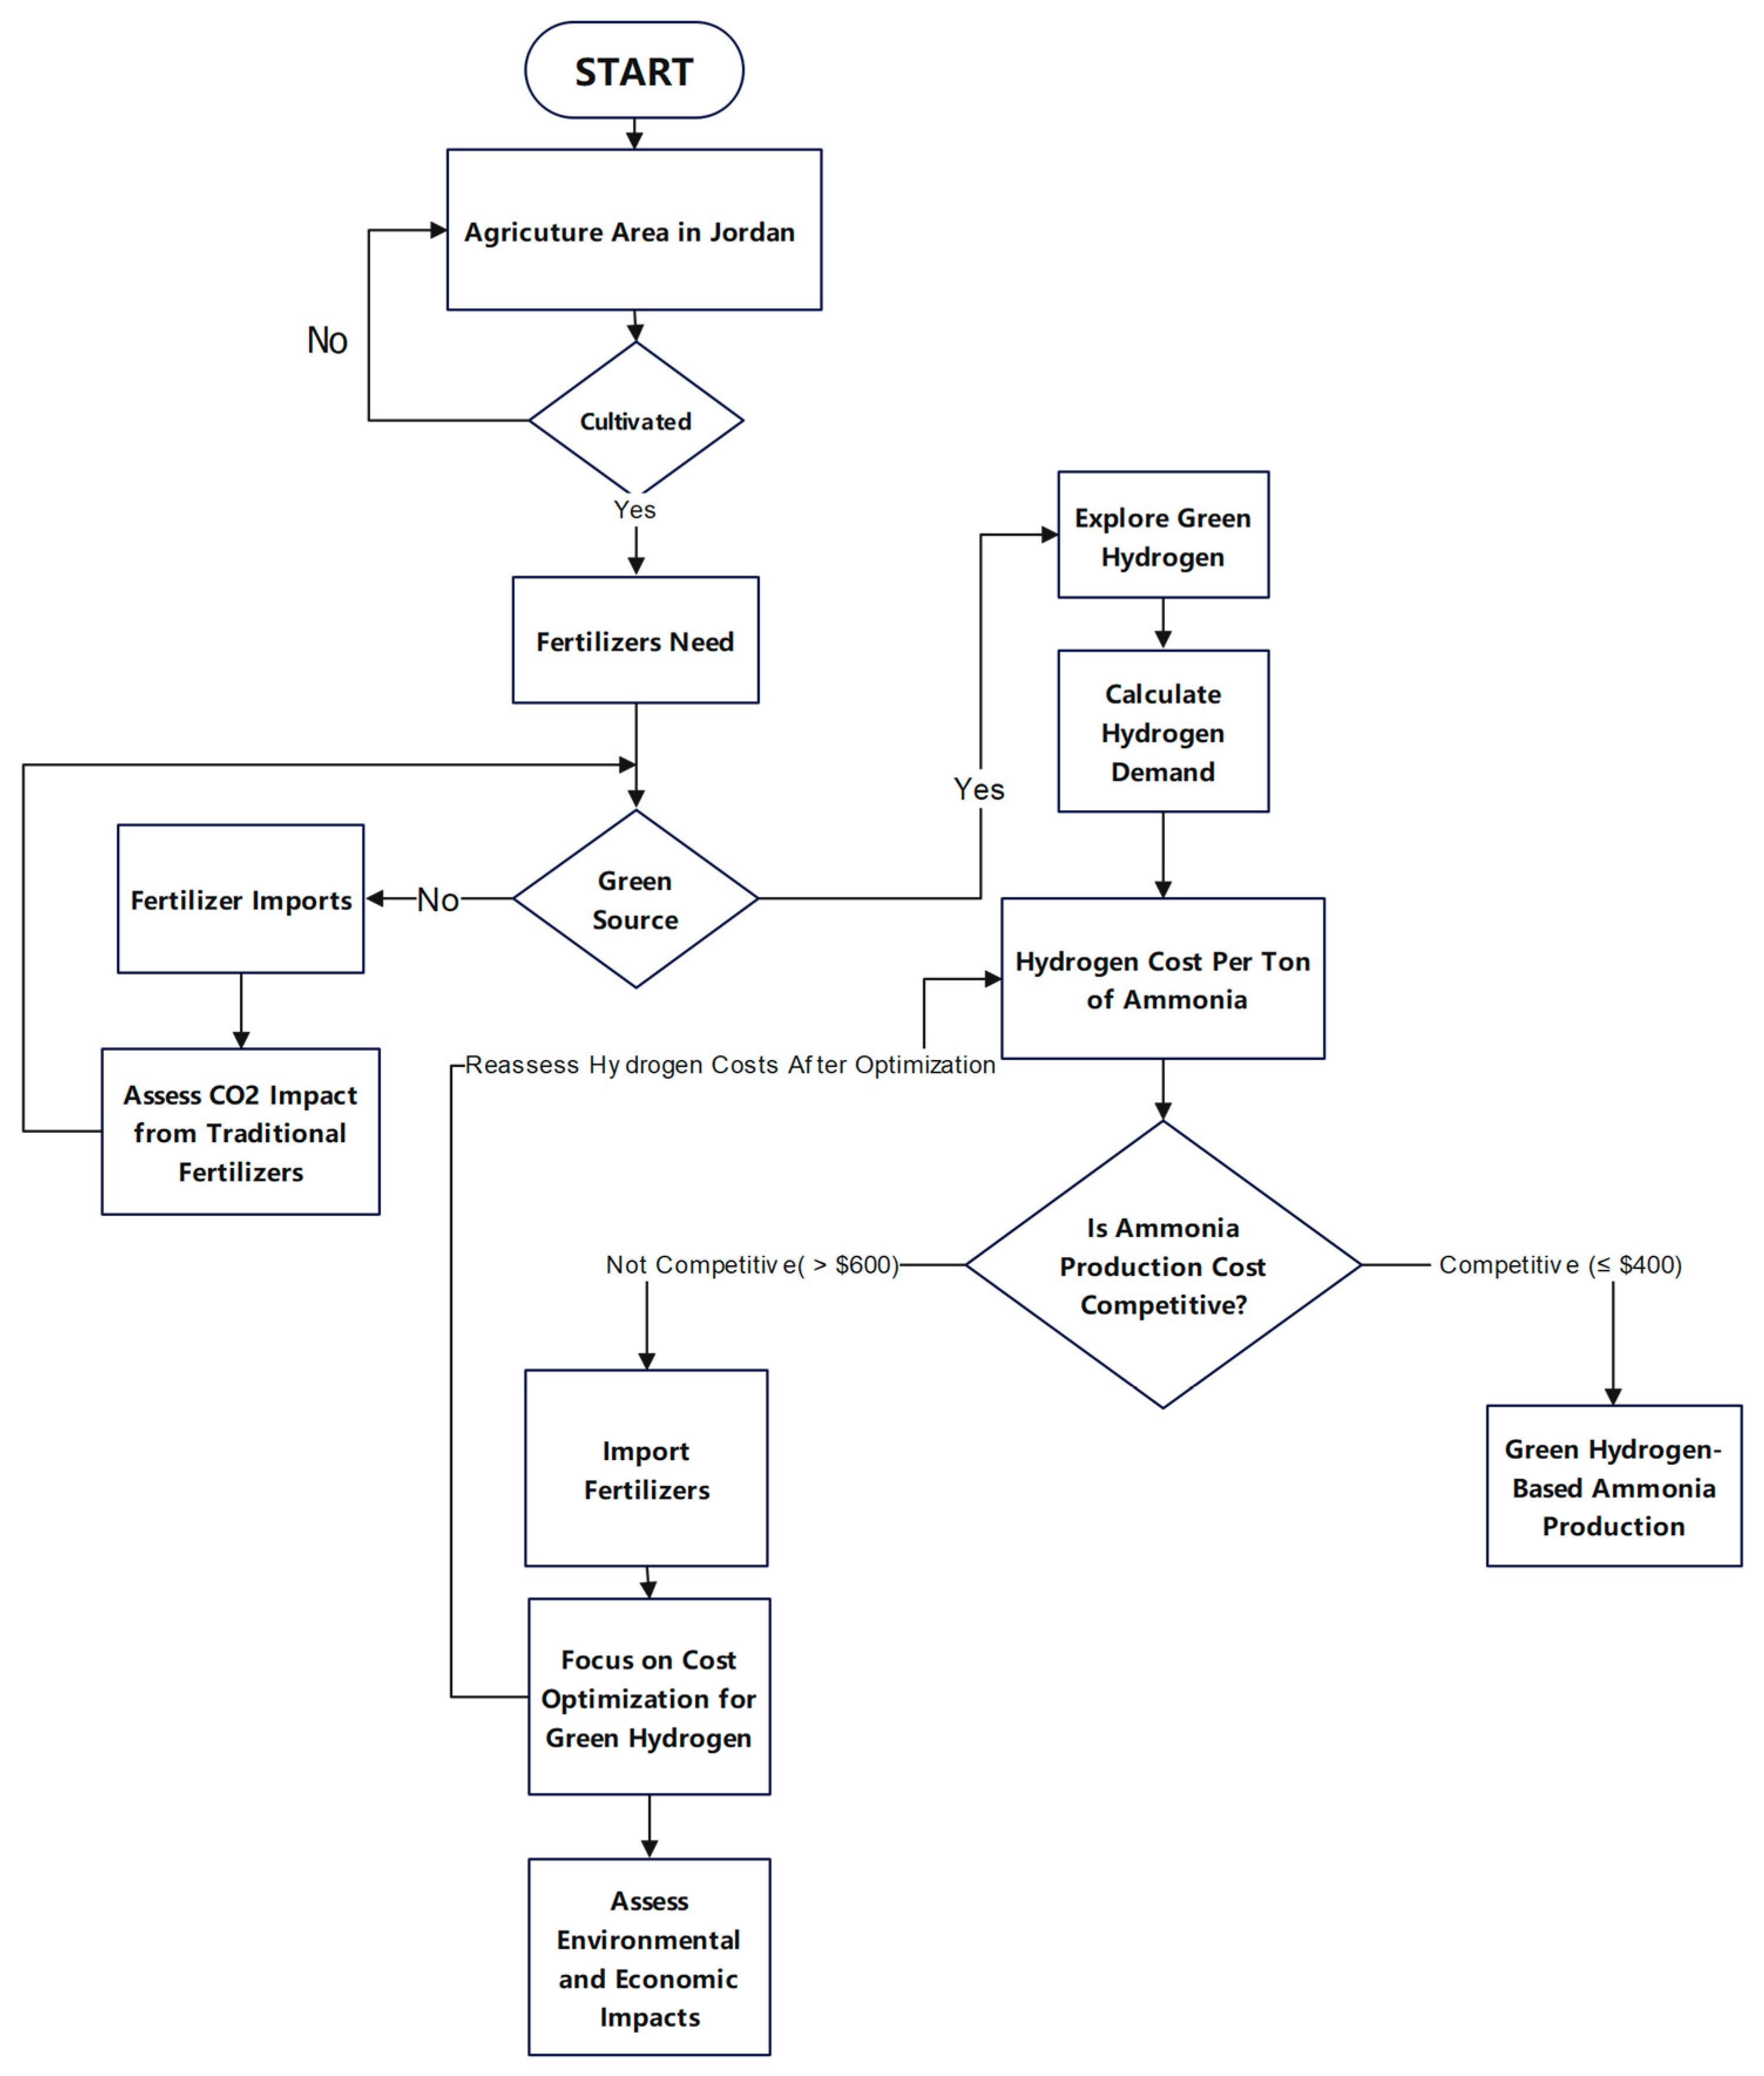
2. Materials and Methods

The agricultural land area in Jordan was analyzed for its historical development as a percentage of the country’s total land area. This analysis was based on the period from 2005 to 2023. The data related to agricultural land area were taken from the annual reports released by the Jordanian Ministry of Agriculture. The analysis revealed that the data showed no consistent trend or correlation (R2), as the values kept fluctuating around 3.5% of the total land area, considering this value a stable baseline over time. Consequently, forecasting or regression was not feasible. Instead, three scenarios were developed for agricultural land areas in Jordan until the year 2050.
The neutral scenario consisted of a constant land area, the optimistic one assumed an annual increase of 2%, and the pessimistic scenario projected a 2% yearly decrease in the agricultural land area. These scenarios allowed for a structured framework to evaluate the potential future trends in agricultural land use despite the lack of a clear historical trend.
While specific data pinpointing a 2% change may be limited, Jordan’s agricultural land area is subject to dynamic changes influenced by multiple factors, making it challenging to maintain a consistent growth rate of 3.5%, which makes the selected rate more reasonable based on various environmental, economic, and policy-related factors. Cities like Amman and Irbid experience rapid growth that encroaches upon farmland, which reflects how urban expansion affects agricultural land expansion. Additionally, Jordan ranks among the world’s most water-stressed countries, which makes water scarcity another critical challenge which affects the change in agricultural land’s total area. Climate change further exacerbates this issue, with declining precipitation rates negatively affecting irrigation and crop productivity. Land degradation caused by overgrazing and unsustainable farming practices continues to reduce soil fertility, making agricultural expansion increasingly difficult. These interconnected challenges indicate that, while the percentage fluctuated around 3.5% as a theoretical expansion rate, the combined factors justify a more conservative assumption of a 2% annual change in agricultural land area. This estimation provides a balanced and realistic framework for evaluating future agriculture trends in Jordan.
Due to insufficient data, there were some difficulties in performing precise calculations for fertilizer production within the Jordanian context. As a result, our analysis was based on agricultural land areas dedicated to different crop categories in Jordan, such as fruits, vegetables, grains, olives, and greenhouse crops. Then, a further analysis was conducted for each specific crop category (e.g., vegetables like tomatoes, cucumbers, and eggplants) if the cultivated areas remained constant through 2023. All the data for this analysis were derived from the Annual Report by the Jordanian Ministry of Agriculture 2023.
Even though this study relied on typical values and standard recommendations for fertilizer usage, such values were obtained from official sources, including consumer data, official agriculture agencies, and official governmental websites. These references provided approximate nitrogen requirements per unit area for each crop category, except for the greenhouse category, for which the calculations were conducted for each production unit.
After gathering the required information for each crop, this study referred to global best practices to determine the typical nitrogen fertilizer usage. Nitrogen content requirements were assessed for each crop within all the categories. Once each crop’s nitrogen demand has been calculated, each category’s total requirement was aggregated. The following steps were used to estimate the amount of hydrogen required for ammonia synthesis, as hydrogen is the primary input for the Haber–Bosh process and the amount of hydrogen in the urea.
Hence, Equation (1) was used to estimate the required amount of urea based on the nitrogen content.
Q U = Q N 46 %
QU represents the amount of urea in tons, where 0.46 represents the percentage of nitrogen in urea; in other words, urea contains 46% nitrogen by weight.
Therefore, the required amount of ammonia in the urea could be calculated using Equation (2).
Q N H 3 = Q U × 57 %
QNH3 represents the amount of ammonia in tons, and 0.57 tons of ammonia is required to produce 1 ton of urea through the Haber–Bosch and urea synthesis process. Using stoichiometry from the Haber–Bosch reaction in Equation (3), we obtained the following:
N 2 + 3 H 2 2 N H 3
The molar mass of ammonia is 17 g/mol, and the molar mass of hydrogen is 1.00784 g/mol. Hence, for every ton of ammonia produced, approximately 17.8% per ton of hydrogen is needed, which can be calculated based on Equation (4):
Q H 2 = Q N H 3 × 17.8 %
QH2 represents the amount of hydrogen in tons. The environmental impact of transitioning to green hydrogen for urea production was evaluated, and the total amount of ammonia required for 2023 was calculated. The corresponding CO2 emissions were estimated for the same year based on conventional ammonia production methods. This analysis highlighted the significance of the environmental benefits of adopting green hydrogen in ammonia production. The total ammonia demand was determined based on historical urea import data and the conversion rate of urea to ammonia. CO2 emissions for 2023 were derived from the standard emissions factor for conventional ammonia production using Equation (5). Typical CO2 emission factors range from 1.8 to 2 tons per ton.
Q C O 2 = Q N H 3 × E F
QCO2 is the CO2 emission in tons, and EF is the emission factor. In addition, an economic analysis was conducted to compare the cost of urea imports in 2023—as Jordan depends on importation instead of local production of fertilizers—with the potential cost of producing green hydrogen domestically to fulfill ammonia requirements for urea production. The analysis used historical urea import data from credible sources to estimate future trends. The reported import values for urea were as follows [69]. In 2021, 13,400 tons was imported, compared to 12,000 tons expected in 2026, which was calculated based on the compound annual growth. The compound annual growth rate (CAGR) was calculated to quantify the decline in urea imports given by Equation (6):
CAGR = FV n 1 IV 1
FV is the final value, IV is the initial value, and n is the number of years.
The cost of producing urea domestically using hydrogen depends on the amount of hydrogen required to produce ammonia and the cost of producing green hydrogen. Accordingly, the cost of urea imports was calculated using Equation (7).
C Urea = Q Urea × P Urea
CUrea is the cost of urea imports, QUrea is the quantity of urea in tons, and PUrea is the price of a ton in USD. In order to compare the cost of urea imports and the utilization of green hydrogen, Equation (8) was used to find the cost of green hydrogen, and Equation (9) was used to see the difference between the cost of urea imports and green hydrogen production.
C H 2 = Q H 2 × P H 2
CH2 is the cost of green hydrogen, QH2 is the quantity of green hydrogen in tons, and PH2 is the price of a ton in USD.
Δ C = C Urea C H 2
ΔC is the difference between the cost of urea import and green hydrogen production costs.
The final step was calculating the break-even price (BEP) using Equation (10), representing the maximum price at which green hydrogen can be produced to remain cost-competitive with imported urea. Ultimately, a sensitivity analysis was conducted to ensure the reliability of the economic comparison between urea imports and domestic production using green hydrogen technology. This analysis examined how variations in key parameters affected the overall cost-effectiveness.
B E P = C U r e a Q H 2
The sensitivity analysis focused on the following key variables affecting the total cost:
  • Hydrogen price: Varying between USD 3/kg and USD 7/kg.
  • Urea price: Global market prices for urea fluctuate, with a range of 450 USD/ton to 600 USD/ton.
  • Urea import quantity: Derived from historical trends and projected rates.
The analysis was performed by systematically varying one parameter at a time. For each scenario, the total cost of urea imports and green hydrogen-based production was calculated to determine its impact on the cost comparison.
Three scenarios were analyzed to estimate the potential variability in costs.
Table 1 represents the three scenarios analyzed to estimate the potential cost variability associated with urea production using green hydrogen. Three scenarios were conducted: baseline, best-, and worst-case scenarios, each representing different combinations of urea and hydrogen prices. The baseline scenario reflected average market conditions with midpoint values for both prices (USD 525/ton for urea and USD 5/kg for hydrogen). On the other hand, the best-case scenario reflected a low hydrogen price of USD 3/kg with a high urea price of USD 600/ton, maximizing cost savings. In contrast, a high hydrogen price of USD 7/kg was assumed in the worst-case scenario, with a low urea price of USD 450/ton, representing the least favorable conditions. After simulating the three scenarios, the sensitivity analysis assessed the economic feasibility under varying market conditions.
The sensitivity analysis further evaluated how key variables, such as hydrogen and urea market price changes, affected the break-even point, providing insights into the economic threshold under which green hydrogen production became favorable compared to urea imports. Figure 4 illustrates a step-by-step research framework for analyzing the fertilizer sector.
A cost-competitive analysis was also conducted, defining the range of hydrogen prices based on market scenario analysis from USD 2 to USD 10 per kilogram, a typical cost range depending on production methods and energy sources.
The ammonia production cost was calculated using the hydrogen price and the fixed hydrogen consumption rate of 195.56 kg per ton, as follows:
C N H 3 = C H 2 × 195.56
CNH3 is the ammonia production cost in USD per ton, and CH2 is the hydrogen price in USD per ton. This formula assumed a fixed ammonia synthesis efficiency and excluded variations in energy cost infrastructure. The flowchart in Figure 4 illustrates the decision-making process for ammonia production in Jordan based on hydrogen costs and environmental impacts.

3. Results and Discussion

The analysis began with historical land area data collected from 2005 until 2023 based on the Jordanian Ministry of Agriculture’s annual reports. The dataset fluctuated without a clear trend as the values of the agricultural area for each year varied around 3.5% from the total country’s area. Due to the absence of a consistent trend, it was necessary to develop projection scenarios based on hypothetical growth rates. To project the land area for the period from 2023 to 2050, three distinct scenarios were considered, as shown in Figure 5, to account for potential variability in agricultural land use:
  • Neutral scenario: Assumed that the land area would remain constant from 2023 until 2050.
  • Optimistic Scenario: Assumed an annual increase of 2% in the land area for the same period.
  • Pessimistic Scenario: Estimated a 2% annual decrease in the land area for the same period.
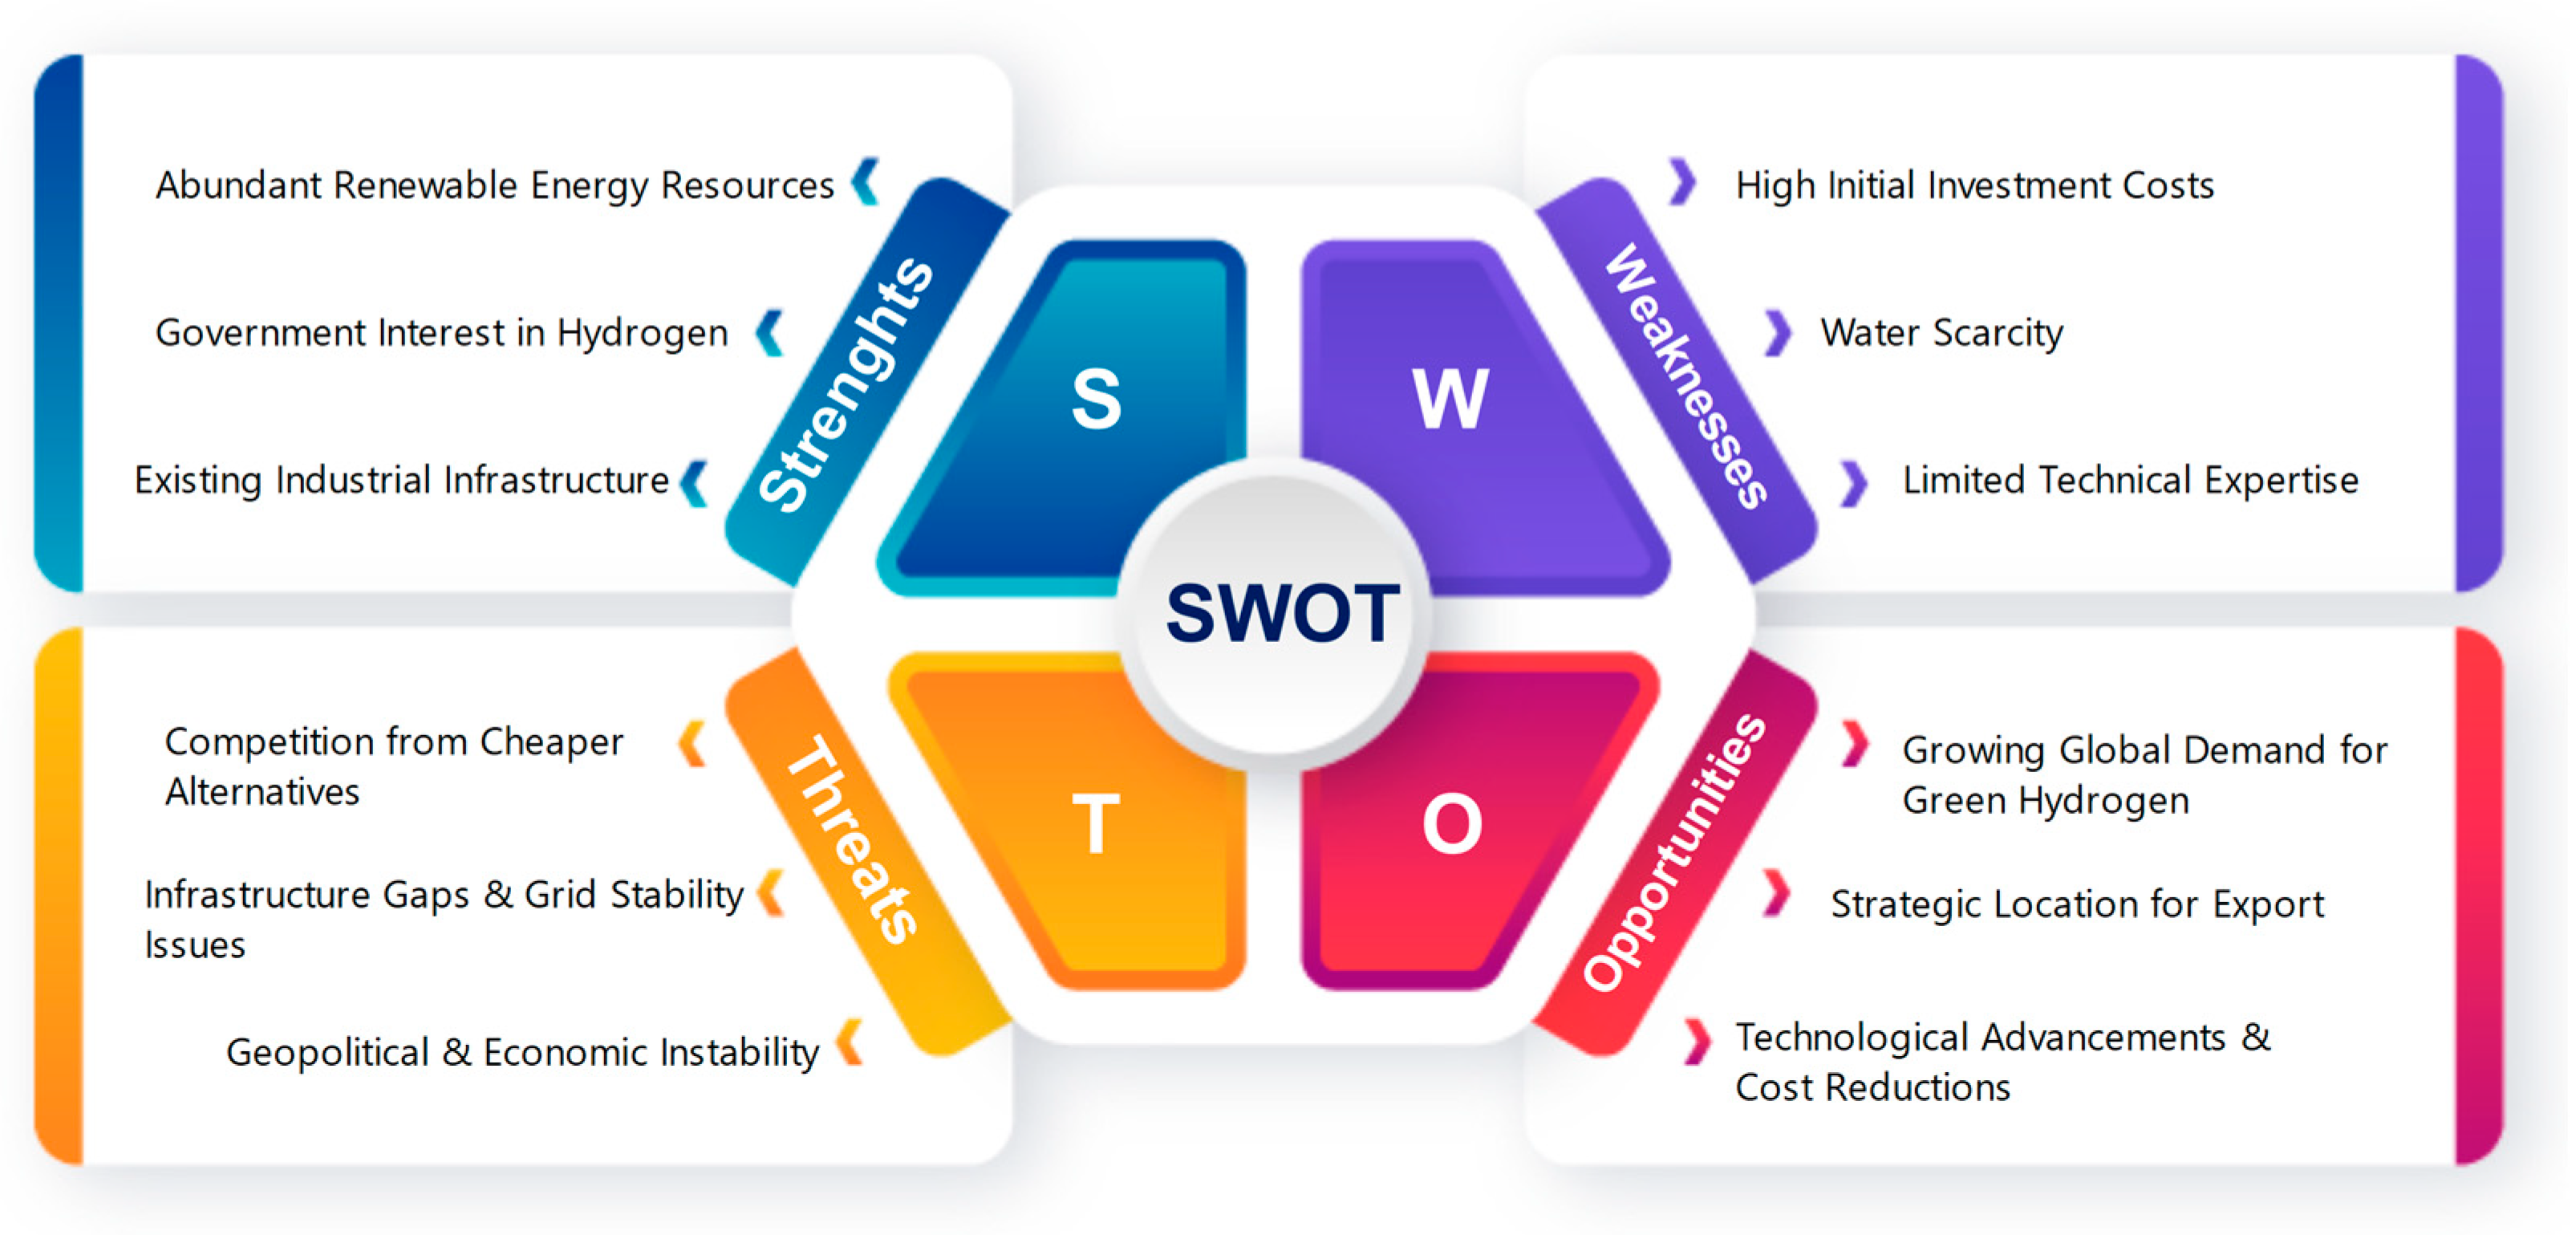
Figure 5 illustrates the historical data from 2005 to 2023 and the projected land area under the three scenarios from 2024 to 2050. The blue line represents the historical data, showing fluctuations without a clear trend consistent with the observed average variability of around 3.5%. On the other hand, the optimistic scenario represented by the blue line indicates a steady annual increase in the planted area. The last scenario, represented by the green line, is the neutral scenario, where the land area remains constant. The red line shows a pessimistic scenario, projecting a decline in agricultural land. A further analysis incorporated these land area projections into the economic models to assess their influence on agricultural productivity, resource allocation, and sustainability planning. The total area cultivated with different crop types, including vegetables, grains, olives, fruits, citrus, and greenhouse, was obtained from the report. In this section, fruits are used as an example to illustrate the calculation process, as the same approach was applied to the rest of the categories. After obtaining the total area cultivated with different fruit crops, apples were determined to cover an area of 19,260 dunums, grapes 88,490 dunums, and bananas 16,708 dunums. Figure 6 illustrates the cultivated area for different fruit crops in Jordan.
The nitrogen demand for each crop per dunum was obtained from global open source resources [69,70,71,72,73,74,75,76,77,78,79,80,81,82,83,84,85,86,87,88,89,90,91,92,93,94,95,96,97,98,99,100,101,102,103,104,105]. This approach was adopted due to the lack of data regarding the specific nitrogen requirements for different crops with respect to Jordan’s context. Hence, typical standard values for nitrogen requirements according to globally followed guidelines were adopted in this research. For each crop type, the values for nitrogen requirements per dunum were multiplied by the total cultivated area for each crop to determine the total nitrogen requirements. For instance, apples with an area of 19,260 dunums and a nitrogen demand of 35 kg per dunum resulted in a total nitrogen demand of 674,103.5 kg.
The total urea required was calculated using Equation (2), accounting for urea containing 46% nitrogen. For apples, it was found that 1,465,442.39   k g of urea was required, calculated using Equation (1).
Meanwhile, 835,302.16   k g of ammonia was required for apples using Equation (2), as this equation reflected that 57% of urea mass was equivalent to ammonia. Then, 148,683.79   k g of hydrogen was needed for apples, calculated using Equation (4), based on the stoichiometric relationship between ammonia and hydrogen. Figure 7 illustrates the amount of nitrogen, hydrogen, urea, and ammonia demand for each fruit crop type in Jordan for 2023.
Then, the three scenarios were simulated to evaluate the hydrogen demand under different conditions.
Figure 8 illustrates the estimated hydrogen demand (in tons) for different fruit crops in 2023 under the three previously mentioned scenarios. The dark blue bars represent the optimistic scenario, which assumes maximum hydrogen utilization efficiency, while the light blue bars represent the pessimistic scenario, which shows the lowest efficiency. The neutral scenario presented by the green bars reflects a balanced approach based on average conditions.
Figure 8 and Figure 9 illustrate the total hydrogen demand for fruit crops under three scenarios—optimistic, neutral, and pessimistic. The optimistic scenario shows the highest hydrogen demand across all fruit crops, with a projected 2% increase in agricultural areas. The neutral scenario serves as a baseline for hydrogen with no significant changes, falling between the optimistic and pessimistic projections. Ultimately, the 2% decline in agricultural productivity shown in the pessimistic scenario presents the lowest hydrogen demand. The same calculation process was applied to all categories and crops mentioned in the report. In addition to hydrogen demand, the CO2 emissions associated with ammonia production were also evaluated and are summarized in Table 2. The calculation considered a potential reduction achievable through the adoption of green ammonia.
Based on the total amount of ammonia required for various crops in 2023, current CO2 emissions were calculated. The total ammonia demand was 27,077.71 tons, resulting in 48,739.87 tons of CO2 emissions. As a result, by replacing conventional ammonia with green types, CO2 emissions could be eliminated. Using the compound annual growth rate (CAGR) formula, the urea imports for 2023 could be estimated. The CAGR was about −2.183%, and the estimated 2023 imports were 13,991.37113 tons. This projection was based on the historical trend observed between 2021 and 2026, specifically a gradual decrease in urea imports, from 13,400 tons in 2021 to 12,000 tons in 2026. The estimated total cost of urea imports for 2023 was calculated under the scenarios based on global market prices.
Table 3 shows the three scenarios that were used to estimate the cost of urea imports in 2023. These values indicated a significant sensitivity of import costs to market price fluctuations. The domestic urea production using green hydrogen was evaluated based on a total hydrogen requirement of 10,122.06 tons. The production cost was assessed under three hydrogen price scenarios.
As shown in Table 4, three scenarios were used to estimate the cost of green hydrogen production in 2023. These results demonstrate that the cost of green hydrogen is a critical factor influencing the economic feasibility of domestic urea production. The comparison of urea import costs and green hydrogen production costs revealed a significant cost gap in all scenarios. Even in the best-case scenario, where hydrogen prices were at their lowest and urea prices at their highest, green hydrogen production was still USD 21.97 million more expensive than imports. This gap widened to USD 43.26 million in the baseline scenario and USD 64.56 million in the worst-case scenario. While the economic analysis highlighted the higher cost of green hydrogen production, the environmental benefits were significant. Conventional urea production resulted in approximately 115,902.97 tons of CO2 emissions annually. By transitioning to green hydrogen, these emissions could be reduced to zero, achieving a 100% reduction in CO2 emissions. This aligns with global efforts to reduce greenhouse gas emissions and combat climate change.
As hydrogen production technologies advance and economies of scale are realized, the cost gap between urea imports and domestic green hydrogen-based urea production is expected to narrow. By 2030, green hydrogen production costs are projected to fall to USD 1.5–USD 2 per kg, significantly improving the competitiveness of locally produced urea. This cost reduction, combined with policy interventions such as carbon pricing, subsidies, and renewable energy incentives, can further enhance the economic viability of green hydrogen projects. Additionally, technological innovations in electrolysis, ammonia synthesis, and process optimization will contribute to lowering production costs, ultimately making domestic urea production an increasingly attractive alternative to imports.
Based on hydrogen price points with predefined cost thresholds, an evaluation of the economic competitiveness of ammonia production using green hydrogen production rather than ammonia importation was conducted to compare the production cost of ammonia at various hydrogen prices. The analysis calculated ammonia production costs (USD/ton) for hydrogen prices ranging from 2 USD to 10 USD per kilogram, assuming 195.56 kg per ton of ammonia as a fixed value of hydrogen consumption. Two competitiveness thresholds were defined.
Minimum Cost (400 USD): This represented a highly competitive range for ammonia production.
Maximum Cost (600 USD): This represented a moderately competitive range.
The bar chart in Figure 10 illustrates the results, as the green bar indicates competitive ammonia production costs (≤USD 400), and the red bars indicate noncompetitive costs (>USD 600). This visual representation compares the impact of hydrogen price on ammonia production costs. The chart illustrates that ammonia production remains competitive only when hydrogen prices are equal to or below USD 2 per kilogram, which reflects the need for cost optimization in green hydrogen production to achieve economic feasibility.

4. SWOT Analysis

This study investigates the potential of replacing imported urea with domestically produced urea using green hydrogen technology. It mainly aims to reduce carbon emissions and enhance sustainability in the agricultural sector. Figure 11 depicts the SWOT analysis results to evaluate the transition feasibility to green hydrogen technology.
Jordan possesses abundant renewable energy resources, particularly solar and wind, which provide a stable foundation for green hydrogen production. Additionally, the country has existing industrial infrastructure, including ammonia production facilities, which can be adapted for hydrogen integration. The government’s interest in hydrogen and policies promoting renewable energy further create opportunities for incentives and regulatory support. However, high initial investment costs remain a significant barrier, as green hydrogen production requires substantial funding for electrolyzers, infrastructure, and storage. Additionally, Jordan faces severe water scarcity, which poses a challenge for electrolysis-based hydrogen production. Another weakness is the limited technical expertise in large-scale hydrogen production, necessitating capacity-building initiatives to develop a skilled workforce.
Despite these challenges, Jordan’s strategic location presents a major opportunity to establish itself as a regional hub for green hydrogen and ammonia exports to Europe and the MENA region. The growing global demand for green hydrogen and continuous technological advancements in electrolyzers are expected to lower production costs, making green hydrogen more competitive in the future. However, several external threats could hinder this progress. Competition from cheaper alternatives, such as natural gas-based ammonia production, remains a significant challenge, delaying green hydrogen adoption. Moreover, infrastructure gaps and grid stability issues may require costly upgrades to enable large-scale hydrogen integration. Lastly, geopolitical and economic instability could impact Jordan’s reliance on international financing, making large-scale hydrogen projects vulnerable to global market fluctuations. By leveraging its strengths and opportunities while addressing key weaknesses and threats, Jordan can position itself as a leader in the green hydrogen economy while ensuring long-term sustainability in its fertilizer industry [106,107,108,109,110,111].

5. Conclusions

This study explores the dual potential of green hydrogen-based urea production in Jordan, aiming to eliminate 100% of CO2 emissions from conventional urea production. The transition aligns with global decarbonization goals and positions Jordan as a leader in sustainable agricultural practices. However, the economic analysis shows substantial challenges, with domestic green hydrogen production costing significantly more than urea imports under current market conditions. Dealing with these challenges will require advances in hydrogen production technologies and the implementation of supportive policies, such as subsidies and carbon pricing. The SWOT analysis emphasizes that, while the project offers long-term strategic opportunities, its success hinges on overcoming high costs and infrastructure limitations. With proper investment and strategic planning, Jordan can leverage green hydrogen to create a more sustainable and self-reliant agricultural sector, contributing to its broader environmental and economic objectives. Future work should focus on optimizing green hydrogen infrastructure and exploring financial mechanisms to bridge the competitiveness gap.

6. Limitations and Future Research Directions

Despite the contributions of this study in assessing the potential of green hydrogen for decarbonizing Jordan’s fertilizer industry, several limitations must be acknowledged for future development.
One key limitation is the reliance on scenario-based projections with fixed annual changes in agricultural land area (±2%). While this method provides a structured approach to estimating future trends, it does not fully capture the complexities of urban expansion, water scarcity, and climate variability, which can significantly influence land-use patterns. More advanced techniques, such as stochastic modeling or GIS-based land-use forecasting, could offer a more dynamic and data-driven representation of these changes. However, due to data availability constraints and the scope of this study, implementing such methods was not feasible. Future research should explore dynamic modeling approaches incorporating real-time data and historical trends to enhance the accuracy of agricultural land projections and their impact on fertilizer demand, ammonia production, and hydrogen consumption.
Another limitation of this study was the use of aggregated national data instead of localized field measurements. While national statistics provide a useful macro-level perspective, they may not fully reflect regional variations in soil fertility, climate conditions, and agricultural practices within Jordan. The lack of publicly available localized agricultural data prevented us from integrating case studies that might have provided more site-specific insights. Future studies should aim to incorporate localized field data, remote sensing techniques, and real-time monitoring systems to refine the accuracy of demand estimations.
Additionally, this study presents a comparative cost analysis between imported and locally produced urea but does not fully capture market fluctuations, policy incentives, and future technological advancements that could influence cost competitiveness. The cost of green hydrogen production is highly sensitive to factors such as subsidies, carbon pricing, energy costs, and technological advancements, which may shift its economic viability over time. A more detailed economic sensitivity analysis, incorporating factors such as government incentives, renewable energy price reductions, and long-term policy impacts, would provide a more comprehensive financial outlook. Future research should develop policy-driven economic models that assess the impact of subsidy programs, carbon credit systems, and international trade regulations on the feasibility of green hydrogen in Jordan’s fertilizer sector.
Lastly, while the SWOT analysis provides an overview of the strengths, weaknesses, opportunities, and threats associated with green hydrogen adoption in Jordan’s fertilizer industry, it remains broad in scope. Future research should develop targeted strategies tailored to Jordan’s specific policy, infrastructure, and economic landscape to enhance the feasibility of green hydrogen implementation.
By addressing these limitations, future studies can provide more refined projections, improve data reliability, and offer strategic insights to accelerate the transition toward sustainable fertilizer production in Jordan.

Author Contributions

Conceptualization, H.M. and F.H.; methodology, H.M.; software, F.H.; validation, H.M., F.H. and R.T.; formal analysis, H.M. and F.H.; investigation, H.M., F.H. and R.T.; resources, H.M. and F.H.; data curation, H.M., F.H. and R.T.; writing—original draft preparation, H.M., F.H. and R.T.; writing—review and editing, H.M. and F.H.; visualization, H.M. and F.H.; supervision, H.M.; project administration, H.M.; and funding acquisition, H.M. All authors have read and agreed to the published version of the manuscript.

Funding

This research was funded by the Deanship of Scientific Research at the German Jordanian University under cluster grant CLUS-SATS-2024.

Institutional Review Board Statement

Not applicable.

Informed Consent Statement

Not applicable.

Data Availability Statement

The data presented in this study are available upon request from the corresponding author.

Acknowledgments

The authors acknowledge the financial support of the Deanship of Scientific Research at the German Jordanian University under grant CLUS-SATS-2024 for the work presented in this paper.

Conflicts of Interest

The authors declare no conflicts of interest.

References

  1. Bhanumathi, S.; Vineeth, M.; Rohit, N. Crop yield prediction and efficient use of fertilizers. In Proceedings of the 2019 International Conference on Communication and Signal Processing (ICCSP), Brighton, UK, 12–17 May 2019; IEEE: Piscataway, NJ, USA, 2019; pp. 0769–0773. [Google Scholar]
  2. Lim, J.; Fernández, C.A.; Lee, S.W.; Hatzell, M.C. Ammonia and nitric acid demands for fertilizer use in 2050. ACS Energy Lett. 2021, 6, 3676–3685. [Google Scholar] [CrossRef]
  3. Daramola, D.A.; Hatzell, M.C. Energy demand of nitrogen and phosphorus based fertilizers and approaches to circularity. ACS Energy Lett. 2023, 8, 1493–1501. [Google Scholar] [CrossRef]
  4. Oliveira, A.M.; Beswick, R.R.; Yan, Y. A green hydrogen economy for a renewable energy society. Curr. Opin. Chem. Eng. 2021, 33, 100701. [Google Scholar] [CrossRef]
  5. Ozturk, M.; Dincer, I. A comprehensive review on power-to-gas with hydrogen options for cleaner applications. Int. J. Hydrogen Energy 2021, 46, 31511–31522. [Google Scholar] [CrossRef]
  6. Genovese, M.; Schlüter, A.; Scionti, E.; Piraino, F.; Corigliano, O.; Fragiacomo, P. Power-to-hydrogen and hydrogen-to-X energy systems for the industry of the future in Europe. Int. J. Hydrogen Energy 2023, 48, 16545–16568. [Google Scholar] [CrossRef]
  7. International Renewable Energy Agency. Renewable Energy Benefits Leveraging Local Capacity for Concentrated Solar Power. Irena. 2025. Available online: https://www.irena.org/-/media/Files/IRENA/Agency/Publication/2025/Jan/IRENA_Renewable_energy_benefits_leveraging_capacity_CSP_2025.pdf (accessed on 31 January 2025).
  8. International Energy Agency. Net Zero by 2050: A Roadmap for the Global Energy Sector-Event-IEA. 2021. Available online: https://iea.blob.core.windows.net/assets/deebef5d-0c34-4539-9d0c-10b13d840027/NetZeroby2050-ARoadmapfortheGlobalEnergySector_CORR.pdf (accessed on 31 January 2025).
  9. Li, Y.; Taghizadeh-Hesary, F. Energy Prices and the Economic Feasibility of Using Hydrogen Energy for Road Transport in the People’s Republic of China; (No. 1185); ADBI Working Paper Series; Asian Development Bank Institute: Mandaluyong, Philippines, 2020. [Google Scholar]
  10. Risco-Bravo, A.; Varela, C.; Bartels, J.; Zondervan, E. From green hydrogen to electricity: A review on recent advances, challenges, and opportunities on power-to-hydrogen-to-power systems. Renew. Sustain. Energy Rev. 2024, 189, 113930. [Google Scholar] [CrossRef]
  11. Coleman, D.; Kopp, M.; Wagner, T.; Scheppat, B. The value chain of green hydrogen for fuel cell buses—A case study for the Rhine-Main area in Germany. Int. J. Hydrogen Energy 2020, 45, 5122–5133. [Google Scholar] [CrossRef]
  12. Pagani, G.; Hajimolana, Y.; Acar, C. Green hydrogen for ammonia production—A case for the Netherlands. Int. J. Hydrogen Energy 2024, 52, 418–432. [Google Scholar] [CrossRef]
  13. United Nations Environment Programme. Emissions Gap Report 2024|UNEP-UN Environment Programme. 2024. Available online: https://www.unep.org/resources/emissions-gap-report-2024 (accessed on 2 February 2025).
  14. Ahrens, F.; Land, J.; Krumdieck, S. Decarbonization of nitrogen fertilizer: A transition engineering desk study for agriculture in Germany. Sustainability 2022, 14, 8564. [Google Scholar] [CrossRef]
  15. Pradhan, B.B.; Limmeechokchai, B.; Chaichaloempreecha, A.; Rajbhandari, S. Role of green hydrogen in the decarbonization of the energy system in Thailand. Energy Strategy Rev. 2024, 51, 101311. [Google Scholar] [CrossRef]
  16. Seck, G.S.; Hache, E.; Sabathier, J.; Guedes, F.; Reigstad, G.A.; Straus, J.; Wolfgang, O.; Ouassou, J.A.; Askeland, M.; Hjorth, I.; et al. Hydrogen and the decarbonization of the energy system in europe in 2050: A detailed model-based analysis. Renew. Sustain. Energy Rev. 2022, 167, 112779. [Google Scholar] [CrossRef]
  17. Maestre, V.M.; Ortiz, A.; Ortiz, I. Challenges and prospects of renewable hydrogen-based strategies for full decarbonization of stationary power applications. Renew. Sustain. Energy Rev. 2021, 152, 111628. [Google Scholar] [CrossRef]
  18. Bartlett, J.; Krupnick, A. Decarbonized hydrogen in the US power and industrial sectors: Identifying and incentivizing opportunities to lower emissions. Resour. Future 2020, 20–25. [Google Scholar]
  19. Khatiwada, D.; Vasudevan, R.A.; Santos, B.H. Decarbonization of natural gas systems in the EU–costs, barriers, and constraints of hydrogen production with a case study in Portugal. Renew. Sustain. Energy Rev. 2022, 168, 112775. [Google Scholar] [CrossRef]
  20. Adekola, K.; Ghafoori, S.; Dechamp, F.; Prada, A. Electricity supply configurations for green hydrogen hubs: A European case study on decarbonizing urban transport. Int. J. Hydrogen Energy 2024, 85, 539–559. [Google Scholar] [CrossRef]
  21. Inal, O.B.; Zincir, B.; Dere, C. Hydrogen as maritime transportation fuel: A pathway for decarbonization. In Greener and Scalable E-fuels for Decarbonization of Transport; Springer: Singapore, 2021; pp. 67–110. [Google Scholar]
  22. Kurien, C.; Mittal, M. Utilization of green ammonia as a hydrogen energy carrier for decarbonization in spark ignition engines. Int. J. Hydrogen Energy 2023, 48, 28803–28823. [Google Scholar] [CrossRef]
  23. Rinaldi, A.; Syla, A.; Patel, M.K.; Parra, D. Optimal pathways for the decarbonisation of the transport sector: Trade-offs between battery and hydrogen technologies using a whole energy system perspective. Clean. Prod. Lett. 2023, 5, 100044. [Google Scholar] [CrossRef]
  24. Kazi, M.K.; Eljack, F.; El-Halwagi, M.M.; Haouari, M. Green hydrogen for industrial sector decarbonization: Costs and impacts on hydrogen economy in qatar. Comput. Chem. Eng. 2021, 145, 107144. [Google Scholar] [CrossRef]
  25. Zaiter, I.; Ramadan, M.; Bouabid, A.; El-Fadel, M.; Mezher, T. Potential utilization of hydrogen in the UAE’s industrial sector. Energy 2023, 280, 128108. [Google Scholar] [CrossRef]
  26. Nikhil, P.; Prakash, G.B.; Kavyasri, K.; Sivasankar, P. Analysis on CO2 emissions, green hydrogen requirement and geo-storage potential of hydrogen for decarbonization of industrial operations in southeastern coast of India. Int. J. Hydrogen Energy 2024, 52, 1507–1521. [Google Scholar] [CrossRef]
  27. Muhsen, H.; Al-Mahmodi, M.; Tarawneh, R.; Alkhraibat, A.; Al-Halhouli, A.A. The potential of green hydrogen and power-to-X utilization in Jordanian Industries: Opportunities and future prospects. Energies 2023, 17, 213. [Google Scholar] [CrossRef]
  28. Doucet, F.; Jürgens, L.; Barkow, H.; Schütte, C.; Neubauer, N.; von Düsterlho, E.; Schäfers, H. Decarbonization of the Industry–Demand and Cost Comparison of Green Hydrogen in Germany. In Proceedings of the 2023 19th International Conference on the European Energy Market (EEM), Lappeenranta, Finland, 6–8 June 2023; IEEE: Piscataway, NJ, USA, 2023; pp. 1–6. [Google Scholar]
  29. Nurdiawati, A.; Urban, F. Decarbonising the refinery sector: A socio-technical analysis of advanced biofuels, green hydrogen and carbon capture and storage developments in Sweden. Energy Res. Soc. Sci. 2022, 84, 102358. [Google Scholar] [CrossRef]
  30. Moradpoor, I.; Syri, S.; Santasalo-Aarnio, A. Green hydrogen production for oil refining—Finnish case. Renew. Sustain. Energy Rev. 2023, 175, 113159. [Google Scholar] [CrossRef]
  31. Manna, J.; Jha, P.; Sarkhel, R.; Banerjee, C.; Tripathi, A.K.; Nouni, M.R. Opportunities for green hydrogen production in petroleum refining and ammonia synthesis industries in India. Int. J. Hydrogen Energy 2021, 46, 38212–38231. [Google Scholar] [CrossRef]
  32. Badakhsh, A.; Bhagavathy, S.M. Caveats of green hydrogen for decarbonisation of heating in buildings. Appl. Energy 2024, 353, 122152. [Google Scholar] [CrossRef]
  33. Segawa, Y.; Endo, N.; Shimoda, E.; Yamane, T. Assessment of hydrogen storage capacity required for decarbonization: A case study using off-site green hydrogen for buildings. Int. J. Hydrogen Energy 2024, 94, 1046–1055. [Google Scholar] [CrossRef]
  34. Röben, F.; Kicherer, N.; Jürgens, L.; Decher, S.; Schäfers, H.; von Düsterlho, J.E. Decarbonization of the heating sector in hamburg grid constraints, efficiency and costs of green hydrogen vs. heat pumps. In In Proceedings of the 2022 18th International Conference on the European Energy Market (EEM), Ljubljana, Slovenia, 13–15 September 2022; IEEE: Piscataway, NJ, USA, 2022; pp. 1–6. [Google Scholar]
  35. Okeke, I.J.; Kamath, D.; Nimbalkar, S.U.; Cresko, J. The Role of Low-Carbon Fuels and Carbon Capture in Decarbonizing the US Clinker Manufacturing for Cement Production: CO2 Emissions Reduction Potentials. Energies 2024, 17, 5233. [Google Scholar] [CrossRef]
  36. Cormos, C.C. Decarbonization options for cement production process: A techno-economic and environmental evaluation. Fuel 2022, 320, 123907. [Google Scholar] [CrossRef]
  37. Bhaskar, A.; Abhishek, R.; Assadi, M.; Somehesaraei, H.N. Decarbonizing primary steel production: Techno-economic assessment of a hydrogen based green steel production plant in Norway. J. Clean. Prod. 2022, 350, 131339. [Google Scholar] [CrossRef]
  38. Johnson, S.; Deng, L.; Gençer, E. Environmental and economic evaluation of decarbonization strategies for the Indian steel industry. Energy Convers. Manag. 2023, 293, 117511. [Google Scholar] [CrossRef]
  39. Arpino, F.; Canale, C.; Cortellessa, G.; Dell’Isola, M.; Ficco, G.; Grossi, G.; Moretti, L. Green hydrogen for energy storage and natural gas system decarbonization: An Italian case study. Int. J. Hydrogen Energy 2024, 49, 586–600. [Google Scholar] [CrossRef]
  40. Bhaskar, A.; Assadi, M.; Somehsaraei, H.N. Decarbonization of the Iron and Steel Industry with Direct Reduction of 643 Iron Ore with Green Hydrogen. Energies 2020, 13, 758. [Google Scholar] [CrossRef]
  41. AlZahrani, A.A.; Zamfirescu, C.; El-Emam, R.S. Analysis of a Solar-Assisted Crude Oil Refinery System with Onsite Green Hydrogen Generation: A Case Study. Arab. J. Sci. Eng. 2024, 50, 2557–2571. [Google Scholar] [CrossRef]
  42. Food and Agriculture Organization of the United Nations. Emissions Due to Agriculture—Global, Regional and Country Trends 2000–2018. FAO. 2021. Available online: https://openknowledge.fao.org/items/08e67acd-1791-4486-ba41-2b52a075b432 (accessed on 3 February 2025).
  43. Statista. Agriculture Emissions Worldwide—Statistics & Facts. Statista. 2024. Available online: https://www.statista.com/topics/10348/agriculture-emissions-worldwide/#topicOverview (accessed on 29 December 2024).
  44. International Fertilizer Association. Fertilizers and Agriculture’s Carbon Footprint. IFA. 2022. Available online: https://www.fertilizer.org/key-priorities/fertilizer-use/fertilizers-agricultures-carbon-footprint/ (accessed on 29 December 2024).
  45. International Energy Agency. The Role of Low-Carbon Fuels in the Clean Energy Transitions of the Power Sector. IEA. 2021. Available online: https://www.iea.org/reports/the-role-of-low-carbon-fuels-in-the-clean-energy-transitions-of-the-power-sector (accessed on 26 December 2024).
  46. Bora, N.; Singh, A.K.; Pal, P.; Sahoo, U.K.; Seth, D.; Rathore, D.; Bhadra, S.; Sevda, S.; Venkatramanan, V.; Prasad, S.; et al. Green ammonia production: Process technologies and challenges. Fuel 2024, 369, 131808. [Google Scholar] [CrossRef]
  47. Food and Agriculture Organization of the United Nations. The Future of Food and Agriculture Drivers and Triggers for Transformation. FAO. 2022. Available online: https://openknowledge.fao.org/server/api/core/bitstreams/002ef5c5-3501-413f-b226-c87da30a7a29/content (accessed on 15 January 2025).
  48. Nadarajan, S.; Sukumaran, S. Chemistry and toxicology behind chemical fertilizers. In Controlled Release Fertilizers for Sustainable Agriculture; Academic Press: Cambridge, MA, USA, 2021; pp. 195–229. [Google Scholar]
  49. Kusin, F.M.; Akhir NI, M.; Mohamat-Yusuff, F.; Awang, M. The impact of nitrogen fertilizer use on greenhouse gas emissions in an oil palm plantation associated with land use change. Atmósfera 2015, 28, 243–250. [Google Scholar] [CrossRef]
  50. Green Economy. Our Energy Future: Green Ammonia. Green Economy. 2025. Available online: https://www.greenintelligence.org.uk/news-and-resources/insights/our-energy-future-green-ammonia/ (accessed on 27 December 2024).
  51. Higher Population Council. Jordan—Recent Demographic Indicators (April 2024). HPC. 2024. Available online: https://www.hpc.org.jo/sites/default/files/jordan_demographic_indicators_sheet_2024.pdf (accessed on 31 December 2024).
  52. International Trade Administration. Jordan Country Commercial Guide. ITA. 2024. Available online: https://www.trade.gov/country-commercial-guides/jordan-agricultural-sectors (accessed on 31 December 2024).
  53. Al-Addous, M.; Bdour, M.; Alnaief, M.; Rabaiah, S.; Schweimanns, N. Water resources in Jordan: A review of current challenges and future opportunities. Water 2023, 15, 3729. [Google Scholar] [CrossRef]
  54. Ministry of Environment. Agriculture Sector—Green Growth National Action Plan 2021–2025. MoEnv. 2020. Available online: https://www.moenv.gov.jo/ebv4.0/root_storage/ar/eb_list_page/20022_jordan_agriculture_v06_rc_web-0.pdf (accessed on 1 January 2025).
  55. O’Brien, T.; Bui NT, N.; Frasheri, E.; Garcia, F.; Protzer, E.; Villasmil, R.; Hausmann, R. What Will It Take for Jordan to Grow? CID Faculty Working Paper Series. 022.411; Harvard University: Cambridge, MA, USA, 2022. [Google Scholar]
  56. Al-Karablieh, E.; Salman, A. Water Resources, Use and Management in Jordan. A Focus on Groundwater; IWMI Project Publication–Groundwater Governance in the Arab World–Taking Stock and Addressing the Challenges; International Water Management Institute (IWMI): Colombo, Sri Lanka, 2016. [Google Scholar]
  57. Ministry of Agriculture. Agriculture in Numbers—Annual Reports. MoA. 2025. Available online: https://www.moa.gov.jo/AR/List/__%D8%A7%D9%84%D8%B2%D8%B1%D8%A7%D8%B9%D8%A9_%D8%A8%D8%A7%D9%84%D8%A3%D8%B1%D9%82%D8%A7%D9%85 (accessed on 1 January 2025).
  58. Al-Alayani, H.; Utilizing Ammonia’s Value Chain in Jordan. Jordan News. 2023. Available online: https://www.jordannews.jo/Section-36/Opinion/Utilizing-amonia-s-value-chain-in-jordan-30897 (accessed on 2 January 2025).
  59. Fertilizers Europe. Types of Fertilizers. Fertilizers Europe. 2023. Available online: https://www.fertilizerseurope.com/fertilizers-in-europe/types-of-fertilizer/ (accessed on 2 January 2025).
  60. Teagasc—The Agriculture and Food Development Authority. Fertiliser Types. Teagasc. 2017. Available online: https://www.teagasc.ie/crops/soil--soil-fertility/fertiliser-types/ (accessed on 2 January 2025).
  61. International Fertilizer Association. Consumption. IFASTAT. 2025. Available online: https://www.ifastat.org/databases/plant-nutrition (accessed on 2 January 2025).
  62. World Bank Group. Fertilizer Consumption (% of Fertilizer Production)—Jordan. WBG. 2025. Available online: https://data.worldbank.org/indicator/AG.CON.FERT.PT.ZS?end=2022&locations=JO&start=1973&view=chart (accessed on 3 January 2025).
  63. World Integrated Trade Solution. Jordan Mineral or Chemical Fertilizers with Nitrogen, Imports by Country in 2023. WITS. 2023. Available online: https://wits.worldbank.org/trade/comtrade/en/country/JOR/year/2023/tradeflow/Imports/partner/ALL/product/310520 (accessed on 3 January 2025).
  64. Volza. Fertilizer Imports in Jordan—Market Size & Demand Based on Import Trade Data. Volza. 2025. Available online: https://www.volza.com/p/fertilizer/import/import-in-jordan/ (accessed on 4 January 2025).
  65. Alrwashdeh, S.S.; Alsaraireh, F.M.; Saraireh, M.A. Solar radiation map of Jordan governorates. Int. J. Eng. Technol. 2018, 7, 1664–1667. [Google Scholar] [CrossRef]
  66. Jordan Wind Project Company. Tafilah Energy Farm. JWPC. 2025. Available online: https://jordanwind.com/ (accessed on 4 January 2025).
  67. International Renewable Energy Agency. Renewable Energy & Energy Efficiency (Law No. 13). IEA. 2021. Available online: https://www.iea.org/policies/5348-renewable-energy-energy-efficiency-law-no-13 (accessed on 5 January 2025).
  68. Hassan, Q.; Algburi, S.; Sameen, A.Z.; Salman, H.M.; Jaszczur, M. Green hydrogen: A pathway to a sustainable energy future. Int. J. Hydrogen Energy 2024, 50, 310–333. [Google Scholar] [CrossRef]
  69. ToAgriculture. Watermelon Fertilizer Application for 1 Hectare: Dos and Don’ts. 2025. Available online: https://toagriculture.com/watermelon-fertilizer-application-for-1-hectare/#:~:text=Calculating%20the%20correct%20amount%20of%20fertilizer%3A&text=Generally%2C%20for%201%20hectare%20of,applications%20throughout%20the%20growing%20season (accessed on 6 January 2025).
  70. Hochmuth, G.J.; Hanlon, E.A. IFAS Standardized Fertilization Recommendations for Vegetable Crops; University of Florida, Cooperative Extension Service, Institute of Food and Agricultural Sciences: Gainesville, FL, USA, 1995. [Google Scholar]
  71. Shrestha, S.; Dhakal, M.; Sapkota, S.; Gautam, I.P.; Pandey, S.; Shrestha, Y. Evaluation of Zucchini (Cucurbita pepo L.) genotypes for spring season production in the mid–hills of Nepal. Nepal J. Sci. Technol. 2021, 20, 73–81. [Google Scholar] [CrossRef]
  72. Hensleigh, P. Evaluation of Fava Bean Lines Under Irrigated and Dryland Conditions at the Bridger, Montana Plant Materials Center. United States Department of Agriculture. Available online: https://www.nrcs.$a.gov/plantmaterials/mtpmcsr13297.pdf (accessed on 5 January 2025).
  73. Garlic Seed. How to Fertilize Your Garlic Properly. 2025. Available online: https://garlicseed.ca/blogs/growing-garlic/how-to-fertilize-your-garlic (accessed on 5 January 2025).
  74. Shafeek, M.R.; Shaheen, A.M.; Abd El-Samad, E.H.; Rizk, F.A.; Abd El-Al, F.S. Response of growth, yield and fruit quality of cantaloupe plants (Cucumis melo L.) to organic and mineral fertilization. Middle East J. Appl. Sci. 2015, 5, 76–82. [Google Scholar]
  75. Lelei, D.; Nabwile, E.; Onyango, O.J. Effect of harvesting stages and nitrogen on seed quality and yield of jute mallow (Corchorus olitorius L.). Int. J. Hortic. Sci. Technol. 2020, 7. [Google Scholar]
  76. Davis, J.G.; Brick, M.A. Fertilizing Dry Beans; Colorado State University Extension: Fort Collins, CO, USA, 2009. [Google Scholar]
  77. North Dakota State University. Field Pea Production. NDSU. 2021. Available online: https://www.ndsu.edu/agriculture/sites/default/files/2021-12/a1166.pdf (accessed on 6 January 2025).
  78. Grains Research and Development Corporation. Chickpea—Section 5: Nutrition and Fertiliser. GRDC. 2017. Available online: https://grdc.com.au/__data/assets/pdf_file/0030/369444/GrowNote-Chickpea-West-5-Nutrition.pdf (accessed on 6 January 2025).
  79. Horticultural Development Company. Nitrogen Recommendations for Optimizing Yield and Quality of Baby Leaf Lettuce. HDC. 2014. Available online: https://projectbluearchive.blob.core.windows.net/media/Default/Imported%20Publication%20Docs/16_14%20Nitrogen%20recommendations%20for%20optimising%20yield%20and%20quality%20of%20baby%20lettuce.pdf (accessed on 7 January 2025).
  80. Wahocho, N.A.; Wahocho, S.A.; Memon, N.; Leghari, M.H.; Baloch, Q.B. Growth and yield response of turnip to various nitrogen application rates. Pak. J. Agric. Agric. Eng. Vet. Sci. 2016, 32, 143–149. [Google Scholar]
  81. TNAU Agritech. Fertilizer Schedule. Available online: https://agritech.tnau.ac.in/horticulture/ferti_schedule.pdf (accessed on 7 January 2025).
  82. Roy, R.N.; Finck, A.; Blair, G.J.; Tandon HL, S. Nutrient management guidelines for some major field crops. Plant Nutrition for Food Security. A Guide for Integrated Nutrient Management; FAO: Rome, Italy, 2006; pp. 235–349. [Google Scholar]
  83. Gebregergis, Z.; Sibhatu, F.B.; Teame, G. Optimizing N fertilizer use for sesame under rain fed and irrigation conditions in Northern Ethiopia. Oil Crop. Sci. 2023, 8, 252–258. [Google Scholar] [CrossRef]
  84. AgriFarming. Best Fertilizer for Barley: Organic, NPK, Requirements, When and How to Apply. 2025. Available online: https://www.agrifarming.in/best-fertilizer-for-barley-organic-npk-requirements-when-and-how-to-apply (accessed on 8 January 2025).
  85. Gerwig, J.; Gelderman, R.; Fertilizer Recommendations Guide. South Dakota State University. 2005. Available online: https://www.nrcs.$a.gov/sites/default/files/2023-06/EC750_2023.pdf (accessed on 8 January 2025).
  86. Conaghan, P.; Clavin, D. Red Clover—Agronomy and Management. Available online: https://www.teagasc.ie/media/website/publications/2017/6-Red-clover-agronomy-and-management.pdf (accessed on 9 January 2025).
  87. New Jersey Agricultural Experiment Station. Soil Fertility Recommendations for Producing Grass Hay. 2025. Available online: https://njaes.rutgers.edu/fs1295/ (accessed on 9 January 2025).
  88. Corn Agronomy. Broomcorn. 1990. Available online: https://corn.aae.wisc.edu/Crops/Broomcorn.aspx (accessed on 10 January 2025).
  89. Alberta Pulse Growers. Lentil—Fertility. 2025. Available online: https://albertapulse.com/lentil-seeding/lentil-fertility/ (accessed on 10 January 2025).
  90. Haifa Group. A Complete Fertilization Program for Olive Trees. 2025. Available online: https://www.haifa-group.com/complete-fertilization-program-olive-trees (accessed on 10 January 2025).
  91. Haifa Group. Fertilization of Pomelo Trees in Tropical Climate. 2025. Available online: https://www.haifa-group.com/fertilization-pomelo-trees-tropical-climate (accessed on 10 January 2025).
  92. Haifa Group. Nutritional Recommendations for Citrus. Available online: https://www.haifa-group.com/files/Guides/Citrus.pdf (accessed on 11 January 2025).
  93. Zekri, M.; Schumann, A.W.; Vashisth, T.; Kadyampakeni, D.M.; Morgan, K.T.; Boman, B.; Shahid, M.A.; Obreza, T.A. 2024–2025 Florida Citrus Production Guide: Fertilizer Application Methods; EDIS: Gainesville, FL, USA, 2024. [Google Scholar]
  94. Wen, S.; Cui, N.; Gong, D.; Xing, L.; Wu, Z.; Zhang, Y.; Wang, Z.; Wang, J. Optimizing nitrogen fertilizer application for achieving high yield with low environmental risks in apple orchard. Agric. Water Manag. 2023, 289, 108501. [Google Scholar] [CrossRef]
  95. Muhammad, S.; Sanden, B.L.; Saa, S.; Lampinen, B.D.; Smart, D.R.; Shackel, K.A.; DeJong, T.M.; Brown, P.H. Optimization of nitrogen and potassium nutrition to improve yield and yield parameters of irrigated almond (Prunus dulcis (Mill.) DA webb). Sci. Hortic. 2018, 228, 204–212. [Google Scholar] [CrossRef]
  96. Guo, C.; Wang, X.; Li, Y.; He, X.; Zhang, W.; Wang, J.; Shi, X.; Chen, X.; Zhang, Y. Carbon footprint analyses and potential carbon emission reduction in China’s major peach orchards. Sustainability 2018, 10, 2908. [Google Scholar] [CrossRef]
  97. Yan, X.; Ye, D.; Tang, Y.; Muneer, M.A.; Christie, P.; Tou, C.; Xu, W.; Shen, B.; Xu, J.; Zhang, J. Potential mitigation of environmental impacts of intensive plum production in southeast China with maintenance of high yields: Evaluation using life cycle assessment. Front. Plant Sci. 2023, 14, 1158591. [Google Scholar] [CrossRef]
  98. Mohit, M.; Verma, M.L.; Thakur, J. Effect of different nitrogenous fertilizers on Fruit Quality and Yield of apricot (Prunus armeniaca L.). J. Pharmacogn. Phytochem 2017, 6, 217–220. [Google Scholar]
  99. Rutkowski, K.; Łysiak, G.P.; Zydlik, Z. Effect of nitrogen fertilization in the sour cherry orchard on soil enzymatic activities, microbial population, and fruit quality. Agriculture 2022, 12, 2069. [Google Scholar] [CrossRef]
  100. Brunetto, G.; Sete, P.B.; Marcio Norberto, P.; Daiane Welter, P.; Thábata Silva Viana, I.; Paulo Andrade, M. The Fate of Soil-Applied Nitrogen in the Fig Tree. Horticulturae 2024, 10, 609. [Google Scholar] [CrossRef]
  101. Ayars, J.E.; Phene, C.J.; Phene, R.C.; Gao, S.; Wang, D.; Day, K.R.; Makus, D.J. Determining pomegranate water and nitrogen requirements with drip irrigation. Agric. Water Manag. 2017, 187, 11–23. [Google Scholar] [CrossRef]
  102. Khan, J.; Sajid, M. Effect of Nitrogen Doses and Timing on Fruit Quality of Guava in Winter. Sarhad J. Agric. 2024, 40, 848–857. [Google Scholar] [CrossRef]
  103. Klein, P. Land preparation planting operation fertilization requirements Chapter 6. In Date Palm Cultivation. FAO Plant Production and Protection; Zaid, A., Ed.; FAO: Rome, Italy, 2002; Volume 156. [Google Scholar]
  104. Magalhães, R.M.F.; Edvan, R.L.; Ratke, R.F.; de Oliveira, M.E.; Carvalho, C.D.M.; Araújo, J.S.; Araújo, D.D.C.; do Nascimento, R.R. Efficiency of fertilization with coated urea in the cultivation of cactus pear under rainfed conditions in Brazilian savannah. J. Agric. Sci. 2021, 159, 426–436. [Google Scholar] [CrossRef]
  105. Polat, A.A. Loquat production in Turkey: Problems and solutions. Eur. J. Plant Sci. Biotechnol. 2007, 1, 187–199. [Google Scholar]
  106. Glenk, G.; Reichelstein, S. Economics of converting renewable power to hydrogen. Nat. Energy 2019, 4, 216–222. [Google Scholar] [CrossRef]
  107. Bhandari, R.; Trudewind, C.A.; Zapp, P. Life cycle assessment of hydrogen production via electrolysis–a review. J. Clean. Prod. 2014, 85, 151–163. [Google Scholar] [CrossRef]
  108. Staffell, I.; Scamman, D.; Abad, A.V.; Balcombe, P.; Dodds, P.E.; Ekins, P.; Shah, N.; Ward, K.R. The role of hydrogen and fuel cells in the global energy system. Energy Environ. Sci. 2019, 12, 463–491. [Google Scholar] [CrossRef]
  109. Hydrogen Council. Path to Hydrogen Competitiveness: A Cost Perspective. 2020. Available online: https://hydrogencouncil.com/wp-content/uploads/2020/01/Path-to-Hydrogen-Competitiveness_Full-Study-1.pdf (accessed on 12 January 2025).
  110. European Commission. A Hydrogen Strategy for a Climate Neutral Europe. 2020. Available online: https://energy.ec.europa.eu/system/files/2020-07/hydrogen_strategy_0.pdf (accessed on 12 January 2025).
  111. Bicer, Y.; Dincer, I. Clean fuel options with hydrogen for sea transportation: A life cycle approach. Int. J. Hydrogen Energy 2018, 43, 1179–1193. [Google Scholar] [CrossRef]
Figure 1. Global emissions on a sectoral basis for 2023 [13].
Agriculture 15 00608 g001
Figure 2. Land distribution in Jordan [56].
Agriculture 15 00608 g002
Figure 3. Consumption of fertilizers in 1000 tons from 2009 to 2022 in Jordan [61,62].
Agriculture 15 00608 g003
Figure 4. Decision-making flowchart for green hydrogen-based ammonia production in Jordan.
Agriculture 15 00608 g004
Figure 5. Graphical representation of land area projection.
Agriculture 15 00608 g005
Figure 6. Cultivated area for different fruit crops in Jordan (2023) [57].
Agriculture 15 00608 g006
Figure 7. Nitrogen, ammonia, and hydrogen requirements for different fruit crops in Jordan (2023).
Agriculture 15 00608 g007
Figure 8. Total hydrogen demand for different fruit crops under various scenarios (2023).
Agriculture 15 00608 g008
Figure 9. Optimistic, neutral, and pessimistic total hydrogen demand for different fruit crops in Jordan (2023).
Agriculture 15 00608 g009
Figure 10. Hydrogen price vs. ammonia production cost and competitiveness. The green bar indicates the competitive cost of produced green hydrogen compared to imported ammonia.
Agriculture 15 00608 g010
Figure 11. SWOT analysis of green ammonia adoption in the agricultural sector.
Agriculture 15 00608 g011
Table 1. Cost scenarios for urea production using green hydrogen.
ScenarioUrea Price (USD/ton)Hydrogen Price (USD/kg)Description
Best case6003Low hydrogen price and high urea price
Baseline5255Midpoint values for both prices
Worst case4507High hydrogen price and low urea price
Table 2. CO2 emission reduction potential across agricultural categories in Jordan (2023).
CategoryTotal Need of Ammonia—2023 (ton)
Vegetables10,471.42711
Grains6887.553799
Olives30.4635075
Citrus2270.66563
Fruits5035.439602
Greenhouse2382.156283
Total Ammonia—2023 (ton)27,077.70593
CO2 Current48,739.87067
CO2 Green0
Reduction %100%
Savings48,739.87067
Table 3. Cost of urea imports under different market scenarios in Jordan (2023).
Cost of Urea Imports
ScenarioPrice per ton (USD)Total Cost (USD)
Best Case6008,394,822.68
Baseline5257,345,469.84
Worst Case4506,296,117.01
Table 4. Cost of green hydrogen production under different market scenarios in Jordan (2023).
Cost of Green Hydrogen Production
ScenarioPrice per kg (USD)Total Cost
Best Case330,366,173.88
Baseline550,610,289.80
Worst Case770,854,405.72
Disclaimer/Publisher’s Note: The statements, opinions and data contained in all publications are solely those of the individual author(s) and contributor(s) and not of MDPI and/or the editor(s). MDPI and/or the editor(s) disclaim responsibility for any injury to people or property resulting from any ideas, methods, instructions or products referred to in the content.

