1. Introduction
Strawberries have gained popularity due to their high nutritional value and economic impact [
1]. Ripe strawberries can be consumed directly or used to create a variety of desserts and jams. Additionally, the unique aroma of strawberries is of substantial scientific research value in perfume and essential oil production [
2]. As the acreage dedicated to strawberry cultivation continues to expand, global production has risen from 7.6 million tons in 2014 to 8.9 million tons in 2019 [
3,
4]. However, strawberry plants require a significant amount of fertilizer and exhibit weak resistance, making them susceptible to fertilizer deficiencies and bacterial attacks [
5]. Once diseases occur, they can lead to substantial economic losses. Traditional methods of strawberry disease detection rely on agronomy experts who make decisions based on the phenotypic characteristics of the plants, which is time-consuming and laborious. Therefore, precise identification and effective monitoring of strawberry diseases throughout the growth stages are essential for the sustainable development of the strawberry industry.
In the object detection field, several algorithms play crucial roles. Region-based Convolutional Neural Networks (R-CNN) are a pioneer in applying deep learning to object detection. It generates region proposals via selective search and then classifies and regresses these regions. Fast R-CNN improved efficiency with ROI Pooling, and Faster R-CNN further enhanced performance by integrating an RPN for end-to-end training. You Only Look Once (YOLO) revolutionized the approach by treating object detection as a regression problem. It divides the image into a grid, and each cell predicts bounding boxes and class probabilities. The YOLO series, especially You Only Look Once version 8 (YOLOv8), has evolved to optimize architecture, feature fusion, and small-object detection. Another notable algorithm is RetinaNet, which addresses class imbalance with the Focal Loss function. Each algorithm has its advantages and disadvantages. R-CNN-based methods offer high accuracy but are slow, while YOLO is fast but may sacrifice some accuracy in complex scenarios.
Recently, strawberry disease detection based on image recognition has become a research hotspot. The development of deep learning has promoted the application of strawberry pest identification in agriculture, and several studies have demonstrated its feasibility in this area. Firstly, Lee et al.’s YOLOv5-based model solved the problem of inaccurate early detection of strawberry diseases [
6]. Xu et al. introduced the Focus loss function, Dropout, and batch regularization into ResNet50, resulting in an average recognition accuracy of 98.67% [
7].Yang et al. developed a self-supervised multi-network fusion classification model for classifying strawberry diseases, achieving an accuracy of 92.48% [
8]. These results highlight the effectiveness of different techniques in improving strawberry disease detection accuracy. Secondly, efforts have been made to address various challenges in strawberry disease detection. For instance, Li et al. [
9] proposed an improved Transformer-based spatial convolution self-attention transformer module. This module combines global and local features, and achieves accurate feature extraction by capturing the spatial position of the feature average precision mean (map) of strawberry disease, which significantly improves the accuracy and efficiency of strawberry disease recognition under complex background. However, compared with the lightweight MobileNet, the parameter of the model is 24.2 M, which still has room for further optimization.
Aiming at the similarity, Kerre and Muchiri [
10], based on normalized sequential convolutional neural networks, adopted the “channel_first” and “channel_last” architecture to adapt to different data processing needs. Their model can reach an accuracy of 86.67% when detecting strawberry greyleaf and leaf blight simultaneously. Nevertheless, the dataset background used in their research was relatively simple, and the model fails to maintain optimal performance for strawberry disease images with complex background. In addition, to deal with the multi-scale target problem, Ilyas et al. [
11] proposed an encoder-decoder adaptive convolutional network equipped with three different modules to identify three different strawberry fruit categories and one class of overgrown or diseased strawberry. The network can adaptively adjust the receptive field and the feature flow to recognize targets of different scales. However, this task usually focuses only on distinguishing between different categories, not on different individuals within the same category.
There are also many studies that prove YOLO is predominantly utilized for agricultural object detection and has demonstrated promising results [
12,
13,
14,
15]. For example, Bai et al. propose an improved YOLO algorithm for greenhouse strawberry seedling detection that uses Swin Transformer and GS-ELAN Module, shows good experimental results, and has high performance [
16]. However, research on strawberry diseases primarily focuses on leaves, with limited comprehensive research on overall detection of strawberry health conditions and their growth and development. Research on the health status of strawberries mainly involves collecting necessary research materials from the cultivation site and generating single-target images. There are three main challenges in detecting strawberry health conditions: (a) Strawberry plants grow relatively densely at various growth stages; flowers, fruits, and leaves are relatively dense. This complex background easily interferes with the model’s disease detection. (b) Strawberry plant lesions have complex shapes and textures in the image features, including similarity between different lesions on leaves and similarity between diseased leaves and normal aging leaves. Such complex and subtle changes easily bring challenges to the model’s recognition. (c) The size of the diseased plant’s image will be inconsistent depending on the method of image acquisition and the size of the field of view, and the multi-scale target will cause the model to be prone to missing and false detection.
In view of the challenges faced in the field of strawberry diseases, this paper takes three developmental states and five health states of strawberry plants as research objects, aiming to develop an efficient and resource-saving detection model. For this purpose, the present paper introduces Disease-YOLO(D-YOLO), a lightweight algorithm for strawberry development and health detection based on YOLOv8s. The main contents of this paper are as follows: 1. Establish a mixed dataset of strawberry development and health conditions in complex environments, including fields, greenhouses, and households. 2. Propose a new D-YOLO model that uses MobileNetv3 as the backbone. The Concat Bidirectional Feature Pyramid Network (Concat-BiFPN) splices the feature maps within a level with those from other levels to obtain a richer representation. The Contextual Transformer (CoT) is introduced to enhance the focus on lesions. The Weighted Intersection over Union (W-IoU) is used as the loss function to optimize the model and address class imbalance. 3. Obtain 89.6% mAP in the training set and 90.5% mAP in the testing set in a self-structuring dataset, and the parameters and floating-point operations (flops) are reduced by 72.0% and 75.1%. Compared to commonly used object detection models, D-YOLO outperforms other object detection algorithms.
2. Materials and Methods
The procedure of the D-YOLO model we propose in the strawberry disease task can be outlined in the following steps: First, construct a dataset that contains three parts: public sub-dataset 1; sub-dataset 2, which was obtained by self-cultivation and mobile phone shooting; and sub-dataset 3, which was collected from different users on Douyin (TikTok in China). Among them, public sub-dataset 1 comprised the strawberry different-health-condition images provided by the AI Challenger Crop Pest and Disease Detection Competition in 2018 [
17], which has 640 images in 8 categories obtained from the Internet by the competition organizers in fields, greenhouses, household, etc. Sub-dataset 2 consists of photos taken by Redmi K40, equipped with a Sony sensor and having a resolution of 3000 × 3000, on sunny days from the greenhouses of the Beijing Academy of Agricultural and Forestry Sciences (116°28′ E, 39°94′ S) at various heights (100–500 mm) and random angles. The potted plants were cultivated under two treatments of normal growth and potassium deficiency, growing naturally and also experiencing diseases. Sub-dataset 3 mainly included calcium deficiency, powdery mildew, and greyleaf, which were not easy to collect, and came from Douyin, taken by different users in households. Then, we classified and labeled the dataset we constructed. Finally, we used the improved YOLOv8 model to swiftly and accurately detect diseases in strawberry plants, and compared the results with other advanced models. The system’s structure is illustrated in
Figure 1.
2.1. Data Acquisition
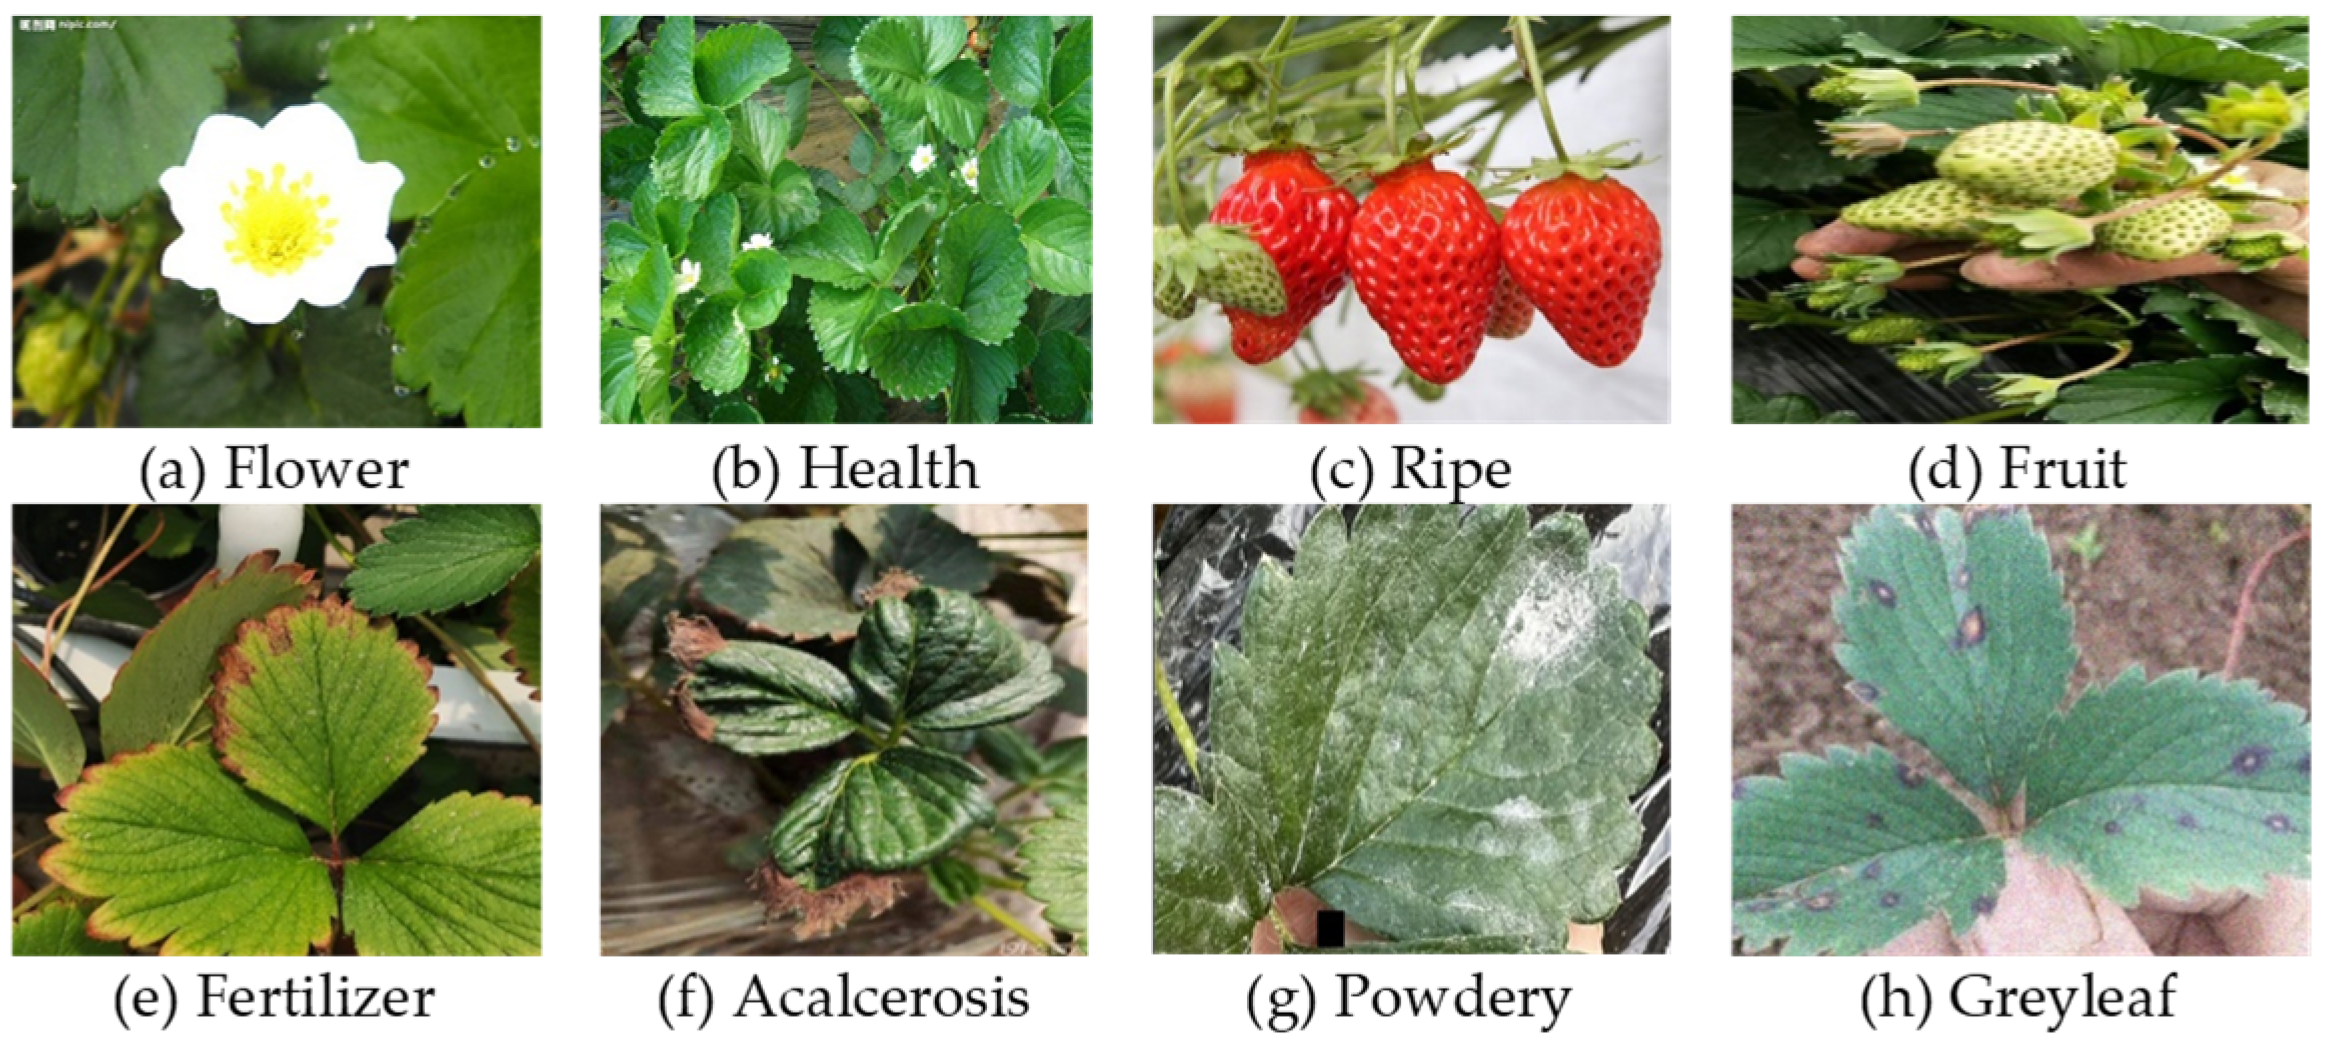
As depicted in
Figure 2, the dataset categories were divided into three fruit development stages (flower, fruit, and ripe) and five plant health states (healthy, fertilizer-deficient, calcium-deficient, powdery mildew-affected, and greyleaf-affected), tailored to the requirements of production. Flowers and fruits were categorized based on the presence of a swollen and oval petal receptacle. Strawberries were classified as either unripe (labeled as ‘fruit’ in the research) or ripe, in accordance with market harvesting standards, where ripeness is determined by more than 80% of the fruit’s surface area turning red. Furthermore, according to the literature [
18], leaves experiencing fertilizer deficiency exhibit yellowish-brown discoloration or yellowing at the edges. Calcium deficiency results in wrinkled leaves, while powdery mildew manifests as white mold spots on the leaves. Greyleaf, on the other hand, produces circular or oval spots on the leaves.
2.2. Dataset Production
Due to the presence of missing labels and mislabeling in public datasets, the dataset constructed in this research was annotated using the open-source annotation tool LabelImg, with annotations in the txt format. Given that strawberry leaves are typically pinnate compound leaves consisting of multiple leaflets, new buds often grow at the node, develop into new plants, cluster in close proximity, grow irregularly, and overlap significantly. Consequently, when annotating the data, leaves with more than 75% coverage are not labeled. Considering the diverse data sources and the difficulty of obtaining pictures of plants in different health conditions, data augmentation was performed on some unhealthy images. Six kinds of data augmentation techniques, including rotation, translation, flipping, brightness adjustment, noise addition and Cutout, are randomly combined. By generating 5 additional images for each original one, effectively expand and balance the dataset as much as possible.
Since the labels on each image were inconsistent, ranging from one to dozens, specifically, the number of healthy category labels in the dataset far exceeds that of other categories. There is also an imbalance among disease-related categories, with more labels for diseases such as grayleaf disease and fertilizer deficiency. Therefore, to address these label imbalances, the dataset was divided in a dynamically increasing way. Initially, based on public dataset 1, the training set, testing set, and validation set were divided for each category according to a ratio of 7:2:1. Subsequently, in light of the results of the instance distribution of each category, sub-datasets 2 and 3 were incrementally added to at a ratio of 8:1:1. Finally, 972 images were obtained for the training set, 198 images for the test set, and 131 images for the validation set, ensuring a balanced distribution. This method avoided having an excessive number of certain labels. Detailed information is shown in
Table 1.
2.3. D-YOLO Network Structure
YOLOv8, a fast one-stage detection algorithm developed by Ultralytics Inc. (Los Angeles, CA, USA), features a network architecture composed of a backbone, a neck, and a detection head [
19]. The backbone is responsible for extracting image features, the Feature Pyramid network (FPN) in the neck processes features at different scales, and the detection head is used to locate object categories. Its decoupled head and C2f module contribute to enhanced performance and efficiency. However, YOLOv8 does not always exhibit optimal performance in certain plant detection tasks, particularly when confronted with complex environmental scenarios [
20,
21]. In light of the characteristics of the strawberry health detection task, this paper proposes a detection method named D-YOLO, which is based on YOLOv8s. Its structure is depicted in
Figure 3. As shown in
Figure 3a, D-YOLO consists of three components. (1) A lightweight backbone, the MobileNetv3 network, is employed to compress model parameters and boost detection speed. (2) A neck network screens and fuses multi-level features to provide more health-related information. The feature fusion network Concat_BiFPN can learn different input features through bottom-up and top-down bidirectional cross-scale connection and weighted. CoT attention can better integrate the relationship between context information and target feature information, and it is more sensitive to small and dense targets. (3) Three Detect modules that can gradually refine the detection results and improve the detection accuracy. Finally, to guide the network to pay more attention to the location and channel information of smaller targets, W-IoU is used to replace the Complete IoU (CIoU) loss function of the original YOLOv8, especially when handling class imbalance issues.
2.3.1. MobileNetv3 Module
The MobileNetv3 module [
22] can be divided into two parts. First, there is depthwise separable convolution, where each convolution kernel corresponds to a single channel. This design significantly reduces the number of parameters. Second, pointwise convolution linearly combines each output channel with the input channel, allowing the network to learn cross-channel interaction information. To mitigate the impact of model parameters, computational complexity, and limitations on detection speed during network deployment, MobileNetv3 with depthwise separable convolution is adopted to replace the original CSP Darknet structure in the YOLOv8 backbone. Unlike standard convolution, as shown in
Figure 3b, the block module of MobileNetv3 compresses the spatial information of the output feature map by introducing a Squeeze-and-Excitation (SE) module. It performs two fully connected layer operations on the compressed feature map to obtain a feature map with channel attention. Finally, the final output feature layer is obtained by channel-by-channel multiplication of the channel attention feature layer and the original feature layer.
2.3.2. Concat_BiFPN
YOLOv8 employs PAN-Net as its feature pyramid network and further enhances the representation ability of multi-scale features by introducing a bottom-up path. The more accurate position signals in the shallow layers of the network are transmitted and fused into the deep features, integrating features of different scales. However, when the unidirectional information flow encounters features with different input resolutions, its contribution to the fused output features varies [
23]. Therefore, this research proposes a multi-scale feature fusion BiFPN to optimize the feature pyramid network of YOLOv8. As shown in
Figure 3b, while repeatedly applying top-down and bottom-up multi-scale feature fusion, BiFPN introduces learnable weights. These weights adjust the effects of feature without adding redundant parameters and provide stronger semantic information for the network [
24]. Moreover, the BiFPN structure realizes cross-scale connection and deeper feature fusion by deleting one node of the input and output, and adding additional edges between the input and output nodes of the same level, which effectively reduces the inference speed.
2.3.3. CoT Attention
The CoT attention mechanism [
25] fully utilizes the context information among input feature maps to guide the learning of the dynamic attention mechanism matrix, thereby enhancing the image representation ability. The lush leaves of strawberry plants can result in a complex background and occlusion, increasing the difficulty of detection. Additionally, detecting small and dense objects is a major challenge in the field of object detection. To address these issues, three CoT attention mechanisms with collaborative learning are incorporated between the feature fusion and detection heads at the neck of the network. Traditional convolutional neural networks typically use the self-attention mechanism of two-dimensional images. This mechanism mainly relies on local information and is ill-suited for tasks that require capturing global information over a long distance. Therefore, the CoT attention mechanism was introduced to improve the model’s ability to capture and perform long-distance modeling. As shown in
Figure 3b, through the self-attention mechanism and convolution operations, the CoT module combines the characteristics of dynamic and static information processing. Its operational mechanism is as follows: each Key obtains the feature information of its neighborhood by performing a 3 × 3 convolution operation, capturing the static context information in this process. These static features are then fused with dynamic context information. The encoded Query and Key are fused via a feature pyramid, and a dynamic multi-head attention matrix is learned through a 1 × 1 convolutional layer. The CoT module is designed to optimize the feature fusion process, rendering the output feature information more comprehensive and sensitive. This is particularly beneficial for more accurate small-target detection. It can more effectively capture and establish long-distance relationships between the feature fusion and prediction output stages, thus enhancing the model’s ability to handle complex scenes and dense targets in strawberry detection tasks.
2.3.4. W-IoU
The regression loss function is one of the most important parameters to measure the performance of the model in the object detection task [
23]. Intersection over Union (IoU) is a common measurement method for the predicted frame overlap and the real frame overlap. It is the ratio of the area of the intersection area and union area of the predicted box and the true box, as shown in Equation (1):
While calculating the loss function, YOLOv8 uses CIoU, which not only computes the overlapping area between the ground truth bounding box and the predicted bounding box, but also takes into account the distance between the centers and the consistency of aspect ratios [
19], as shown in Equations (2) and (3):
where
is the parameter of trade-off and
is the parameter used to measure the consistency of the aspect ratio. Both are defined in Equations (4) and (5):
Therefore, the loss function of YOLOv8 network can be calculated as follows in Equation (6):
CIoU, in its calculation, can only account for the aspect ratio difference while overlooking disparities in other aspects. When affected by spatial resolution, this loss function aggravates the penalty for low-quality object aspect ratios and is sensitive to small object position deviations. For the intricate strawberry detection task, this loss function fails to strike a balance between challenging and simple samples, which is detrimental to the small object detection task. In contrast, W-IoU [
26] evaluates the quality of anchors using the concept of “outlier degree”, and offers a gradient gain allocation strategy. This strategy can decrease the competitiveness of high-quality anchors and mitigate the harmful gradients produced by low-quality examples. By compensating for the limitations of CIoU, W-IoU comprehensively considers the aspect ratio, centroid distance and overlap area. This enables it to better balance good and poor anchor boxes, thereby significantly enhancing the overall performance of the detection system. The calculation equations of W-IoUv3 are presented in Equations (4)–(7):
where, W-IoUv3 uses
to penalize the aspect ratio difference between the bounding box and the ground truth. Additionally, it can penalize the angle, which helps to reduce the degrees of freedom in regression and accelerate the model’s convergence speed. W-IoUv3 is based on
. The non-monotonic focusing factor
constructed by W-IoUv3 can dynamically optimize the weights in the loss function, Moreover, the hyperparameters
can be adjusted to suit different models. Given these advantages, W-IoUv3 is ultimately chosen as the loss function for the model in this research.
2.4. Model Evaluation Criteria
In order to evaluate the effectiveness of D-YOLO model in strawberry development and health status detection tasks, this study evaluated and analyzed precision (P), recall (R), mAP, parameters (Params), and flops. P, R, and mAP are calculated in Equations (8)–(10):
in the above formula,
means that the target is correctly predicted,
means that the target is not correctly predicted, and
means the correct target that predicts the non-wrong target.
is the number of detection categories.
is the area under the P-R curve for a certain category.
2.5. Training Environment and Parameter Setting
Table 2 shows the experimental environment and parameter settings. All training conducted experiments and comparative analysis on the same dataset, experimental platform, and parameters.
3. Results
3.1. Lightweight Model
To comprehensively verify the practical effectiveness of the improved D-YOLO model in strawberry disease detection, this section introduces the MobileNetv3 backbone network as the baseline. MobileNetv3 is a lightweight network characterized by a relatively small number of model parameters and low computational complexity, enabling it to meet the real-time detection requirements of small devices [
27]. Substantive performance tests on strawberry disease detection were carried out for the improved D-YOLO model, the original YOLOv8s, GhostNet [
28], ShuffleNet [
29], EfficientViT [
30], and MobileNeXT [
31].
The comparison results are presented in
Table 3. Upon analyzing the data, it was evident that after replacing the lightweight backbone network, all six evaluation indicators of the model experienced a decline. YOLOv8s led in precision, recall, and mAP, showing high detection accuracy. However, lightweight models like baseline and YOLOv8–MobileNeXT had far fewer parameters (2.3 M and 2.0 M) and lower flops (5.8 G and 6.4 G), which benefits resource-constrained deployments. Although their precision, recall, and mAP were lower, the baseline still had a competitive mAP of 89.0%. The other models, such as GhostNet, ShuffleNet, and EfficientViT, fell between YOLOv8s and the lightweight models in terms of performance and resource usage. Specifically, with the same amount of computation, the baseline model had 5.8 G flops, representing a 79.6% decrease compared to YOLOv8s (28.5 G flops). In contrast, the decreases in flops for GhostNet, ShuffleNet, EfficientViT, and MobileNeXT were only 64.0%, 64.8%, 77.2%, and 77.5%, respectively. In terms of model complexity, the baseline model had 2.3 M parameters, showing a 77.8% reduction compared to YOLOv8s. However, the decreases in parameters for GhostNet, ShuffleNet, and EfficientViT were only 61.0%, 63.5% and 75.3%, respectively. Therefore, MobileNetv3 demonstrated the most significant lightweighting effect.
3.2. Comparation on Attention Mechanisms
The effectiveness of the CoT attention mechanism in the D-YOLO model for the strawberry disease detection task was verified. Under the same conditions, it compared the Efficient Multi-Scale Attention (EMA) [
32], Convolutional Block Attention Module (CBAM) [
33] and Coordinate attention (CA) [
34] models.
As can be seen from
Table 4, after adding five attention mechanisms, the recall and mAP were significantly improved. Among them, the recall and mAP of CoT improvements achieved by the CoT attention mechanism were more notable compared to those of the other three attention mechanisms. In particular, the other three attention mechanisms all sacrificed recall to some extent in order to improve precision, leading to a large gap. The CoT attention mechanism had the most significant effect on improving recall, with an increase of 2.3%, and both precision and F1 increased by 0.6%. At the same time, CoT was more complex than other attention mechanisms within an acceptable range, which also resulted in an increase of 1.4 G in flops.
From the mAP results of different categories, the detection capabilities of all attention mechanisms were quite remarkable. The detection performance for the “powdery” category was the best. Next came “acalcerosis” and “greyleaf”, and finally “fertilizer”. Regarding the detection of the strawberry development process, the model performed well in identifying “flowers”, “fruits”, and “ripe”, but generally showed poor performance in the “health” category. The CoT attention mechanism achieved the best results among all attention mechanisms in detecting “fruit”, “powdery”, and “greyleaf”, and showed comparable results in the “flower” and “acalcerosis” categories.
Through the analysis of the confusion matrix (
Figure 4), it was found that the improved model achieved a detection accuracy of over 90% for both ripe fruits and stressed plants. This indicates that the model is conducive to the detection of strawberry yield and stress conditions. On the other hand, we can also identify the reasons for the model’s relatively poor detection performance. The main cause is attributed to misclassifications between the “health” category and the background. Following that, misjudgments between flowers and unripe fruits contributed to the problem. This also shows that when the model is faced with different scenarios, especially in farmland planting scenarios, it tends to misclassify healthy plants as the background (even though they are similar in nature). Most of the misclassified plants were present in images with multiple overlapping targets, which are difficult to label accurately.
3.3. Ablation Experiment
To further verify the performance of the improved D-YOLO model in the strawberry disease detection task, four groups of networks were set up to assess and validate the improvement effect of each improved module compared to the baseline. The results can be found from
Table 5.
As shown in
Table 5, experimental results indicate that after incorporating MobileNetv3, the number of parameters and flops was significantly reduced while maintaining the model’s accuracy. The BiFPN, CoT, and W-IoU modules gradually helped to narrow the gap in mAP. Notably, after adding the W-IoU module, the performance reached the optimal level. After optimizing the feature fusion, cross-scale connection and deeper feature fusion were achieved. Although the mAP only increased by 0.1%, the inference speed was effectively improved. Moreover, the CoT attention mechanism further strengthened the model’s feature extraction ability in complex environments. It effectively suppressed the interference of background information, improved the feature attention to the target category, and enhanced the feature extraction ability. The unique calculation method of CoT boosted the recognition rate of the strawberry’s development and health state by 0.2% in complex environments. Simultaneously, the W-IoU module improved the detection mAP. When the increase in model parameters and computation amount was negligible, the mAP was further improved by 0.3%. Finally, compared to the baseline model, the overall parameters improved by 0.5%, while the total number of parameters and flops only increased by 0.8 M and 1.3 G, respectively. Compared with YOLOv8s, although the mAP decreased by 1.8%, our improved model reduced the parameters by 72% and the flops by 75.1%.
3.4. Performance Comparison of Different Models
To qualitatively evaluate the detection effect of the improved D-YOLO, Faster R-CNN [
35], RetinaNet [
36], YOLOv5s [
37], YOLOv5-320 [
38], YOLOv6n [
39], YOLOv6s, YOLOv8n [
19], YOLOv8s, and D-YOLO were used for comparison, respectively. The provided
Table 6 and
Figure 5 present a comprehensive comparison of several state-of-the-art object detection models.
On the whole, the parameter counts of 25.6 M for Faster R-CNN and 27.1 M for RetinaNet suggest that they are relatively complex models. This complexity is also reflected in their long training times. Faster R-CNN takes 36.45 h and RetinaNet takes 35.37 h. In terms of mAP, Faster R-CNN achieved a relatively low value of 37.8%, while RetinaNet performed better with an mAP of 63.9%. Their high computational requirements, with 16.8 G FLOPs for Faster R-CNN and 16.1 G flops for RetinaNet, may be a contributing factor to their long training times.
Among the YOLO-based models, YOLOv5s was remarkable, with a high precision rate of 90.5% and a relatively high recall of 86.4%, achieving an mAP of 91.2%. It had 7.0 M parameters and 15.8 G flops, and its training time was 6.30 h. YOLOv5-320, a lightweight variant of YOLOv5, featured significantly fewer parameters and lower flops, resulting in a shorter training time of 4.25 h. However, this reduction in complexity sacrificed performance, as its precision, recall, and mAP were lower than those of YOLOv5s. YOLOv6n had a relatively low recall and mAP. With 4.2 M parameters and 11.8 G flops, its training time was merely 1.40 h, making it one of the fastest training models in the comparison. In contrast, YOLOv6s attained a high mAP of 91.5%, similar to YOLOv5s. But it had a much higher parameter count and a large number of flops, likely due to its more complex architecture. YOLOv8n struck a balance between performance and complexity. It had a precision of 87.0%, a recall of 86.0%, and an mAP of 90.8%, along with 3.2M parameters and 8.2 G flops. YOLOv8s showed a slightly higher mAP of 91.4%, with a precision of 87.7% and a recall of 88.4%. It had 11.1 M parameters and 28.5 G flops, and its training time was 3.45 h. Our proposed D-YOLO model reached a precision of 86.6% and a recall of 87.8%, resulting in an mAP of 89.6%. Although its mAP was slightly lower than that of some high-performing models like YOLOv5s, YOLOv6s, and YOLOv8s, D-YOLO has distinct advantages. It had an extremely low parameter count of 2.3 M and only 7.1 G flops, significantly lower than most of the other models. Moreover, it had the shortest training time of 1.399 h. This indicates that D-YOLO offers an excellent balance between performance and resource utilization. It can be efficiently deployed on resource-constrained devices such as edge devices or embedded systems, maintaining a relatively high level of detection accuracy. In conclusion, while D-YOLO may not have had the highest mAP, its combination of low parameter count, low flops, and short training time makes it a promising choice for applications where efficiency and speed are crucial.
In this study, we also visually compared the two models with the worst overall performance and the three models with the best overall performance. Four images of different categories in different environments were randomly selected from the testing set for visualization and comparison. These images included large visual, branches occlusion, rainy day with water droplets, and sunny day with direct sunlight. It can visually explain why Faster R-CNN and RetinaNet were not effective. As shown in
Figure A1, Faster R-CNN performed poorly in tasks with low pixels and branches occlusion, but it had a relatively high detection rate for the health category. In contrast, RetinaNet had a relatively high detection rate for ripe category, but it could hardly detect the “health” category. It was speculated that it performed better in tasks with prominent features (such as color). YOLOv5s, YOLOv8s, and D-YOLO had relatively high detection effects. It was found that D-YOLO had a fairly high detection rate for small targets and complex environments, and had a similar effect to that of those YOLO models.
3.5. Visual Analysis
The research visually analyzed the feature maps in the D-YOLO detection process, making it easy to intuitively understand the performance of the model in the detection process. Feature visualization was evaluated using Grad-CAM, and the generation process of heatmapping is shown in
Figure 6. The generation process of the feature map included the original image, the lightweight backbone, the BiFPN, and attention module. Eight categories with different environments and health conditions were randomly selected from the testing set to form a set of feature generation maps.
It was found that the model’s attention was scattered in the shallow feature map of the network. It did not only focus on specific categories, but also included background and texture information. As the network layers deepened, the model continuously extracted the semantic information of various categories to higher dimensions, retained and enhanced the target information, and the attention area on the feature map gradually became concentrated and appeared dark red. Moreover, through these eight categories, it was found that the model’s focus on each category varied. For flowers, the model mainly focused on the stamens in the shallow layers, while in the deeper layers, it paid more attention to the correlation between the stamens and their surrounding areas. This implies that the model can more accurately judge whether the plant has entered the fruiting stage. When it comes to unripe and ripe fruits, the model paid more attention to the central part of the fruits, which may be related to the color of the fruits. Regarding diseased and healthy leaves, the model focused more on the lesion areas. In general, the D-YOLO model effectively eliminated the interference of the background, expanded the perception domain of the feature map, refined the attention feature area of the category, and mad the detection more efficient, indicating that the improved model had a good detection effect. However, at the same time, these feature maps also showed the main reason for the low mAP on individual categories. This was because the model cannot make a judgment in the face of severe occlusion, long field of view, or illumination influence.
3.6. Model Verification
To further verify the superiority of our model, we conducted model validation using the testing set that did not participate in the training task. As shown in
Table 7, our model achieved an mAP of 90.5% in eight categories, and the precision reached 87.6%. Furthermore, our model had obvious advantages in the detection of flowers, ripe, fruit, acalcerosis, powdery, and greyleaf. Compared with the training set, D-YOLO significantly improved the detection indicators of precision, recall, and mAP in the categories of health and fertilizer. At the same time, it also had a good effect on the detection of small targets such as fruit, powdery, and greyleaf. D-YOLO had a good comprehensive performance in the identification of different growth and development processes, and health conditions in various environments.
5. Conclusions
This paper proposes a lightweight model D-YOLO that can perform strawberry task detection in complex environments. The model uses MobileNetv3 as the backbone network, and uses BiFPN to optimize the feature pyramid network of the original YOLOv8. In addition, the CoT attention mechanism was added to the neck network of YOLOv8, and the W-IoU loss function was used to optimize the network mode. The experimental results show that D-YOLO obtained 89.6% mAP in the training set and 90.5% mAP in the testing set. The parameters were reduced 72.0% and the flops obtained a reduction of 75.1%. Moreover, D-YOLO was better than the commonly used object detection models in the comprehensive indicators of training effect and training time. This shows that the designed network model can well identify and judge the development process and health state of strawberries. Cross-domain validation on a maize disease dataset demonstrated D-YOLO’s superior generalization with 94.5% mAP, outperforming YOLOv8 by 0.6%. Through the above studies, it is proved that D-YOLO algorithm is lightweight and effective, which provides strong technical support for real-time monitoring and early intervention of strawberry diseases. Although our model has some unavoidable limitations, it can still effectively judge the growth and development process and health status of strawberries. In future research, we need to consider constructing more diverse strawberry or other crops health states and further optimizing the model. Only in this way can it better withstand the impacts of occlusion, illumination, and other factors, and address the problems of occlusion and low precision in complex environments.


