Article

Crop Performance and Photochemical Processes Under a UV-to-Red Spectral Shifting Greenhouse: A Study on Aubergine and Strawberry

by
Stefano Conti
1,
Ida Di Mola
1,*,
Miloš Barták
2,
Eugenio Cozzolino
3,
Giuseppe Melchionna
1,
Pasquale Mormile
4,
Lucia Ottaiano
1,
Roberta Paradiso
1,
Massimo Rippa
4,
Antonino Testa
5 and
Mauro Mori
1
1
Department of Agricultural Sciences, University of Naples Federico II, Piazza Carlo di Borbone 1, 80055 Portici, Italy
2
Laboratory of Photosynthetic Processes, Department of Experimental Biology, Faculty of Science, Masaryk University, Kamenice 5, 62500 Brno, Czech Republic
3
Council for Agricultural Research and Economics (CREA), Research Center for Cereal and Industrial Crops, 81100 Caserta, Italy
4
National Research Council (CNR), Institute of Applied Science and Intelligent System, 80078 Pozzuoli, Italy
5
Department of Environmental, Biological and Pharmaceutical Sciences and Technologies, University of Campania Luigi Vanvitelli, 81100 Caserta, Italy
*
Author to whom correspondence should be addressed.
Agriculture 2025, 15(6), 569; https://doi.org/10.3390/agriculture15060569
Submission received: 14 January 2025 / Revised: 1 March 2025 / Accepted: 3 March 2025 / Published: 7 March 2025
(This article belongs to the Section Crop Production)

Abstract

:
Light quality is a fundamental factor in greenhouses, since different light wavelengths affect plant photosynthesis and photomorphogenesis differently, they thus affect crop growth and productivity. The aim of this study was to evaluate the effect of an experimental greenhouse cover film with UV-to-Red spectral shifting properties on photosynthesis, plant growth, fruit yield, and the quality of two crops spanning over a year-long cultural cycle: aubergines (Solanum melongena L.), as a spring–summer crop, followed by strawberries (Fragaria × ananassa Duch.), as an autumn–spring crop. Trials were carried out in a multispan greenhouse where two sectors were covered, each one with a different light diffusing polyethylene film: one sector was covered with a UV-to-Red photoluminescent film, doped with a blend of rare-earth elements partially converting the UV solar radiation into Red wavelengths, while a light diffusing polyethylene film was used as the control. At the physiological level, spectral shifting affected the chlorophyll fluorescence parameters related to the photochemistry of photosynthesis, which were found to be positively related to crop yield. Moreover, differential analysis of the fast Chlorophyll a fluorescence transients (or OJIP kinetics) showed that spectral shifting affected different steps of the plant photochemical metabolism.

1. Introduction

Light is the primary requirement for life on Earth since it powers photosynthesis, ultimately providing food to most living organisms. Photosynthesis is the single biological process which allows chlorophyll-containing organisms to convert energy coming from outside of our planet into photochemical energy. Moreover, the light-driven reactions of oxygenic photosynthesis also provide the vital oxygen supply, which allows for the existence of life on Earth [1].
Currently, a main objective of applied research in agriculture is the optimization of plant growth conditions with the aim of maximizing plant productivity and quality. This is especially important in consideration of the increasing world population [2] and climate change [3,4], which is seriously impacting agricultural productivity.
In this view, greenhouse agriculture allows the farmer to manage environmental factors, thus adjusting to plant requirements and allowing for high crop productivity even in unfavorable outdoor conditions. For this reason, the ability to control the light environment is of special interest in greenhouse agriculture, which, together with water availability and air temperature, affects plant growth, production, and quality.
Plants, as sessile organisms, have evolved finely regulated metabolic pathways that make use of light not just to provide energy for photosynthesis but also for regulating plant growth via photo-morphogenetic responses. Plants can decode information carried by the surrounding light environment and translate them into physiological responses such as the transition from a development stage to the next [5,6], the fine regulation of secondary metabolism [7,8], and the resistance to diseases [9,10].
The effects of light intensity on plant anatomy and photosynthesis have long been investigated, as reported for instance by Mitchell [11] and by Wilson and Cooper [12]. Light quantity in terms of intensity (PPFD) and duration (photoperiod) is commonly managed in greenhouse agriculture. On the other hand, plant growth and productivity are also affected by light spectral composition. For instance, the development of the photosynthetic apparatus is regulated by Red (R) light, while the photochemical reactions of photosynthesis are most effectively powered by R and Blue (B) wavelengths, and B light also regulates stomatal opening [13,14,15,16]. Moreover, modulation of R light intensity also induces photo-morphogenetic responses by modifying the Red:Far-Red and the Red:Blue ratios, thus regulating important plant responses including stem elongation, branching, and leaf expansion, ultimately affecting the plant growth and architecture. For instance, changes in leaf area can, in turn, positively or negatively modify the photosynthetically active surface. Consequently, the crosstalk between the R-induced effects on photochemical efficiency and the phytochrome-mediated light signaling needs to be evaluated when manipulation of the light spectrum is applied in greenhouse crops. On these bases, modulation of the light spectrum can be an effective tool for improving yield and quality in several crops [8,16,17,18]. Spectral modulation of the light environment can be achieved by the following strategies: monochromatic or combined light spectra using light emitting diodes (LEDs), as both supplemental light or the sole light source [8]; partial depletion or enrichment of specific wavelengths using photo-selective or colored films or nets [19]; and spectral shifting films [20,21].
LEDs are more efficient in power conversion than traditional light sources (e.g., High-Pressure Sodium (HPS) lamps) [22]. Moreover, LEDs also emit very little heat, which must be compensated by greenhouse heating. Overall, considering the cost of light sources and electricity and their environmental impact, the use of smart cover materials is able to improve the light distribution (i.e., diffusive covers) or the light spectrum (i.e., photo-selective or spectral shifting covers) is a potential tool for enhancement [23]. These covers can be designed to convert less photosynthetically active wavebands such as UV and Green (G) into the more effective B and R light [21].
From the physicist’s point of view, the light conversion process is called down-shifting photoluminescence, meaning that a photon of higher energy (UV) is converted to a photon of lower energy (R) [20]. Light conversion is based on the chemical/physical properties of “light conversion agents”, which include fluorescent dyes and organic and inorganic rare-earth elements (REE) complexes. Among the latter, inorganic REE complexes have a higher luminous efficiency and spectral emission that can be designed to match plant absorption, compared with organic REE complexes. Moreover, inorganic REE complexes are cheaper, easy to be prepared and stored, and more resistant to oxidation and high temperature. Hence, they are suitable for the doping of greenhouse cover films [24].
In previously published research, we reported the agronomical performance of lettuce (Lactuca sativa L.) and wild rocket (Diplotaxis tenuifolia L.) grown under small scale experimental greenhouses covered with REE doped poly-methyl methacrylate (PMMA) panels. In either case, plants grown under the spectral shifting covers produced higher yields, due to positive effects on physiology of photosynthesis [25,26]. However, the blend of rare-earths incorporated into the doped cover reduced the light intensity inside the greenhouse compared to the clear undoped control. Therefore, our findings did not allow us to separate the light-shifting from the shading effects.
In the present research, we upscaled and improved the previous experimental setup by using a light diffusing REE doped polyethylene (PE) film, converting UV radiation to R wavelengths, and we used a commercial light diffusive PE film as the control. The REE spectral shifting film was very close in light transmissivity to the commercial undoped control film.
Since any variation in the light environment affects plant photochemistry, this study aimed at gaining knowledge about the effect of spectral modification on the physiology of photosynthesis. The analysis of chlorophyll a (Chl a) fluorescence was the selected approach to be used in this study. Some Chl a fluorescence parameters such as ΦPSII (the effective photochemical efficiency of PSII in the light adapted state), Fv/FM (the theoretical maximum quantum efficiency of PSII photochemistry), or NPQ (the Non-Photochemical Quenching) are commonly used to monitor the overall health status of the plant, since they are indicators of efficiency of the photosynthetic metabolism [27,28].
Additionally, analysis of the fast transients of Chl a fluorescence provides detailed information about the energy flow across the thylakoidal membranes of the chloroplasts, detecting even small changes in the structure and functioning of the photosynthetic machinery. This method is based on recording, at high time-resolution of microseconds to milliseconds, the Chl a fluorescence emitted by a dark-adapted leaf within 2 s following illumination. Upon illumination, a fast increase in fluorescence emission occurs, from a minimum level (O) to a peak (P) intensity, following a polyphasic induction kinetic which can be observed by plotting the measured fluorescence intensity vs. time on a semi-logarithmic chart. This rapidly increasing chlorophyll fluorescence emission is known as “fast chlorophyll fluorescence transient” or OJIP kinetic from the conventional names of the main inflection points O (at 40 µs), J (at 2 ms), I (at 30 ms), and P (at ≈ 1 s), while F0, FJ, FI, and FP are the values of fluorescence intensity on an arbitrary scale recorded at these time points. The fast chlorophyll fluorescence transients are then analyzed according to the so-called JIP-test, originally proposed by Strasser [29]. The JIP-test results in tens of chlorophyll fluorescence parameters related to functionality of photosystem II (PSII) with biophysical and physiological interpretation. Those comprise (1) absolute chlorophyll fluorescence signals, (2) effectiveness (quantum yields) of PSII processes, and (3) phenomenological fluxes. Further analysis of OJIP kinetics based on OJIP normalizations and subtractions, provides a semiquantitative way to visualize the impact of external factors on the photochemistry of photosynthesis [30]. As such, the measurement of Chl a fluorescence is a convenient tool to examine the photosynthetic performance and the effect of stress factors non-destructively in vivo.
In two horticultural crops, with aubergines as a spring–summer crop and strawberries as an autumn–spring crop, we studied the effects of the R-shifted light spectrum on yield, agronomical and quality parameters, and on the physiology of photosynthesis by analyzing the OJIP kinetics of Chl a fluorescence. Compared to LED-based artificial lighting, smart covers offer the advantage of lower costs for both purchase and operation; hence, they are affordable for small and medium farms. Moreover, when spectral shifting is coupled with diffusive properties, they also allow for the advantages of more uniform light distribution at the canopy level.

2. Materials and Methods

2.1. Experimental Setup and Crop Management

The experiment was carried out at the private farm “I Sapori della Terra” located in Giugliano (40.9619 N; 14.1089 E, Naples, Italy) and lasted 14 months from March 2022 to May 2023.
Aubergines and strawberries were grown in a large multispan tunnel greenhouse consisting of 10 structural units, each 5 m wide, 39 m long, and 2.5 m high. Five units (test sector) were covered with a UV-to-R photoluminescent film, doped with a blend of REEs partially converting the solar UV radiation into R wavelengths, while the other five units were covered with a standard light diffusing PE film as the control. No physical separation was built inside the greenhouse between the two sectors, to minimize the differences induced by the covers in air temperature and RH. This choice aimed at avoiding the side effects of the covers on other environmental parameters, to better study the specific influence of the light spectrum. The sampling areas were located within the three middle greenhouse units of each sector.
Aubergine plants (Solanum melongena L.), hybrid cv. ‘Senegal’ (Semillas Fitò Italia, Padua, Italy), were transplanted in the first ten days of March 2022 at the plant density of 1 plant m−2 (1.4 m between rows and 0.7 m within the row) and harvested 8 times from 16 June to 21 July 2022.
Strawberry (Fragaria × ananassa Duch.) plants cv. ‘Red Sara’ (Planasa, Valtierra, Spain) were transplanted in the first ten days of October 2022 in double rows (0.35 m apart, 1.05 m between the double row; 0.20 m along the row). Fruits were harvested 9 times from 10 March until 20 May 2023.
Crops were grown on a sandy-loam soil (57% sand, 24.8% silt, 18.2% clay), pH 7.4, total nitrogen (Kjeldahl method) 1.13 g kg−1, phosphorus pentoxide (Olsen method) 277.2 ppm, potassium oxide (Tetraphenylborate method) 1393.5 ppm, and organic matter (Bichromate method) 1.7%.
Fertilization and pest control were managed according to local agricultural practices; water losses were calculated with the Hargreaves formula [31] and fully restored by drip irrigation.
The control sector (C) was covered with a diffusive PE film (Suntherm, Ginegar Plastic Products Ltd., Israel; supplied by Polyeur, Benevento, Italy) with no UV-A-induced fluorescence in the visible spectrum. The test sector was covered with a spectral shifting PE film, doped with a blend of REE including Europium and Dysprosium. This spectral shifting cover (SS) was customized by Lucedentro Srl (Sassuolo, Italy), who are currently developing a commercial product to be patented, therefore, its exact composition and production process were not made public. The SS film had a 30% light diffusion. The optical properties of this PE film are reported in the following Section 3.1.
The harvest dates were the following: for the aubergine crop, 16 June (I), 20 June (II), 24 June (III), 30 June (IV), 5 July (V), 7 July (VI), 14 July (VII), and 21 July (VIII); and for the strawberry crop, 10 March (I); 16 March (II); 23 March (III); 28 March (IV); 3 April (V); 15 April (VI); 3 May (VII); 9 May (VIII), and 20 May (IX).

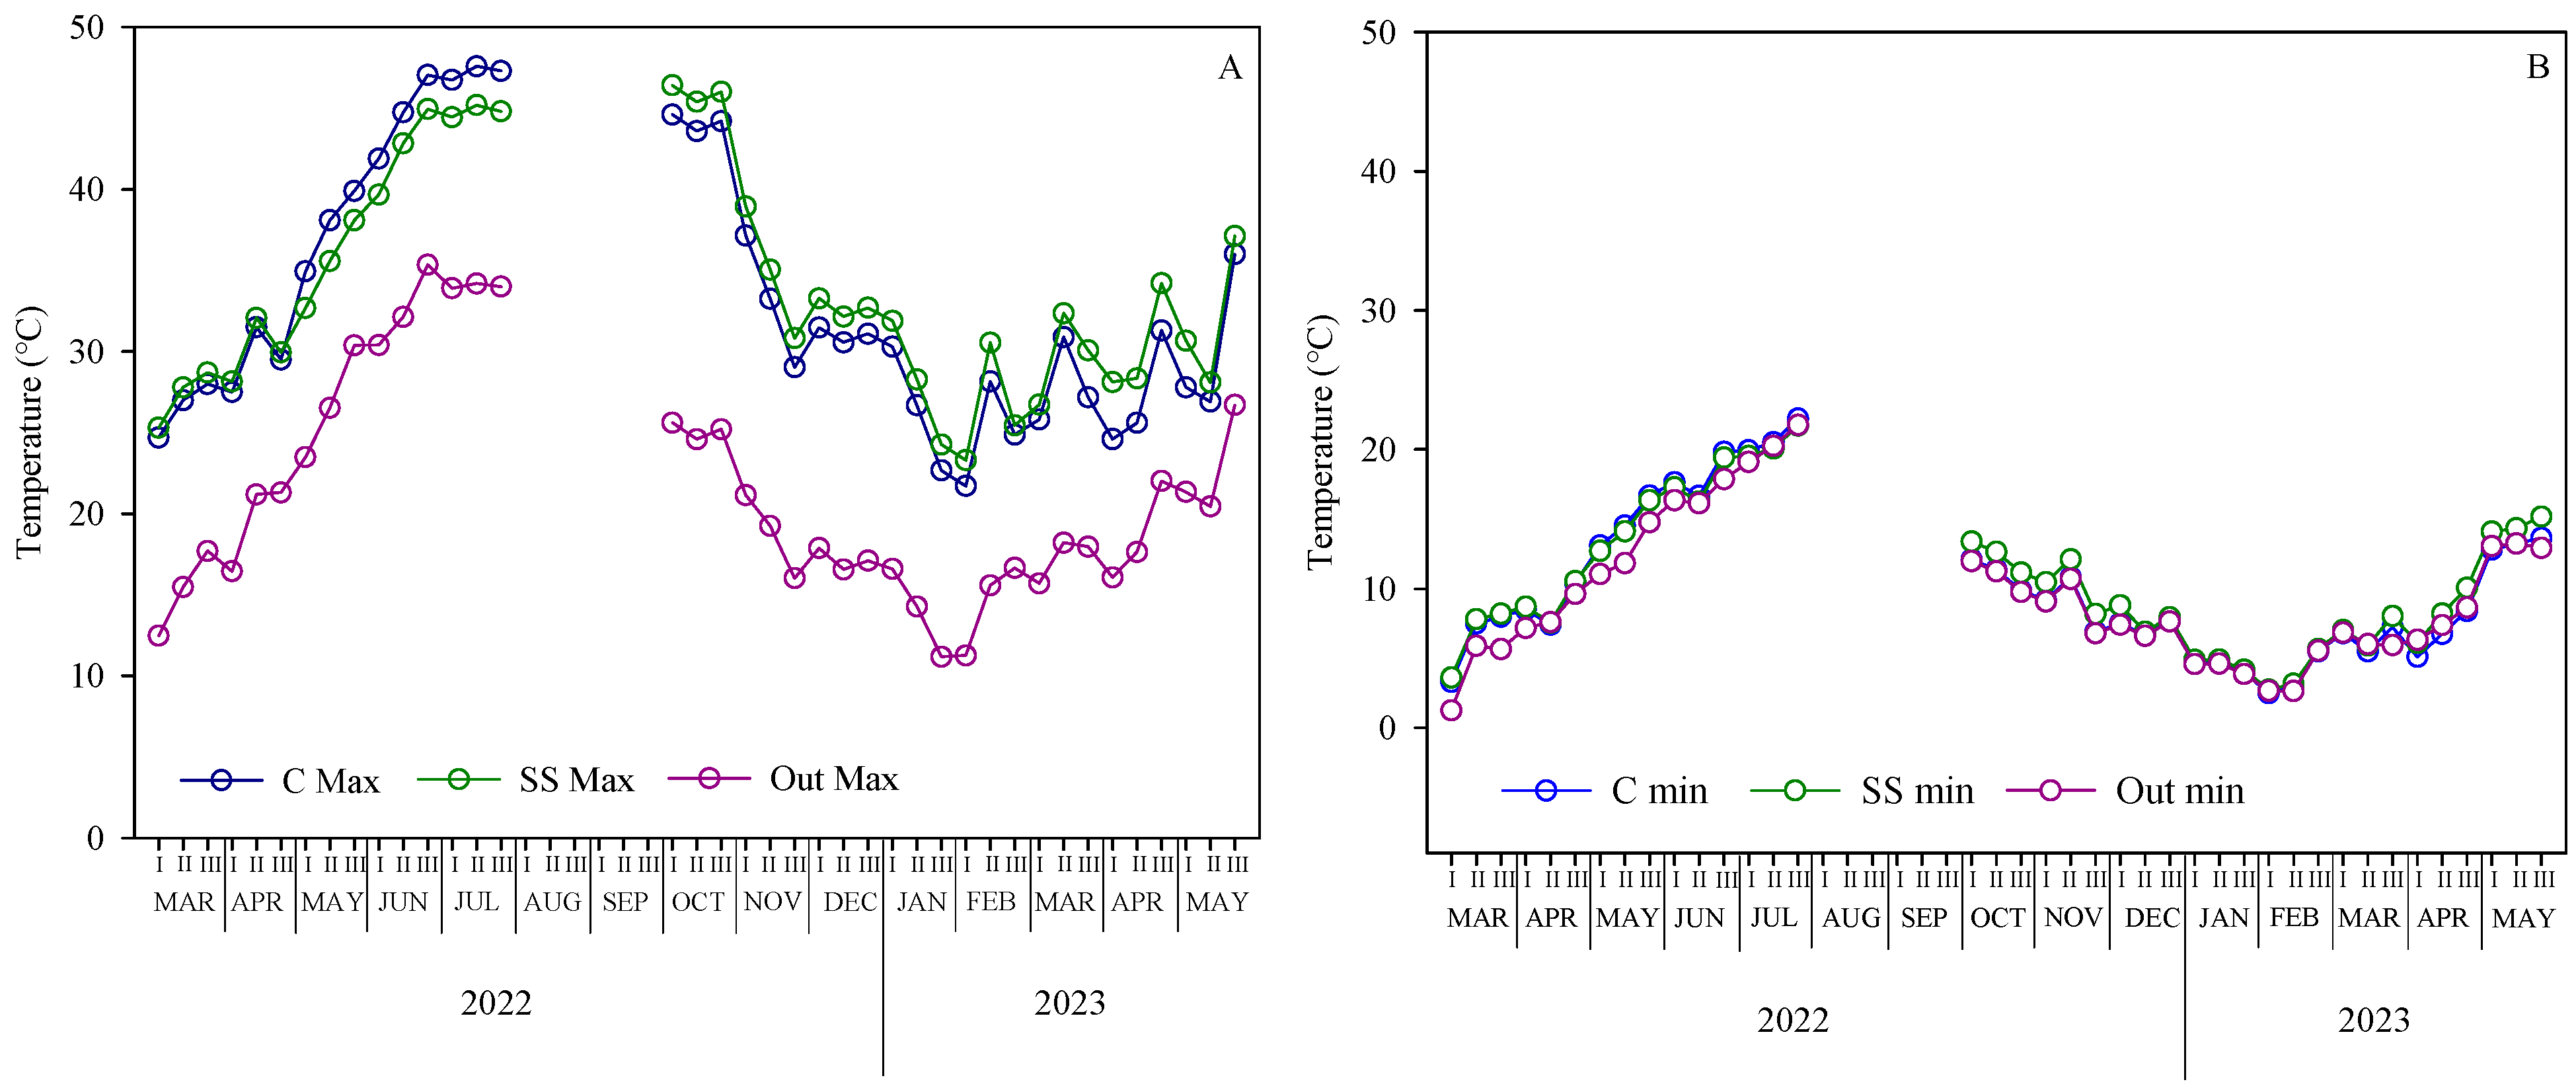
2.2. Temperature Pattern Under the Greenhouse

Air temperature data (Figure 1) were continuously recorded during the whole experimental period, under both the control and the spectral shifting (SS) greenhouse sectors as well as outside, using an EL-USB-1 temperature data logger (Lascar Electronics, Wiltshire, UK).
The maximum temperature inside both greenhouses was higher than outside, reaching 33.5 °C (mean value of the two films) vs. 21.3 °C (outside) (Figure 1A). A smaller difference was recorded between the inside (10.3 °C) and outside (9.5 °C) minimum temperatures (Figure 1B). During the aubergine crop cycle (March–July 2022), no differences in Max temperatures between the two cover films (0.2 °C, mean value) were recorded in March–April, while higher temperatures were recorded under the control (+2.2 °C) compared with the spectral shifting greenhouse, in the latest part of the crop cycle (Figure 1A). The highest temperatures were recorded in the second ten days of July, reaching 47.6 °C and 45.2 °C under the control and spectral shifting greenhouse, respectively. During the strawberry cycle (October 2022–May 2023), instead, both minimum and maximum temperatures were always higher under spectral shifting film compared to control film: +0.8 °C and +1.9 °C, respectively (Figure 1A,B).

2.3. Analytical Methods

2.3.1. Yield

Three sampling areas were identified within each greenhouse sector (C and SS) and 10 plants were sampled per sampling area, each one corresponding to a replicate. At each harvest, for both aubergine and strawberry crops, the following production data were collected: number of marketable and not marketable fruits per square meter, total fresh weight in order to determine marketable and unmarketable yield (expressed in tons ha-1), and mean fruit weight. Fruits were classified as “marketable” when they were ripe, undamaged, regularly shaped, and heavier than 100.00 g (aubergine) or 20.00 g (strawberry).

2.3.2. Fruit Quality Parameters

Fruit quality parameters were assessed on a sample of 10 fruits per replicate in each crop, at the middle of the productive phase (harvest V).
Dry matter was assessed after oven-drying of fresh fruits (100 g sample) at 70 °C until a constant weight was reached.
Firmness was measured on two opposite sides of each fruit, using a digital penetrometer (T.R. Turoni srl, Forlì, Italy) equipped with an 8 mm diameter probe, and the results were expressed in kg cm−2.
The total soluble solid (TSS) content of strawberry juice was measured using a digital refractometer (Sinergica Soluzioni, DBR35, Pescara, Italy), and the results were expressed as °Brix.
The color space parameters (L*, a*, and b*) were measured on two opposite sides of each fruit with a CR-300 Chroma Meter (Minolta Camera Co. Ltd., Osaka, Japan). L* is brightness, ranging between 0 (black, no reflection) and 100 (white); a* is the chroma parameter, ranging between −60 (Green) and +60 (Red); and b* is the chroma parameter ranging between −60 (Blue) and +60 (Yellow).

2.3.3. Chemical Analyses

At the same harvest (harvest V), fresh fruit samples (10 marketable fruits per replicate) were frozen in liquid nitrogen and stored at −80 °C. A sub-sample from each frozen sample was lyophilized, prior to chemical analyses.
The total ascorbic acid (TAA) content was assayed spectrophotometrically according to Kampfenkel et al. [32] and it was expressed as mg ascorbic acid 100 g−1 fresh weight (fw). Carotenoid content was spectrophotometrically assayed after extraction with ammoniacal acetone according to Lichtenthaler and Wellburn [33] and it was expressed as mg g−1 fw. Hydrophilic antioxidant activity (HAA) was evaluated by the N,N-dimethyl-p-phenylenediamine (DMPD) method [34] and results were expressed as mmol of ascorbic acid (AsA) 100 g−1 dw. Lipophilic antioxidant activity (LAA) was assayed by the ABTS method according to Re et al. [35] and the results were expressed in mmol of Trolox 100 g−1 dw. Total phenols were determined in methanolic extracts [36], using the Folin–Ciocalteu method [37], with gallic acid as a standard.

2.4. Chlorophyll Fluorescence Measurements

Non-destructive chlorophyll a (Chl a) fluorescence measurements were taken in vivo on randomly sampled fully expanded leaves at the beginning of the productive phase to record the photochemical parameters in fully developed plants. Twenty replicate measurements for each treatment were taken between 12:50 and 13:45 h on 21 June for aubergines and between 12:10 and 13:10 h on 14 February for strawberries.
Fast chlorophyll fluorescence transients were recorded using a PAR-FluorPen FP 110/D portable fluorimeter (Photon Systems Instruments, Drásov, Czech Republic), equipped with detachable leaf clips. Chl a fluorescence was induced by the fluorimeter internal LED Blue light (455 nm), set at 90% power and producing a saturating actinic light pulse of 2700 μmol photons m−2 s−1, and the fast rise of Chl a fluorescence was recorded for 2000 ms using the fluorimeter OJIP protocol, according to Strasser et al. [29]. Fluorescence measurements were carried out as previously described [25], modified as follows: a first measurement was recorded immediately after clipping the fluorimeter onto the leaf in its light-adapted state (LAS), then the leaf clip window was closed and the leaf was dark-adapted for 30 min, prior to dark-adapted state (DAS) measurements. The required duration of the pre-darkening period had been previously assessed by following a time course of Fv/FM (DAS) increase until a constant value. Afterward, a second measurement in the DAS was recorded using the same fluorimeter settings. Fluorescence data were acquired and processed using the FluorPen software ver. 1.1 (Photon Systems Instruments, Drásov, Czech Republic) and they were further analyzed using Microsoft Excel 365. The effective quantum yield of PSII photochemistry in the LAS (ΦPSII) was calculated by the FluorPen software according to Genty et al. [38] while NPQ was calculated according to Bilger and Björkman [39] as NPQ = (FM − F’M)/F’M where FM is the maximum fluorescence measured in the DAS and F’M is the maximum fluorescence measured in the LAS. JIP-test parameters (Table 1) were calculated by the FluorPen software according to Strasser et al. [29].
OJIP kinetics were double normalized between specific time-points and then the control (C) transient was subtracted from the test (SS) transient, graphically evidencing bands, which provided more detailed information about photochemistry [30,40,41].
Table 1. Summary of JIP-test parameters definition. Based on Stirbet and Govindjee [42] and Tsimilli-Michael [30].
ParametersDefinitions
F0 ≅ F40µsminimal fluorescence, when all PSII RCs are open (≅to the minimal reliable recorded fluorescence)
FJ ≡ F2msfluorescence at the J-step (2 ms) of OJIP
FI ≡ F30msfluorescence at the I-step (30 ms) of OJIP
FM (=FP)maximal fluorescence, when all PSII RCs are closed (=FP when the actinic light intensity is above 500 µmol photons m−2 s−1)
Fv = FM − F0maximal variable fluorescence
VJ = FJ/Fv = (FJ − F0)/(FM − F0)relative variable fluorescence at the J-step (2 ms)
VI = FI/Fv = (FI − F0)/(FM − F0)relative variable fluorescence at the I-step (30 ms)
FM/F0Maximum to background chlorophyll fluorescence ratio
Fv/F0Variable to background chlorophyll fluorescence ratio
Fv/FM (=φP0)maximum quantum yield of PSII photochemistry
M0approx. initial slope (in ms−1) of the fluorescence transient normalised on the maximal variable fluorescence Fv = FM − F0
Areatotal complementary area between the fluorescence induction curve and F = FP
Sm = Area/Fv = EC0/RCNormalized area, a measure of the energy needed to close all Reaction Centres. Refers to the multiple turn-over in the closure of the reaction centres from time F0 up to the time FM.
SsThe smallest Sm, corresponding to the case when every QA is reduced only once. Single turn-over.
N = Sm/SsTurn-over number, expresses how many times QA is reduced in the time interval from F0 to FM
Quantum yields and efficiencies or probabilities
φP0 (=Fv/FM)Maximum quantum yield of PSII photochemistry
ψ0Efficiency with which a trapped exciton can move an electron further than QA into the electron transport chain
φE0Quantum yield of the electron transport flux from QA to QB
φD0Quantum yield for energy dissipation
φPavQuantum yield of the electron transport flux until the PSI electron acceptors
Specific energy fluxes (per active PSII RC)
ABS/RCAbsorbed photon flux per PSII Reaction Centre (apparent antenna size of an active PSII)
TR0/RCTrapped energy flux (leading to QA reduction) per PSII Reaction Centre
ET0/RCElectron transport flux beyond QA per PSII Reaction Centre
DI0/RCDissipated energy flux per PSII Reaction Centre
Performance index
PIAbsPerformance index for energy conservation from photons absorbed by PSII antenna until the reduction in intersystem electron acceptors
Briefly, both SS and control C fluorescence transients were double normalized between 2 time points as follows:
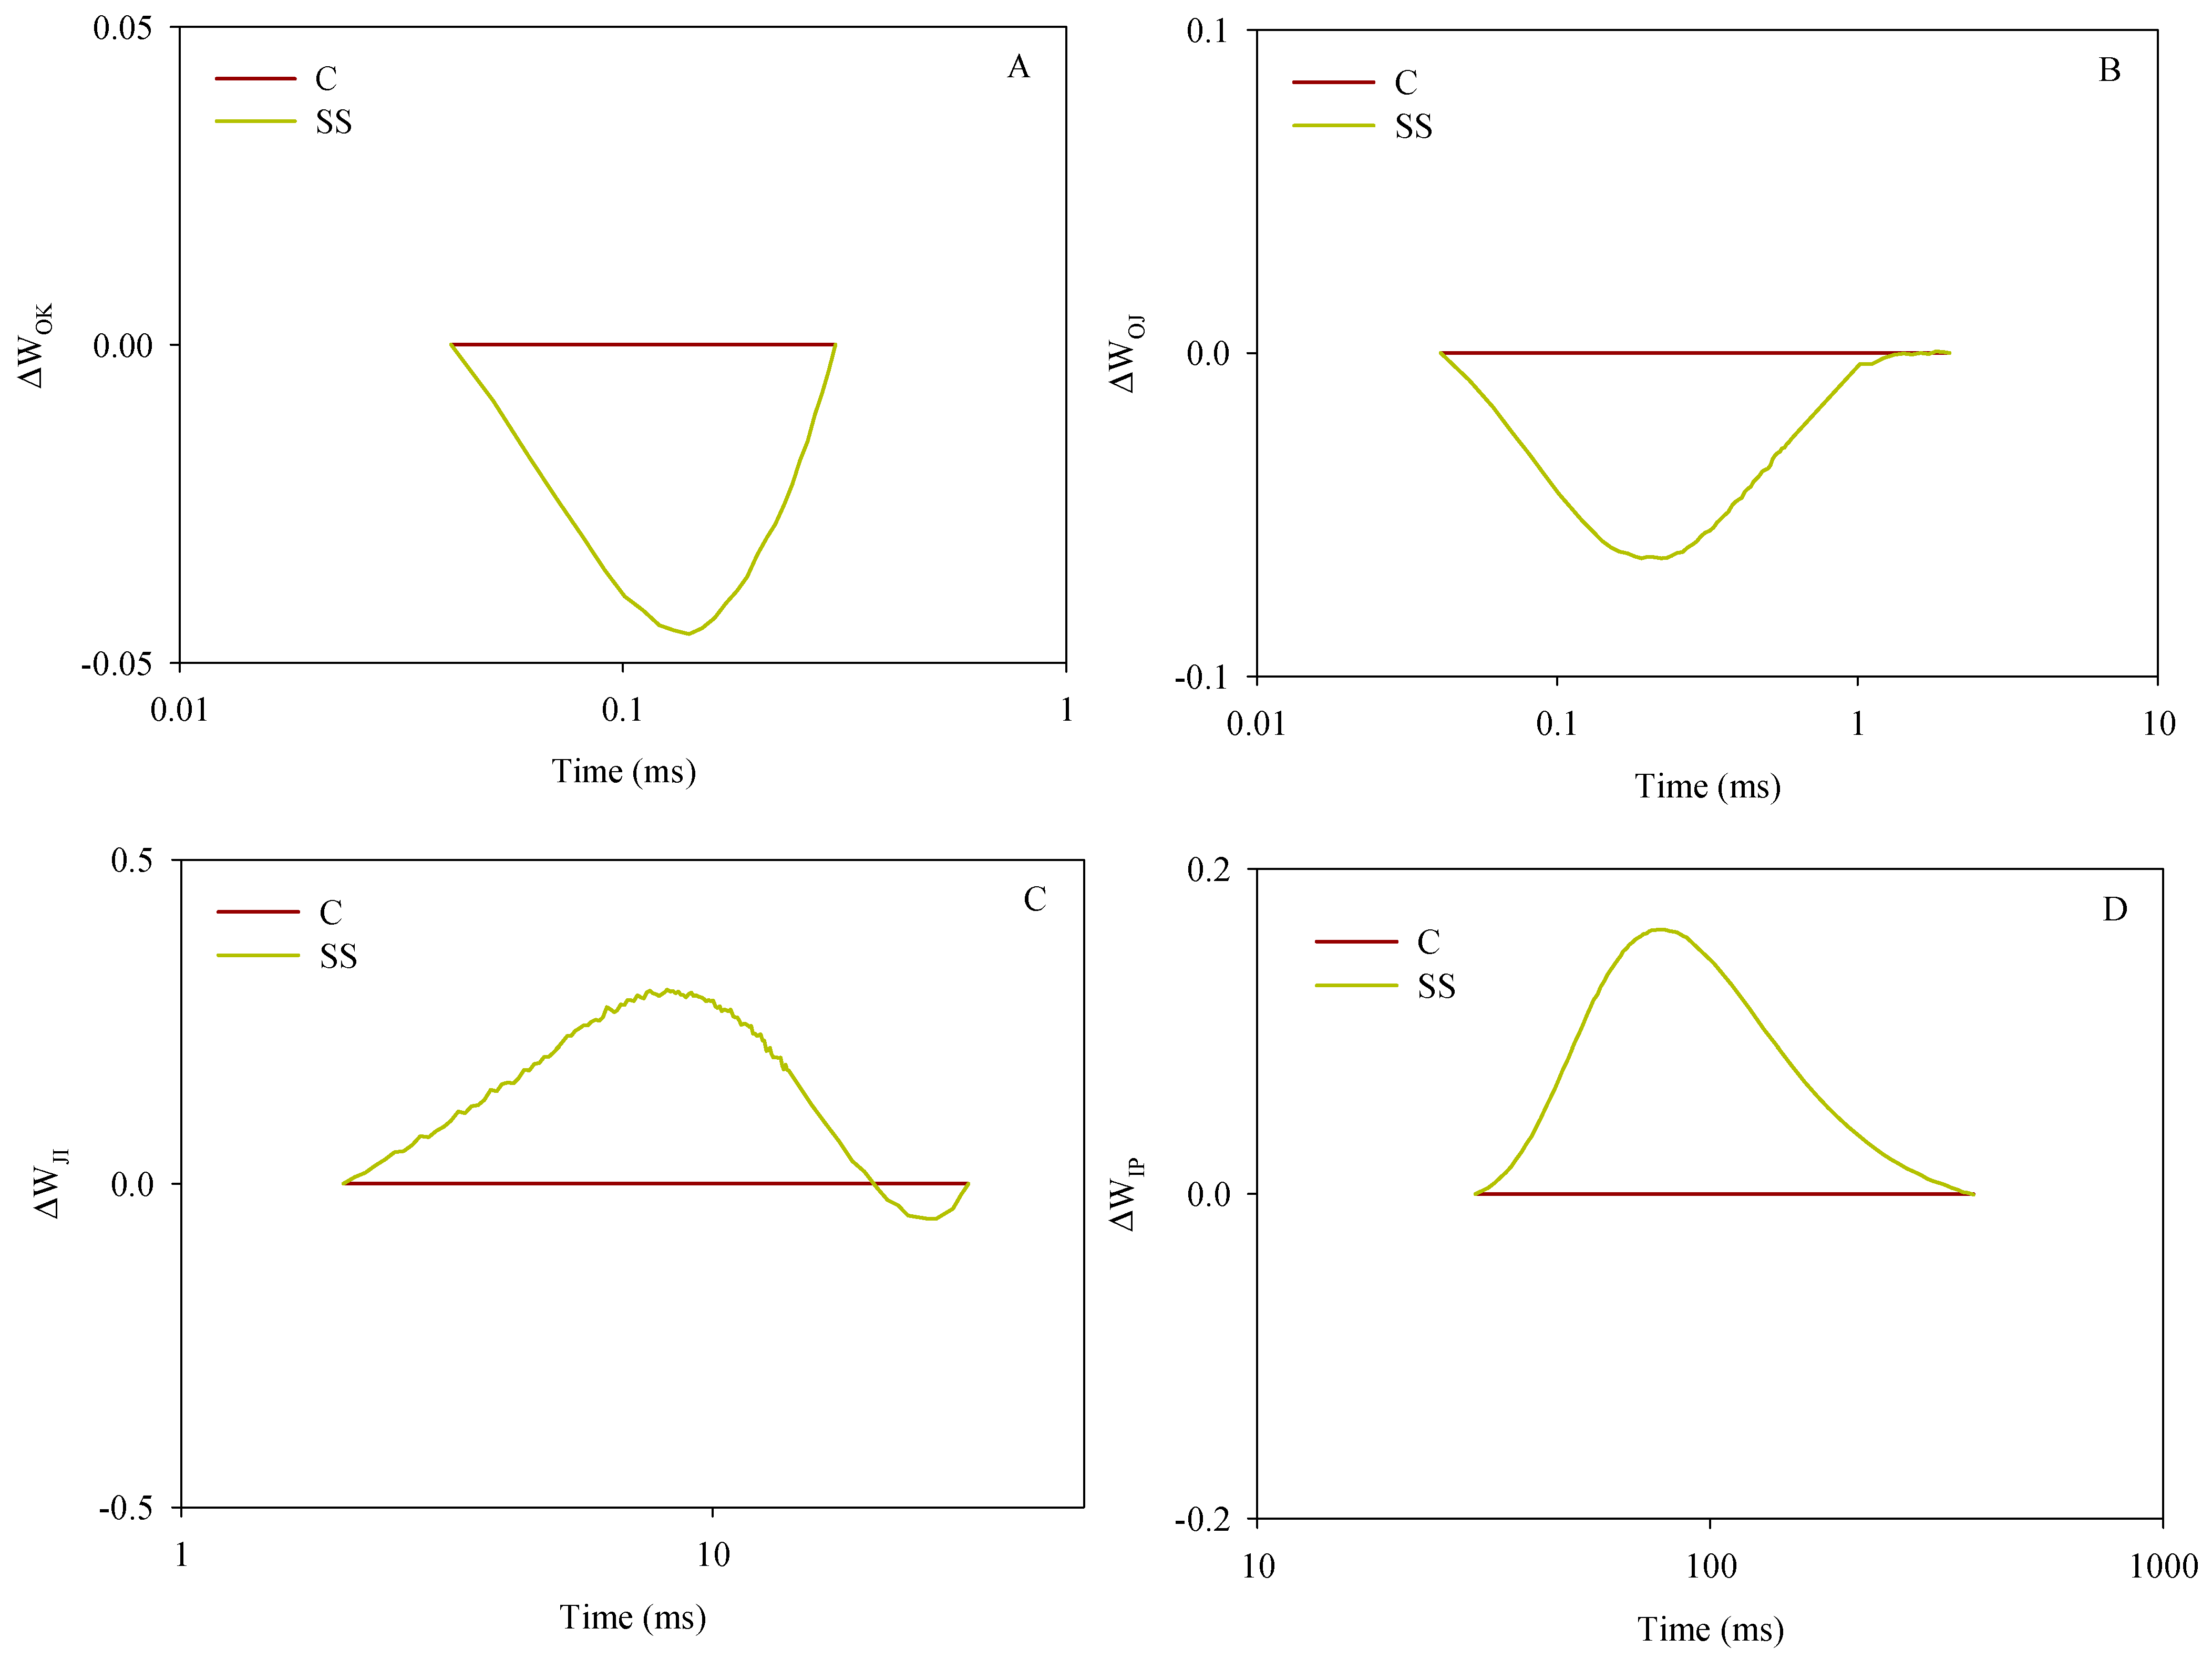
  • Between O (at 40 µs on the fluorescence induction curve) and K (at 300 μs), calculated as WOK = (Ft − F0)/(FK − F0); after normalization, the difference kinetics were calculated as ΔWOK = WOK(SS) − WOK(C), evidencing the L-band;
  • Between O and J (2 ms), calculated as WOJ = (Ft − F0)/(FJ − F0), with the ΔWOJ evidencing the K-band;
  • Between J and I (30 ms), calculated as WJI = (Ft − FJ)/(FI − FJ), with the ΔWJI evidencing the H-band;
  • Between I and P (peak of the induction curve), calculated as WIP = (Ft − FI)/(FP − FI), with the ΔWIP evidencing the G-band.

2.5. Statistical Analysis

Yield components and fruit quality data were subjected to one-way analysis of variance (ANOVA) with the SPSS software package (SPSS version 22, Chicago, IL, USA).
Marketable yield data were analyzed using the repeated measures design approach. Finally, a Student’s t-test was performed on chlorophyll fluorescence data to check for differences between the treatments.

3. Results

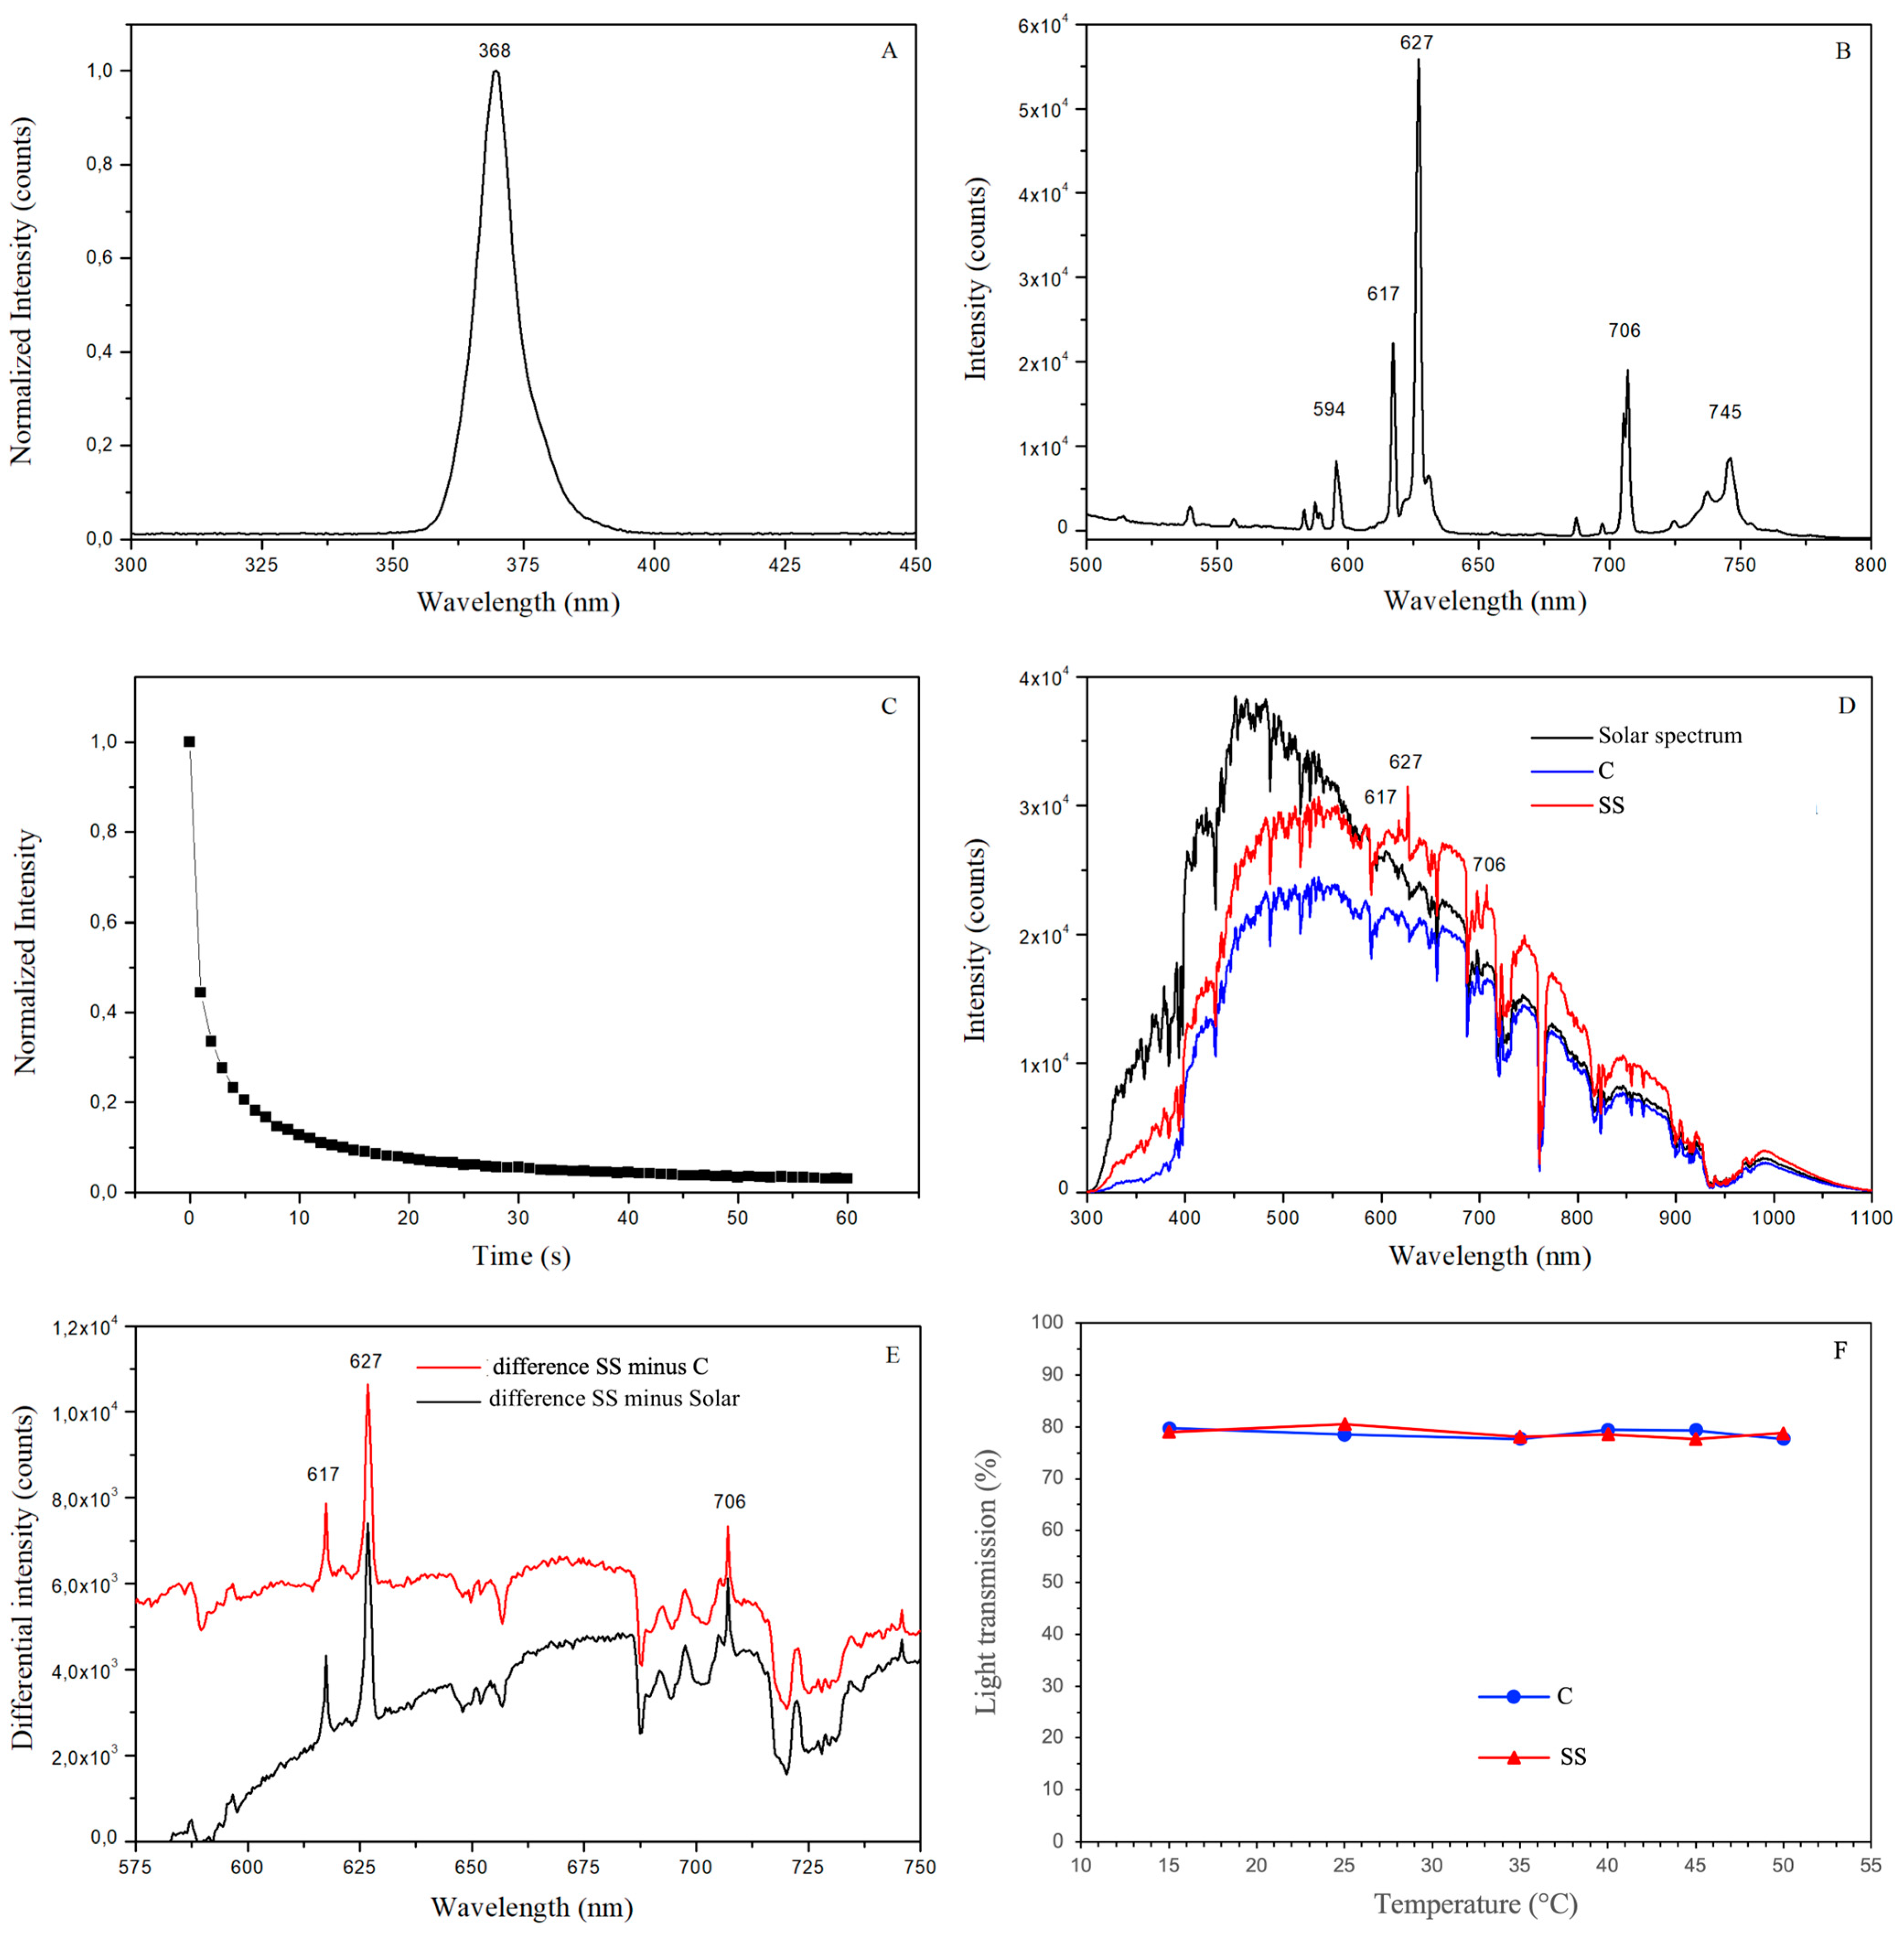
3.1. Optical Properties of the Spectral Shifting Greenhouse Cover

3.1.1. Spectrophotometric Analysis

Optical analysis of the spectral shifting film was performed using the Maya 2000 Pro spectrophotometer (Ocean Insight, Oxford, UK; spectral range 165–1100 nm) connected with an optical fiber with a core of 500 μm. An integration time of 10 ms was set during all measurements. The commercial software OceanView 2.0 (Ocean Insight, Oxford, UK) with which the device was supplied was used for the acquisition of the spectra and to manage the basic parameters.
Laboratory measurements: To characterize the optical properties of the spectral shifting greenhouse cover, a UV-A diode lamp with an emission peak at 368 nm (Figure 2A) was used as the excitation source in photoluminescence measurements. This induced a photoluminescence emission from the REE-doped PE film in the visible range of the light spectrum (Figure 2B), thus effectively converting UV-A excitation into visible light with emission peaks in the orange (peaks at 594 and 617 nm) and Red/Far-Red (peaks at 627; 706 and 745 nm) regions of the spectrum. Photoluminescence spectra were recorded at 1 Hz frame rate after UV excitation. When the UV-A source was switched off, the photoluminescence emission at 627 nm (main R peak in the visible range) rapidly faded within tens of seconds following a phosphorescence time course shown in Figure 2C.
Field measurements: Figure 2D shows the comparison among the open-air sunlight spectrum, the spectrum recorded under the control greenhouse, and the spectrum recorded under the spectral shifting greenhouse, recorded on 23 November between 13:45 and 14:15 h. The photoluminescence induced by the sunlight UV radiation resulted in three main peaks (at 617; 627, and 706 nm) and an overall enrichment in the Orange–Red region of the PAR range.
The spectral shifting effect of the REE-doped film is evidenced by calculating the difference spectra shown in Figure 2E. The black line in Figure 2E is the difference spectrum (spectral shifting minus solar), where the area between the difference spectrum and the x-axis qualitatively represents the enrichment in the Red region of the spectrum inside of the spectral shifting greenhouse compared with the external solar radiation. Similarly, the red line in Figure 2E is the difference spectrum (spectral shifting minus control film) showing that the REE incorporated into the spectral shifting PE film enriched the transmitted light in the whole Orange-Red region from 575 to 715 nm compared to the control greenhouse.

3.1.2. Light Transmission at Variable Incident Radiation Intensity

Light transmission through both control and spectral shifting films was measured at variable incident light intensities, using a Schott KL 2500 LCD (Schott AG, Mainz, Germany) as a cold halogen light source. A highly significant linear regression (R2 > 0.99) was recorded between incident and transmitted light intensities with no significant difference between control (y = 0.7911x − 0.2365; R2 = 0.999) and spectral shifting (y = 0.7895x − 4.1749; R2 = 0.9999) film at any incident light intensity.
No significant difference was recorded in light transmission through both films: on average, the transparency factor, expressed as percentage of the incident light intensity up to a PPFD of 2250 µmol m−2 s−1, was 78.7%.

3.1.3. Light Transmission at Variable Temperatures of the Greenhouse Cover Film

To test the effect of temperature on light transmission, sample sections of the spectral shifting film were heated in an oven up to 50 °C. Afterward, light transmission was measured using a Schott KL 2500 LCD (see above) as a cold halogen light source while constantly monitoring the film temperature with a thermocouple thermometer. The transparency of the greenhouse cover material was not affected by its temperature as percentage light transmission remained constant at 78.7% of incident light intensity and it did not change with temperature, within the 15–50 °C temperature range (Figure 2F).

3.2. Aubergine (Spring–Summer Crop)

3.2.1. Production and Quality

The aubergine marketable yield over the productive season is shown in Figure 3. Compared with the control, a 19% higher marketable yield was recorded inside the SS greenhouse in the first five harvests (statistically significant differences in harvests I to IV) and the largest yield difference between SS and C treatments was recorded at the first harvest (+43%). No statistically significant differences between treatments were recorded in the latest phase of the productive season (harvests VI to VII) although the yield was lower under the SS greenhouse.
Overall, the cumulative marketable yield (sum of all harvests) was 11% higher (statistically significant) under the SS greenhouse, due to higher production in the early phase of the productive season, from harvest I to harvest IV (Table 2). The total number of marketable fruits (+12%) and fruit firmness (+14%) were also significantly higher under the SS greenhouse. Contrastingly, mean fruit weight or dry matter were not affected by the greenhouse cover.
With regard to the quality parameters of aubergine fruits, only carotenoid content was found to be statistically higher under the SS greenhouse (+11%), while no significant differences were recorded for HAA, LAA, phenols, or ascorbic acid content (Table 3).
The CIELAB color parameters measured on aubergine fruits show that only the a* parameter was significantly higher under the SS greenhouse, while for the brightness (L*) and the yellowness (b*) components, no differences were recorded between the treatments (Table 4).

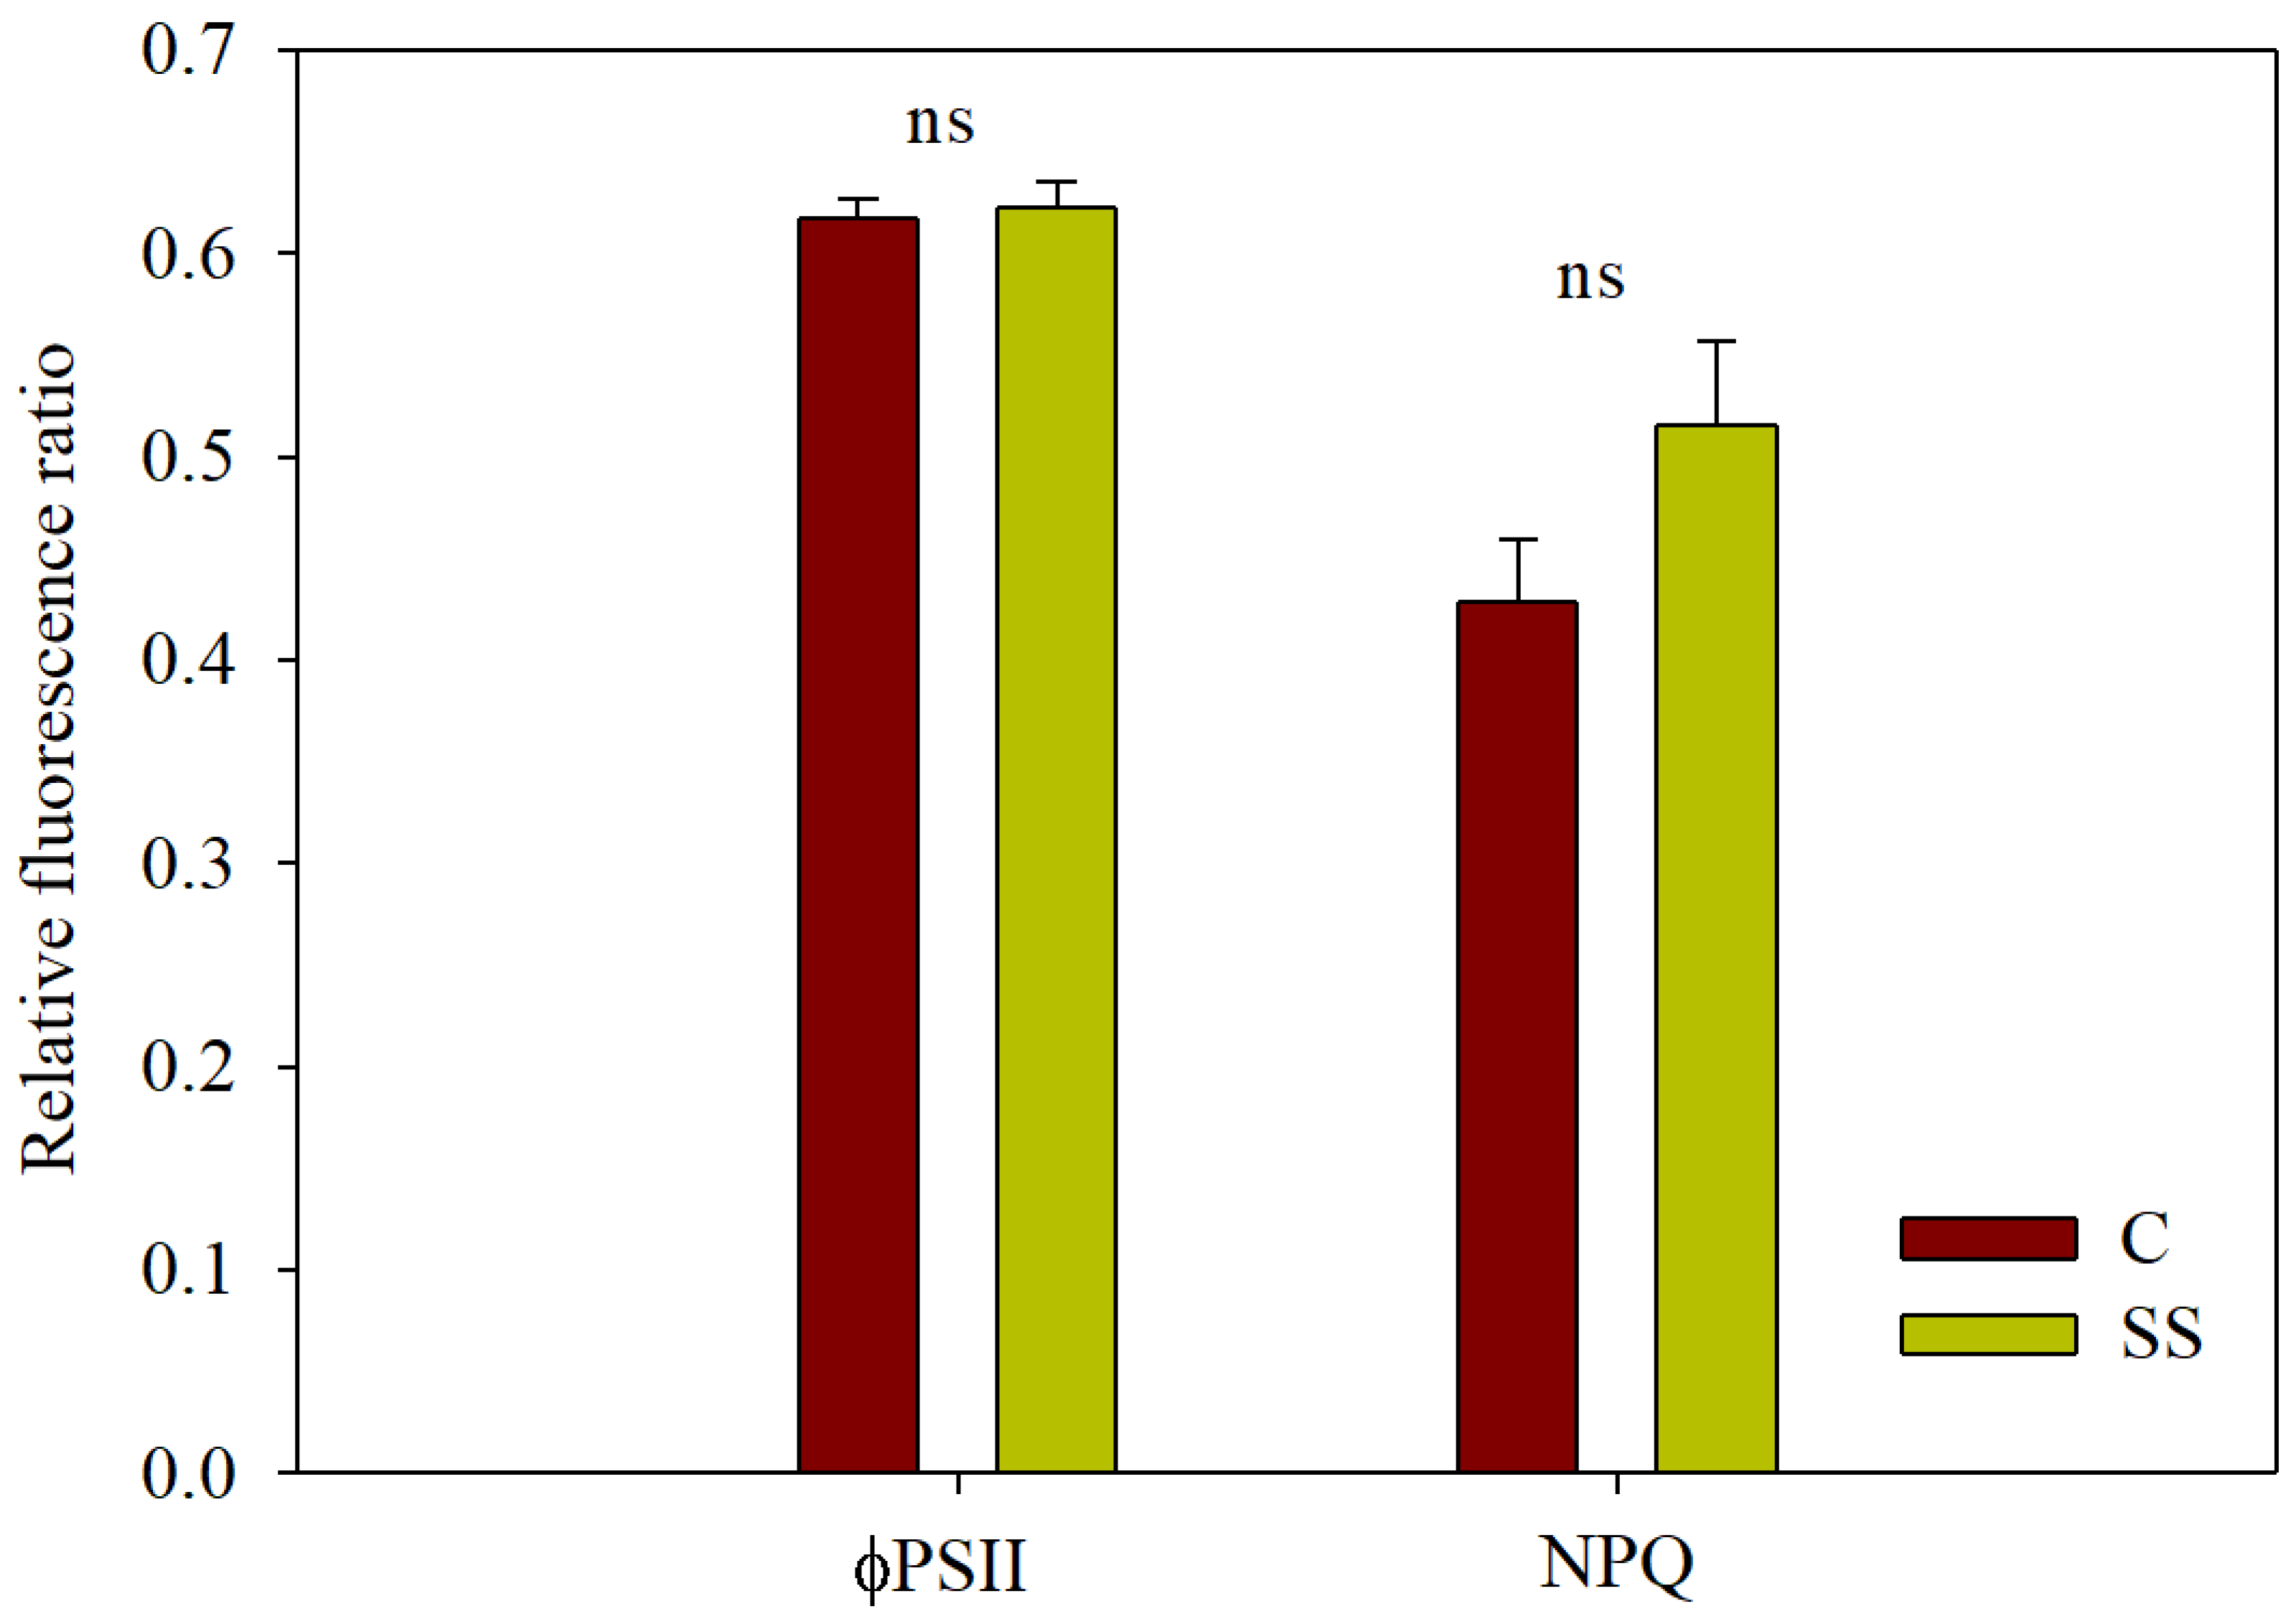
3.2.2. Chl a Fluorescence and JIP-Test Parameters

Chlorophyll a fluorescence measurements on aubergine plants were taken on 21 June, just prior to harvest II, when plants were fully developed with no signs of leaf senescence.
Measurements were performed at the peak daylight time (13:00 h, local summer time) when the PPFD values were external sunlight 2013 µmol m−2 s−1; C greenhouse 1377 µmol m−2 s−1; and SS greenhouse 1428 µmol m−2 s−1. Chl a fluorescence was recorded non-destructively in vivo on intact leaves as described in Section 2.
Neither ΦPSII nor NPQ was significantly affected by the greenhouse cover (Figure 4). The average ΦPSII value was 0.62, confirming that crops were in optimum hydration and nutrition status. NPQ ranged between 0.43 and 0.52 for C and SS, respectively, and it did not significantly differ between the treatments.
Following 30 min of dark adaptation, Chl a fluorescence measurements were repeated on the same leaves in their dark-adapted state and fast Chl a fluorescence transients were recorded. The fluorescence transients are shown in Figure 5 while the fluorescence parameters resulting from the JIP-test analysis are shown in Table 5. The OJIP transients in aubergines were similar in shape in C and in SS plants. Both OJIP transients showed a dip before the P (peak) point, at about 30 µs, indicating effective plastoquinone pool reduction and fast reoxidation of the QA electron acceptor.
The O point of the OJIP kinetics measured by the F0 parameter was significantly lower in SS plants (F0 = 12,198) compared to the control (F0 = 13,677). Therefore, both FM/F0 and Fv/F0, expressing PSII photochemical efficiency, were accordingly higher in SS plants compared with the control. Contrastingly, the Fv/FM parameter ranged between 0.64 and 0.67 for the C and the SS crop, respectively, with no significant difference between the treatments.
The Sm parameter, or the normalized area between the fluorescence induction curve and F = FM, was significantly lower in SS plants (Sm = 437) than in C plants (Sm = 524).
To further elucidate the differences between treatments in response to light spectrum, the relative fluorescence between the steps O (at 40 µs on the fluorescence induction curve) and K (at 300 μs) was calculated as WOK = (Ft − F0)/(FK − F0). Similarly, the relative fluorescence between O and J (2 ms) was calculated as WOJ = (Ft − F0)/(FJ − F0). The kinetic differences ΔWOK and ΔWOJ make the L- and K-bands visible, respectively. These bands have a peak around 0.15 and 0.3 ms, respectively. The L-band is an indicator of energetic connectivity or grouping between PSII units while the K-band is related to the stability of the oxygen evolving complex (OEC), respectively [43].
Differential analysis of the fluorescence transients (Figure 6) confirmed the differences between the treatments showing negative L-band and K-band for the SS plants compared with the control. Negative L- and K-band are related to improved photochemical efficiency in the initial phase of photochemical reactions in PSII, confirming that the SS environment had a positive effect on the connectivity parameter in PSII or OEC functionality. However, positive and well-distinguished H- and G-bands found in the plants grown under the SS greenhouse indicated a negative effect of the cover on photosynthetic electron flow (for more details, see Discussion). Particularly for the H-band, the electron flow to the end acceptors in PSII was reduced, which is typically related to the redox state of the plastoquinone pool. It means slower reduction in the PQ pool in the plant grown under the SS greenhouse cover. The positive G-band is associated with unbalanced electron flow to the end electron acceptors in PSI.

3.3. Strawberry (Autumn–Spring Crop)

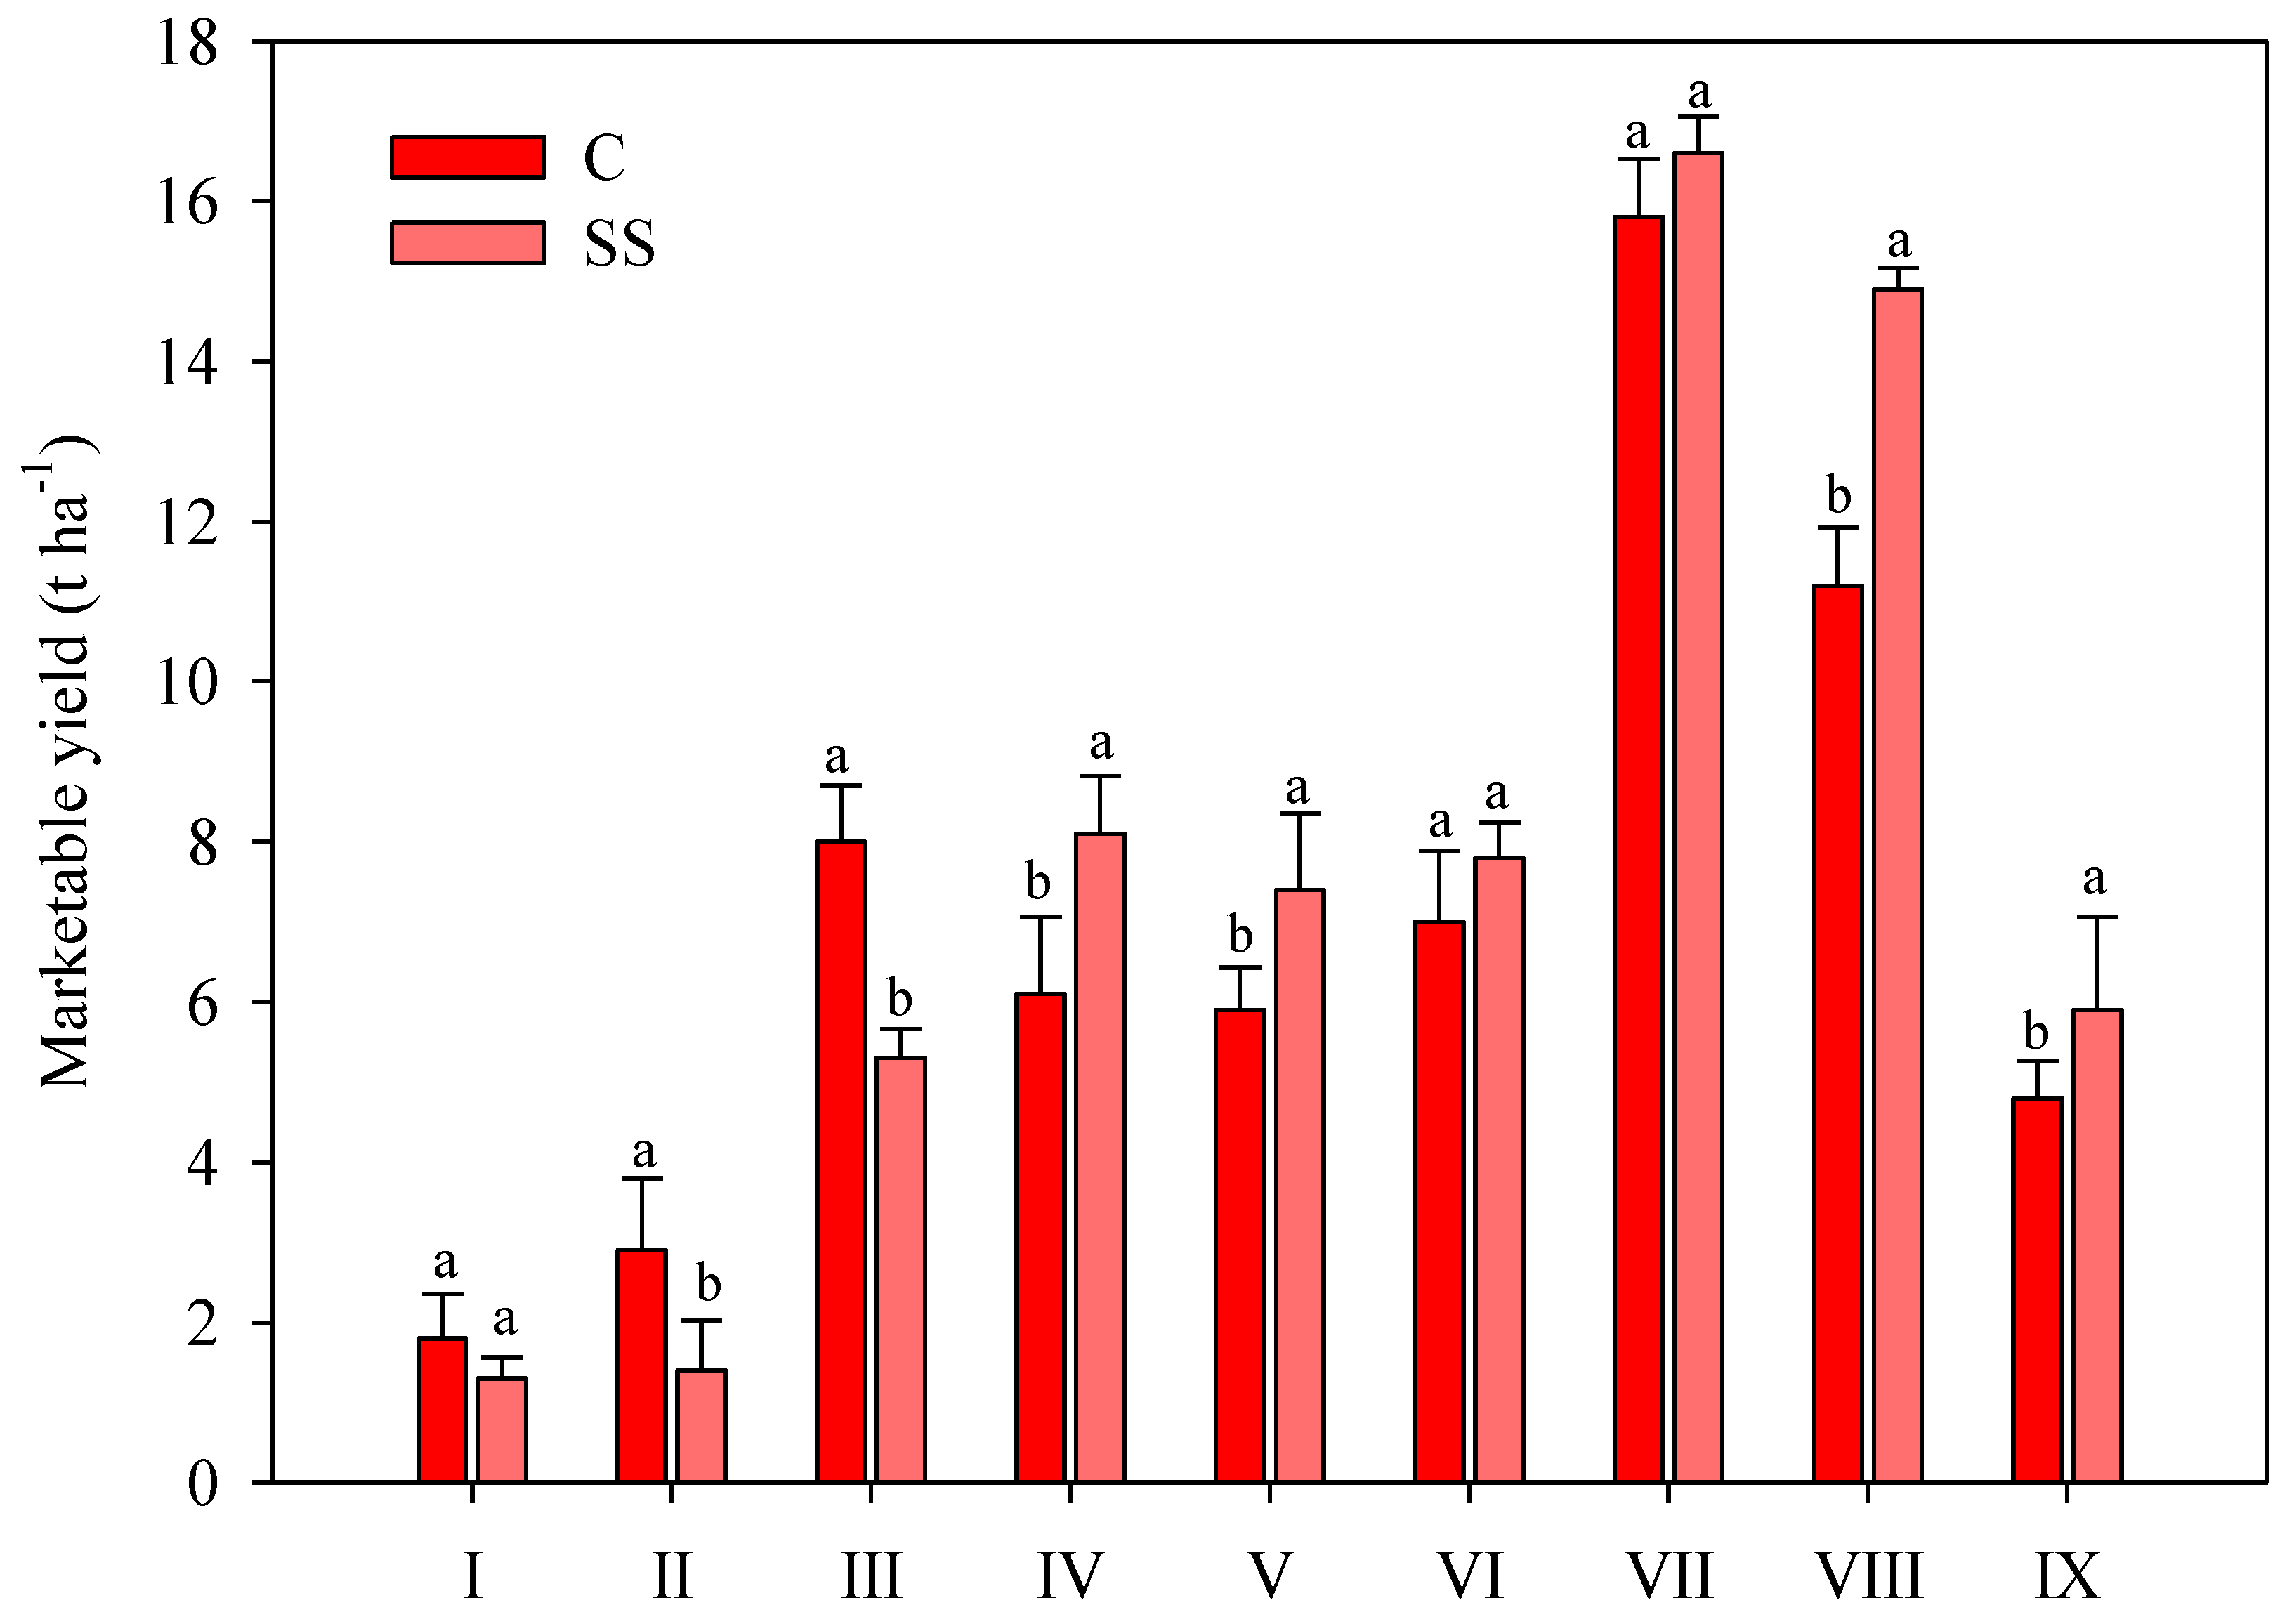
3.3.1. Production and Quality

Strawberry marketable yield was significantly affected by the greenhouse cover, although results differed from those recorded in the case of the aubergine crop. Strawberry production of harvests I to III was higher under the control than under the spectral shifting greenhouse (+65.5% on average) although no statistically significant difference emerged in the case of the first harvest. Contrastingly, this trend was reverted in the middle and late phases of the productive season and the highest yield was produced under the SS greenhouse from harvest IV to the last harvest IX. These differences, however, were not always statistically significant (Figure 7).
Cumulative yield, number of fruits, fruit mean weight, dry matter percentage, and total soluble solids (TSS) of strawberries were not statistically affected by the different light spectra inside of the greenhouses. Fruit firmness was found to be the only quality parameter, which significantly differed between treatments, as it was 7% higher under the spectral shifting greenhouse, compared with the control (Table 6).
Within the set of biochemical qualitative parameters, ascorbic acid (AsA) and carotenoid content were significantly lower in the spectral shifting greenhouse compared with the control, while no significant differences were recorded for HAA, LAA, or phenol content (Table 7).
Among the CIELAB color parameters of strawberry fruits, only the L* (brightness) was statistically higher under the SS greenhouse, while yellowness (b*) and redness (a*) components were not affected (Table 8).

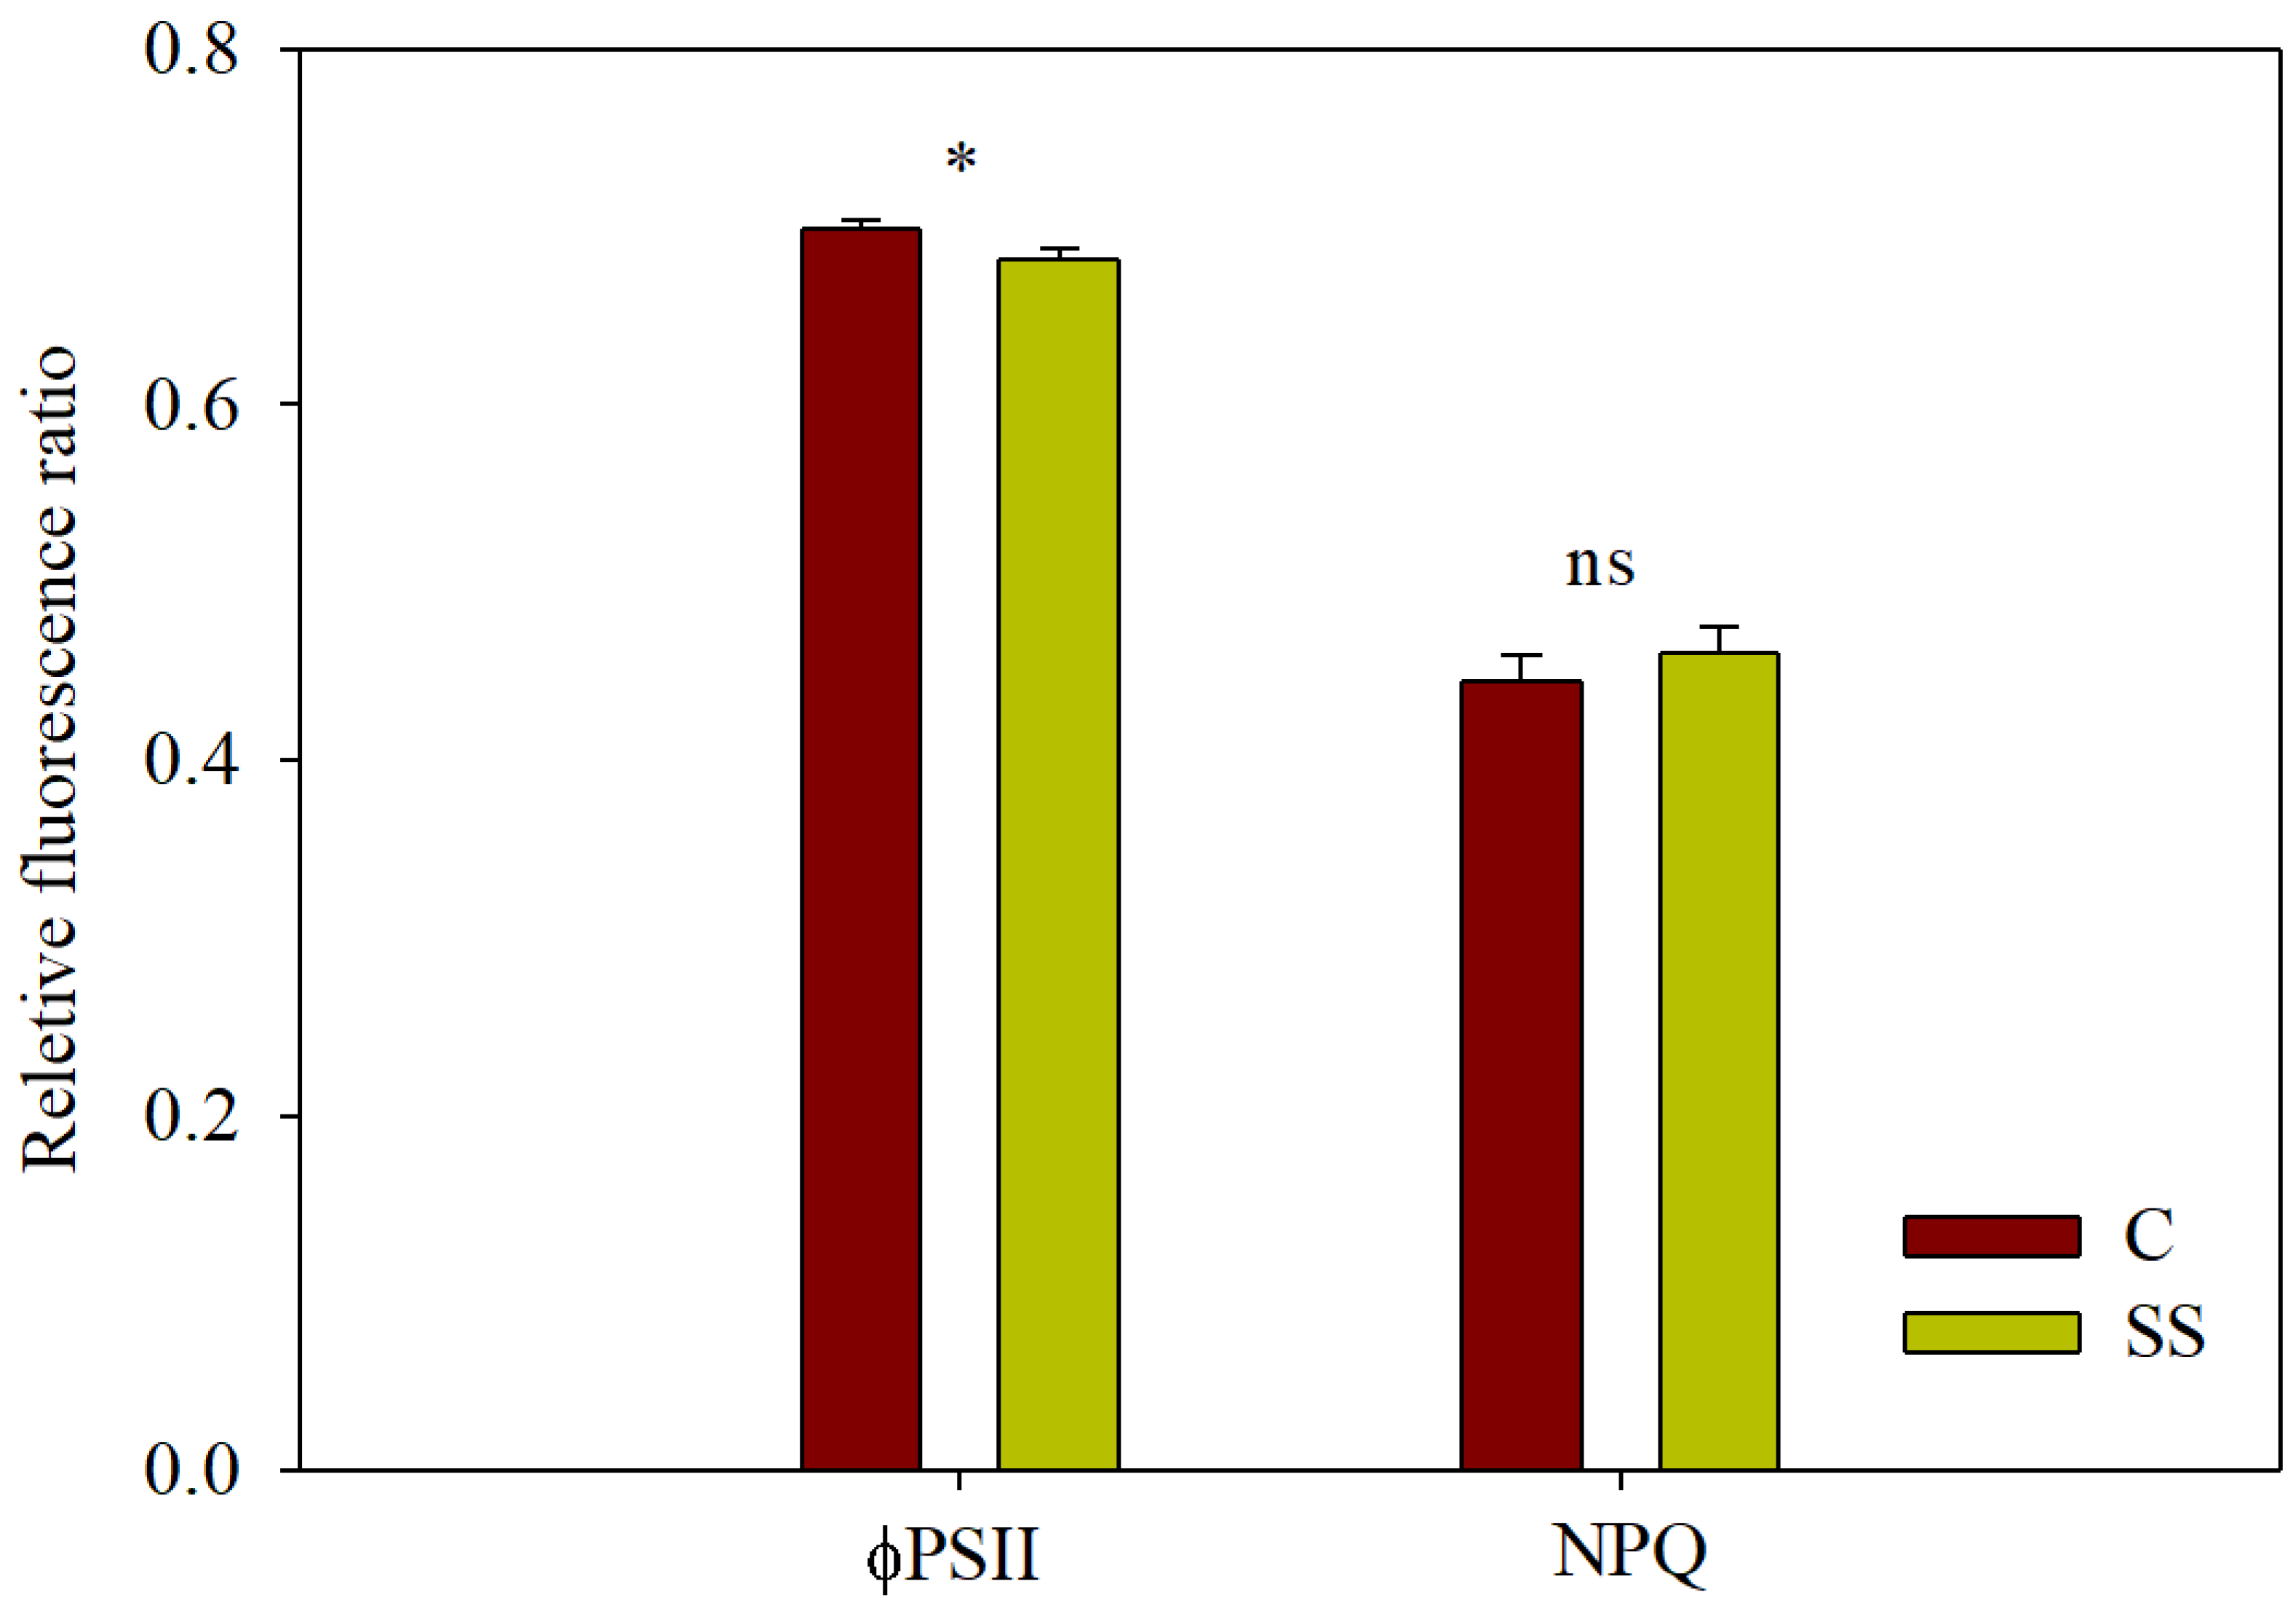
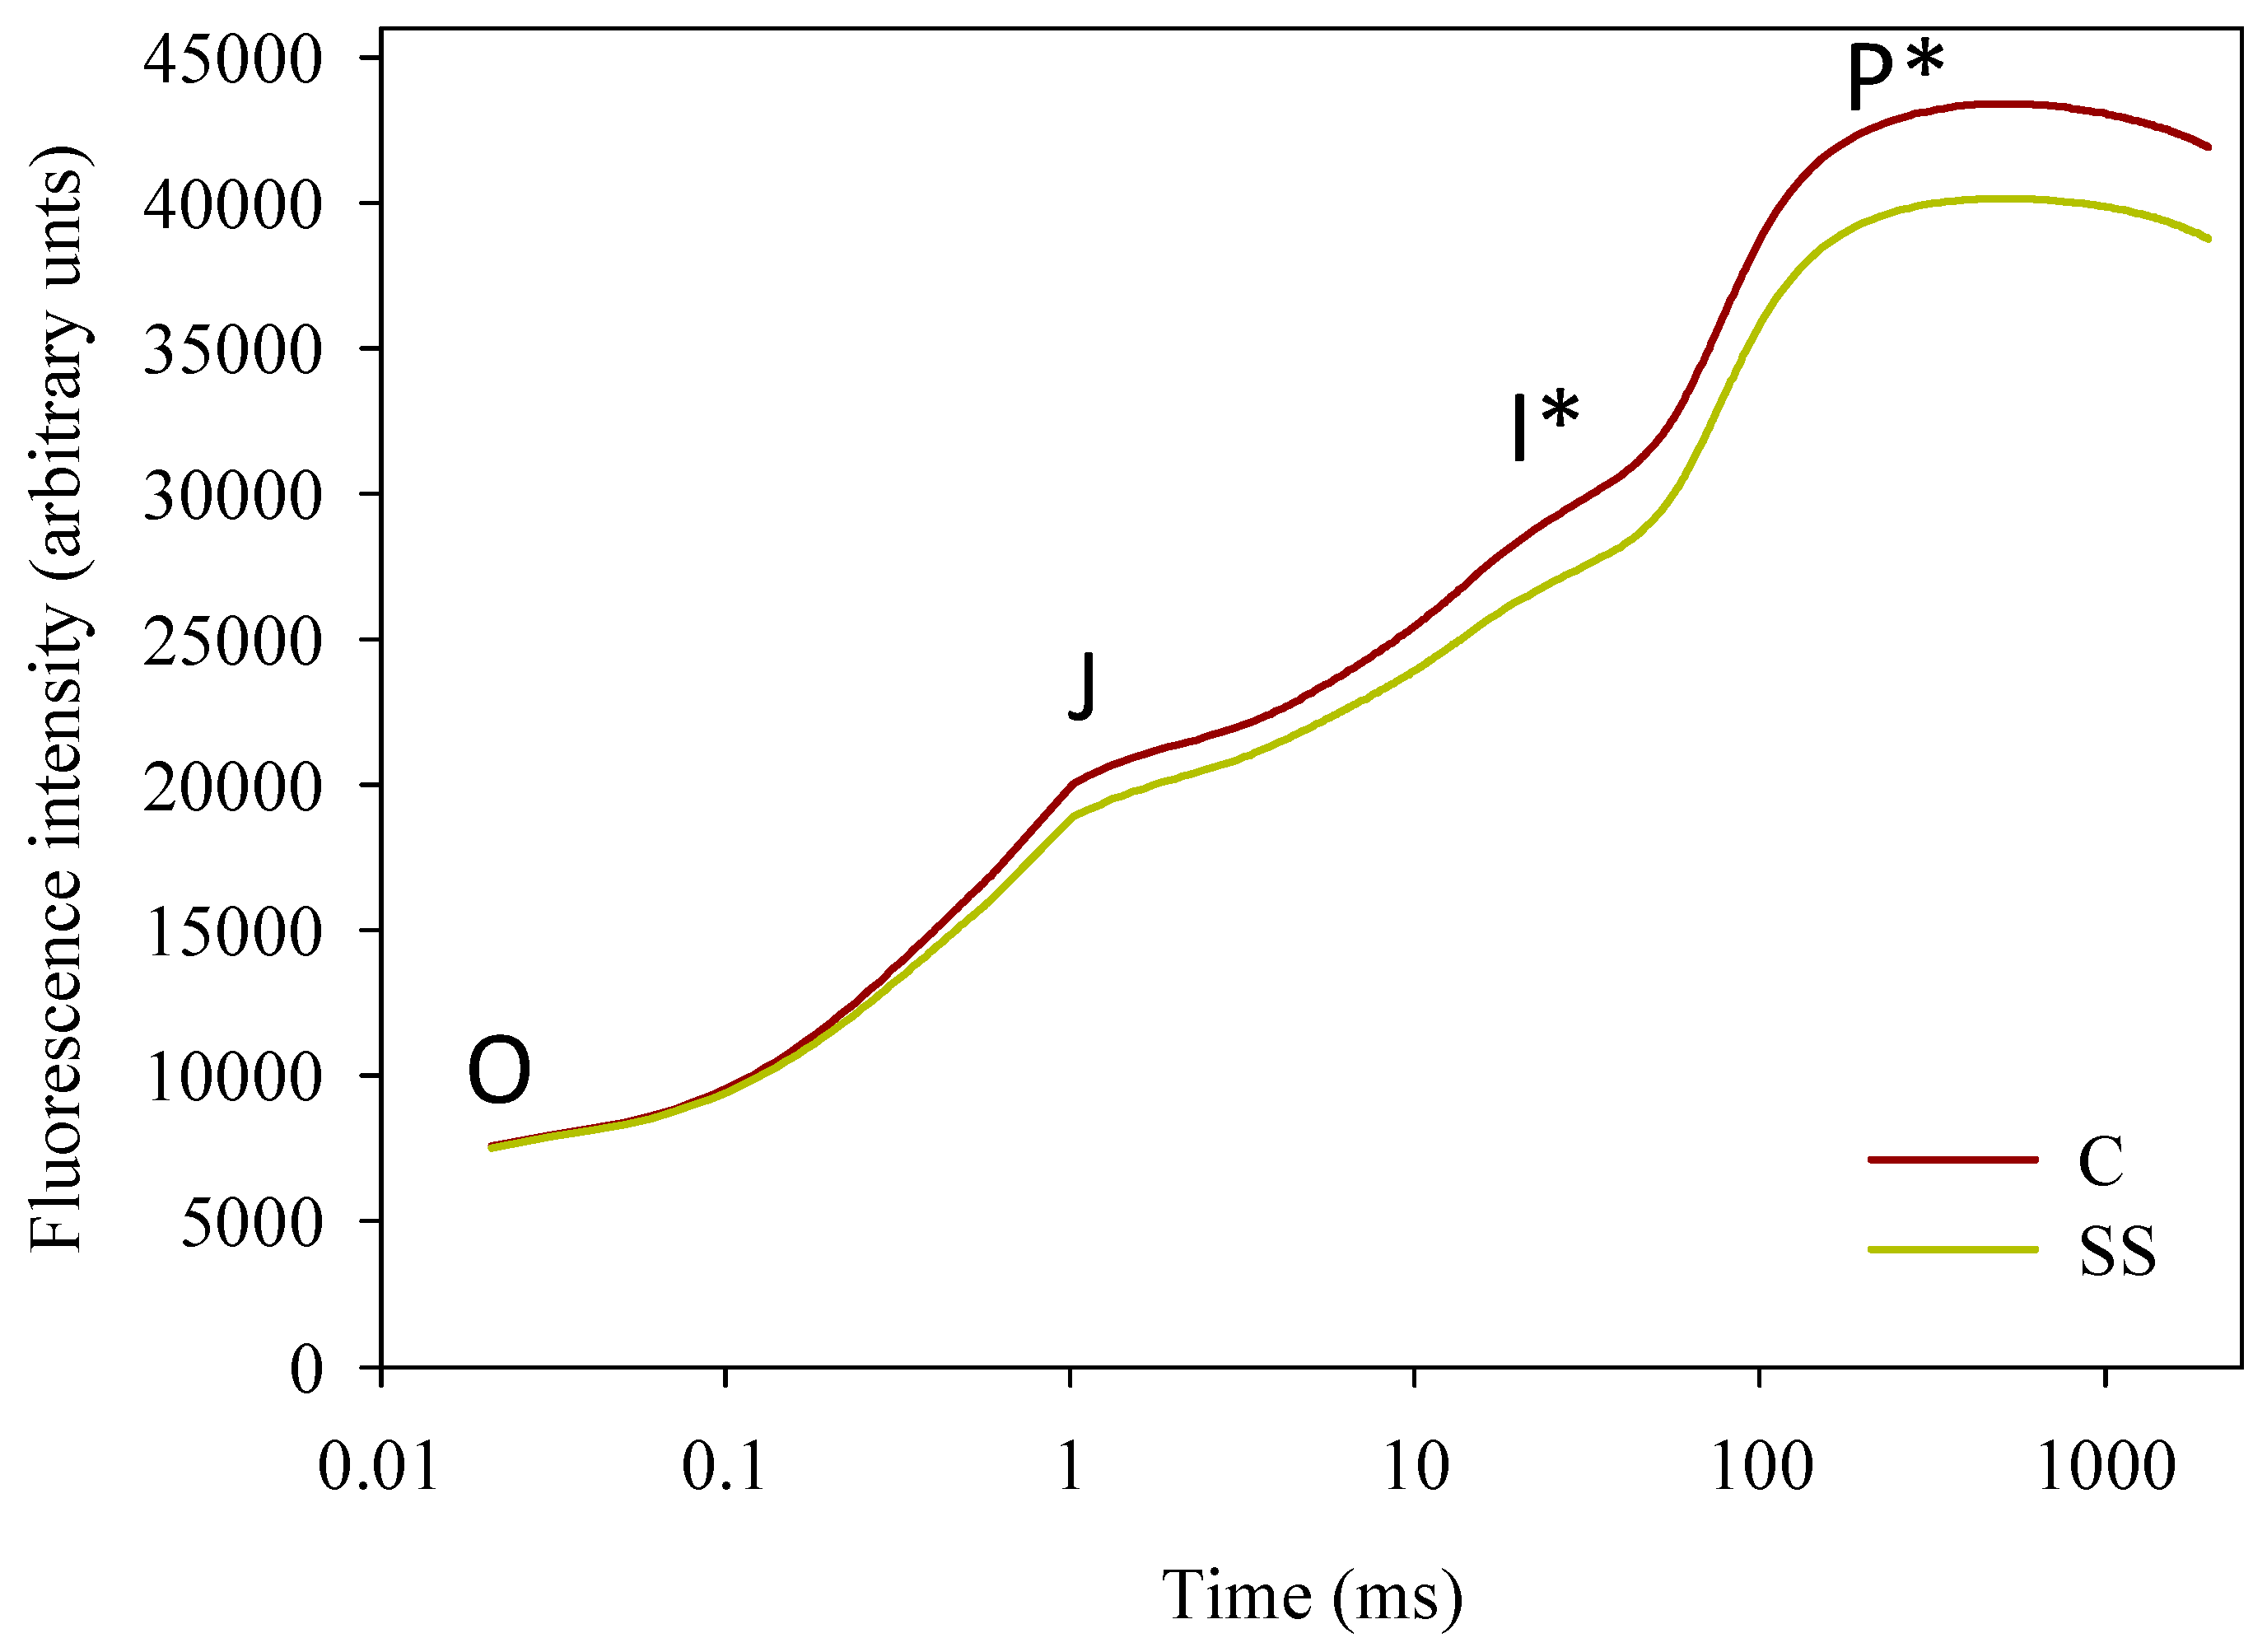
3.3.2. Chl a Fluorescence and JIP-Test Parameters

Chlorophyll a fluorescence measurements on strawberry plants were performed on 14 February, prior to harvest I, when plants were fully developed at the early fruiting phase. Measurements were taken at the peak daylight time (12:00 h, local time) when the PPFD values were external 1321 µmol m−2 s−1; control greenhouse 667 µmol m−2 s−1; and spectral shifting greenhouse 692 µmol m−2 s−1. A small but significant difference was recorded in ΦPSII, which was marginally higher in C plants (ΦPSII = 0.70) than in SS plants (ΦPSII = 0.68), while the NPQ did not differ between treatments, ranging from 0.44 to 0.46 in C and SS plants, respectively (Figure 8).
The JIP-test analysis of the dark-adapted fluorescence transients (Figure 9) is reported in Table 9. Control plants had the highest photochemical quantum efficiency compared with SS plants, in terms of either Fv/FM or the more sensitive FM/F0 or Fv/F0 ratios. These in turn resulted from the FI, FM, and Fv values, which were higher in C than in SS treatment. In the control plants, we also recorded a larger Area parameter, which is related to the efficiency of photosynthetic electron transport chain, although the Sm, or the normalized Area parameter, did not differ between treatments. The quantum yield for energy dissipation (ΦDo) was also smaller in C (ΦDo = 0.19) than in SS (ΦDo = 0.20) plants.
Differential analysis of the fluorescence transients is shown in Figure 10. The positive L-band, H-band, and J-step indicate a lower photochemical performance of SS plants compared to the control. However, the trend of the K-band resulting from the difference of O-J normalized kinetics remained more complex to discuss.

4. Discussion

4.1. Cover Film Properties

The specially designed spectral shifting PE film used in this trial allowed for a high light transmissivity (79%) matching the commercial diffusive film used as the control. This feature allowed us to overcome the technical constraints of our previous research [26], where the SS and the control covers differed in terms of light transmission, so that PPFD and temperature inside the experimental greenhouses were also affected. Light transmissivity of the PE films used in this research was independent of the incident solar light PPFD, and it did not change with temperature. This guaranteed that the experimental conditions remained unchanged throughout the year-long period, thus allowing us to study the effect of light spectrum modulation as the main experimental factor.

4.2. Aubergine (Spring–Summer Crop)

The SS greenhouse cover positively affected the total yield of aubergine grown in the spring–summer cycle compared with the control. A substantial increase was recorded in the first half of the harvest season while the positive effect gradually decreased later. Conversely, the greenhouse covers did not induce significant differences either in ΦPSII or in NPQ. These parameters describe the overall efficiency of the photochemical phase of photosynthesis: ΦPSII in the light adapted state is a proxy of the overall working photosynthetic efficiency and it is directly related to net photosynthesis (CO2 fixation) [38], while NPQ is a measure of absorbed light energy dissipation, to protect the photosynthetic machinery from excess light energy [44]. ΦPSII and NPQ are related, and they follow a light-driven fluctuation during the daily light/dark cycle, with ΦPSII reaching a minimum and NPQ reaching a maximum value around midday, at the peak of the light period [25,45,46,47]. At this time of the day, the most pronounced effect of environmental stress factors on the photochemical metabolism could be observed [25]. Therefore, in the case of the aubergine crop, the lack of significant differences in ΦPSII or NPQ between the treatments suggests that the greenhouse covers did not induce major environmental stress conditions or differences between C and SS plants in terms of photochemistry of photosynthesis. Similarly, the Fv/FM ratio measured on dark-adapted leaves did not differ between treatments. This suggests that the SS cover did not substantially affect the functioning of photosystem II. The Fv/FM ratio is known to be a rather robust parameter that is not equally sensitive to different stressors affecting plant growth [48]. Similarly, most of the JIP-test parameters did not differ between treatments, confirming the hypothesis that the spectral-shifted light environment did not cause dramatic changes in the plant photosynthetic metabolism.
However, some additional information about photochemistry could be deduced from the lower basal fluorescence (F0) recorded in SS plants. Reportedly, higher F0 values may be associated with photoinactivation, oxidative damage, and loss of PSII reaction centers [27], while the lower F0 Chl a fluorescence recorded in SS plants indicates higher quenching of absorbed light energy. Since the quenching happens in LHCII, this may be associated with effective aggregation of chlorophyll molecules within the LHCII complex and carotenoid-chlorophyll coupling [49].
Higher quenching in LHCIIs due to carotenoids might be supported by a recent study of Kowalczyk et al. [50] who, using OJIP analysis, showed that light spectral properties affected carotenoid and PSII chlorophyll fluorescence signals in cucumbers. However, interaction with the other three minor light-harvesting complexes (CP29, CP26, CP24) located between LHCII and the PSII core complex should be considered as well, although their contribution to F0 quenching is still not known and it represents a matter of recent research in model plants [51]. Overall, lower F0 values in SS plants show a lower emission of Chl a fluorescence from LHCs descending from an increased efficiency of the absorbed energy flow from LHCs to the core of PSII, thus suggesting a protective effect of SS on the functioning of LHCII. This interpretation is supported by higher FM/F0 and Fv/F0 ratios measured in SS plants, which express the “theoretical” maximum photochemical efficiency of PSII on a more sensitive scale than the widely used Fv/FM ratio and are reported to be related with the efficiency of the water-splitting complex on the donor side of PSII [52,53]. These findings are consistent with a previous study showing that FM/F0 and Fv/F0 ratios increased in basil plants grown under a R-enriched light spectrum [54]. These results suggest that R wavelengths improved the photochemical efficiency and protected the water-splitting complex in aubergine plants grown under the SS greenhouse, compared with the control. Contrasting results, however, have also been previously reported [55].
The parameter Sm or the normalized area between the OJIP fluorescence curve and F = FM provides a measure of the excitation energy needed to close all PSII Reaction Centers [30]. Hence, Sm also gives a measure of the amount of all electron acceptors that are reduced until all RCs are closed and, concomitantly, of the total electron transport activity [29]. The Sm was smaller in SS than in C plants, suggesting that the total amount of QA was smaller under the spectral shifting greenhouse.
The presence of a dip (referred to as D point) between J and I points on OJIPs of both control and SS plants is associated with an effective plastoquinone pool. At D point, the rate of electron flow from QA to PQ is higher than the rate of light-driven reduction in QA and in QB in the J-I phase [56]. The appearance of D point depends on the turnover of PQ pool and the rate constant of the Q cycle drive trans-thylakoid proton pump [57].
Other JIP-test parameters were unaffected by the experimental factors, indicating that the subtle light spectrum shift under the SS cover triggered a yield increase without substantially affecting plant growth and physiology. Similarly, the qualitative traits of aubergines were unaffected by spectral shifting, except for carotenoid content and the a* colour parameter, which were higher under the SS greenhouse.
To further elucidate the differences between treatments in response to light spectrum, we separately analyzed different sections of the polyphasic OJIP kinetics. This approach allowed us to gain more detailed information about photochemical reactions, which may otherwise be missed by looking at the entire OJIP curve. Analysis of the difference kinetics [30,40,41] evidenced the L-, K-, H-, and G-bands. The L-band is an indicator of energetic connectivity or grouping between PSII units.
In the case of aubergine plants grown under the SS greenhouse, negative L-band values are interpreted as higher energetic connectivity or improved use of the excitation energy and increased stability of the system [29,43,58], compared with the control. Negative K-band values indicate an improved activity of the OEC and/or a reduced PSII antenna size [59]. However, differences in the OEC functionality should also affect the P step of the OJIP kinetics [30]: since C and SS plants did not significantly differ in the FM values, these data suggest that plants grown under the SS greenhouse had a smaller functional antenna size. Similar effects of light modulation on the K-band were reported by Zhu et al. [60]. The J-I phase of the OJIP fluorescence transients reflects the reduction in the electron carriers between the two photosystems, PSII and PSI [29,61], and it is related to the size of the plastoquinone (PQ) pool carrying electrons between PSII and PSI. The H-band emerging from the difference between J-I normalized kinetics in C and SS plants is related to the reduction and oxidation of the PQ pool and it is used to describe multiple-turnover events [52]. When the PQ pool capacity decreases, the rate of reduction is higher, and this results in positive values of the transient H-band. In this study, the positive values of the transient H-band indicated that spectral shifting induced a decrease in the PQ pool in aubergine plants compared with the control. The G-band emerges from the difference between I-P normalized kinetics in C and SS plants and it reflects PSI activity and re-oxidation of the PQ pool from the PSI electron carriers [29,62]. The positive G-band typically indicates a decrease in the PSII acceptors pool in SS compared with C plants. The decrease is accompanied by a reduced electron transport rate and a subsequent decrease in the reduction rate of PSI [63]. This agrees with the reduction in parameter Sm in SS plants.
Overall, we found that spectral shifting finely affected the photosynthetic metabolism of aubergine plants, improving some phases of the early photochemical reactions (L- and K-bands, above) or depressing others (H- and G-bands). Questions remain about the translation of photochemical events into the overall photosynthetic efficiency or even crop productivity. As a matter of fact, ΦPSII (the effective quantum yield of PSII photochemistry), which is directly related to net photosynthesis (CO2 fixation) [38], did not differ between treatments, while crop yield was significantly higher under the SS greenhouse.
To date, many studies have shown positive effects of spectral-shifting on yield in a variety of crops such as tomato, strawberry, radish, Welsh onion, and lettuce [21,64,65,66], although contrasting data were published, e.g., by Kang et al. [67], who found that a spectrum conversion film increasing the PPFD in the R range improved the photosynthetic efficiency and yield of Chinese cabbage but not of lettuce.
Even though spectral-shifting films have been developed to improve photosynthetic efficiency and yield, the effects of the modified light environment on photosynthetic traits and the translation of photochemical events into higher productivity of crops are still unclear. For instance, it was recently reported [68] that R-enriched light increased cyclic electron flow around PSI in Arabidopsis, thus promoting CO2 fixation. This effect was further confirmed by Yoon et al. [69], who analyzed the OJIP transients in sweet pepper and found that the green-to-red shifted spectrum promoted electron transfer around PSI, with a corresponding improvement in photosynthetic performance and plant growth. Fruit yield, however, was unaffected. Conversely, in our study, we recorded higher yield under the SS greenhouse but no effect on the same OJIP parameters. Considering these conflicting responses, it appears that no general indication could be deduced, and more research is needed to better understand the physiological effects of spectral modulation on plant metabolism and productivity.

4.3. Strawberry (Autumn–Spring Crop)

Due to its widespread cultivation and high economic relevance, many factors of strawberry production have already been investigated [70], including the effect of supplemental monochromatic or combined LED lighting [71,72] or studies comparing the effects of light spectrum among multiple strawberry cultivars [73]. Nonetheless, most of the cited studies have been carried out in research facilities on hydroponically fed potted plants or even on detached fruits, while not much information is available on light supplementation carried out in “real” field conditions as pointed out by Lauria et al. [74].
In this study, we found that spectral shifting did not affect total strawberry yield, thus ruling out the possible occurrence in our study of the so-called “Red light syndrome” reported in plants grown under monochromatic R light [8,75].
While our results agree with Choi et al. [71], reporting no yield difference between control and Red LED supplemented light spectra, and with Kang et al. [76], who reported the effects of a green to red light conversion film, this appears not always to be confirmed by previous studies. Indeed, our results are not in agreement with, e.g., Lauria et al. [77] who reported an improved strawberry yield in a R-supplemented light environment.
In this respect, Roosta et al. [73] recently reported that the effects on plant productivity varied among cultivars, while Guiamba et al. [78] found that yield, number of fruits, and mean weight of the berries as well as a number of biochemical parameters were significantly affected not only by light composition (R:G:B ratio) but also by light intensity (PPFD) and duration of the daily light/dark cycle. Interestingly, in our study, the modified light environment under the spectral shifting greenhouse resulted in an altered yield distribution within the harvest season, which was higher in the late phase of the productive season under the SS greenhouse, compared with the control.
The total soluble solids were not affected by spectral shifting in agreement with a previous study by Jiang et al. [72]. In this respect, Roosta et al. [73] also reported that TSS was unaffected by Red LED supplemented light spectrum in three out of four of the tested strawberry cultivars, while a significant increase in TSS was recorded for one of the cultivars. This finding further supports the idea that the effects of spectrum modulation on plant growth and metabolism are species- and cultivar-specific. The SS treatment elicited an increase in fruit firmness compared with the control, in agreement with Kang et al. [76], although Jiang et al. [72] reported no significant effect on detached fruits.
With regard to other quality parameters, we found no effect of spectral shifting on either hydrophilic or lipophilic antioxidant activities or phenolics content, in agreement with previous reports [71,72], although the latter study was conducted on detached berries.
The lower ascorbate content in strawberries under the SS greenhouse differed from the findings of Jiang et al. [72] who reported a significant increase in ascorbate levels. The latter study, however, was designed to investigate the effects of light spectrum on detached berries so that no direct comparison among experimental results could be performed.
The unavailability of a proper comparison to support or contradict our experimental results should be further highlighted in the case of the carotenoid content, which we found to be lower than the control in fruits produced under the SS greenhouse. Indeed, leaf carotenoid content was previously reported to remain unaffected, to increase, or to decrease compared with control depending on cultivar, light spectral composition, PPFD, and daily light/dark cycle [71,73,78], as already discussed above about crop productivity.
For the color parameters of mature berries, the effect of spectral shifting was mostly in agreement with Jiang et al. [72] who similarly reported an increase in L* (brightness) and no significant variation in a* (redness), while we did not record any significant effect on b* contrarily to the cited study on detached fruits exposed to red light. Contrastingly, previous studies reported that R light increased the content of anthocyanins, the pigments responsible for the development of red color in mature strawberries [73], by up-regulating the expression of genes related to their biosynthesis [79].
At the time of Chl a fluorescence measurements (mid-February, early fruiting phase), ΦPSII was marginally lower in strawberries grown under the SS greenhouse compared with the control, while the NPQ did not significantly differ between treatments. As in the case of the preceding aubergine crop, high ΦPSII (in the range 0.68–0.70) and low NPQ (0.45 mean value) ratios confirmed the good physiological state of the strawberry crops and showed that the SS greenhouse cover did not increase photoinhibition, thus ruling out the adverse effect of red-light supplementation on strawberry growth [8,75]. Also, low values of thermal dissipation found for the strawberry plants (ΦD0 and DI0/RC lower than 1.0) are indicative of the good physiological state of photosynthetic apparatus. Such a low value is generally associated with highly vital individuals as reported for various plants ranging from algae [80] to crops [81] and trees [82].
Interestingly, the highest ΦPSII in control strawberry plants paralleled the highest fruit yield of C crop in the early harvests.
FI, FM, and Fv were higher in the Control than in SS plants, resulting in accordingly higher Fv/FM, Fv/F0 and FM/F0 ratios in the Control than in SS plants. This confirmed that at the time of measurements, both the theoretical maximum efficiency (Fv/FM measured in the DAS) and the effective efficiency of PSII photochemistry (ΦPSII measured in the LAS) were higher in C strawberry plants and this matched the highest fruit production of the control crop in the first part of the harvest season. In this respect, our results agreed with previous studies reporting that higher efficiency of PSII photochemistry supported a higher strawberry yield [45,78].
The parameter Area, resulting from the JIP test, was also statistically higher in C plants. This parameter provides a measure of the excitation energy needed to close all PSII Reaction Centers and it is related to the amount of all electron carriers reduced from time zero until the time when FM is reached (tFM) [30]. Although this was not paralleled by a corresponding difference in the Sm parameter, which is the normalized Area value useful for a proper comparison among different samples, our results suggest that spectral shifting may have negatively affected the Chl a fluorescence parameters related to electron transfer in the photochemical reactions. Additionally, the quantum yield for energy dissipation (ΦD0) was higher in strawberry plants grown under the SS greenhouse. ΦD0 represents the quantum yield for energy dissipation, or the proportion of light energy absorbed by PSII, which is dissipated and does not contribute to photosynthetic carbon fixation. Overall, it appeared that at the beginning of the productive phase (end of February), the photochemical efficiency of strawberry plants grown under the SS greenhouse was lower than in control plants and this matched the lower fruit productivity in this phase of the crop cycle.
The difference kinetics allowed for a semiquantitative comparison of the photochemical metabolism between SS and C plants [30]. In SS strawberry plants, the appearance of a positive L-band indicated a lower energetic connectivity and less efficient use of excitation energy, while the positive H-band indicated that the PQ pool was smaller compared with the control. However, interpretation of the K-band and G-band was not equally clear. Apparently, spectral shifting did not induce substantial differences, neither in the activity of the OEC/PSII antenna size (K-band) nor in the pool size of the end electron acceptors (G-band). Interestingly, the appearance of a positive H-band was the only common trait between the two crops (aubergine and strawberry) grown under the spectral shifting greenhouse. This suggested that the Red-shifted light environment resulted in an alteration of the electron flow from PSII to PSI. This could be a consequence of an imbalance between reduction in PQ pool (reduced by the electron flow originating from PSII) and its re-oxidation due to PSI activity.
These results appear to complement the data published by Lauria et al. [77] who found that electron flow from QA to QB and beyond was impaired in strawberries grown under R-supplemented light. In this study, authors reported significant differences in the rates of excitons trapping (TRo/RC) as well as ΨO and ΦEo (Table 1). In our study, we found no significant differences in these parameters between plants grown under the SS greenhouse and the control. However, the difference in kinetics showed that a modification of the electron flow beyond PSII may be a common response to R light supplementation in both aubergine and strawberry crops.
Overall, from the experimental data recorded in both crops during this field trial, we may draw the following conclusions:
Spectral shifting under the SS greenhouse did not cause dramatic effects on the photosynthetic metabolism in the plants, as shown by the absence of major differences in photochemical efficiency, either ΦPSII (LAS), Fv/FM (DAS), or in NPQ.
However, on the more sensitive scale of the FM/F0 and Fv/F0 ratios, we recorded a direct correspondence between these parameters and higher yield both in aubergines (SS crop) and in strawberries (C crop), confirming that Chl a fluorescence measurement is a valuable tool for assessing crop productivity and for improvements in greenhouse production [83]. More detailed information about the effects of spectral shifting greenhouse cover on the physiology of photosynthesis emerged from analysis of the difference kinetics: the positive H-band and G-band in the case of the aubergine crop and positive L-band and H-band in the case of the strawberry crop indicated that an impairment in photochemical reactions was induced in these plants as discussed above.
Overall, our results further confirm previous studies suggesting that the effectiveness of spectral tuning in terms of physiological responses and productive results is dependent not only on the plant species [67] but also differs among cultivars of the same species as in the comparative study on four strawberry cultivars reported by Roosta et al. [73].

5. Conclusions

The experimental UV-to-R spectral shifting greenhouse cover affected the plant response in aubergine and strawberry crops differently.
At the physiological level, Red light enrichment induced fine variations in the photochemical phase of photosynthesis, confirming that spectral shifting covers may be used to modulate the plant photosynthetic metabolism and to improve crop production. Possible phytochrome mediated photo-morphogenetic responses may have positively influenced the plant performance (for instance by enhancing the biomass allocation in fruits); however, the main objective of this experiment was to elucidate the effects of this light manipulation on photochemistry.
While aubergine production benefited from the red-enriched light environment, strawberry cumulative yield remained unaffected although productivity improved toward the end of the crop cycle. It may be questionable whether a delayed production may be commercially interesting for the producer, and it should be investigated in different strawberry cultivars. However, within the multi-year life cycle of a polyethylene cover, the positive results of one crop may be cost effective even if no advantage were obtained for other crops in the succession.
Overall, use of a UV-to-R spectral shifting film is a promising technology for improving horticultural production in protected environments without the additional cost of energy consumption for artificial lighting sources. However, since the overall effect of spectral modulation on plant physiology and performance is dependent on plant species and cultivar, the results may not be generalized. Further research is needed to screen, for each crop, a range of different cultivars to evaluate the performance of this technology in different climatic areas and to find the most desirable results in terms of agricultural production. Moreover, critical issues such as durability or environmental safety of REE-doped films will need to be addressed in terms of cost-effectiveness and environmental impact.

Author Contributions

Conceptualization: S.C., I.D.M., E.C., R.P., P.M. and M.M.; methodology: G.M., L.O., M.R. and A.T.; software: L.O. and G.M.; validation: I.D.M. and P.M.; investigation and resources: E.C., G.M., M.R. and A.T.; data curation: L.O. and I.D.M.; formal analysis: S.C., M.B., M.M., I.D.M. and M.R.; writing original draft preparation: S.C., M.B., I.D.M. and M.M.; writing—review and editing: all authors; supervision and project administration: M.M.; funding acquisition: M.M. All authors have read and agreed to the published version of the manuscript.

Funding

This research was funded by the research agreement between the Department of Agricultural Sciences of the University of Naples Federico II (Portici, Naples, Italy) and Lucedentro SRL (Sassuolo, MO, Italy) of Dr. Luca Beltrame, with the agreement approved in July 2021.

Institutional Review Board Statement

Not applicable.

Data Availability Statement

The raw data supporting the conclusions of this article will be made available by the authors on request.

Conflicts of Interest

The authors declare the following financial interests/personal relationships, which may be considered as potential competing interests: Mauro Mori reports that financial support was provided by Lucedentro SRL (Sassuolo, MO, Italy). Other authors declare that they have no known competing financial interests or personal relationships that could have appeared to influence the work reported in this paper.

References

  1. Govindjee, G.; Govindjee, R. Introduction to Photosynthesis. In Bioenergetics of Photosynthesis; Govindjee, Ed.; Academic Press: New York, NY, USA, 1975; pp. 1–50. [Google Scholar]
  2. Alexandratos, N.; Bruinsma, J. (Eds.) World Agriculture Towards 2030/2050: The 2012 Revision; ESA Working Papers 12-03; FAO: Rome, Italy, 2012. [Google Scholar]
  3. WMO (World Meteorological Organization). The Global Climate 2011-2020 A Decade of Accelerating Climate Change; WMO: Geneva, Switzerland, 2023; Volume 1338, ISBN 978-92-63-11338-2. [Google Scholar]
  4. WMO (World Meteorological Organization). State of the Global Climate 2023; WMO: Geneva, Switzerland, 2024; Volume 1347, ISBN 978-92-63-11347-4. [Google Scholar]
  5. Devlin, P.F.; Christie, J.M.; Terry, M.J. Many Hands Make Light Work. J. Exp. Bot. 2007, 58, 3071–3077. [Google Scholar] [CrossRef] [PubMed]
  6. Higuchi, Y.; Hisamatsu, T. Light Acts as a Signal for Regulation of Growth and Development. In LED Lighting for Urban Agriculture; Kozai, T., Fujiwara, K., Runkle, E., Eds.; Springer: Singapore, 2016. [Google Scholar]
  7. Shimizu, H. Effect of Light Quality on Secondary Metabolite Production in Leafy Greens and Seedlings. In LED Lighting for Urban Agriculture; Kozai, T., Fujiwara, K., Runkle, E., Eds.; Springer: Singapore, 2016. [Google Scholar]
  8. Landi, M.; Zivcak, M.; Sytar, O.; Brestic, M.; Allakhverdiev, S.I. Plasticity of Photosynthetic Processes and the Accumulation of Secondary Metabolites in Plants in Response to Monochromatic Light Environments: A Review. Biochim. Biophys. Acta Bioenerg. 2020, 1861, 148131. [Google Scholar] [CrossRef]
  9. Kudo, R.; Yamamoto, K. Induction of Plant Disease Resistance and Other Physiological Responses by Green Light Illumination. In LED Lighting for Urban Agriculture; Kozai, T., Fujiwara, K., Runkle, E., Eds.; Springer: Singapore, 2016. [Google Scholar]
  10. Lauria, G.; Lo Piccolo, E.; Ceccanti, C.; Guidi, L.; Bernardi, R.; Araniti, F.; Cotrozzi, L.; Pellegrini, E.; Moriconi, M.; Giordani, T.; et al. Supplemental Red LED Light Promotes Plant Productivity, “Photomodulates” Fruit Quality and Increases Botrytis Cinerea Tolerance in Strawberry. Postharvest Biol. Technol. 2023, 198, 112253. [Google Scholar] [CrossRef]
  11. Mitchell, K.J. Influence of Light and Temperature on the Growth of Ryegrass (Lolium Spp.): I. Pattern of Vegetative Development. Physiol. Plant. 1953, 6, 21–46. [Google Scholar] [CrossRef]
  12. Wilson, D.; Cooper, J.P. Effect of Light Intensity during Growth on Leaf Anatomy and Subsequent Light-Saturated Photosynthesis among Contrasting Lolium Genotypes. New Phytol 1969, 68, 1125–1135. [Google Scholar] [CrossRef]
  13. Muneer, S.; Kim, E.; Park, J.; Lee, J. Influence of Green, Red and Blue Light Emitting Diodes on Multiprotein Complex Proteins and Photosynthetic Activity under Different Light Intensities in Lettuce Leaves (Lactuca Sativa L.). Int. J. Mol. Sci. 2014, 15, 4657–4670. [Google Scholar] [CrossRef] [PubMed]
  14. Hernández, R.; Kubota, C. Physiological Responses of Cucumber Seedlings under Different Blue and Red Photon Flux Ratios Using LEDs. Environ. Exp. Bot. 2016, 121, 66–74. [Google Scholar] [CrossRef]
  15. Hamdani, S.; Khan, N.; Perveen, S.; Qu, M.; Jiang, J.; Govindjee; Zhu, X.-G. Changes in the Photosynthesis Properties and Photoprotection Capacity in Rice (Oryza Sativa) Grown under Red, Blue, or White Light. Photosynth. Res. 2019, 139, 107–121. [Google Scholar] [CrossRef]
  16. Paradiso, R.; Proietti, S. Light Quality Manipulation to Control Plant Growth and Photomorphogenesis in Greenhouse Horticulture: The State of the Art and the Opportunities of Modern LED Systems. J. Plant Growth Regul. 2022, 41, 742–780. [Google Scholar] [CrossRef]
  17. Lauria, G.; Ceccanti, C. Effects of Light Modulation on Plant Photosynthesis Process and Secondary Metabolism. Agrochimica 2021, 65, 45–51. [Google Scholar] [CrossRef]
  18. Lu, N.; Mitchell, C.A. Supplemental lighting for greenhouse-grown fruiting vegetables. In LED Lighting for Urban Agriculture; Kozai, T., Fujiwara, K., Runkle, E., Eds.; Springer: Singapore, 2016. [Google Scholar]
  19. Ilić, Z.S.; Fallik, E. Light Quality Manipulation Improves Vegetable Quality at Harvest and Postharvest: A Review. Environ. Exp. Bot. 2017, 139, 79–90. [Google Scholar] [CrossRef]
  20. Wondraczek, L.; Tyystjärvi, E.; Méndez-Ramos, J.; Müller, F.A.; Zhang, Q. Shifting the Sun: Solar Spectral Conversion and Extrinsic Sensitization in Natural and Artificial Photosynthesis. Adv. Sci. 2015, 2, 1500218. [Google Scholar] [CrossRef] [PubMed]
  21. Shen, L.; Lou, R.; Park, Y.; Guo, Y.; Stallknecht, E.J.; Xiao, Y.; Rieder, D.; Yang, R.; Runkle, E.S.; Yin, X. Increasing Greenhouse Production by Spectral-Shifting and Unidirectional Light-Extracting Photonics. Nat. Food 2021, 2, 434–441. [Google Scholar] [CrossRef]
  22. Marcelis, L.F.M.; Costa, J.M.; Heuvelink, E. Achieving Sustainable Greenhouse Production: Present Status, Recent Advances and Future Developments. In Achieving Sustainable Greenhouse Production; Heuvelink, E., Marcelis, L.F.M., Eds.; Burleigh Dodds Science Publishing: Cambridge, UK, 2019; pp. 1–14. ISBN 978-0-429-26674-4. [Google Scholar]
  23. Katzin, D.; Marcelis, L.F.M.; Mourik, S. Energy Savings in Greenhouses by Transition from High-Pressure Sodium to LED Lighting. Appl. Energy 2021, 281, 116019. [Google Scholar] [CrossRef]
  24. Liu, Y.; Gui, Z.; Liu, J. Research Progress of Light Wavelength Conversion Materials and Their Applications in Functional Agricultural Films. Polymers 2022, 14, 851. [Google Scholar] [CrossRef]
  25. Di Mola, I.; Conti, S.; Bartak, M.; Cozzolino, E.; Ottaiano, L.; Giordano, D.; Melchionna, G.; Mormile, P.; Rippa, M.; Beltrame, L.; et al. Greenhouse Photoluminescent PMMA Panels Improve the Agronomical and Physiological Performances of Lettuce (Lactuca Sativa L.). Horticulturae 2022, 8, 913. [Google Scholar] [CrossRef]
  26. Paradiso, R.; Mola, I.; Conti, S.; Ottaiano, L.; Cozzolino, E.; Rippa, M.; Mormile, P.; Melchionna, G.; Testa, A.; Beltrame, L.; et al. Photosynthesis, Yield and Quality in Wild Rocket (Diplotaxis Tenuifolia L.) under Photoluminescent Greenhouse Covers. Agronomy 2023, 13, 2372. [Google Scholar] [CrossRef]
  27. Baker, N.R. Chlorophyll Fluorescence: A Probe of Photosynthesis In Vivo. Annu. Rev. Plant Biol. 2008, 59, 89–113. [Google Scholar] [CrossRef] [PubMed]
  28. Roháček, K.; Soukupová, J.; Barták, M. Chlorophyll Fluorescence: A Wonderful Tool to Study Plant Physiology and Plant Stress. In Plant Cell Compartments—Selected Topics; Schoefs, B., Ed.; Research Signpost: Kerala, India, 2008; pp. 41–104. [Google Scholar]
  29. Strasser, R.J.; Tsimilli-Michael, M.; Srivastava, A. Analysis of the Chlorophyll a Fluorescence Transient. In Chlorophyll a Fluorescence—A Signature of Photosynthesis; Papageorgiou, G.C., Govindjee, Eds.; Advances in Photosynthesis and Respiration; Springer: Dordrecht, The Netherlands, 2004; Volume 19. [Google Scholar]
  30. Tsimilli-Michael, M. Revisiting JIP-Test: An Educative Review on Concepts, Assumptions, Approximations, Definitions and Terminology. Photosynthetica 2020, 58, 275–292. [Google Scholar] [CrossRef]
  31. Hargreaves, G.H.; Samani, Z.A. Reference Crop Evapotranspiration from Temperature. Appl. Eng. Agric. 1985, 1, 96–99. [Google Scholar] [CrossRef]
  32. Kampfenkel, K.; Vanmontagu, M.; Inze, D. Extraction and Determination of Ascorbate and Dehydroascorbate from Plant Tissue. Anal. Biochem. 1995, 225, 165–167. [Google Scholar] [CrossRef]
  33. Lichtenthaler, H.K.; Wellburn, A.R. Determinations of Total Carotenoids and Chlorophylls a and b of Leaf Extracts in Different Solvents. Biochem. Soc. Trans. 1983, 11, 591–592. [Google Scholar] [CrossRef]
  34. Fogliano, V.; Verde, V.; Randazzo, G.; Ritieni, A. Method for Measuring Antioxidant Activity and Its Application to Monitoring the Antioxidant Capacity of Wines. J. Agric. Food Chem. 1999, 47, 1035–1040. [Google Scholar] [CrossRef] [PubMed]
  35. Re, R.; Pellegrini, N.; Proteggente, A.; Pannala, A.; Yang, M.; Rice-Evans, C. Antioxidant Activity Applying an Improved ABTS Radical Cation Decolorization Assay. Free Radic. Biol. Med. 1999, 26, 1231–1237. [Google Scholar] [CrossRef]
  36. Paradiso, R.; Di Mola, I.; Cozzolino, E.; Ottaiano, L.; El-Nakhel, C.; Rouphael, Y.; Mori, M. Nutrient and Nutraceutical Quality of Rocket as a Function of Greenhouse Cover Film, Nitrogen Dose and Biostimulant Application. Agronomy 2023, 13, 638. [Google Scholar] [CrossRef]
  37. Singleton, V.L.; Orthofer, R.; Lamuela-Raventós, R.M. Analysis of Total Phenols and Other Oxidation Substrates and Antioxidants by Means of Folin-Ciocalteu Reagent. Methods Enzymol. 1999, 299, 152–178. [Google Scholar]
  38. Genty, B.; Briantais, J.M.; Baker, N.R. The Relationship between the Quantum Yield of Photosynthetic Electron Transport and Quenching of Chlorophyll Fluorescence. Biochim. Biophys. Acta 1989, 990, 87–92. [Google Scholar] [CrossRef]
  39. Bilger, W.; Björkman, O. Role of the Xanthophyll Cycle in Photoprotection Elucidated by Measurements of Light-Induced Absorbance Changes, Fluorescence and Photosynthesis in Leaves of Hedera Canariensis. Photosynth. Res. 1990, 25, 173–185. [Google Scholar] [CrossRef]
  40. Strasser, R.J.; Tsimilli-Michael, M.; Dangre, D.; Rai, M. Biophysical Phenomics Reveals Functional Building Blocks of Plants Systems Biology: A Case Study for the Evaluation of the Impact of Mycorrhization with Piriformospora Indica. In Advanced Techniques in Soil Microbiology. Soil Biology; Varma, A., Oelmüller, R., Eds.; Springer: Berlin/Heidelberg, Germany, 2007; Volume 11. [Google Scholar]
  41. Kalaji, H.M.; Bąba, W.; Gediga, K.; Goltsev, V.; Samborska, I.A.; Cetner, M.D.; Dimitrova, S.; Piszcz, U.; Bielecki, K.; Karmowska, K.; et al. Chlorophyll Fluorescence as a Tool for Nutrient Status Identification in Rapeseed Plants. Photosynth. Res. 2018, 136, 329–343. [Google Scholar] [CrossRef]
  42. Stirbet, A. Govindjee On the Relation between the Kautsky Effect (Chlorophyll a Fluorescence Induction) and Photosystem II: Basics and Applications of the OJIP Fluorescence Transient. J. Photochem. Photobiol. B 2011, 104, 236–257. [Google Scholar] [CrossRef]
  43. Strasser, R.J.; Stirbet, A.D. Heterogeneity of Photosystem II Probed by the Numerically Simulated Chlorophyll a Fluorescence Rise (O-J-I-P). Math. Comput. Simul. 1998, 48, 3–9. [Google Scholar] [CrossRef]
  44. Ruban, A. Nonphotochemical Chlorophyll Fluorescence Quenching: Mechanism and Effectiveness in Protecting Plants from Photodamage. Plant Physiol. 2016, 170, 1903–1916. [Google Scholar] [CrossRef]
  45. Choi, H.G.; Moon, B.Y.; Kang, N.J. Correlation between Strawberry (Fragaria Ananassa Duch.) Productivity and Photosynthesis-Related Parameters under Various Growth Conditions. Front. Plant Sci. 2016, 7, 1607. [Google Scholar] [CrossRef] [PubMed]
  46. Di Mola, I.; Conti, S.; Cozzolino, E.; Melchionna, G.; Ottaiano, L.; Testa, A.; Sabatino, L.; Rouphael, Y.; Mori, M. Plant-Based Protein Hydrolysate Improves Salinity Tolerance in Hemp: Agronomical and Physiological Aspects. Agronomy 2021, 11, 342. [Google Scholar] [CrossRef]
  47. Nomura, K.; Saito, M.; Ito, M.; Yamane, S.; Iwao, T.; Tada, I.; Yamazaki, T.; Ono, S.; Yasutake, D.; Kitano, M. Diurnal Decline in the Photosynthetic Capacity of Uppermost Leaves in an Eggplant Canopy Grown in a Horticultural Greenhouse. Photosynthetica 2022, 60, 457–464. [Google Scholar] [CrossRef]
  48. Kalaji, M.H.; Goltsev, V.N.; Zuk-Golaszewska, K.; Zivcak, M.; Brestic, M. Chlorophyll Fluorescence: Understanding Crop Performance—Basics and Applications; CRC Press—Taylor & Francis Group: Boca Raton, FL, USA, 2017. [Google Scholar]
  49. Holleboom, C.-P.; Gacek, D.A.; Liao, P.-N.; Negretti, M.; Croce, R.; Walla, P.J. Carotenoid–Chlorophyll Coupling and Fluorescence Quenching in Aggregated Minor PSII Proteins CP24 and CP29. Photosynth. Res. 2015, 124, 171–180. [Google Scholar] [CrossRef]
  50. Kowalczyk, K.; Sieczko, L.; Borucki, W.; Sujkowska-Rybkowska, M.; Mirgos, M.; Niedzińska, M.; Bederska-Błaszczyk, M.; Kowalczyk, W.; Geszprych, A.; Gajc-Wolska, J. The Effect of LED and HPS Assimilation Lighting on Leaf Anatomy, Chlorophyll and Carotenoid Autofluorescence Signals, and Some Physiological and Chemical Leaf Traits Related to the Productivity of Cucumber (Cucumis Sativus L.) in High-Wire Cultivation. Agronomy 2022, 12, 2004. [Google Scholar] [CrossRef]
  51. Sardar, S.; Caferri, R.; Camargo, F.V.A.; Capaldi, S.; Ghezzi, A.; Dall’Osto, L.; D’Andrea, C.; Cerullo, G.; Bassi, R. Site-Directed Mutagenesis of the Chlorophyll-Binding Sites Modulates Excited-State Lifetime and Chlorophyll–Xanthophyll Energy Transfer in the Monomeric Light-Harvesting Complex CP29. J. Phys. Chem. Lett. 2024, 15, 3149–3158. [Google Scholar] [CrossRef]
  52. Strasser, R.J.; Tsimilli-Michael, M.; Qiang, S.; Goltsev, V. Simultaneous in Vivo Recording of Prompt and Delayed Fluorescence and 820-Nm Reflection Changes during Drying and after Rehydration of the Resurrection Plant Haberlea Rhodopensis. Biochim. Biophys. Acta Bioenerg. 2010, 1797, 1313–1326. [Google Scholar] [CrossRef]
  53. Esmaeilizadeh, M.; Shamsabad, M.R.M.; Roosta, H.R.; Dąbrowski, P.; Rapacz, M.; Zieliński, A.; Wróbel, J.; Kalaji, H.M. Manipulation of Light Spectrum Can Improve the Performance of Photosynthetic Apparatus of Strawberry Plants Growing under Salt and Alkalinity Stress. PLoS ONE 2021, 16, e0261585. [Google Scholar] [CrossRef]
  54. Hosseini, A.; Zare Mehrjerdi, M.; Aliniaeifard, S.; Seif, M. Photosynthetic and Growth Responses of Green and Purple Basil Plants under Different Spectral Compositions. Physiol. Mol. Biol. Plants 2019, 25, 741–752. [Google Scholar] [CrossRef]
  55. Cammarisano, L. Illuminating Future Food Production: The Impacts of Tuneable Artificial Lighting on Food Crop Biology and Productivity. Ph.D. Thesis, Institute of Biological, Environmental and Rural Sciences, Aberystwyth University, Aberystwyth, UK, 2020. [Google Scholar]
  56. Küpper, H.; Benedikty, Z.; Morina, F.; Andresen, E.; Mishra, A.; Trtílek, M. Analysis of OJIP Chlorophyll Fluorescence Kinetics and QA Reoxidation Kinetics by Direct Fast Imaging. Plant Physiol. 2019, 179, 369–381. [Google Scholar] [CrossRef] [PubMed]
  57. Vredenberg, W.J. Algorithm for Analysis of OJDIP Fluorescence Induction Curves in Terms of Photo- and Electrochemical Events in Photosystems of Plant Cells: Derivation and Application. J. Photochem. Photobiol. B Biol. 2008, 91, 58–65. [Google Scholar] [CrossRef] [PubMed]
  58. Tsimilli-Michael, M.; Strasser, R.J. The Energy Flux Theory 35 Years Later: Formulations and Applications. Photosynth. Res. 2013, 117, 289–320. [Google Scholar] [CrossRef] [PubMed]
  59. Yusuf, M.A.; Kumar, D.; Rajwanshi, R.; Strasser, R.J.; Tsimilli-Michael, M.; Govindjee; Sarin, N.B. Overexpression of (γ-Tocopherol Methyl Transferase Gene in Transgenic Brassica Juncea Plants Alleviates Abiotic Stress: Physiological and Chlorophyll a Fluorescence Measurements. Biochim. Biophys. Acta 2010, 1797, 1428–1438. [Google Scholar] [CrossRef]
  60. Zhu, J.; Zhang, Y.C.; Yang, L.Y.; Zhou, L. Effect of Different LED-Lighting Quality Conditions on Growth and Photosynthetic Characteristics of Saffron Plants (Crocus Sativus L.). Photosynthetica 2022, 60, 497–507. [Google Scholar] [CrossRef]
  61. Dimitrova, S.; Paunov, M.; Pavlova, B.; Dankov, K.; Kouzmanova, M.; Velikova, V.; Tsonev, T.; Kalaji, H.M.; Goltsev, V. Photosynthetic Efficiency of Two Platanus Orientalis L. Ecotypes Exposed to Moderately High Temperature—JIP-Test Analysis. Photosynthetica 2020, 58, 657–670. [Google Scholar] [CrossRef]
  62. Ceppi, M.G.; Oukarroum, A.; Çiçek, N.; Strasser, R.J.; Schansker, G. The IP Amplitude of the Fluorescence Rise OJIP Is Sensitive to Changes in the Photosystem I Content of Leaves: A Study on Plants Exposed to Magnesium and Sulfate Deficiencies, Drought Stress and Salt Stress. Physiol. Plant. 2012, 144, 277–288. [Google Scholar] [CrossRef]
  63. Zagorchev, L.; Atanasova, A.; Albanova, I.; Traianova, A.; Mladenov, P.; Kouzmanova, M.; Goltsev, V.; Kalaji, H.M.; Teofanova, D. Functional Characterization of the Photosynthetic Machinery in Smicronix Galls on the Parasitic Plant Cuscuta Campestris by JIP-Test. Cells 2021, 10, 1399. [Google Scholar] [CrossRef]
  64. Novoplansky, A.; Sachs, T.; Cohen, D.; Bar, R.; Bodenheimer, J.; Reisfeld, R. Increasing Plant Productivity by Changing the Solar Spectrum. Sol. Energy Mater. 1990, 21, 17–23. [Google Scholar] [CrossRef]
  65. Hemming, S.; van Os, E.A.; Hemming, J.; Dieleman, J.A. The Effect of New Developed Fluorescent Greenhouse Films on the Growth of Fragaria x Ananassa ‘Elsanta’. Eur. J. Hort. Sci. 2006, 71, 145–154. [Google Scholar]
  66. Hidaka, K.; Yoshida, K.; Shimasaki, K.; Murakami, K.; Yasutake, D.; Kitano, M. Spectrum Conversion Film for Regulation of Plant Growth. J. Fac. Agric. Kyushu Univ. 2008, 53, 549–552. [Google Scholar] [CrossRef] [PubMed]
  67. Kang, J.H.; Kim, D.; Yoon, H.I.; Son, J.E. Growth, Morphology, and Photosynthetic Activity of Chinese Cabbage and Lettuce Grown under Polyethylene and Spectrum Conversion Films. Hortic. Environ. Biotechnol. 2023, 64, 593–603. [Google Scholar] [CrossRef]
  68. Li, Y.; Tu, W.; Liu, C.; Liu, W.; Hu, G.; Liu, X.; Chen, Z.; Yang, C. Light Conversion Film Promotes CO 2 Assimilation by Increasing Cyclic Electron Flow around Photosystem I in Arabidopsis Thaliana. Int. J. Hydrog. Energy 2017, 42, 8545–8553. [Google Scholar] [CrossRef]
  69. Yoon, H.I.; Kang, J.H.; Kang, W.H.; Son, J.E. Subtle Changes in Solar Radiation under a Green-to-Red Conversion Film Affect the Photosynthetic Performance and Chlorophyll Fluorescence of Sweet Pepper. Photosynthetica 2020, 58, 1107–1115. [Google Scholar] [CrossRef]
  70. Hernández-Martínez, N.R.; Blanchard, C.; Wells, D.; Salazar-Gutiérrez, M.R. Current State and Future Perspectives of Commercial Strawberry Production: A Review. Sci. Hortic. 2023, 312, 111893. [Google Scholar] [CrossRef]
  71. Choi, H.G.; Moon, B.Y.; Kang, N.J. Effects of LED Light on the Production of Strawberry during Cultivation in a Plastic Greenhouse and in a Growth Chamber. Sci. Hortic. 2015, 189, 22–31. [Google Scholar] [CrossRef]
  72. Jiang, L.; Chen, X.; Gu, X.; Deng, M.; Li, X.; Zhou, A.; Suo, M.; Gao, W.; Lin, Y.; Wang, Y. Light Quality and Sucrose-Regulated Detached Ripening of Strawberry with Possible Involvement of Abscisic Acid and Auxin Signaling. Int. J. Mol. Sci. 2023, 24, 5681. [Google Scholar] [CrossRef]
  73. Roosta, H.R.; Bikdeloo, M.; Ghorbanpour, M. The Growth, Nutrient Uptake and Fruit Quality in Four Strawberry Cultivars under Different Spectra of LED Supplemental Light. BMC Plant Biol. 2024, 24, 179. [Google Scholar] [CrossRef]
  74. Lauria, G.; Lo Piccolo, E.; Pellegrini, E.; Bellini, E.; Giordani, T.; Guidi, L.; Lorenzini, G.; Malorgio, F.; Massai, R.; Nali, C.; et al. Photosynthetic Traits and Biochemical Responses in Strawberry (Fragaria × Ananassa Duch.) Leaves Supplemented with LED Lights. Photosynthetica 2021, 59, 557–569. [Google Scholar] [CrossRef]
  75. Trouwborst, G.; Hogewoning, S.W.; Kooten, O.; Harbinson, J.; Ieperen, W. Plasticity of Photosynthesis after the ‘Red Light Syndrome’ in Cucumber. Environ. Exp. Bot. 2016, 121, 75–82. [Google Scholar] [CrossRef]
  76. Kang, J.H.; Yoon, H.I.; Lee, J.M.; Kim, J.P.; Son, J.E. Electron Transport and Photosynthetic Performance in Fragaria × Ananassa Duch. Acclimated to the Solar Spectrum Modified by a Spectrum Conversion Film. Photosynth. Res. 2022, 151, 31–46. [Google Scholar] [CrossRef] [PubMed]
  77. Lauria, G.; Lo Piccolo, E.; Ceccanti, C.; Paoli, L.; Giordani, T.; Guidi, L.; Malorgio, F.; Massai, R.; Nali, C.; Pellegrini, E.; et al. Supplemental Red Light More than Other Wavebands Activates Antioxidant Defenses in Greenhouse-Cultivated Fragaria x Ananassa Var. Elsanta Plants. Sci. Hortic. 2023, 321, 112319. [Google Scholar] [CrossRef]
  78. Guiamba, H.D.S.S.; Zhang, X.; Sierka, E.; Lin, K.; Ali, M.M.; Ali, W.M.; Lamlom, S.F.; Kalaji, H.M.; Telesiński, A.; Yousef, A.F.; et al. Enhancement of Photosynthesis Efficiency and Yield of Strawberry (Fragaria Ananassa Duch.) Plants via LED Systems. Front. Plant Sci. 2022, 13, 918038. [Google Scholar] [CrossRef]
  79. Zhang, Y.; Jiang, L.; Li, Y.; Chen, Q.; Ye, Y.; Zhang, Y.; Luo, Y.; Sun, B.; Wang, X.; Tang, H. Effect of Red and Blue Light on Anthocyanin Accumulation and Differential Gene Expression in Strawberry (Fragaria × Ananassa). Molecules 2018, 23, 820. [Google Scholar] [CrossRef]
  80. Canora, D.D.; Guasch, L.L.; Zuazo, R.S. Species-Specific Responses of Antarctic Terrestrial Microalgae to Salinity Stress. Comparative Study in Klebsormidium sp. and Stigeoclonium sp. Czech Polar Rep. 2022, 12, 89–102. [Google Scholar] [CrossRef]
  81. Hussain, N.; Sohail, Y.; Shakeel, N.; Javed, M.; Bano, H.; Gul, H.S.; Zafar, Z.U.; Frahat Zaky Hassan, I.; Ghaffar, A.; Athar, H.U.; et al. Role of Mineral Nutrients, Antioxidants, Osmotic Adjustment and PSII Stability in Salt Tolerance of Contrasting Wheat Genotypes. Sci. Rep. 2022, 12, 12677. [Google Scholar] [CrossRef]
  82. Arnold, A.L.M.; McGrath, C.; Reinhardt, A. Effects of Oak Processionary Moth (Thaumetopoea Processionea L.) Outbreaks on the Leaf Performance and Health of Urban and Forest Oak Trees (Quercus Robur L.) in Brandenburg, Germany. Forests 2023, 14, 124. [Google Scholar] [CrossRef]
  83. Baker, N.R.; Rosenqvist, E. Applications of Chlorophyll Fluorescence Can Improve Crop Production Strategies: An Examination of Future Possibilities. J. Exp. Bot. 2004, 55, 1607–1621. [Google Scholar] [CrossRef]
Figure 1. Maximum (A) and minimum (B) temperature inside (SS: spectral shifting sector; C: control sector) and outside (Out) of the greenhouse during the whole experimental period (aubergine cycle: March–July 2022; October 2022–May 2023). Each month was divided into three ten-day periods: I (lst–10th day), II (11th–20th day), and III (21st–last day).
Agriculture 15 00569 g001
Figure 2. (A) Emission spectrum of the UV-A diode lamp used as an excitation source in the photoluminescence analysis of the spectral shifting (SS) film. (B) Phosphorescence emission spectrum of the SS film following UV-A excitation. The spectrum is characterized by five main peaks, three of which are in the visible region (594, 617, and 627 nm) and two in the Far-Red region (706 and 745 nm). (C) Time course of phosphorescence emission measured at 627 nm (R region) following excitation with a UV-A source at 368 nm. Phosphorescence intensity values were normalized with reference to the first value measured after switching off the UV-A lamp. (D) Comparison between the solar spectrum (black line), the spectrum measured under the spectral shifting film (SS, red line), and the spectrum measured under the control film (C, blue line). (E) Difference spectrum obtained subtracting the solar light spectrum from the spectrum measured under the SS film (black line) compared with the difference spectrum obtained subtracting the spectrum measured under the control film from the spectrum measured under the SS film (red line). (F) Light transmission (% of incident light) of the C and SS films as a function of temperature.
Agriculture 15 00569 g002
Figure 3. Aubergine marketable yield as affected by the greenhouse cover material, control (C), or spectral shifting (SS). Values are means ± standard error, different letters indicate significant differences at p ≤ 0.05. Roman numerals indicate harvest number.
Agriculture 15 00569 g003
Figure 4. Effective quantum yield of PSII photochemistry in the LAS (ΦPSII) and non-photochemical quenching (NPQ) of aubergine plants grown under control (C) and spectral shifting (SS) greenhouse covers. Values are unitless ratios, error bars are se, n = 20, ns no significant difference.
Agriculture 15 00569 g004
Figure 5. Raw OJIP kinetics recorded on aubergine plants grown under control (C) and spectral shifting (SS) greenhouse covers. The lines are means of n = 20 replicates; important chlorophyll fluorescence inflection points are indicated as O (0.040 ms), J (2 ms), I (30 ms), and P (fluorescence peak at ≈1 s); * denotes statistically significant differences between C and SS at the O, J, I, or P inflection points (Student’s t-test at p ≤ 0.05).
Agriculture 15 00569 g005
Figure 6. Aubergine Chl a fluorescence transients. Difference kinetics obtained after double normalization between two time points of the fast chlorophyll fluorescence transients and subtracting the kinetics of the control from the kinetics of the SS treatment. Difference kinetics ΔWOK = [WOK(SS) − WOK(C)] evidencing the L-band (A), ∆WOJ = [WOJ(SS) − WOJ(C)] evidencing the K-band (B), ΔWJI = [WJI(SS) − WJI(C)] evidencing the H-band (C); ΔWIP = [WIP(SS) − WIP(C)] evidencing the G-band (D).
Agriculture 15 00569 g006
Figure 7. Strawberry production as affected by the greenhouse cover material, control (C), or spectral shifting (SS). Values are means ± standard error; different letters indicate significant differences at p ≤ 0.05. Roman numerals indicate harvest number.
Agriculture 15 00569 g007
Figure 8. Effective quantum yield of PSII photochemistry in the LAS (ΦPSII) and non-photochemical quenching (NPQ) of strawberry plants grown under control (C) and spectral shifting (SS) greenhouses. Values are unitless ratios, error bars are se, n = 20, * denotes significant difference at p ≤ 0.05, ns no significant difference.
Agriculture 15 00569 g008
Figure 9. Raw OJIP kinetics recorded on strawberry plants grown under control (C) and spectral shifting (SS) greenhouse covers. The lines are means of n = 20 replicates; important chlorophyll fluorescence inflection points are indicated as O (0.040 ms), J (2 ms), I (30 ms), and P (fluorescence peak at ≈1 s); * denotes statistically significant differences between C and SS at the O, J, I, or P inflection points (Student’s t-test at p ≤ 0.05).
Agriculture 15 00569 g009
Figure 10. Strawberry Chl a fluorescence transients. Difference kinetics obtained after double normalization between two time points of the fast chlorophyll fluorescence transients and subtracting the kinetics of the control from the kinetics of the SS treatment. Difference kinetics ΔWOK = [WOK(SS) − WOK(C)] evidencing the L-band (A), ∆WOJ = [WOJ(SS) − WOJ(C)] evidencing the K-band (B), ΔWJI = [WJI(SS) − WJI(C)] evidencing the H-band (C), ΔWIP = [WIP(SS) − WIP(C)] evidencing the G-band (D).
Agriculture 15 00569 g010
Table 2. Aubergine yield, dry matter, and fruit firmness as affected by greenhouse cover.
TreatmentsCumulative Yield
t ha−1
Total Fruits
n° m−2
Mean Weight
g fruit−1
Dry Matter
%
Firmness
kg cm−2
Control63.9 ± 3.030.2 ± 1.08213.0 ± 1.587.6 ± 0.141.69 ± 0.009
SS70.8 ± 2.433.8 ± 0.94210.7 ± 0.728.0 ± 0.161.93 ± 0.013
**nsns**
Values are means ± se, one-way ANOVA was used to test for statistically significant differences reported as ns: not significant; *: significant at p ≤ 0.05; **: significant at p ≤ 0.01.
Table 3. Aubergine quality parameters as affected by greenhouse cover.
TreatmentsHAA
mmol AsA 100 g−1 dw
LAA
mmol Trolox 100 g−1 dw
Phenols
mg GAE g−1 dw
AsA
mg 100 g−1 fw
Carotenoids
mg g−1 fw
Control3.86 ± 0.2924.9 ± 1.093.12 ± 0.0859.4 ± 1.460.037 ± 0.001
SS3.06 ± 0.0426.4 ± 0.533.18 ± 0.0861.2 ± 4.480.041 ± 0.002
nsnsnsns*
Values are means ± se, one-way ANOVA was used to test for statistically significant differences reported as ns: not significant; *: significant at p ≤ 0.05. AsA: ascorbic acid; HAA: hydrophilic antioxidant activity; LAA: lipophilic antioxidant activity; GAE: gallic acid equivalents.
Table 4. Aubergine color parameters (brightness L*, redness a*, yellowness b*) as affected by greenhouse cover.
TreatmentsL*a*b*
Control24.0 ± 0.13.6 ± 0.1−0.17 ± 0.02
SS24.3 ± 0.24.3 ± 0.2−0.18 ± 0.03
ns*ns
Values are means ± se, one-way ANOVA was used to test for statistically significant differences reported as ns: not significant; *: significant at p ≤ 0.05.
Table 5. JIP-test parameters of aubergine plants grown under control and spectral shifting greenhouses.
JIP-Test ParameterControlSpectral Shiftingt-Test
F013,677 ± 47912,198 ± 392*
FJ25,415 ± 90726,852 ± 1402ns
FI21,966 ± 127825,667 ± 2062ns
FM39,398 ± 174442,505 ± 2442ns
Fv25,721 ± 178330,307 ± 2443ns
VJ0.470 ± 0.0270.476 ± 0.023ns
VI0.294 ± 0.0350.389 ± 0.044ns
FM/F02.934 ± 0.1503.535 ± 0.201*
Fv/F01.934 ± 0.1502.535 ± 0.201*
Fv/FM0.641 ± 0.0190.695 ± 0.022ns
M01.288 ± 0.0531.180 ± 0.041ns
Area12,903,958 ± 602,83512,066,264 ± 450,842ns
Sm523 ± 23436 ± 27*
Ss0.366 ± 0.0150.409 ± 0.020ns
N1497 ± 1041175 ± 139ns
ΦP00.641 ± 0.0190.695 ± 0.022ns
Ψ00.530 ± 0.0270.524 ± 0.023ns
ΦE00.344 ± 0.0220.361 ± 0.017ns
ΦD00.359 ± 0.0190.305 ± 0.022ns
ΦPav870 ± 7885 ± 8ns
PiAbs0.613 ± 0.0910.854 ± 0.101ns
ABS/RC4.528 ± 0.2793.988 ± 0.450ns
TR0/RC2.834 ± 0.1332.607 ± 0.178ns
ET0/RC1.546 ± 0.1411.427 ± 0.167ns
DI0/RC1.694 ± 0.1821.382 ± 0.288ns
Values are means (n = 20) ± se. Student’s t-test was used to test for statistically significant differences between C and SS, reported as ns (not significant) or * (significant at p ≤ 0.05).
Table 6. Strawberry production and quality parameters as affected by greenhouse cover.
TreatmentsCumulative Yield
t ha−1
Total Fruits
n° m−2
Mean Weight
g fruit−1
DM
%
TSS
°Brix
Firmness
kg cm−2
Control63.5 ± 7.02226.8 ± 9.727.8 ± 1.219.2 ± 0.159.4 ± 0.110.43 ± 0.002
SS68.7 ± 5.24247.1 ± 3.728.0 ± 1.119.2 ± 0.209.8 ± 0.110.46 ± 0.003
nsnsnsnsns**
Values are means ± se, one-way ANOVA was used to test for statistically significant differences reported as ns: not significant; **: significant at p ≤ 0.01. DM: dry matter; TSS: soluble solids content.
Table 7. Strawberry quality parameters as affected by greenhouse cover.
TreatmentsHAA
mmol AsA 100 g−1 dw
LAA
mmol Trolox 100 g−1 dw
Phenols
mg GAE g−1 dw
AsA
mg 100 g−1 fw
Carotenoids
mg g−1 fw
Control11.1 ± 0.0227.9 ± 1.04.6 ± 0.1063.6 ± 2.00.017 ± 0.0003
SS11.5 ± 0.1126.5 ± 0.84.8 ± 0.0150.6 ± 0.90.010 ± 0.0001
nsnsns***
Values are means ± se, one-way ANOVA was used to test for statistically significant differences reported as ns: not significant; *: significant at p ≤ 0.05; **: significant at p ≤ 0.01. HAA: hydrophilic antioxidant activity; LAA: lipophilic antioxidant activity; AsA: ascorbic acid.
Table 8. Strawberry color parameters (brightness L*, redness a*, yellowness b*) as affected by greenhouse cover.
TreatmentsL*a*b*
Control33.9 ± 0.524.9 ± 1.093.12 ± 0.08
SS35.7 ± 0.226.4 ± 0.533.18 ± 0.08
*nsns
Values are means ± se, one-way ANOVA was used to test for statistically significant differences reported as ns: not significant; *: significant at p ≤ 0.05.
Table 9. JIP-test parameters of strawberry plants grown under control and spectral shifting greenhouses.
JIP-Test ParameterControlSpectral Shiftingt-Test
F08190 ± 1628128 ± 196ns
FJ21,361 ± 48620,223 ± 543ns
FI29,769 ± 74627,469 ± 705*
FM43,422 ± 95640,201 ± 813*
Fv35,232 ± 83832,074 ± 720*
VJ0.374 ± 0.0050.378 ± 0.009ns
VI0.611 ± 0.0050.602 ± 0.007ns
FM/F05.306 ± 0.0764.973 ± 0.102*
Fv/F04.306 ± 0.0763.973 ± 0.102*
Fv/FM0.811 ± 0.0030.797 ± 0.004*
M00.611 ± 0.0140.620 ± 0.025ns
Area19,347,982 ± 582,93317,040,625 ± 577,748*
Sm550 ± 12534 ± 18ns
Ss0.616 ± 0.0080.617 ± 0.011ns
N894 ± 18867 ± 28ns
ΦP00.811 ± 0.0030.797 ± 0.004*
Ψ00.626 ± 0.0050.622 ± 0.009ns
ΦE00.508 ± 0.0050.497 ± 0.009ns
ΦD00.189 ± 0.0030.203 ± 0.004*
ΦPav928 ± 1925 ± 2ns
PiAbs3.651 ± 0.1643.403 ± 0.274ns
ABS/RC2.011 ± 0.0282.049 ± 0.045ns
TR0/RC1.630 ± 0.0211.630 ± 0.029ns
ET0/RC1.019 ± 0.0111.010 ± 0.010ns
DI0/RC0.381 ± 0.0090.418 ± 0.017ns
Values are means (n = 20) ± se. Student’s t-test was used to test for statistically significant differences between C and SS, reported as ns (not significant) or * (significant at p ≤ 0.05).
Disclaimer/Publisher’s Note: The statements, opinions and data contained in all publications are solely those of the individual author(s) and contributor(s) and not of MDPI and/or the editor(s). MDPI and/or the editor(s) disclaim responsibility for any injury to people or property resulting from any ideas, methods, instructions or products referred to in the content.

