Article

Discrete Element Method Analysis of Soil Penetration Depth Affected by Spreading Speed in Drone-Seeded Rice

Department of Mechanical and Design Engineering, Hongik University, Sejong 30016, Republic of Korea
Agriculture 2025, 15(4), 422; https://doi.org/10.3390/agriculture15040422
Submission received: 21 January 2025 / Revised: 7 February 2025 / Accepted: 15 February 2025 / Published: 17 February 2025
(This article belongs to the Section Agricultural Technology)

Abstract

:
This research explores, using discrete element method (DEM) simulations, the behavior of rice seed infiltration into soil when it is deployed via unmanned aerial vehicle (UAV)-mounted systems. Five distinct sowing strategies were analyzed to evaluate their effectiveness in embedding seeds within paddy soil: gravitational drop, centrifugal spreading, airflow propulsion, pneumatic discharge, and pneumatic shooting. A two-step analysis was performed. Initially, the flight dynamics of rice seeds were modeled, and the influence of air and water drag forces were accounted for. Subsequently, soil penetration was simulated with DEM based on the material properties and contact parameters sourced from the existing literature. The results show that the pneumatic methods effectively penetrated the soil, with pneumatic shooting proving to be the most efficient due to its superior impact momentum. Conversely, the methods that failed to penetrate left seeds on the soil surface. These findings demonstrate the necessity to enhance UAV sowing technology to improve penetration depth while maintaining operational efficiency, and they also offer crucial insights for the progress of UAV applications in agriculture.

1. Introduction

Rice, along with wheat and maize, is classified as one of the three main cereals in the world [1,2,3], and it serves as a staple food for approximately 50% of the world’s population [4]. In Asian countries, where rice consumption is particularly high, rice production plays a crucial role in national food security [5]. Given the increasing frequency of extreme weather events and the resulting instability in food supply [3,6], enhancing rice productivity, developing long-term storage solutions, and advancing food processing technologies have become increasingly important in maintaining the sustainability of food security. Traditional rice cultivation methods are based on labor-intensive processes such as sowing and transplanting, with manual transplantation accounting for more 25% of the total costs of rice production due to labor expenses [7,8]. To reduce labor costs and improve productivity, mechanized transplant methods [9,10] have been developed and widely adopted. In addition, direct rice seeding techniques, which eliminate the need for the transplant stage, have been continuously developed and refined [7,8,11].
Unlike traditional seeding methods, such as manual broadcasting and mechanical transplanting (which require substantial labor and time and often lead to uneven seed distribution, resulting in suboptimal crop development and inefficient use of resources), seeding technology based on UAVs offers a promising alternative. This technology enables rapid, wide-ranging seeding operations with precise control over seed distribution and placement. By ensuring more uniform seed penetration into the soil, it reduces the need for manual labor and enhances planting efficiency, which is critical for improving germination and crop yields. Therefore, recently, direct seeding techniques using UAVs, such as drones, have gained significant attention due to their high productivity and convenient operation [12,13]. In particular, there has been active research on the kinematic design, optimization, and operational conditions of rice seed spreaders mounted on UAVs. For example, Liu et al. detailed the design and operation of a UAV with a pelletized rice seeding device that comprises a hopper, metering device, distributor, accelerating module, and angle adjustment ring [14]. They conducted performance tests to measure the seed discharge rate, the seed distribution characteristics (based on sowing uniformity using computer vision techniques), and the rice yield per unit area. In addition, optimization studies have been performed to achieve a uniform seeding distribution and high rice yield using a centrifugal rice seed spreader mounted on UAVs. These studies focused on parameters such as flight altitude, spreader disc rotation speed, and baffle ring inclination to determine optimal seeding conditions [2]. Lysych et al. reviewed the design and performance of various seeding devices applicable to UAV-based seeding systems [15]. Their study presented design concepts for sowing devices, such as gravitational drop, centrifugal spread, airflow propulsion, and pneumatic discharge. DEM simulations were conducted to analyze how pelletized seeds penetrate weakly cohesive soil at three launch velocities (25, 50, and 75 m/s) to predict the sowing performance of a pneumatic sowing module. Their study concluded that a launch velocity of 50 m/s is sufficient to ensure that the seeds are fully embedded in the soil. This simulation did not account for the deceleration of the seeds due to the resistance to fluid drag in the air and surface water or the high cohesion of the paddy soil, suggesting that the predicted penetration depth may have been overestimated. UAV-based sowing technology has been adapted for use beyond rice cultivation and is being increasingly employed for various crops and forest restoration projects. The choice of sowing technique is influenced by the type of seed. Centrifugal and airflow methods are commonly used for the widespread dispersal required by small-to-medium-sized seeds, such as those of spruce, pine, birch, cedar, fir, viburnum, and linden. In contrast, pneumatic methods, which facilitate the precise placement of seeds needed for successful germination, are more suitable for larger seeds such as oak, hazel, hazelnuts, and walnuts, as well as pelletized seeds [15]. These considerations highlight the versatility of UAV seeding and emphasize the importance of customizing seeding techniques to meet the unique needs of each crop or reforestation project.
In addition to seeding devices, UAV technology has been applied to monitor rice cultivation. Kawamura et al. introduced a technique for obtaining rice plant height maps by processing images of paddy fields captured by UAVs, which helps to monitor the growth conditions of the rice after seeding [16]. This comprehensive approach to the use of UAVs for rice cultivation not only improves the efficiency of seeding operations, but also provides valuable data to improve crop management and yield. However, existing research on UAV rice seeding has predominantly focused on device design, optimization, seeding operations for planar seed distribution in paddy fields, and post-sowing monitoring.
In contrast, there is a lack of research on the optimal vertical planting depth for UAV-sown rice in paddy fields. In a study investigating the impact of different depths of sowing on rice, it was discovered that the depths of the varying depths had a significant influence on both seed germination and seedling emergence rates [17,18]. According to [17], sowing at higher depths (3 cm) generally improved the overall biomass of rice plants in non-compacted soil, while it resulted in a decrease in biomass when the soil was compacted. In particular, planting at a shallow depth of 2 cm in compacted soil increased root biomass by 22.53% during the first season and by 23.61% in the second season. Furthermore, compacted soil improved plant density and yield by 19.02% and 18.1%, respectively, for shallow sowing. According to [18], sowing seeds on the surface (0 cm) led to a higher germination rate of 90%, while planting seeds at a depth of 2.5 cm decreased the germination rate to 77.70% and reduced the emergence of seedlings to 50. 97%. Sowing at greater depths resulted in a 137.81% increase in mesocotyl length, a 101.45% increase in coleoptile length, and an 84. 03% increase in the length of the prophyll leaf. However, it caused a 7.07% reduction in root length and a 6.89% reduction in plant height. These findings underscore the importance of optimizing sowing depth and soil conditions to improve rice productivity, demonstrating that both above-ground and below-ground growth characteristics are markedly influenced by sowing depth.
Previous research on UAV seeding has been mainly focused on the separate phases of seed dispersal [2,14] or seed penetration into the soil [15]. However, the flight phase of the seed, which is essential in affecting its speed and angle of impact, has been largely overlooked. Additionally, there is a lack of studies that have combined seed release, flight, and soil penetration into a unified simulation model. This study aims to fill this gap by offering a comprehensive numerical analysis of the dynamics of UAV seeding, linking the conditions during seed discharge with the subsequent performance of soil penetration.
This research seeks to evaluate the effectiveness of soil penetration in rice sowing by employing numerical analysis to examine five distinct UAV seeding methods, each of which are characterized by varying seed launching velocities that range from 2 m/s to 255 m/s. These methods include gravitational drop, centrifugal distribution, airflow propulsion, pneumatic discharge, and pneumatic shooting. The research involves two main stages of numerical analysis. The first stage integrates non-linear equations of motion to account for the hydrodynamics forces acting on the rice seeds as they fall from the spreader. The second stage utilizes DEM simulations to calculate the penetration depth of the seeds based on their terminal velocity and orientation. This stage also involves the prior modeling of the shapes of rice seed and soil particles, as well as the selection of the contact model parameters.
The remainder of this article is systematically structured to comprehensively cover the scope of this study mentioned above. Section 2 discusses the flight dynamics of rice seeds, detailing the calculations of their velocity and position in air and paddy water and considering drag forces. In addition, the contact model parameters for the paddy soil were selected and calibrated based on the modeling results of previous studies and the principle of similarity. Section 3 presents the setup and results of the DEM simulations that were conducted to analyze seed penetration into the paddy soil using the velocity and orientation information of rice seed incidence in paddy water. Finally, Section 4 provides conclusions and describes potential future research directions.

2. Materials and Methods

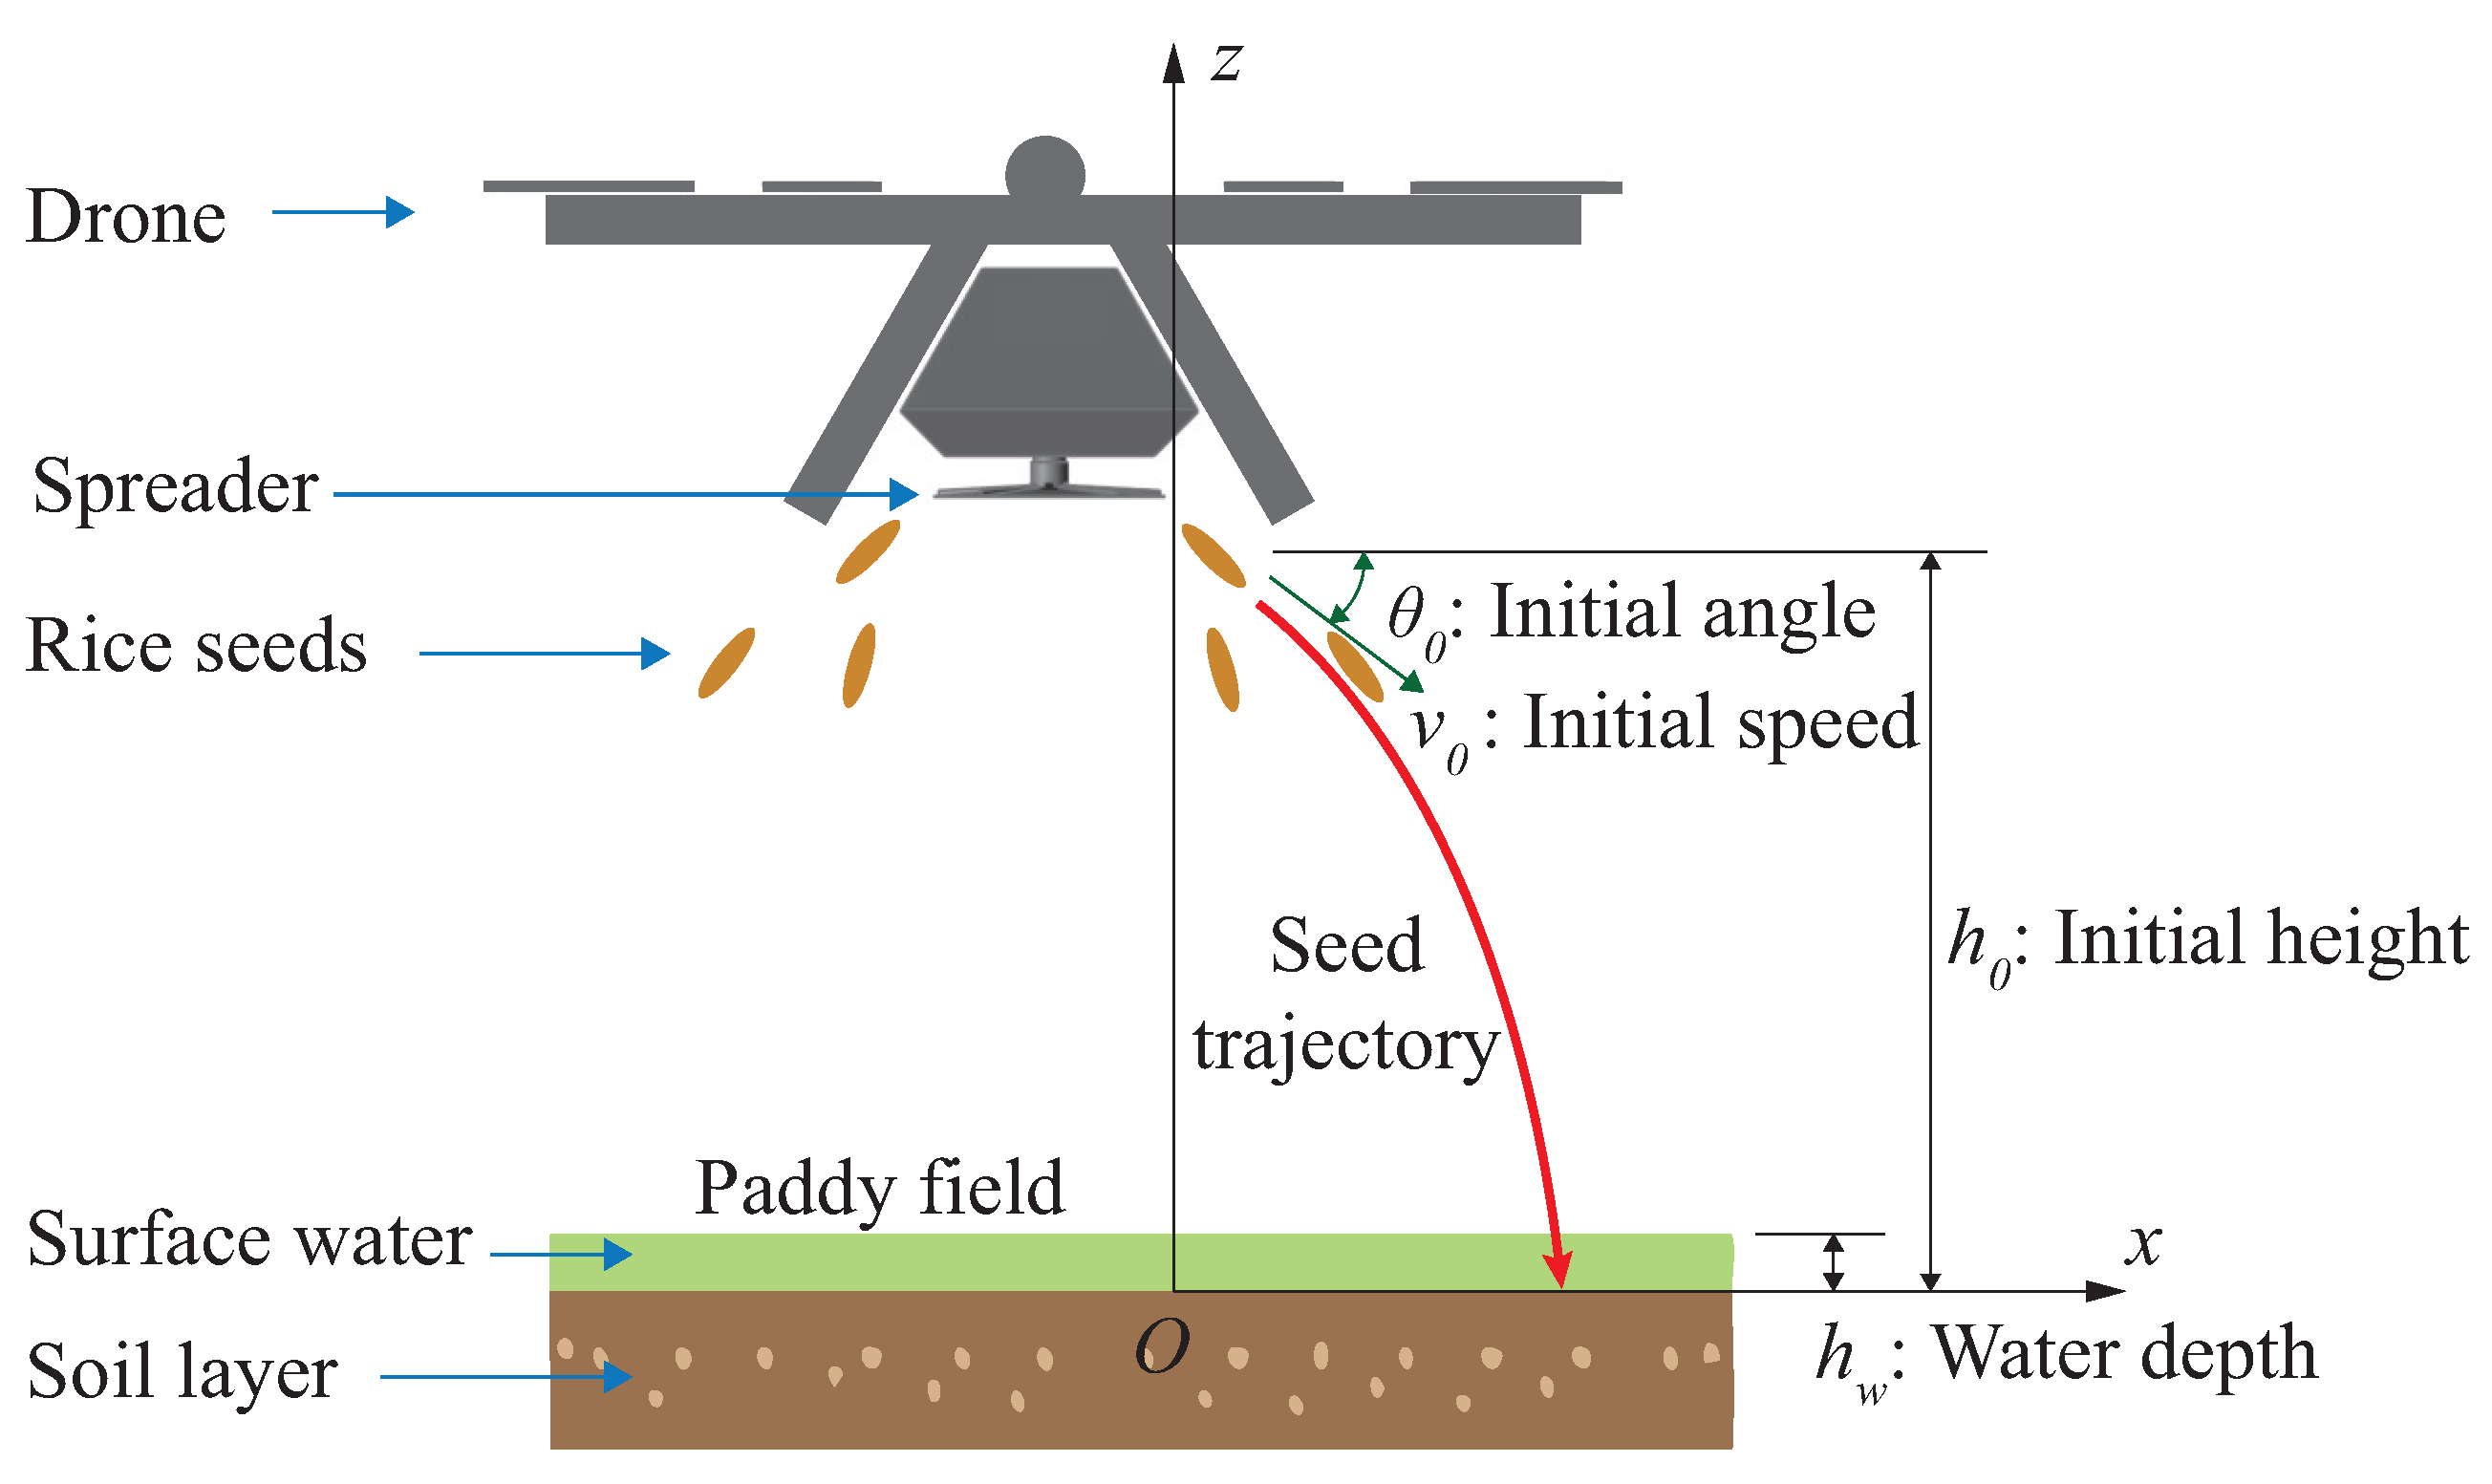
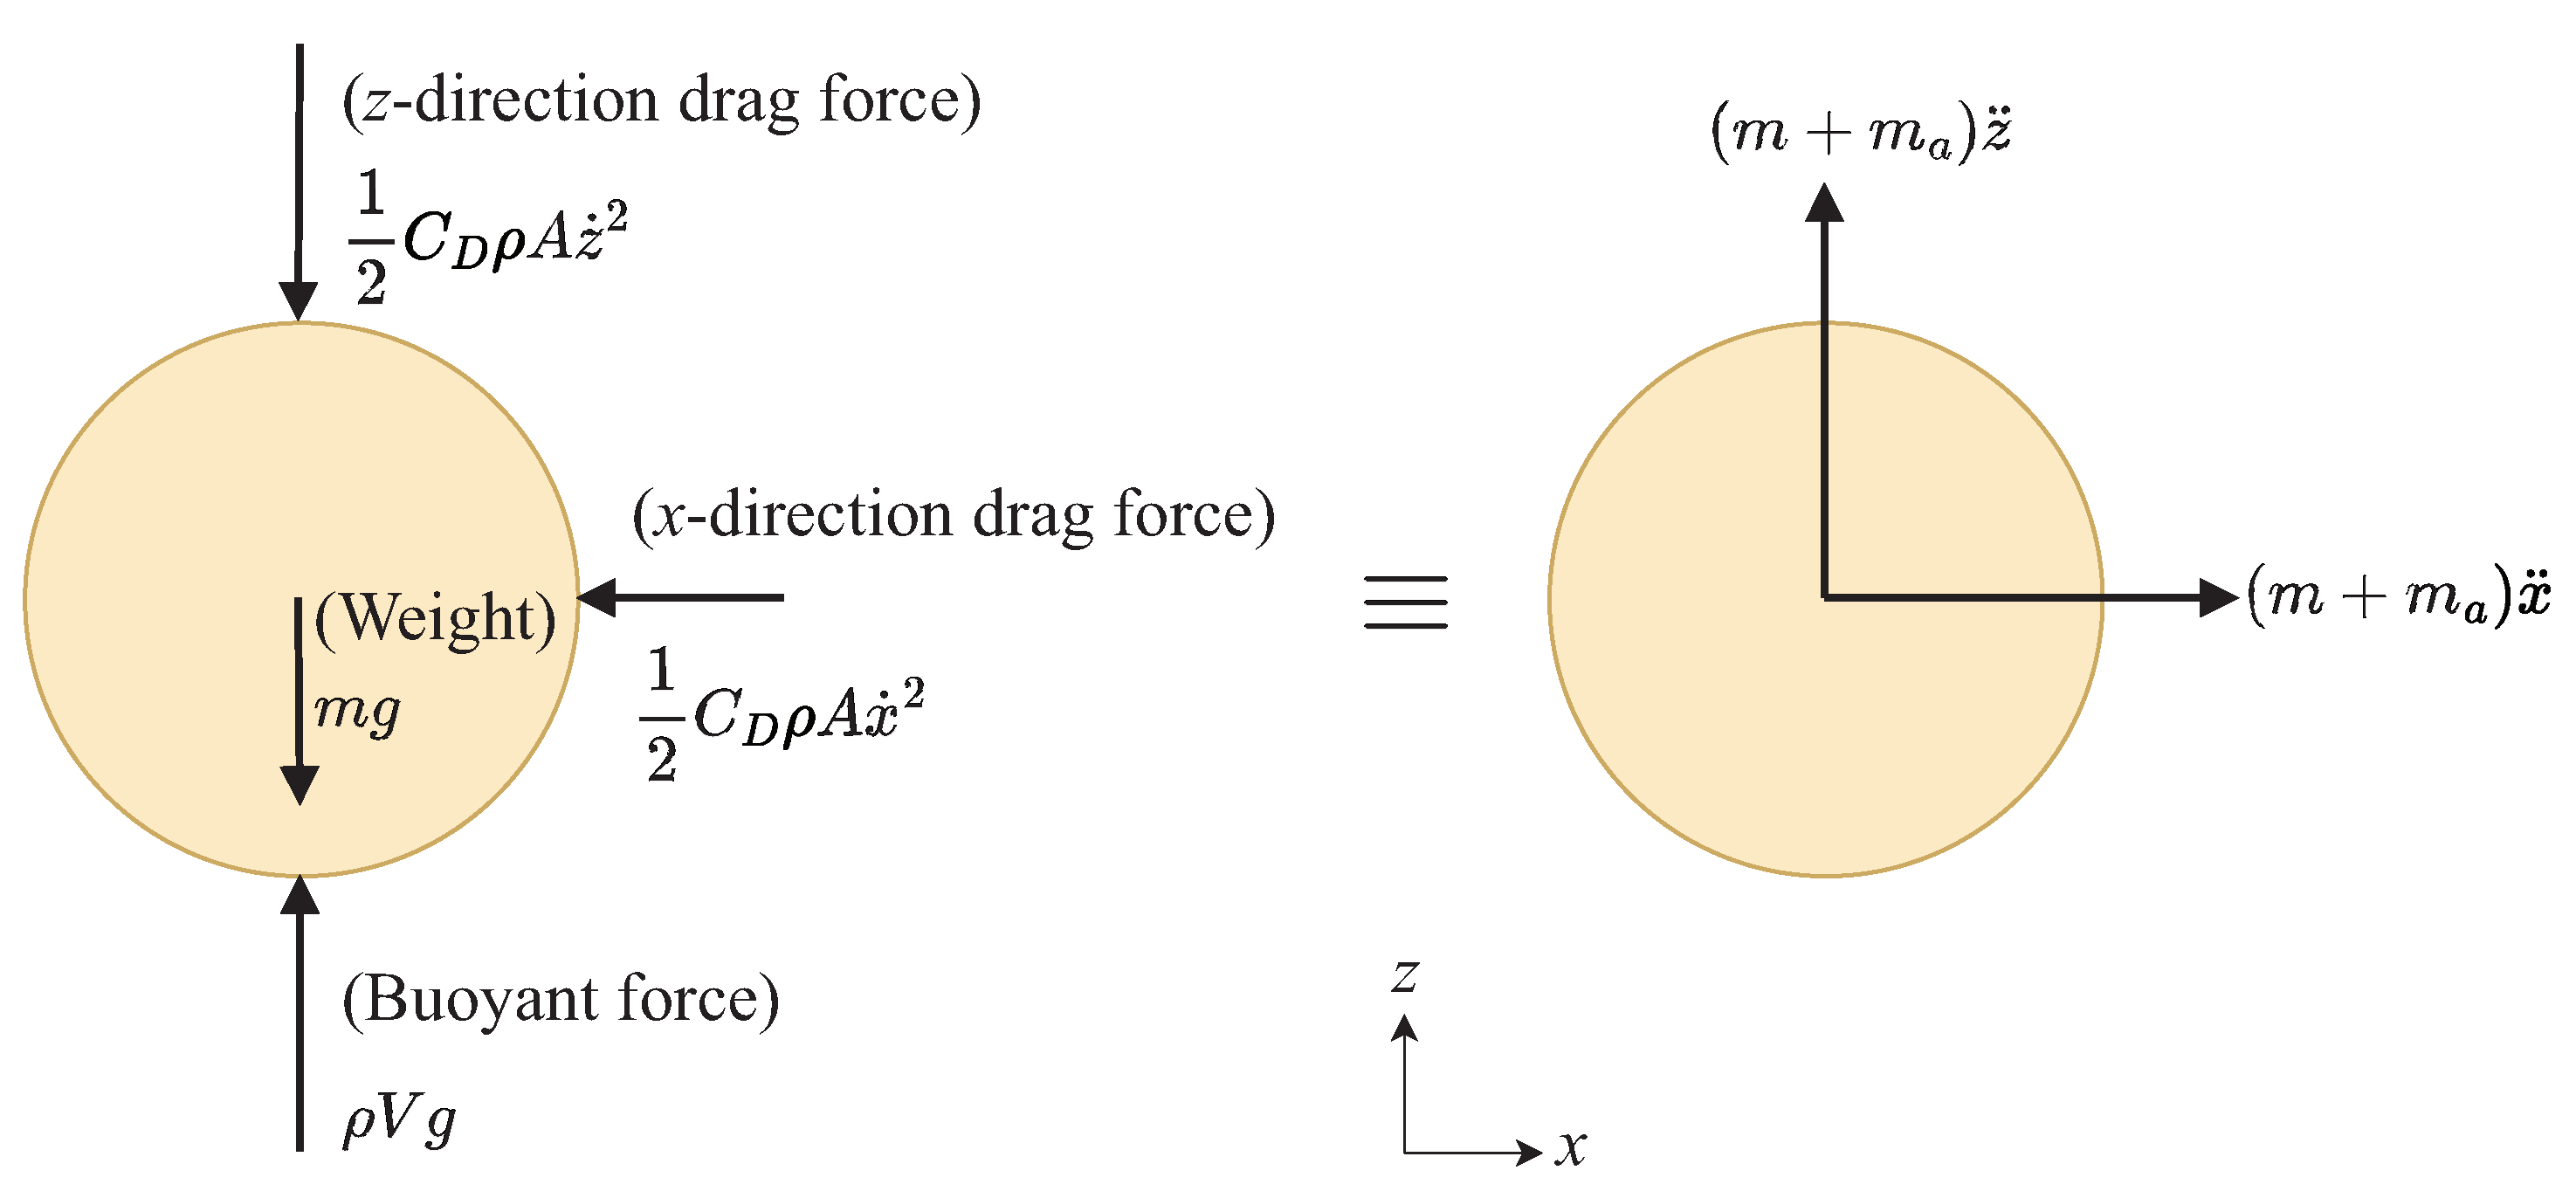
2.1. Dynamics of Rice Seed Flight

In this study, the shape of the rice seed used for DEM simulation was depicted as a prolate spheroid with dimensions of 9.0 mm length and 2.1 mm thickness, and these were based on measurements of the 11 rice grains reported in [19]. To determine the flight dynamics of the rice seed, its equations of motion incorporated the external forces of gravity and the drag force resulting from the viscosity of fluids such as air and paddy water. The hydrodynamic drag coefficient, which is influenced by the orientation of the spheroid in relation to the upstream flow velocity, generally decreases in a non-linear fashion as the characteristic contact area reduces [20,21,22]. In this study, a spherical, instead of an ellipsoid, model with the same volume was used for calculating the drag force. This simplification was chosen because the aerodynamic modeling of an ellipsoid requires accounting for complexities such as angular velocity, strike angle, and fluid interactions. Since the analysis of flight dynamics solely focused on determining the two-degree-of-freedom trajectory and velocity of the seed, the volume-equivalent sphere model was selected to reduce computational demands while maintaining accuracy. Adopting a full six-degree-of-freedom model that considers rotational effects and fluid interactions would not be feasible and is beyond the scope of this study. As a result, although the seed–soil interparticle interactions in DEM were modeled using the spheroid shape, the hydrodynamic drag was evaluated based on a sphere with an equivalent volume diameter of 3.1 mm.
Figure 1 illustrates the trajectory of the rice seeds from the UAV when spreading to the impact of the soil bed, along with the global coordinate system that was used for dynamic analysis. The  x y -plane represents the surface of the paddy field, with the z-direction perpendicular to the ground. Here, v 0 and θ 0 denote the initial launching velocity and angle, respectively, placing the rice seed trajectory in the z x plane.
Figure 2 illustrates the dynamic force equilibrium of a rice seed as it descends freely after being released from the UAV, including both a free-body diagram and a schematic diagram. The free-body diagram details the forces exerted on the seed, such as its weight, buoyancy, and drag force. In the schematic diagram, the inertial force components take into account not only the seed’s own inertia, but also the added mass effect. This effect arises as the seed moves through the fluid, displacing the surrounding medium and incorporating the inertia of the displaced fluid into the overall dynamics of the seed.
The equations of motion for the rice seed in the vertical and horizontal directions during falling are expressed as nonlinear ordinary differential equations (ODEs):
m + m a z ¨ + 1 2 C D ρ A z ˙ 2 ρ V g + m g = 0 ,
m + m a x ¨ + 1 2 C D ρ A x ˙ 2 = 0 ,
where z and x represent the position components of the rice seed in the global coordinate system. The double- and single-dot operators over the position components indicate the second and first derivatives with respect to time, respectively. Additionally, in Equations (1) and (2), m is the mass of the rice seed, m a is the added mass, C D is the drag coefficient, ρ is the mass density of the surrounding fluid, A = π R 2 represents the projection area with R being the radius of the sphere, V is the volume of a rice seed, and  g = 9.81 m / s 2 is the standard gravitational acceleration. The term involving the first-order derivative in Equations (1) and (2) corresponds to the drag force. The third term in Equation (1) represents the buoyant force, which can be neglected in the air domain. It is important to mention that the influences of the wind and paddy water flow on the falling rice seed were excluded from the motion equations to simplify the mathematical modeling and ensure numerical feasibility.
From a differential equation perspective, the non-linearity of Equations (1) and (2) arises not only because the drag force is proportional to the square of the velocity, but also because the drag coefficient is not constant and is instead a non-linear function of the particle Reynolds number, which is defined as follows:
R e = 2 ρ u R μ ,
where u represents the velocity of the fluid upstream relative to the sphere and μ denotes the dynamic viscosity of the fluid. The drag coefficient model used in this investigation, which was proposed by [23], was chosen because it is applicable to a wide range of particle Reynolds numbers that encompass both laminar and turbulent flow regimes, specifically 0.01 < R e < 200,000:
C D = 24 R e + 0.44 .
The drag coefficient is determined by fixing a solid body in a wind tunnel or similar apparatus, then measuring the resistance force exerted by the fluid flow using a load cell. However, the rice direct seeding problem of the UAV involves a spherical body moving through a stagnant fluid. In this situation, the fluid is displaced by the moving spherical body, requiring the inclusion of an additional inertial force to accelerate the originally stagnant fluid, referred to as the added mass effect [24]. This phenomenon is referred to in this way because the coefficient of the second derivative term in the motion equations, i.e., Equations (1) and (2), is represented by adding m a to m. The added mass m a for a spherical body can be expressed as follows [25]:
m a = 1 2 ρ V .
The properties of air and paddy water used to establish equations of motion through Equations (1) and (2) for a rice seed that was assumed to be a sphere are summarized in Table 1. For the international standard atmosphere, the density and viscosity of the air is 1.225  kg / m 3 and 1.790 × 10 5 Pa · s , respectively [26]. In the paddy water domain, the material properties of a thin mud sample taken from a paddy field with a water content of 645.78% and a density of 1090 kg / m 3 were adopted from [27]. The paddy water exhibited Newtonian flow behavior, with a dynamic viscosity of 1.06 × 10 2 Pa · s according to rheometer measurements.
To solve these differential equations, the initial conditions were given by z ˙ 0 = v 0 sin ( θ 0 ) and x ˙ 0 = v 0 cos ( θ 0 ) , with the initial positions being z 0 = h 0 and x 0 = 0 . The specific initial conditions for this numerical analysis were sourced from a review of the existing literature on UAV direct seeding experiments. Studies have concentrated on improving conditions for rice seed distribution [28,29,30]. In particular, the research conducted by Wu et al. in [28] offers essential information on the speed and orientation of the centrifugal spreading method. According to their findings, optimal conditions for maximum spreading uniformity are achieved with a UAV altitude of 2.1 m, a flight speed of 2 m/s, and a spreader baffle ring angle of 26°. The regression model derived from the data analysis indicates that, under these conditions, the relative velocity of rice seeds leaving the spreader is 0.63 m/s horizontally and 0.96 m/s vertically. Considering the UAV’s speed, the absolute horizontal velocity component ranges from 1.37 to 2.63 m/s. This corresponds to an initial velocity v 0 = 2.79 m/s and an angle θ 0 = 18.9 ° for the maximum launch speed.
Regarding alternative seeding methodologies, the initial launch speeds for deploying the seed UAVs were derived from the research conducted by Lysych et al. [15] on the design of the seeding mechanism. For rice seeds released by the gravitational drop method, the vertical relative velocity with respect to the UAV is 0 m/s. When propelled using airflow, the relative vertical velocity is 18 m/s. In the case of pneumatic discharge, this relative speed can increase to 75 m/s. During pneumatic shooting, the seeds reach an average relative velocity of 225 m/s, with values ranging from 150 to 300 m/s, as reported in [31]. Pneumatic shooting, a term newly introduced in this study, describes the notably increased launch speed in relation to standard pneumatic discharge. A comprehensive summary of the absolute launch velocities and angles, incorporating both the relative discharge velocities and the horizontal speed of the UAV of 2 m/s for these five methods, is provided in Table 2.
Taking into account the variety in the launch velocity of rice seeds upon their release from the UAV, it was found that the Reynolds number of particles varied between 424 R e 47,734 in air and 638 R e 71,724 in water for the five sowing approaches, as detailed in Table 2. These Reynolds numbers fell within both the intermediate range ( 1 < R e < 1000 ) and the turbulent regime ( R e > 1000 ), where inertial forces took precedence over the laminar regime ( R e < 1 ) [21]. As a result, the drag force model described in Equation (4), which is applicable for 0.01 < R e < 200,000, was clearly appropriate for the five seeding approaches analyzed in this research.
To improve the rice growth and yield, it is recommended to maintain the paddy water level at approximately 9 cm during sowing [32,33]. Therefore, for analyzing the flight dynamics of rice seeds sown from a UAV, the initial position conditions were set at a depth of 9 cm from the soil bed to the surface of the paddy water and a height of 2.1 m from the surface of the water to the UAV. This yields an initial height of h 0 = 2.19 m. Consequently, in the calculations of added mass, drag force, and buoyant force in Equations (1) and (2), the properties of the fluid were chosen based on the position of the rice seed, and the properties of the air or paddy water were selected accordingly. It should be noted that the added mass effect and buoyant force were not significant in the air region because the density of air is more than 800 times less than that of paddy water.
To solve the set of non-linear ODEs with the specified initial conditions and material properties, an in-house code was developed using the built-in ODE solver function ode23 in MATLAB version 2023a (developed by MathWorks, Inc. in Natick, MI, USA). The ode23 function implements the Bogacki–Shampine numerical integration scheme [34,35], which is based on an adaptive step size algorithm tthat is suitable for non-stiff problems like the free fall scenario analyzed in this study. Table 3 provides the calculated results for the terminal velocity and impact angle based on the initial conditions of the rice seed in the five different sowing mechanisms that are detailed in Table 2. These findings served as impact velocity conditions for performing the DEM simulations of the rice seed penetration that is described in Section 3.
Figure 3 exemplifies the calculated trajectory and velocity–time graphs of the rice seed that were obtained from the numerical integration of the non-linear ODE for the centrifugal spreading case among the five sowing methods. In Figure 3b, the path traced by rice seeds released from the UAV is shown, facilitating the estimation of the horizontal distance from the point of release to the point of landing in the paddy field. In this centrifugal spreading model, the rice seed covers an extra horizontal distance of 2.7 m in the UAV’s forward direction prior to reaching the field. Furthermore, when entering paddy water from the air, the velocity of the rice seed significantly decreases as a result of the higher viscosity of the water, as shown in Figure 3b.

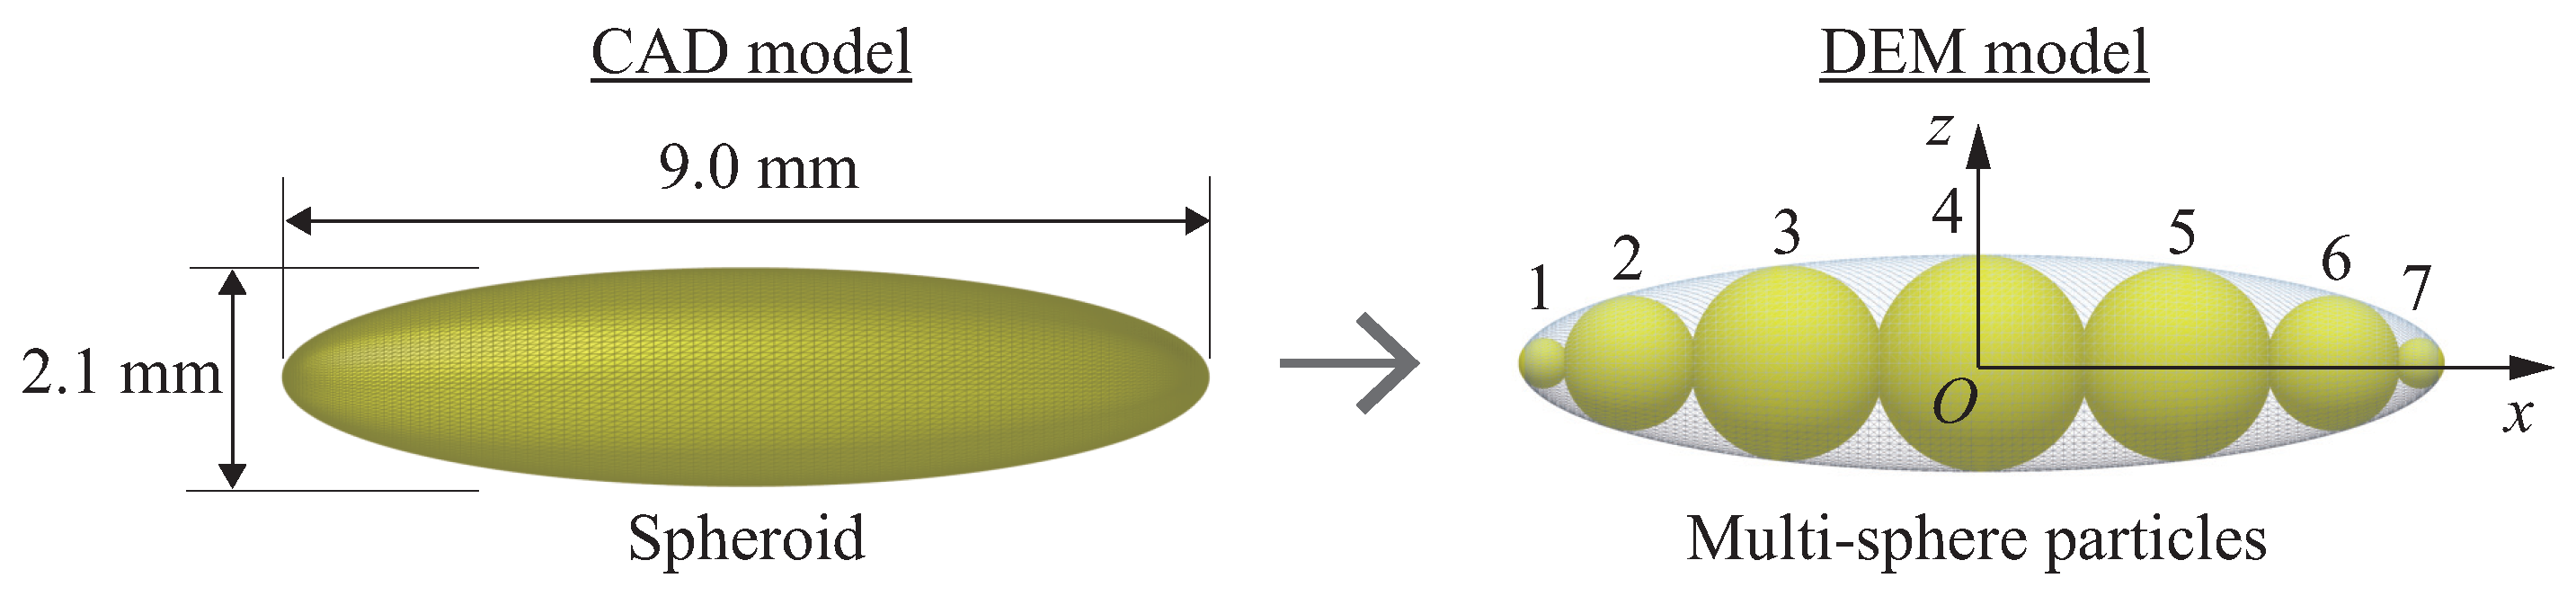
2.2. Contact Model and Parameters

In DEM analyses of the cohesive soils, the Hertz–Mindlin (HM) model combined with the Johnson–Kendall–Roberts (JKR) cohesion model has been extensively used [36,37,38,39,40]. The HM model is a contact model without cohesion that effectively and precisely characterizes the non-linear viscoelastic behavior of particle rheology through material constants and only a few parameters. The JKR model complements the cohesionless Hertz–Mindlin model by incorporating the cohesive forces between particles caused by moisture in fine powders or muddy soils. This paper provides a concise summary of the mathematical expressions of the contact models instead of presenting the entire formulation process for DEM equations of motion and contact models. This approach helps the reader understand the impact of the model parameters on particle behavior. In particular, this section presents excerpts from the previous paper of the author of [41], where the theory of contact models is introduced based on a review of the literature of references, such as [42,43,44,45] for the HM model and [46,47,48] for the JKR model.
Figure 4 illustrates a schematic of the contact condition between two spherical particles i and j, showing a normal overlap δ on the circular contact surface with a contact radius, which is denoted as a.
The Hertz–Mindlin model with JKR cohesion encompasses a Hertzian elastic force F n e , a viscous force F n v , and a JKR cohesive force F n c acting along the normal direction n ^ . In the tangential direction t ^ , as a cohesionless model, only the elastic force F t e and the viscous force F t v of the Mindlin elastic–viscous model were taken into account. In the equations provided in this paper, the boldface denotes vector quantities, while the italicized characters represent scalar quantities. A hat on a vector signifies a unit-directional vector with a magnitude of one. Each of the contact force components can be explicitly expressed in the following forms:
F n e = 4 3 R eq E eq 2 δ n 3 2 n ^ ,
F n v = 20 3 ln e ln 2 e + π 2 m eq 2 R eq E eq 2 δ n 1 4 v rel · n ^ n ^ ,
F n c = 4 π γ E eq a 3 2 n ^ ,
F t e = 8 R eq G eq 2 δ n δ t t ^ ,
F t v = 80 3 ln e ln 2 e + π 2 m eq 2 R eq G eq 2 δ n 1 4 v rel · t ^ t ^ ,
where R eq is the equivalent particle radius, E eq is the equivalent modulus of elasticity, δ n is the normal contract overlap distance, e is the coefficient of restitution, m eq is the equivalent particle mass, v rel is the relative velocity at the contact point, · is the vector inner product operator, γ is the cohesive surface energy, a is the contact radius, G eq is the equivalent shear elastic modulus, and δ t is the accumulated tangential displacement during contact. The equivalent properties, which are denoted by the subscript eq, are expressed based on the individual properties of the particles i and j when they are in contact:
R eq = 1 R i + 1 R j 1 ,
m eq = 1 m i + 1 m j 1 ,
E eq = 1 ν i 2 E i + 1 ν j 2 E j 1 ,
G eq = 2 ν i G i + 2 ν j G j 1 ,
where ν is the Possion’s ratio.
In addition to the forces related to the translational motion expressed in Equations (6) through (10), the rolling friction M r associated with rotational motion is modeled in the following simple form:
M r = μ r F n R ω ,
where μ r is the coefficient of rolling friction, F n the magnitude of resultant contact normal force, and ω is the particle relative angular velocity vector.
Simulating the bulk volume of systems with fine particles, such as soil or powder, becomes computationally infeasible with DEM if the particles are modeled at their actual size because of the sheer number of particles involved. To address this, DEM often uses an up-scaling approach, in which particle sizes are increased to reduce the number of particles and to improve computational efficiency to a feasible level [36]. This approach involves adjusting the contact model parameters to ensure that the behavior of the scaled-up particles closely mimics that of the original system of particles. A common theoretical approach to adjust the constants of the model, even when the size of the particle is modified, is the principle of similarity [49,50], which is achieved using the dimensionless parameters widely used in fluid dynamics analysis. However, the theoretical principle of similarity increases the structural geometry and computational domain in proportion to the particle size without reducing the number of particles to be computed. Consequently, this method does not offer any computational cost efficiency. Therefore, in DEM simulations of bulk soil, calibration techniques that effectively reduce computational burden are preferred over the principle of similarity. In bulk particle simulations based on the parameter calibration approach, the DEM particle size is initially determined considering both computational load and accuracy. The material properties such as density, Poisson’s ratio, and modulus of elasticity are typically kept at their original values. However, other parameters of the contact model, such as friction coefficients and cohesion model parameters, are calibrated against the experimental results of soil characterization tests, such as the slump test [36,38], the penetration test [51], and the measurement of the angle of repose [37].
In this research, rather than performing soil characterization tests and calibrating contact model parameters first hand, material properties and contact model parameters from previous publications were used for simulations. In particular, the properties of the rice seed material and the parameters of the contact model were obtained from [19], which also provided shape information. Figure 5 illustrates the CAD (computer-aided design) geometry along with its multi-sphere model for DEM analysis. Initially, rice grain was represented in CAD as a spheroid, which is characterized by a semi-major axis of 4.5 mm and a semi-minor axis of 1.05 mm. Subsequently, this spheroid was discretized into a configuration of seven spherical particles, as shown in Figure 5, with the x-directional position and radius of each sphere detailed in Table 4. The variability in the size of the rice seeds affected their aerodynamic characteristics and ability to penetrate the soil, as these depend on variations in mass, drag force, and impact resistance. However, in this study, the velocities at which the seeds were discharged from the UAVs surpassed the expected variability range of seed sizes. Given this study’s relatively low sensitivity to seed size variation, the statistical distribution of rice seed sizes was omitted from the simulations.
It is important to note that if the soil particles are larger than the rice seed, the rice seed could easily penetrate the interstitial spaces between the soil particles, which would reduce the reliability of the penetration simulation results. Consequently, in this DEM analysis, a soil particle size of 0.5 mm was chosen, which is less than half of the semi-minor axis of 1.05 mm of the spheroidal rice model, as shown in Figure 5. The material constants and contact model parameters for the paddy soil were determined by referring to [36,37,38,39,40,52,53,54,55]. Specifically, the parameters required for DEM simulations were extracted from [55], except for the surface energy for the JKR cohesion. The surface energy of the soil particles was taken from [37], which describes DEM simulations on soil particles to assess the angle of repose through a steepest ascent test. Since, to the best of the author’s knowledge, no existing publications have provided DEM calibration constants for the contact interaction between rice grain and soil, this study assumed that these constants were the mean values of the two materials. In DEM simulations, the computational domain of the paddy field cannot be infinitely expanded. This requires selecting a limited computational region and specifying boundary walls to contain the particles. The contact parameters between these boundary walls and the soil particles were set to be the same as those for soil–soil interactions. The characteristics of the materials and the contact model parameters relevant to DEM calculations for rice and soil are detailed in Table 5 and Table 6, respectively.

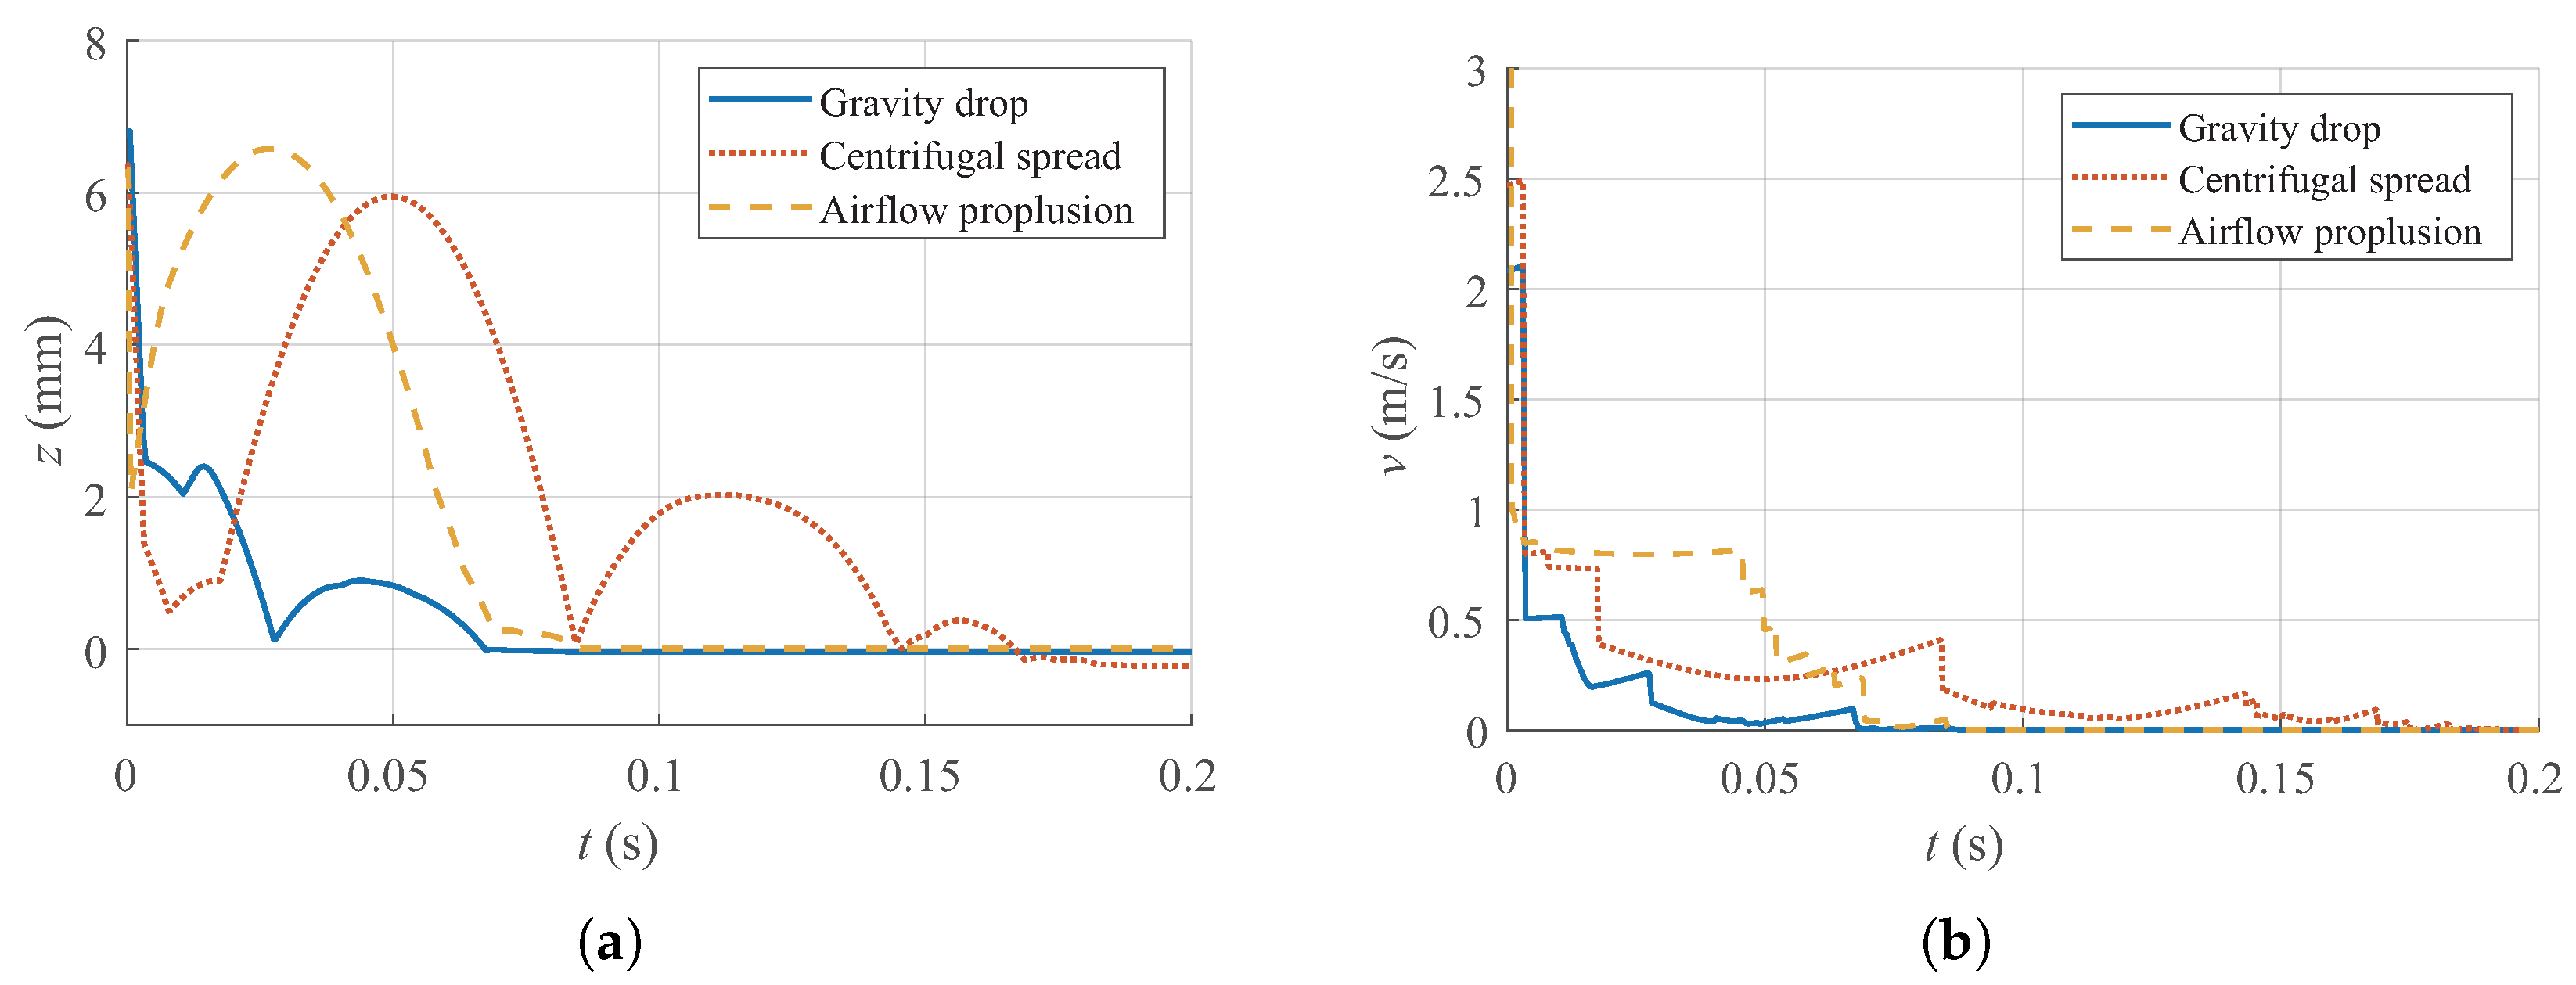
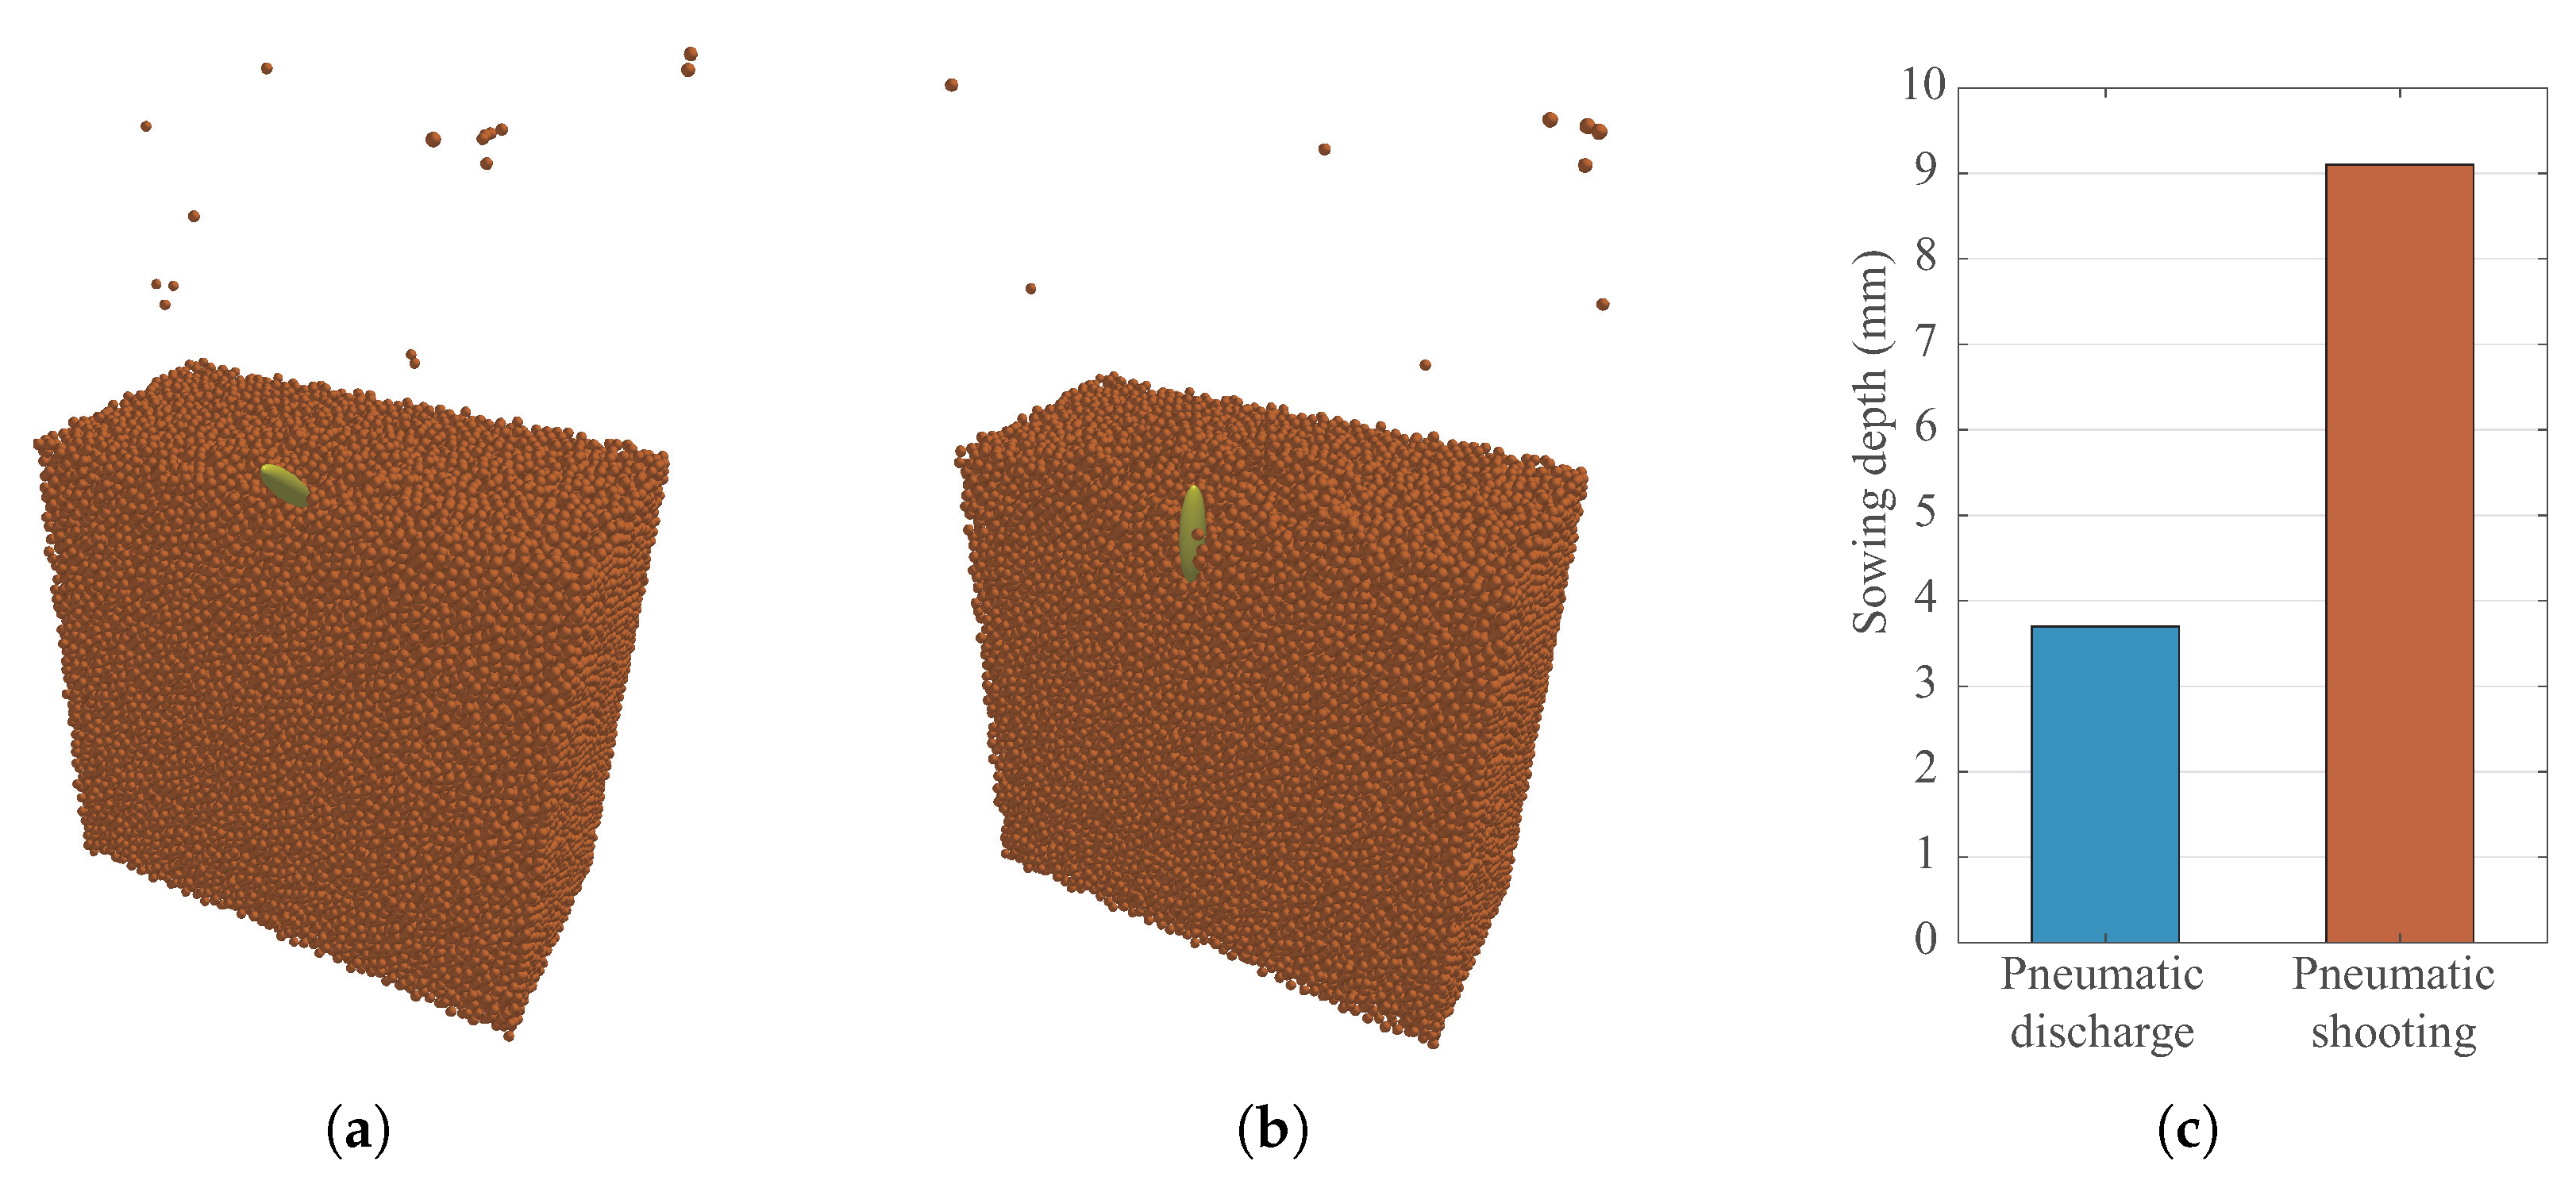
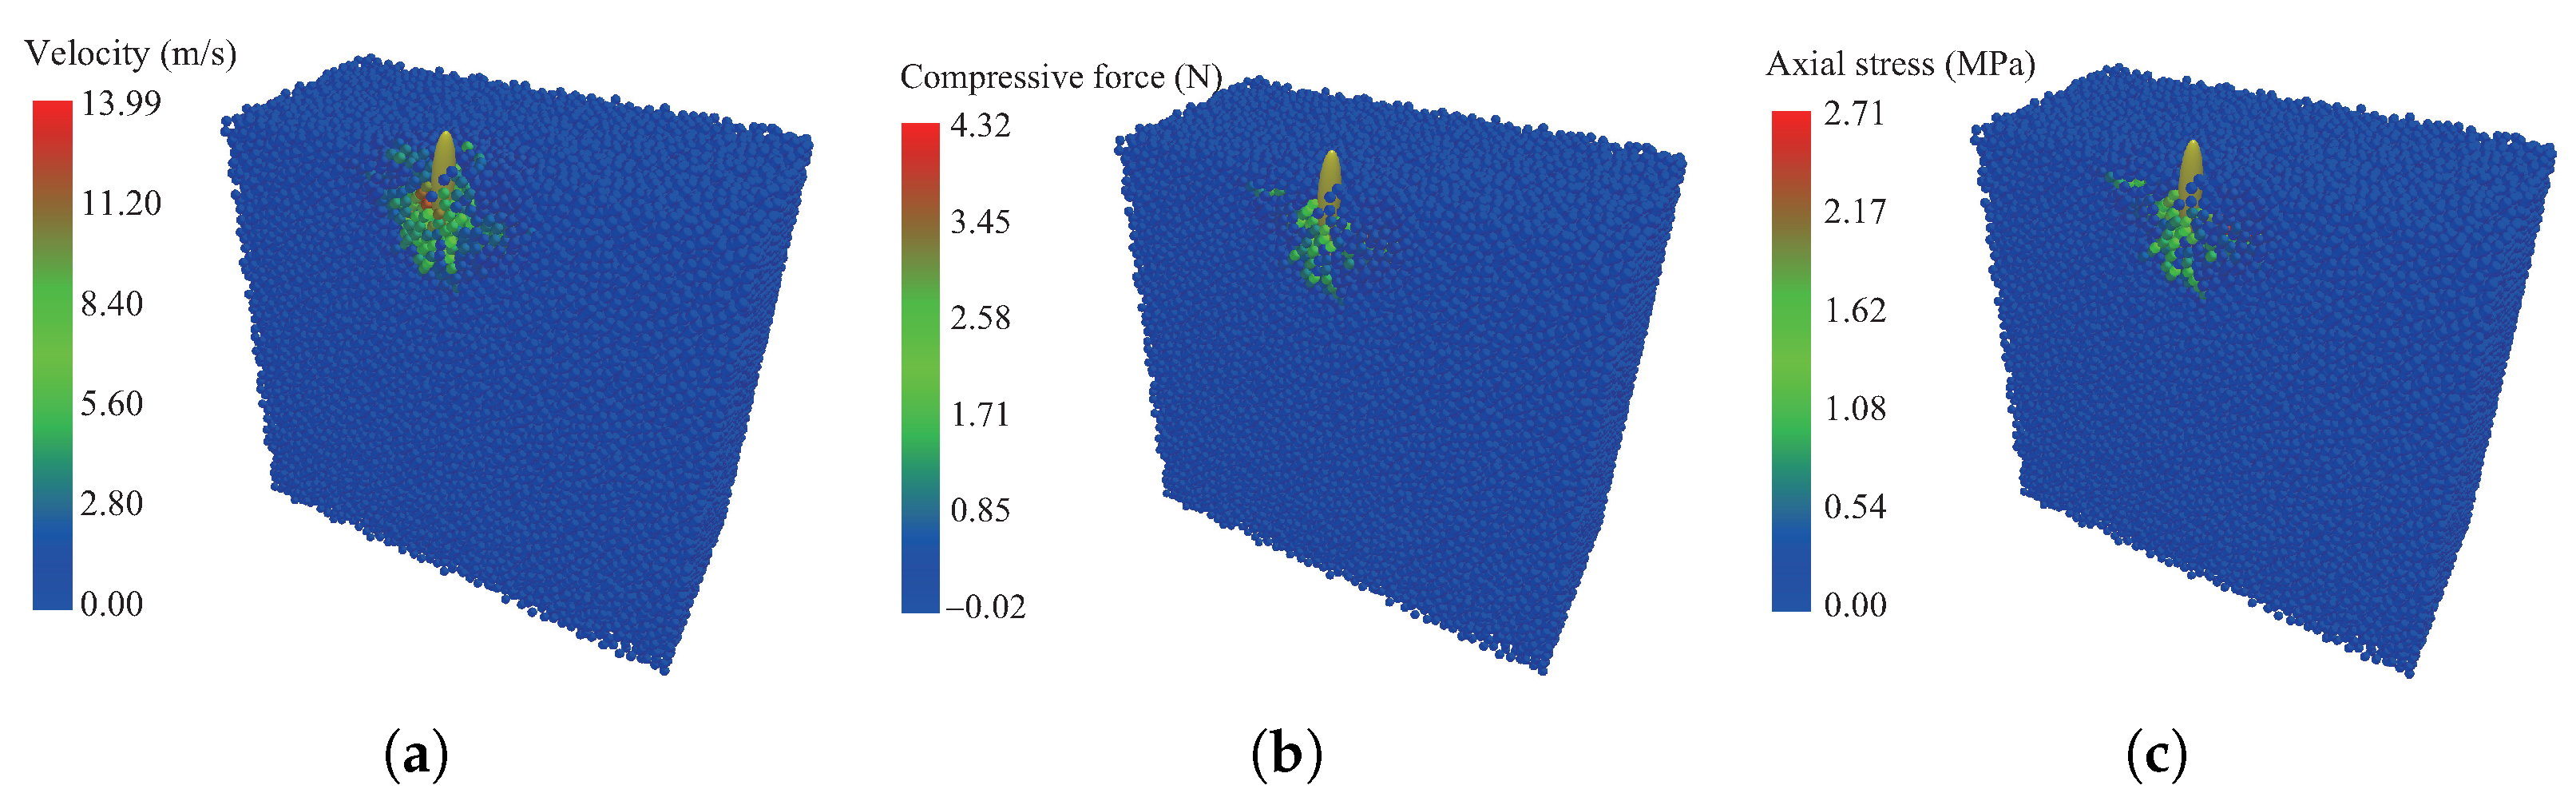
3. DEM Simulation Results and Discussion

This research used the commercial software Altair® EDEM™ (version 2022.2 by Altair Engineering Inc. in Troy, MI, USA) to perform DEM simulations of the penetration of drone-seeded rice into paddy soil. A soil bed was created in the shape of a cube, each side measuring 50 mm and containing 239,390 spherical cohesive soil particles. The soil bed featured a box-shaped boundary, where the top walls were open (rising 30 mm above the surface of the particles) and the overall height was 80 mm. The contact model parameters for the interaction between the walls and the soil particles were set to match those of the soil particles. This configuration was chosen to mimic the boundary conditions that represent interactions with an infinite expanse of soil beyond the walls. The coordinate system used adhered to that described in Section 2.1, placing the upper surface of the soil bed at z = 0.
The DEM simulation started by creating and launching a single rice seed, which is illustrated as an assemblage of spheres in Figure 5, above the soil particle bed. In every simulation run, the impact velocity and orientation initial conditions were specified for five distinct sowing device types, as detailed in Table 3. To ensure that the seeds hit the center of the soil bed surface, the virtual outlet surface was adjusted for each sowing method. However, the DEM simulations did not account for the hydrodynamic drag effects of the water present on the soil surface. It is important to note that the rice seed can bounce after impact and collide with the boundary walls of the soil bed. As hydrodynamic effects were ignored and boundary walls were considered, the motion of the rice seed, if it rebounds rather than penetrates, differs from the real-world behavior observed in a semi-infinite soil field with surface water. However, the objective of this study was to evaluate the penetration depth of the rice seed in the soil bed for various UAV sowing methods. Although there may be inaccuracies in predicting the dynamics of the bouncing seed, the simulations provided meaningful insights into scenarios where the penetration depth was zero, offering valuable information for assessing the effectiveness of different sowing methods.
The results of the DEM simulations for the sowing of rice based on UAVs demonstrate that, except for the two pneumatic techniques, the rice seeds remained on the surface of the soil rather than embedded in the soil. Sowing techniques are classified, based on their ability to penetrate soil, into two categories: one that does not penetrate the soil and another that successfully inserts seeds into the paddy soil. Figure 6 presents graphs that show time-dependent changes in the z component of the seed position and the velocity magnitude for scenarios without penetration, including gravitational drop, centrifugal spread, and airflow propulsion. As shown in Figure 6a, the gravitational drop technique, which was characterized by the lowest initial terminal velocity, resulted in the lowest rebound height and the shortest time for the rice seed to settle on the surface of the paddy soil. For alternative techniques like centrifugal spreading and airflow propulsion that employ greater initial speeds, rice seeds tend to reach greater bouncing heights and have marginally longer settling durations. Figure 6b illustrates the temporal evolution of the velocity of the rice seed, emphasizing a prevalent pattern: during the seed’s initial contact with the soil substrate, a large fraction of its momentum is lost. This finding indicates considerable energy dissipation during the first impact with cohesive soil, regardless of the particular sowing technique used.
Figure 7 illustrates images that were obtained from the post-processing phase of the DEM simulation regarding the gravitational drop sowing method. This simulation, which was characterized by a terminal velocity of 2.08 m/s and an impact angle of 49.1°, presented results in three distinct time intervals of 0 s, 0.05 s, and 0.1 s. In the context of the DEM simulation, the rice seed was represented using a multi-sphere model, as illustrated in Figure 4b. However, for post-processing and visualization purposes, the rice seeds were depicted in the form of a spheroid, as shown in Figure 4a. The images in Figure 7 demonstrate that the rice seeds did not penetrate the soil bed due to their low terminal velocity. Moreover, the minimal impact energy resulted in insignificant deformation of the soil bed, indicating that the cohesive structure of the soil largely remained unchanged throughout the simulation. This underscores the limited interaction between the rice seeds and soil bed when using the gravitational drop method.
Figure 8 presents the graphics obtained from the DEM simulations of the centrifugal spreading method, which was characterized by a terminal velocity of 2.47 m/s and an impact angle of 42.3°, as observed in the three distinct time instances of 0 s, 0.1 s, and 0.2 s. The centrifugal seeding method involves a higher horizontal velocity component of the seed than the gravitational drop technique. This leads to a more significant horizontal displacement during the rebound phase when the seed is in contact with the soil bed. Figure 8c indicates that the seed is located near the edge of the soil bed. Without the boundary wall constraint, the seed would have moved out of the soil region, hindering its progression outside the simulation limits. Similarly to the results derived from the gravitational drop method in Figure 7, the seed did not penetrate and the soil bed did not show plastic deformation.
Figure 9 presents the post-processed images of the DEM simulation results for the airflow propulsion technique, which was characterized by a terminal velocity of 14.48 m/s and an impact angle of 83.7°. The images were post-processed in time instances of 0 s, 0.05 s, and 0.1 s. Although the impact velocity was higher than in the gravitational drop and centrifugal spreading scenarios, soil penetration was not detected. A notable difference in the airflow propulsion approach was the increased momentum of the rice seeds, which resulted in an observable crater-like indentation at the impact site, indicating a minor plastic deformation of the soil surface.
Unlike the gravitational drop, centrifugal spreading, and airflow propulsion methods previously discussed, seed penetration occurred with both pneumatic sowing techniques. Figure 10 presents time-dependent graphs that illustrate the vertical position and velocity of a rice seed for the pneumatic discharge and pneumatic shooting methods. Figure 10a depicts the vertical center of mass position of the seed. For both pneumatic techniques, the steady-state position reached values where z < 0 , which means a partial embedding of the seeds in the soil. This conclusion is consistent with the morphology and dimensions of the seeds, which is spheroid with a semi-minor axis of 1.05 mm and a semi-major axis of 4.5 mm. Moreover, the simulation results illustrated that none of the pneumatic techniques caused bouncing. The pneumatic shooting mechanism, due to its increased incident velocity, enabled deeper penetration. Figure 10b shows the time–velocity graphs for the rice seeds in the two pneumatic seeding scenarios. To capture the rapid changes in velocity just after the impact, followed by more gradual alterations, the time axis is represented on a logarithmic scale. The graph illustrates that a considerable amount of the seed’s momentum was almost immediately transferred to the soil particles upon impact, highlighting the dynamic interaction between the seed and the soil bed.
Figure 11 presents the post-processed graphics from the DEM simulation results for the pneumatic discharge method, which is defined by an impact velocity of 57.29 m/s and an incidence angle of 88.5 degrees, as observed at time intervals of 0 s, 0.01 s, and 0.02 s. Unlike the gravitational drop, centrifugal spreading, and airflow propulsion techniques, the pneumatic discharge method successfully achieved soil penetration. This penetration occurred because the seeds impacted the soil at a velocity at least five times greater than that provided by the airflow propulsion technique, imparting the necessary momentum to penetrate the soil bed. The high-speed impact caused a noticeable penetration effect in the soil, resulting in the scattering and displacement of soil particles at the site of contact. Visual inspection indicates that the rice seed was approximately half embedded in the ground, confirming successful penetration and highlighting significant performance differences between pneumatic ejection and other seeding methods.
Figure 12 presents the post-processed images that were derived from the DEM simulation results related to the pneumatic shooting technique. For this simulation, the initial conditions were defined by a pre-impact flight speed of 144.64 m/s and an incidence angle of 89.5°. This scenario represents the case with the highest sowing momentum among the five UAV seeding methods analyzed in this study. The images were analyzed at the same time points as those used in the pneumatic discharge case, as presented in Figure 11 (specifically at 0 s, 0.01 s, and 0.02 s). Unlike the results demonstrated in Figure 11, where the impact velocity exceeded 100 m/s, the pneumatic shooting technique revealed a significantly deeper vertical penetration depth, with the seeds maintaining a more direct trajectory during penetration. Sowing at a greater depth ensures that a substantial portion of the seeds is embedded in the soil, indicating that this pneumatic shooting method achieves superior penetration efficiency when compared to other evaluated sowing techniques.
Figure 13 offers a comprehensive qualitative and quantitative evaluation of the penetration depth results for the two pneumatic sowing techniques discussed above. Figure 13a,b display cross-sectional views of the soil bed along the z x plane, illustrating the rice grain embedded in the soil for the pneumatic discharge and pneumatic shooting methods, respectively. These visualizations enable a precise assessment of the depth of seed planing in the soil for each scenario. Figure 13c presents a quantitative measure of the penetration depth by determining the distance from the soil surface to the lowest point of the rice seed. The graph emphasizes the variation in penetration effectiveness between the two methods, demonstrating that the pneumatic shooting approach achieved a significantly higher depth when compared to the pneumatic discharge approach.
Figure 14 presents the distribution of the velocity and contact forces between particles within the soil bed 0.001 s after the impact of the rice seed in the pneumatic shooting case. After seed momentum was transferred, there was a noticeable increase in the velocity and contact forces in the soil particles that were proximate to the contact region, as shown in Figure 14a and Figure 14b, respectively. In addition, as shown in Figure 14b, negative compressive force values indicated the presence of tensile forces due to cohesion. Figure 14c illustrates the distribution of the axial stress derived from the component of normal contact force between the particles. This distribution mirrors the pattern observed in compressive forces when there is no cohesion between the particles.
The simulation results discussed in this section reveal that, of the UAV-based sowing techniques evaluated, the gravitational drop, centrifugal spread, and airflow propulsion methods led to seeds resting on the soil surface without penetrating it, while the two pneumatic methods enabled soil penetration. The effectiveness of the pneumatic approaches in planting seeds into the soil was due to the substantially greater seed momentum produced by these systems. However, the discharge rate of the pneumatic devices is relatively low, making them more suitable for seeding pelletized seeds of plants that require lower seeding densities.
The analysis underscores the essential influence of seed velocity and momentum in ensuring successful penetration. For increased efficiency in UAV-based seeding and proper seed embedding, it is advisable to increase the seed launch speed to at least 75 m/s while maintaining a robust discharge rate. Achieving this requires fine tuning the air pump’s efficiency and redesigning the air outlet to generate a more rapid jet stream. The findings obtained from the DEM simulations provide essential and quantitative insights for optimizing the design of UAV-mounted sowing devices. These insights highlight the importance of controlling the discharge rates and seed penetration efficiency to meet the diverse requirements of agricultural applications.

4. Conclusions

This study used numerical simulations to evaluate the effectiveness of UAV-mounted rice seed sowing techniques in paddy fields, focusing on the roles of spreading velocity and seed dynamics in achieving soil penetration. Among the five evaluated sowing methods, the pneumatic discharge and pneumatic shooting techniques proved effective in penetrating the seeds into the soil, with pneumatic shooting reaching the highest depth (which is attributable to its higher launch speed and momentum), whereas approaches such as gravitational drop, centrifugal spreading, and airflow propulsion left seeds resting on the soil surface due to insufficient impact energy. The results highlight the importance of adequate seed velocity and momentum for successful soil infiltration. To enhance UAV seeding systems, it is advised to refine airflow methods to attain seed launching velocities greater than 75 m/s, all the while preserving a practical discharge rate in contrast to current low-discharge-rate pneumatic approaches. This improvement can be realized through advances in air pump systems and nozzle designs.
In conclusion, the findings of this study suggest that using numerical simulation techniques for UAV seeding greatly improves the design and optimization of seed spreaders. By predicting seed penetration outcomes in various discharge scenarios, simulation-based methods enable engineers to more effectively refine UAV seeding systems, reducing the number of physical prototype iterations and accelerating the development process. This optimization not only reduces equipment production costs, but also improves planting efficiency, thereby ultimately increasing crop yield and advancing more sustainable agricultural practices.
Future research should target the limitations of this study, such as the lack of hydrodynamic effects from surface water and the possibility of seed rebound, to refine the accuracy of the DEM simulations. Furthermore, examining the interactions between the soil moisture, seed traits, and UAV operational parameters could advance the effectiveness and adaptability of UAV-based rice sowing methods. In addition, further research is needed to explore the implications of soil moisture levels and composition on the performance of UAV-assisted seeding. The moisture content in soil has a direct impact on its cohesion and resistance to collisions, while differences in mineral and organic composition alter mechanical features such as density and elasticity. Integrating these factors into DEM simulations would provide a more comprehensive understanding of UAV seeding performance across diverse soil conditions. Future research should also explore the non-technical aspects of UAV seeding, paying particular attention to its economic impact. As additional information on the efficiency of UAV seeding becomes available, economic analyses can assess its cost-effectiveness, labor-saving capabilities, and improvements in yield, thus aiding in the widespread commercial adoption of this technology in agriculture.

Funding

This research was supported by the Basic Science Research Program through the National Research Foundation of Korea (NRF), which is funded by the Ministry of Education (No. RS-2022-NR075787).

Institutional Review Board Statement

Not applicable.

Informed Consent Statement

Not applicable.

Data Availability Statement

The original contributions presented in this study are included in the article. Further inquiries can be directed to the corresponding author.

Conflicts of Interest

The author declares no conflicts of interest.

References

  1. Seck, P.A.; Diagne, A.; Mohanty, S.; Wopereis, M.C.S. Crops That Feed the World 7: Rice. Food Secur. 2012, 4, 7–24. [Google Scholar] [CrossRef]
  2. Wu, H.; Jin, R.; Liu, A.; Jiang, S.; Chai, L. Savings and Losses of Scarce Virtual Water in the International Trade of Wheat, Maize, and Rice. Int. J. Environ. Res. Public Health 2022, 19, 4119. [Google Scholar] [CrossRef]
  3. Neupane, D.; Adhikari, P.; Bhattarai, D.; Rana, B.; Ahmed, Z.; Sharma, U.; Adhikari, D. Does Climate Change Affect the Yield of the Top Three Cereals and Food Security in the World? Earth 2022, 3, 45–71. [Google Scholar] [CrossRef]
  4. Samal, P.; Babu, S.C.; Mondal, B.; Mishra, S.N. The Global Rice Agriculture towards 2050: An Inter-Continental Perspective. Outlook Agric. 2022, 51, 164–172. [Google Scholar] [CrossRef]
  5. Mohidem, N.A.; Hashim, N.; Shamsudin, R.; Che Man, H. Rice for Food Security: Revisiting Its Production, Diversity, Rice Milling Process and Nutrient Content. Agriculture 2022, 12, 741. [Google Scholar] [CrossRef]
  6. Zhao, W.; Chou, J.; Li, J.; Xu, Y.; Li, Y.; Hao, Y. Impacts of Extreme Climate Events on Future Rice Yields in Global Major Rice-Producing Regions. Int. J. Environ. Res. Public Health 2022, 19, 4437. [Google Scholar] [CrossRef] [PubMed]
  7. Rao, M.S.; Nagarjuna, D.; Murthy, K.R. Productivity and Profitability in Dry Direct Sown Rice through Mechanization. Int. J. Chem. Stud. 2021, 9, 17–20. [Google Scholar] [CrossRef]
  8. Bautista, A.P.; Mataia, A.; Austria, C.; Tiongco, M.; Laborte, A. Adoption and Performance of Direct-seeded Rice (DSR) Technology in the Philippines. Philipp. J. Sci. 2023, 152, 459–484. [Google Scholar] [CrossRef]
  9. Saha, R.; Patra, P.S.; Ahmed, A.S. Impact of Mechanical Transplanting on Rice Productivity and Profitability- Review. Int. J. Econ. Plants 2021, 8, 226–230. [Google Scholar] [CrossRef]
  10. Hossen, M.A.; Shahriyar, M.M.; Islam, S.; Paul, H.; Rahman, M.M. Rice Transplanting Mechanization in Bangladesh: Way to Make It Sustainable. Agric. Sci. 2022, 13, 130–149. [Google Scholar] [CrossRef]
  11. Cheema, M.J.M.; Nauman, M.H.; Ghafoor, A.; Farooque, A.A.; Haydar, Z.; Ashraf, M.U.; Awais, M. Direct Seeding of Basmati Rice through Improved Drills: Potential and Constraints in Pakistani Farm Settings. Appl. Eng. Agric. 2021, 37, 53–63. [Google Scholar] [CrossRef]
  12. Qi, P.; Wang, Z.; Wang, C.; Xu, L.; Jia, X.; Zhang, Y.; Wang, S.; Han, L.; Li, T.; Chen, B.; et al. Development of Multifunctional Unmanned Aerial Vehicles versus Ground Seeding and Outplanting: What Is More Effective for Improving the Growth and Quality of Rice Culture? Front. Plant Sci. 2022, 13, 953753. [Google Scholar] [CrossRef] [PubMed]
  13. Yang, Z.; Zhu, Y.; Zhang, X.; Liao, Q.; Fu, H.; Cheng, Q.; Chen, Z.; Sun, Y.; Ma, J.; Zhang, J.; et al. Unmanned Aerial Vehicle Direct Seeding or Integrated Mechanical Transplanting, Which Will Be the next Step for Mechanized Rice Production in China? —A Comparison Based on Energy Use Efficiency and Economic Benefits. Energy 2023, 273, 127223. [Google Scholar] [CrossRef]
  14. Liu, W.; Zou, S.; Xu, X.; Gu, Q.; He, W.; Huang, J.; Huang, J.; Lyu, Z.; Lin, J.; Zhou, Z.; et al. Development of UAV-based Shot Seeding Device for Rice Planting. Int. J. Agric. Biol. Eng. 2022, 15, 1–7. [Google Scholar] [CrossRef]
  15. Lysych, M.; Bukhtoyarov, L.; Druchinin, D. Design and Research Sowing Devices for Aerial Sowing of Forest Seeds with UAVs. Inventions 2021, 6, 83. [Google Scholar] [CrossRef]
  16. Kawamura, K.; Asai, H.; Yasuda, T.; Khanthavong, P.; Soisouvanh, P.; Phongchanmixay, S. Field Phenotyping of Plant Height in an Upland Rice Field in Laos Using Low-Cost Small Unmanned Aerial Vehicles (UAVs). Plant Prod. Sci. 2020, 23, 452–465. [Google Scholar] [CrossRef]
  17. Zuo, Q.; Kuai, J.; Zhao, L.; Hu, Z.; Wu, J.; Zhou, G. The Effect of Sowing Depth and Soil Compaction on the Growth and Yield of Rapeseed in Rice Straw Returning Field. Field Crop. Res. 2017, 203. [Google Scholar] [CrossRef]
  18. Yang, W.; Xu, D.; Li, S.; Tang, X.; Pan, S.; Chen, X.; Mo, Z. Emergence and Seedling Establishment of Rice Varieties at Different Sowing Depths. J. Plant Growth Regul. 2022, 41, 1672–1686. [Google Scholar] [CrossRef]
  19. Zhang, S.; Tekeste, M.Z.; Li, Y.; Gaul, A.; Zhu, D.; Liao, J. Scaled-up Rice Grain Modelling for DEM Calibration and the Validation of Hopper Flow. Biosyst. Eng. 2020, 194, 196–212. [Google Scholar] [CrossRef]
  20. Bagheri, G.; Bonadonna, C. On the Drag of Freely Falling Non-Spherical Particles. Powder Technol. 2016, 301, 526–544. [Google Scholar] [CrossRef]
  21. Sanjeevi, S.K.P.; Padding, J.T. On the Orientational Dependence of Drag Experienced by Spheroids. J. Fluid Mech. 2017, 820, R1. [Google Scholar] [CrossRef]
  22. Ouchene, R. Numerical Simulation and Modeling of the Hydrodynamic Forces and Torque Acting on Individual Oblate Spheroids. Phys. Fluids 2020, 32, 073303. [Google Scholar] [CrossRef]
  23. Goossens, W.R. Review of the Empirical Correlations for the Drag Coefficient of Rigid Spheres. Powder Technol. 2019, 352, 350–359. [Google Scholar] [CrossRef]
  24. Falkovich, G. Fluid Mechanics: A Short Course for Physicists; Cambridge University Press: New York, NY, USA, 2011. [Google Scholar] [CrossRef]
  25. Son, K.J. A Discrete Element Model for the Influence of Surfactants on Sedimentation Characteristics of Magnetorheological Fluids. Korea-Aust. Rheol. J. 2018, 30, 29–39. [Google Scholar] [CrossRef]
  26. Douglas, J.F.; Gasiorek, J.M.; Swaffield, J.A.; Jack, L.B. Fluid Mechanics, 5th ed.; Pearson: London, UK, 2005. [Google Scholar]
  27. Xie, Y.; Hong, Y.; Zhang, X.; Ren, J. Analysis of Mud Splashing Pattern of Paddy Field Blade Using Computational Fluid Dynamics. Comput. Electron. Agric. 2020, 176, 105639. [Google Scholar] [CrossRef]
  28. Wu, Z.; Li, M.; Lei, X.; Wu, Z.; Jiang, C.; Zhou, L.; Ma, R.; Chen, Y. Simulation and Parameter Optimisation of a Centrifugal Rice Seeding Spreader for a UAV. Biosyst. Eng. 2020, 192, 275–293. [Google Scholar] [CrossRef]
  29. Liu, W.; Zhou, Z.; Xu, X.; Gu, Q.; Zou, S.; He, W.; Luo, X.; Huang, J.; Lin, J.; Jiang, R. Evaluation Method of Rowing Performance and Its Optimization for UAV-based Shot Seeding Device on Rice Sowing. Comput. Electron. Agric. 2023, 207, 107718. [Google Scholar] [CrossRef]
  30. Zhijun, W.; Yu, C.; Shengcai, S.; Hao, D.; Xiaobing, L.; Lijia, X. Design and Experimental Analysis of Drone Rice Direct Seeding Device. J. Eng. Sci. Technol. Rev. 2023, 16, 132–139. [Google Scholar] [CrossRef]
  31. Mohan, M.; Richardson, G.; Gopan, G.; Aghai, M.M.; Bajaj, S.; Galgamuwa, G.A.P.; Vastaranta, M.; Arachchige, P.S.P.; Amorós, L.; Corte, A.P.D.; et al. UAV-Supported Forest Regeneration: Current Trends, Challenges and Implications. Remote Sens. 2021, 13, 2596. [Google Scholar] [CrossRef]
  32. Anbumozhi, V.; Yamaji, E.; Tabuchi, T. Rice Crop Growth and Yield as Influenced by Changes in Ponding Water Depth, Water Regime and Fertigation Level. Agric. Water Manag. 1998, 37, 241–253. [Google Scholar] [CrossRef]
  33. Sudhir-Yadav; Gill, G.; Humphreys, E.; Kukal, S.; Walia, U. Effect of Water Management on Dry Seeded and Puddled Transplanted Rice. Part 1: Crop Performance. Field Crop. Res. 2011, 120, 112–122. [Google Scholar] [CrossRef]
  34. Bogacki, P.; Shampine, L.F. A 3(2) Pair of Runge - Kutta Formulas. Appl. Math. Lett. 1989, 2, 321–325. [Google Scholar] [CrossRef]
  35. Son, K.J. Mathematical Modeling of Collisional Heat Generation and Convective Heat Transfer Problem for Single Spherical Body in Oscillating Boundaries. Mathematics 2023, 11, 4637. [Google Scholar] [CrossRef]
  36. Zhou, H.; Zhou, T.; Wang, X.; Hu, L.; Wang, S.; Luo, X.; Ji, J. Determination of Discrete Element Modelling Parameters of a Paddy Soil with a High Moisture Content (>40%). Agriculture 2022, 12, 2000. [Google Scholar] [CrossRef]
  37. Zhu, B.; Liu, J.; Chen, X.; Yu, J.; Liu, M.; Zhang, Q. Parameter Calibration of Soil in the Poyang Lake Region Based on Discrete Element Method. Am. J. Biochem. Biotechnol. 2020, 16, 538–548. [Google Scholar] [CrossRef]
  38. Tienan, Z.; Zhou, H.; Ji, J.; Sun, F.; Qin, Z. Parameter Calibration of the Discrete Element Simulation Model for Soaking Paddy Loam Soil Based on the Slump Test. PLoS ONE 2023, 18, e0285428. [Google Scholar] [CrossRef] [PubMed]
  39. Zhu, D.; Shi, M.; Yu, C.; Yu, Z.; Kuang, F.; Xiong, W.; Xue, K. Tool-Straw-Paddy Soil Coupling Model of Mechanical Rotary-Tillage Process Based on DEM-FEM. Comput. Electron. Agric. 2023, 215, 108410. [Google Scholar] [CrossRef]
  40. Zou, L.; Yan, D.; Niu, Z.; Yuan, J.; Cheng, H.; Zheng, H. Parametric Analysis and Numerical Optimisation of Spinach Root Vibration Shovel Cutting Using Discrete Element Method. Comput. Electron. Agric. 2023, 212, 108138. [Google Scholar] [CrossRef]
  41. Son, K.J. A Numerical Study of the Influence of Rheology of Cohesive Particles on Blade Free Planetary Mixing. Korea-Aust. Rheol. J. 2018, 30, 199–209. [Google Scholar] [CrossRef]
  42. Wilkinson, S.; Turnbull, S.; Yan, Z.; Stitt, E.; Marigo, M. A Parametric Evaluation of Powder Flowability Using a Freeman Rheometer through Statistical and Sensitivity Analysis: A Discrete Element Method (DEM) Study. Comput. Chem. Eng. 2017, 97, 161–174. [Google Scholar] [CrossRef]
  43. Chaudhuri, B.; Mehrotra, A.; Muzzio, F.J.; Tomassone, M.S. Cohesive Effects in Powder Mixing in a Tumbling Blender. Powder Technol. 2006, 165, 105–114. [Google Scholar] [CrossRef]
  44. Kruggel-Emden, H.; Simsek, E.; Rickelt, S.; Wirtz, S.; Scherer, V. Review and Extension of Normal Force Models for the Discrete Element Method. Powder Technol. 2007, 171, 157–173. [Google Scholar] [CrossRef]
  45. Kruggel-Emden, H.; Wirtz, S.; Scherer, V. A Study on Tangential Force Laws Applicable to the Discrete Element Method (DEM) for Materials with Viscoelastic or Plastic Behavior. Chem. Eng. Sci. 2008, 63, 1523–1541. [Google Scholar] [CrossRef]
  46. Marshall, J.S.; Li, S. Adhesive Particle Flow; Cambridge University Press: New York, NY, USA, 2014. [Google Scholar]
  47. Bortolotti, C.T.; Santos, K.G.; Francisquetti, M.C.C.; Duarte, C.R.; Barrozo, M.A.S. Hydrodynamic Study of a Mixture of West Indian Cherry Residue and Soybean Grains in a Spouted Bed. Can. J. Chem. Eng. 2013, 91, 1871–1880. [Google Scholar] [CrossRef]
  48. Hui, C.Y.; Lin, Y.Y.; Baney, J.M.; Jagota, A. The Accuracy of the Geometric Assumptions in the JKR (JohnsonKendallRoberts) Theory of Adhesion. J. Adhes. Sci. Technol. 2000, 14, 1297–1319. [Google Scholar] [CrossRef]
  49. Feng, Y.; Han, K.; Owen, D.; Loughran, J. On Upscaling of Discrete Element Models: Similarity Principles. Eng. Comput. 2009, 26, 599–609. [Google Scholar] [CrossRef]
  50. Feng, Y.T.; Owen, D.R.J. Discrete Element Modelling of Large Scale Particle Systems—I: Exact Scaling Laws. Comput. Part. Mech. 2014, 1, 159–168. [Google Scholar] [CrossRef]
  51. Ucgul, M.; Fielke, J.M.; Saunders, C. Three-Dimensional Discrete Element Modelling of Tillage: Determination of a Suitable Contact Model and Parameters for a Cohesionless Soil. Biosyst. Eng. 2014, 121, 105–117. [Google Scholar] [CrossRef]
  52. Ahmad, F.; Qiu, B.; Ding, Q.; Ding, W.; Khan, Z.M.; Shoaib, M.; Chandio, F.A.; Rahim, A.; Khaliq, A. Discrete Element Method Simulation of Disc Type Furrow Openers in Paddy Soil. Int. J. Agric. Biol. Eng. 2020, 13, 103–110. [Google Scholar] [CrossRef]
  53. Wang, X.; Zhang, Q.; Huang, Y.; Ji, J. An Efficient Method for Determining DEM Parameters of a Loose Cohesive Soil Modelled Using Hysteretic Spring and Linear Cohesion Contact Models. Biosyst. Eng. 2022, 215, 283–294. [Google Scholar] [CrossRef]
  54. Zeng, Y.; Chen, C.; Quan, W.; Xie, S.; Shi, F.; Ma, Z.; Wu, M. Calibration Parameter of Soil Discrete Element Based on Area Difference Method. Agriculture 2023, 13, 648. [Google Scholar] [CrossRef]
  55. Kim, Y.S.; Siddique, M.A.A.; Kim, W.S.; Kim, Y.J.; Lee, S.D.; Lee, D.K.; Hwang, S.J.; Nam, J.S.; Park, S.U.; Lim, R.G. DEM Simulation for Draft Force Prediction of Moldboard Plow According to the Tillage Depth in Cohesive Soil. Comput. Electron. Agric. 2021, 189, 106368. [Google Scholar] [CrossRef]
Figure 1. A schematic of the UAV direct seeding.
Agriculture 15 00422 g001
Figure 2. A free-body diagram and schematic diagram illustrating the dynamic equilibrium of a rice seed in flight.
Agriculture 15 00422 g002
Figure 3. Calculation results for the gravitational spreading example: (a) the trajectory of the rice seed; (b) the velocity versus time curve.
Agriculture 15 00422 g003
Figure 4. Diagram illustrating the particle contacts in the discrete element method.
Agriculture 15 00422 g004
Figure 5. Spheroidal CAD model of the rice grain and its multi-sphere configuration for DEM.
Agriculture 15 00422 g005
Figure 6. DEM calculation results: (a) time versus z-position, and (b) the time versus speed of the rice seed in cases of gravitational drop, centrifugal spread, and airflow propulsion.
Agriculture 15 00422 g006
Figure 7. Images that were post-processed from the DEM simulation results (a) at t = 0 s, (b) at t = 0.05 s, and (c) at t = 0.1 s for the gravitational drop case with a seed impact velocity of 2.08 m/s and an incident angle of 49.1°.
Agriculture 15 00422 g007
Figure 8. Post-processed simulation graphics (a) at t = 0 s, (b) at t = 0.1 s, and (c) at t = 0.2 s for the centrifugal spreading case with a seed impact velocity of 2.47 m/s and an incident angle of 42.3°.
Agriculture 15 00422 g008
Figure 9. Images that were post-processed from the DEM simulation data (a) at t = 0 s, (b) at t = 0.05 s, and (c) at t = 0.1 s for the airflow propulsion case with a seed impact velocity of 14.48 m/s and an incident angle of 83.7°.
Agriculture 15 00422 g009
Figure 10. DEM calculation results: (a) time versus z-position, and (b) time versus the speed of the rice seeds for the two pneumatic seeding cases.
Agriculture 15 00422 g010
Figure 11. Post-processed simulation graphics (a) at t = 0 s, (b) at t = 0.1 s, and (c) at t = 0.2 s for the pneumatic discharge case with a seed impact velocity of 57.29 m/s and an incident angle of 88.5°.
Agriculture 15 00422 g011
Figure 12. Post-processed simulating images analyzed (a) at t = 0 s, (b) at t = 0.05 s, and (c) at t = 0.1 s for the pneumatic shooting case with a seed impact velocity of 144.64 m/s and an incident angle of 89.5°.
Agriculture 15 00422 g012
Figure 13. Post-processing DEM simulation graphics for the (a) pneumatic discharge case and the (b) pneumatic shooting case at 0.05 s, as well as a (c) comparative bar chart illustrating the sowing depth.
Agriculture 15 00422 g013
Figure 14. Post-processing DEM simulation graphics of the soil bed for the pneumatic shooting case at 0.001 s: (a) the particle velocity distribution, (b) the compressive contact force distribution, and (c) the axial stress distribution.
Agriculture 15 00422 g014
Table 1. The fluid properties of the air and paddy water.
FluidDensity ( kg / m 3 ) Viscosity ( Pa · s )
Air1.225 1.790 × 10 5
Paddy water1090 1.06 × 10 2
Table 2. The initial launch parameters for the five sowing method types.
Sowing TypeLaunch Speed 1 (m/s)Launch Angle 1  ( ° )
Gravitational drop20
Centrifugal spreading2.7918.9
Airflow propulsion18.1183.7
Pneumatic discharge75.0388.5
Pneumatic shooting22589.5
1 The launch speed and angle account for the horizontal drone speed at 2 m/s.
Table 3. The calculated terminal velocities for the five types of UAV sowing.
Sowing TypeTerminal Speed (m/s)Terminal Angle ( ° )
Gravitational drop2.0849.1
Centrifugal spreading2.4742.3
Airflow propulsion14.4883.7
Pneumatic discharge57.2988.5
Pneumatic shooting144.6489.5
Table 4. The location and size of each of the multi-sphere particles.
IDx-Position (mm)Radius (mm)
1 4.26 0.245
2 3.42 0.654
3 1.89 0.947
40.001.050
51.890.947
63.420.654
74.260.245
Table 5. Material properties of the rice seed and paddy soil.
PropertyRiceSoil
Mass density ( kg / m 3 )12502527
Shear modulus (MPa)237.568.5
Poisson’s ratio0.2750.314
Table 6. Parameters for the Hertz–Mindlin and JKR cohesive contact model.
ParameterRice–SoilSoil–Soil
Coefficient of restitution0.550.3
Coefficient of sliding friction0.20.36
Coefficient of rolling friction0.080.18
Surface energy ( J / m 2 )0.751.5
Disclaimer/Publisher’s Note: The statements, opinions and data contained in all publications are solely those of the individual author(s) and contributor(s) and not of MDPI and/or the editor(s). MDPI and/or the editor(s) disclaim responsibility for any injury to people or property resulting from any ideas, methods, instructions or products referred to in the content.

