Article

Distinguishing True from False Estrus in Hanwoo Cows Using Neck-Mounted IMU Sensors: Quantifying Behavioral Differences to Reduce False Positives

1
Asia Pacific Ruminant Institute, Icheon 17385, Republic of Korea
2
Department of Eco-Friendly Livestock Science, Institutes of Green Bio Science and Technology, Seoul National University, Pyeongchang 25354, Republic of Korea
*
Author to whom correspondence should be addressed.
These authors contributed equally to this work.
Agriculture 2025, 15(21), 2307; https://doi.org/10.3390/agriculture15212307
Submission received: 13 October 2025 / Revised: 30 October 2025 / Accepted: 4 November 2025 / Published: 5 November 2025

Abstract

This study aimed to characterize behavioral differences between true estrus (TE) and false estrus (FE) in cows using neck-mounted six-axis inertial measurement unit sensors to reduce false positives in automated detection systems. A retrospective analysis was conducted on 1464 validated estrus alerts from 414 Hanwoo cows across 13 commercial farms in South Korea. Alerts were classified as TE (625 alerts) or FE (839 alerts) based on comprehensive validation criteria, including standing heat observation, artificial insemination records, ovulation confirmation, and pregnancy outcomes. Mounting activity, rumination time, and lying time were analyzed. True estrus exhibited significantly higher (p < 0.0001) total number of mounts and maximum mounting duration compared to FE over the entire observation period. Notably, the maximum number of mounts per hour was higher (p < 0.0001) in FE before alert generation but higher (p < 0.0001) in TE afterward, with FE declining rapidly. Coefficients of variation for rumination and lying time were significantly higher (p < 0.0001) in TE than in FE, indicating greater behavioral disruption. These findings revealed that secondary behavioral signs exhibit distinct quantitative and temporal patterns between TE and FE, suggesting potential criteria that could be integrated into automated detection algorithms to reduce false-positive rates.

1. Introduction

Accurate detection of estrus in cattle is directly linked to reproductive efficiency and, consequently, to the profitability of both dairy and beef production systems. Missing the optimal breeding window results in prolonged calving intervals, reduced milk yield, increased veterinary expenses, and overall losses in productivity estimated at 0.7 to 1.2 dollars per additional day open [1,2,3]. Moreover, reproductive failure leads to the unnecessary maintenance of non-productive animals, thereby increasing greenhouse gas emissions and the carbon intensity of livestock systems, which aggravates the environmental burden of cattle farming [4,5]). Thus, estrus detection is a key factor not only for farm profitability but also for mitigating environmental impacts.
Most cows ovulate within 24–33 h after the onset of estrus or 15–22 h after estrus termination, making these intervals critical benchmarks for the timing of artificial insemination [6,7,8]. Estrus is accompanied by hormonal, thermal, and vulvar changes as well as distinctive behavioral alterations. Among them, standing heat is recognized as the most reliable primary sign, being closely associated with ovulation. However, standing heat is expressed in only about 58% of estrous periods [9], and each mounting episode typically lasts only 3–8 s, which makes monitoring challenging [10]. Furthermore, its expression may be weakened by factors such as social grouping, heat stress, and management conditions [11,12]. To compensate for these limitations, secondary behavioral signs—including mounting activity, increased locomotion, and reduced rumination and lying—are widely employed in estrus detection. Nevertheless, these indicators are individually less accurate and may also be influenced by stress or environmental changes [10,13]. Still, combining primary and secondary signs, or multiple secondary signs, has been shown to improve detection accuracy [6,7]. For example, combined indicators such as activity + mounting (76%), activity + lying (89%), and activity + rumination (94%) demonstrate the effectiveness of this integrative approach [14].
Traditionally, estrus detection has relied on visual assessment of external signs or behaviors. However, such methods are prone to observer bias and risk failure when estrous behaviors are weak or short-lived. Consequently, a demand for objective and automated detection methods has driven technological development. Pressure-sensitive patches can record standing heat during mounting but lack durability; pedometers capture increased walking activity but are susceptible to non-estrus-related movement; blood or milk hormone assays are highly accurate but costly and time-consuming; and UWB-based positioning systems are effective for group-level monitoring but require substantial installation efforts. Other explored methods include rumen or vaginal bolus sensors, infrared thermography, and acoustic-based detection [6,10]. Among these, accelerometer-based inertial measurement unit (IMU) sensors attached to the neck, ear, or legs have become the most widely adopted. These sensors sensitively capture changes in activity, rumination, and posture transitions, achieving high performance in estrus detection [15], and have been standardized in many commercial farms. Nevertheless, because they detect secondary rather than primary signs, they are associated with a relatively high false-positive rate [7,13]. Aungier et al. [16] reported that even after algorithm optimization, including duration thresholds, false-positive rates remained at 21% for neck-mounted activity monitors, while unoptimized systems showed rates as high as 32%. To enhance the reliability of accelerometer-based estrus detection, it is therefore essential to characterize how secondary behavioral signs differ quantitatively and temporally between true estrus (TE) and false estrus (FE). However, large-scale studies explicitly addressing this distinction and providing actionable behavioral criteria remain limited.
Therefore, the objective of the present study was to characterize and quantify behavioral differences between TE and FE in Hanwoo cows using neck-mounted six-axis IMU sensors. Specifically, this study analyzed mounting behavior parameters (total count, maximum duration, and temporal patterns before and after alerts), as well as variability in rumination and lying time, to identify behavioral features that can be integrated into automated detection algorithms to reduce false-positive rates. By improving the specificity of estrus detection, such algorithm refinements would enhance insemination success rates and ultimately contribute to both farm productivity and environmental sustainability through reduced reproductive waste.

2. Materials and Methods

2.1. Animals, Housing Conditions, and Ethical Approval

This study was approved by the Institutional Animal Care and Use Committee of Seoul National University (approval number: SNU-250112-2). As a retrospective analysis, this study utilized data that had been collected during routine production management at 13 commercial Hanwoo cattle farms in South Korea, without imposing any additional stress or treatments designed for research purposes on the animals. The research data were collected from 1 August 2024, to 31 July 2025, encompassing 414 Hanwoo cows, including 69 nulliparous heifers (14 to 24 months of age), 70 primiparous cows (24 to 36 months of age), and 275 multiparous cows (over 36 months of age). For parous cows (primiparous and multiparous), only animals at least 60 days postpartum were included in the analysis. Cows with major health events recorded in farm management systems (such as clinical mastitis or severe lameness requiring veterinary intervention) during the observation period were excluded. All farms employed a loose housing system, where cows were maintained under standard herd management practices at their respective farms and allowed to exhibit natural estrous cycles. All farms provided ad libitum access to either total mixed rations or separate feeding of concentrates and roughages according to the Korean Feeding Standard for Hanwoo Cattle [17], with continuous access to clean drinking water. The stocking density at each farm provided a minimum of 10 m2 of space per animal. All barns utilized sawdust as bedding material, applied at an approximate depth of 20 cm and regularly replaced to ensure a clean housing environment.

2.2. Estrus Detection System and Classification

To monitor estrous behavior, all cows were equipped with a six-axis IMU sensor (Farmer’s Hands, Bodit Inc., Seoul, Republic of Korea; Figure 1) attached to the left side of the neck.
The sensor continuously collected three-dimensional acceleration and angular velocity data from the cow’s neck movements, with detailed specifications presented in Table 1. The estrus detection system analyzed the motion data in real-time using an embedded artificial intelligence algorithm, which automatically generated and transmitted estrus alerts when behavior patterns associated with estrus were detected.
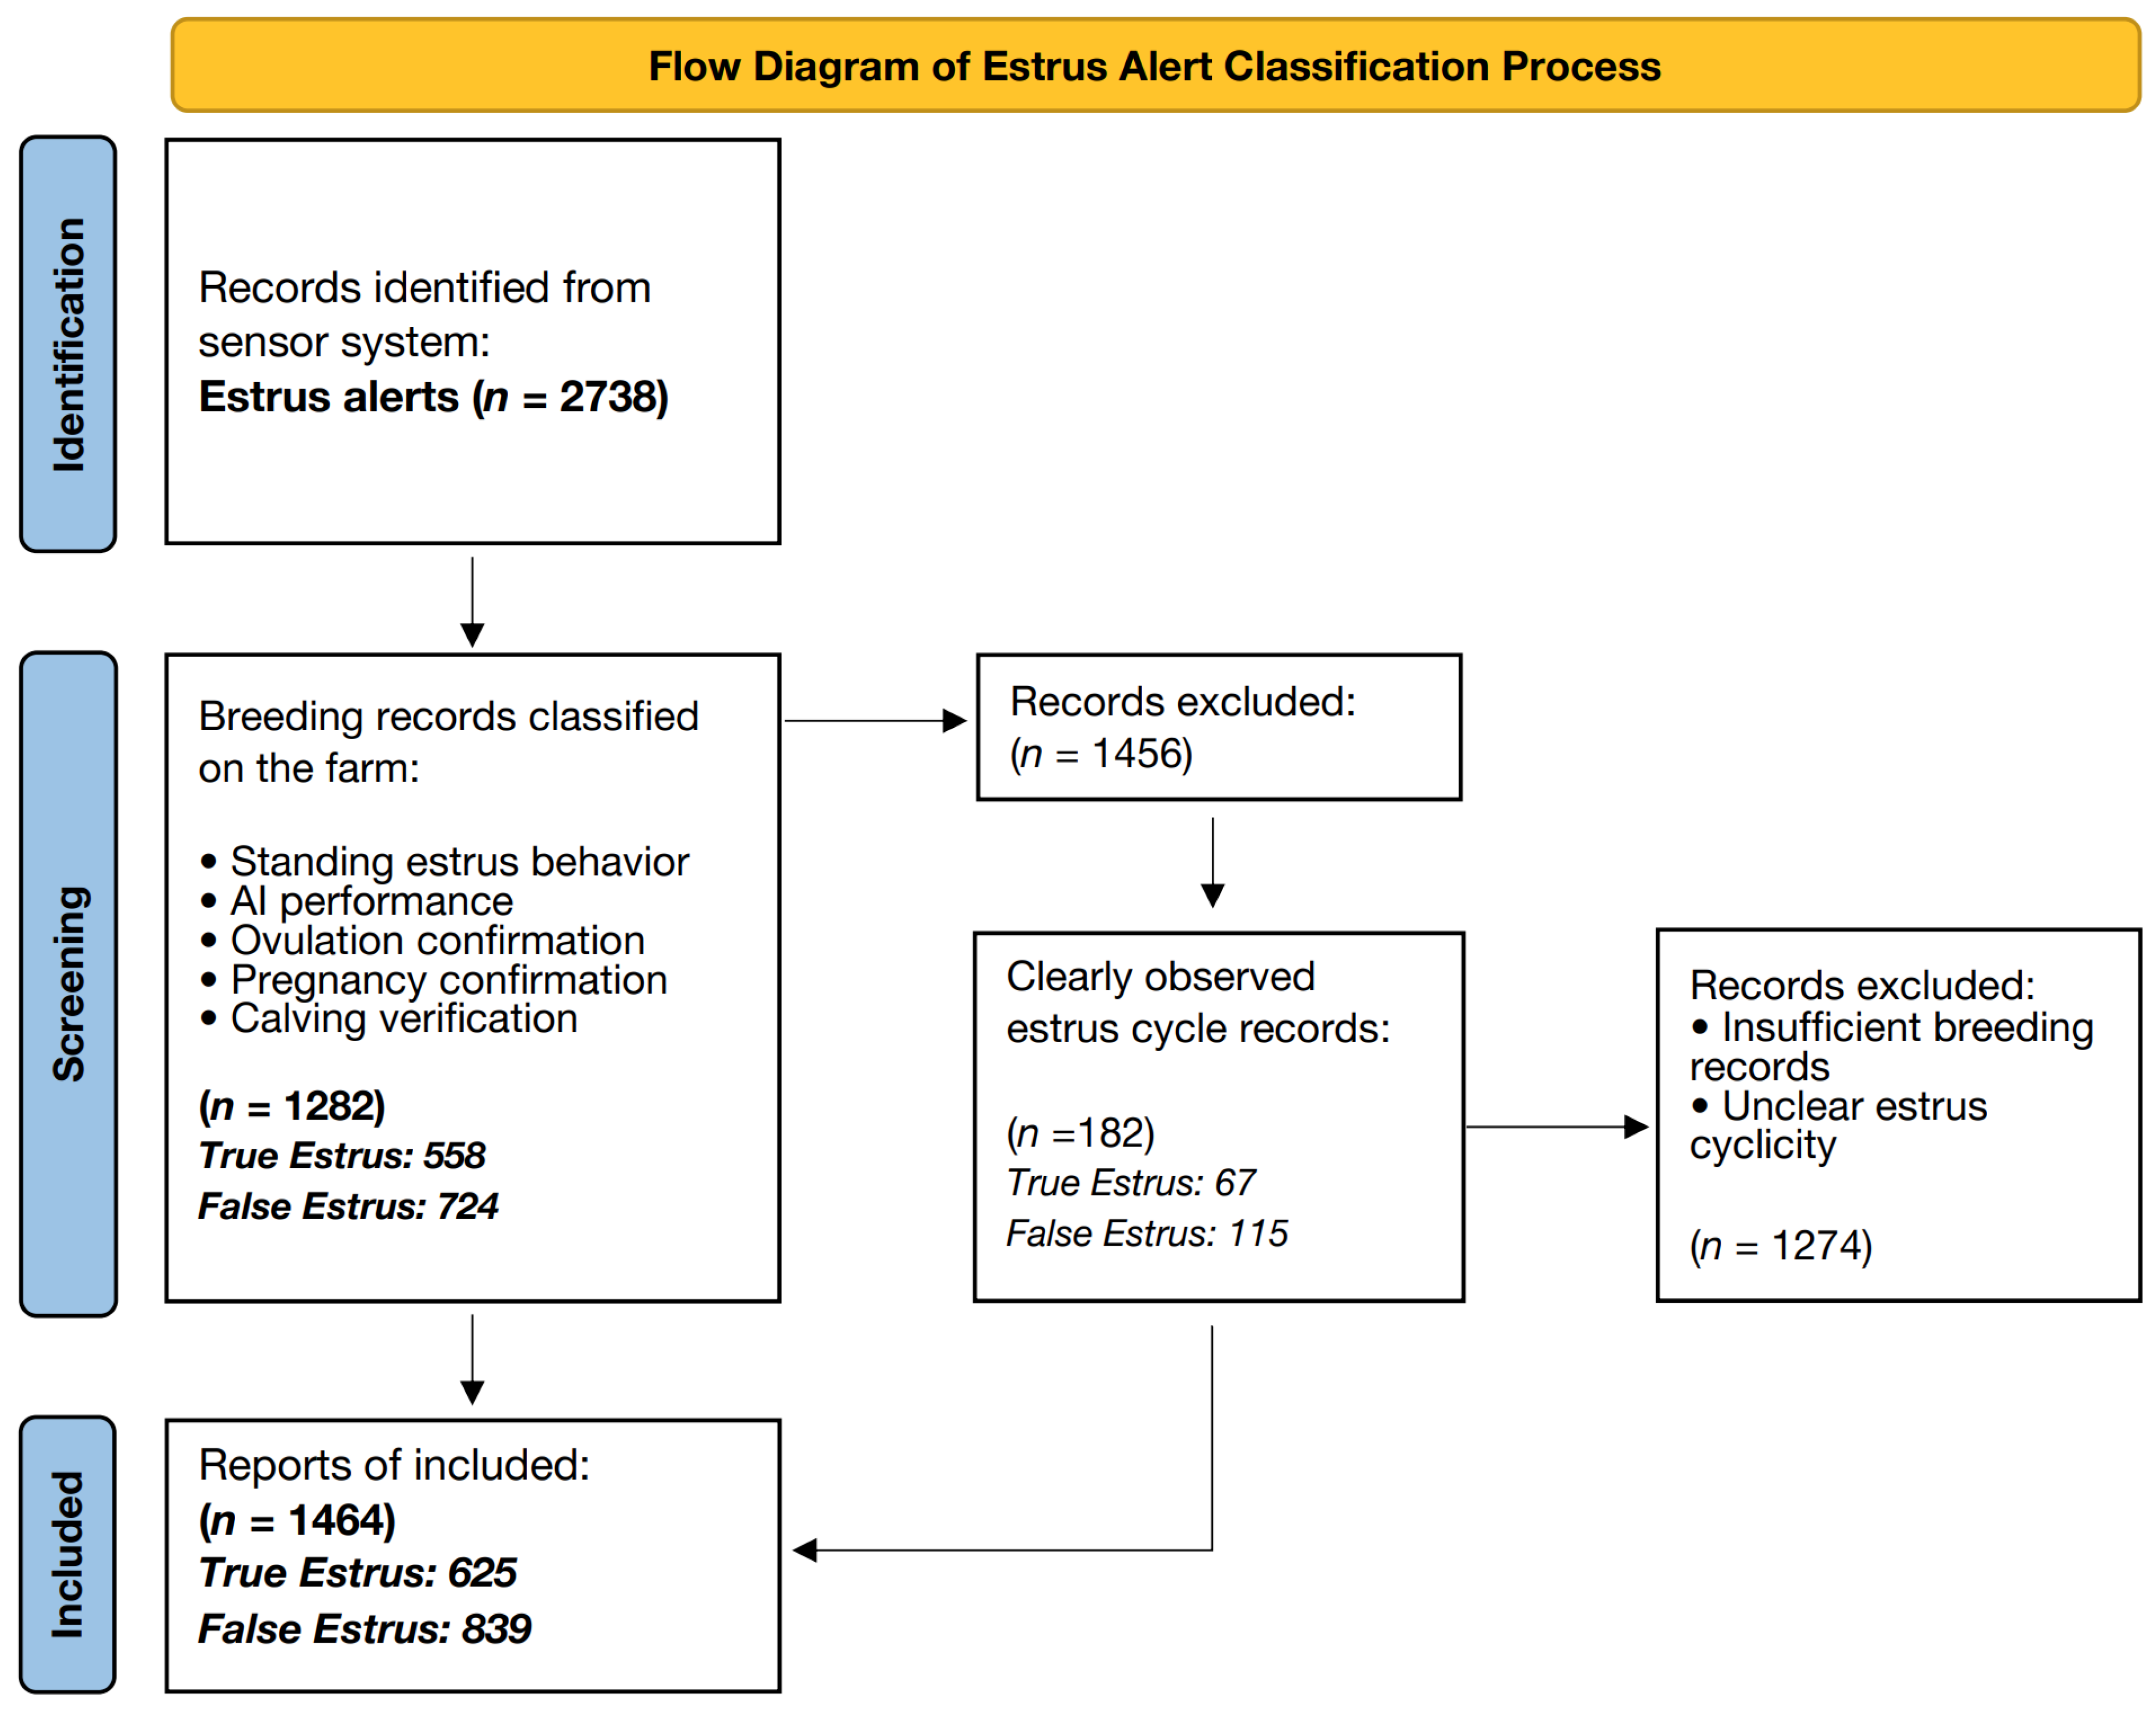
During the data collection period, the system generated a total of 2738 estrus alerts. Each alert was retrospectively reviewed by the farm’s artificial insemination technician to assess whether sufficient follow-up information was available for validation. The validation criteria, which integrated observational and diagnostic information from multiple time points (Table 2), could only be applied to alerts with adequate subsequent data. Alerts lacking the necessary information to evaluate against these criteria were excluded from the analysis. This screening process yielded 1464 alerts with sufficient data for definitive classification. Among these validated alerts, those that met at least one validation criterion were classified as TE, whereas those that failed to meet any criterion were classified as FE. Ultimately, 625 alerts were classified as TE, and 839 alerts were classified as FE. The detailed screening and classification process is illustrated in Figure 2.

2.3. Behavioral Data Collection and Processing

To analyze behavioral differences between TE and FE, the sensor system independently recorded detailed behavioral data for each cow while generating estrus alerts. By recognizing specific patterns of neck movements, the system outputted three categories of behavioral metrics on an hourly basis: number of mounts (identified by detecting sudden forward tilting, lifting, and vigorous vibration patterns of the neck), rumination time (identified by detecting regular, low-frequency up-and-down neck movement patterns), and lying time (identified by sustained horizontal posture and static state). The accuracy of the mounting behavior detection algorithm was validated following the same protocol described by Kim et al. [18], which involved direct comparison between algorithm outputs and visual observations from video recordings. Briefly, the validation demonstrated a sensitivity of 90.9% and a specificity of 99.1% for mounting event detection, confirming the reliability of the automated mounting behavior measurements used in this study. Similarly, the detection algorithms for rumination time and lying time had been validated and reported in the same study, with sensitivity values of 93.7% and 98.7%, and specificity values of 98.8% and 96.4%, respectively [18].
All behavioral data were aligned with the time point of estrus alert generation as the zero-time point (t = 0). The observation period for mounting behavior analysis was set at 12 h before and after the estrus alert (25 h total). The pre-period was defined as from 12 h to 1 h before the alert, and the post-period was defined as from 0 to 12 h after the alert. The observation period for rumination and lying time was set at 24 h before and after the estrus alert (49 h total). To establish baseline behavioral patterns for comparison, non-estrus (NE) control data were collected. Specifically, NE data were extracted from 72 to 24 h before each estrus alert (49 h total), during which no other estrus alerts were generated. A total of 1463 NE samples were obtained from eligible time periods across all cows.
To quantify mounting behavior characteristics, three parameters were calculated: maximum number of mounts, defined as the highest number of mounts recorded in any single hour during the observation period; total number of mounts, defined as the cumulative sum of mounts throughout the entire observation period; and maximum mounting duration, defined as the longest consecutive time period with high mounting activity (five or more mounts per hour). The threshold for defining high mounting activity was determined based on the upper quartile of mounting frequency observed during the peri-estrus period (Figure S1).
Analysis of rumination and lying time employed a four-hour cumulative moving window method for data smoothing [19,20,21]. The cumulative value at time point t was calculated using the following equation:
C t = i = 0 3 X t i .
where C(t) represents the cumulative value at time point t, and X(t − i) represents the one-hour measured value at time point (t − i).
Additionally, to quantify the variability of rumination and lying time before and after estrus, the coefficient of variation (CV) was calculated [22,23]:
C V = s x ¯ × 100 .
where  x ¯    represents the mean and s represents the standard deviation. The coefficient of variation expresses the standard deviation as a percentage of the mean, serving as a measure of relative variability [24,25].

2.4. Statistical Analysis

All data were analyzed using SAS 9.4 software (SAS Institute Inc., Cary, NC, USA). The three mounting behavior parameters (maximum number of mounts, total number of mounts, and maximum mounting duration), as well as rumination and lying time during the pre-period and post-period of estrus alerts, were compared between TE and FE groups using the TTEST procedure. Cumulative distribution functions (CDF) of each parameter were compared between groups using the NPAR1WAY procedure with the Kolmogorov–Smirnov test. Coefficients of variation for rumination and lying time were compared among the three groups (NE, TE, and FE) using the GLM procedure. Normality of residuals was assessed using the Shapiro–Wilk test, and homogeneity of variances was evaluated using Levene’s test. Post hoc multiple comparisons were performed using the Tukey–Kramer test. Significant differences were considered at p < 0.05, and a tendency was declared at 0.05 ≤ p < 0.1.

3. Results

3.1. Circadian Distribution of Estrus Alert Generation

The temporal distribution of estrus alerts throughout the 24 h cycle is presented in Figure 3. Both TE and FE alerts exhibited distinct circadian patterns, with peak occurrence during midday hours. The maximum alert generation was observed at hour 12 for TE (approximately 8.7%) and hour 13 for FE (approximately 8.6%). Both groups showed relatively low alert frequencies during early morning hours (2–3%) and maintained moderate levels during evening hours (3–5%). The overall circadian distribution patterns were similar between TE and FE groups throughout the 24 h period.

3.2. Mounting Behavior Parameters

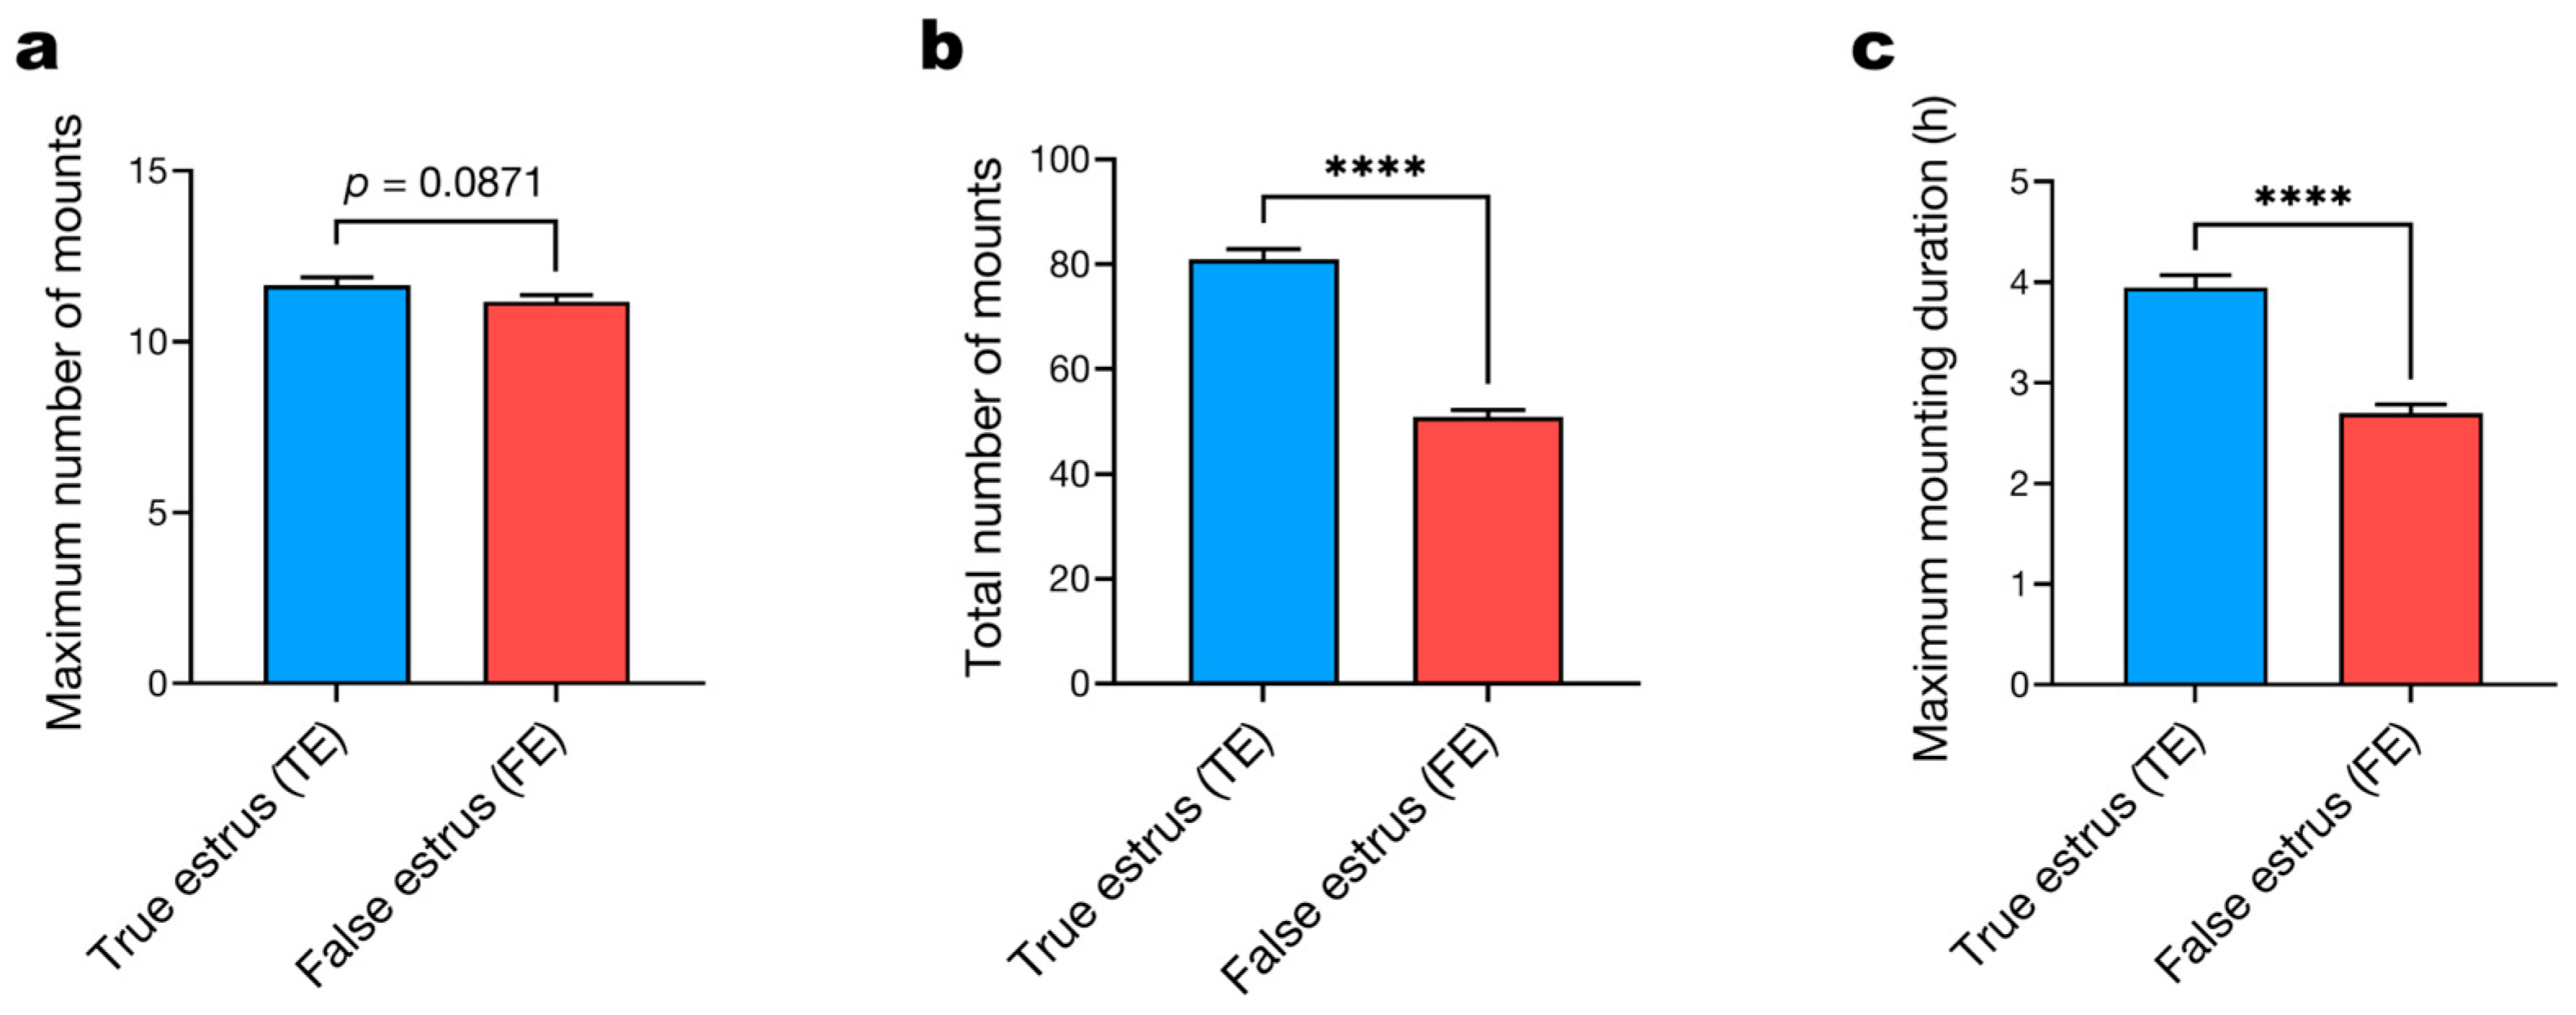
Mounting behavior parameters measured over the 25 h observation period are presented in Figure 4. The maximum number of mounts per hour showed a tendency toward higher values in TE (11.7 ± 0.2 mounts) compared to FE (11.2 ± 0.2 mounts, p = 0.0871). The total number of mounts was significantly greater in TE (81.0 ± 1.9 mounts) than in FE (50.8 ± 1.3 mounts, p < 0.0001). Similarly, maximum mounting duration was significantly longer in TE (3.9 ± 0.1 h) than in FE (2.7 ± 0.1 h, p < 0.0001).
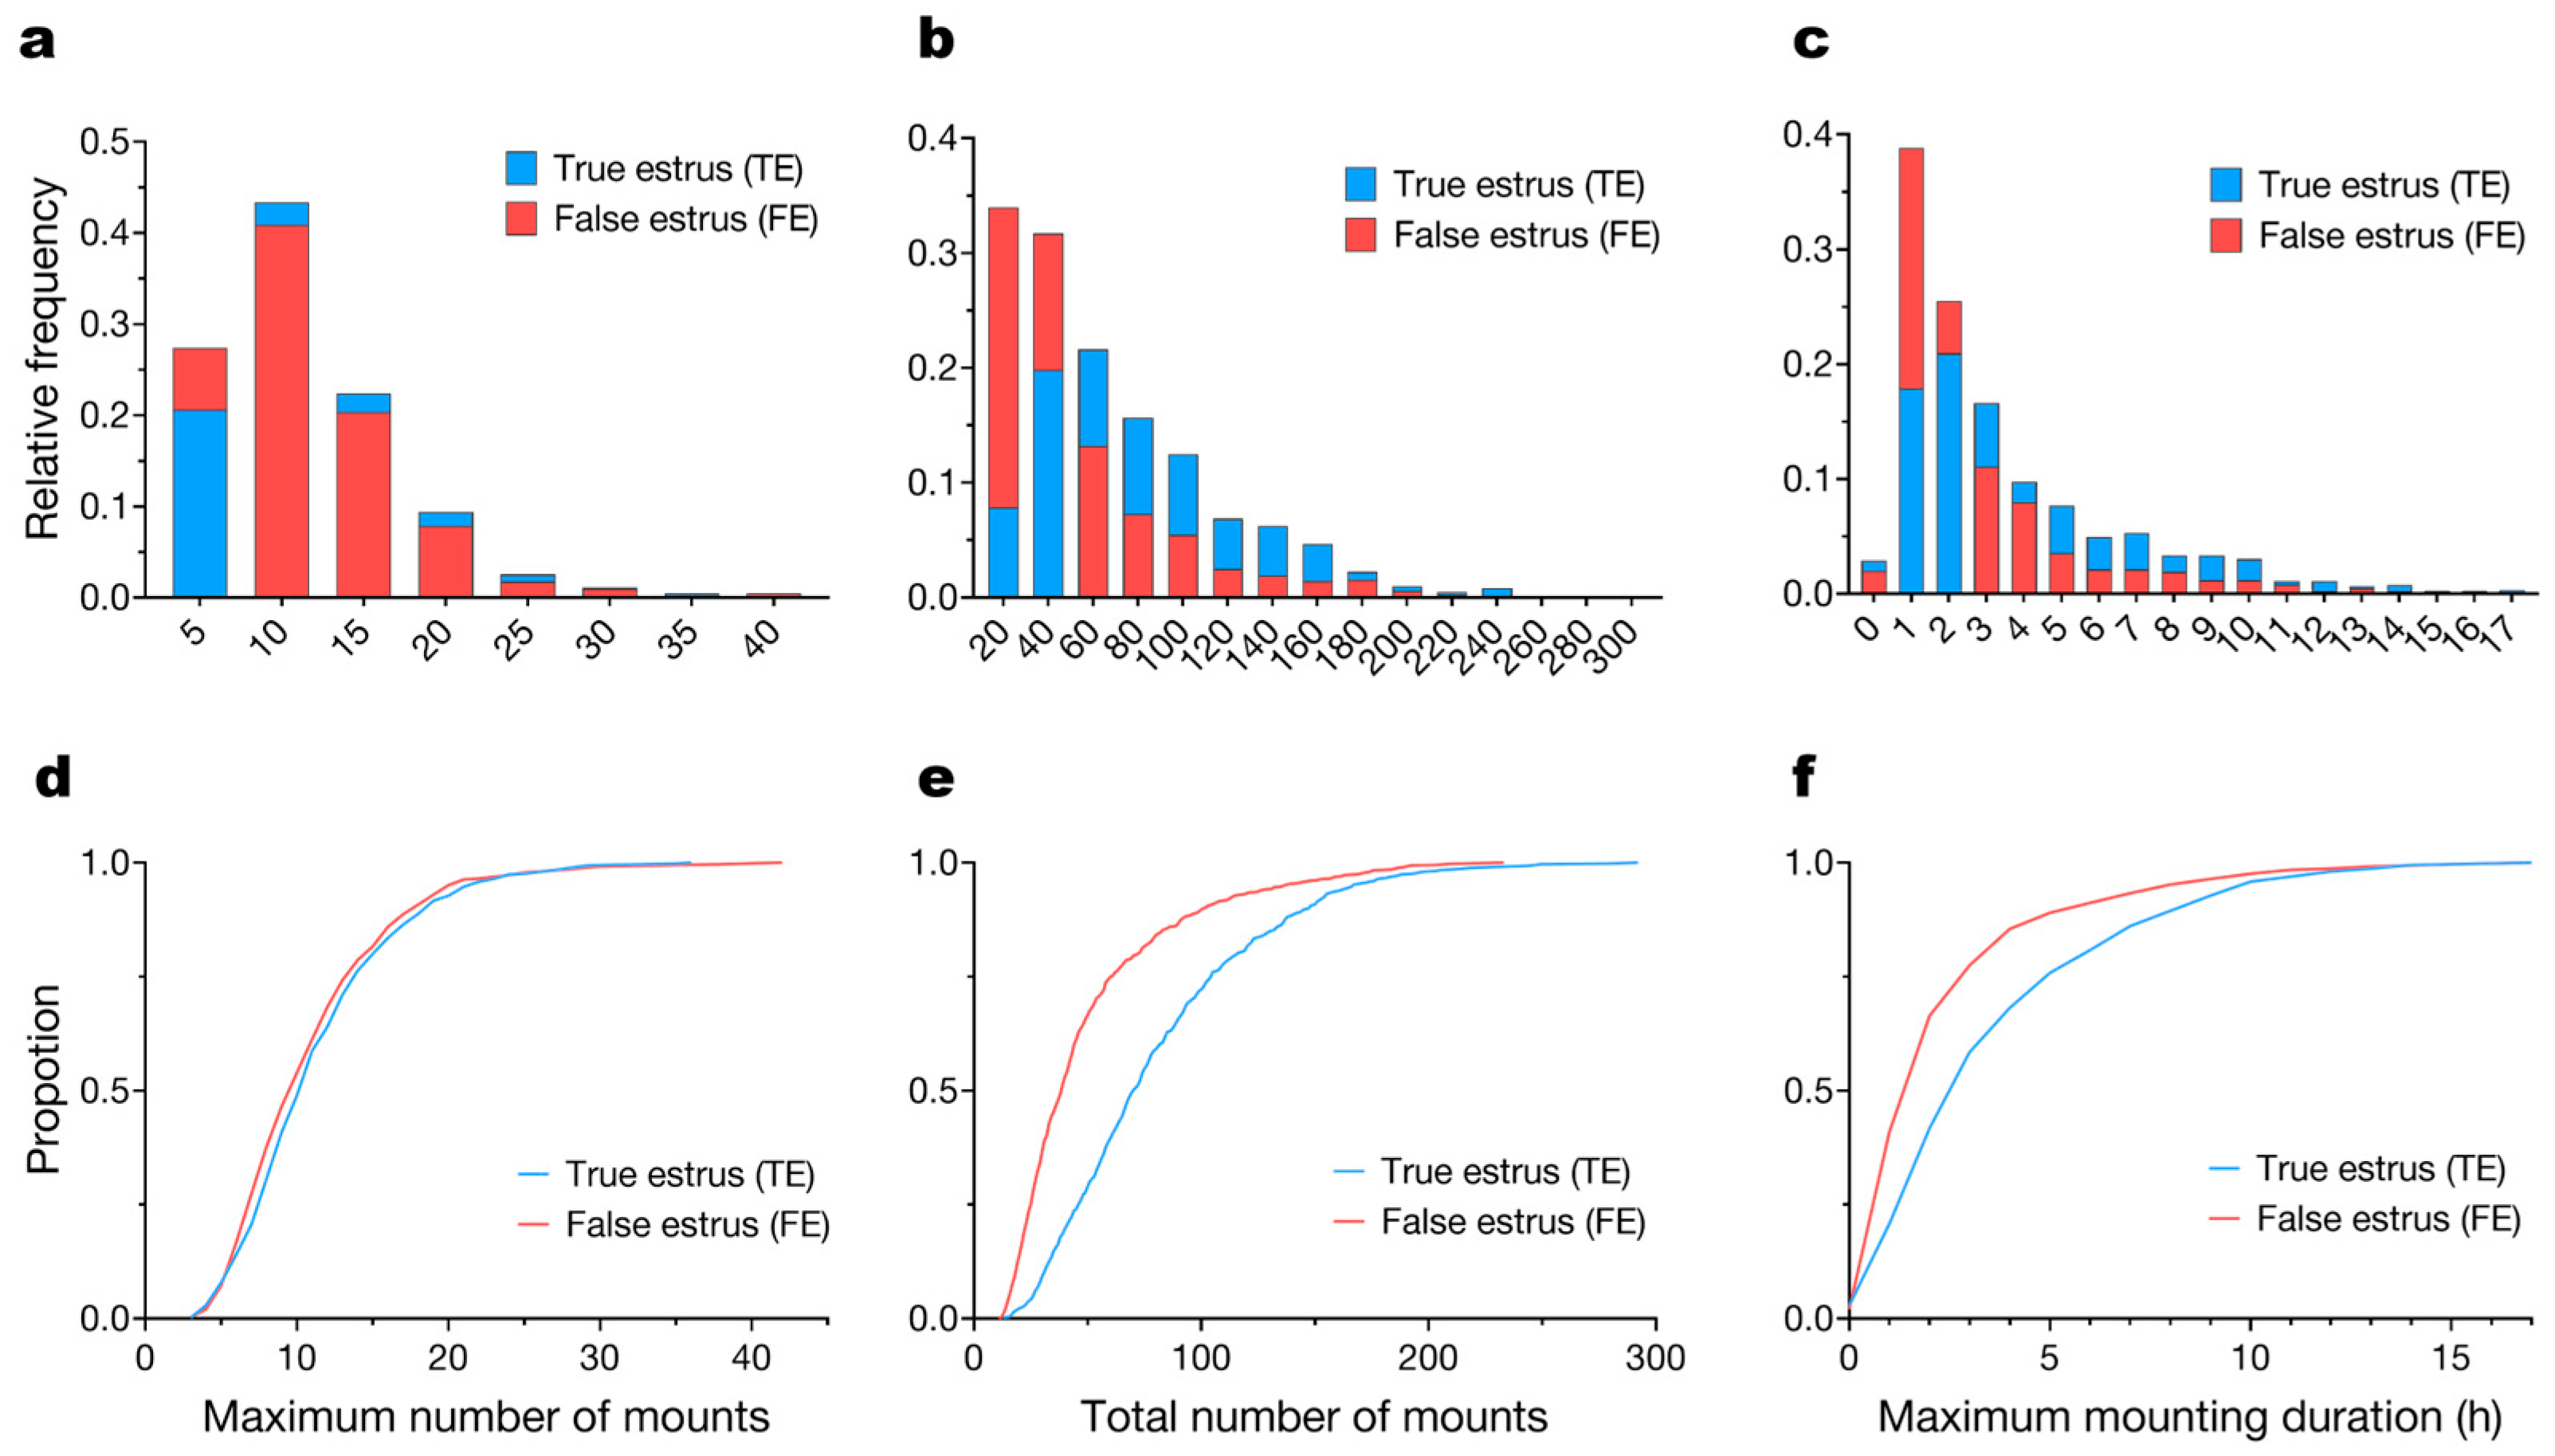
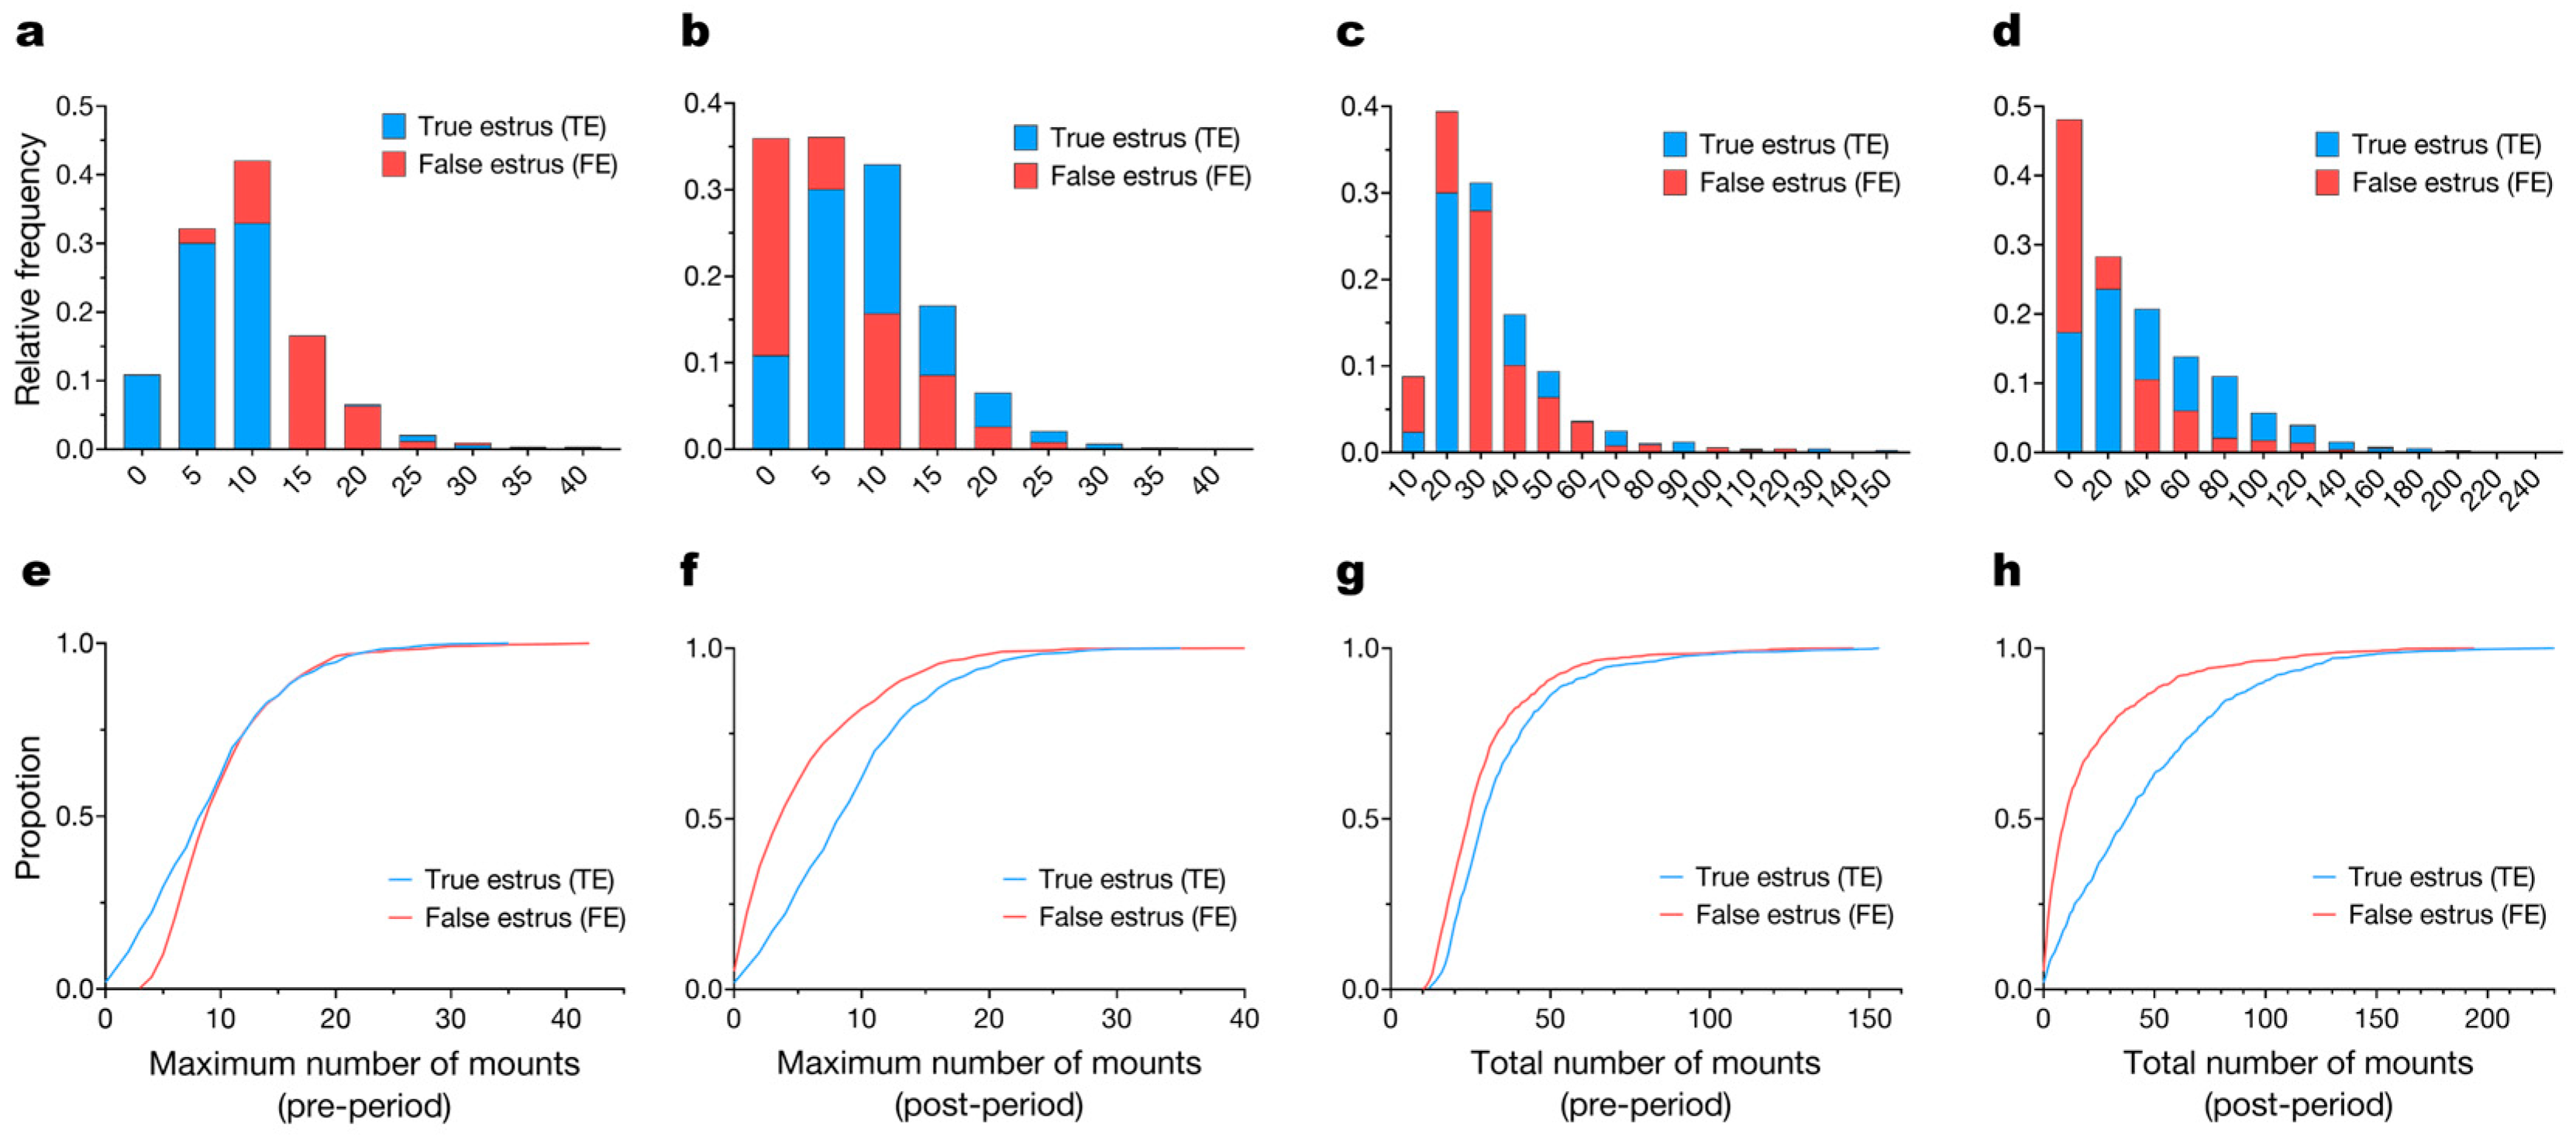
The frequency distributions and CDF of these mounting parameters are illustrated in Figure 5. The relative frequency distribution of maximum number of mounts showed similar patterns between TE and FE groups, with both groups concentrated primarily in the range of 5–15 mounts per hour. In contrast, the distribution of total number of mounts revealed a clear rightward shift for TE, with a higher proportion of alerts occurring at elevated mount counts (>60 mounts). The maximum mounting duration distribution also demonstrated a rightward shift in TE, indicating greater concentration of alerts with longer sustained mounting activity (>3 h). The CDF differed significantly (p < 0.0001) between TE and FE for the total number of mounts and maximum mounting duration, while the maximum number of mounts tended (p = 0.0561) to differ between groups.

3.3. Temporal Patterns of Mounting Behavior

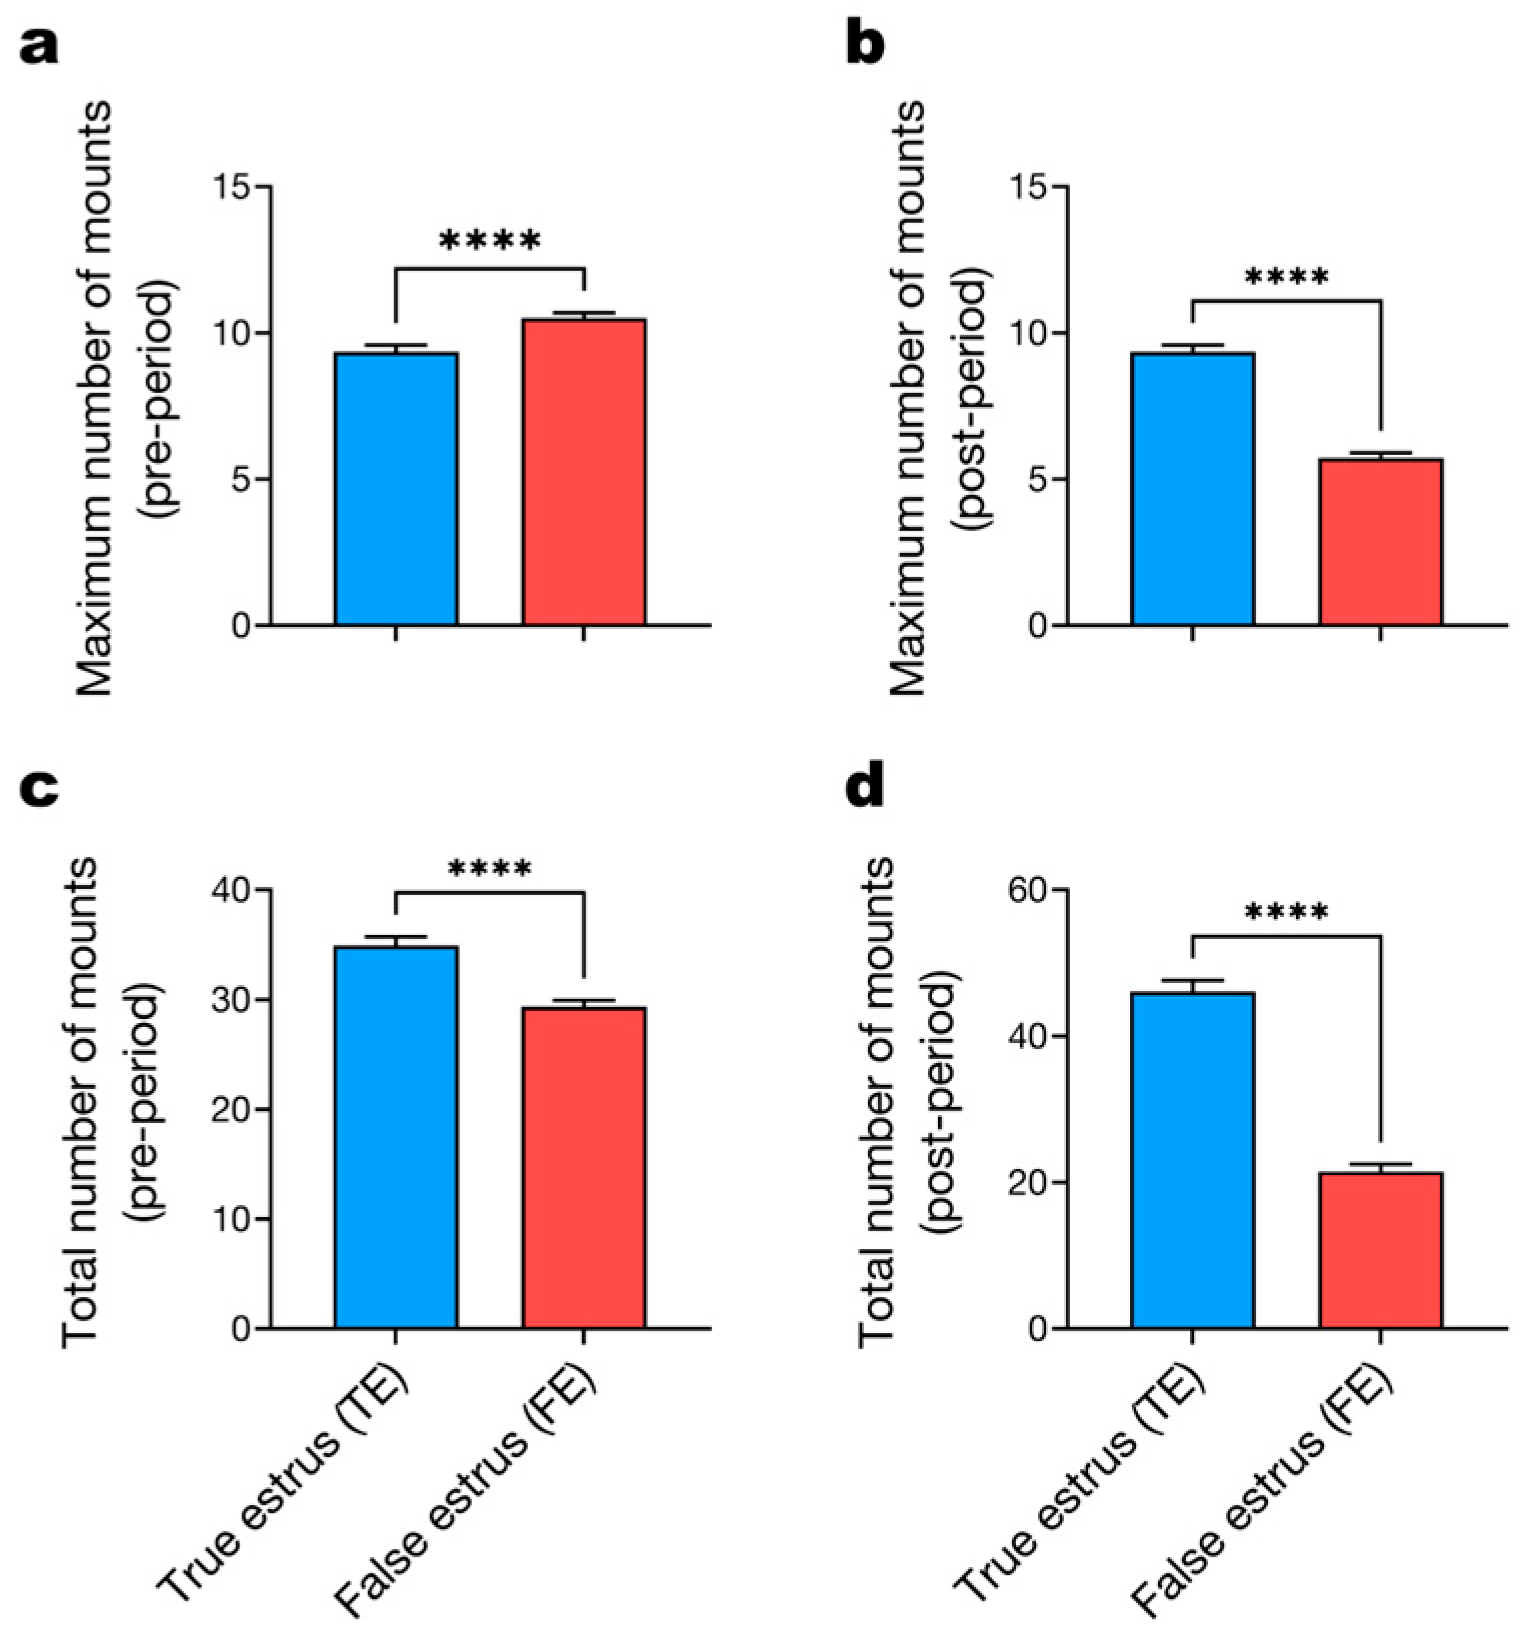
To further characterize mounting behavior dynamics, parameters were analyzed separately for the pre-period and post-period, as shown in Figure 6. During the pre-period, the maximum number of mounts per hour was significantly higher in FE (10.5 ± 0.2 mounts) than in TE (9.6 ± 0.2 mounts, p < 0.0001). However, in the post-period, this pattern reversed, with TE (9.3 ± 0.2 mounts) showing significantly higher values than FE (5.7 ± 0.2 mounts, p < 0.0001). For the total number of mounts, TE exhibited significantly greater values than FE in both the pre-period (34.9 ± 0.8 versus 29.3 ± 0.6 mounts, p < 0.0001) and the post-period (46.1 ± 1.6 versus 21.5 ± 1.0 mounts, p < 0.0001).
The frequency distributions and cumulative distribution functions of mounting parameters stratified by time period are presented in Figure 7. In the pre-period, the distribution of the maximum number of mounts showed substantial overlap between TE and FE groups, with both concentrated around 5–15 mounts per hour, though FE displayed a slightly higher central tendency. In contrast, the post-period distribution revealed a distinct separation, with FE concentrated heavily in the lower range (0–10 mounts) while TE exhibited a broader distribution extending to 10–20 mounts per hour. Similar temporal patterns were observed for the total number of mounts. During the pre-period, both groups were concentrated in the 20–40 mounts range with considerable overlap. However, in the post-period, FE showed a sharp concentration in the 0–20 mounts range, whereas TE maintained a wide distribution spanning 50–100 mounts. The CDF differed significantly between TE and FE for all temporal comparisons: pre-period maximum number of mounts (p = 0.0139), post-period maximum number of mounts (p < 0.0001), pre-period total number of mounts (p < 0.0001), and post-period total number of mounts (p < 0.0001).

3.4. Behavioral Variability During Estrus Events

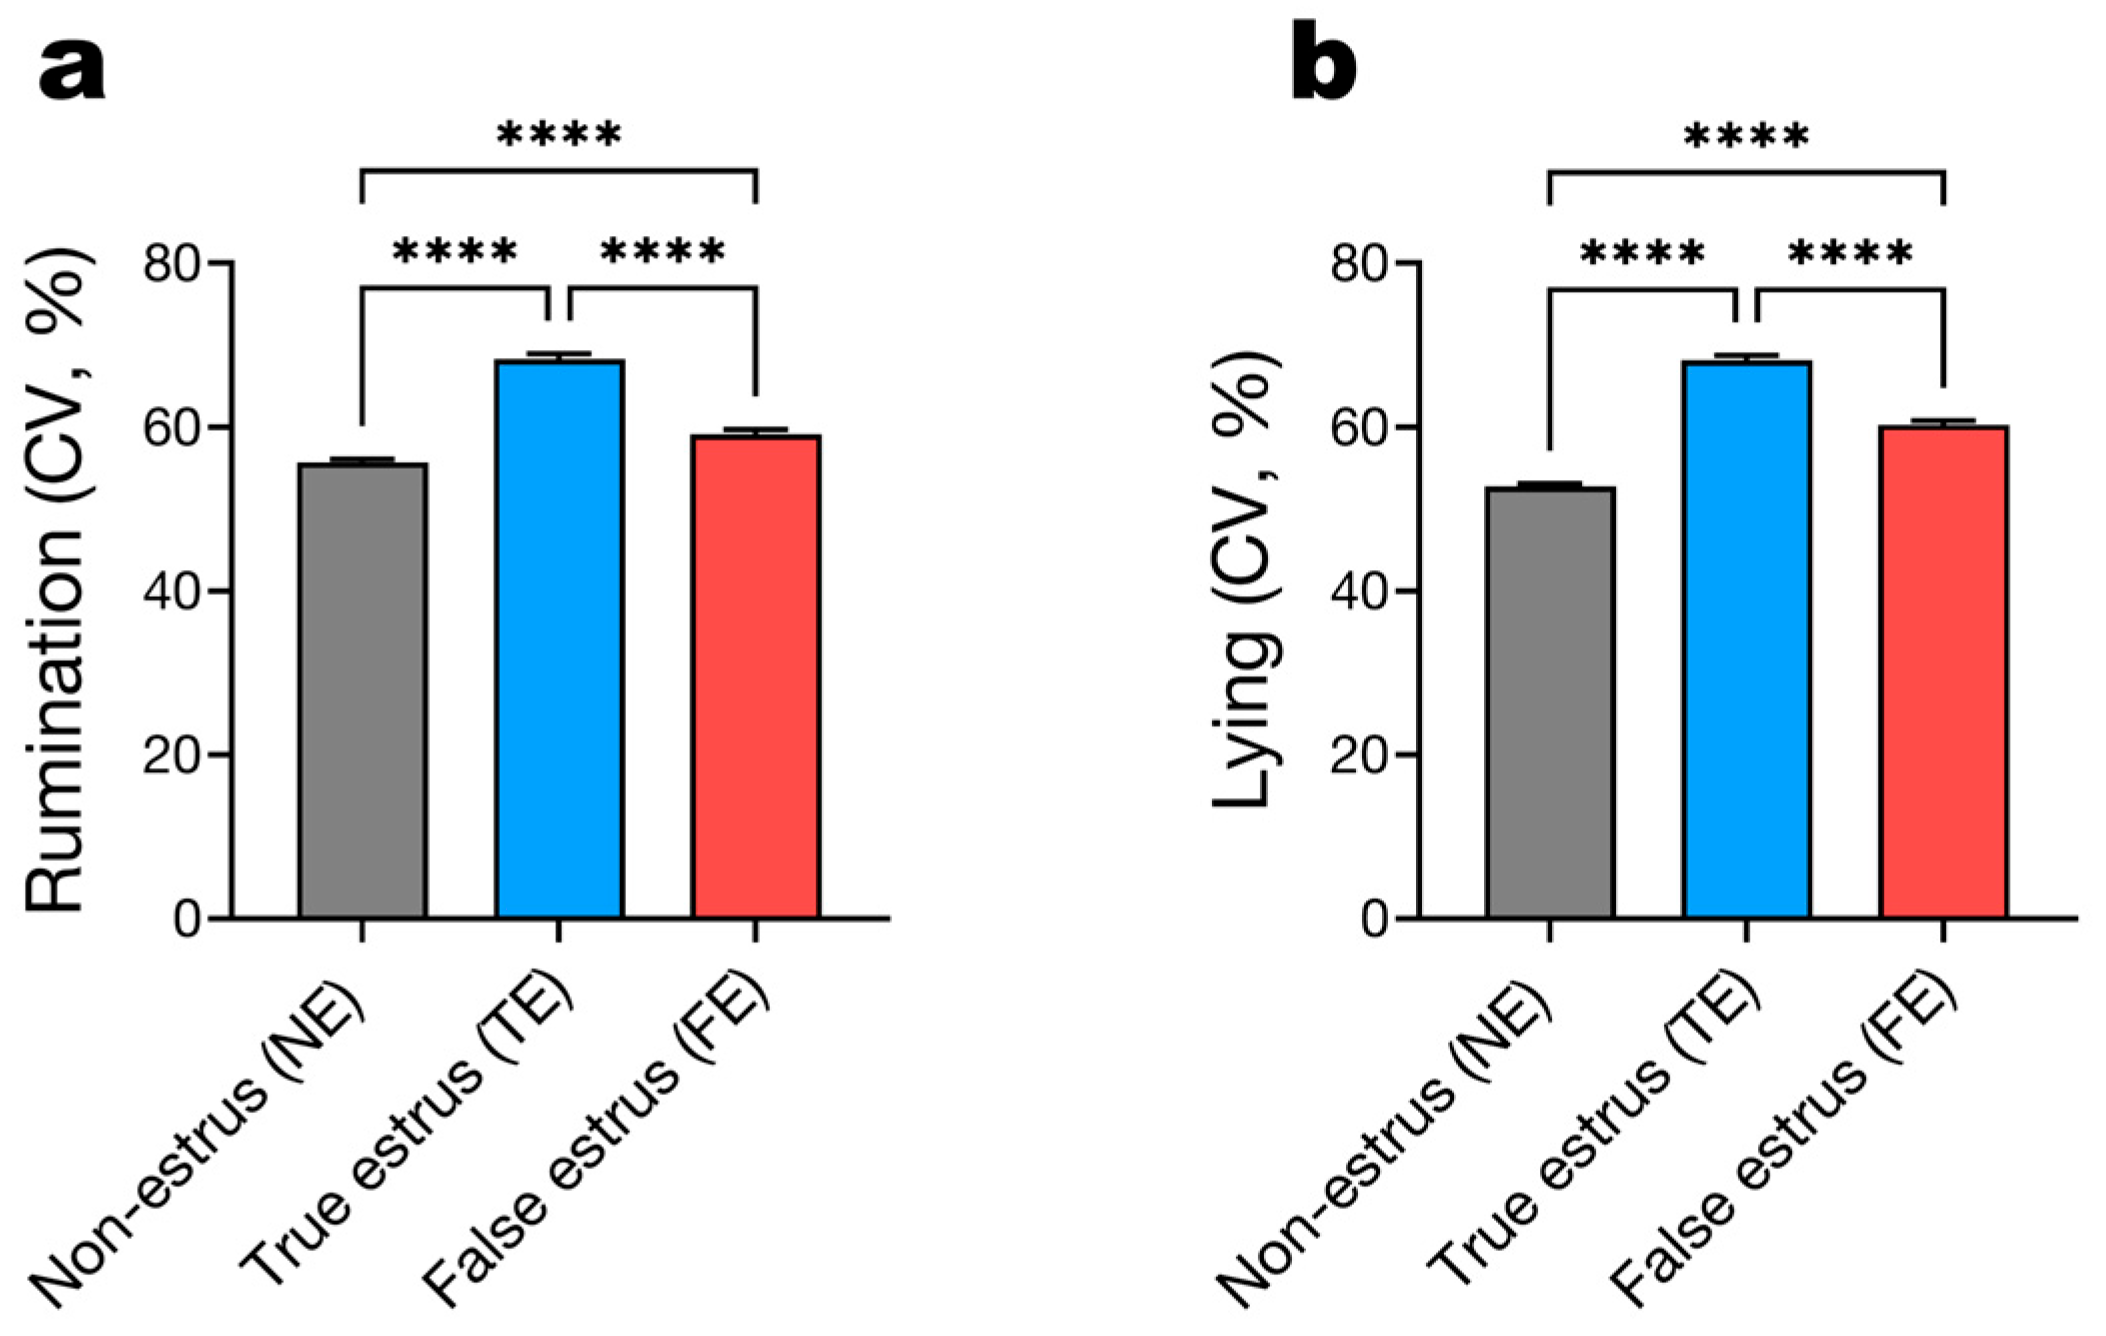
To assess the degree of behavioral disruption associated with estrus alerts, CV for rumination time and lying time were compared among NE, TE, and FE periods (Figure 8). For rumination time, the CV was significantly lower in the NE group (55.7 ± 0.4%) compared to both TE (68.3 ± 0.6%) and FE (59.2 ± 0.6%) groups (p < 0.0001). Moreover, TE exhibited significantly higher rumination CV than FE (p < 0.0001). Similarly, the CV for lying time was significantly lower (p < 0.0001) in the NE group (52.7 ± 0.4%) compared to both TE (68.2 ± 0.6%) and FE groups (60.3 ± 0.5%). Additionally, TE showed significantly higher (p < 0.0001) lying time CV than FE.

3.5. Temporal Dynamics of Rumination and Lying Behavior

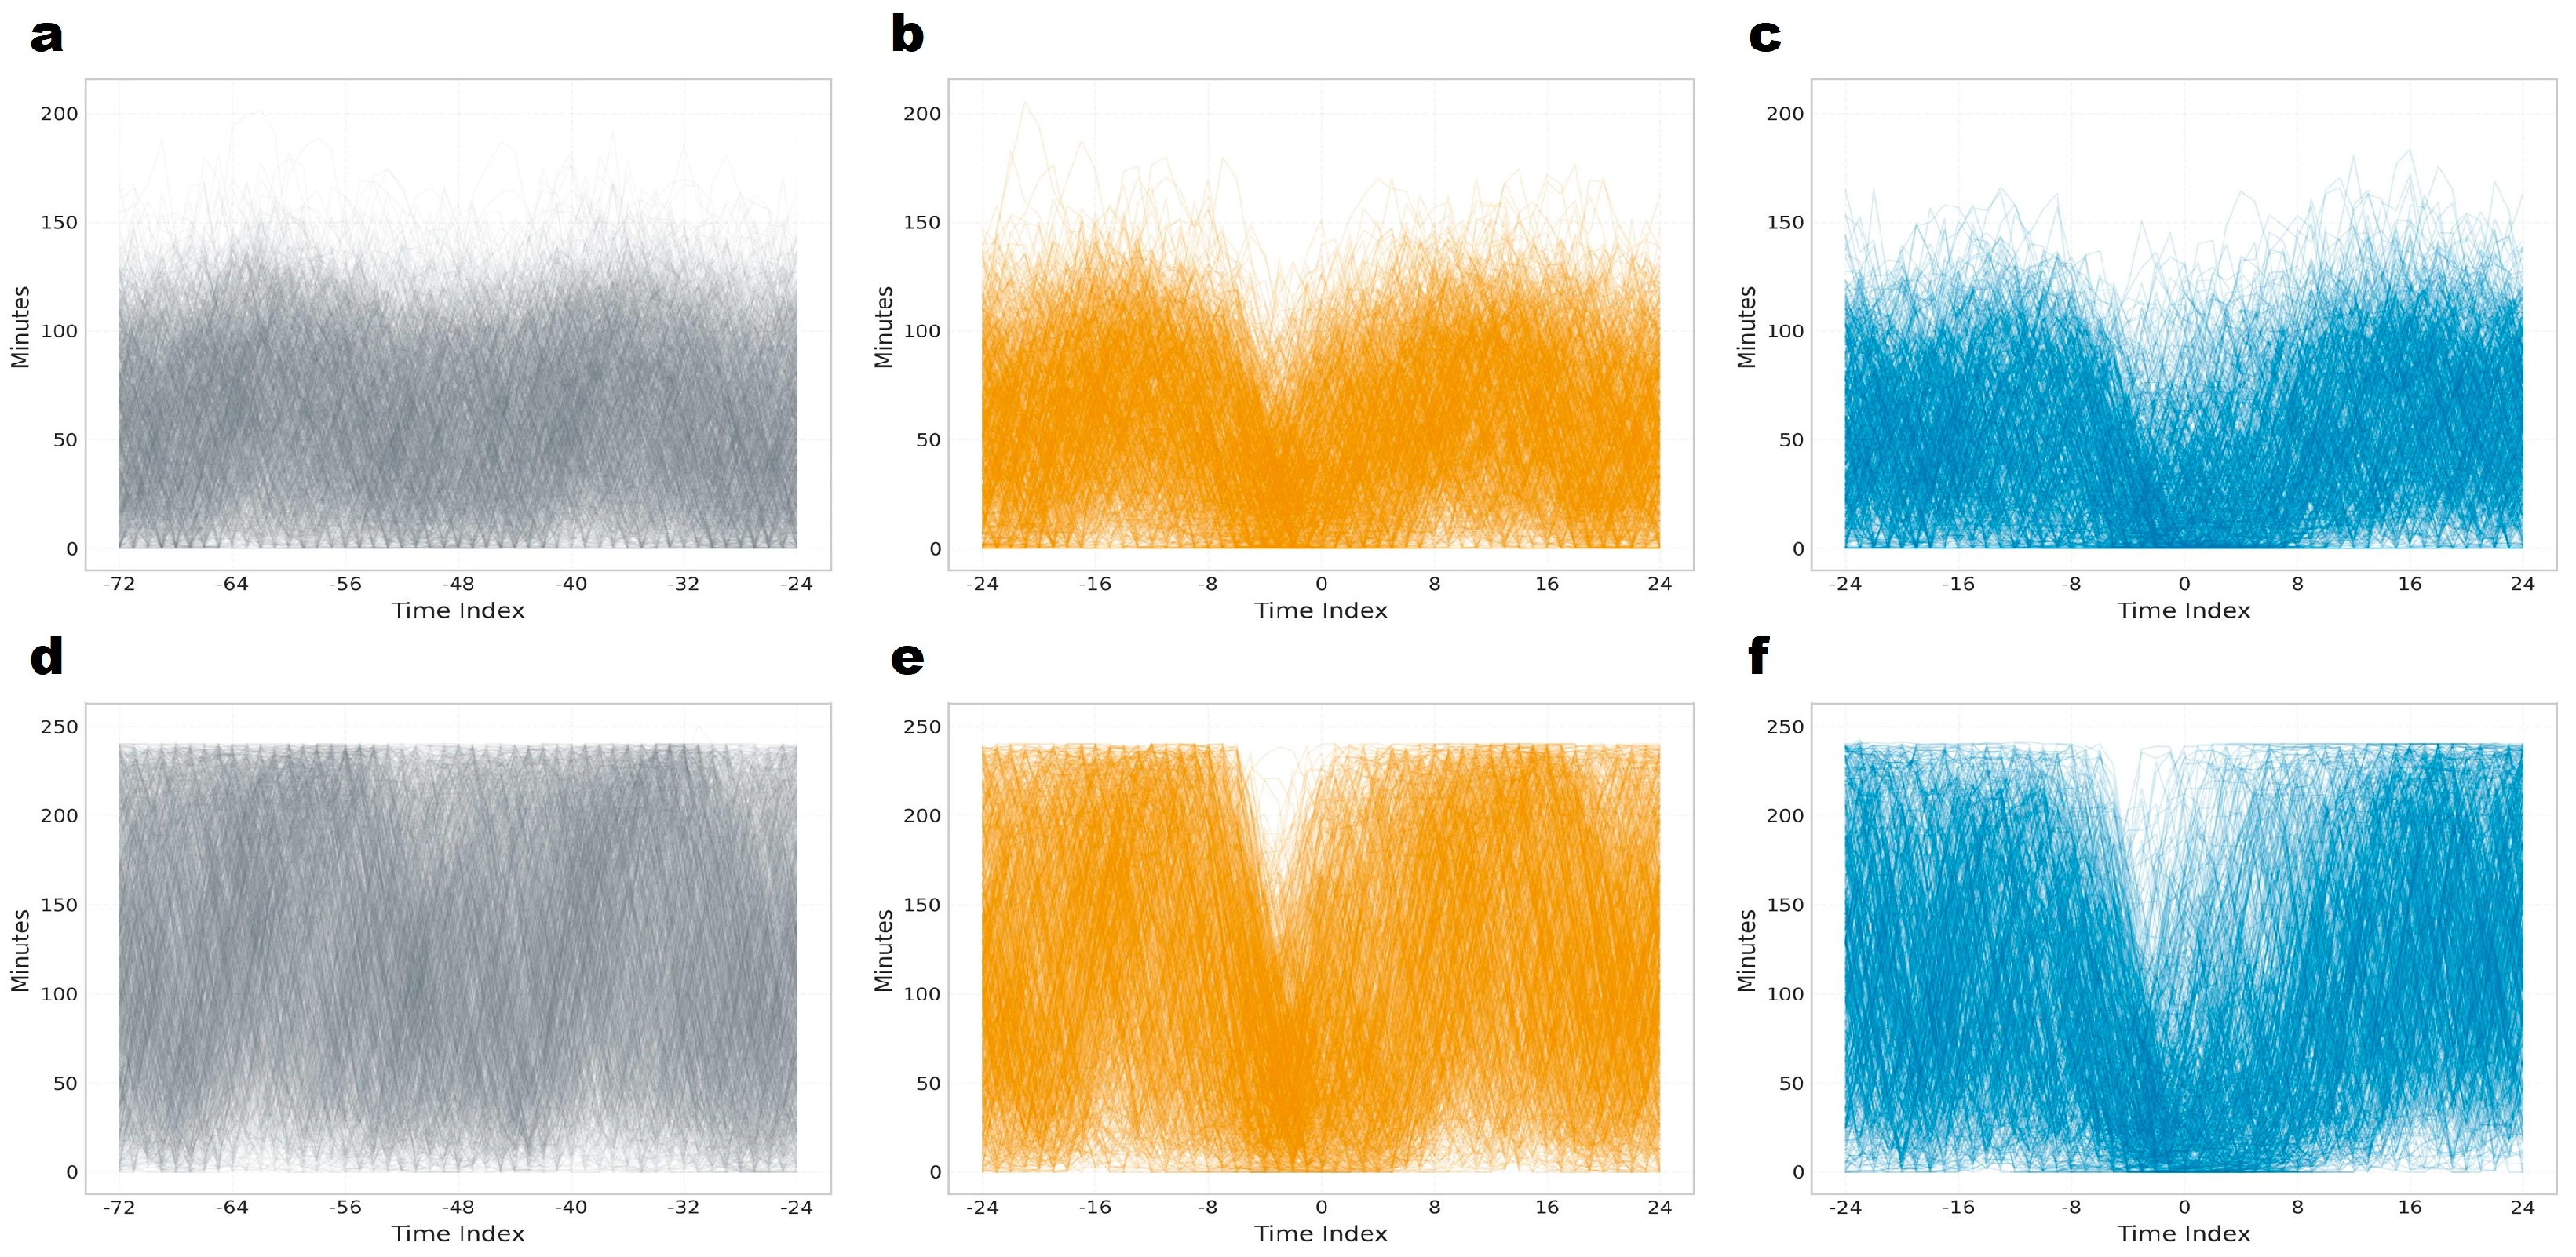
The temporal trajectories of rumination and lying time surrounding estrus alert generation are visualized in Figure 9. The NE group exhibited relatively stable and dispersed patterns throughout the observation period, with no systematic convergence of trajectories relative to the reference time point.
In contrast, both FE and TE groups demonstrated behavioral changes surrounding the estrus alert. For rumination time, both groups showed declining patterns converging toward the alert time point (time index 0), followed by recovery. Similarly, lying time in both FE and TE groups displayed a reduction around the alert time with subsequent recovery. The convergence of individual trajectories toward reduced values at the alert time point in both FE and TE groups, contrasting with the stable dispersed patterns in the NE group.

4. Discussion

The primary objective of this study was to characterize the behavioral differences between TE and FE in cows using neck-mounted six-axis IMU sensors, with the aim of reducing false-positive rates in automated estrus detection systems. Through retrospective analysis of 1464 validated estrus alerts from 414 Hanwoo cows across 13 commercial farms, the present study demonstrated that secondary behavioral signs, including mounting activity, rumination time, and lying time, exhibited distinct quantitative and temporal patterns that effectively distinguished TE from FE events.
The circadian distribution of estrus alerts showed peak occurrences during midday hours for both TE and FE groups, with relatively lower frequencies during early morning hours (Figure 2). While previous studies have reported that estrus onset predominantly occurs during nighttime or early morning hours in cows [14,26,27], the present results suggest that alert generation patterns may be influenced by farm activity and social interactions rather than solely reflecting the physiological timing of estrus onset. These findings indicate that temporal distribution patterns should be considered when improving the accuracy of estrus detection systems. The temporal patterns of estrous behavior serve as a major factor causing farm managers to miss appropriate observation windows, and in large-scale operations, detection rates with traditional visual observation alone are notably reduced. Behavioral indicators manifested during estrus, including standing heat acceptance, increased activity, and altered feed intake, are closely associated with hormonal changes, and accurate detection of these physiological changes is essential for determining the optimal timing of artificial insemination [15,28].
The mounting behavior analysis using six-axis IMU sensors in the present study yielded quantitative results consistent with previous IMU-based estrus detection research. The significantly higher total number of mounts in the TE group (81.0 ± 1.9 mounts) compared to the FE group (50.8 ± 1.3 mounts) aligns with the findings of Cheon et al. [29] in Hanwoo cows. The elevated maximum mounting duration observed in TE (3.9 ± 0.1 h versus 2.7 ± 0.1 h in FE) likely reflects the complete activation of the hypothalamic-pituitary-gonadal axis and subsequent luteinizing hormone surge characteristic of ovulatory estrus, whereas FE may involve only transient hormonal fluctuations without a full endocrine cascade [30]. This finding corresponds with the behavioral persistence during estrus reported by Wang et al. [21]. Perez Marquez et al. [15] reported increases in both activity and ear temperature using ear-mounted accelerometers during estrus, and the discriminatory capacity of the mounting parameters analyzed in the present study suggests that physiological and behavioral indicators can be used complementarily in estrus detection.
The temporal analysis of mounting behavior revealed distinct patterns between TE and FE across the observation period. The total number of mounts was consistently higher in TE during both the pre-period (34.9 ± 0.8 versus 29.3 ± 0.6 mounts) and post-period (46.1 ± 1.6 versus 21.5 ± 1.0 mounts), with the differential markedly amplified post-alert. Interestingly, when examining the maximum number of mounts per hour, FE actually showed higher values during the pre-period (10.5 ± 0.2 versus 9.6 ± 0.2 mounts in TE), suggesting that transient social mounting behaviors or dominance interactions may trigger alerts without reflecting true reproductive status [31]. However, this pattern reversed dramatically post-alert, with TE maintaining elevated activity while FE declined rapidly. This sustained post-alert mounting in TE likely reflects the physiological persistence between estrogen peak and ovulation, during which behavioral receptivity is maintained by ongoing follicular maturation [32], and corresponds with the high sensitivity within short time windows reported by Wang et al. [21]. The probability density distribution analysis further illustrated this temporal distinction, with FE concentrated at lower mount counts (0–20 mounts) during the post-period, whereas TE displayed a broader distribution extending to 50–100 mounts. These findings align with the high detection rates reported by Weber et al. [33] using three-dimensional accelerometer systems and the improved performance achieved through local cascade ensemble approaches by Fauvel et al. [34]. The substantial differentials observed in total mounting count (60% increase in TE) and maximum mounting duration (46% increase in TE) suggest that temporal dynamics of mounting behavior, particularly post-alert patterns, could serve as valuable criteria for algorithm refinement in automated estrus detection systems. Distinguishing transient socially driven mounting from sustained reproductive mounting may enhance algorithm specificity while preserving the biological relevance of behavioral monitoring.
The changes in rumination and lying behavior observed during estrus in Hanwoo breeding cows in this study showed high consistency with findings from other research, confirming the universal applicability of behavioral estrus detection techniques. The elevated coefficients of variation for rumination and lying behavior in the TE group (68.3 ± 0.6% and 68.2 ± 0.6%, respectively) contrasted with the relatively stable patterns in the FE (59.2 ± 0.6% and 60.3 ± 0.5%) and NE groups (55.7 ± 0.4% and 52.7 ± 0.4%). This increased variability may arise from competition between reproductive and maintenance behaviors during TE [35]. The importance of distinguishing TE from FE through behavioral variability is further emphasized by Perez Marquez et al. [36], and considering the report by Sheldon et al. [37] that estrus-like behaviors can be observed in approximately 8 to 10 percent of individuals during pregnancy, the diagnostic value of behavioral variability analysis is deemed substantial. The high coefficients of variation for rumination and lying observed in the TE group indicate considerable individual differences in behavioral changes during estrus, which directly supports the findings of Abeni et al. [38] that individual factors account for more than 60 percent of behavioral variation. These individual differences align with the report by Weber et al. [33] that individual baseline establishment was essential for achieving 92 percent detection rates in commercial systems, suggesting the importance of individual learning periods and continuous calibration algorithms in the development of practical estrus detection systems.
The sharp decline and recovery pattern of rumination time surrounding estrus alerts observed in the TE group showed similar trends to the average reduction of 31 min reported by Mičiaková et al. [39] across 634 estrous cycles and the 61.8 min reduction reported by Codl et al. [40]. In particular, the characteristic U-shaped pattern, which began approximately 8 h before the estrus alert, reached its minimum at the time of estrus, and then gradually recovered, demonstrated temporal consistency with the progressive decline starting 2 days before estrus followed by recovery within 1 to 3 days reported by Toušová et al. [41]. The sharp decline and recovery pattern observed in lying time before and after estrus alerts also corresponded with the 188 min reduction in time spent lying on the day of estrus reported by Zhou et al. [42]. These results reconfirmed that rumination and lying are reliable maintenance behaviors serving as estrus detection indicators in cows.
The present study analyzed the potential utility of secondary behavioral signs of estrus, including mounting, rumination, and lying, with the objective of refining the distinction between non-estrus and estrus to reduce false positive detection rates. Since false positives represent a persistent weakness of accelerometer-based detection systems with high estrus detection rates, technologies to filter them are essential. Physiologically, accurate detection techniques exist to distinguish estrus from FE in dairy cows using milk progesterone (IMP4) assays [43]; however, behavioral standard references remain limited, and practical application to beef cows in field conditions still faces constraints. A limitation of the present study is the reliance solely on behavioral parameters without concurrent validation using physiological markers such as progesterone profiles. Nevertheless, research efforts to improve accuracy by combining physiological status with behavioral indicators [44] or utilizing composite behavioral indices [45] continue to advance. It is anticipated that estrus detection technology will become more sophisticated and practical when multiple meaningful behavioral indicators, including those identified in the present study, are comprehensively integrated through learning algorithms in the future.

5. Conclusions

This study demonstrates that neck-mounted IMU sensors can effectively differentiate TE from FE in Hanwoo cows through quantitative analysis of secondary behavioral signs. Post-alert mounting activity patterns emerged as the most discriminative feature, with TE maintaining sustained elevation while FE declined rapidly. The elevated coefficients of variation in rumination and lying time during TE further confirmed greater behavioral disruption associated with genuine reproductive events. These quantified behavioral criteria provide an evidence base for algorithm refinement, suggesting that integration of temporal dynamics alongside magnitude measurements could enhance specificity in automated estrus detection systems and ultimately improve reproductive management efficiency in cattle production.

Supplementary Materials

The following supporting information can be downloaded at: https://www.mdpi.com/article/10.3390/agriculture15212307/s1, Figure S1: Temporal distribution of mounting behavior in true estrus (TE; n = 625) and false estrus (FE; n = 839) events across the observation period.

Author Contributions

Conceptualization, S.-J.K. and N.-Y.K.; Formal analysis, S.-J.K. and N.-Y.K.; Methodology, S.-J.K., X.-C.J. and N.-Y.K.; Software, X.-C.J. and N.-Y.K.; Validation, S.-J.K. and N.-Y.K.; Investigation, S.-J.K. and N.-Y.K.; Resources, S.-J.K.; Data curation, S.-J.K., X.-C.J. and N.-Y.K.; Writing—original draft, S.-J.K., X.-C.J., R.B. and N.-Y.K.; Writing—review and editing, S.-J.K., X.-C.J., R.B. and N.-Y.K.; Visualization, X.-C.J. and N.-Y.K.; Project administration, N.-Y.K. All authors have read and agreed to the published version of the manuscript.

Funding

This work was supported by Korea Institute of Planning and Evaluation for Technology in Food, Agriculture and Forestry (IPET) and Korea Smart Farm R&D Foundation (KosFarm) through Smart Farm Innovation Technology Development Program, funded by Ministry of Agriculture, Food and Rural Affairs (MAFRA) and Ministry of Science and ICT (MSIT), Rural Development Administration (RDA) (RS-2024-00402276).

Institutional Review Board Statement

This study was approved by the Institutional Animal Care and Use Committee of Seoul National University (approval number: SNU-250112-2).

Data Availability Statement

The original contributions of this study are incorporated within the article. For further information or requests regarding the data, please contact the corresponding author.

Acknowledgments

We would like to express our sincere gratitude to Bodit Inc. for their valuable technical assistance.

Conflicts of Interest

The authors declare no conflicts of interest.

Abbreviations

TETrue estrus
FEFalse estrus
IMUInertial measurement unit
NENon-estrus
CVCoefficient of variation
CDFCumulative distribution functions

References

  1. Lucy, M.C. Reproductive Loss in High-Producing Dairy Cattle: Where Will It End? J. Dairy Sci. 2001, 84, 1277–1293. [Google Scholar] [CrossRef]
  2. Walsh, S.W.; Williams, E.J.; Evans, A.C.O. A review of the causes of poor fertility in high milk producing dairy cows. Anim. Reprod. Sci. 2011, 123, 127–138. [Google Scholar] [CrossRef]
  3. de Vries, A.; Conlin, B.J. Economic Value of Timely Determination of Unexpected Decreases in Detection of Estrus Using Control Charts. J. Dairy Sci. 2003, 86, 3516–3526. [Google Scholar] [CrossRef]
  4. Gerber, P.; Henderson, B.; Makkar, H. Mitigation of Greenhouse Gas Emissions in Livestock Production: A Review of Technical Options for Non-CO2 Emissions; FAO Animal Production and Health Paper (FAO): Rome, Italy, 2013. [Google Scholar]
  5. Archer, S.C.; Green, M.J.; Huxley, J.N. Association between milk yield and serial locomotion score assessments in UK dairy cows. J. Dairy Sci. 2010, 93, 4045–4053. [Google Scholar] [CrossRef]
  6. Firk, R.; Stamer, E.; Junge, W.; Krieter, J. Automation of oestrus detection in dairy cows: A review. Livest. Prod. Sci. 2002, 75, 219–232. [Google Scholar] [CrossRef]
  7. Roelofs, J.; López-Gatius, F.; Hunter, R.H.F.; van Eerdenburg, F.J.C.M.; Hanzen, C. When is a cow in estrus? Clinical and practical aspects. Theriogenology 2010, 74, 327–344. [Google Scholar] [CrossRef]
  8. López-Gatius, F. Revisiting the Timing of Insemination at Spontaneous Estrus in Dairy Cattle. Animals 2022, 12, 3565. [Google Scholar] [CrossRef]
  9. Roelofs, J.B.; van Eerdenburg, F.J.C.M.; Soede, N.M.; Kemp, B. Various behavioral signs of estrous and their relationship with time of ovulation in dairy cattle. Theriogenology 2005, 63, 1366–1377. [Google Scholar] [CrossRef]
  10. Santos, C.A.d.; Landim, N.M.D.; Araújo, H.X.d.; Paim, T.d.P. Automated Systems for Estrous and Calving Detection in Dairy Cattle. AgriEngineering 2022, 4, 475–482. [Google Scholar] [CrossRef]
  11. Orihuela, A.n. Some factors affecting the behavioural manifestation of oestrus in cattle: A review. Appl. Anim. Behav. Sci. 2000, 70, 1–16. [Google Scholar] [CrossRef] [PubMed]
  12. Gwazdauskas, F.C.; Lineweaver, J.A.; McGilliard, M.L. Environmental and Management Factors Affecting Estrous Activity in Dairy Cattle. J. Dairy Sci. 1983, 66, 1510–1514. [Google Scholar] [CrossRef]
  13. Sveberg, G.; Refsdal, A.O.; Erhard, H.W.; Kommisrud, E.; Aldrin, M.; Tvete, I.F.; Buckley, F.; Waldmann, A.; Ropstad, E. Behavior of lactating Holstein-Friesian cows during spontaneous cycles of estrus. J. Dairy Sci. 2011, 94, 1289–1301. [Google Scholar] [CrossRef]
  14. Reith, S.; Hoy, S. Review: Behavioral signs of estrus and the potential of fully automated systems for detection of estrus in dairy cattle. Animal 2018, 12, 398–407. [Google Scholar] [CrossRef]
  15. Perez Marquez, H.J.; Ambrose, D.J.; Bench, C.J. Behavioral changes to detect estrus using ear-sensor accelerometer compared to in-line milk progesterone in a commercial dairy herd. Front. Anim. Sci. 2023, 4, 1149085. [Google Scholar] [CrossRef]
  16. Aungier, S.P.M.; Roche, J.F.; Sheehy, M.; Crowe, M.A. Effects of management and health on the use of activity monitoring for estrus detection in dairy cows. J. Dairy Sci. 2012, 95, 2452–2466. [Google Scholar] [CrossRef] [PubMed]
  17. NIAS. Korean Feeding Standard for Hanwoo, 4th ed.; National Institute of Animal Science: Wanju, Republic of Korea, 2022. [Google Scholar]
  18. Kim, S.-J.; Jin, X.-C.; Bharanidharan, R.; Kim, N.-Y. Monitoring Multiple Behaviors in Beef Calves Raised in Cow–Calf Contact Systems Using a Machine Learning Approach. Animals 2024, 14, 3278. [Google Scholar] [CrossRef] [PubMed]
  19. Stangaferro, M.L.; Wijma, R.; Caixeta, L.S.; Al-Abri, M.A.; Giordano, J.O. Use of rumination and activity monitoring for the identification of dairy cows with health disorders: Part I. Metabolic and digestive disorders. J. Dairy Sci. 2016, 99, 7395–7410. [Google Scholar] [CrossRef]
  20. Riaboff, L.; Couvreur, S.; Madouasse, A.; Roig-Pons, M.; Aubin, S.; Massabie, P.; Chauvin, A.; Bédère, N.; Plantier, G. Use of Predicted Behavior from Accelerometer Data Combined with GPS Data to Explore the Relationship between Dairy Cow Behavior and Pasture Characteristics. Sensors 2020, 20, 4741. [Google Scholar] [CrossRef]
  21. Wang, J.; Bell, M.; Liu, X.; Liu, G. Machine-Learning Techniques Can Enhance Dairy Cow Estrus Detection Using Location and Acceleration Data. Animals 2020, 10, 1160. [Google Scholar] [CrossRef]
  22. Carslake, C.; Occhiuto, F.; Vázquez-Diosdado, J.A.; Kaler, J. Repeatability and Predictability of Calf Feeding Behaviors—Quantifying Between- and Within-Individual Variation for Precision Livestock Farming. Front. Vet. Sci. 2022, 9, 827124. [Google Scholar] [CrossRef]
  23. Piñeiro, J.M.; Menichetti, B.T.; Barragan, A.A.; Relling, A.E.; Weiss, W.P.; Bas, S.; Schuenemann, G.M. Associations of postpartum lying time with culling, milk yield, cyclicity, and reproductive performance of lactating dairy cows. J. Dairy Sci. 2019, 102, 3362–3375. [Google Scholar] [CrossRef]
  24. Braun, U.; Zürcher, S.; Hässig, M. Eating and rumination activity in 10 cows over 10 days. Res. Vet. Sci. 2015, 101, 196–198. [Google Scholar] [CrossRef]
  25. Vanhoudt, A.; van Winden, S.; Fishwick, J.C.; Bell, N.J. Monitoring cow comfort and rumen health indices in a cubicle-housed herd with an automatic milking system: A repeated measures approach. Ir. Vet. J. 2015, 68, 12. [Google Scholar] [CrossRef] [PubMed]
  26. Reith, S.; Brandt, H.; Hoy, S. Simultaneous analysis of activity and rumination time, based on collar-mounted sensor technology, of dairy cows over the peri-estrus period. Livest. Sci. 2014, 170, 219–227. [Google Scholar] [CrossRef]
  27. Cheon Si, N.; Yoo Geum, Z.; Kim Chan, H.; Jung Ji, Y.; Kim Dong, H.; Jeon Jung, H. Study on behavioral change of estrus in Hanwoo (Korean native cattle). J. Korea Acad. Ind. Coop. Soc. 2020, 21, 825–832. [Google Scholar] [CrossRef]
  28. Mayo, L.M.; Silvia, W.J.; Ray, D.L.; Jones, B.W.; Stone, A.E.; Tsai, I.C.; Clark, J.D.; Bewley, J.M.; Heersche, G., Jr. Automated estrous detection using multiple commercial precision dairy monitoring technologies in synchronized dairy cows. J. Dairy Sci. 2019, 102, 2645–2656. [Google Scholar] [CrossRef]
  29. Cheon, S.N.; Park, G.-W.; Park, K.-H.; Jeon, J.H. Peri-estrus activity and mounting behavior and its application to estrus detection in Hanwoo (Korea Native Cattle). J. Anim. Sci. Technol. 2023, 65, 748–758. [Google Scholar] [CrossRef]
  30. Crowe, M.A.; Mullen, M. Regulation and Function of Gonadotropins Throughout the Bovine Oestrous Cycle. In Gonadotropin; Vizcarra, J.A., Ed.; IntechOpen: London, UK, 2013. [Google Scholar]
  31. Blackshaw, J.K.; Blackshaw, A.W.; McGlone, J.J. Buller steer syndrome review. Appl. Anim. Behav. Sci. 1997, 54, 97–108. [Google Scholar] [CrossRef]
  32. Williams, G.L.; Cardoso, R.C. Neuroendocrine Control of Estrus and Ovulation. In Bovine Reproduction; Wiley: Hoboken, NJ, USA, 2021; pp. 269–291. [Google Scholar]
  33. Weber, W.E.; Looney, C.R.; Rook, W.L. 136 Application of Ear-attached Sensor Technology (CowManager) to Detect Estrus in a Commercial Beef Cow AI Program. J. Anim. Sci. 2022, 100, 6. [Google Scholar] [CrossRef]
  34. Fauvel, K.; Masson, V.; Fromont, É.; Faverdin, P.; Termier, A. Towards Sustainable Dairy Management—A Machine Learning Enhanced Method for Estrus Detection. In Proceedings of the 25th ACM SIGKDD International Conference on Knowledge Discovery & Data Mining, Anchorage, AK, USA, 4–8 August 2019; pp. 3051–3059. [Google Scholar]
  35. Walker, S.; Smith, R.; Routly, J.; Jones, D.; Morris, M.; Dobson, H. Lameness, activity time-budgets, and estrus expression in dairy cattle. J. Dairy Sci. 2008, 91, 4552–4559. [Google Scholar] [CrossRef] [PubMed]
  36. Perez Marquez, H.J.; Ambrose, D.J.; Schaefer, A.L.; Cook, N.J.; Bench, C.J. Evaluation of infrared thermography combined with behavioral biometrics for estrus detection in naturally cycling dairy cows. Animal 2021, 15, 100205. [Google Scholar] [CrossRef]
  37. Sheldon, I.; Dobson, H. Reproductivechallengesfacing the cattle industry at the beginningof the 21st century. Reproduction 2003, 61, 1–13. [Google Scholar]
  38. Abeni, F.; Galli, A. Monitoring cow activity and rumination time for an early detection of heat stress in dairy cow. Int. J. Biometeorol. 2017, 61, 417–425. [Google Scholar] [CrossRef] [PubMed]
  39. Mičiaková, M.; Strapák, P.; Strapáková, E.; Szencziová, I. Evaluating Rumination Time Changes During Estrus in Dairy Cows. Dairy 2025, 6, 5. [Google Scholar] [CrossRef]
  40. Codl, R.; Ducháček, J.; Vacek, M.; Pytlík, J.; Stádník, L.; Vrhel, M. Relationship between daily activities duration and oestrus in dairy cows over the year. Acta Vet. Brno 2022, 91, 11–16. [Google Scholar] [CrossRef]
  41. Toušová, R.; Ducháček, J.; Codl, R.; Pytlík, J.; Ptáček, M.; Gašparík, M.; Stádník, L. Rumination Time Monitoring as a Possible Tool to Improve Diagnostics of Heat and Parturition. Acta Univ. Agric. Silvic. Mendel. Brun. 2020, 68, 109–117. [Google Scholar] [CrossRef]
  42. Zhou, X.; Xu, C.; Gomes Lopes, M.; Loor, J.J.; Shao, Y.; Jia, B.; Shao, G.; Huang, B. Characterization of the physical and ruminal activities related to estrus in dairy cows raised on Chinese commercial farms. Vet. Arh. 2023, 93, 143–158. [Google Scholar] [CrossRef]
  43. Morton, J.M.; Wynn, P.C. Assessing ovulation detection performance in commercial dairy herds using progesterone concentrations from limited numbers of strategically collected milk samples. J. Dairy Sci. 2010, 93, 3019–3030. [Google Scholar] [CrossRef]
  44. Schilkowsky, E.M.; Granados, G.E.; Sitko, E.M.; Masello, M.; Perez, M.M.; Giordano, J.O. Evaluation and characterization of estrus alerts and behavioral parameters generated by an ear-attached accelerometer-based system for automated detection of estrus. J. Dairy Sci. 2021, 104, 6222–6237. [Google Scholar] [CrossRef]
  45. Daoerji, F.; Huijuan, W. Research of Estrus Detection Models in Dairy Cows by Activity. Sci. Discov. 2018, 6, 102–109. [Google Scholar] [CrossRef]
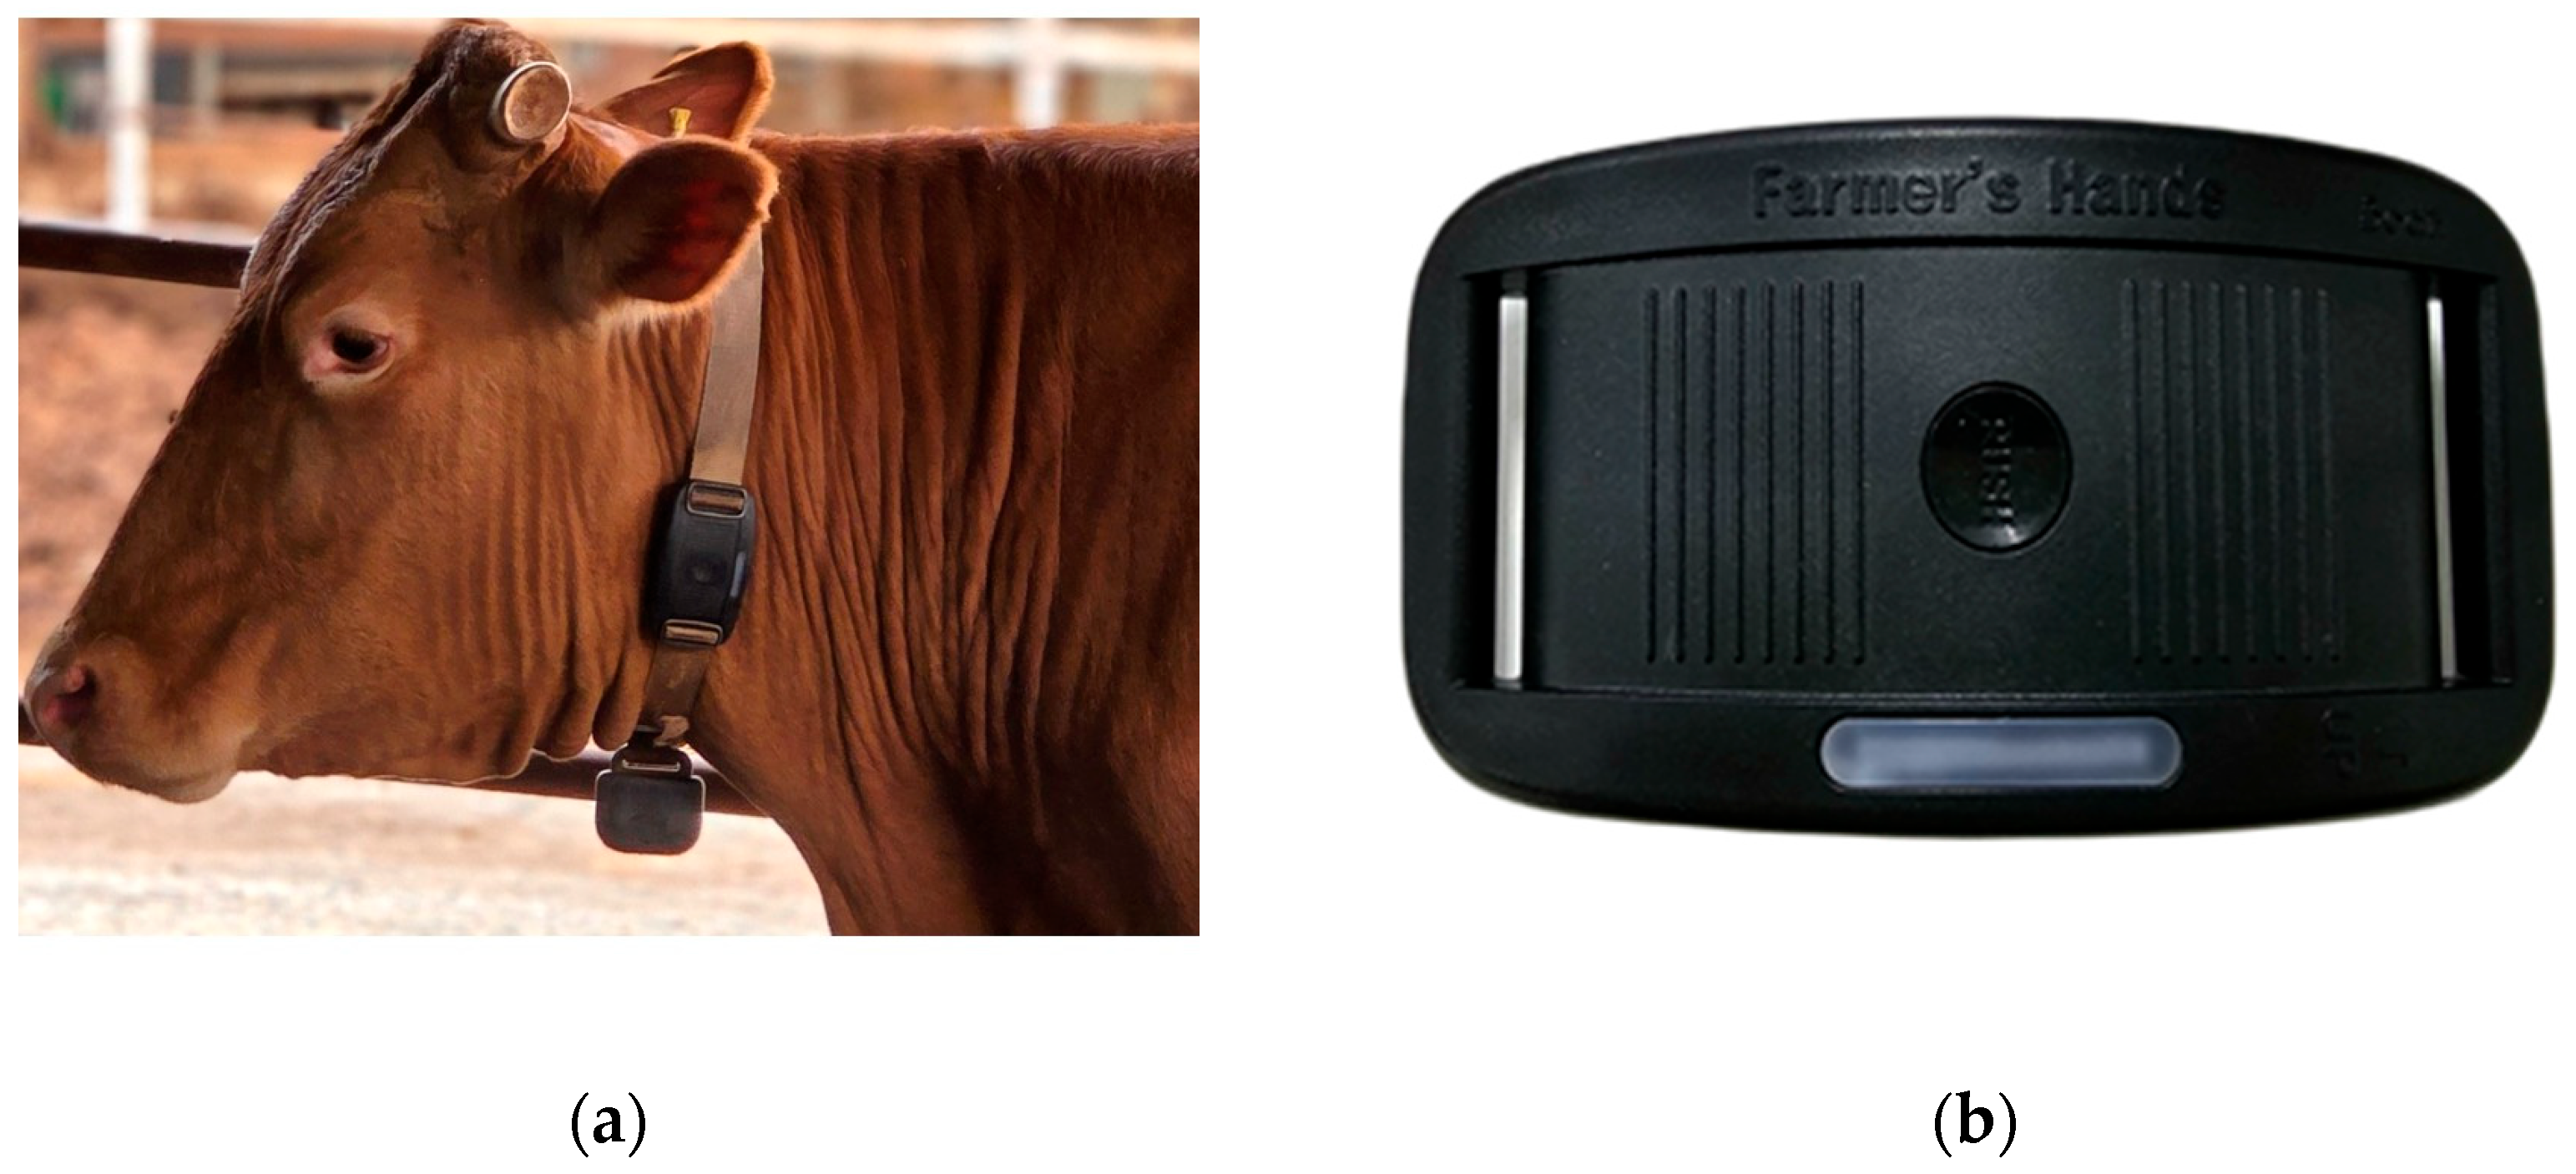
Figure 1. Neck-mounted inertial measurement unit (IMU) sensor system for estrus detection in Hanwoo cows. (a) Sensor device attached to the left side of a cow’s neck using an adjustable collar strap; (b) Sensor device (Farmer’s Hands, Bodit Inc., Seoul, Republic of Korea).
Agriculture 15 02307 g001
Figure 2. Flow diagram of estrus alert validation and classification process in Hanwoo cows.
Agriculture 15 02307 g002
Figure 3. Circadian distribution of estrus alert generation in true estrus (TE; n = 625) and false estrus (FE; n = 839) events in Hanwoo cows.
Agriculture 15 02307 g003
Figure 4. Comparison of mounting behavior parameters between true estrus (TE; n = 625) and false estrus (FE; n = 839) alerts in Hanwoo cows. (a) Maximum number of mounts per hour; (b) Total number of mounts during the 25 h observation period; (c) Maximum mounting duration, defined as the longest consecutive period with high mounting activity (≥5 mounts/h). Data are presented as mean ± SEM. **** indicates p < 0.0001.
Agriculture 15 02307 g004
Figure 5. Frequency distribution and cumulative distribution functions (CDF) of mounting behavior parameters in true estrus (TE; n = 625) versus false estrus (FE; n = 839) alerts. (ac) Relative frequency distributions for maximum number of mounts, total number of mounts, and maximum mounting duration, respectively; (df) Corresponding cumulative distribution functions comparing TE and FE groups for each mounting parameter.
Agriculture 15 02307 g005
Figure 6. Temporal comparison of mounting behavior parameters before and after estrus alert generation in true estrus (TE; n = 625) versus false estrus (FE; n = 839) events. Maximum number of mounts per hour during (a) the pre-period (12 to 1 h before alert) and (b) the post-period (0 to 12 h after alert); Total number of mounts during (c) the pre-period and (d) the post-period. Data are presented as mean ± SEM. **** indicates p < 0.0001.
Agriculture 15 02307 g006
Figure 7. Frequency distributions and cumulative distribution functions (CDF) of mounting parameters stratified by time period relative to estrus alert. (ad) Relative frequency distributions of the maximum number of mounts during the pre-period (12 to 1 h before alert), maximum number of mounts during the post-period (0 to 12 h after alert), total number of mounts during the pre-period, and total number of mounts during the post-period, respectively; (eh) Corresponding cumulative distribution functions for each parameter, comparing true estrus (TE; n = 625) and false estrus (FE; n = 839) groups.
Agriculture 15 02307 g007
Figure 8. Coefficients of variation (CV) for rumination time and lying time across non-estrus (NE; n = 1463), true estrus (TE; n = 625), and false estrus (FE; n = 839) periods. (a) rumination time CV and (b) Lying time CV across different estrus periods. Data are presented as mean ± SEM. **** indicates p < 0.0001.
Agriculture 15 02307 g008
Figure 9. Temporal trajectories of rumination time and lying time surrounding estrus alert generation in non-estrus (NE), false estrus (FE), and true estrus (TE) periods. (ac) Individual cow trajectories for rumination time (minutes per 4 h window) plotted relative to alert time (time index 0) for NE, FE, and TE groups, respectively; (df) Corresponding trajectories for lying time. Each line represents an individual cow’s behavioral pattern over the 49 h observation period (−24 to +24 h relative to alert). Time index 0 indicates the moment of estrus alert generation. The density of trajectories reflects the behavioral consistency within each group, with converging patterns indicating synchronized behavioral changes.
Agriculture 15 02307 g009
Table 1. Technical specifications of the neck-mounted inertial measurement unit (IMU) sensor used for estrus detection.
TypeSpecification
ModelFHL2
Sensorsix-axis IMU (accelerometer + gyroscope)
Sampling Rate25 Hz
Data transmissionBluetooth 5.0
Power SupplyLi-Ion 18,650 battery/3.6 V 7000 mAh (3500 mAh × 2EA)
Data Storage128 Mb flash memory
Dimensions127 mm × 67 mm × 33 mm (L × W × H)
Weight216 g
Table 2. Validation criteria for retrospective classification of estrus alerts.
CriterionDescription
Standing Estrus BehaviorThe cow stood immobile when mounted by another cow for at least 2 s, observed a minimum of five times within a 24 h period
Artificial insemination PerformanceRecord of artificial insemination performed by an artificial insemination technician following observed estrus signs
Ovulation ConfirmationDetection of ovulation by rectal palpation or transrectal ultrasonography, with follicles palpated before ovulation and corpus luteum presence confirmed afterward
Return to EstrusObservation of estrus signs 18–24 days post-insemination, indicating a true estrous cycle despite conception failure
Pregnancy ConfirmationConfirmation of pregnancy 30–45 days post-insemination using rectal palpation, ultrasound, or blood test.
Calving VerificationVerification of successful calving at term, providing ultimate confirmation of the preceding estrus event
Disclaimer/Publisher’s Note: The statements, opinions and data contained in all publications are solely those of the individual author(s) and contributor(s) and not of MDPI and/or the editor(s). MDPI and/or the editor(s) disclaim responsibility for any injury to people or property resulting from any ideas, methods, instructions or products referred to in the content.