Abstract
Small-scale poultry farms often lack access to advanced monitoring tools and rely heavily on manual observation, which is time-consuming, inconsistent, and insufficient for precise flock management. Feeding and drinking behaviors are critical, as they serve as early indicators of health and environmental issues. With global poultry production expanding, raising over 70 billion hens annually, there is an urgent need for intelligent, low-cost systems that can continuously and accurately monitor bird behavior in resource-limited farm settings. This paper presents the development of a computer vision-based chicken behavior monitoring system, specifically designed for small barn environments where at most 10–15 chickens are housed at any time. The developed system consists of an object detection model, created on top of the YOLOv8 model, trained with an imagery dataset of laying hen, feeder, and waterer objects. Although chickens are visually indistinguishable, the system processes each detection per frame using bounding boxes and movement-based approximation identification rather than continuous identity tracking. The approach simplifies the tracking process without losing valuable behavior insights. Over 700 frames were annotated manually for high-quality labeled data, with different lighting, hen positions, and interaction angles with dispensers. The images were annotated in YOLO format and used for training the detection model for 100 epochs, resulting in a model having an average mean average precision (mAP@0.5) metric value of 91.5% and a detection accuracy of over 92%. The proposed system offers an efficient, low-cost solution for monitoring chicken feeding and drinking behaviors in small-scale farms, supporting improved management and early health detection.
1. Introduction
Poultry farming is critical in global food security, supplying much of the world’s protein consumption [1]. Monitoring bird behaviors like feeding and drinking is vital, as they indicate the chicken’s health and well-being [2]. While industrial technology and advanced monitoring techniques have benefited large-scale poultry operators, small-scale farms still rely on manual monitoring and well-tried experience, which is time-consuming, inconsistent, and error-prone [3]. These traditional approaches also have limited ability to detect subtle behavioral phenotyping changes. Furthermore, commercial monitoring systems’ high cost and complex setup made them impractical for small-scale poultry houses [4].
Advances in Computer Vision (CV) [5] coupled with Artificial Intelligence (AI) [6], using high-end Internet of Things (IoT) sensors [7], wearable devices [8], and multi-angle cameras [9], have made the automated and real-time monitoring of laying hen behavior in modern poultry systems, particularly in cage-free environments, possible [6]. Automated detection of key behaviors, such as feeding, drinking, and egg-laying, has become increasingly vital for improving welfare, enhancing productivity, and reducing labor [10]. These AI-based systems can provide consistent and real-time bird behavior tracking and are designed specifically for small-scale poultry farms. Using such intelligent systems, farm operators can identify individual chickens and monitor their activities, such as foraging, drinking, and relaxation, which provides invaluable information for maximizing the management of farms [11]. Rapid identification of abnormal behavior of chickens allows interventions to be performed as quickly as possible, thereby reducing the disease transmission risk and improving overall farm productivity [12].
This paper proposes an AI-based monitoring system for detecting hen behavior and tracking their interactions with the feeder and waterer in small barn environments. The developed system uses low-cost hardware to provide real-time visualizations and behavioral summaries to support data-driven poultry management. It runs on basic CPU-based computers without needing GPU-intensive servers, making it ideal for small-scale farms. The system can identify chickens in video streams and classify their interactions with target feeding and watering zones. In particular, instead of tracking chicken identity, the system uses overlapping bounding boxes with predefined feeder and waterer zones to analyze behavior. We also addressed the environmental variability (e.g., lighting, occlusion, etc.) through data augmentation techniques during model training to improve detection accuracy under varied conditions.
To validate the applicability of the proposed approach, we captured an imagery dataset, consisting of 700 images of hen, feeder, and waterer objects, captured at the Poultry Center, Cooperative Agricultural Research Center (CARC), Prairie View A&M University (PVAMU), Prairie View, Texas, USA. Figure 1 shows an example frame from the collected imagery dataset. As shown in the snapshot, the hens were housed in pens measuring 2.0 m in length, 1.2 m in width, and 3.5 m in height. The floor of each pen was lined with clean, dry wood shavings, which were regularly replaced to maintain hygienic conditions and minimize ammonia accumulation.
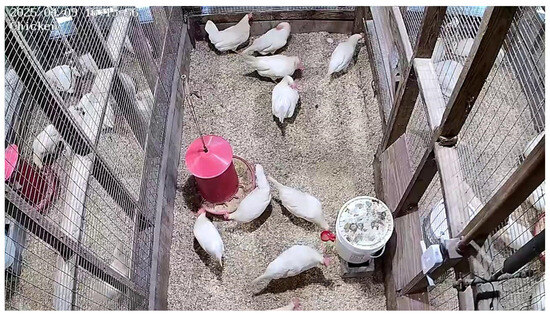
Figure 1.
An example from the imagery dataset showing the hen, feeder, and waterer target objects.
The developed approach operates by finding fixed spatial areas in the video frame corresponding to the feeder and waterer areas. On detection, when the bounding box of a hen overlaps with such defined areas at detection time, it is identified as being involved in feeding or drinking behavior. These behaviors are tracked frame-wise and translated into aggregated time-based behavioral measures. We developed a Graphical User Interface to visualize hen behavior in real time, with overlays showing the target object locations, zone labels, and behavioral statistics. This function provides the poultry operators with actionable insights through visual overlays and Comma Separated Values (CSVs)-based behavior reports.
We trained a YOLOv8 model [13], a lightweight architecture ideal for real-time detection, using 700 manually labeled images. Experimental results demonstrated that the developed system operated reliably by achieving a 91.5% mAP@0.5 detection accuracy, maintaining ID consistency across challenging movement scenarios, delivering approximately 15 frames per second (FPS) real-time performance on CPU-based hardware, and accurately summarizing overall feeding and drinking behaviors. Furthermore, our system uses zone-based analysis rather than tracking individual chickens, reducing complexity and hardware dependency.
The rest of the paper is organized as follows: Section 2 presents related work. Section 3 and Section 4 present the design and prototype implementation of the system, respectively. Section 5 experimentally evaluates the system in terms of performance and accuracy. Finally, Section 6 summarizes the results of this work.
2. Background and Related Work
Traditional methods of monitoring chicken behavior in poultry environments mainly depend on manual observation by farm workers or caretakers [6,10,14]. These practices are often tedious, time-consuming, and prone to human oversight, especially when chickens display subtle behavioral changes that may indicate stress, illness, or other environmental issues. In many small-scale farms or backyard barns, tracking individual chickens and analyzing their feeding and drinking habits becomes increasingly challenging due to limited resources and manpower [15].
Recent global advances in poultry behavior monitoring increasingly rely on CV [5], AI [6], IoT sensors [7], wearable devices [8], and multi-angle camera systems [9] to automate the detection of feeding, drinking, and other key behaviors in large-scale poultry operations [6,10,11]. While these approaches provide high accuracy and detailed phenotyping, they often require complex setups, GPU-intensive computation, and high implementation costs, which make them impractical for smallholder or organic farms. In contrast, the system proposed in this study is designed to be lightweight, low-cost, and accessible: it employs a zone-based detection strategy using overlapping bounding boxes for feeders and waterers, eliminating the need for individual bird identification. This approach allows reliable real-time monitoring on standard CPU-based hardware while maintaining robustness under environmental variability, such as lighting changes and partial occlusion, making it particularly suitable for resource-limited small-scale poultry farms.
In a confined barn environment that typically accommodates around a few dozen chickens, there is a strong demand for an intelligent, low-cost, and automated system that can detect the presence of each chicken, monitor its movement patterns, and determine how much time it spends at feeding and watering stations [10]. Such a system must operate in real time, require minimal manual oversight, and provide accurate insights into daily activity patterns, enabling farm owners to make timely and informed decisions about their livestock’s health and welfare [16]. This paper aims to address this gap by introducing an AI-based solution that eliminates the burden of manual tracking and supports precision poultry management at a smaller scale.
Convolutional Neural Network (CNN)-based systems have driven breakthroughs in visual recognition tasks [9]. Object detection models, such as YOLO (You Only Look Once) [13], offer the ability to detect multiple objects from a single frame in real-time, making them highly suitable for dynamic barn environments [3]. YOLOv8 introduces anchor-free detection, decoupled classification heads, and transformer-based layers for improved context awareness and bounding box localization [13]. Object tracking in video streams is critical in behavior analysis, enabling the system to follow a single object (e.g., hens) across multiple frames. DeepSORT [17] is one of the most robust object trackers, combining motion estimation with deep learning-based appearance matching to maintain object identity even under occlusion [8]. When combined, object detection and tracking models allow for consistent behavior analysis of chickens without manual intervention, enabling data-driven decision-making in farm management [1].
Hao et al. [10] developed a CNN-based model that reliably detected feeding events in laying hens, providing real-time behavioral data critical for identifying anomalies in feed intake that may indicate disease, stress, or competition at feeders. The model facilitated behavior monitoring and offered intuitive visualization tools that enhance decision-making for farm managers. Drinking behavior is another essential welfare and performance indicator, and recent AI applications have shown promise in tracking such activities with high resolution. Yang et al. [3] introduced an innovative depth-based model capable of detecting and analyzing drinking events in cage-free houses. This model, which integrates depth perception with advanced object tracking, improves the accuracy of individual bird monitoring even in complex environments where visual occlusions and crowding are common. By capturing changes in drinking frequency and duration, the system enables early detection of health issues, such as dehydration or heat stress, and supports proactive management practices.
Egg-laying behavior, particularly detecting mislaid or floor eggs, has also been a key focus of AI-driven monitoring systems. Mislaying not only reduces egg quality but also poses biosecurity and economic challenges. Bist et al. [6] developed a deep learning model to detect mislaying behavior using computer vision, allowing farms to identify problem areas or individual birds contributing to off-nest laying. Similarly, Subedi et al. [5] applied machine vision systems to successfully track the locations of floor eggs, offering a non-invasive method for egg collection optimization and behavioral analysis.
Li et al. [18] used DeepSORT coupled with YOLOv5 models to track beef cattle in large barns, achieving over 92% accuracy in tracking them across dense environments. Although DeepSORT effectively tracks moving objects, our system used the bounding box proximity approach to predefined zones rather than DeepSORT due to the visually similar nature of hens in small barn environments. In behavior analysis, spatial zones are commonly defined to represent areas of interest such as waterers or feeder objects. When the center of a chicken’s bounding box overlaps with these zones, the system increments time counters to determine how long the chicken interacted with a specific region [8]. This method offers a lightweight and accurate alternative to posture-based or skeletal analysis methods, often computationally intensive [19]. Studies have shown that zone-based approaches work well for livestock with distinct interaction areas, especially in enclosed barn environments [16]. For instance, Luo et al. [15] demonstrated the viability of zone-based tracking for pigs by calculating time spent in feeding zones using simple bounding box logic.
Collectively, these innovations underscore the role of AI in promoting precision livestock farming, where real-time behavior detection ensures efficient management, better animal welfare, and sustainable production outcomes. These intelligent monitoring tools not only support early intervention and precision management but also contribute to improving productivity, reducing labor demands, and ensuring the sustainability of modern egg production systems [5]. As the poultry industry increasingly adopts digital solutions, AI-based behavior detection is a key component for optimizing layer performance while enhancing animal welfare and farm efficiency.
3. Materials and Methods
3.1. Dataset Collection
Figure 2 illustrates the camera placement in the pen at a top-down angle to capture the hens, waterer, and feeder objects. We used a fixed-position overhead Full HD Camera with 30 FPS (frames per second) installed at a height of 2 m for video recording inside the poultry house. The wireless outdoor camera supports dual lens and PTZ (Pan–Tilt–Zoom) capabilities, capturing 2K FHD (Full HD) videos with 10× Hybrid Zoom and 360° viewing. We recorded more than 20 videos for the pin, each of which is around 3–4 min. All videos were captured at natural barn lighting with minor fluctuations in April 2025.
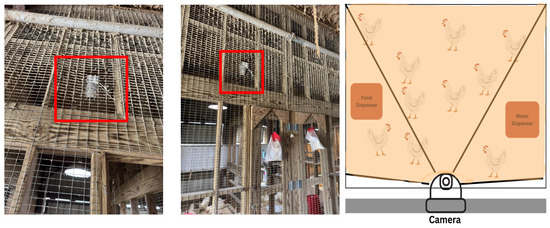
Figure 2.
Camera placement in the poultry farm.
At 40 weeks of age, ten hens were housed in a pen measuring 2.0 m in length, 1.2 m in width, and 3.5 m in height. The floor of each pen was covered with a layer of clean, dry wood shavings bedding, which was regularly maintained to promote hygiene and reduce ammonia buildup. The housing system was a semi-open structure, allowing for natural ventilation and exposure to ambient light conditions, which helped simulate a more natural environment and reduce heat stress. The bird pen was equipped with a bucket cup waterer and a hung feeder positioned at an appropriate height to facilitate easy access, enabling the birds to consume water and feed freely throughout the experimental period (ad libitum). Feed and water levels were checked and replenished daily. The housing setup was designed in accordance with animal welfare standards, providing sufficient space per bird to reduce competition and stress. The layout supported the hens’ ability to express natural behaviors such as walking, wing flapping, perching, dust bathing, and foraging, which are essential indicators of good welfare. Environmental enrichment and minimal disturbances contributed to maintaining the physical and psychological health of the laying hens throughout the study period.
3.2. Methodology
Figure 3 presents the proposed system architecture, organized into four distinct layers. Layer 1 encompasses the video acquisition and pre-processing stage, wherein the collected video dataset is segmented into individual frames at fixed intervals of 500 milliseconds. This segmentation was performed using a Python-based script, version 3.13, that employs the FFmpeg framework [20]. Subsequently, target objects—namely, hens, feeders, and waterers—were extracted to facilitate the training of the hen clustering and classification machine learning models. Object annotation for these classes was conducted using the LabelIng tool [21], thereby enabling the development of the detection and segmentation models.
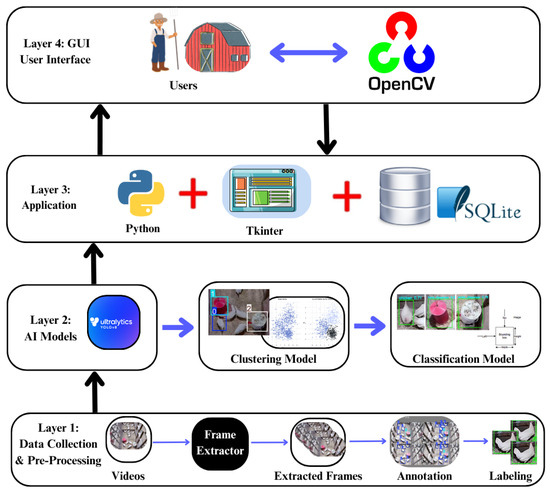
Figure 3.
System architecture.
Layer 2 comprises the detection and segmentation module, implemented using the YOLOv8 model, the clustering module based on the K-Means algorithm, and the identification module also utilizing the YOLOv8 framework. Layer 3 represents the application layer, developed with Python’s built-in Tkinter library for constructing graphical user interfaces (GUIs), in conjunction with the SQLite database engine [22] for persistent data management. This layer provides the interface through which end users, depicted in Layer 4, interact with the system. The GUI facilitates convenient access to system functionalities, enabling users to monitor hens’ feeding and drinking behaviors. It additionally overlays bounding boxes, class labels, and live behavioral statistics (e.g., feeding and drinking durations) on individual video frames, with real-time rendering achieved via OpenCV’s lightweight visualization engine.
3.2.1. Target Object Detection and Segmentation Using YOLOv8
The YOLOv8 model was trained on a custom image dataset with over 700 annotated frames, each frame containing multiple annotated objects (hens, feeders, waterers), resulting in over 2000 labeled instances, to enable accurate detection and segmentation of target objects within video frames. The frames were also carefully selected to capture diverse conditions (lighting, positions, and interaction angles). We applied standard augmentation techniques (rotation, scaling, brightness adjustments) to address potential overfitting and ensured dataset division into training, validation, and testing sets. YOLOv8, a state-of-the-art deep learning algorithm, was selected for its high-performance capabilities in real-time object detection within video streams. Upon receiving video input, the model processes each frame to identify and localize the hens, feeders, and waterers, generating bounding boxes to delineate the detected objects.
Following the detection of objects of interest, the bounding boxes generated by the YOLOv8 model were utilized to crop the corresponding regions from each frame. This extraction step is essential for isolating the target objects from their surrounding background, thereby producing cleaner and more relevant data for the subsequent clustering phase. To track feeding and drinking behavior, the system defines two static rectangular zones based on pixel coordinates, defined as follows:
where and are the feeder and waterer zones, respectively.
The overall procedure is detailed in Algorithm 1. The bounding box coordinates for each object of interest were computed using the input parameters , and subsequently converted into the top-left coordinate format (i.e., ).
| Algorithm 1 Converting YOLO bounding box to pixel coordinates |
| Require: return
|
The Hungarian algorithm was implemented to optimally assign predicted bounding boxes to detected bounding boxes, utilizing cost matrices that integrate both motion and appearance similarity measures. The resulting cost matrix, , incorporates these motion and appearance features to facilitate accurate matching between detections and tracks, thereby improving data association:
In this expression, denotes the Mahalanobis distance between the predicted state and the observed detection ; represents the cosine distance between the corresponding deep feature vectors and ; and is a weighting parameter that balances the contributions of motion and appearance costs.
3.2.2. Hen Behavior Zone Detection
A Kalman filter was employed to improve the accuracy of motion prediction. The filter estimates the current state, , of an object based on its previous state, , according to the following formulation:
where F denotes the state transition matrix, B represents the control input matrix, is the control vector, and corresponds to the process noise term.
The observation model refines the state estimate by incorporating new measurements, , as expressed by the following relation:
where H denotes the observation matrix, while represents the measurement noise term.
We employed the zone-based logic to monitor overlaps between the hen objects and predefined feeder and waterer regions, and calculate the duration spent in each zone. We first calculate the center coordinates of the bounding box of each hen. We then check if lies inside some predefined feeder or waterer zones. If a match is found, we increment the corresponding or for that hen. The behavior summaries are updated frame-by-frame. The center of the hen bounding box at time t, , is defined as follows:
A hen’s box is considered within a feeder zone, f, if
and it is within waterer zone, w, if:
Algorithm 2 delineates the procedure for determining the presence of overlap between the bounding boxes of a hen object and those of a feeder or waterer object. The coordinates of the two bounding boxes, , are utilized to compute the overlapping area. The algorithm returns a Boolean value, yielding if an overlap exists between and , and otherwise.
| Algorithm 2 Checking if a hen box overlaps with a feeder or waterer zone |
| Require: if OR OR OR then return False, 0 else calculate_overlap_area return True, end if |
In Algorithm 3, the overlap area between the input bounding boxes () is computed based on the product of their centroid overlaps along the x- and y-axes, expressed as . Subsequently, the Euclidean distance between the centroids of the bounding boxes is calculated. To assess the spatial proximity of a target bounding box relative to other boxes within a video frame, this Euclidean distance is compared against a predefined threshold, enabling the determination of neighboring objects within the scene.
| Algorithm 3 Calculating the overlap area between two boxes |
| Require: return
|
4. Implementation
4.1. Dataset Pre-Processing and Annotation
Image pre-processing techniques were applied to the training dataset to enhance model training accuracy and minimize training loss. Specifically, adjustments to image color contrast were performed, followed by the introduction of Gaussian noise to simulate natural variations. Furthermore, image desaturation was employed, reducing chromatic intensity by incorporating increased grayscale components. These transformations were designed to mitigate the influence of background features during the model training process. Seven hundred frames are extracted from the captured videos at defined intervals to ensure diversity in hen posture and location.
Prior to model training, the pixel intensity values of the imagery dataset were normalized to conform to a Gaussian distribution centered at zero. The normalization process was performed by subtracting the mean pixel intensity of each image, denoted as , from the value of each pixel , and subsequently dividing the result by the image’s standard deviation, , as expressed by:
where C denotes the input object image, X represents the normalized output image, and i and j indicate the spatial indices of the pixel undergoing normalization.
Additional images were generated through targeted data augmentation to address the risk of overfitting in clusters with insufficient training samples. Specifically, these augmentations included horizontal flipping, rotations within the range of −45° to 45°, scaling by a factor of 1.5, altering the brightness and contrast variations, zooming with a range of 0.2, translational shifts in width and height with a relative scale of 0.3, and selective manual cropping.
Each image frame was manually annotated using the LabelImg tool [21] to mark the bounding boxes around hens, feeders, and waterers, as shown in Figure 4. The generated labels follow the YOLO format to ensure compatibility with the object detection model training. The bounding box widths are generally clumped below 0.2, and heights below 0.25, confirming that the labeled objects are relatively small in width and height, as one would expect for chickens and their feeders when looking down.
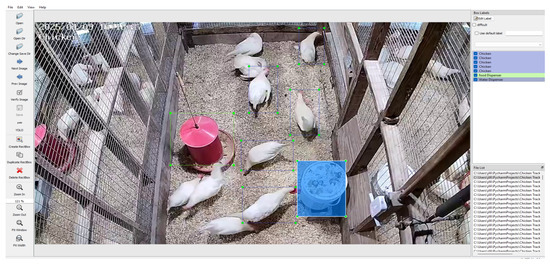
Figure 4.
Annotating the hen, feeder, and waterer objects using LabelIng.
4.2. Target Object Detection Using YOLOv8
The YOLOv8n (nano) model was trained utilizing annotated images of hens captured under diverse poses, interactions, and illumination conditions characteristic of poultry house environments. The training dataset encompassed three custom object classes: class 0 (hen), class 1 (feeder), and class 2 (waterer). This variation in visual context was intended to enhance the model’s robustness in detecting target objects across heterogeneous real-world scenarios. The training configuration employed a batch size of 16, a total of 100 epochs, and an input image resolution of 640 × 640 pixels.
The tight clustering of width and height values confirms the decision to use YOLOv8n, a compact model that performs well on small object detection. As shown in Figure 5 and Figure 6, we observed weak or slight center position to box size correlations (i.e., object size is not strongly influenced by object location in the image). This is conducive to good generalization via model training. The mAP@0.5 curve demonstrated a substantial rise during the early epochs and plateaued around 91.5%, reflecting the model’s high accuracy at a 50% intersection-over-union (IoU) threshold. The more stringent mAP@0.5:0.95 metric also improved steadily, stabilizing at 87.7%, showing the model’s robustness across varying overlap thresholds. These figures provide insight into class imbalance, object positioning, and bounding box size variations in our imagery dataset.
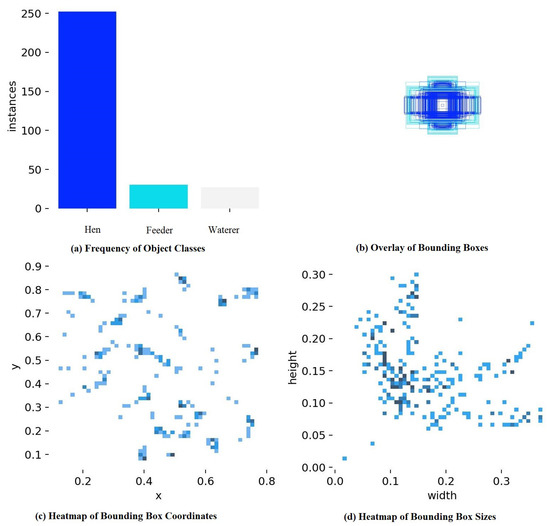
Figure 5.
Data Labeling Analysis: mAP Curve (mAP@0.5 & mAP@0.5:0.95). (a) The bar chart shows the frequency of object classes—the hen objects are around 250 instances, while the feeder and waterer have far fewer (25–30 each). (b) The plot displays an overlay of bounding boxes, illustrating labeled objects’ general shape and placement. (c,d) Plots display the heatmaps/scatter distributions of bounding box coordinates and sizes: x vs. y shows the spatial distribution of object positions, while the vs. shows the size distribution of bounding boxes.
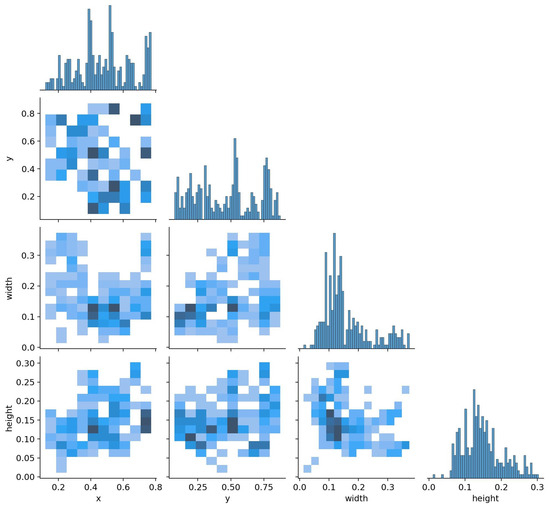
Figure 6.
Data labeling pairwise correlogram shows the distribution (histograms) of the x, y, , and variables. Darker areas indicate a higher density of points. This visualization helps to identify potential correlations and distribution patterns across all variable pairs.
We also observed a weak positive correlation between width and height, which suggests that wider objects are proportionally wider in height too. The bounding box label distribution confirms that the dataset is correctly set up with diverse spatial coverage and consistent object size. These patterns are key to successful model training and explain the high precision and recall of the YOLOv8n model.
The performance of the training and validation phases of the YOLOv8n model was assessed using several key metrics and loss components across 100 epochs. As indicated in Figure 7, the training and validation loss of the YoloV8n model shows the model’s effective learning, smooth convergence, and strong generalization capability. The figure presents a graphical representation of the training loss for the hen detection model, evaluated across four distinct loss components: box loss, segmentation loss, classification loss, and total loss.
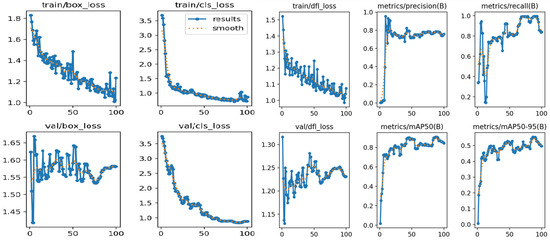
Figure 7.
The training and validation loss of the YoloV8n model.
Over the course of 100 training epochs, model accuracy exhibited a progressive increase, while the Mean Squared Error (MSE) loss demonstrated a consistent decline. As depicted, convergence was achieved after approximately the 40th epoch, indicating that the image dataset, in conjunction with the fine-tuned hyperparameters, provided an effective fit to the model architecture. The validation loss graphs mirror the training loss trend. While the val/box_loss and val/dfl_loss showed slight fluctuations, overall, they converged around lower values, confirming that the model was not overfitting and maintained reliable performance on unseen data.
The training box loss exhibits a consistent decline from approximately 2.2 to 1.3, reflecting progressive improvements in localization accuracy across epochs. Similarly, the training classification loss decreases sharply from 3.6 and stabilizes below 1.0, indicating effective discrimination among the target categories—namely, hen, feeder, and waterer. Although precision demonstrates initial fluctuations, it stabilizes near 0.95 after the twentieth epoch, signifying highly reliable detections with minimal false-positive instances. The recall trajectory follows a comparable pattern of improvement, surpassing 0.9 by the conclusion of training, thereby evidencing the model’s capacity to identify the majority of true instances. The validation box loss parallels the training box loss, showing a consistent downward trend that suggests an absence of overfitting. Likewise, the validation classification loss decreases smoothly across epochs, confirming the model’s capacity to generalize effectively to unseen data while maintaining robust classification performance.
Figure 8 illustrates an example of the inference result of the Yolov8n model for identifying the correct classes. As shown in the figure, the system successfully identifies and labels the three classes in real-time video frames: hen (class 0) with a blue bounding box, waterer (class 1) with a cyan bounding box, and feeder (class 2) with a brown bounding box. Each detected object is annotated with its class name, demonstrating the model’s ability to recognize multiple objects simultaneously in various lighting and positioning conditions. The training performance metrics were measured as follows: mAP@0.5, precision, and recall to be 91.5%, 92.3%, and 88.6%, respectively.
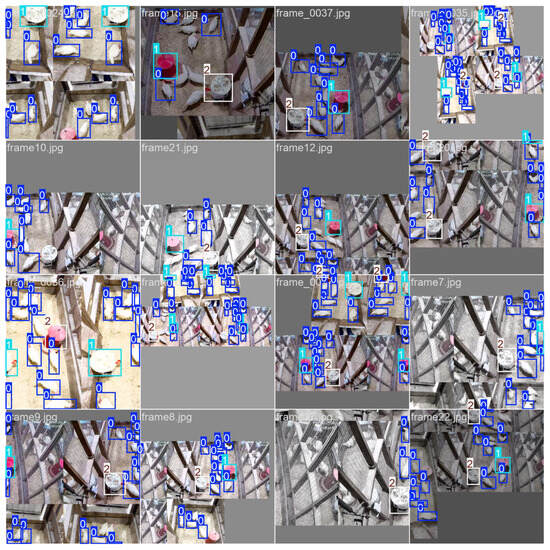
Figure 8.
Detecting the target objects with bounding boxes in the training phase: 0, 1, and 2 represent hen, waterer, and feeder, respectively.
As Figure 9 illustrates, the DeepSORT algorithm effectively tracked hens across consecutive frames with high confidence levels, preserving consistent object identifiers even during brief occlusion events. The x-coordinate values, representing the horizontal center positions of detected objects, were distributed within the range of 0.2 to 0.8, indicating a horizontal spread of hens, feeders, and waterers across the video frame. In contrast, the y-coordinate values, corresponding to vertical center positions, were predominantly concentrated within the range of 0.2 to 0.6, suggesting that objects were primarily located in the central vertical region of the frame. This spatial distribution is likely attributable to the fixed camera position and the physical layout of the pens.
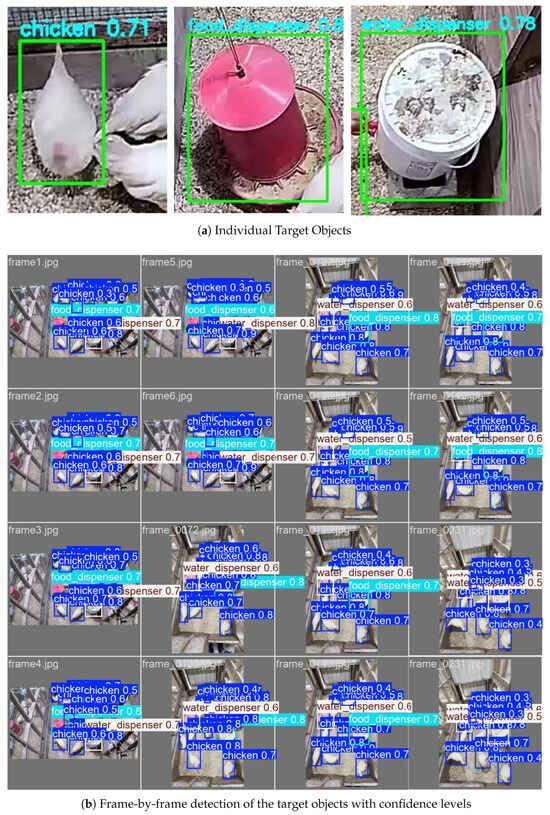
Figure 9.
Examples of the inference result of the target objects using the ML model.
4.3. GUI User Interface
The web application was developed using OpenCV and Python’s Tkinter library. The graphical user interface (GUI) was designed to be user-friendly, enabling seamless video upload, visualization of analytical results, and automated notifications regarding behaviors of interest associated with hens’ feeding and drinking activities. As illustrated in Figure 10, the application displays all detected target objects annotated with their corresponding bounding boxes and confidence scores upon video upload. Specifically, the system is configured to recognize three object classes: hens (highlighted with green bounding boxes), waterers (yellow bounding boxes), and feeders (blue bounding boxes).
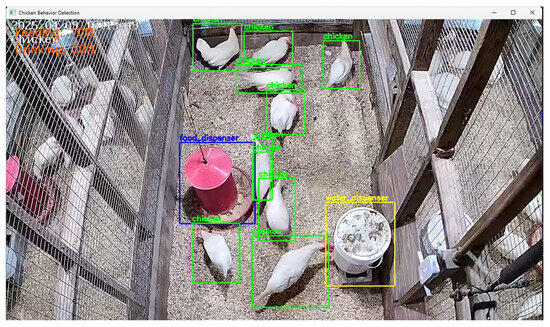
Figure 10.
A screenshot of the GUI dashboard.
5. Evaluation and Result Analysis
We conducted an experimental evaluation of the prototype implementation with respect to both classification accuracy and computational performance. In terms of accuracy, the system demonstrated robust results under natural conditions, maintaining reliable performance across variations in camera distance, object orientation, and illumination. An illustrative example of successful object inference, including the corresponding confidence scores, is presented in Figure 9.
5.1. System Performance
As shown in Figure 11a, the precision curve increased sharply in the first 20 epochs and then stabilized above 0.9, reaching a peak of 92.3%. The recall followed a similar trajectory, shown in Figure 11b, rising quickly and stabilizing around 88.6%, indicating that the model consistently detected most true positives across classes. The precision–recall (PR) curve, presented in Figure 11c, illustrates the trade-off between true positive rate and positive predictive value for the Yolov8 model across varying probability thresholds. This curve reflects the model’s capacity to accurately detect target objects while balancing the incidence of false positives and false negatives. The results indicate that the model sustains consistently high precision and recall over a broad range of thresholds, thereby demonstrating its robustness. Moreover, the curve provides strong evidence of the model’s effectiveness in detecting hens under different sensitivity levels, supporting its reliability for deployment in real-world conditions. Figure 11d illustrates the F1 curve of the YOLOv8 model across varying confidence thresholds. The model achieves stable and high F1 scores for the hen and feeder, while performance for the waterer is more variable. The aggregated curve (bold blue) reaches a maximum F1 of 0.86 at a threshold of 0.096, demonstrating strong overall performance with a balanced trade-off between precision and recall.
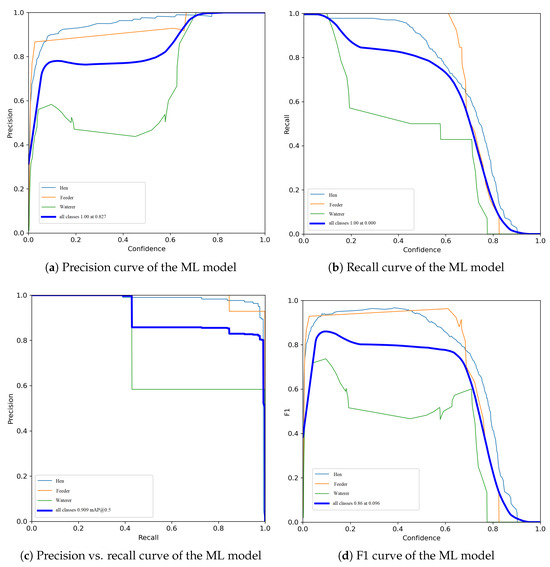
Figure 11.
Evaluation metrics of the ML model.
The average proportions of feeding and drinking behaviors were quantified over the course of the experimental period. The results indicate that the hens allocated approximately 39% of their observed time to feeding and about 11.5% and 49.5% of the time to drinking and resting/walking, respectively. These values provide a time-distributed activity breakdown within a fixed observational window, allowing consistent monitoring across multiple video clips. These evaluation metrics indicate that the YOLOv8-based detection module exhibits high accuracy and robustness, establishing it as a reliable foundation for real-time poultry behavior monitoring applications.
The system consistently detected all visible hens within the images, regardless of variations in size, orientation, or posture, thereby ensuring robustness for behavior monitoring in practical farm settings. In addition, the feeder and waterer were accurately identified, enabling zone-based reasoning for behavior analysis, such as quantifying feeding and drinking durations. The model maintained reliable performance under challenging conditions, including overlapping or partially occluded hens, while preserving detection boundaries across individual instances. Furthermore, detection stability was sustained across sequential frames and varying illumination, with consistent recognition of the three target classes. These results highlight the system’s strong generalization capacity and stability, both of which are essential for real-time video-based deployment.
5.2. Result Analysis and Discussion
The developed system was trained using a dataset of over 700 manually annotated frames, capturing variations in lighting, hen postures, and angles of interaction with feeders and waterers. This diverse dataset ensured robustness and adaptability of the model to the dynamic conditions common in small barn environments housing 10–15 birds. The model was trained for more than 100 epochs and achieved a mean average precision at 0.5 IoU (mAP@0.5) of 91.5%, with an overall detection accuracy exceeding 92%, indicating strong performance in accurately detecting laying hens and farm equipment relevant to feeding and drinking behaviors.
The system utilizes bounding box detection combined with movement-based approximation rather than continuous individual identity tracking. This approach simplifies computational requirements while effectively capturing valuable behavioral insights, especially in settings where birds are visually similar and maintaining persistent individual tracking is challenging. This methodology is consistent with recent advances in poultry behavior detection systems, such as those reported by Hao et al. [10], who demonstrated that convolutional neural network (CNN) models can reliably detect feeding behavior in laying hens without requiring complex tracking mechanisms.
Furthermore, the practical utility of the system aligns with the objectives highlighted by Yang et al. [3], who developed depth-based models for tracking drinking behavior and floor egg occurrences in cage-free housing systems, emphasizing the value of automated, behavior-focused monitoring for improving poultry management. The approach adopted in this study similarly emphasizes behavioral event detection over identity tracking, allowing efficient real-time application in small-scale farms with limited computational resources.
Recent work by Bist et al. [6] and Subedi et al. [5] further supports the feasibility and benefits of deep learning-based monitoring systems in poultry production, particularly in detecting specific behaviors such as mislaying and floor egg occurrences. These studies underscore the increasing role of advanced computer vision and machine learning in enhancing poultry welfare and farm productivity, consistent with the positive outcomes demonstrated here for feeding and drinking behavior detection.
The annotated dataset, prepared with tools like LabelImg [21] and processed using frameworks such as FFmpeg [20], enabled the creation of high-quality labeled images essential for model training. The diversity in the dataset reflects the complexity of real-world farm environments and contributes significantly to the generalizability and accuracy of the detection model.
The ability to monitor feeding and drinking behaviors accurately and efficiently presents significant advantages for small-scale poultry producers. Manual observation is labor-intensive, subjective, and insufficient for continuous monitoring, while this automated system can provide timely and objective data to support early health detection and improved flock management. These practical benefits mirror the motivations and findings in the recent poultry monitoring literature.
While the current system performs well in small barn environments, scaling to larger commercial operations may require enhancements such as multi-camera integration and more sophisticated tracking algorithms to manage larger flock sizes and occlusion challenges. Nonetheless, the demonstrated model provides a solid foundation for developing accessible, low-cost poultry behavior monitoring systems that can be adapted and expanded. In particular, the proposed system is currently optimized for small-scale poultry barns housing 10–15 hens. Scaling the system to larger flocks would require additional considerations, such as increased camera coverage, more robust tracking algorithms, and expansion of the training dataset to maintain detection accuracy and behavioral monitoring reliability.
A potential limitation of the current approach is the presence of “invisible” birds. These individuals remain stationary or do not enter the predefined feeding or drinking zones, which may result in missed observations. Future work could address this limitation by incorporating multi-angle cameras or adaptive zone mapping. Regarding economic feasibility, the system is designed with low-cost, CPU-based hardware and open-source software, making it highly suitable for smallholder and organic farms. While it may be less cost-effective for large-scale commercial operations requiring comprehensive multi-camera setups, its simplicity and affordability make it an accessible tool for resource-limited poultry producers.
In summary, this study demonstrates that the developed system, trained on a diverse and well-annotated dataset, can accurately detect feeding and drinking behaviors in laying hens within small-scale farm settings. This approach is consistent with and supported by recent advances in deep learning applications in poultry science [3,5,6,10], offering a practical solution for improving management and health surveillance in poultry production.
6. Conclusions
This study demonstrates the potential of an AI-based computer vision system for accurately monitoring feeding and drinking behaviors in small-scale poultry farms. The proposed approach supports improved flock management and early detection of health issues by providing a low-cost and efficient solution. Future work will focus on expanding the dataset, integrating identity tracking, and scaling the system for larger flocks and additional behaviors such as egg-laying. This paper presents a real-time laying hen behavior monitoring system for small-scale poultry farms. The developed system integrates YOLOv8n object detection, zone-based behavior analysis, and a real-time graphical interface to (i) detect hens, feeders, and waterers in video streams with high accuracy; (ii) analyze feeding and drinking behaviors using bounding box overlaps with defined zones; and (iii) eliminate the need for wearable sensors or manual observation, providing a low-cost, automated alternative. Optimized for CPU-based hardware, the system is lightweight, low-cost, and suitable for small farms with limited infrastructure. At the same time, the modular design allows easy adaptation to larger barns, additional animal classes, or new behavior categories. The developed system enables poultry operators to make data-driven management decisions, improving welfare and operational productivity. A fully integrated GUI provides real-time visualization, behavior summaries, and actionable insights in a farmer-friendly interface.
In ongoing work, we are looking into opportunities for generalizing our approach to recognize other hen behaviors, such as resting, walking, or abnormal movements, using pose estimation or action recognition models. We also plan to include support for multiple feeding and drinking zones to analyze preference patterns or zone-specific usage, and implement rule-based or ML-driven alerts when feeding or drinking drops below normal thresholds. We are currently working on building a mobile app that allows poultry operators to gain remote access to the historical behavior data and real-time video. We will also integrate IoT-sensed data (e.g., temperature, humidity, and gas sensor data) to correlate behavior with environmental conditions. Finally, we will evaluate the system performance and accuracy in larger barn settings with higher hen populations and varied layouts.
Key challenges remain, including managing occlusions, ensuring reliable detection in larger flocks, and maintaining long-term system accuracy under variable conditions, which must be addressed before large-scale deployment.
Author Contributions
Conceptualization, J.I. and A.A.A.; methodology, A.A.A., A.A.A.A.-W., and J.I.; formal analysis, J.I., A.A.A.A.-W., and J.L.; investigation, J.I., A.A.A., and A.A.A.A.-W.; resources, A.A.A. and J.L.; data curation, A.A.A.A.-W. and A.A.A.; writing—original draft preparation, J.I., A.A.A., and A.A.A.A.-W.; writing—review and editing, A.A.A., A.A.A.A.-W., and J.L.; visualization, A.A.A.; supervision, A.A.A. and A.A.A.A.-W.; project administration, J.L.; funding acquisition, A.A.A. and J.L. All authors have read and agreed to the published version of the manuscript.
Funding
The National Science Foundation (NSF) partly supports this research work under grants #2011330, #2200377, and #2302469 to Ahmed Abdelmoamen Ahmed. Also, funding received from the USDA-NIFA-Evans Allen grant with Accession Number #7004964 and other USDA-NIFA grants (#2023-38821-39977, #2023-51300-40853) to Lohakare is gratefully acknowledged.
Institutional Review Board Statement
All experimental procedures were conducted in compliance with the Animal Welfare Act (AWA) and Animal Welfare Regulations (AWRs) as stipulated by the United States Department of Agriculture (USDA), as well as the Guide for the Care and Use of Laboratory Animals. Approval was obtained from the Institutional Animal Care and Use Committee (IACUC) of PVAMU under protocol number AUP# 2023-055 for layer studies.
Informed Consent Statement
Not applicable.
Data Availability Statement
The raw data supporting the conclusions of this article will be made available by the authors on request.
Conflicts of Interest
The authors declare no conflicts of interest. The funders had no role in the design of the study; in the collection, analyses, or interpretation of data; in the writing of the manuscript; or in the decision to publish the results.
References
- Shahab, H.; Iqbal, M.; Sohaib, A.; Ullah Khan, F.; Waqas, M. IoT-based agriculture management techniques for sustainable farming: A comprehensive review. Comput. Electron. Agric. 2024, 220, 108851. [Google Scholar] [CrossRef]
- Yan, Y.; Sheng, Z.; Gu, Y.; Heng, Y.; Zhou, H.; Wang, S. Research note: A method for recognizing and evaluating typical behaviors of laying hens in a thermal environment. Poult. Sci. 2024, 103, 104122. [Google Scholar] [CrossRef] [PubMed]
- Yang, X.; Lu, G.; Zhang, J.; Paneru, B.; Dhungana, A.; Dahal, S.; Bist, R.B.; Chai, L. Tracking Poultry Drinking Behavior and Floor Eggs in Cage-Free Houses with Innovative Depth Anything Model. Appl. Sci. 2025, 15, 6625. [Google Scholar] [CrossRef]
- Bist, R.B.; Subedi, S.; Yang, X.; Chai, L. A Novel YOLOv6 Object Detector for Monitoring Piling Behavior of Cage-Free Laying Hens. AgriEngineering 2023, 5, 905–923. [Google Scholar] [CrossRef]
- Subedi, S.; Bist, R.; Yang, X.; Chai, L. Tracking floor eggs with machine vision in cage-free hen houses. Poult. Sci. 2023, 102, 102637. [Google Scholar] [CrossRef] [PubMed]
- Bist, R.B.; Yang, X.; Subedi, S.; Chai, L. Mislaying behavior detection in cage-free hens with deep learning technologies. Poult. Sci. 2023, 102, 102729. [Google Scholar] [CrossRef] [PubMed]
- Abdelmoamen, A. A Modular Approach to Programming Multi-Modal Sensing Applications. In Proceedings of the IEEE International Conference on Cognitive Computing, ICCC ’18, San Francisco, CA, USA, 2–7 July 2018; pp. 91–98. [Google Scholar]
- Shahbazi, M.; Mohammadi, K.; Derakhshani, S.M.; Groot Koerkamp, P.W.G. Deep Learning for Laying Hen Activity Recognition Using Wearable Sensors. Agriculture 2023, 13, 738. [Google Scholar] [CrossRef]
- Inadagbo, O.; Makowski, G.; Ahmed, A.A.; Daigle, C. On Developing a Machine Learning-Based Approach for the Automatic Characterization of Behavioral Phenotypes for Dairy Cows Relevant to Thermotolerance. AgriEngineering 2024, 6, 2656–2677. [Google Scholar] [CrossRef]
- Hao, H.; Fang, P.; Jiang, W.; Sun, X.; Wang, L.; Wang, H. Research on Laying Hens Feeding Behavior Detection and Model Visualization Based on Convolutional Neural Network. Agriculture 2022, 12, 2141. [Google Scholar] [CrossRef]
- Ahmed, M.M.; Hassanien, E.E.; Hassanien, A.E. A smart IoT-based monitoring system in poultry farms using chicken behavioural analysis. Internet Things 2024, 25, 101010. [Google Scholar] [CrossRef]
- Ahmed, A.A.; Reddy, G.H. A Mobile-Based System for Detecting Plant Leaf Diseases Using Deep Learning. AgriEngineering 2021, 3, 478–493. [Google Scholar] [CrossRef]
- Ultralytics YOLOv8. Available online: https://docs.ultralytics.com/models/yolov8/ (accessed on 10 September 2025).
- Bai, Q.; Gao, R.; Li, Q.; Wang, R.; Zhang, H. Recognition of the behaviors of dairy cows by an improved YOLO. Intell. Robot. 2024, 4, 1–19. [Google Scholar] [CrossRef]
- Luo, Y.; Xia, J.; Lu, H.; Luo, H.; Lv, E.; Zeng, Z.; Li, B.; Meng, F.; Yang, A. Automatic Recognition and Quantification Feeding Behaviors of Nursery Pigs Using Improved YOLOV5 and Feeding Functional Area Proposals. Animals 2024, 14, 569. [Google Scholar] [CrossRef] [PubMed]
- Symeonaki, E.; Maraveas, C.; Arvanitis, K.G. Recent Advances in Digital Twins for Agriculture 5.0: Applications and Open Issues in Livestock Production Systems. Appl. Sci. 2024, 14, 686. [Google Scholar] [CrossRef]
- Yu, Z.; Zheng, X.; Yang, J.; Su, J. Improved YOLOX-DeepSORT for Multitarget Detection and Tracking of Automated Port RTG. IEEE Open J. Ind. Electron. Soc. 2024, 5, 317–325. [Google Scholar] [CrossRef]
- Li, G.; Sun, J.; Guan, M.; Sun, S.; Shi, G.; Zhu, C. A New Method for Non-Destructive Identification and Tracking of Multi-Object Behaviors in Beef Cattle Based on Deep Learning. Animals 2024, 14, 2464. [Google Scholar] [CrossRef] [PubMed]
- Ahmed, A.A.; Omari, S.A.; Awal, R.; Fares, A.; Chouikha, M. A Distributed System for Supporting Smart Irrigation using IoT Technology. Eng. Rep. 2020, 3, e12352. [Google Scholar] [CrossRef]
- FFmpeg Multimedia Framework. Available online: https://ffmpeg.org (accessed on 10 September 2025).
- LabelIng ver. 1.8.6: Graphical Image Annotation Tool. Available online: https://pypi.org/project/labelImg/ (accessed on 10 September 2025).
- SQLite Database Engine. Available online: https://www.sqlite.org (accessed on 10 September 2025).


Disclaimer/Publisher’s Note: The statements, opinions and data contained in all publications are solely those of the individual author(s) and contributor(s) and not of MDPI and/or the editor(s). MDPI and/or the editor(s) disclaim responsibility for any injury to people or property resulting from any ideas, methods, instructions or products referred to in the content. |
© 2025 by the authors. Licensee MDPI, Basel, Switzerland. This article is an open access article distributed under the terms and conditions of the Creative Commons Attribution (CC BY) license (https://creativecommons.org/licenses/by/4.0/).