Abstract
Quantitative estimation of rapeseed yield is important for precision crop management and sustainable agricultural development. Traditional manual measurements are inefficient and destructive, making them unsuitable for large-scale applications. This study proposes a canopy-volume estimation and yield-modeling framework based on unmanned aerial vehicle light detection and ranging (UAV-LiDAR) data combined with a HybridMC-Poisson reconstruction algorithm. At the early yellow ripening stage, 20 rapeseed plants were reconstructed in 3D, and field data from 60 quadrats were used to establish a regression relationship between plant volume and yield. The results indicate that the proposed method achieves stable volume reconstruction under complex canopy conditions and yields a volume–yield regression model. When applied at the field scale, the model produced predictions with a relative error of approximately 12% compared with observed yields, within an acceptable range for remote sensing–based yield estimation. These findings support the feasibility of UAV-LiDAR–based volumetric modeling for rapeseed yield estimation and help bridge the scale from individual plants to entire fields. The proposed method provides a reference for large-scale phenotypic data acquisition and field-level yield management.
1. Introduction
Rapeseed (Brassica napus L.) is the second largest oil crop worldwide, with its applications extending beyond edible oil to protein feed, biodiesel, and ecosystem services [1,2,3,4]. According to FAO statistics, global rapeseed production reached ~92 million tons in 2023 [5]. Marker-assisted and genomic selection have accelerated the breeding of elite cultivars with traits such as high oleic acid content and lodging resistance [1]. Low-erucic acid rapeseed oil is rich in ω-3 α-linolenic acid, which reduces cardiovascular disease risk [6]; rapeseed meal, a by-product, contains ~35% protein and serves as a high-quality feed source [7]. In the energy sector, rapeseed oil is a dominant feedstock for biodiesel in the EU and contributes to greenhouse-gas reduction targets [8]. Moreover, in rice–rapeseed and wheat–rapeseed rotations, rapeseed has been shown to suppress soil-borne pathogens and improve nitrogen use efficiency. Large-scale remote sensing mapping (e.g., RapeseedMap10) demonstrates that rapeseed rotation schedules inferred from spatial maps align with known agronomic benefits of rotation [9]. The development of the rapeseed industry is thus of strategic importance for national edible oil security and green, low-carbon agriculture.
However, rapeseed production is highly affected by its complex canopy structure and sensitivity to low-temperature stress, resulting in substantial interannual yield fluctuations [10], often higher than those observed for wheat and rice. Under climate change, these risks are expected to intensify [11,12,13]. Therefore, there is an urgent need to develop accurate, rapid, and non-destructive yield estimation techniques at the field scale, in order to optimize agronomic management, reduce production risks, and contribute to carbon neutrality strategies. At present, however, major producing regions still rely heavily on manual sampling, which is labor-intensive, often limited in spatial representativeness, and suffers from delays in reporting [14]. Furthermore, remote sensing studies have shown that vegetation indices and structural features during flowering phases are highly variable, and optical saturation reduces accuracy under dense canopy conditions [2] UAV- and satellite-based multispectral methods have been tested in different crop conditions to monitor phenotypic traits and yield-related features of rapeseed, showing potential to overcome these limitations [10,15]. To overcome the constraints of manual yield estimation, remote sensing technologies—particularly high-resolution optical satellites and unmanned aerial vehicles (UAVs) equipped with multispectral or hyperspectral sensors—have been widely employed for monitoring rapeseed biomass dynamics [16]. These methods primarily rely on statistical relationships between vegetation indices (e.g., NDVI) and biomass. However, during peak flowering, rapeseed typically exhibits a high LAI at which canopy spectral signals saturate; consequently, the correlation between NDVI and biomass declines sharply [17,18], causing failures in biomass and yield estimation during critical phenological windows. For example, Hu et al. (2024) demonstrated that yield prediction using UAV-based spectral sensors was more accurate at the budding and pod stages than during flowering [19]. Although crop height and other structural proxies derived from optical images show strong associations with yield in practice [4], two-dimensional imagery inherently lacks sufficient three-dimensional (3D) structural information (e.g., canopy volume, vertical distribution, porosity) and is inadequate for characterizing rapeseed’s complex canopy architecture; moreover, monitoring accuracy is sensitive to image-scale/resolution settings in field deployments [20]. Optical remote sensing is also disrupted by cloud cover, haze, and other adverse weather conditions, leading to data gaps during key growth periods [21]. Studies integrating multi-temporal, multispectral, or radar data do improve performance [4,7,21,22], but spectral saturation and the absence of explicit 3D structure in high-LAI canopies remain core bottlenecks. As a result, optical remote sensing alone cannot simultaneously meet the dual requirements of timeliness and accuracy in rapeseed yield prediction.
The emergence of 3D reconstruction techniques provides new opportunities for high-throughput crop phenotyping and yield prediction. Depending on the sensors and algorithms employed, mainstream 3D reconstruction approaches can be broadly classified into three categories. The first involves active structured-light or RGB-D/depth camera scanning, typically applied to individual plants under controlled or semi-controlled conditions, achieving millimeter-level accuracy. However, their strict illumination requirements, limited working distance, and sensitivity to ambient light reduce their utility in field environments [23]. The second category is UAV-based photogrammetry (SfM/MVS), which reconstructs dense point clouds from overlapping multi-view images. These methods perform well in less occluded, structurally regular crops, but in rapeseed, overlapping leaves, pod occlusions and leaf reflectance variability degrade accuracy. Wang et al. demonstrated that plant height extraction errors increase as canopy density grows [24,25]. Similarly, Fujiwara et al. compared UAV-SfM configurations in field crops and reported that canopy complexity strongly affects accuracy [25]. To address these challenges, advanced multi-view reconstruction such as UAV oblique imaging combined with 3D Gaussian Splatting and SAM segmentation has been tested for rapeseed biomass estimation, producing more complete and accurate models than traditional orthophotos [26]. The third category is active laser scanning (TLS or UAV-LiDAR). LiDAR combined with spectral data has been shown to improve aboveground biomass estimation for rapeseed, especially under dense canopy where spectral saturation limits optical methods [27]. Field-scale LiDAR studies also confirmed its advantage in capturing canopy structure and leaf distribution [28]. Across all methods, common challenges persist. Registration algorithms such as ICP remain sensitive to non-rigid, highly occluded structures. Surface reconstruction approaches (Poisson, voxel, mesh) often assume simpler topology, which fails for rapeseed with many small siliques and branching stems. New deep learning frameworks, such as OB-NeRF, are being applied to reconstruct complex plant architecture efficiently, achieving higher fidelity in geometry and texture [29]. Specifically for rapeseed, Huang et al. (2025) combined 3D Gaussian Splatting with a deep learning segmentation network, enabling high-fidelity reconstruction of seedling point clouds and accurate organ-level trait extraction [30]. Recent advances in deep learning have greatly expanded the toolbox for 3D crop phenotyping and canopy modeling. Models such as Neural Radiance Fields (NeRF) and deep convolutional architectures have demonstrated high potential for reconstructing complex plant structures with improved geometric fidelity and fine-scale textural realism [31,32]. These approaches learn continuous scene representations that jointly encode radiance and depth, effectively addressing occlusion, illumination variation, and incomplete thin organs that often challenge conventional SfM/MVS methods. In addition, point-cloud completion networks based on convolutional and transformer architectures can recover missing organs and refine canopy surfaces [33]. Emerging 3D Gaussian Splatting frameworks further enhance reconstruction efficiency and real-time visualization in dense canopies, showing particular promise for oilseed rape biomass estimation when combined with semantic segmentation models such as SAM [34]. While most deep-learning-based studies have focused on single-site or single-season validations, recent work has begun to explore multi-phenological-stage applications in crops such as oilseed rape [34], highlighting the potential for broader temporal and spatial generalization in future research. Overall, balancing accuracy, completeness, and computational efficiency across plant, plot, and field scales remains the critical bottleneck for rapeseed-specific 3D reconstruction pipelines.
With respect to point cloud processing and reconstruction algorithms, research has focused on several directions. Point cloud registration commonly uses iterative closest point (ICP) and related variants and is widely reported in plant phenotyping/LiDAR workflows [35,36,37]. For surface reconstruction, implicit approaches such as Poisson reconstruction can produce smooth, closed meshes, while explicit schemes like Delaunay-based meshing and voxelization are frequently used for trait extraction and volume/area estimation. However, many generic pipelines assume relatively simple organ topology or regular geometry, which degrades when facing thin, highly occluded or fine-scale organs [36,38]. In rapeseed specifically, slender branches, layered leaves and numerous small, dispersed siliques make registration, completion and segmentation difficult; recent studies highlight noise/occlusion handling, completion of thin organs and organ-level deep-learning segmentation as key to reliable reconstruction and phenotyping [39,40,41].
A more severe challenge lies in scaling the “3D reconstruction–yield estimation” pipeline from laboratory single-plant scanning to field-scale applications. First, single-plant segmentation that works in controlled setups degrades at plot scale: occlusion, stem–leaf adhesion and background clutter make individualization and organ-level separation much harder, and recent field studies show individual-plant detection/height extraction becomes less reliable as canopy complexity increases [42,43]. Second, point-cloud density is highly heterogeneous in real fields: over complex terrain and with varying flight altitude/angles [44], UAV (LiDAR or photogrammetric) point densities fluctuate markedly, which propagates to canopy metrics and breaks simple voxel-/convex-hull volume assumptions [45]. Third, computational efficiency limits near-real-time use: end-to-end UAV pipelines (registration, filtering, meshing/Poisson or explicit voxel/triangulation, and trait extraction) remain compute-intensive in hectare-scale campaigns, and comparative software benchmarks report substantial processing-time differences even for the same datasets [46]. Recent work shows LiDAR and advanced reconstruction/segmentation can mitigate saturation and occlusion and improve structural fidelity, but robust, rapeseed-specific pipelines that balance accuracy, completeness and throughput from plant→plot→field are still needed [47,48].
Therefore, this study addresses the accuracy and efficiency bottlenecks in existing 3D reconstruction methods for rapeseed canopy modeling by proposing an innovative HybridMC-Poisson algorithm. The objectives are (1) to develop a single-plant reconstruction algorithm that integrates voxel-based denoising, Monte Carlo completion, and skeleton-topology constraints, thereby enhancing geometric accuracy and structural completeness; (2) to extract key phenotypic parameters from reconstructed canopies and establish quantitative relationships between rapeseed canopy volume and seed yield; and (3) to extend the approach to the field scale for yield spatial distribution prediction and accuracy validation. Through systematic experiments across multiple scales (plant–quadrat–field), this study aims to provide a technically feasible pathway for high-throughput phenotyping and precise yield estimation of structurally complex crops.
2. Materials and Methods
2.1. Study Area Description
The experimental site was selected in a typical winter rapeseed (Brassica napus L.) field located in the hilly region of Dongloushan, Yi County, Baoding City, China (115.41323° E, 39.15547° N, altitude 84 m) (Figure 1). The area lies in the transition zone between the North China Plain and the Yanshan Mountains, with undulating hills as the dominant landform, representing a typical winter rapeseed cultivation ecology of northern China. The annual mean temperature is 12.7 °C, with an average annual precipitation of approximately 574 mm. The soil is rich in organic matter and exhibits good fertility, making it suitable for winter rapeseed cultivation.
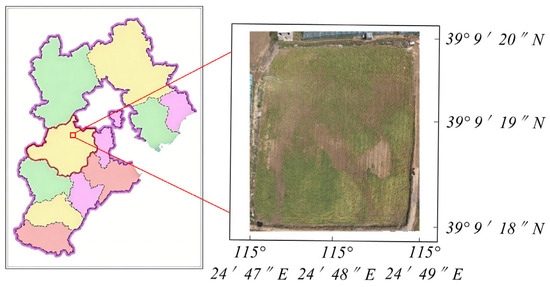
Figure 1.
Location and field view of the experimental site.
The experimental field measured 60 m × 74 m and was planted with the cultivar “Hengyou 8.” Sowing took place in early September, and harvest was conducted in May of the following year. During the growing season, no severe pests or diseases were observed, the crop showed uniform growth, and population biomass remained stable.
The surrounding area is characterized by extensive winter rapeseed production with diverse field types and management practices representative of regional agronomic systems. The selected experimental site thus embodies the common features of local rapeseed cultivation in terms of planting practices, canopy morphology, and growth conditions. This ensures that subsequent 3D point cloud reconstruction, structural parameter extraction, and yield model development are conducted on a field with both representativeness and generalizability.
2.2. UAV Platform and Sensor
A DJI M300 RTK UAV (DJI Technology Co., Ltd., Shenzhen, China) equipped with a 3D-BOXR Lite LiDAR sensor (Dalian, China) was used for field surveys Figure 2a. The main specifications of the UAV and LiDAR system are listed in Table 1. The survey was conducted on 11 May 2025, from 10:30 to 12:00 local time in Yi County, Hebei Province, under clear weather conditions with a southerly wind of 2 m/s, good visibility, and rapeseed plants at the early maturity stage.
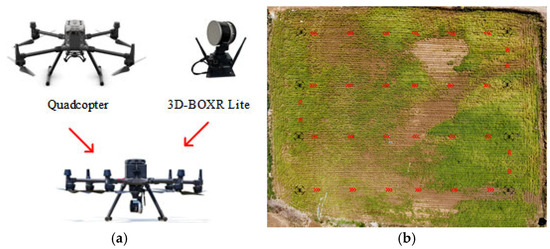
Figure 2.
(a) UAV and LiDAR equipment. (b) Schematic of field data acquisition. ed arrows indicate the UAV flight paths.

Table 1.
Main specifications of the UAV and LiDAR system.
The flight parameters were set to a height of 5 m, speed of 4 m/s, with 70% forward overlap and 60% side overlap Figure 2b. Data acquisition and visualization were performed using 3D-Viewer(v 2.6, Hangjia Technology Co., Ltd., Dalian, China), while point cloud processing and registration were carried out with CloudCompare (v 2.13.2, EDF R&D, Paris, France) and Open3D (v 0.18.0). Preprocessing steps included statistical outlier removal (SOR) filtering, voxel downsampling, and ground–vegetation separation. All UAV operations strictly adhered to airspace approval procedures and safety regulations.
2.3. Single-Plant 3D Reconstruction Algorithm
To improve the accuracy and robustness of single-plant 3D modeling for rapeseed, an integrated reconstruction framework, termed HybridMC–Poisson, was developed in this study. This algorithm combines and optimizes two widely used surface-reconstruction approaches—Marching Cubes (MC) [49] and Screened Poisson Reconstruction [50]—to achieve a balance between boundary fidelity, surface smoothness, and computational efficiency. The proposed workflow integrates the boundary-preserving capability of MC with the smooth-surface characteristics of the Screened Poisson method, while incorporating adaptive density trimming and rigid fusion modules to enhance structural stability and detail preservation under variable LiDAR point densities.
- (1)
- Data Preprocessing
The raw UAV–LiDAR point clouds were first processed using Statistical Outlier Removal (SOR) filtering (k = 24, std_ratio = 2.0) to remove noise points, followed by voxel downsampling (voxel size = 0.015 m) to achieve uniform point density. A Progressive TIN filter (slope threshold = 15°, step size = 0.20 m) was then applied to separate ground and vegetation, and objects lower than 0.05 m were removed. This preprocessing effectively suppresses random noise while maintaining canopy-edge fidelity, ensuring stable reconstruction performance under varying LiDAR scanning conditions.
- (2)
- Reconstruction Workflow
The HybridMC-Poisson approach consists of five key steps: voxelization, surface generation, density trimming, rigid registration, and mesh fusion.
① Voxelization and Marching Cubes
The point cloud was projected into a 3D voxel grid to construct a binary volumetric representation:
where denotes the occupancy state of voxel , and represents the spatial region of that voxel. The Marching Cubes algorithm [49] was then applied to extract isosurfaces and generate an initial triangular mesh that preserved local boundary details.
② Poisson Reconstruction and Adaptive Density Trimming
A smooth mesh was reconstructed using the Screened Poisson equation [50], which estimates a continuous implicit function whose gradient best fits the input point normals. Local vertex densities (dv) were then calculated, and a quantile-based density threshold was used to remove spurious patches:
where represents the 5th percentile of the density distribution.
This adaptive trimming process dynamically suppresses pseudo-surfaces in sparse regions while preserving fine canopy details, improving robustness against non-uniform LiDAR sampling and occlusions.
③ Rigid Registration and Fusion
Rigid registration between the MC and Poisson meshes was performed using the Iterative Closest Point (ICP) algorithm [51], minimizing the Euclidean distance between corresponding vertices:
where denotes MC points, denotes Poisson points, and is the rigid transformation. The final fused mesh retained the global smoothness of Poisson reconstruction while preserving the boundary fidelity of MC.
- (3)
- Error Feedback and Volume Estimation
To ensure accuracy in volume calculation, a dynamic error feedback mechanism was introduced. When the relative error between reconstructed and measured volume exceeded ±5%, density trimming and registration parameters were adjusted and the reconstruction process was repeated.
Ground truth volumes were obtained using the water displacement method (Archimedes’ principle), in which harvested rapeseed samples were submerged in a water container and the displaced water volume was recorded.
The relative error (RE) was defined as:
where and denote reconstructed and measured volumes, respectively. This metric quantitatively evaluates reconstruction accuracy under different morphological conditions.
- (4)
- Algorithm Performance Comparison
To validate performance, 20 rapeseed plants were reconstructed and compared with three common algorithms (Ball-Pivoting, Poisson, Alpha-Shape). All reconstructions were executed on a workstation equipped with an Intel Core i7-14700K CPU (3.0 GHz), 64 GB RAM, and an NVIDIA RTX 3060 GPU. The average runtime of approximately 3 s refers to the reconstruction of a single plant using the HybridMC–Poisson pipeline. Evaluation metrics included relative volume error, Hausdorff distance, Chamfer distance, and average runtime. Results showed that HybridMC-Poisson outperformed the baseline methods in both volume accuracy and morphological fidelity, while reaching a more favorable accuracy–efficiency trade-off (Table 2).

Table 2.
Overview of reconstruction algorithms.
2.4. Quadrat Experiments and Modeling
- (1)
- Quadrat Experiment Design
High-resolution UAV orthophotos and LiDAR point clouds were simultaneously acquired and spatially co-registered. The study area was divided into 1 m × 1 m grid cells, and classified into low-, medium-, and high-density levels based on point cloud density. For each level, 20 quadrats were randomly selected (total = 60) to ensure representativeness and balance. Quadrat centers were extracted from orthophotos and georeferenced using RTK. At maturity, all plants within each quadrat were harvested, dried, and threshed to obtain grain dry weight as ground-truth yield (Figure 3).
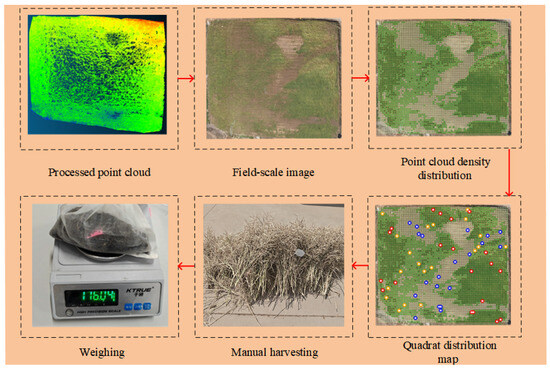
Figure 3.
Workflow of quadrat sampling and yield measurement; red, yellow, and blue points represent selections from high-, medium-, and low-density point clouds, respectively.
- (2)
- Canopy Volume Calculation
Canopy volume of each quadrat was reconstructed using the HybridMC-Poisson algorithm. triangular mesh integration, which better preserves canopy complexity and reduces boundary bias compared with traditional voxel methods.
- (3)
- Volume–Yield Modeling
Based on canopy volume and measured yield data, a linear regression model was constructed using ordinary least squares (OLS). Model performance was evaluated with coefficient of determination (R2), root mean square error (RMSE), and residual distribution.
2.5. Evaluation of Point Cloud Preprocessing Quality
As shown in Figure 4a, the field photograph provides an intuitive view of the overall canopy morphology, serving as a direct reference for subsequent point cloud analysis. The raw point cloud in Figure 4b exhibited evident voids, particularly along the flight path edges and near distant interfering objects such as trees, and also contained a number of outliers. After preprocessing with the Statistical Outlier Removal (SOR) algorithm Figure 4c, approximately 4.3% of noise points were removed, and the effective vegetation point density increased to 836 pts/m2, thereby improving the continuity and recognizability of plant contours. This preprocessing step provides a more reliable data foundation for accurate vegetation point cloud extraction and structural reconstruction in subsequent 3D modeling.

Figure 4.
Effect of point cloud preprocessing. (a) The field photos. (b) Raw point clouds and (c) preprocessed point clouds.
3. Results
3.1. Performance Comparison of Single-Plant Reconstruction Algorithms
To assess the adaptability of different 3D reconstruction algorithms for rapeseed plants, standardized preprocessing of individual plants was conducted within the whole-field point cloud. This included local region selection, outlier removal, smoothing, coordinate registration, downsampling, and normal estimation, thereby generating high-quality input point clouds with complete structures and clear boundaries for subsequent comparative experiments Figure 5a. On this basis, the same rapeseed plant was reconstructed using four algorithms—HybridMC-Poisson, Ball-Pivoting, Poisson, and Alpha-Shape—and their accuracy in both volume estimation and morphological fidelity was evaluated. Figure 5b shows the comparative errors in volume estimation, providing a direct visualization of method differences.
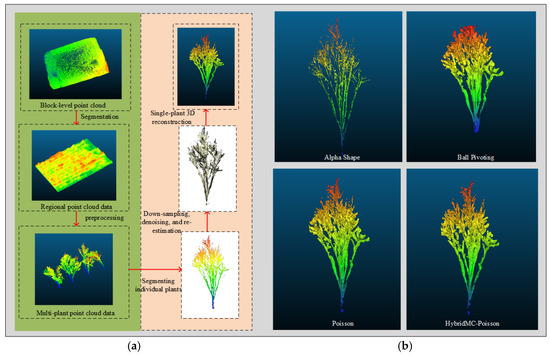
Figure 5.
Data processing workflow and algorithm comparison. (a) Workflow of single-plant extraction and preprocessing. (b) Comparison of volume estimation errors among four reconstruction algorithms. color shading indicates plant height.
To systematically evaluate the performance of different reconstruction algorithms in terms of volume estimation and morphological fidelity, n = 20 representative rapeseed plants were selected from the experimental area. As shown in Figure 6a, the HybridMC-Poisson algorithm achieved the lowest average relative volume error (2.96%), compared with Alpha-Shape (5.54%), Poisson (6.22%), and Ball-Pivoting (12.96%), representing reductions of 2.58, 3.26, and 10.00 percentage points, respectively. These results highlight the superior capability of HybridMC-Poisson for modeling complex canopy structures with higher accuracy and reliability.
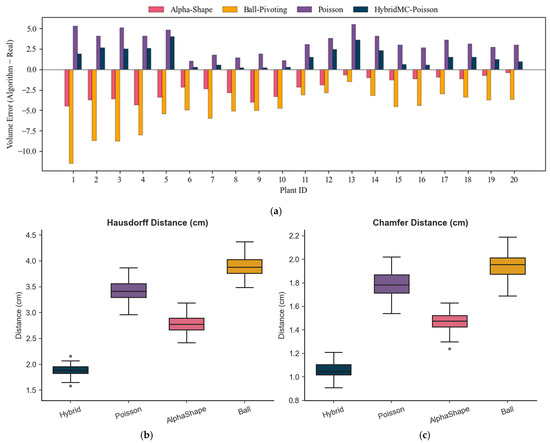
Figure 6.
Comparison of volume estimation errors and morphological accuracy among reconstruction algorithms (n = 20 representative rapeseed plants). (a) Volume estimation errors of four algorithms; (b) Distribution of Hausdorff distances; (c) Distribution of Chamfer distances.
Morphological accuracy was further assessed using Hausdorff and Chamfer distances in Figure 6b,c. HybridMC-Poisson yielded the lowest median values for both indices (1.883 cm and 1.053 cm, respectively), with more concentrated distributions and fewer outliers, indicating better structural fidelity and robustness. In contrast, Ball-Pivoting achieved low errors in a few cases but exhibited high variability overall, reflected by a wider interquartile range. Alpha-Shape produced Chamfer distances close to HybridMC-Poisson but showed significantly higher Hausdorff distances, suggesting limitations in capturing complex canopy boundaries. Statistical analyses confirmed that HybridMC-Poisson significantly outperformed the three baseline algorithms in both volume estimation and morphological metrics.
3.2. Algorithmic Efficiency
To explore the trade-off between accuracy and efficiency, 20 parameter combinations were tested, including voxel size (0.01–0.03 m), Poisson depth (8–10), and Ball-Pivoting radius (1.0–1.5 × mean point spacing). A coarse-to-fine evaluation strategy was adopted. The general trend indicated that increasing parameter resolution reduced relative volume error, Chamfer distance, and Hausdorff distance, but also increased computation time (Figure 7).
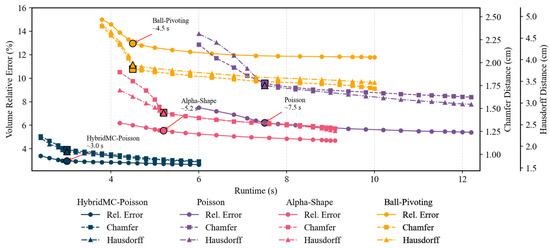
Figure 7.
Comparison of computational efficiency.
Among the four algorithms, HybridMC-Poisson reached the optimal accuracy–efficiency trade-off most quickly, achieving representative accuracy (relative error 2.96%, Chamfer = 1.053 cm, Hausdorff = 1.883 cm) in ~3.0 s. Further increasing computational cost brought only marginal improvements in accuracy while significantly increasing runtime. By contrast, Poisson, Alpha-Shape, and Ball-Pivoting required longer times (~7.5 s, 5.2 s, and 4.5 s, respectively) to reach their optimal settings, and their minimum errors remained higher than HybridMC-Poisson, with earlier diminishing returns.
As shown in Table 3, HybridMC–Poisson ranked highest in both volume accuracy and morphological fidelity while maintaining superior computational efficiency through its dual-resolution voxel strategy and adaptive trimming. These results demonstrate that the algorithm performs reliably for high-throughput 3D phenotyping of complex crop structures under varying canopy conditions.

Table 3.
Reconstruction error statistics for single rapeseed plants.
To statistically validate the differences in reconstruction accuracy among algorithms, a one-way ANOVA was performed based on 20 individual plant samples per method. The results revealed a highly significant difference in relative volume error (F = 15.04, p < 0.001), confirming that the HybridMC–Poisson algorithm achieved significantly higher accuracy than the other reconstruction methods (Table 4).

Table 4.
One-way ANOVA results for reconstruction accuracy among algorithms.
3.3. Quadrat Statistics and Yield Modeling
Based on data from 60 quadrats, canopy structural parameters and yields were statistically analyzed across three density levels (Table 5). With increasing density, the average plant number per quadrat increased significantly, leading to higher total canopy volume and yield. However, single-plant volume varied little across density classes, indicating that yield differences primarily resulted from plant number rather than individual plant size. These results indicate that yield differences primarily resulted from plant number rather than individual plant size.

Table 5.
Average plant number, volume, and yield across density levels.
On this basis, a linear regression model between single-plant volume and single-plant yield was constructed. Comparing models with and without intercepts, the intercept model showed limited explanatory power and produced positive yield predictions when plant volume approached zero, which is physiologically implausible. By contrast, the through-origin model was more biologically rational [25]. The final fitted equation was:
Single-plant yield (kg) = 7.5 × 10 − 5 × Single-plant volume (cm3)
Figure 8 illustrates the regression relationship, where scatter points aligned well with the fitted line, showing strong linear consistency. To extend this model to the field scale, an integrated coefficient (c) was introduced to represent the combined effects of planting density, average pod number, and local agronomic conditions on yield formation. The coefficient c incorporates the regression slope along with an empirical adjustment derived from regional planting parameters. According to field observations, there were approximately 19 plants per square meter, and each plant produced an average of around 220 pods, consistent with the regional yield characteristics of winter rapeseed (Brassica napus L.) in northern China.
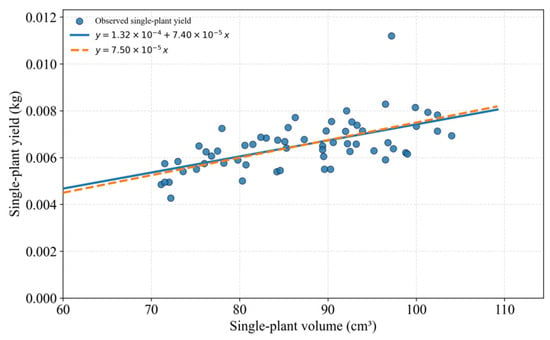
Figure 8.
Linear regression between single-plant volume and yield.
Therefore, c reflects the yield potential of rapeseed under these specific planting and climatic conditions, including an annual mean temperature of 12.7 °C and an average annual precipitation of 574 mm.
The field-scale regression equation becomes:
where c = 75 under current conditions.
Field yield (kg) = c × Field canopy volume (m3)
Here, c = 75 corresponds to the integrated coefficient for a density of 19 plants m−2 and an average of 220 pods per plant, and can be recalibrated for other regions or planting configurations. The canopy volume of the experimental field was 14.82 m3 (equivalent to 14,820,199 cm3), yielding a predicted total yield of 1112 kg. Compared with the measured yield of 989 kg, the relative error was 12.4%, which is comparable to existing crop-yield models based on LiDAR data [6].
3.4. Prediction Accuracy and Error Sources
To validate the applicability of the through-origin model at the field scale, the regression coefficient b derived from quadrats was applied to canopy volume for extrapolation, and the predicted yields were compared with measured yields Figure 9a. Scatter points were distributed close to the 1:1 line, with R2 = 0.8652, RMSE = 0.0229 kg, MAE = 0.0169 kg, and a mean relative error of 15.85%. These results confirmed that the model captured yield variation effectively and demonstrated strong quantitative prediction capability. Residual analysis Figure 9b further indicated that residuals were randomly distributed around zero, without systematic bias or heteroscedasticity. This finding is consistent with earlier studies on yield estimation error structures [52], thereby reinforcing the reliability of the proposed model. Combined with five-fold cross-validation results, the model demonstrated high robustness during extrapolation.
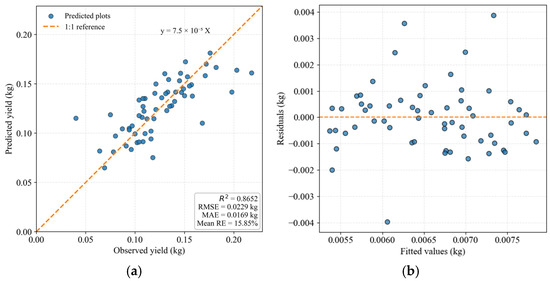
Figure 9.
Field-scale validation of the through-origin regression model. (a) Relationship between observed and predicted yields; (b) Residuals versus fitted values.
Despite the overall high accuracy, some dispersion remained, which may be attributed to:
- (1)
- spatial heterogeneity among plants, causing yield variation under the same volume;
- (2)
- sampling and weighing errors in manual yield measurement;
- (3)
- local occlusion or noise in point cloud reconstruction affecting volume estimation.
These results suggest that future improvements should focus on enhancing spatial structure representation, improving quadrat design representativeness, and optimizing point cloud processing algorithms.
3.5. Volume–Yield Relationship and Model Rationality
In fitting the relationship between single-plant volume and yield, the through-origin regression model provided more biologically reasonable explanations than the intercept model. When plant volume approaches zero, yield should also be zero. Thus, the through-origin model not only achieved excellent statistical fit but also aligned with crop growth principles [53].
For cross-scale comparison, the total canopy volume of the field was converted from cm3 to m3. For instance, the canopy volume of the experimental field was approximately 14.82 m3, which more intuitively reflected field-scale structural characteristics and facilitated comparisons across studies.
In summary, the constructed linear model exhibited both statistical significance and mechanistic rationality, providing a reliable basis for yield prediction.
4. Discussion
4.1. Factors Influencing the Accuracy of Single-Plant Volume Reconstruction
This study revealed a significant negative correlation between actual plant volume and reconstruction error (Figure 10), indicating that larger plants generally exhibited higher modeling accuracy. This pattern is consistent with previous findings that higher LiDAR sampling density improves canopy surface fidelity and reduces geometric bias in complex structures [28,44,45]. Two mechanisms mainly contributed:
- (1)
- Point-cloud density effect: Larger plants received denser sampling during UAV-LiDAR scanning, reducing bias caused by sparse returns.
- (2)
- Structural clarity effect: Larger plants exhibited clearer geometry and thicker organs, improving keypoint extraction and model stability while reducing errors from boundary ambiguity or local occlusion [37].
Among the compared algorithms, the HybridMC–Poisson algorithm achieved the lowest overall reconstruction error and showed greater stability across different plant sizes compared with Poisson, Alpha-Shape, and Ball-Pivoting. These results align with the reported advantages of voxel-based and screened Poisson methods in improving reconstruction robustness and accuracy for plant phenotyping [35,45]. The adaptive density refinement in our method further enhanced surface smoothness and geometric continuity, consistent with recent high-fidelity LiDAR phenotyping studies [24].
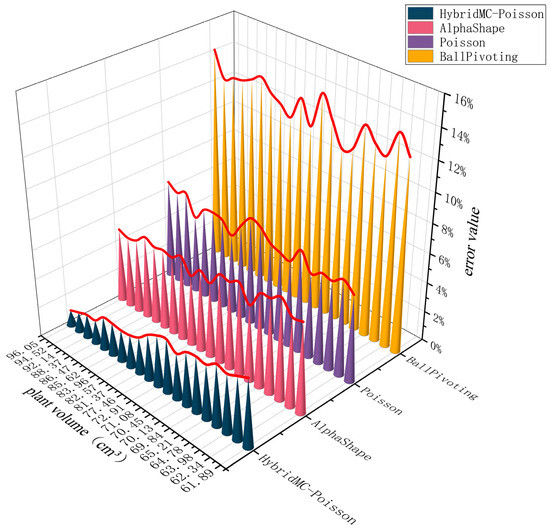
Figure 10.
Relationship between actual plant volume and reconstruction error.
4.2. Application Prospects and Implications
The UAV-LiDAR-based single-plant volume–yield modeling framework developed in this study offers an effective approach for high-throughput phenotyping and precision yield estimation. It combines rapid, non-destructive operation with scalability to large field areas, providing a transferable model structure for crops with similar canopy architectures (e.g., soybean, cotton, and some cereals).
Recent studies have demonstrated that integrating LiDAR-derived structure with spectral or thermal information can significantly enhance the accuracy of biomass and yield estimation [15,19,27]. Multi-temporal and multi-view acquisitions have also been shown to improve robustness against occlusion and capture canopy growth dynamics, supporting future development of structure–spectrum fusion and temporal monitoring workflows [30,50].
Nevertheless, this study was conducted on a single experimental site and crop type, which may limit the generalizability of the proposed model. Moreover, LiDAR point density and canopy structural complexity are known to affect reconstruction quality and yield estimation accuracy [44]. Future research will therefore extend validation to multiple crop varieties, ecological regions, and LiDAR configurations, aiming to enhance model adaptability and robustness through broader testing.
5. Conclusions
This study developed an end-to-end workflow from single-plant 3D reconstruction to field-scale yield prediction based on UAV-LiDAR point clouds, and proposed the HybridMC-Poisson algorithm incorporating voxel refinement and density-aware mechanisms. The main conclusions are as follows:
- (1)
- Improved reconstruction accuracy: The HybridMC-Poisson algorithm effectively alleviated boundary blurring and detail loss in single-plant rapeseed modeling, significantly improving volume estimation accuracy and geometric fidelity compared with conventional methods. Benchmark experiments confirmed its superiority over Poisson, Alpha-Shape, and Ball-Pivoting in error control and robustness.
- (2)
- Robust yield model: A linear regression model between plant volume and yield was constructed using quadrat survey data, with the through-origin model selected as the final formulation. At the field scale, the predicted yield differed from the measured yield by 12.4%, meeting accuracy requirements for agricultural remote sensing yield estimation.
- (3)
- Practical application potential: The proposed method provides a rapid and non-destructive approach for yield estimation in rapeseed and other complex-canopy crops. It offers promising applications for crop phenotyping and smart agriculture management. However, further improvements are needed in cross-regional adaptability and point cloud stitching efficiency. Future work could leverage deep learning and multi-modal data fusion to enhance robustness and scalability.
- (4)
- Improved reconstruction accuracy directly enhances the reliability of field-scale yield estimation and supports refined fertilizer and irrigation planning. By providing high-resolution structural information at both single-plant and canopy levels, the proposed workflow enables more precise quantification of crop biomass and spatial yield variability. Such accuracy improvements facilitate data-driven decision-making in precision agriculture, contributing to optimized input allocation, reduced resource waste, and higher production efficiency.
Author Contributions
Conceptualization and methodology, N.L. and Z.H.; writing—original draft preparation, N.L. and Z.H.; writing—review and editing, C.C. and L.Z.; supervision, C.C. and L.Z.; resources, Y.S. and H.J.; visualization, C.Y. and L.Y.; experiment and data curation, T.Z., J.C. and Q.F. All authors have read and agreed to the published version of the manuscript.
Funding
This research was funded by the Hebei Province Characteristic Oil Agricultural Industry Technology System—Supporting Agricultural Machinery and Product Processing (grant number HBCT2024050206); the Hebei Province Modern Agricultural Science and Technology Innovation Special Project (grant number 242N1901Z); the Hebei Province Key R&D Program (grant number 21321902D); the Hebei Province Agricultural Science and Technology Achievement Transformation Fund Project (grant number 2025JNZ-S19); the Study on the Flying Behavior and Deposition of Droplets (grant number 3002195); and the Key Laboratory Open Fund Project: Research on Liquid Deposition Characteristics in Apple Tree Canopy Spraying Operations (grant number BFUKF202527).
Data Availability Statement
Data are available from the corresponding author upon reasonable request.
Acknowledgments
The authors gratefully acknowledge the financial support provided by the above-mentioned funding projects.
Conflicts of Interest
The authors declare no conflicts of interest. The funders had no role in the design of the study; in the collection, analyses, or interpretation of data; in the writing of the manuscript; or in the decision to publish the results.
References
- Stahl, A.; Pfeifer, M.; Frisch, M.; Wittkop, B.; Snowdon, R.J. Recent genetic gains in nitrogen use efficiency in winter oilseed rape (Brassica napus L.). Front. Plant Sci. 2017, 8, 963. [Google Scholar] [CrossRef]
- Li, Y.; Zhao, H.; Wang, X.; Cheng, T.; Tian, Y.; Zhu, Y. Abundance considerations for modeling yield of rapeseed during flowering. Front. Plant Sci. 2023, 14, 1188216. [Google Scholar]
- Han, J.; Zhang, Z.; Cao, J. Developing a new method to identify flowering dynamics of rapeseed using Landsat 8 and Sentinel-1/2. Remote Sens. 2021, 13, 105. [Google Scholar] [CrossRef]
- Zhang, Y.; Hu, X.; Ma, J.; Li, S.; Xu, Z. Cross-year rapeseed yield prediction for harvesting decisions using UAV-derived vegetation indices and texture features. Remote Sens. 2025, 17, 2010. [Google Scholar] [CrossRef]
- FAO. World Food and Agriculture—Statistical Yearbook 2023; FAO: Rome, Italy, 2023. [Google Scholar]
- Shen, J.; Liu, Y.; Wang, X.; Bai, J.; Lin, L.; Luo, F.; Zhong, H. A comprehensive review of health-benefiting components in rapeseed oil. Food Chem. 2023, 15, 999. [Google Scholar] [CrossRef] [PubMed]
- Yang, Z.; Huang, Z.; Cao, L. Biotransformation technology and high-value application of rapeseed meal: A review. Bioresour. Bioproc. 2022, 9, 65. [Google Scholar] [CrossRef] [PubMed]
- European Court of Auditors (ECA). Special Report 29/2023: The EU’s Support for Sustainable Biofuels; Publications Office of the European Union: Luxembourg, 2023. [Google Scholar]
- Han, J.; Zhang, Z.; Luo, Y.; Cao, J.; Zhang, L. The RapeseedMap10 database: Annual maps of rapeseed at 10 m spatial resolution based on multi-source data. Earth Syst. Sci. Data 2021, 13, 2857–2871. [Google Scholar] [CrossRef]
- Duan, B.; Xiao, X.; Xie, X.; Huang, F.; Zhi, X.; Ma, N. Remote estimation of rapeseed phenotypic traits under different crop conditions based on UAV multispectral images. J. Appl. Remote Sens. 2024, 18, 018503. [Google Scholar] [CrossRef]
- Brown, J.K.M.; Beeby, R.; Penfield, S. Yield instability of winter oilseed rape modulated by early winter temperature variation. Sci. Rep. 2019, 9, 43461. [Google Scholar] [CrossRef]
- Persaud, L.; Bheemanahalli, R.; Seepaul, R.; Reddy, K.R.; Macoon, B. Low- and high-temperature phenotypic diversity of Brassica carinata shoot traits. Front. Plant Sci. 2022, 13, 900011. [Google Scholar] [CrossRef]
- Junk, J.; Torres, A.; El Jaroudi, M.; Eickermann, M. Impact of climate change on the phenology of winter oilseed rape (Brassica napus L.) in Europe. Agriculture 2024, 14, 1049. [Google Scholar] [CrossRef]
- Chlingaryan, A.; Sukkarieh, S.; Whelan, B. Machine learning approaches for crop yield prediction and nitrogen status estimation in precision agriculture: A review. Comput. Electron. Agric. 2018, 151, 61–69. [Google Scholar] [CrossRef]
- Zhu, H.; Lin, C.; Dong, Z.; Xu, J.-L.; He, Y. Early yield prediction of oilseed rape using UAV-based hyperspectral imaging combined with machine learning algorithms. Agriculture 2025, 15, 1100. [Google Scholar] [CrossRef]
- Wei, C.; Wang, S.; Wang, C.; Wang, L.; Yang, G.; Zhao, C. Estimation and mapping of winter oilseed rape LAI from high-resolution optical satellite data via a hybrid inversion method. Remote Sens. 2017, 9, 488. [Google Scholar] [CrossRef]
- Fang, S.; Tang, W.; Peng, Y.; Gong, Y.; Dai, C.; Chai, R.; Liu, K. Remote estimation of vegetation fraction and flower fraction in oilseed rape with unmanned aerial vehicle data. Remote Sens. 2016, 8, 416. [Google Scholar] [CrossRef]
- Sun, C.; Zhang, Y.; Chen, X.; Li, H.; Zhao, J. Mapping rapeseed aboveground biomass potential using optical and phenotypic metrics. Front. Plant Sci. 2024, 15, 1504119. [Google Scholar] [CrossRef] [PubMed]
- Hu, H.; Ren, Y.; Zhou, H.; Lou, W.; Hao, P.; Lin, B.; Zhang, G.; Gu, Q.; Hua, S. Oilseed rape yield prediction from UAVs using spectral sensors. Agriculture 2024, 14, 1317. [Google Scholar] [CrossRef]
- Zhang, J.; Wang, C.; Yang, C.; Xie, T.; Jiang, Z.; Hu, T.; Luo, Z.; Zhou, G.; Xie, J. Assessing the effect of real spatial resolution of in situ UAV multispectral images on seedling rapeseed growth monitoring. Remote Sens. 2020, 12, 1207. [Google Scholar] [CrossRef]
- Wu, F.; Lu, P.; Chen, S.; Xu, Y.; Wang, Z.; Dai, R.; Zhang, S. Identifying peak flowering dates of winter rapeseed with Sentinel-1/2. Remote Sens. 2025, 17, 1051. [Google Scholar] [CrossRef]
- d’Andrimont, R.; Taymans, M.; Lemoine, G.; Ceglar, A.; Yordanov, M.; van der Velde, M. Detecting flowering phenology in oilseed rape with Sentinel-1/2 time series. Remote Sens. Environ. 2020, 239, 111660. [Google Scholar] [CrossRef]
- Teng, X.; Zhou, G.; Wu, Y.; Huang, C.; Dong, W.; Xu, S. Three-dimensional reconstruction method of rapeseed plants in the whole growth period using RGB-D camera. Sensors 2021, 21, 4628. [Google Scholar] [CrossRef]
- Lv, X.; Wang, X.; Wang, Y.; Zhang, F.; Liu, L.; Wu, Z.; Liu, Y.; Yang, Y.; Li, X.; Chen, L.; et al. Dynamic whole-life cycle measurement of individual plant height in oilseed rape through the fusion of point cloud and crop root zone localization. Comput. Electron. Agric. 2025, 236, 110505. [Google Scholar] [CrossRef]
- Fujiwara, R.; Kikawada, T.; Sato, H.; Akiyama, Y. Comparison of remote sensing methods for plant heights in agricultural fields using UAV-SfM. Front. Plant Sci. 2022, 13, 886804. [Google Scholar] [CrossRef]
- Shen, Y.; Zhou, H.; Yang, X.; Lu, X.; Guo, Z.; Jiang, L.; He, Y.; Cen, H. Biomass phenotyping of oilseed rape through UAV multi-view oblique imaging with 3DGS and SAM model. arXiv 2024, arXiv:2411.08453. [Google Scholar] [CrossRef]
- Jiang, Y.; Wu, F.; Zhu, S.; Zhang, W.; Wu, F.; Yang, T.; Yang, G.; Zhao, Y.; Sun, C.; Liu, T. Research on rapeseed above-ground biomass estimation based on spectral and LiDAR data. Agronomy 2024, 14, 1610. [Google Scholar] [CrossRef]
- Hu, F.; Lin, C.; Peng, J.; Wang, J.; Zhai, R. Rapeseed leaf estimation methods at field scale by LiDAR and TLS. Agronomy 2022, 12, 2409. [Google Scholar] [CrossRef]
- Wu, S.; Hu, C.; Tian, B.; Huang, Y.; Yang, S.; Li, S.; Xu, S. A 3D reconstruction platform for complex plants using OB-NeRF. Front. Plant Sci. 2025, 16, 1449626. [Google Scholar] [CrossRef] [PubMed]
- Huang, Y.R.; Pang, J.; Yu, S.; Su, J.; Hou, S.; Han, T. Reconstruction, segmentation and phenotypic feature extraction of oilseed rape point cloud combining 3D Gaussian Splatting and CKG-PointNet++. Agriculture 2025, 15, 1289. [Google Scholar] [CrossRef]
- Arshad, M.A.; Jubery, T.; Afful, J.; Jignasu, A.; Balu, A.; Ganapathysubramanian, B.; Sarkar, S.; Krishnamurthy, A. Evaluating neural radiance fields (NeRFs) for 3D plant geometry reconstruction in field conditions. Plant Phenomics 2024, 6, 0235. [Google Scholar] [CrossRef]
- Hu, K.; Ying, W.; Pan, Y.; Kang, H.; Chen, C. High-fidelity 3D reconstruction of plants using neural radiance fields. Comput. Electron. Agric. 2024, 220, 108848. [Google Scholar] [CrossRef]
- Chen, H.; Liu, S.; Wang, C.; Wang, C.; Gong, K.; Li, Y.; Lan, Y. Point cloud completion of plant leaves under occlusion conditions based on deep learning. Plant Phenomics 2023, 5, 0117. [Google Scholar] [CrossRef]
- Shen, Y.; Zhou, H.; Yang, X.; Lu, X.; Guo, Z.; Jiang, L.; He, Y.; Cen, H. Biomass phenotyping of oilseed rape through UAV multi-view oblique imaging with 3DGS and SAM model. Comput. Electron. Agric. 2025, 235, 110320. [Google Scholar] [CrossRef]
- Stausberg, L.; Jost, B.; Klingbeil, L.; Kuhlmann, H. A 3D surface reconstruction pipeline for plant phenotyping. Remote Sens. 2024, 16, 4720. [Google Scholar] [CrossRef]
- Paturkar, A.; Zhao, Y.; Sengupta, G.S.; Bailey, D.G. Making use of 3D models for plant physiognomic analysis. Remote Sens. 2021, 13, 2232. [Google Scholar] [CrossRef]
- Huang, X.; Zheng, S.; Zhu, N. High-throughput legume seed phenotyping using a laser scanner and 3D reconstruction (includes Poisson surface reconstruction). Remote Sens. 2022, 14, 431. [Google Scholar] [CrossRef]
- Wu, B.; Yu, B.; Yue, W.; Shu, S.; Tan, W.; Hu, C.; Huang, Y.; Wu, J.; Liu, H. A voxel-based method for automated identification and morphological parameters of street trees from mobile laser scanning data. Remote Sens. 2013, 5, 584–611. [Google Scholar] [CrossRef]
- Kuželka, K.; Slavík, M.; Surový, P. Very high-density point clouds from UAV laser scanning for automatic tree stem detection and direct diameter measurement. Remote Sens. 2020, 12, 1236. [Google Scholar] [CrossRef]
- Jarahizadeh, S.; Salehi, B. A comparative analysis of UAV photogrammetric software performance for forest 3D modeling: Agisoft Metashape, PIX4Dmapper, and DJI Terra. Sensors 2024, 24, 286. [Google Scholar] [CrossRef]
- Wang, Q.; Li, C.; Huang, L.; Chen, L.; Zheng, Q.; Liu, L. Research on rapeseed seedling counting based on an improved crowd counting network. Agriculture 2024, 14, 783. [Google Scholar] [CrossRef]
- Dorbu, F.; Hashemi-Beni, L. Detection of individual corn crop and canopy delineation from UAV imagery. Remote Sens. 2024, 16, 2679. [Google Scholar] [CrossRef]
- Adedeji, O.; Abdalla, A.; Ghimire, B.; Ritchie, G.; Guo, W. Flight altitude and sensor angle affect UAS cotton plant-height assessments. Drones 2024, 8, 746. [Google Scholar] [CrossRef]
- Wu, G.; You, Y.; Yang, Y.; Cao, J.; Bai, Y.; Zhu, S.; Wu, L.; Wang, W.; Chang, M.; Wang, X. UAV-LiDAR measurement of vegetation canopy structure and its impact on land–air exchange simulation based on Noah-MP model. Remote Sens. 2022, 14, 2998. [Google Scholar] [CrossRef]
- Li, W.; Tang, B.; Hou, Z.; Wang, H.; Bing, Z.; Yang, Q.; Zheng, Y. Dynamic slicing and reconstruction algorithm for precise canopy volume estimation in 3D citrus tree point clouds. Remote Sens. 2024, 16, 2142. [Google Scholar] [CrossRef]
- Gao, M.; Yang, F.; Wei, H.; Liu, X. Individual maize location and height estimation in field using UAV-borne LiDAR and RGB images. Remote Sens. 2022, 14, 2292. [Google Scholar] [CrossRef]
- Guo, Z.; Yang, X.; Shen, Y.; Zhu, Y.; Jiang, L.; Cen, H. 3D reconstruction of of complex, dynamic population canopy architecture for crops with a novel point cloud completion model: A case study in Brassica napus (rapeseed). arXiv 2025, arXiv:2506.18292. [Google Scholar]
- Yu, C.B.; Lu, X.; Liao, X.; Liao, H. High-throughput quantification of rapeseed root architecture and its correlation with aboveground biomass. J. Oil Crops China 2016, 38, 681–690. [Google Scholar]
- Lorensen, W.E.; Cline, H.E. Marching cubes: A high-resolution 3D surface construction algorithm. In Seminal Graphics: Pioneering Efforts That Shaped the Field; Association for Computing Machinery: New York, NY, USA, 1987; Volume 21, pp. 163–169. [Google Scholar]
- Kazhdan, M.; Hoppe, H. Screened Poisson surface reconstruction. ACM Trans. Graph. 2013, 32, 29. [Google Scholar] [CrossRef]
- Besl, P.J.; McKay, N.D. A method for registration of 3-D shapes. IEEE Trans. Pattern Anal. Mach. Intell. 1992, 14, 239–256. [Google Scholar] [CrossRef]
- Fallas Calderón, I.D.L.Á.; Heenkenda, M.K.; Sahota, T.S.; Serrano, L.S. Canola yield estimation using remotely sensed images and M5P model tree algorithm. Remote Sens. 2025, 17, 2127. [Google Scholar] [CrossRef]
- Bognár, P.; Kern, A.; Pásztor, S.; Steinbach, P.; Lichtenberger, J. Testing the robust yield estimation method for winter wheat, corn, rapeseed, and sunflower with different vegetation indices and meteorological data. Remote Sens. 2022, 14, 2860. [Google Scholar] [CrossRef]
Disclaimer/Publisher’s Note: The statements, opinions and data contained in all publications are solely those of the individual author(s) and contributor(s) and not of MDPI and/or the editor(s). MDPI and/or the editor(s) disclaim responsibility for any injury to people or property resulting from any ideas, methods, instructions or products referred to in the content. |
© 2025 by the authors. Licensee MDPI, Basel, Switzerland. This article is an open access article distributed under the terms and conditions of the Creative Commons Attribution (CC BY) license (https://creativecommons.org/licenses/by/4.0/).