Abstract
Plant surface electrical signals are key representations for non-destructive monitoring of changes in cell membrane potential, enabling real-time reflection of physiological responses and regulatory processes under external stimuli. However, the low-frequency and weak-amplitude characteristics of these signals make them extremely susceptible to interference from multiple complex noise sources, such as environmental, power-line frequency, and inherent instrument noise. Existing denoising methods suffer from issues such as mode mixing and insufficient fidelity, hindering accurate extraction of genuine plant physiological information. This study proposes a novel denoising approach that integrates Complete Ensemble Empirical Mode Decomposition with Adaptive Noise (CEEMDAN) and Wavelet Soft Thresholding (WST). By decomposing and filtering noise components with adaptive thresholds based on the SURE criterion, the method achieves multi-scale decomposition and effective suppression of residual noise. Applied to surface electrical signals of maize leaves, the results demonstrated a 48% reduction in permutation entropy (PE) for the entire signal. In the resting potential segment, the root mean square (RMS) decreased by 28.91%, total energy dropped by 9.3%, and waveform stability improved. For the action potential segment, the full width at half maximum (FWHM) increased to 0.747, and although the peak amplitude slightly decreased, the waveform structure remained intact. Signal energy became more concentrated within the 0–2 Hz range, achieving efficient noise suppression and high signal fidelity. This method provides a reliable preprocessing technique for elucidating plant physiological mechanisms based on surface electrical signals and holds significant potential for real-time non-destructive monitoring and early warning systems in smart agriculture.
1. Introduction
Plant electrical signals are recognized as reflections of growth status and internal physiological regulation. External stimuli are transmitted to other organs through these electrical signals, enabling plants to perceive and respond to environmental stresses [1]. The role of electrical signals in plants extends beyond regulating internal physiological processes; they also serve as a medium for plants to perceive the outside world. Specifically, external stimuli can trigger changes in local cell membrane ion flux, and the resulting electrical signals can be rapidly transmitted throughout the plant, thereby initiating systemic physiological responses [2,3]. Therefore, the investigation of plant electrical signals is of great significance for understanding the mechanisms underlying plant responses to external stimuli [4]. The surface electrical signals of plant leaves provide a valuable window into physiological status and stress responses. As the primary sites of photosynthesis and respiration, leaves play a decisive role in plant growth. Compared to other plant organs, they are highly sensitive to environmental changes such as illumination, temperature, and humidity; furthermore, non-invasive measurement technology using surface electrodes is more mature and convenient, making it suitable for in situ, real-time monitoring. The acquisition of leaf surface electrical signals offers a non-destructive method for monitoring plant physiology and health [5]. This technique allows real-time recording and analysis of electrical fluctuations without interfering with normal growth. Variations in leaf electrical signals often reflect physiological conditions—such as water status, nutrient availability, and light exposure—as well as stressors including mechanical damage, insect herbivory, and disease. In particular, light conditions, as a key environmental factor affecting photosynthesis and morphogenesis, can induce recognizable electrical signal responses as they vary [6]. Plant electrical signals are characterized as weak low-frequency signals, typically on the order of microvolts (μV) [7,8]. However, during signal acquisition, substantial noise is often introduced into the recorded data; this noise primarily originates from high-frequency sources, such as power-line frequency interference from electrical equipment and inherent noise from the acquisition device itself, as well as low-frequency noise, such as motion artifacts introduced by leaf movement caused by ambient airflow or slight vibrations. The presence of noise compromises signal quality and severely interferes with subsequent analysis, leading to issues such as signal distortion, excessive background interference, and potential misinterpretation of physiological conditions. Therefore, effective denoising and extraction of useful biological signals during the acquisition and analysis of plant electrical signals are essential for obtaining accurate and reliable data for research applications. For understanding plant growth status, the acquired electrical signal data from leaves must be effectively denoised to obtain high-quality signals, which is crucial for subsequent research. In existing studies, common denoising approaches for weak electrical signals include wavelet transform, bandpass filtering, and empirical mode decomposition (EMD). Various wavelet-based methods have achieved relatively good performance in denoising plant electrical signals. The wavelet transform decomposes a signal into detailed information at different frequency bands. By adjusting the wavelet basis function and thresholding strategies, noise can be effectively suppressed while major signal characteristics are preserved [9,10]. Bandpass filtering is a widely used denoising technique that retains signals of interest within a specific frequency range. It is often applied as a preprocessing step in many signal processing pipelines [11,12,13,14]. EMD has been applied across various fields [15,16,17]. It adaptively decomposes complex signals into multiple intrinsic mode functions (IMFs), each representing a specific frequency component. This method performs particularly well in processing non-stationary signals. However, these methods still exhibit limitations: The wavelet-based approach heavily depends on threshold selection; inappropriate parameters may lead to ineffective noise suppression or cause over-smoothing and signal distortion. As a linear filter with fixed frequency bands, bandpass filtering may remove transient features when processing non-stationary and dynamically varying signals with complex compositions, and it fails to distinguish between valid signals and noise within the same frequency band. EMD suffers from mode mixing and end effects, which can disrupt time–frequency distribution and make it difficult to accurately separate different frequency components. Moreover, the decomposition results often lack reproducibility.
In the field of bioelectrical signal processing, techniques for electroencephalography (EEG) and electrocardiography (ECG) have been relatively well-established. Independent Component Analysis (ICA) [18,19,20] and Principal Component Analysis (PCA) [21,22] are among the primary preprocessing methods used in these domains. ICA demonstrates a strong capability for source separation, effectively isolating distinct signal sources from multi-channel recordings. PCA, on the other hand, reduces dimensionality to emphasize dominant components and suppress noise interference. However, these denoising techniques are not directly applicable to plant surface electrical signals. Multi-channel plant electrical signals typically reflect localized responses and signal conduction through tissues, with different channels often recording correlated electrical activities rather than fully independent source signals. Since ICA relies on the assumption of statistical independence among sources, it tends to confuse noise and useful signals under such conditions. Although PCA assumes that principal components represent meaningful information, the dominant components in raw plant electrical signals are frequently dominated by noise, and the extremely low signal-to-noise ratio makes it difficult for PCA to separate useful information effectively.
The Complete Ensemble Empirical Mode Decomposition with Adaptive Noise (CEEMDAN), an improved variant of EMD, not only reduces mode mixing but also exhibits significantly lower reconstruction error compared to conventional EMD [23]. It demonstrates considerable advantages in processing non-stationary and highly complex signals. Nevertheless, the intrinsic mode functions (IMFs) decomposed by CEEMDAN may still contain residual noise, which can introduce errors in subsequent analysis. Therefore, wavelet thresholding is often combined to further process the reconstructed signal. The hybrid CEEMDAN–wavelet approach has been proven effective in processing high-frequency signals in the context of ultrasonic non-destructive testing [24]. However, unlike ultrasonic signals, plant surface electrical signals are characterized by low frequency, weak amplitude, and non-stationary behavior, which necessitate more refined processing strategies.
This study combines adaptive mode decomposition with wavelet thresholding techniques to propose a novel multi-scale denoising method. First, CEEMDAN is employed to decompose the original signal into multiple intrinsic mode functions (IMFs), and the high-frequency components dominated purely by noise are directly removed to complete an initial separation of strong noise. Subsequently, the retained IMF components, where signals and noise are mixed, are subjected to a secondary, refined denoising using wavelet soft thresholding based on the SURE criterion. This strategy provides a more reliable technical means for accurately extracting genuine plant physiological response information from the noise-laden original data.
2. Materials and Methods
2.1. Experimental Materials and Data Preparation
2.1.1. Material Selection and Cultivation
The experimental samples consisted of maize (Zea mays L.) variety ‘Zhengdan 958’. Seeds were pre-treated in a greenhouse by first being soaked in distilled water for 24 h to promote germination. After sprouting, seedlings with vigorous growth were selected and transplanted into plastic buckets measuring 27 cm in diameter and 30 cm in height. A uniformly formulated nutrient soil (composed of 40% garden soil, 30% composted organic fertilizer, 20% river sand, and 10% perlite) was used to ensure consistent soil conditions. Plants were cultivated outdoors under natural environmental conditions and managed using conventional irrigation and fertilization protocols. Throughout the growth period, the ambient temperature was maintained between 20 °C and 30 °C. The entire cultivation process lasted approximately 45 days. At this time, the maize plants had entered the large bell stage. The plants had developed approximately 9–11 fully expanded leaves, reached a height of about 1 m, and the upper whorl of leaves formed a “bell” shape as the stem began jointing and elongating. During this period, the plants exhibited vigorous vegetative growth and stable physiological activity, making it the ideal stage for electrical signal acquisition.
2.1.2. Weak Electrical Signal Acquisition System
In the experiment, a four-channel acquisition system was constructed using four Ag/AgCl patch electrodes, with a custom-made silver needle electrode equipped as the reference electrode. The electrodes were gently attached to the upper surface of the maize leaves via their integrated conductive gel to ensure stable electrical contact and minimize mechanical damage. The installation positions of the recording and reference electrodes are shown in Figure 1. The weak signal recording device was a plant electrical signal acquisition system custom-built by our laboratory. The main control chip of the system is the STM32F103C8T6 (STMicroelectronics, Geneva, Switzerland), the analog-to-digital converter used is the ADS1299 (Texas Instruments, Dallas, TX, USA), and it is compatible with OPEN-BCI (OpenBCI_GUI-6.0.0-beta.1) to enable real-time data storage and visualization.
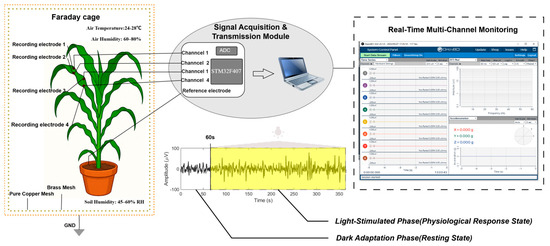
Figure 1.
Experimental setup under light stimulation.
2.1.3. Electrical Signal Recording Under Light Stimulation
Data acquisition was conducted in an environmentally controlled laboratory. All measurements were completed inside a custom-built Faraday cage, which was thoroughly enclosed by two layers of copper mesh (brass and pure copper) and effectively grounded. The environmental conditions inside the Faraday cage were maintained as follows: Temperature was controlled by the laboratory air conditioning system and monitored in real-time by an internal temperature and humidity sensor, ensuring it remained constant at 24–28 °C; air relative humidity was regulated by an air humidifier, also monitored by the sensor, and kept at 60–80%; and soil volumetric water content was monitored using a soil moisture sensor and maintained between 45% and 60% through manual watering as needed. Light stimulation was provided by a full-spectrum plant growth light (simulating sunlight, light intensity of 25,000 Lux), located 30 cm above the leaves. Before data recording, maize plants were placed in the dark for 2 h to ensure they entered a resting state. During data collection, the temperature was 24–28 °C, the air relative humidity was 60–80%, and the soil volumetric water content was 45–60%. The surface electrical signals of maize leaves comprised 60 s of recording in darkness (resting state) followed by 300 s under light stimulation (physiological response state). A schematic of the electrical signal recording from maize leaves is shown in Figure 1. Although the Faraday cage shielded the majority of external electromagnetic interference, the finally acquired raw signal was still unavoidably contaminated with composite noise. High-frequency noise primarily originated from 50 Hz power-line frequency interference from the environment (from lighting equipment), unavoidable electronic noise from the data recording system, and weak mechanical vibrations transmitted from the external environment; meanwhile, low-frequency noise was mainly sourced from slow changes at the electrode–plant tissue interface and the plant’s own non-specific background physiological activity. These complex noise components severely masked the genuine physiological signals; thus, effective denoising is a critical prerequisite for subsequent precise analysis.
Figure 1 illustrates the three core stages of the experiment from left to right. First is the signal acquisition environment, where the maize plant is placed within a double-layer copper mesh Faraday cage, with recording electrodes positioned on the leaf surface, and the control ranges for ambient temperature, humidity, and soil moisture are indicated. Second is the signal acquisition and transmission module, which diagrams the signal’s conversion from the electrodes into a digital signal via the ADS1299, followed by data integration and processing by the main control chip STM32F103C8T6. Finally, the real-time multi-channel monitoring interface displays the raw electrical signal waveform, clearly demarcating the initial 60 s dark adaptation (resting) phase and the subsequent light-stimulated (physiological response) phase.
2.2. Denoising Algorithms: Principles and Implementation
2.2.1. Framework Design of the CEEMDAN-WST Denoising Method
The original signal was decomposed into several IMFs using CEEMDAN. Based on the characteristics of plant electrical signals, the frequency content of each IMF component was evaluated to determine whether it primarily fell within the typical frequency range of plant electrical activity. IMFs containing little or no useful information were removed, while the remaining low-frequency components and the residue—which retained valid plant electrical signals along with partial noise—were preserved to improve overall signal quality. Subsequently, the retained meaningful IMFs were processed using wavelet soft-thresholding (WST). The criteria for selecting these components are elaborated in the Discussion section. An adaptive threshold determination method (Stein’s Unbiased Risk Estimate, SURE) was employed to establish the optimal threshold, effectively suppressing noise while preserving signal details. Finally, the denoised signal was reconstructed from the wavelet-processed IMFs. A schematic diagram of the algorithm is presented in Figure 2. To objectively evaluate the denoising performance, permutation entropy (PE) and zero-crossing rate (ZCR) were introduced as quantitative metrics. PE reflects the randomness of a signal; a value closer to 1 indicates higher randomness and greater noise content. ZCR measures the number of times the signal crosses zero per unit time and is positively correlated with high-frequency components. By comparing the PE and ZCR values of the signal before and after denoising, the effectiveness of the denoising process can be indirectly assessed.
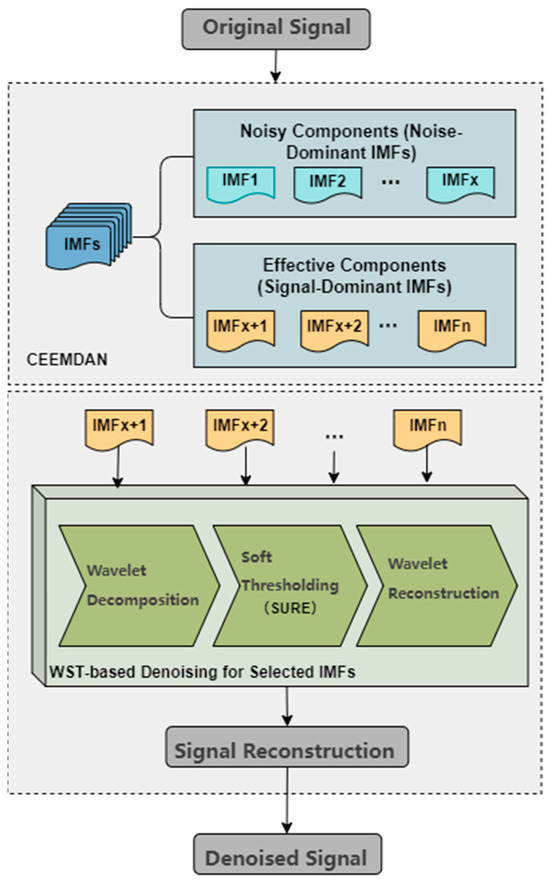
Figure 2.
CEEMDAN-WST denoising flowchart.
2.2.2. Principles of the CEEMDAN-WST Algorithm
The acquired original plant surface electrical signal is first decomposed using the CEEMDAN algorithm. CEEMDAN is an algorithm developed as an improvement upon the traditional EEMD. Unlike EMD, it involves multiple additions of white noise to the signal before decomposition. The specific decomposition steps and calculation formulas are as follows:
Step 1: Taking a segment of the original plant surface electrical signal as an example, white noise is added to the original time series signal to construct a noise-added signal , where is the standard deviation of the added white noise, is a white noise standard deviation sequence, and denotes the noise ensemble size.
Step 2: Each noise-added signal was decomposed using Empirical Mode Decomposition (EMD) to extract the first-order Intrinsic Mode Function (IMF), which typically encompasses the broadest frequency range. The first-order IMFs obtained from all ensemble trials were then averaged. This averaged IMF component more accurately represents the local characteristics of the original signal:
The residual signal after extracting the first-order IMF was calculated:
Step 3: For the stage , a signal is constructed by introducing noise to obtain the noise-added residual signal .
where denotes the -th IMF component extracted from the -th white noise sequence, and is the adaptive noise standard deviation for this stage.
The residual signal was updated as follows:
To further remove the residual noise mixed within the various IMF components, the Wavelet Soft Thresholding (WST) method is employed to perform refined processing on each of the selected effective IMF components. The WST procedure was composed of three steps: wavelet decomposition, soft-thresholding, and wavelet reconstruction. The signal was first decomposed into subbands at different frequencies through wavelet transformation. The wavelet coefficients were then processed using a soft-thresholding function, wherein coefficients with absolute values less than the threshold were set to zero, and those exceeding the threshold were shrunk by subtracting the threshold value. Finally, the denoised signal was reconstructed via the inverse wavelet transform. The specific mathematical expressions are described below:
Step 4: Let the -th effective IMF component selected after decomposing the original plant surface electrical signal via CEEMDAN be . A wavelet transform is performed on each to obtain a set of wavelet coefficients , where represents the scale and indicates the temporal position:
Step 5: Soft-Thresholding Function Processing
A threshold was set, and the soft-thresholding function was applied to each wavelet coefficient :
Step 6: Wavelet Reconstruction
The denoised signal was reconstructed by performing the inverse wavelet transform on the processed coefficients
Step 7: The decomposition process was terminated according to the predefined maximum number of iterations and the residual stopping criterion inherent in the CEEMDAN algorithm. The original signal was then reconstructed as follows:
2.3. Method Comparison and Parameter Configuration
To comprehensively and objectively evaluate the denoising performance of the CEEMDAN-WST method proposed in this study, two denoising methods—singular WST and EMD combined with WST—were set as comparative groups.
Wavelet thresholding denoising is one of the benchmark methods in the signal denoising field. First, the original plant electrical signal replaces in Equation (7) and is directly input into the WST workflow for denoising. Due to the non-stationary nature of these signals, the frequency components of the effective signal and noise may overlap in the time domain. When processing such signals, singular WST may struggle to achieve an optimal balance between noise removal and signal detail preservation, easily leading to signal distortion or residual noise.
EMD-WST denoising is a technique closely related to the method proposed in this paper. Comparison with it clearly highlights the performance advantages of replacing standard EMD with CEEMDAN, particularly the improvement in suppressing mode mixing. First, the EMD algorithm is applied to process the original signal , using its standard implementation which requires no additional parameter settings. EMD adaptively decomposes the signal into a series of IMFs through a ‘sifting’ iterative process. Subsequently, the obtained IMFs are processed using the exact same selection criteria as in our CEEMDAN-WST method and are fed into Equation (7), then entering the WST processing workflow with identical configurations. Finally, the signal is reconstructed to obtain the final denoised signal. The standard EMD algorithm is prone to severe ‘mode mixing’ phenomena when processing noisy and non-stationary signals, meaning a single IMF may contain vastly different time scales, or components of the same time scale are allocated to different IMFs. This imprecise decomposition directly affects the accuracy of the subsequent selection and the efficacy of WST denoising, thereby significantly compromising its performance in the denoising task.
To ensure experimental reproducibility and fairness of comparison, unified parameter configurations were adopted for both CEEMDAN and WST in this study. These parameters were determined based on extensive preliminary experiments, comprehensively considering the frequency characteristics of plant electrical signals and noise distribution properties, with the aim of achieving an optimal balance between denoising performance and signal fidelity. Detailed configurations are provided in Table 1.

Table 1.
Parameter configurations.
3. Results and Analysis
3.1. Denoising Process Analysis
3.1.1. Results of IMF Decomposition and Selection
After processing with the CEEMDAN method, the original plant surface electrical signal was adaptively decomposed into 16 IMF components, arranged from high frequency to low frequency, and one residual term. To effectively separate the parts carrying physiological information from these components, we combined multiple metrics, including frequency domain and information entropy, to quantitatively evaluate each IMF component. Table 2 details the various frequency domain characteristic parameters for IMF1 to IMF16, providing an objective basis for component selection.
Table 2.
IMF component frequency characteristics.
As indicated in the table, the frequencies of IMF1 to IMF3 ranged from 15 to 60 Hz, significantly exceeding the typical frequency range of plant electrical signals. Moreover, their entropy values were relatively high, between 0.7768 and 0.9971, indicating strong disorder within these components. Therefore, IMF1 to IMF3 were identified as noise components and subsequently removed. In contrast, IMF4 and IMF5 were regarded as transitional components. Although their frequencies and entropy values were also elevated, their cumulative energy ratios reached 53.26% and 99.62%, respectively, suggesting the presence of meaningful information. To avoid loss of useful signal content while mitigating noise, these two components were classified as valid. Nevertheless, they required further denoising refinement using WST to enhance signal quality. IMF6 to IMF16, with frequencies all below 2 Hz, a cumulative energy ratio of 100%, and low entropy values ranging from 0.3852 to 0.4954, were identified as the primary IMF components containing plant electrical signals. In summary, IMF4 to IMF16 were selected as valid components representing the plant electrophysiological activity.
3.1.2. Denoising Effect of Wavelet Soft Thresholding on Key Mid-Frequency Components
Additionally, in the selection of IMF components, metrics such as spectral centroid and permutation entropy were comprehensively considered, and mid-frequency components that might contain useful biological information were retained to avoid information loss. All retained components were further processed using wavelet soft-thresholding adopting the SURE criterion. The comparison found that the noise suppression effect of WST on these mid-frequency components, IMF4–IMF6, was significant, as shown in Figure 3. It can be clearly observed from the figure that the original IMF components, before processing, exhibit distinct high-frequency spikes and irregular fluctuations in the time domain, and their corresponding frequency-domain spectrograms also show a rather diffuse energy distribution. After WST processing, the denoised IMF components become significantly smoother in the time domain; in the frequency domain, their energy spectrum also becomes more concentrated, with the main energy converging near the dominant frequency of the signal, while the noise energy in high-frequency regions is substantially reduced. This result objectively demonstrates that WST processing can effectively conduct refined denoising on the selected IMF components, with the noise suppression being most evident for the transitional components.
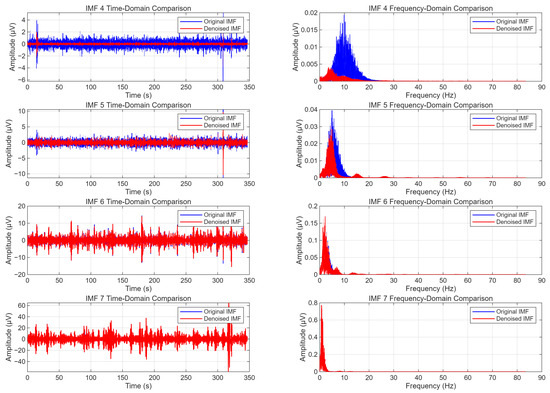
Figure 3.
Comparison of Denoising Effects on Transitional Components.
3.2. Denoising Results Analysis
Prior to denoising, the original plant surface electrical signal was contaminated by substantial external noise originating from environmental sources (e.g., power frequency interference from temperature control equipment and lighting equipment), inherent electronic noise in the data acquisition system, and other complex noise sources. This resulted in a highly irregular temporal waveform with numerous sharp peaks (Figure 4a) and an overall elevated signal amplitude in the time–frequency energy distribution (Figure 4b).

Figure 4.
Time-domain and time–frequency comparison.
The raw signal was processed using the CEEMDAN-WST denoising framework. The specific configuration parameters, which were determined through extensive experimentation considering the frequency characteristics of plant electrical signals and noise distribution properties, are summarized in Table 1. The denoised time-domain signal and its corresponding time–frequency energy distribution are shown in Figure 4c,d, respectively.
The first 60 s segment corresponds to the resting electrical potential of the maize leaf under dark conditions. Compared to the raw signal, the denoised waveform exhibited improved stability, with amplitudes consistently within ±50 μV.
At 60 s, the light was switched on to induce an action potential (AP). The denoised time-domain waveform displayed more organized variations following stimulation. After a brief delay (approximately 20 s), ion channels were activated, generating the AP. The energy of the signal was predominantly concentrated within the 0–2 Hz frequency band, with the average energy in this band reduced by 2.39 dB after denoising.
3.3. Comparative Analysis of Denoising Methods
To further validate the effectiveness of the CEEMDAN-WST denoising method, a comparative analysis was conducted against the WST and EMD-WST methods, focusing on waveform characteristics in the time domain and energy distribution in the frequency domain.
3.3.1. Time-Domain Comparative Analysis
To comprehensively evaluate the denoising performance of the different methods, the permutation entropy (PE) was calculated for the signals processed by the three denoising techniques. For the resting potential segment, quantitative comparisons were made using voltage peak-to-peak (Vpp), root mean square (RMS), and the number of spikes to reflect the background noise amplitude level and the presence of abnormal peaks. For the action potential segment, the peak amplitude (PeakAmp) and full width at half maximum (FWHM) were further computed to assess action potential fidelity.
The original signal data were compared with the signals denoised by WST, EMD-WST, and CEEMDAN-WST (Figure 5), focusing on the resting potential segment (Segment a) and the first elicited action potential (Segment b).
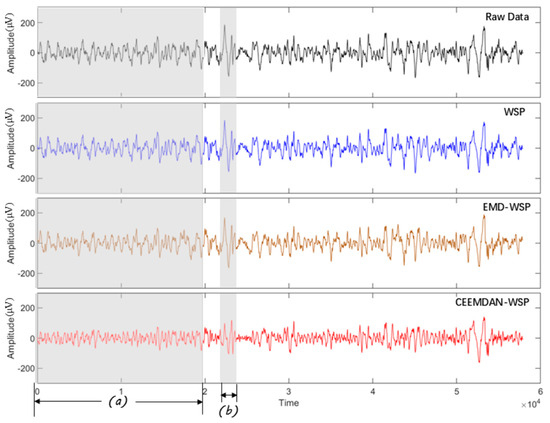
Figure 5.
Time-domain comparison of denoising methods.
The Vpp, RMS, and number of spikes were statistically analyzed for the resting potential segment; the results are summarized in Table 3. The CEEMDAN-WST method reduced Vpp by 28.28%, decreased RMS by 28.91%, and eliminated spikes entirely (reduced to 0). For the action potential segment, a decrease in PeakAmp was observed; however, the complete waveform morphology was preserved. Meanwhile, the FWHM increased to 0.74708, indicating maintained structural integrity of the action potential. These results demonstrate that the CEEMDAN-WST method effectively suppressed noise while preserving the morphological features of the action potential.
Table 3.
Comparison of time-domain quantitative metrics.
3.3.2. Scale-Domain Comparative Analysis
Time-domain metrics alone are insufficient to fully evaluate denoising performance and signal fidelity. Therefore, a comparative analysis was conducted in the scale domain using continuous wavelet transform (CWT) scalograms, as shown in Figure 6. By comparing locally magnified regions, it was evident that the high-intensity speckles—indicative of noise—were significantly suppressed in the signal denoised by CEEMDAN-WST. Based on the scalograms, four metrics were computed to quantify denoising performance: total energy, time-domain energy concentration, scale centroid, and scale bandwidth. These metrics reflect the overall energy level, concentration of energy over time, central tendency of spectral energy distribution, and spread of the frequency distribution, respectively. The results are presented in Table 4.
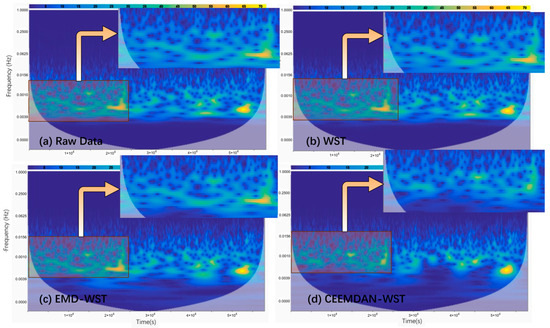
Figure 6.
Scale-domain CWT comparison.
Table 4.
Scale-domain quantitative metric.
The CEEMDAN-WST method reduced total energy by 9.3%, significantly outperforming the other two methods. Combined with a 7% reduction in scale bandwidth, these results indicate effective suppression of high-frequency noise components. Moreover, the scale centroid remained within the low-frequency range, consistent with the spectral characteristics of plant electrical signals, demonstrating that the denoising process did not distort the original signal’s frequency structure. The time-domain energy concentration also increased by 12.4%, indicating that the useful signal became more temporally compact and clearer compared to the other methods. In summary, CEEMDAN-WST significantly reduced noise energy, enhanced signal distinguishability, and preserved the signal’s integrity and essential low-frequency characteristics, demonstrating excellent denoising performance.
4. Discussion
4.1. Selection of IMF Components
In this study, the selection of IMF components is a crucial step, as it directly determines the upper limit of the denoising effect and signal fidelity. To extract valid plant electrical signals from the CEEMDAN-decomposed IMFs and ensure that the small amount of effective information in the high-frequency bands is not lost, it is necessary to cross-validate using a combination of metrics, such as frequency domain and information entropy, along with known plant electrophysiological prior knowledge.
Frequency range is the primary criterion for distinguishing between signal and noise. Numerous studies have indicated that the frequency range of plant electrical signals is below 2 Hz [25,26,27]. Analysis of the data in Table 2 of the Results section reveals that the dominant frequencies of IMF1–IMF3 far exceed this range. Therefore, we have sufficient reason to identify these high-frequency components as pure noise, primarily composed of power-line frequency interference and instrument electronic noise, and thus remove them directly. Regarding the processing of the transitional components IMF4 to IMF6, the data shows their frequencies and entropy values are also elevated, suggesting they might also be considered noise. However, these components cannot be simply discarded. The core consideration behind the denoising method proposed in this study is to achieve a balance between noise reduction and information integrity. It is particularly noteworthy that the cumulative energy of IMF5 within the 0–10 Hz band reached 99.62%. This high energy proportion may represent rapid physiological information generated by the plant in response to light stimulation; if directly removed, it could lead to a significant loss of useful information. Second, PE provides a quantitative metric for measuring signal complexity and randomness. The closer a signal’s PE value is to 1, the stronger its randomness and the more it resembles noise; conversely, a smaller value indicates stronger regularity and determinism in the signal. The results show that the high entropy values of IMF1–IMF3 further corroborate their characteristics as random noise, while the low entropy values of IMF6 and subsequent components are fully consistent with the regular characteristics that physiological signals, as structured information carriers, should possess.
In summary, identifying IMF4–IMF16 as the effective components containing the plant electrical signal was a comprehensive decision based on multi-dimensional metrics—including frequency, entropy, and energy distribution—and combined with electrophysiological prior knowledge, aiming to retain potential physiological information to the greatest extent possible.
4.2. Comparison of Denoising Techniques and Application Potential
Liao proposed an improved wavelet thresholding method for denoising plant electrical signals [28]. After wavelet decomposition, an enhanced threshold function was introduced, which utilized an exponential function to achieve smooth attenuation near the threshold. A tuning factor α was incorporated to adjust the threshold according to different types of plant electrical signals, thereby avoiding signal distortion caused by over-denoising. To validate the algorithm’s performance, researchers conducted comparative denoising experiments on plant electrical signals under four spectral conditions: red light, red–blue light, blue light, and white light. The data showed that under all test conditions, the improved wavelet thresholding method achieved a higher signal-to-noise ratio and a lower mean squared error compared to traditional methods. It offers high computational efficiency and enables multi-scale analysis, making it suitable for rapid real-time processing tasks in digital agriculture. However, real plant electrical signals are often contaminated by diverse external noise, and the denoising efficacy is highly sensitive to threshold and tuning factor selection, which typically requires extensive experimentation for different signal types and noise environments. This represents a longstanding limitation of traditional wavelet denoising methods.
Gu, J. et al. [29] introduced a hybrid denoising approach combining Variational Mode Decomposition (VMD) and Empirical Wavelet Transform (EWT). The signal was first decomposed into modal components via VMD, and high-frequency components were removed, resulting in notable noise suppression. Subsequently, EWT with adaptive thresholding was applied for sub-band division and threshold processing within modes, reducing dependency on parameter tuning. This combined method exhibited excellent performance in denoising plant electrical signals, particularly in studies analyzing plant responses to external stimuli, where it significantly mitigated noise interference.
In comparison, the CEEMDAN-WST method proposed in this study offers further improvements in signal fidelity. It reduces reliance on manual threshold adjustment and demonstrates superior retention of mid-to-low frequency components relative to the VMD-EWT approach. By incorporating adaptive noise assistance, CEEMDAN significantly alleviates mode mixing, yielding more detailed decomposition and clearer frequency band separation than VMD. The retained components were further processed using wavelet soft-thresholding based on the Stein’s Unbiased Risk Estimate (SURE) criterion. As illustrated in the corresponding figures, significant noise suppression was observed in components IMF4 to IMF6. This method achieves an improved balance between noise removal and signal preservation. Although it may slightly compromise overall noise suppression capability, it retains valuable mid-frequency information. The subsequent wavelet soft-thresholding under the SURE criterion effectively suppresses residual noise in these mid-frequency bands, mitigating the issue of noise retention.
5. Conclusions
This study addresses the problem of severe contamination in plant surface electrical signals by complex high- and low-frequency noise during the acquisition process, proposing a multi-scale hybrid denoising method that combines CEEMDAN and WST. The method first decomposes the original signal via CEEMDAN and removes the high-frequency components dominated purely by noise; subsequently, the retained IMF components, where signals and noise are mixed, are subjected to secondary, refined processing using wavelet soft thresholding based on the SURE criterion, thereby suppressing residual noise while protecting the physiological signal from distortion. The method was also applied to the denoising of plant surface electrical signals. The results demonstrated that the method not only effectively removed high-frequency noise but also ensured signal fidelity while suppressing residual noise in the low-frequency band. After denoising, the permutation entropy (PE) of the overall signal was reduced from 0.9151 to 0.4789. The amplitude of the plant resting potential was stabilized within ±50 μV, with the voltage peak-to-peak (Vpp) and root mean square (RMS) values reduced by 28.28% and 28.91%, respectively, in the time domain. The full width at half maximum (FWHM) of the action potential segment increased to 0.74708. In the scale domain, the total energy was decreased by 9.3%, the time-domain energy concentration was improved by 12.4%, and the scale bandwidth was narrowed by 7%. All these metrics outperformed those obtained using both WST and EMD-WST methods. The proposed method achieved an effective balance between noise suppression and signal fidelity in plant electrical signal processing, providing a reliable preprocessing foundation for physiological and response studies of plant electrical signals. It exhibits broad application potential for future smart agriculture monitoring and early warning systems.
Author Contributions
Conceptualization, F.T. (Fangmin Tian) and Z.L.; Methodology, Z.L.; Validation, Z.L. and F.T. (Fangmin Tian); Data Curation, Z.L.; Writing—Original Draft Preparation, Z.L.; Writing—Review and Editing, F.T. (Fangmin Tian) and F.T. (Feng Tan); Visualization, Z.L.; Supervision, F.T. (Fangmin Tian); Project Administration, F.T. (Fangmin Tian); Funding Acquisition, F.T. (Fangmin Tian). All authors have read and agreed to the published version of the manuscript.
Funding
This work was supported by the Natural Science Foundation of Heilongjiang Province (LH2023F043) and The National Key Research and Development Program of China (2023YFD2301605).
Data Availability Statement
The data presented in this study are available on request from the corresponding author. The data are not publicly available due to being part of an ongoing research project.
Conflicts of Interest
The authors declare no conflicts of interest.
Abbreviations
The following abbreviations are used in this manuscript:
| CEEMDAN | Complete Ensemble Empirical Mode Decomposition with Adaptive Noise |
| WST | Wavelet Soft Thresholding |
| PE | Permutation entropy |
| RMS | Root mean square |
| FWHM | Full width at half maximum |
| EMD | Empirical mode decomposition |
| EEG | Electroencephalography |
| ECG | Electrocardiography |
| ICA | Independent Component Analysis |
| PCA | Principal Component Analysis |
| IMFs | Intrinsic mode functions |
| AP | Action potential |
| ZCR | Zero-crossing rate |
| Vpp | Voltage peak-to-peak |
| PeakAmp | Peak amplitude |
| CWT | Continuous wavelet transform |
| VMD | Variational Mode Decomposition |
| EWT | Empirical Wavelet Transform |
References
- Li, J.-H.; Fan, L.-F.; Zhao, D.-J.; Zhou, Q.; Yao, J.-P.; Wang, Z.-Y.; Huang, L. Plant electrical signals: A multidisciplinary challenge. J. Plant Physiol. 2021, 261, 153418. [Google Scholar] [CrossRef] [PubMed]
- Huber, A.E.; Bauerle, T.L. Long-distance plant signaling pathways in response to multiple stressors: The gap in knowledge. J. Exp. Bot. 2016, 67, 2063–2079. [Google Scholar] [CrossRef] [PubMed]
- Mudrilov, M.; Ladeynova, M.; Grinberg, M.; Balalaeva, I.; Vodeneev, V. Electrical signaling of plants under abiotic stressors: Transmission of stimulus-specific information. Int. J. Mol. Sci. 2021, 22, 10715. [Google Scholar] [CrossRef] [PubMed]
- Xin, Y.-M. Research and Application of Online Detection Equipment for Plant Electrical Signals. Master’s Thesis, Heilongjiang Bayi Agricultural University, Daqing, China, 2020. [Google Scholar] [CrossRef]
- Shi, J.-X. Study on an In Situ Detection Method for Electrical Transmission Characteristics in Banded-Leaf Maize Using Array Electrodes. Master’s Thesis, Heilongjiang Bayi Agricultural University, Daqing, China, 2024. [Google Scholar] [CrossRef]
- Garcia-Menchaca, L.; Guerra-Sánchez, C.; Tarchoun, N.; Lebbihi, R.; Cruz-Dominguez, O.; Sifuentes-Gallardo, C.; Peréz-Martínez, J.G.; Cleva, M.; Ortega-Sigala, J.; Durán-Muñoz, H. Early-Stage Research to Characterize the Electrical Signal of Optically Stimulated Hydroponic Strawberries Using Machine Learning Techniques. Eng. Proc. 2025, 87, 44. [Google Scholar] [CrossRef]
- Wang, L.-Z.; Li, Q. Quantitative study on weak electrical signals of Bryophyllum pinnatum. J. China Jiliang Univ. 2009, 20, 195–200. [Google Scholar] [CrossRef]
- Favre, P.; Agosti, R.D. Voltage-dependent action potentials in Arabidopsis thaliana. Physiol. Plant. 2007, 131, 263–272. [Google Scholar] [CrossRef] [PubMed]
- Zhang, X.; Yu, N.; Xi, G.; Meng, X. Power spectrum analysis of maize based on wavelet de-noising. In Proceedings of the 2nd international conference on information science and engineering, Hangzhou, China, 4–6 December 2010. [Google Scholar]
- Wang, J.H.; Geng, L.H.; Zhang, C.M. Research on the weak signal detecting technique for crop water stress based on wavelet denoising. Adv. Mater. Res. 2012, 424–425, 966–970. [Google Scholar] [CrossRef]
- Peng, W. EEG preprocessing and denoising. In EEG Signal Processing and Feature Extraction; Hu, L., Zhang, Z., Eds.; Springer: Singapore, 2019; pp. 71–87. [Google Scholar] [CrossRef]
- Varady, P. Wavelet-based adaptive denoising of phonocardiographic records. In Proceedings of the 23rd Annual International Conference of the IEEE Engineering in Medicine and Biology Society, Istanbul, Turkey, 25–28 October 2001. [Google Scholar] [CrossRef]
- Liu, Z.; Bing, Z.; Tian, L.; Li, M.; Sun, Y.; Wang, Y. Research on de-noising method of plant electric signal based on EMD and wavelet threshold. In Proceedings of the 2021 7th International Conference on Control, Automation and Robotics (ICCAR), Singapore, 23–26 April 2021. [Google Scholar]
- Ren, Z.; Tian, F.; Wang, S.; Chen, S. Research on maize leaves surface action potential recognition method based on ResNet-18SE. Smart Agric. Technol. 2025, 10, 100819. [Google Scholar] [CrossRef]
- Zhang, M.; Wei, G. An integrated EMD adaptive threshold denoising method for reduction of noise in ECG. PLoS ONE 2020, 15, e0235330. [Google Scholar] [CrossRef] [PubMed]
- Khaldi, K.; Alouane, M.T.-H.; Boudraa, A.-O. A new EMD denoising approach dedicated to voiced speech signals. In Proceedings of the 2nd International Conference on Signals, Circuits and Systems, Nabeul, Tunisia, 7–9 November 2008. [Google Scholar] [CrossRef]
- Yu, J.; Zhang, Z. Research on the seismic signal denoising with the LMD and EMD method. In Proceedings of the 2017 IEEE 2nd Advanced Information Technology, Electronic and Automation Control Conference (IAEAC), Chongqing, China, 25–26 March 2017. [Google Scholar] [CrossRef]
- Cheng, J.; Li, L.; Li, C.; Liu, Y.; Liu, A.; Qian, R.; Chen, X. Remove diverse artifacts simultaneously from a single-channel EEG based on SSA and ICA: A semi-simulated study. IEEE Access 2019, 7, 60276–60289. [Google Scholar] [CrossRef]
- Rejer, I.; Górski, P. Benefits of ICA in the case of a few channel EEG. In Proceedings of the 2015 37th Annual International Conference of the IEEE Engineering in Medicine and Biology Society (EMBC), Milan, Italy, 25–29 August 2015. [Google Scholar] [CrossRef]
- Willigenburg, N.W.; Daffertshofer, A.; Kingma, I.; van Dieën, J.H. Removing ECG contamination from EMG recordings: A comparison of ICA-based and other filtering procedures. J. Electromyogr. Kinesiol. 2012, 22, 485–493. [Google Scholar] [CrossRef] [PubMed]
- Kumar, B.K. Estimation of number of levels of scaling the principal components in denoising EEG signals. Biomed. Pharmacol. J. 2021, 14, 425–433. [Google Scholar] [CrossRef]
- Ziani, S.; Suchetha, M.; Ziani, L. Enhancing signal quality: A comparative study of ICA and PCA in denoising EMG and ECG signals. In Smart Internet of Things for Environment and Healthcare; Springer: Cham, Switzerland, 2024; pp. 189–196. [Google Scholar]
- Hu, Y.; Ouyang, Y.; Wang, Z.; Yu, H.; Liu, L. Vibration signal denoising method based on CEEMDAN and its application in brake disc unbalance detection. Mech. Syst. Signal Process. 2023, 187, 109972. [Google Scholar] [CrossRef]
- Yang, Y.; Li, S.; Li, C.; He, H.; Zhang, Q. Research on ultrasonic signal processing algorithm based on CEEMDAN joint wavelet packet thresholding. Measurement 2022, 201, 111751. [Google Scholar] [CrossRef]
- Wang, Z.-Y.; Fan, L.-F.; Wang, Y.-Q.; Li, J.H. Selection of recording modes for plant surface electrical signals based on signal feature analysis. Trans. Chin. Soc. Agric. Eng. 2018, 34, 137–143. [Google Scholar] [CrossRef]
- Hedrich, R.; Salvador-Recatalà, V.; Dreyer, I. Electrical wiring and long-distance plant communication. Trends Plant Sci. 2016, 21, 376–387. [Google Scholar] [CrossRef] [PubMed]
- Volkov, A.G. Plant Electrophysiology: Theory and Methods; Springer: Berlin, Germany, 2006. [Google Scholar]
- Liao, X.-L. Denoising method of plant electrical signal based on improved wavelet threshold. Anhui Agric. Sci. 2023, 51, 4–6+20. [Google Scholar]
- Gu, J.; Tian, F.; Shi, J.; Tan, F. Noise reduction and analysis of leaf electrical signals of strap-leaved plants based on VMD-EWT. Comput. Electron. Agric. 2024, 226, 109441. [Google Scholar] [CrossRef]


Disclaimer/Publisher’s Note: The statements, opinions and data contained in all publications are solely those of the individual author(s) and contributor(s) and not of MDPI and/or the editor(s). MDPI and/or the editor(s) disclaim responsibility for any injury to people or property resulting from any ideas, methods, instructions or products referred to in the content. |
© 2025 by the authors. Licensee MDPI, Basel, Switzerland. This article is an open access article distributed under the terms and conditions of the Creative Commons Attribution (CC BY) license (https://creativecommons.org/licenses/by/4.0/).