Abstract
Most Polish commercial dairy farms have expanded their production in recent years through herd increases and milk yield improvements. This study investigates internal and external drivers shaping farmers’ decisions regarding the future scale of milk production on family farms in Poland. The analysis is based on two sources of data. The primary input comes from a survey conducted in 2025 among 549 commercial dairy farms. To situate individual responses within a broader structural context, accounting data from 444 farms that continuously reported to the Polish FADN between 2005 and 2022 were used. Although not central to the analysis, these data illustrate long-term sectoral developments, particularly herd enlargement and resource concentration. The survey demonstrated a diversity of drivers shaping decisions to expand or stabilise milk production in the next five years. Farmers’ individual characteristics play a central role. The farmer’s perceived health and work ability (5-year horizon), as well as the availability of a successor, strongly influence the willingness to expand or maintain milk production levels. Other important factors include tangible resources, organisational capacity, and financial strength, such as herd size, agricultural land area, and investment capacity. This highlights the role of production potential and farm adaptability. External conditions such as land access, lease prices, and the market environment are not decisive by themselves but provide the background against which farmers evaluate their options. The study confirms that no single factor drives changes in dairy farms. What matters most is how farmers configure and align their available resources with external circumstances. The ability to combine human, physical, and financial capital in a coherent and strategic way is essential for shaping production strategies and ensuring the continuity of farm operations.
1. Introduction
Cattle and dairy farming are an important part of the Polish economy. The amount of EUR 5827 million of milk sold in 2023 accounted for 18.9% of the agricultural product output in Poland. With cattle sales, the amount increases to 25.8% [1]. Although the share of milk and cattle sales in agricultural product output was relatively constant from 2010 to 2023, ranging from 23.6 to 26.8%, milk’s value grew steadily to reach nearly 2.5 times its 2010 level in 2023. Additionally, the production of cow milk in Poland amounted to 15.5 million tonnes in 2023. This volume places the country in the third place among the 27 EU member states (after Germany and France), demonstrating the dairy sector’s significant role in the Polish economy. The export value of dairy products in Poland reached EUR 3282 million in 2023, equivalent to 4.8 million tonnes of milk [2].
These macroeconomic parameters demonstrate the substantial role of the dairy sector in the Polish agri-food industry and its dynamic growth between 2010 and 2023. The latter has been driven by both external factors and internal forces. Globalisation, especially from 1990 to 2022, and Poland’s accession to the EU in 2004, were the main external considerations. The main internal determinants include cattle-raising traditions in Poland, a favourable climate, and relatively high economic competition in milk production compared to other agricultural activities [3].
However, the Polish dairy industry is facing numerous barriers to its growth. One of them is a relatively small scale of milk production on dairy farms [4]. There were 173.3 thousand cattle and dairy farms in 2023 in Poland, with the average herd size of less than 13 cows. Only 11.2% of the farms had more than 30 cows, but they contributed 51.1% to Poland’s cow population [2]. This state is due to multiple factors [5], but historical ones, often disregarded in the literature, merit a mention. Following the end of World War II in 1945, Poland initiated its sociopolitical transformations. The governments deployed and perpetuated a socialist economy, which marginalised private ownership. In agriculture, large, state-controlled holdings were established. It was often done by force; land was expropriated from farming families and contributed to state farms. However, strong opposition from farmers forced the government to abandon the concept. Although there were private farms in Poland between 1945 and 1989, they were under constant pressure and their growth was inhibited [6]. As a result, after the political transformation of 1989 and the shift towards a free-market economy, family farms had a very low production potential. Their land resources and production scales were relatively small, especially compared to those of their Western European counterparts [7]. Today, 36 years after the transformation, Polish family farms, including dairy farms, still have not reached large-scale production levels. Notably, the expansion is much faster in other European countries. According to the Farm Accountancy Data Network (FADN), which collects data from commercial farms that produce about 90% of the standard output (SO) for a specific EU member state, the economic size of the average dairy farm in the Netherlands was EUR 451 thousand in 2022. It held 105 cows with assets totalling EUR 4.460 million. The economic size of the average Polish dairy farm expressed as SO in FADN was EUR 60 thousand in 2022, with 21 cows and EUR 317.8 thousand in assets (EU FADN).
Today’s economic theories consider farms in the food production and distribution structure mainly as producers of materials that are processed at later stages and distributed to consumers. Moreover, food raw materials of agricultural origin are mass-produced. Cow’s milk from specific regions or even countries has similar composition. Additionally, the inflexible demand for food products forces farmers to increase their milk output. It is stimulated by continuous pressure to improve performance, thanks to technological and biological progress, to increase income [3,8].
While extensive research has examined the economic performance and structural transformation of dairy farming [8,9,10,11], less is known about how farmers perceive growth opportunities and how personal, institutional, and market factors jointly shape strategic decisions. This issue is particularly relevant in post-socialist agricultural systems, where historical legacies and resource constraints continue to influence development trajectories.
The present study seeks to identify and evaluate key internal and external determinants influencing the future scale of milk production on Polish family farms. It aims to provide a deeper understanding of the mechanisms driving farm growth and strategic decision-making in the evolving institutional and market environment. The following section introduces the theoretical framework that underpins this analysis.
2. Theoretical Background
2.1. Research Gap and Conceptual Justification
In recent decades, European agriculture, including that of Poland, has shown a clear trend toward concentration and an increasing scale of production on dairy farms. The declining number of producers, accompanied by simultaneous growth in herd size and farmland area, represents the main direction of structural transformation within the sector [3,4,5]. This process reflects a combination of cost pressures, technological progress, policy changes and growing competitiveness requirements, all of which affect farms to varying degrees depending on their resources and adaptive potential [3,7,8].
Despite extensive research on efficiency and production concentration, there is still no consistent explanation for why some farms decide to expand while others maintain their current scale or withdraw from production. Previous studies have mainly focused on economic and structural aspects, using classical quantitative methods such as regression models, logit analyses, correlations or synthetic indicators [10,12,13]. Research on the development of the dairy sector has drawn on various theoretical approaches and analytical perspectives, taking into account economic, demographic, behavioural and institutional factors (Table 1). However, many of these analyses have focused on selected groups of variables without fully considering the links between the material resources of farms and the personal and adaptive characteristics of their owners. In Poland, where the pace of production concentration remains relatively slow and farm structures are highly diverse [2,7], identifying the factors that promote scale enlargement and understanding their interactions is of particular importance.

Table 1.
Overview of Selected Factors Influencing Dairy Farm Development and the Research Gap.
Previous studies show that demographic factors such as age, succession, and education play an important role in farmers’ strategic decisions [14,20], yet they are usually examined without reference to organisational or psychological contexts. Issues related to farmers’ health, work ability, and motivation have appeared only sporadically in the literature [6,15,17], despite their crucial importance for long-term sustainability and investment decisions. Behavioural aspects such as flexibility, market perception, and readiness for change have been analysed mainly in the context of well-being and resilience [8,9], rather than as direct determinants of development strategies.
There is also a lack of consistent approaches to institutional and market factors such as agricultural policy, land and labour availability, competition mechanisms, and price stability. Although sectoral studies [2,3,5,7] broadly describe their influence on the functioning of the dairy market, they rarely integrate these dimensions with analyses of farm-level resources and decision-making processes.
The identified research gap can therefore be defined as the absence of an empirical framework explaining how farmers’ resources, attitudes, and adaptive capacities, shaped by their institutional and market environments, influence decisions regarding the future scale of milk production. Previous analyses have focused mainly on economic and structural data, while exploratory approaches and farmers’ own perspectives as sources of insight into decision-making mechanisms have been used less frequently. There is still a shortage of studies that capture the interaction and synergy of diverse factors, both material and intangible, and that integrate complementary analytical perspectives. The following chapters present the theoretical framework that supports such an approach and forms the basis for the subsequent empirical analysis.
2.2. Resource-Based View and Complementary Perspectives (RBV, IBV, MBV)
Considering that farms are currently positioned at the beginning of the food distribution chain and primarily operate as producers of raw materials, they have limited influence over downstream market conditions. As a result, their long-term competitiveness depends largely on internal resources and capabilities rather than external price mechanisms. For this reason, the resource-based view (RBV) offers a suitable framework for analysing the drivers shaping the future scale of milk production and the competitive advantage of dairy farms. This approach emphasises that access to, and the effective use of, resources and capabilities, including knowledge and managerial competencies are key determinants of success. The theory has been refined over the years. Although its origins can be traced back to E.H. Chamberlin’s work on resource heterogeneity [21], the RBV was substantially developed by B. Wernerfelt [22] and J.B. Barney [23]. It seeks to explain which resources within an enterprise have the potential to secure a competitive advantage and lead to improved economic performance.
Researchers break down and group the resources in various ways. H. Itami identifies physical, human, monetary, and invisible resources: managerial skills, technologies, customer trust, and organisational culture [24]. J.B. Barney distinguished tangible assets, capabilities, organisational processes, information, and knowledge. They are controlled by the enterprise and can further the strategy towards improved efficiency and effectiveness [23]. M. Romanowska classifies resources as visible, part of company assets, or invisible, concerning people and culture [25]. For farms, the distinction between tangible (visible) and intangible (invisible) resources is particularly relevant. Within tangible resources, two subgroups typical of agriculture stand out: land and so-called biological assets (livestock, perennial plants, etc.). Considering the specificity of dairy farming, the tangible resources decisive for the competitive position include (1) owned land (owned agricultural land); (2) leased land (leased agricultural land); (3) the value of farm buildings; (4) the value of tractors, farm machinery, and equipment. Furthermore, an analysis of the potential of production upscaling on dairy farms should consider not only the stock of tangible resources but also the conditions under which they can be effectively utilised. Intangible (invisible) resources are just as important as tangible (visible) ones. The literature shows that the primary component of these resources is broadly defined human capital. It refers to desirable characteristics of farm operators and workers, such as knowledge, perceived health, abilities, work motivation, and, in family-run farms, the presence of a potential successor, which together shape the baseline capacity for strategic development [3,6,26].
Still, scholars emphasise that internal resources alone do not explain farm development. The RBV is inherently endogenous and overlooks the institutional and market environments [27,28]. Therefore, it is worth complementing this approach with the institution-based view (IBV) and the market-based view (MBV) [29]. The IBV accentuates the role of the institutional framework, such as agricultural policy, subsidy schemes, environmental regulations, or social norms that provide the context for agricultural activities and affect decision-making [29,30]. The MBV extends this perspective by highlighting external economic constraints that shape the feasibility of resource accumulation, including agricultural land lease prices, debt capital costs (loan interest rates), and the availability and cost of hired labour. It also focuses on competition mechanisms and market structure, namely milk prices, costs of means of production, relationships with customers and vendors and changing consumer preferences [31,32].
In this way, the three complementary perspectives (RBV, IBV, and MBV) provide a foundation for understanding how internal resources and the institutional–market environment jointly shape strategic decisions at the farm level. However, the mere possession of resources does not determine the capacity for survival and growth. What becomes crucial is the ability to deploy these resources adaptively, which leads to the concept of dynamic capabilities.
2.3. Dynamic Capabilities and Farm Adaptability
In recent decades, research on the competitiveness of enterprises, including farms, has increasingly shifted towards the dynamic capabilities view, which highlights adaptability. The theory amplified by Teece and Pisano and Shuen [18] states that the possession of resources does not guarantee a competitive advantage if the organisation is unable to shape them flexibly and adapt to a changing environment. Dynamic capabilities (DC) include processes for detecting opportunities and threats and mobilising and reconfiguring resources to maintain competitive advantage despite an uncertain environment [33]. The adaptability of farms, dairy farms in particular, means being able to make investment decisions, embrace changes in agricultural policies, adapting to fluctuating prices, and remaining open to organisational and technological innovations [34]. Empirical research shows that farms that are more capable of adapting invest more often, are more receptive to market cooperation, and attain better economic and social results than those preferring static attitudes [35].
From the perspective of dairy farms, this adaptability manifests itself in several critical dimensions: the ability to accumulate financial reserves and undertake investments despite uncertainty, the capacity to reorganise labour and land use, and resilience to external shocks such as policy reforms or market volatility. These dimensions constitute the practical expression of dynamic capabilities, determining whether farms can convert their resource potential into a long-term developmental trajectory rather than mere survival [5,34].
This adaptive capacity forms a bridge between resource-based theories and the strategic choices observed among farmers, determining whether farms pursue a developmental path or merely react to external constraints.
2.4. Conceptual Framework for Farm Development Analysis
The theoretical underpinnings discussed above are reflected in the conceptual model adopted for this study, which integrates three complementary analytical perspectives: the RBV, the IBV, and the MBV. These are combined with the dynamic capabilities concept to account for a mechanism that empowers farms to use their resources effectively while remaining flexible when regulatory and market constraints change (Figure 1).
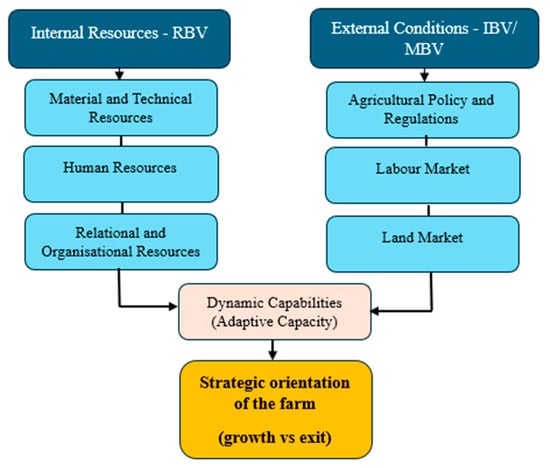
Figure 1.
Conceptual Framework; source: original work.
The model distinguishes two main domains influencing farmers’ strategic orientation: internal resources and external conditions. On the internal side (RBV), three key resource groups are identified, namely material and technical, human, and relational and organisational, which together determine the farm’s production and management potential. On the external side (IBV/MBV), the framework highlights institutional and market factors, including agricultural policy and regulations, as well as the functioning of land and labour markets. These two domains interact through the farm’s dynamic capabilities, understood as its adaptive capacity, that is, the ability to transform, combine, and reconfigure resources in response to changing external conditions. Ultimately, this interaction determines the farm’s strategic orientation, expressed through the choice between development and exit pathways.
In summary, the research design integrates RBV as the primary explanatory paradigm, complemented by DC as an adaptive mechanism and IBV/MBV as contextual, interpretation-oriented perspectives. This integrated approach provides the theoretical rationale for distinguishing between divergent development pathways at the farm level, which underpins the definition of the strategic orientations examined in the empirical analysis.
The presented conceptual model serves as a starting point for the operationalisation of variables and the construction of key analytical categories. The following section presents the data sources and research procedure applied to identify the strategic orientations of dairy farms.
3. Data Sources and Methods
3.1. Source Data
The primary source of empirical data for the study is the results of a survey among commercial dairy farm owners. The survey was conducted in the first half of 2025 in the voivodeships important for the Polish dairy industry (Podlaskie and Warmińsko-Mazurskie, totalling 371 respondents) and in a region of significant agrarian fragmentation dominated by declining animal husbandry (Podkarpackie, 177 respondents). The considerable diversity of agricultural structures among the regions broadened the analytical perspective and robustness of conclusions.
The data were collected using a standardised pen-and-paper survey questionnaire approved by the Rector’s Ethics Committee for Human Research of the University of Agriculture in Kraków. The questionnaires were distributed and collected with the aid of dairy plant employees at milk reception points. Participation was voluntary and anonymous.
The survey questionnaire was developed based on the adopted theoretical framework, particularly the resource-based view (RBV), complemented by the institutional-based view (IBV), the market-based view (MBV), and the concept of dynamic capabilities. It included the main categories of resources (material, human, organisational, and relational), as well as farmers’ assessment of the external environment and their readiness for change. The questionnaire contained 39 mainly closed-ended questions, which allowed for a clear operationalisation of variables. The questions referred to resource structure (land, labour, equipment), management practices, financial situation, investment plans, relations with institutions, and perceptions of market and regulatory conditions (for example, labour availability, agricultural policy, or media influence). A large proportion of the questionnaire consisted of Likert-scale questions. Particular attention was paid to assessing the potential to increase the scale of milk production, which formed the basis for the dependent variable. The full list of questions used in the modelling and their assignment to theoretical categories is presented in the Supplementary S1.
In total, about 730 questionnaires were distributed, and 562 were returned, resulting in a 77% response rate. The data were digitised by two members of the research team and independently verified by two analysts to ensure accuracy and consistency before further analysis. Thirteen questionnaires were rejected due to missing answers to key questions, especially those relating to the dependent variable and main predictors used in the classification model. In these cases, the listwise deletion approach was applied, excluding the entire form from further analysis. This approach was used to maintain the internal consistency of the dataset and avoid distortions caused by imputing missing values for essential variables. The scale of rejection was limited and did not significantly affect the sample size.
For another 23 forms, representing about 4 percent of the accepted questionnaires, minor data gaps were found. In those cases, missing responses were filled in based on internal consistency within the questionnaire. For example, data on total farm area were calculated as the sum of owned and leased land, and in three cases, the area was estimated as the sample mean. Missing answers in Likert-scale questions, particularly regarding perceptions of the external environment such as institutional and market conditions, were treated as the “Hard to say” option, which was included in the questionnaire and reflected a genuine lack of opinion. In total, 549 correctly completed questionnaires were included in the final analysis.
To ensure clarity and reliability, the data were entered twice by two research team members and then verified by two independent analysts. This procedure aimed to eliminate potential coding errors and ensure the coherence and completeness of the dataset prior to statistical analysis.
It should be clearly stated that the survey was not representative of the entire population of dairy farms in Poland as a purposive, non-random sampling method was applied. This limits the possibility of generalising the results to the whole population. However, efforts were made to include a diverse range of dairy farms in terms of scale, production intensity, demographic structure, and management strategies. As a result, the sample reflects the structure of commercial dairy farms in Poland’s main milk-producing regions fairly well. This allows for a reliable exploration of relationships between resources, external conditions, and strategic orientation, although the findings should be interpreted with due regard for the limitations associated with the sampling scheme.
Complementary contextual data were drawn from time series compiled by the Farm Accountancy Data Network (FADN). The dataset included 444 commercial farms that continuously participated in the FADN system from 2005 to 2022 and maintained at least three dairy cows during this period. These data helped to situate the survey findings within the broader structural and financial trends of the dairy sector and served as a rationale for undertaking this research. The long-term FADN analysis shows that the continuation of milk production at the farm level is increasingly linked to scaling up operations. For this reason, studying the factors, including subjective ones, that influence farmers’ decisions to expand or withdraw from production has gained particular relevance. The FADN data were used only as contextual background and were not directly applied in statistical modelling.
In addition to the primary data described above, the analysis also incorporated scientific literature, industry reports, and current statistical data from Statistics Poland (GUS). These sources were used both to develop the theoretical assumptions of the study and to embed the results within the broader structural and market context of the Polish dairy sector. The GUS data included, among other elements, the number of farms keeping dairy cattle, total herd size, and average milk purchase prices, which allowed the survey responses to be interpreted against the current state of the sector.
3.2. Data Preparation, Modelling Approach and Variable Operationalisation
The process of data preparation, variable operationalisation, and subsequent modelling was carried out in stages and included both organisational work with the empirical material and analytical procedures aimed at identifying the strategic orientations of dairy farms (Figure 2).
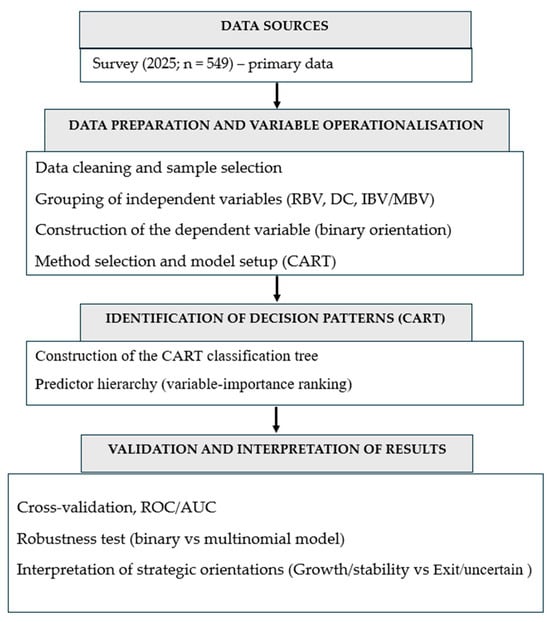
Figure 2.
Flow diagram of the research process for identifying strategic orientations in dairy farms; source: original work.
The starting point was the survey data described in Section 3.1, which were verified, coded, and cleaned. Logical consistency of responses, the presence of missing values, and potential outliers were checked. To ensure comparability across farms, the response scales were standardised and variables were harmonised.
After completing the data preparation stage, basic descriptive statistics were calculated, including measures of central tendency and variation, followed by an examination of the distributions of quantitative, ordinal, and binary variables. This analysis provided an overview of data quality and consistency before moving to the stage involving the construction and operationalisation of variables within the adopted conceptual framework.
Based on the analytical framework, the next step involved identifying and operationalising the variables included in the model. The structure of the independent variables reflects the primary assumptions of the analytical framework, emphasising survey-based evidence. It covers both objective structural features of the farms (such as land area, herd size, and equipment) and subjectively perceived drivers, including adaptability, relationships with institutions, and external conditions. The independent variables were grouped into five main categories: RBV—tangible and technical resources; RBV—human and organisational resources; RBV—relational and institutional resources; RBV—intangible resources and innovation; Dynamic Capabilities—adaptability and financial standing; and IBV/MBV—market and institutional environment (Table 2). Dynamic capabilities were treated not as a separate resource category but as an adaptive and mediating mechanism linking internal resources (RBV) with external institutional and market conditions (IBV/MBV). The variables are expressed on different scales: quantitative, ordinal, and binary. Detailed operationalisation, definitions, and answer distributions are presented in the Supplementary S1.
Table 2.
Variables Used in the Model.
The dependent variable was defined as the intended future direction of milk production on the farm. It was operationalised based on the survey question “How would you describe the potential to increase the milk output on your farm in five years?” with six possible answers: dynamic growth, steady growth, stability, steady reduction, winding up, and hard to say (see Table S1 in the Supplementary S1 for the full distribution of responses). These responses were aggregated into two analytical categories:
Growth/stability-oriented, which includes farm owners who declared dynamic growth, steady growth, or stability;
Exit/uncertain-oriented, encompassing farmers who declared plans to reduce or discontinue production or were unable to specify their intentions.
The adopted simplification and reduction of the dependent variable to two binary categories have both theoretical and methodological justification. In studies on strategic decisions in agriculture, it is common to distinguish between growth-oriented and market-exiting farms, which corresponds to the typologies of growth-oriented, stabilisers, exit-oriented, or disengaging [19]. The reduction of categories was also statistically justified, since some responses, such as “winding up” or “dynamic growth”, had relatively low frequencies, which could have limited the robustness and clarity of the subsequent analysis. This aggregation helped to ensure analytical consistency and improved the interpretability of results.
At the next analytical stage, the Classification and Regression Trees (CART) method was applied to identify the configuration of features and perceived constraints that differentiate the declared strategic orientations of the respondents. This method was selected for several reasons. First, the decision tree is an exploratory tool capable of identifying the hierarchy of variables that best discriminate observations without the prerequisite of assumptions regarding data distribution or the functional form of the relationships [36]. As opposed to classical regression models, this method handles heterogeneous (quantitative, ordinal, and binary) data well, making it particularly useful for socioeconomic survey research [37]. Second, decision trees offer a high level of interpretation clarity. They display results as simple if-then conditional rules, with the final classification emerging from logical splitting of the sample at nodes. This makes the method easy to understand for analysts as well as practitioners and agricultural policy stakeholders. Communicating the results is further facilitated by a visual representation of the model structure [38]. Another advantage of CART is that it can calculate the relative significance of explanatory variables. Predictor importance ranking based on reductions in the classification error along tree levels can identify factors critical for distinguishing the phenomenon [39].
V-fold cross-validation with 10 folds was used to validate the model and ensure its sufficient generalisation. Model overfitting was minimised by setting the minimum number of observations per end node to 10 cases. Prediction errors were also analysed, and model performance was evaluated using the ROC (Receiver Operating Characteristic) curve and AUC (Area Under Curve). All computations were carried out in STATISTICA 13.0 (StatSoft, Tulsa, OK, USA).
In addition to assessing model quality, a robustness test was conducted to verify whether the simplification of the dependent variable into two binary categories influenced the model’s stability and interpretability. The final stage involved the interpretation of the obtained results and the formulation of conclusions concerning the strategic orientations and development pathways of dairy farms.
4. Results
4.1. Changes in Milk Production in Polish Dairy Farms Between 2005 and 2022 According to FADN Data
The overall view of changes in the milk production scale in Polish dairy farms is outlined using basic economic data for farms that participated in the FADN (Farm Accountancy Data Network) continuously from 2005 to 2022 and had at least three dairy cows during that period. This means that any changes in the livestock structure are due to actual shifts within the same entities: their growth, stabilisation, or abandonment of milk production expansion. This sample facilitates long-term comparisons by minimising the impact of random and seasonal factors. The data were aggregated into averages for two extreme three-year periods. The average dairy cow herd size for the 444 investigated farms (Table 3) increased from 15.5 in the first period (2005–2007) to 22.7 in the second period (2020–2022). A little over half of the farms (231) increased their cow herd sizes, 213 maintained the same number of cattle, while only 24 significantly reduced their herds between 2005 and 2022. It should be noted, however, that the analysis does not cover farms with fewer than three cows, which were the most likely to abandon milk production altogether.
Table 3.
Primary Resources of the Farms by Group *.
Farms that increased milk output also amassed land. This process was much faster than labour cost increases, which indicates improved labour efficiency. In absolute terms, the largest increases in agricultural land areas, exceeding 23 hectares, were found for farms with herds of over 30 dairy cows in 2005–2007. In relative numbers, those farms that grew their dairy cow herds from a little over a dozen to more than 30 heads also expanded their agricultural land by over 50%.
Nearly one-third of the agricultural land used by the investigated dairy farms was leased. Hired labour was not substantial. It amounted to 1–5% of labour inputs on farms with up to 50 dairy cows. However, for herds over 50 heads, the number of hired workers increased substantially, leading to hired labour accounting around 20% or more of total labour.
The primary objectives of agricultural production include generating farm income and increasing asset value. The average family farm income grew in all groups between 2005 and 2022 (Table 4). The highest income levels were reported by farms with the largest dairy cow herds. The dynamic analysis revealed that the income increase amounted to 131.8% to 172.6% for farms with relatively constant herd sizes and reached 218.1% to 346.0% for farms that increased their herd counts. The highest relative income increases were identified for the group of farms that grew their herd sizes from a little over a dozen to over 30 heads.
Table 4.
Owned Farming Assets (Excl. Land) and Farming Income by Group *.
The production scale and associated tangible dairy farm resources are critical for remuneration. According to Parzonko et al. [40], the average calculated remuneration of the farmer and their family in a group of commercial farms was relatively low even in 2005–2007. It changed in 2020–2022, when the amount slightly exceeded the average salary in other sectors.
One of the important factors that drives income growth is the improvement in technical efficiency, which leads to a clear increase in milk yield and a gradual rise in funds from direct payments and EU funds for farm investments [40]. Both the farm income amount and the ability to secure external funds play very important roles in expanding farm assets. Our analysis demonstrates that the scale of business is also highly relevant to the value of owned farming assets. At the same time, the growth of dairy cow herd size resulted in a faster increase than observed for farms with stable herd counts. The groups with constant dairy cow numbers recorded owned farming asset value increases ranging from +8.1% (for herds of 3–10 dairy cows) up to +83.5% (for herds of 30–50 heads). In contrast, the increases in groups where farms enlarged the herds amounted to between 63.3% and 159.2%.
The above numbers demonstrate the beneficial effects of milk production expansion. They suggest links between farm income, the size of the dairy cow herd, and agricultural land area. However, they fail to account for the drivers behind changes in the future scale of production. Neither do they identify barriers to the existence and development of dairy farms. Therefore, survey-based studies are needed to complement the quantitative analyses.
4.2. Analysis of the Results of the Survey Among Polish Dairy Farms
4.2.1. Resources and Socioeconomic Characteristics of the Surveyed Farms
This subsection provides basic characteristics of the farms we surveyed in the first half of 2025. The results are presented in a way that facilitates comparison with aggregate data for Poland and individual regions. Selected characteristics that are particularly relevant to understanding the diversity of drivers shaping the future scale of production are then discussed.
The average cow herd count was 28.4, which is over twice Poland’s average (12.5 in 2023) and above the values for voivodeships with the highest concentration of dairy cattle farming: Podlaskie (20 heads) and Warmińsko-Mazurskie (19.4 heads) (Figure 3). The sample average was affected by several large farms, as indicated by the median of 20 heads, which is closer to the values observed in dairy regions. The analysis of agricultural land suggests similar results (Figure 4). The 2023 average area for Poland was 12 hectares. In contrast, it was much higher in the sample, similar to the values for Podlaskie and Warmińsko-Mazurskie.
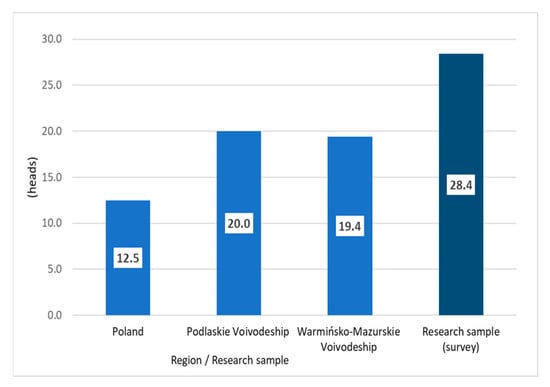
Figure 3.
Average Number of Dairy Cows per Farm (2023, Sample 2025). Source: original work based on the survey and Statistics Poland [1].
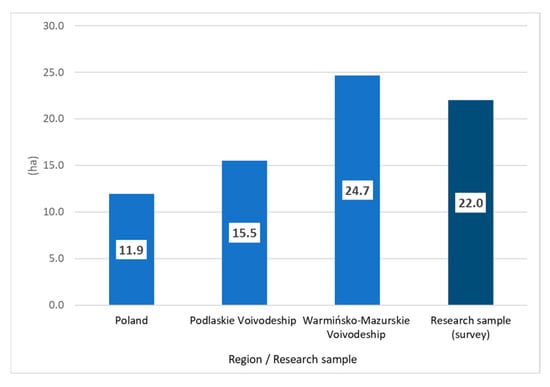
Figure 4.
Average Agricultural Land per Farm in Hectares (2023, Sample 2025). Source: original work based on the survey and Statistics Poland [1].
The average dairy cow milk yield in the sample was 7.4 thousand kilograms per year, while the Polish average was 6.7 thousand kilograms (Figure 5). This means that the sample had a higher yield than Poland’s and regional averages.
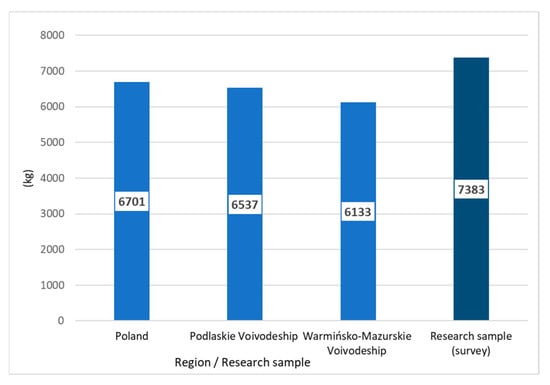
Figure 5.
Average Milk Yield per Cow in Kilograms (2023, Sample 2025). Source: original work based on the survey and Statistics Poland [1].
The average labour input expressed as AWU indicates higher labour intensity on the surveyed farms (Figure 6). It was 2.1 AWU for the sample vs. 1.3 AWU for Poland and 1.5 AWU for the Podlaskie and Warmińsko-Mazurskie Voivodeships. According to FADN, the average for Polish dairy farms is 1.7 AWU. These results confirm that dairy farming is more labour-intensive than the average agricultural sector, and the sample exhibits particularly high labour input.
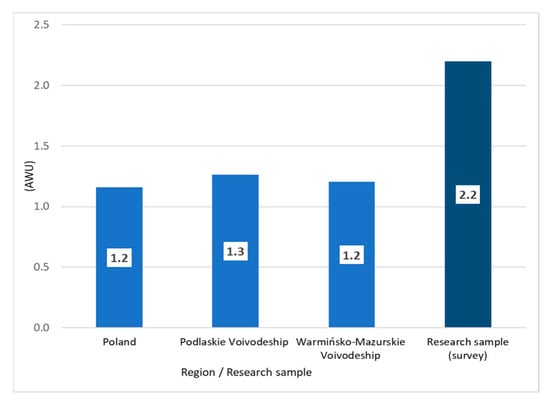
Figure 6.
Average Labour Input per Farm in AWU (2020, Sample 2025). Source: original work based on the survey and Statistics Poland [1].
Next, demographics and subjective assessments of the respondents are presented, as they are relevant to analysing the future scale of milk production. The age structure is dominated by farmers aged 40–59 years (nearly 60% of the sample). Young farmers under 30 years accounted for less than 4%, while those over 60 years made up 19% (Figure 7). Age is directly linked to self-assessed health. Over half of the respondents (54%) believed their perceived health and work ability (5-year horizon) to be adequate for expanding or maintaining milk production, while about one-quarter were pessimistic about their health-related capabilities (Figure 8).
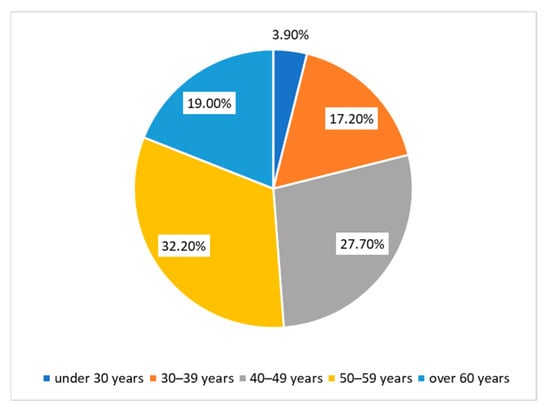
Figure 7.
Age Structure of Farmers (Survey 2025). Source: original work.
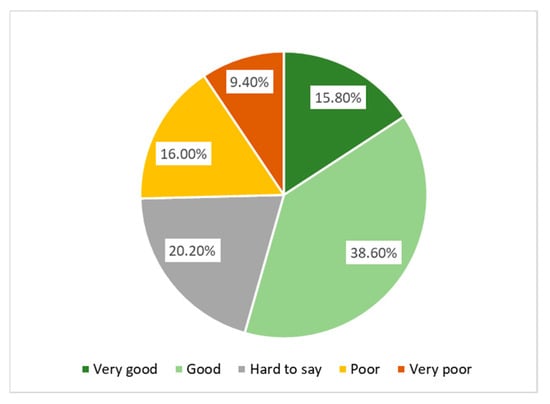
Figure 8.
Farmers’ Self-Assessment of Perceived Health and Work Ability (Survey 2025). Source: original work.
Self-assessed financial standing was relatively favourable. Almost 80% of the farmers reported good or rather good financial standing, while only 13% indicated bad or rather bad (Figure 9). This suggests that financial stability is perceived as an important foundation for sustaining or expanding production on most farms.
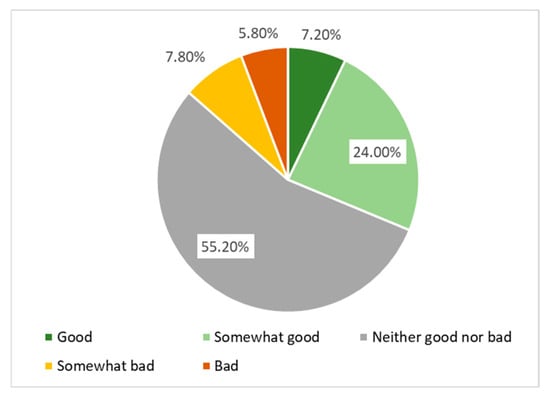
Figure 9.
Self-Assessment of the Farm’s Income (Survey 2025). Source: original work.
Market and institutional considerations are just as important as internal drivers. The availability of hired labour emerged as a major challenge. Nearly two-thirds of respondents reported difficulties in this regard, and only a small portion declared no problems with hiring workers (Figure 10). Labour shortages are thus becoming a critical barrier to production expansion, regardless of technical or financial resources.
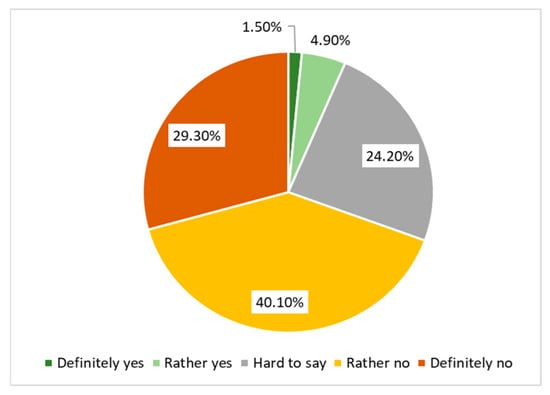
Figure 10.
Availability of Hired Workers According to Farmers’ Assessment (Survey 2025). Source: original work.
In summary, the surveyed farms had larger cow herds than the Polish average and closely reflected the situation in Poland’s leading dairy farming regions, Podlaskie and Warmińsko-Mazurskie. They also had larger tangible assets and moderately high production intensity. The age structure highlights the dominance of middle-aged farmers and the ongoing issue of generational renewal. At the same time, the optimistic self-assessments of health, work ability, and financial standing by most respondents indicate solid foundations for continued activity and investment.
4.2.2. Factors Conducive to Increasing Milk Production: Classification Tree Results
The analysis aimed at identifying drivers that shape farmers’ strategic orientations regarding the future scale of milk production was conducted using a CART decision tree model. The classification tree (Figure 11) illustrates the conditions differentiating between two orientations of the surveyed dairy farms: growth/stability-oriented vs. exit/uncertain-oriented. At the core of the model lie the dependent variable “future scale of milk production (5-year horizon)” and a set of personal, structural, and economic predictors.
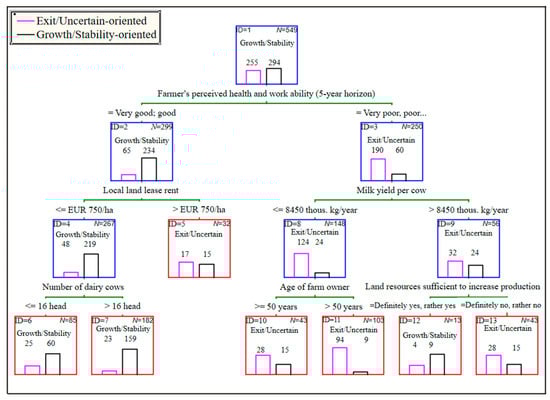
Figure 11.
CART Decision Tree Structure for Variable ‘Growth Outlooks’. Source: original work based on survey data.
The root node (ID = 1) covers the entire population of 549 surveyed farms, with 294 (53.6%) classified as growth/stability-oriented and 255 (46.4%) as exit/uncertain-oriented. The first and most important split concerns the farmer’s perceived health and work ability (5-year horizon) as critical drivers of continued farm operations. The respondents who were optimistic about their personal situation (ID = 2, N = 299) were mostly oriented towards investments (234 vs. 65), which indicates a central role of health factors in the decision-making process.
The next important discriminating criterion for the farms whose owners considered their perceived health and work ability (5-year horizon) as conducive to further farming activities (ID = 2) was the level of rent for leased land. For those with lower rents (ID = 4), the next factor was the cow herd size. Most farms with over 16 dairy cows (ID = 7, N = 182) declared growth/stability orientation (159, 87%). This result demonstrates that a larger herd is a valuable resource, facilitating economies of scale and driving further investment. With rent prices held constant, farms owning smaller herds (up to 16 cows, ID = 6, N = 85) were more diversified. Although they were mostly growth/stability-oriented (60 farms), the exit/uncertain orientation was not negligible (25 cases, about 29% of node observations). This structure may suggest that, with a lower production potential, farms face a fine line between continuing and restricting their business. This may be due to the low returns on investments in milk production. These results outline a consistent profile of farms with the best potential to increase milk production They are kept by relatively young and healthy owners who already have medium-sized or large dairy herds and operate under favourable constraints, such as low land-lease costs. This group is oriented strictly towards investing in milk production growth.
The structure of decision factors differs between farms whose owners reported health or work ability constraints (ID = 3, N = 250) and those with more favorable personal circumstances. In this branch, milk yield per cow was the first discriminating factor. Farms exhibiting poorer yield (≤8450 kg/year; ID = 8, N = 148) typically preferred the exit/uncertain orientation. Eighty-four per cent of them (124) were classified as exit/uncertain-oriented. This may suggest that, combined with poor health, low productivity increases the sense of growth barriers, discouraging milk production expansion. In contrast, farms with higher milk yield (>8450 kg/year; ID = 9, N = 56) had a much more diversified decision-making profile, consisting of similar portions of exit/uncertain-oriented (N = 32) and growth/stability-oriented (N = 24) attitudes. The analysis results suggest that high milk yield can compensate for personal limitations of the farm owner, such as deteriorating health. Despite objective personal barriers (worse declared health), many of the farmers in this group (ID = 9) continue and even expand their farming business. This is true particularly for farmers who already have sufficient land to increase production (ID = 12). Most of them (9/13) declared the pursuit of a growth/stability orientation. The other group, lacking sufficient land (ID = 13), often declared plans consistent with exit/uncertain orientation (65%).
The last split discussed here (ID = 8) indicates that the owner’s age may also determine the potential to increase the production scale. Older people (>50 years; ID = 11, N = 103) more often declared an exit/uncertain orientation (94 cases). Note that this branch covers respondents with worse declared health, which may be consequential for production expansion plans. Additionally, a relatively low milk yield in this group of farms (under 8450 kg per cow a year) is yet another important reason for the gradual discontinuation of production. All these features make up a distinct profile of a producer who is likely to limit or even discontinue milk production. Younger owners (under 50 years; ID = 10, N = 43) much more often declared growth/stability orientation despite similar limitations, like health issues or relatively low milk yield. About 34% of them reported plans to maintain or increase production, which may indicate being more open to risks, a longer planning horizon, and readiness to invest in productivity.
The predictor importance analysis provides further insight into the classification tree model’s outputs. The ranking covers the variables shown in the tree as well as those that were not used as splitting variables but still exhibited significant discriminatory potential and contributed to reducing node heterogeneity.
The highest importance value (1.000) was reached by the variable concerning the farmer’s perceived health and work ability (5-year horizon) favourable to further farming activity (Table 5). This variable is a critical RBV resource (human resources). This means that farmer’s health characteristics are the most significant drivers of readiness to expand or stabilise milk production. They are followed by key tangible and technical resources (RBV) and variables for Dynamic Capabilities, namely the number of dairy cows (0.812), income self-assessment (0.796), and declared potential to save and invest money (0.777). Their high ranks demonstrate the importance of the achieved production potential and the ability to use it and grow, which is consistent with the adaptive strategy approach.
Table 5.
Predictor Ranking.
Subsequent ranked variables, namely cow milk yield (RBV), access to labour (Dynamic Capabilities), owner’s age (RBV), and availability of hired labour (IBV/MBV), also concern the capacity to use resources to scale up farming activities. Notably, variables linked to IBV/MBV were also highly ranked. The high importance of such institutional and market factors as agricultural land rent, evaluation of media discourse, or perceived availability of land demonstrates the impact of external factors on decisions regarding the future scale of milk production.
Variables categorised as Dynamic Capabilities also ranked high: financial standing, perceived resources, and resilience/flexibility. Other valued variables included income, potential for investment, and adaptability in resource utilisation. These are the primary factors that discriminate between farms with similar production capabilities that choose stability or exit approaches. Interestingly, some important factors, like debt or having a successor, ranked high in terms of importance even though they were absent in the main nodes of the tree. This suggests their meaningful, if subtle, role in decision-making, which can be revealed only with alternative data configurations.
The effects of relational and organisational resources, as well as intangible resources and innovation (RBV), are also meaningful. Although of lesser importance, factors such as cooperation with the dairy plant, agricultural consulting, or use of cowshed management software are consistent with the paradigm of farms actively seeking support and innovation. The lowest ranks are occupied by auxiliary variables, including the number of casual workers or non-family workers (RBV), which may be of contextual importance, but do not determine decisions on a global scale.
The ranking of the predictors reveals the complex nature of milk production growth decision-making. It combines hard technical and economic resources (RBV), adaptive capacities (Dynamic Capabilities), and institutional and market factors (IBV/MBV).
The final step of the classification process is to assess the quality of the decision-making model shown in Table 6. The central performance indicator, AUC (area under the ROC curve) = 0.8404, demonstrates a strong discriminative performance of the model. The high value of the Gini coefficient (0.6808) confirms that the CART-based model has substantial predictive power and non-random splitting [41]. Therefore, it offers practical value and can be used to classify farms effectively. The error risk values for the training dataset (0.2157) and in cross-validation (0.2245) are sufficiently low to indicate a sound balance between fitting and generality. The stability of predictions is further supported by relatively low standard errors.
Table 6.
CART Quality Assessment Indicators (Dependent Variable: Future Scale of Milk Production).
Note that the classes were similarly distributed in the dataset (about 46% of cases in the exit/uncertain-oriented class and 54% in the growth/stability-oriented class), which helped build a balanced classification tree.
To verify the robustness of these results, an additional model was developed using the full six-category specification of the dependent variable. The comparative outcomes, summarised in Table S2 in the Supplementary S1, indicate that although the multinomial model exhibited slightly higher classification error and lower overall stability, the hierarchy of the main predictors remained consistent. Farmers’ perceived health, herd size, labour capacity, and financial position continued to dominate across both model versions. These results confirm that the principal relationships identified in the binary CART model are robust and not driven by the chosen form of dependent variable aggregation.
5. Discussion
Increasing the scale of production, primarily by raising dairy cow herd size and milk yield, is fundamental for improving the growth potential of dairy farms in Poland. Both empirical studies and farming practice consider production expansion the central mechanism for improving technical and economic performance [42,43]. Larger herds improve labour productivity, reduce fixed unit costs, and enable the use of new technology [44]. The scale of production also affects the bargaining potential of a farmer in their market environment and helps with growth investments [45].
Analysis of FADN data demonstrates that farms that increased their herd sizes simultaneously acquired more agricultural land, sometimes expanding by 50%. This enabled them to achieve economies of scale, accelerating the improvement of economic gains and growth in owned farming asset value. A different situation occurred on farms that reduced herd sizes between 2005 and 2022. These decisions were followed by lower labour inputs, no significant increase in farming asset value, and relatively minor income improvement. These findings indicate that a reduced herd size usually prevents farmers from making full use of their resources and curbs their growth potential. This is consistent with the findings from the classification model, which emphasises the roles of personal and tangible factors in shaping investment-related decisions.
5.1. Role of Personal Factors in Growth Processes
One significant result of the survey data analysis is the key role of personal factors, i.e., the farmer’s subjective self-assessment of health and ability to work over the next five years, which strongly predicts strategic orientation toward growth or stabilisation. This observation aligns with the human capital concept in the RBV, where perceived long-term health and work ability are fundamental resources that determine the potential to use other farm assets effectively. The literature has long recognised the farmer’s age, knowledge, and skills as critical determinants of farm growth and resilience [46]. Younger farmers tend to be more inclined towards innovation and expansion, while older ones tend to prefer conservative strategies or even withdraw [47,48]. The present results align with this notion because farmers over the age of 50 were much more frequently classified as exit/uncertainty-oriented, especially when they negatively assessed their future health and work ability.
Studies from other European countries offer similar conclusions. An analytical study of structural changes in the Swiss dairy sector identified the advanced age of farm managers as the primary factor for discontinuation [14]. Another study by Gastaldi, Galetto, and Pace Guerrero [13] confirms that old age significantly increases the risk of exit. The presence of a successor has an opposite impact, which significantly improves the chances to continue farming activities. Other authors also emphasise the importance of succession for farm persistence. Older farmers without a successor tend to gradually wind down production [20].
Importantly, self-assessed work ability was a stronger predictor than age itself. This suggests that long-term engagement in farming is shaped less by age as such and more by the farmer’s actual condition, functional capacity, and ability to meet the physical demands of dairy production. Evidence from other countries further supports this view. For instance, a study from Norway demonstrated that farmers with higher levels of job and life satisfaction, as well as lower stress, were more likely to pursue development strategies such as herd expansion or productivity improvements. Good mental well-being was positively associated with intentions to continue or upscale production, while those reporting lower satisfaction, higher stress or greater social isolation were more often aligned with an exit/uncertainty orientation. Mental and emotional factors such as loneliness, optimism and perceived purpose were found to be significantly associated with strategic decision-making on the farm [15]. The physical strain involved in dairy farming is also an important factor. Existing literature highlights the high prevalence of musculoskeletal conditions among farmers, often resulting from routine physical tasks such as milking and cattle handling [16]. For those with deteriorating health or limited physical strength, particularly in older age, continuing production becomes increasingly burdensome.
The structure of the classification tree confirms these tendencies. The variable representing self-assessed health and work ability over a five-year horizon was the most influential predictor of future orientation, surpassing structural or demographic characteristics. These findings align with other analyses demonstrating that farmers who report higher levels of general well-being and satisfaction are more open to innovation and new technologies. This, in turn, can enhance quality of life, creating a feedback loop: satisfied farmers are more likely to invest in the farm, while successful investments reinforce satisfaction and future engagement [49].
Similar observations were made in studies on farmers’ quality of life across the EU. Herrera Sabillón et al. [17] demonstrated that farming satisfaction is a strong determinant of the general quality of life for farmers, which contributes to the intention to continue the activities in the long term. The very high importance ranking of the variable related to perceived health and work ability further suggests that personal capacity and mental well-being may be more impactful in shaping strategic orientation than formal demographic indicators such as date of birth [17]. Nevertheless, relatively few systematic studies address the role of physical and mental health in the context of long-term strategic choices in agriculture. Given that many farmers remain active beyond retirement age and that succession remains a widespread challenge [50], and that farmers face substantial succession problems, particularly in Europe [51,52,53], the influence of actual and perceived work ability on investment plans and business continuity deserves significantly more research and policy attention.
5.2. Scale of Production and Tangible Resources
The analysis found that tangible resources (mainly agricultural land and the condition of buildings and machinery), which determine the potential to keep larger numbers of dairy cows, are strong factors shaping attitudes towards investments. Farms with larger herds (over 16 heads) much more often declared plans to expand the milk production scale. Researchers identified similar associations in other countries. In Switzerland, larger cattle herds and more human resources were linked to a lower probability of abandoning dairy farming [14]. South American studies also established that small farms are statistically more inclined to abandon dairy production than large ones. However, other factors can reduce the differences [13]. This could be because larger farms have more funds and technology, which enables them to achieve better performance, increasing their resilience to market fluctuations and driving investments. The literature makes it clear that financial and technical resources (investment capabilities, modern equipment) are important determinants of farm growth [14]. The survey results corroborate this conclusion: high milk yield, good income and potential to save money ranked high among the predictors.
Owned and leased agricultural land area was counted among important predictors, even though it was not used as a splitting rule. This confirms that land, the fundamental means of agricultural production, remains a critical resource determining business scalability. Results recorded in FADN illustrate the case well. Herd growth typically co-occurred with land resources expansion, with about one-third of agricultural land being leased. These results are consistent with findings by Kusz [12], who found that larger utilised agricultural areas are strongly correlated with increased investments and upgrades in dairy farms. Equipment (including machinery, devices, and infrastructure for milk production) also proved to be an important differentiator of growth potential. Modern technical assets enhance performance and provide physical relief for farmers, which can influence decisions on whether to continue farming in the context of age or health issues.
Although the literature shows that dairy automation technologies such as automated milking systems, electronic cow health monitoring and herd management software can improve performance and reduce the physical strain of work [54,55], these variables did not play a significant role in the classification model. Their low importance most likely reflects the limited use of such technologies among the surveyed farms rather than their actual relevance for long-term development. As a result, they did not differentiate between the subgroups. Nevertheless, automation may influence dairy farm growth indirectly and over a longer period, for instance by reducing labour requirements and improving work quality. This indicates the need for further studies, especially in relation to farmers’ well-being and quality of life. Recent research demonstrates that investments in automation, including milking robots and herd management systems, can not only support the continuation or expansion of production but also enhance the farmer’s satisfaction and work–life balance [56].
These results are consistent with the RBV because accumulated production capital (herd, land, equipment) provides the underpinnings for further growth, even if it does not guarantee permanent success. Therefore, tangible resources should be considered together with the farmer’s competencies and relational resources (consulting, cooperation with the dairy plant). Only their synergy can improve results.
5.3. Role of Dynamic Capabilities and Institutional and Market Factors
The impact of adaptability and external factors also turned out to be a determinant of plans to expand production. The analysis included variables describing farm adaptability (self-assessed financial standing, potential to save or invest, resilience to external shocks) as well as perceptions of the market environment (availability of land, lease rent, labour supply). The high importance of variables such as farm income or the potential to invest indicate that farmers who recognise the financial stability of their farms more often adopt growth- or stabilisation-oriented strategies. This is consistent with the concept of dynamic capabilities: farms with stronger financial resilience are better able to cope with fluctuations in prices or costs and are more open to risks associated with expansion [18].
As shown by FADN data, the accumulation of owned farming assets typically coincides with tangible investments and production expansion. This reflects the dynamic capabilities mechanism, whereby a financial buffer enables investment, which in turn strengthens long-term adaptability [35].
Results related to the market environment are also noteworthy. Lower land lease costs and easier access to hired labour were associated with more growth-oriented attitudes, suggesting that favourable institutional and market conditions encourage production increases. Conversely, unfavourable signals from the external environment can discourage expansion. Although external factors did not dominate the main nodes of the classification tree (with the exception of lease rent), their relatively high importance scores (e.g., labour availability) suggest that farmers do take environmental conditions into account, even if internal resources remain decisive. Similar findings have been reported in other European contexts, where access to land and labour is shown to condition structural change and farm expansion [57,58].
FADN data further confirm that as production scales up, the influence of land and labour markets grows. Farms with more than 50 cows rely more heavily on leased land and hired workers, meaning that their growth prospects are increasingly conditioned by external market availability [14].
5.4. New Findings on the Synergy of Factors in Dairy Farm Development Decisions
The results of this study extend existing knowledge on the mechanisms shaping the strategic orientation of dairy farms by introducing an integrative perspective that links personal, resource-based, and institutional–market factors. Findings from previous studies, summarised in Table S3 in Supplementary S1, highlighted the importance of age, succession, herd size, and land resources as the main determinants of structural concentration and farm exits [10,13,14]. The present analysis confirms some of these relationships but shifts the interpretative focus from individual structural factors to configurations of resources in which health, work ability, and the perception of financial stability jointly form complex decision patterns.
The use of the classification and regression tree (CART) model made it possible to empirically capture the interaction and hierarchy of factors, as well as nonlinear and nonmonotonic relationships that are difficult to identify using traditional regression models. The analysis revealed that the highest probability of production growth occurs among younger and healthier farmers managing larger herds in regions with favourable lease costs. In contrast, the absence of a successor, declining health, or unfavourable market conditions increase the likelihood of maintaining the status quo or withdrawing from production. These results are consistent with the findings of Gastaldi et al. [13], who showed that succession and work ability act as interdependent predictors of farm continuity, as well as with the study of Hansen and Østerås [15], which confirmed the positive relationship between farmers’ occupational well-being and the efficiency and resilience of their farms.
This holistic nature of decision-making has also been emphasised by other researchers. Holmes et al. [16], analysing farmers’ exits from the dairy sector in the United Kingdom, pointed to the complex interaction of multiple factors influencing the intention to cease production, noting that such decisions rarely stem from a single cause but rather from a configuration of circumstances. A similar conclusion was drawn by Herrera Sabillón et al. [17], who demonstrated that farmers’ job satisfaction and quality of life affect their strategic orientation only when combined with sufficient material resources. The present results confirm this relationship, showing that even a large herd or solid capital base does not guarantee growth if the farmer lacks adequate health or motivation.
Compared to earlier studies, this research stands out due to the scope of its theoretical integration. Combining the resource-based view (RBV), the institution-based view (IBV), and the market-based view (MBV) with the concept of dynamic capabilities has made it possible to conceptualise development decisions as an adaptive process, in which farms respond to external stimuli through flexible use of available resources. This model helps explain why farms with similar economic parameters may follow divergent developmental paths depending on how farmers perceive their capabilities, health, and institutional environment.
In conclusion, the study provides an empirically grounded model of resource synergy in which the farmer’s health and work ability play a central role in determining long-term development decisions. Farm resilience and competitiveness are shown not to be a simple function of scale or capital, but rather the result of the interaction among material, personal, and institutional factors. This shift from single determinants to interdependent configurations of resources constitutes the main finding of this research and its contribution to the understanding of transformation mechanisms within the dairy sector.
6. Conclusions and Implications
The study, based on survey data collected from 549 commercial dairy farms in Poland and supported by a contextual analysis of FADN data, provides a deeper understanding of the mechanisms shaping strategic decision-making in the dairy sector. Although the research is exploratory in nature and its results should be interpreted in the context of the analysed sample, the observed behavioural patterns offer valuable insights for understanding adaptation processes and development mechanisms in Polish dairy farming. These insights are reflected in the main findings summarised below.
- 1.
- Production expansion is the central mechanism for dairy farm growth and resilience. FADN data show that the average herd size on farms where cows were kept in 2005–2022 grew from 15.5 to 22.7 heads, which confirms production expansion. Farms that expanded their operations increased their land and capital resources simultaneously, achieving better performance and economic results. The survey results are consistent with this finding because farms with a greater potential more often declared growth-oriented attitudes. Production expansion therefore acts as a catalyst for investment and contributes to the continuation of farming operations.
- 2.
- The pivotal factor differentiating between strategies of dairy farms is the owner’s self-assessment of health and work ability. The outcomes demonstrate that it is the perceived capacity to continue farming in the coming years rather than the chronological age that influences farmers’ choices the most. Farmers who declared physical and mental fitness readiness to work in the coming five years more often planned investments and production expansion. The availability of a successor further strengthened this orientation by ensuring continuity and increasing the probability of farm survival beyond the current owner.
- 3.
- Tangible resources, especially land and herd size, form another critical area. Access to agricultural land determines the potential to expand production, while lease rent significantly affects strategic choices. The results confirm that land, herd and equipment are decisive for investment and the persistence of dairy farms. The land lease market is of particular importance because both availability and cost strongly influence expansion prospects.
- 4.
- Growth is also enhanced through economies of scale, which operate in a feedback loop with farm income. Larger herd size improves work performance at lower unit costs and leads to competitive advantage. This improves financial standing and facilitates saving and investment. A reinforcing mechanism is thus created in which a greater scale of production and stronger financial capacity mutually support each other.
- 5.
- Directions of change in dairy farms are not determined by a single factor. The ability to combine tangible, human and financial resources with external constraints is decisive. Farmers’ adaptability emerges as the key, since it enables them to respond to changing environments and adjust their growth strategies. This adaptability determines whether resources are mobilised in a way that secures persistence and competitive advantage.
The conclusions presented above have not only a cognitive but also a practical dimension. They show that farmers’ strategic decisions result from the interplay of personal, material and institutional factors, which has direct implications for the design of agricultural support instruments. The findings also indicate that health and adaptive capacity should be recognised as integral components of agricultural policy and advisory systems. Based on these insights, the following practical implications are proposed:
- Integrating farmers’ health into agricultural policy. The physical and mental condition of farmers should be recognised as a key determinant of farm development. Public support could include preventive health programmes, occupational health monitoring and easier access to physiotherapy and psychological assistance adapted to the specific working conditions in agriculture.
- Reducing the physical burden of dairy production. Investments in mechanisation and partial automation, such as milking robots, feeding systems and herd-monitoring technologies, can substantially reduce the physical strain of work, allowing farmers to remain active longer and improving their overall well-being.
- Facilitating land access and stabilising the lease market. Transparent and flexible lease mechanisms, long-term contracts and incentives for land consolidation can enhance the development potential of viable farms while preventing excessive concentration of land.
- Improving access to capital and income stability. Expanding financial instruments that support investment, liquidity and risk management, such as preferential loans and insurance against price or yield fluctuations, would enable farmers to pursue growth-oriented strategies and increase financial resilience.
- Enhancing advisory and managerial support. Agricultural advisory services should not be limited to technical issues but should also cover business planning, financial management and strategic decision-making, thereby strengthening the adaptive capacities of dairy farms.
- Supporting intergenerational succession. Initiatives that facilitate farm transfer, including training programmes, tax incentives and mentoring schemes, can improve continuity, reduce uncertainty and maintain the long-term production potential of the dairy sector.
Together, these directions can help strengthen the long-term resilience and competitiveness of dairy farms operating under increasingly demanding market and institutional conditions.
7. Research Limitations and Future Focus
The present results are based on data from a survey among milk producers. Being declarative, the input can be subjective and biased by instantaneous mood or social desirability. The central conclusions are founded on self-assessment, which inherently increases measurement sensitivity and the risk of classification errors. Although the sample was large and diverse, it was not random. Its geographic range covered two different regions of Poland. This improves the analytical contrast but prevents generalisation to the entire country.
The CART model is exploratory, which makes it sensitive to minor data alterations and the selection of splitting parameters. Cross-validation reduced but did not eliminate the risk of overfitting. The method of farm categorisation represents another limitation. In the main part of the analysis, respondents’ answers (dynamic growth, slow growth, stability, slow reduction, winding up, hard to say) were aggregated into two analytical categories: growth/stability-oriented and exit/uncertain-oriented.
This approach enhances interpretative clarity and reflects the strategic contrast in decision-making; however, it may blur the distinction between farmers who actively invest and those who primarily aim to maintain the current production level. To address this concern, a robustness check was conducted, confirming that the aggregation did not materially affect the results or the stability of the model.
The timing of the study, the first half of 2025, is also a limitation since some answers may have been influenced by temporary market and regulatory conditions, which restrict the possibility of extrapolation to a longer perspective.
Future efforts should include an investigation into the determinants of growth processes in individual regions, because the situation of farms in areas where milk production grows dynamically may be substantially different from that in areas with a tendency to discontinue dairy farming. It is also imperative to conduct more in-depth analyses of social and psychological conditions for decision-making regarding the quality of life of farmers, their job satisfaction, health strains, and perceived financial security. Research on work–life balance seems to be particularly relevant in this regard. Decisions on whether to invest in a farm depend not only on tangible potential and financial standing but also on the perception of everyday quality of life, job demands and the ability to reconcile professional and private responsibilities. Incorporating these dimensions into future analyses could enhance understanding of the mechanisms underlying strategic decisions in the dairy sector and provide a broader knowledge base useful for both academic research and practical applications.
Supplementary Materials
The following supporting information can be downloaded at: https://www.mdpi.com/article/10.3390/agriculture15212250/s1, Table S1. Variables used in the modelling; Table S2. Robustness Check—Comparison of CART Model Specifications; Table S3. Comparison of the present study with selected research on dairy farm development and farmers’ strategic decisions.
Author Contributions
Conceptualisation, W.S.; methodology, W.S.; software, W.S.; validation, W.S., A.P., T.W., M.C., L.L. and A.D.; formal analysis, W.S., A.P. and T.W.; investigation, A.P., T.W., M.C., L.L. and A.D.; resources, A.P., T.W., M.C., L.L. and A.D.; data curation, T.W., M.C., L.L. and A.D.; writing—original draft preparation, W.S., A.P. and T.W.; writing—review and editing, W.S., A.P., T.W., M.C., L.L. and A.D.; visualisation, W.S.; supervision, W.S., A.P. and T.W.; project administration, T.W., M.C. and A.D.; funding acquisition, T.W., M.C. and A.D. All authors have read and agreed to the published version of the manuscript.
Funding
Research paid for with funds from the Ministry of Science and Higher Education under contract No. MEiN/2023/DPI/2872 dated 04/10/2023, action No. I.2 in the amount of PLN 1,350,000.00.
Institutional Review Board Statement
The study was conducted according to the guidelines of the Declaration of Helsinki and approved by the Rector’s Committee for the Ethics of Scientific Research Involving Human Subjects of Agriculture University of Krakow (protocol code 228/2024, date of approval: 22 October 2024). This study did not involve animals.
Data Availability Statement
The data presented in this study are available on reasonable request from the corresponding author. The data are not publicly available due to privacy restrictions and the inclusion of confidential farm-level information.
Conflicts of Interest
The authors declare no conflicts of interest.
Abbreviations
The following abbreviations are used in this manuscript:
| FADN | The Farm Accountancy Data Network |
| EU | European Union |
| EUR | Euro |
| SO | Standard output |
| RBV | Resource-based view |
| IBV | Institution-based view |
| MBV | Market-based view |
| CART | Classification and Regression Trees |
| ROC | Receiver operating characteristic |
| AUC | Area under curve |
| AWU | Annual work unit |
| GUS | Statistics Poland |
| DC | Dynamic Capabilities |
References
- Statistics Poland. Statistical Yearbook of Agriculture 2024; Statistics Poland: Warsaw, Poland, 2024. [Google Scholar]
- Szajner, P. (Ed.) Rynek Mleka. Stan i Perspektywy. Nr 67. Analizy Rynkowe; IERiGŻ PIB: Warsaw, Poland, 2024. [Google Scholar]
- Parzonko, A.; Bórawski, P. Pozycja Konkurencyjna Polskich Gospodarstw Mlecznych w UE-Stan, Uwarunkowania i Przewidywania Na Przyszłość; Szkoła Główna Gospodarstwa Wiejskiego w Warszawie (SGGW): Warszawa, Poland, 2021. [Google Scholar]
- Ziętara, W.; Adamski, M. Competitiveness of the polish dairy farms at the background of farms from selected european union countries. Probl. Agric. Econ. 2018, 354, 56–79. [Google Scholar] [CrossRef]
- Ziętara, W.; Pietrzak, M.; Malak-Rawlikowska, A. Polish Dairy Farm Transformations and Competitiveness 20 Years after Poland’s Accession to the European Union. Animals 2024, 14, 2013. [Google Scholar] [CrossRef]
- Bukraba-Rylska, I. Socjologia Wsi Polskiej; Wydawnictwo Naukowe PWN: Warszawa, Poland, 2008. [Google Scholar]
- Hryszko, K.; Pieniążek, K.; Rembeza, J.; Seremak-Bulge, J.; Szajner, P.; Świetlik, K. Rozwój Rynku Mleczarskiego i Zmiany Jego Funkcjonowania w Latach 1990–2005; Instytut Ekonomiki Rolnictwa i Gospodarki Żywnościowej-Państwowy Instytut Badawczy: Warszawa, Poland, 2005; Available online: https://open.icm.edu.pl/handle/123456789/4775 (accessed on 26 October 2025).
- Bórawski, P.; Pawlewicz, A.; Parzonko, A.; Harper, J.K.; Holden, L. Factors Shaping Cow’s Milk Production in the EU. Sustainability 2020, 12, 420. [Google Scholar] [CrossRef]
- Jafri, S.H.; Adnan, K.M.M.; Baimbill Johnson, S.; Talukder, A.A.; Yu, M.; Osei, E. Challenges and Solutions for Small Dairy Farms in the U.S.: A Review. Agriculture 2024, 14, 2369. [Google Scholar] [CrossRef]
- Poczta, W.; Średzińska, J.; Chenczke, M. Economic Situation of Dairy Farms in Identified Clusters of European Union Countries. Agriculture 2020, 10, 92. [Google Scholar] [CrossRef]
- Tomczak, F. Od Rolnictwa Do Agrobiznesu: Transformacja Gospodarki Rolniczo-Żywnościowej Stanów Zjednoczonych Ameryki Północnej; Szkoła Główna Handlowa-Oficyna Wydawnicza: Warszawa, Poland, 2004. [Google Scholar]
- Kusz, D. Level of Investment Expenditure versus Changes in Technical Labour Equipment and Labour Efficiency in Agriculture in Poland. In Proceedings of the International Scientific Conference Economic Sciences for Agribusiness and Rural Economy, Warsaw, Poland, 7–8 June 2018; Available online: https://js.wne.sggw.pl/index.php/esare/article/view/1477 (accessed on 26 October 2025).
- Gastaldi, L.B.; Galetto, A.J.; Pace Guerrero, I.R. Factors Affecting Exit Intentions from Dairy Farming in the Pampas Region of Argentina. Econ. Agrar. Recur. Nat. 2023, 23, 91–116. [Google Scholar] [CrossRef]
- Zorn, A.; Zimmert, F. Structural Change in the Dairy Sector: Exit from Farming and Farm Type Change. Agric. Food Econ. 2022, 10, 7. [Google Scholar] [CrossRef]
- Hansen, B.G.; Østerås, O. Farmer Welfare and Animal Welfare- Exploring the Relationship between Farmer’s Occupational Well-Being and Stress, Farm Expansion and Animal Welfare. Prev. Vet. Med. 2019, 170, 104741. [Google Scholar] [CrossRef]
- Holmes, G.; Osei, M.; Bray, J.; Discetti, R. Why Dairy Farmers Leave the Industry: The Role of Control, Autonomy, and Self-Efficacy. J. Rural Stud. 2025, 116, 103600. [Google Scholar] [CrossRef]
- Herrera Sabillón, B.; Gerster-Bentaya, M.; Knierim, A. Measuring Farmers’ Well-being: Influence of Farm-level Factors on Satisfaction with Work and Quality of Life. J. Agric. Econ. 2022, 73, 452–471. [Google Scholar] [CrossRef]
- Teece, D.J.; Pisano, G.; Shuen, A. Dynamic capabilities and strategic management. Strateg. Manag. J. 1997, 18, 509–533. [Google Scholar] [CrossRef]
- Hansson, H.; Ferguson, R.; Olofsson, C. Psychological Constructs Underlying Farmers’ Decisions to Diversify or Specialise Their Businesses—An Application of Theory of Planned Behaviour. J. Agric. Econ. 2012, 63, 465–482. [Google Scholar] [CrossRef]
- Rodriguez-Lizano, V.A.; Montero-Vega, M.; Sibelet, N. Which Variables Influence the Succession Process in Family Farms? A Literature Review. Cah. Agric. 2020, 29, 39. [Google Scholar] [CrossRef]
- Chamberlin, E. The Theory of Monopolistic Competition; Harvard University: Cambridge, MA, USA, 1933. [Google Scholar]
- Wernerfelt, B. A Resource-based View of the Firm. Strateg. Manag. J. 1984, 5, 171–180. [Google Scholar] [CrossRef]
- Barney, J. Firm Resources and Sustained Competitive Advantage. J. Manag. 1991, 17, 99–120. [Google Scholar] [CrossRef]
- Itami, H.; Roehl, T. Mobilizing Invisible Assets; Harvard University Press: Cambridge, MA, USA, 1991. [Google Scholar]
- Romanowska, M. Kształtowanie Wartości Firmy w Oparciu o Kapitał Intelektualny. In Systemy Informacji Strategicznej. Wywiad Gospodarczy a Konkurencyjność Przedsiębiorstwa; Borowiecki, R., Romanowska, M., Eds.; Difin: Warszawa, Poland, 2001. [Google Scholar]
- Parzonko, A.; Bórawski, P. Competitiveness of Polish Dairy Farms in the European Union. Agric. Econ. 2020, 66, 168–174. [Google Scholar] [CrossRef]
- Oliver, C. Sustainable competitive advantage: Combining institutional and resource-based views. Strateg. Manag. J. 1997, 18, 697–713. [Google Scholar] [CrossRef]
- Peng, M.W.; Sun, S.L.; Pinkham, B.; Chen, H. The institution-based view as a third leg for a strategy tripod. Acad. Manag. Perspect. 2009, 23, 63–81. [Google Scholar] [CrossRef]
- Amgai, S.; Komarek, A.M.; Adhikari, R.P. Understanding the role of policy in enhancing agrifood value chain competitiveness: A systematic literature review. J. Agric. Food Res. 2025, 22, 102022. [Google Scholar] [CrossRef]
- Peng, M.W. Towards an institution-based view of business strategy. Asia Pac. J. Manag. 2002, 19, 251–267. [Google Scholar] [CrossRef]
- Porter, M.E. Competitive Strategy: Techniques for Analyzing Industries and Competitors; Free Press: New York, NY, USA, 1980. [Google Scholar]
- Vigfússon, K.; Johannsdottir, L.; Olafsson, S.; Köseoglu, M.A. Integrating resource-based and market-based views in the fisheries industry–CEO perspectives. Mar. Policy 2025, 171, 106454. [Google Scholar] [CrossRef]
- Teece, D.J. Explicating dynamic capabilities: The nature and microfoundations of (sustainable) enterprise performance. Strateg. Manag. J. 2007, 28, 1319–1350. [Google Scholar] [CrossRef]
- Thorsøe, M.; Noe, E.; Maye, D.; Vigani, M.; Kirwan, J.; Chiswell, H.; Grivins, M.; Adamsone-Fiskovica, A.; Tisenkopfs, T.; Tsakalou, E.; et al. Responding to change: Farming system resilience in a liberalized and volatile European dairy market. Land Use Policy 2020, 99, 105029. [Google Scholar] [CrossRef]
- Bastanchury-López, M.T.; De-Pablos-Heredero, C.; Montes-Botella, J.L.; Martín-Romo-Romero, S.; García, A. Impact of Dynamic Capabilities on Performance in Dairy Sheep Farms in Spain. Sustainability 2020, 12, 3368. [Google Scholar] [CrossRef]
- Breiman, L.; Ihaka, R. Nonlinear Discriminant Analysis via Scaling and ACE; Technical Report; Department of Statistics, University of California: Davis, CA, USA, 1984. [Google Scholar]
- Maimon, O.; Rokach, L. Decomposition methodology for knowledge discovery and data mining. In Data Mining and Knowledge Discovery Handbook; Maimon, O., Rokach, L., Eds.; Springer: Boston, MA, USA, 2005; pp. 981–1003. [Google Scholar] [CrossRef]
- Sroka, W.; Król, K.; Kulesza, J.; Stanuch, M.; Lisek, S. Community Readiness for Agro Living Lab (ALL) Projects: Factors Influencing Engagement of Young Urban Residents. Agriculture 2025, 15, 94. [Google Scholar] [CrossRef]
- Machuca, C.; Vettore, M.V.; Krasuska, M.; Baker, S.R.; Robinson, P.G. Using classification and regression tree modelling to investigate response shift patterns in dentine hypersensitivity. BMC Med. Res. Methodol. 2017, 17, 120. [Google Scholar] [CrossRef] [PubMed]
- Parzonko, A.; Wojewodzic, T.; Czekaj, M.; Płonka, R.; Parzonko, A.J. Remuneration for Own Labour in Family-Run Dairy Farms Versus the Salaries and Wages in Non-Agricultural Sectors of the Economy—Evaluation of the Situation in Poland in 2005–2022. Agriculture 2025, 15, 1314. [Google Scholar] [CrossRef]
- Zhang, G.; Gionis, A. Regularized Impurity Reduction: Accurate Decision Trees with Complexity Guarantees. Data Min. Knowl. Discov. 2023, 37, 434–475. [Google Scholar] [CrossRef]
- Pawlak, K.; Poczta, W. Competitiveness of Polish Agriculture in the Context of Globalization and Economic Integration Competitive Potential and Position. Probl. Agric. Econ. 2020, 4, 86–107. [Google Scholar] [CrossRef]
- Ziętara, W.; Adamski, M. Skala Produkcji, Efektywność i Konkurencyjność Polskich Gospodarstw Wyspecjalizowanych w Produkcji Mleka. Zagadnienia Ekon. Rolnej 2014, 1, 97–115. Available online: https://open.icm.edu.pl/handle/123456789/6343 (accessed on 26 October 2025).
- Wilczyński, A.; Kołoszycz, E. Economic Resilience of EU Dairy Farms: An Evaluation of Economic Viability. Agriculture 2021, 11, 510. [Google Scholar] [CrossRef]
- Fałkowski, J.; Malak-Rawlikowska, A.; Milczarek-Andrzejewska, D. Farmers’ Self-Reported Bargaining Power and Price Heterogeneity. Br. Food J. 2017, 119, 1672–1686. [Google Scholar] [CrossRef]
- Sumner, D.A.; Leiby, J.D. An Econometric Analysis of the Effects of Human Capital on Size and Growth among Dairy Farms. Am. J. Agric. Econ. 1987, 69, 465–470. [Google Scholar] [CrossRef]
- Hamilton, W.; Bosworth, G.; Ruto, E. Entrepreneurial Younger Farmers and the” Young Farmer Problem” in England. Agric. For. 2015, 61, 61–69. [Google Scholar] [CrossRef]
- Olsen, J.V.; Lund, M. The Impact of Socio-Economic Factors and Incentives on Farmers’ Investment Behaviour. Food Econ.-Acta Agric. Scand. Sect. C 2011, 8, 173–185. [Google Scholar] [CrossRef]
- Liu, Y.; Chen, M.; Yu, J.; Wang, X. Being a Happy Farmer: Technology Adoption and Subjective Well-Being. J. Econ. Behav. Organ. 2024, 221, 385–405. [Google Scholar] [CrossRef]
- Thelin, A.; Holmberg, S. Farmers and Retirement: A Longitudinal Cohort Study. J. Agromed. 2010, 15, 38–46. [Google Scholar] [CrossRef]
- Bertolozzi-Caredio, D.; Bardaji, I.; Coopmans, I.; Soriano, B.; Garrido, A. Key Steps and Dynamics of Family Farm Succession in Marginal Extensive Livestock Farming. J. Rural Stud. 2020, 76, 131–141. [Google Scholar] [CrossRef]
- Coopmans, I.; Dessein, J.; Accatino, F.; Antonioli, F.; Bertolozzi-Caredio, D.; Gavrilescu, C.; Gradziuk, P.; Manevska-Tasevska, G.; Meuwissen, M.; Peneva, M.; et al. Understanding farm generational renewal and its influencing factors in Europe. J. Rural Stud. 2021, 86, 398–409. [Google Scholar] [CrossRef]
- Bertolozzi Caredio, D. The Farm Succession Effect on Farmers’ Management Choices. Land Use Policy 2024, 137, 107014. [Google Scholar] [CrossRef]
- Ivanova, I.; Trotsenko, I.; Trotsenko, V. Automation of Processes in Dairy Cattle Production. IOP Conf. Ser. Mater. Sci. Eng. 2019, 582, 012035. [Google Scholar] [CrossRef]
- Shortall, J.; Shalloo, L.; Foley, C.; Sleator, R.D.; O’Brien, B. Investment Appraisal of Automatic Milking and Conventional Milking Technologies in a Pasture-Based Dairy System. J. Dairy Sci. 2016, 99, 7700–7713. [Google Scholar] [CrossRef]
- Lavrijsen-Kromwijk, L.; Demba, S.; Müller, U.; Rose, S. Impact of Automation Level of Dairy Farms in Northern and Central Germany on Dairy Cattle Welfare. Animals 2024, 14, 3699. [Google Scholar] [CrossRef] [PubMed]
- Ben Hassen, T.; El Bilali, H.; Daher, B.; Burkart, S. Sustainable and resilient food systems in times of crises. Front. Nutr. 2025, 12, 1564950. [Google Scholar] [CrossRef] [PubMed]
- Latruffe, L.; Piet, L. Does land fragmentation affect farm performance? A case study from Brittany, France. Agric. Syst. 2014, 129, 68–80. [Google Scholar] [CrossRef]


Disclaimer/Publisher’s Note: The statements, opinions and data contained in all publications are solely those of the individual author(s) and contributor(s) and not of MDPI and/or the editor(s). MDPI and/or the editor(s) disclaim responsibility for any injury to people or property resulting from any ideas, methods, instructions or products referred to in the content. |
© 2025 by the authors. Licensee MDPI, Basel, Switzerland. This article is an open access article distributed under the terms and conditions of the Creative Commons Attribution (CC BY) license (https://creativecommons.org/licenses/by/4.0/).