Abstract
The European Union’s (EU’s) climate neutrality agenda prioritises sustainable agriculture, within the scope of which the dairy sector is central to food security, rural life, and trade competitiveness. While Latvia’s contribution to milk production in the EU is comparatively small, dairy farming constitutes a structurally important sector in the country that must reconcile economic sustainability with environmental concerns, including greenhouse gas (GHG) emissions and resource use. Therefore, this study’s research aim is to identify key environmental hotspots and explore the relationship between productivity, economic performance, and sustainability using the life cycle assessment (LCA) approach in farms of different sizes in Latvia. This study applies an LCA methodology to evaluate environmental hotspots and investigate the relationships between the productivity, size, and economic performance of Latvian dairy farms; in addition, the GHG emissions of Latvian dairy farms are analysed. Small farms dominate by number in Latvia, while the largest farms have the highest yields and milk quality, and are more economically sensitive due to their high production costs. The LCA results show that large farms have the highest absolute environmental impacts—particularly milking and feed production—though the emission intensity per kilogram of milk is lower than that in small farms. These findings indicate productivity–profit trade-offs when considering environmental impacts, with milking and feed emerging as the key areas for enhancing sustainability.
1. Introduction
In the EU, sustainability has become a core objective. Current EU strategies emphasise achieving climate neutrality by 2050, advancing the green transition, and ensuring that this transition is just and equitable [1]. Nonetheless, it is also considered important to ensure a high quality of life, particularly regarding agriculture, food security, water resources, and ecosystem health [2]. Milk production is the foundation of the agricultural economy in the EU, from which rural settlements derive their livelihoods, achieve trade balances, and ensure food security. The EU produced 165 million tons of milk in 2017, with Germany and France leading the way in milk production among EU countries. Although Latvia is recognised as one of the smallest milk producers in the EU [3], dairy farming remains a crucial sector in Latvia [4]. The EU is a significant player in the global dairy trade, accounting for approximately one-third of the world’s dairy product exports and maintaining a substantial presence in overseas markets [5]. Milk production worldwide has been on the increase, stimulated by the rise in demand, dietary changes, and enterprises that supply farms with production factors [3]. However, studies have identified the dual dilemma of dairy farming regarding the trade-off between profitability and environmental pressures, as a response to climate change and resource limitations [6]. Emerging trends, such as the geographic reallocation of milk production to nations in the Global South and mechanised intensification, are influencing both economic and ecological performance [7]. To address these demands, global eco-efficiency modelling systems integrating indicators derived from LCA with farm data enable the quantification of sectoral efficiency [8]. Increasing milk yield per cow reduces resources and emissions per unit of milk produced, making the entire system eco-efficient [9,10]. Increasing productivity can reduce inputs—such as animals, feed, land, and water—by 25–33% per million metric tons of energy-corrected milk, resulting in measurable environmental benefits [10]. However, regulatory circumstances can affect cost efficiency, with more stringent regulations having the effect of reducing economic efficiency through overcapitalisation and reliance on domestic feed [11]. Understanding the impacts of milk yield and farm size on environmental performance and profitability is crucial for developing sustainable dairy farming policies [6]. Bigger farms are more likely to have better yields and profitability but may have higher GHG emissions per hectare than smaller farms, requiring additional specialised policy instruments. Cluster analyses have revealed that farm size and environmental indicators respond differently across farm types [12]. It is necessary to utilise various multi-criteria tools that integrate economic, environmental, and social indicators, allowing for the identification of optimal configurations and trade-offs [10,13]. Italian farm studies and LCA results have suggested that farms can achieve high economic, environmental, and social performance simultaneously, indicating that conventional trade-offs between profitability and sustainability can be reduced [14]. Aiming to combine farm-level economic indicators, milk yield information, and cradle-to-gate life cycle assessment to identify key economic and environmental hotspots in dairy production, integrating LCA with life cycle costing and the Integrated Farm System Model, allows for robust quantification of performance, emissions, and resource use [15,16]. Previous livestock LCA studies have omitted some impact categories; thus, this study presents a broader set of indicators to better capture relevant trade-offs [16]. Cradle-to-gate approaches are most suitable for assessing GHG emissions, water use, and land use in dairy systems, even though more data are still needed throughout the value chain [17].
Global concerns regarding climate change, resource scarcity, and sustainable agriculture make it critical to evaluate both the economic and environmental performance of dairy farms. Despite extensive research globally, there is a lack of comprehensive data linking economic performance, milk yield, and environmental impacts across differently sized farms in Latvia. Therefore, this study’s research aim is to identify key environmental hotspots and explore the relationships between productivity, economic performance, and sustainability using the LCA approach, considering differently sized farms in Latvia.
According to data from the Latvian Environmental Geology and Meteorology Centre, emissions from agricultural soil management accounted for the largest share (47.1%) of the sector’s total emissions in 2023. Emissions from farm animal intestinal fermentation processes were the second-largest source of agricultural emissions, generating 41.6% of total agricultural emissions. Manure management contributed 7.6%, while liming and urea use together accounted for 3.7% of total agricultural emissions in 2023 [18].
The remainder of this paper is structured into five sections. Section 2 describes the research methods, as well as the data and materials used for calculations. Section 3 summarises the calculation results, comprehensively analysing the economic and environmental indicators of differently sized dairy farms in Latvia, using various methodologies, including LCA and the Intergovernmental Panel on Climate Change Guidelines (IPCC Guidelines). Section 4 presents a discussion of the main research results based on the scientific literature and an analysis of empirical research studies. Section 5 summarises the main conclusions and future research priorities.
2. Materials and Methods
2.1. Initial Steps of the Methodological Framework
The step-by-step methodological framework of the study is shown in Figure 1. First, the scientific literature in the Scopus database and other sources was reviewed to identify different methodologies for GHG emission calculations. The literature review focused on LCA and the 2006 IPCC Guidelines [19], including studies focused on dairy farming in Latvia to determine the environmental impacts and GHG emissions associated with different farm size groups. Although studies typically report total emissions in a country or in the agricultural sector, more accurate information is needed—at the very least, at the level of different farm size groups—for policymakers to develop the necessary incentive measures to reduce such emissions.
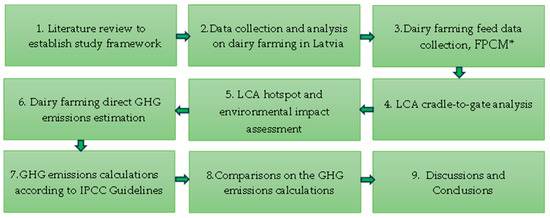
Figure 1.
Step-by-step methodological framework of the study. * FPCM: fat- and protein-corrected milk.
In the second step, it was necessary to understand the economic characteristics of dairy farming. Therefore, Latvian data from the Farm Accounting Data Network (FADN) database for 2021–2023 were used for a detailed analysis of the economic income and cattle composition of dairy farms, broken down according to their economic size. The economic size of farms is one of the main categories used in the EU typology for classifying agricultural holdings, which is measured as the total Standard Output (SO) of the holding expressed in EUR. The SO is the average monetary value of the farm output according to the farm-gate price of each agricultural product (crop or livestock) in a particular area. In Latvia, only farms exceeding an economic size of 4000 EUR SO are defined as commercial and evaluated in the FADN database. Farms were divided into six groups based on their economic size in SO: 4–<15, 15–<25, 25–<50, 50–<100, 100–<500, and ≥500 thousand EUR [20].
As the FADN provides selected data for representative dairy farms in Latvia, it does not include all farms and data on milk quality indicators are not available. Consequently, in the third step, it was necessary to obtain dairy farming data regarding milk quality for the country. Therefore, the Rural Support Service (RSS) database, which contains farm statistics including the number of cows, herds, milk yields, and milk quality indicators (i.e., milk fat and protein content), was utilised [21]. Each herd was regarded as representing one farm. To ensure an in-depth analysis, all dairy farms were categorised into three sizes: small-sized dairy farms (1–50 dairy cows), medium-sized dairy farms (51–200 dairy cows), and large-sized dairy farms (201 dairy cows and larger). The data were compiled as of the year up to 30 September 2024 (thus considered as data for 2024), and aggregated for each of the three groups, based on the total number of dairy cows, average milk yield per cow, and milk quality parameters. Data from the FADN was compiled for the 2021–2023 period, providing an overview of the dairy sector in Latvia. To compare the various milk quality and yield values per year, milk yield was recalculated to what is known as fat- and protein-corrected milk (FPCM; in kg), assuming a conversion to FPCM with 4.0% fat and 3.3% protein.
While approaches in the scientific literature for calculation of the FPCM differ, the prevailing approach is to use the following two formulas.
- (1)
- According to the International Dairy Federation, the FPCM should be calculated using Formula (1) [22]:FPCMIDF (kg/year) = Production (kg/year) × (0.1226 × True Fat (%) + 0.0776 × True Protein (%) + 0.2534)
- (2)
- According to the United Nations Food and Agriculture Organization (FAO) (2007), the FPCM should be calculated using Formula (2) [23]:FPCMFAO (kg/year) = Raw milk (kg/year) × (0.337 + 0.116 × Fat content (%) + 0.06 × Protein content (%))
Both formulas for FPCM were calculated to obtain descriptive statistics and analyse the Latvian dairy sector. For LCA and per 1 kg of emissions, the FPCMFAO formula was used.
In the LCA model, the functional unit was set for FPCM, with the output being the per cow annually generated FPCMFAO amount, while the input was the respective feed amount per cow annually. The average dairy cow’s active milking lifespan is 3–4.5 years in high-income countries [24]. As LCA was performed for comparison of the three dairy farm size groups, the annual data were not multiplied.
According to the International Organization for Standardization (ISO) standards [25], it is recommended to avoid allocation whenever possible. However, in this study, allocation was necessary due to the significance of the animals as a co-product of milk. According to the EU Commission, the default allocation factor for cattle farming is based on mass for animals (for live weight, 12%, and for milk, 88%) [26]. This allocation was also used in the LCA research conducted in SimaPro (see Section 2.2), which was applied to all farms, and served as the basis for the obtained results.
2.2. Environmental Impact Assessment Through the Cradle-to-Gate LCA Technique
LCA was performed according to the study’s overall framework (Steps 5 and 6). To further evaluate the hotspots of environmental damage and assess whether the feed and size of dairy farming operations differ, LCA was performed with the use of SimaPro 10.2.0.2 and the Ecoinvent 3.0 database. Cut-offs were determined via a classification system, using ReCiPe 2016 Endpoint (H) V1.11/World (2010) H/A [27]. The research focused on emissions linked to milk production until the farm gate. The SimaPro software 10.2.0.2 (PRé Sustainability B.V., Amersfoort, The Netherlands) (further in text SimaPro), along with the Ecoinvent database, offers detailed life cycle inventories for various agricultural inputs. The constructed model encompassed upstream operations such as the manufacture and transport of feed, fertilisers, and other consumables, which are usually considered as Scope 3 emissions according to the GHG Protocol. While other Scope 3 emissions from post-farm activities (e.g., milk processing, packaging, distribution, and consumption) were not taken into consideration, the addition of these upstream inputs would provide a less fragmented view of the indirect environmental impacts within a cradle-to-farm boundary; however, the carbon footprint results would differ if a cradle-to-grave approach were used.
For LCA, there are two general approaches: bottom-up or top-down. As identified in ISO 14072:2024 [28], the bottom-up approach involves compiling various Life Cycle Inventories (LCIs) of an organisation’s products, which are weighted by the quantity of products produced during the specified period, including associated utilities. In the top-down approach, it is essential to consider the organisation as a whole, and adding upstream models (known as “cradle-to-gate”) for all outputs is crucial. LCA enables the identification of key environmental hotspots and opportunities for improvement. Buxel et al. (2014) noted that “while LCA was originally designed to support decisions in the environmental engineering area, it is a tool that can also be used managerially to develop valuable and fact-based sustainability strategies within the company regarding its products and services” [29]. Therefore, the LCI process of LCA involves collecting data on resource inputs, energy consumption, and emissions to air, water, and land throughout a product’s life cycle [30]. The life cycle impact assessment step should enable description and assessment of the environmental impacts of the inventory components. The LCA technique was applied in a cradle-to-gate manner, which involves analyses from raw materials through to manufacturing, including at the factory/farm level [30]. This required defining the functional unit and allocation method, as well as data collection for LCI—including feed data and milk output for each farm size according to the RSS data (see Figure 2).
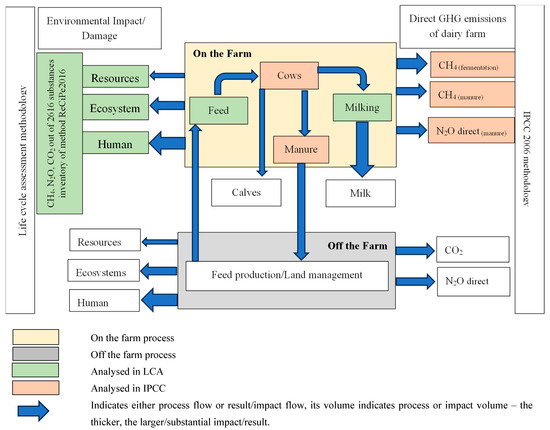
Figure 2.
Schematic overview of the milk production system and analysis components.
The dairy farming feed structure and components for Latvia were compiled from various sources: research articles, farmer advisory and consulting articles, and a handbook [31,32,33]. The types of fodder and rations in small, medium, and large farms (in kg dry matter per day) are listed in Table A1 in Appendix A. It can be observed that for large-sized farms, more emphasis is placed on the total mixed ratio of feed. For dairy farms with 1–50 dairy cows, significant focus is placed on the combination of legumes with grass silage, hay, and grass silage/haylage, with the addition of roots in the feed mixture also observed.
A total mixed ratio (TMR) was created in SimaPro based on inputs derived from Latvian Rural Advisory and Training Centre (LLKC) data [33], which are presented in Table A2 in Appendix A. TMR—well-balanced feed which is already premixed before feeding—is typically administered in medium- and large-sized farms to ensure homogeneity of feed and consistency in milk output and quality, but is less commonly used in small farms. While the TMR formulation varies with each farm, as a farm typically works in collaboration with feed sellers to optimise the formula for their own farm, the average recommendation from the LLKC was adopted in this study.
Averages per group, especially for medium- to large-sized farms, were used as assumptions for lactation phases. According to Degola et al. (2016) [31], lactation is distinguished as lasting for 150 days. According to the notes, the period from the beginning to the end of lactation lasts 305 days, with the lactation end phase lasting 155 days, while the dry period averages 40–65 days. To approximate the calendar year, the latter period was assumed to last 60 days. To calculate the average feed for medium- and large-sized farms, these period estimates were used for proportional estimation of the feed intake according to the following formula:
Feed amount = 150/365 × feed amount + 155/365 × feed amount + 60/365 × feed amount
The nutrient composition in feed rations is summarised in Table A3 in Appendix A.
ISO standards (especially 14040:2006 [30] and 14044:2006 [25]) standardise the LCA process and are widely used globally [34], including in the life cycle inventory stage of the SimaPro software. For impact analysis in the SimaPro software, global ReCiPe2016 endpoint data were used, allowing the environmental impact assessment to be aggregated into a single score and compared between dairy farms of different sizes. The single score (Pt) was calculated by applying a weighting factor to each impact category to normalise the score in the damage assessment [35].
2.3. Calculation and Analysis of GHG Emissions
GHG analysis was performed according to the study’s overall framework (Steps 6, 7, and 8).
According to the FAO (2007), GHG emissions from dairy farming are quantified as carbon dioxide (CO2), methane (CH4), and nitrous oxide (N2O) emissions, including those from milked cows, animals for replacement in the herd, and surplus calves for meat. However, factors such as land use, capital goods, the retail stage, and disposal of packaging are excluded [23]. The GHG emission calculation was performed using LCA and the 2006 IPCC Guidelines for National Greenhouse Gas Inventories [19].
To calculate the environmental impacts for the dairy sector—especially its contribution to GHG emissions—using the 2006 IPCC Guidelines, the results were based on calculations according to Formulas (4)–(8).
For CH4 intestinal fermentation and manure, an annual, per country formula is used, as shown in Formulas (4) and (5) [19].
where CH4 intestinal fermentation denotes CH4 emissions from feed intestinal fermentation in a country, expressed in kg of CH4 annually; and EF1(Dairy cows) is the CH4 emission factor/multiplier for dairy cows, which varies according to the 2006 IPCC Guidelines; for Western Europe, it is 117, and for Eastern Europe, it is 99 [19], while Popluga et al. (2019) calculated a specific value for Latvia, and obtained 141.2 kg of CH4 emissions per dairy cow annually [36]—thus, this value was used for Latvia. Furthermore, N denotes the number of dairy cows in Latvia.
where CH4 manure denotes CH4 emissions from dairy cow manure in the country, expressed in kg of CH4 annually; and EF2(manure) is the CH4(manure) emission factor/multiplier for dairy cows. For Latvia, Popluga et al. determined the value of this multiplier to be 17.28 [36]; however, according to the 2006 IPCC Guidelines, the coefficient is dependent on the temperature. According to Tradingeconomics, in 2024, the average temperature in Latvia was 8.51 degrees Celsius, which is below 10 degrees and, thus, corresponds to a coefficient of 11 according to the 2006 IPCC Guidelines [37]. As the indicator for Latvia has been calculated, it will be used.
CH4 (intestinal fermentation) = EF 1(Dairy cows) × N
CH4 (manure) = EF 2(manure) × N
For N2O, an annual, per country formula is also used, as shown in Formula (6) [19].
where N2ODmm denotes direct N2O emissions from manure management (mm) in the country, kg N2O annually; N is the number of dairy cows in Latvia; Nex is the annual average N excretion per dairy cow in the country, kg N per animal annually (as of 2021, this is 119.90 according to Latvia’s National Inventory Report 1990–2021 [38]); MS is the fraction of total annual nitrogen excretion for each dairy cow that is managed in a manure management system in the country, dimensionless (for Eastern Europe, this indicator is 0.35, according to the 2006 IPCC Guidelines); EF3 is an emission factor for direct N2O emissions from the manure management system in the country, kg N2O-N/kg N in manure management system (for Latvia, the value of this factor is 0.005) (Popluga et al., 2019) [36]; and 44/28 is the value for conversion of (N2O-N)(mm) emissions into N2O(mm) emissions.
N2ODmm = N × Nex × MS × EF3 × 44/28
According to ISO 14067/2018 [39], GHG emissions other than CO2 are expressed in CO2eq by multiplying the respective GHG emissions using conversion coefficients for CH4 and N2O to CO2eq (Formulas (7) and (8)). New conversion rates have been developed, according to Statistics Netherlands. Since September 2022, due to the IPCC’s rules, the conversion factor for methane (CH4) has been increased (from 25 to 28), while that for nitrous oxide (N2O) has decreased (298 instead of 265) [40].
where CO2eq(1) denotes CH4 emissions converted into CO2 equivalent global warming units, methane kg per animal per year, and CH4 is the methane emissions derived from fermentation and manure, summed together per dairy cow, in kg annually.
where CO2eq(2) denotes the direct N2O emissions converted into CO2eq global warming units, nitrogen oxide kg per dairy cow annually; and N2O is the direct nitrogen oxide emissions from dairy cows’ manure per dairy cow, in kg annually.
CO2eq(1) = 28 × CH4
CO2eq(2) = 265 × N2O
Figure 2 illustrates the connections, commonalities, and differences between the LCA and 2006 IPCC Guidelines methodologies for calculating GHG emissions.
Figure 2 illustrates the separation and analysis components for on- and off-farm processes. On-farm refers to data and processes that take place on the dairy farm, including feed provided to cows and the milking process, as well as manure from cows; meanwhile, the feed is prepared off-farm, and milk and calves/meat are also sold outside the farm (if the dairy farm itself does not process milk). Cradle-to-gate LCA analysis was performed for the on-farm processes from feed to milking (inclusive), thereby enabling estimation of the environmental impacts and their components. The separately analysed GHG emissions of CO2, CH4, and N2O were also considered. These emissions were compared with the direct emissions—which result from cows and manure, according to the 2006 IPCC Guidelines methodology—and then the results were compared.
Research limitations: (1) Only direct on-farm GHG emissions for the dairy sector were calculated using IPCC Guidelines; (2) cradle-to-gate LCA was chosen for hotspot detection from annual data; and (3) off-farm processes were considered outside of the study’s scope.
3. Results
The outcomes in this section are presented in three subsections. The first involves a comparison of dairy farms of different sizes, based on several sources of information. The second involves the evaluation and comparison of these farms by means of LCA. The third evaluates GHG emissions, which were estimated by employing different methodological strategies.
3.1. Characteristics of Dairy Farms in Latvia
According to statistical data, there were 113,000 dairy cows in Latvia at the end of 2024 [41], with an average milk yield per cow of 8239 kg, representing a 15% increase compared with 2020 [42]. The number of cattle and cows has shown a declining annual trend over the period 2020–2024, with 12%, 11%, and 17% reductions in total cattle, the number of cows, and dairy cows in 2024 compared with 2020 [43]. There were 58.6 thousand farms in Latvia at the end of 2024; of these, only 7194 farms (or 12%) were engaged in dairy farming [44].
An overview of the composition of dairy farms in Latvia in 2023, based on the FADN data, is presented in Table 1. While the FADN included 270 farms (or 4% of the total), these farms are representative of 74% of the total dairy farms in Latvia.

Table 1.
Characteristics of dairy farms by size groups in Latvia in 2021–2023 based on the FADN data [20].
In Latvia, when a dairy farm’s size exceeds 100 cows, its annual milk yield tends to increase significantly; the reason for this is that larger farms are typically commercial, large-scale operations and, thus, they are very focused on optimising the milk output amount. Therefore, they are also constantly adjusting and looking for the right feed mixture for yield optimisation. Most dairy farms, according to their economic size, are in the range of 15–50 thousand EUR SO.
An economic analysis indicated that the gross and net income per farm varies significantly. While the total net income in 2023 was negative, large farms represented the overall losses, despite having significantly—from 8 up to 90 times—higher gross income compared with other dairy farms. This outcome indicates the pressures that such dairy farms are experiencing despite their large size and possibility of economies of scale, with the cost of milk production in 2023 impacting the bottom line of the largest farms the most. The highest net and gross income were observed for farms with SO from 15 up to 100 thousand EUR, which also had the lowest milk yield per cow—from 5.10 to 5.66 tons per year. Meanwhile, larger farms with higher income, namely those with 100–500 and >500 thousand EUR SO—had lower profit or loss, respectively, but the highest yields. As such, high yields for the year 2023 came with additional pressure on net income for the largest dairy farms in Latvia. Therefore, to assess the differences and potential for environmental impact hotspots, a detailed LCA was carried out. As the six SO groups detailed above were too fragmented for analysis, the dairy farms were further aggregated into three categories: small, those with 1–50 dairy cows; medium, with 51–200 dairy cows; and large, with 201 or more dairy cows.
Compiling and analysing RSS data for dairy farms in Latvia, Table 2 shows that there are only 2794 farms (or 39% of the total in the country) under the milk monitoring system; however, these farms include 101,000 cows, accounting for 89% of the total number of cows in Latvia. The most significant number of herds in Latvia is attributed to small-sized dairy farms, with 1–50 cows per herd. It is important to note, as mentioned for the FADN data in Table 1, that very small but economically significant farms are not covered; however, by herd number, they are substantial, and a part of this group would not be covered in the FADN data. Small-sized farms also yield 21% fewer kg of milk per cow per year (p.a.) on average compared with medium-sized dairy farms, and 38% fewer kg of milk per cow p.a. compared with large-sized dairy farms. When breaking down the data for the small farm size category in more detail, it can be observed that the majority of herds are in the category with more than 4 to less than 15 cows per herd, comprising 1350 herds (or 48% of herds in the RSS milk monitoring system), while very small farms with 1 to 4 cows comprise 302 herds (or 11%). Together, farms with 1–15 dairy cows comprise over half (59%) of the dairy herds in Latvia, while producing only 9% of the total milk output in 2024 [43]. The medium-sized dairy farm group comprises farms with herds ranging from 51 to 200 dairy cows, generating 29% of total annual milk output in Latvia. In contrast, small farms generate only 24% of the yearly milk output despite having 9% more dairy cows compared with medium-sized farms. The majority (47%, or almost half) of Latvia’s annual milk output is generated by large-sized farms; that is, those with 201 or more cows per herd. Although there are only 79 such dairy farms, this group achieved the highest milk yield per cow, at 11,200 kg per year. The farms also differ regarding the quality of the milk they produce based on their size. When measured in terms of fat and protein components, the highest fat content (4.17%) was found in milk from small farms, while medium farms had a lower average fat content (at 4.07%) and the lowest value of this indicator was found in milk from large farms (3.9%). The most significant variations from the average between herds regarding milk fat content were observed in the small farm group, ranging from 2.27% to 6.04%. In contrast, more consistent results were found among large farms, with fat content ranging between 3.04% and 4.74%. To compare milk yields when their quality indicators vary, FPCM has been used globally to recalculate and convert milk yields to a fat content of 4% and a protein content of 3.3%. Widely used approaches to calculating FPCM derive from two sources: the FAO and IDF formulas. However, it should be noted that these formulas can generate different results. For example, with the Latvian farm data, the FAO formula generated a lower amount of kg FPCM when compared with unadjusted milk yields per year. In contrast, the IDF formula yielded 24–26% higher FPCM kg milk per cow compared with the FAO formula, resulting in a higher average milk yield per cow in Latvia compared with the non-adjusted average milk yield in kg per cow (except for large-sized farms). Therefore, for LCA analysis, comparability was ensured by using the FPCM kg of milk yield per cow per year calculated via the FAO formula, which provides more conservative values.
Table 2.
Breakdown of dairy production indicators and FPCM in Latvia by herd size for the year up to 30.09.2024 based on RSS data [20,21,22,23].
3.2. LCA Calculation Results for Dairy Farms in Latvia
The life cycle impact assessment (cradle-to-gate) results are shown in Table 3.
Table 3.
Life cycle impact assessment (cradle-to-gate) midpoint comparison between Latvian dairy farms of three different sizes in 2024 [21,23,27,31,32,33].
As can be seen from the impact data in Table 3, the most significant impacts are those related to fossil and mineral resource scarcity, fine particulate matter formation (leading to human non-carcinogenic toxicity), and the impacts on human health due to global warming. When comparing the three dairy farm size groups, the impacts were found to differ, especially between small- and medium-sized farms (with a difference of 2% to 58% in the presented indicators, being larger in the medium group compared with the small group), as well as between small- and large-sized farms (differences between 0% and 66%, with higher impact factors observed for large-sized dairy farms). Less deviation was observed between medium- and large-sized dairy farms (difference between 1 and 14%, with the exception of significantly lower terrestrial acidification in large-sized farms). Therefore, significant differences were observed when comparing the three groups of dairy farms regarding the environmental impact/damage categories. When expressed in relative terms—that is, where 100% indicates the farm size with the most significant indicator and the respective values for farms of other sizes are expressed as a percentage of that main factor—it was found that for all 22 midpoint impact categories, large-sized farms were the main contributor, with exception of the terrestrial acidification category, where the main contributors was medium-sized farms, with an assigned value of 100% [43].
How the midpoint impact categories detailed in Table 3 translate into three aggregated endpoint areas of production/categories—namely damage to human health, damage to ecosystems, and damage to resource availability—and the associated damage pathways are shown in Figure 3.
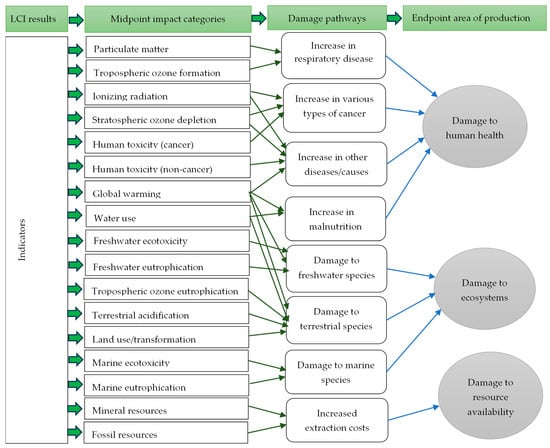
Figure 3.
Presentation of the relationships between impact categories, midpoints, and endpoints in ReCiPe 2016 (SimaPro database manual—methods library) [45].
In Table 3, the results of an analysis performed for each damage impact factor are shown. To assess which of the three significant factors was the most impactful on the environment, Figure 4 represents the results as a unified single score.
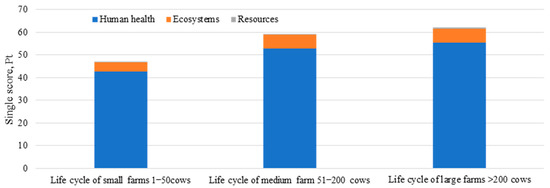
Figure 4.
Damage assessment (cradle-to-gate) by farm size, and single-score impact grouped by environmental endpoint impact category in Latvia for 2024 [21,23,27,31,32,33].
Figure 4 shows that the most significant impact of dairy farming is on human health aspects, followed by a significantly lower impact on ecosystems and a minimal impact on resource scarcity. The hotspot affecting human health, as shown in the figure above, results from factors such as ozone depletion and particulate matter generation. The difference in impact is most obvious between small-scale dairy farms and medium- to large-scale dairy farms in Latvia.
The cradle-to-gate environmental impact (Table 4)—that is, covering from feed to milking—is a significant influencing factor that can be expressed as a single score, Pt, in ReCiPe. The most important factor, according to this score, is the milking process—comprising 34% of the impact of all processes analysed in small and medium farms, and 40% in large farms. This suggests an area for more in-depth exploration, potentially helping in the search for damage reduction possibilities. At the same time, differences can be observed between small farms and medium- to large-scale farms, with alfalfa silage serving as the second-greatest contributor in the latter (18% in large farms and medium farms) according to the overall damage assessment normalised score, while the contributor in second position for small farms is hay.
Table 4.
Life cycle impact assessment (cradle-to-gate) comparison between different-sized dairy farms in Latvia, expressed as a single score (Pt), and its structure in 2024 [21,23,27,31,32,33].
3.3. Comparisons of the Calculation of Direct GHG Emissions in Different Sizes of Dairy Farms in Latvia
The GHG emission calculation results obtained using the 2006 IPCC Guidelines methodology are shown in Table 5, while those using the LCA methodology are presented in Table 6.
Table 5.
Calculation results of direct GHG emissions in 2024 for the dairy sector in Latvia, broken down by farm size group, according to the 2006 IPCC Guidelines methodology [19,21,23,36,38,40].
Table 6.
Calculation results of direct GHG emissions in 2024 for the dairy sector in Latvia, broken down by farm size group, according to the LCA (cradle-to-gate) methodology [21,23,27,31,32,33].
The main difference is that the number of dairy cows changes the emissions (Table 6). The deviation between groups regarding the number of cows would lead to the same deviation in the total direct emissions from the dairy sector. Notably, this gives rather simplistic and overall GHG emission results for the sector; as such, additional benefits can be gained through LCA to determine hotspots.
As can be seen in this stage of the cradle-to-gate process, the primary emissions are attributable to the feed and milking processes. Therefore, these emissions should be calculated separately when comparing the three groups to obtain a more in-depth picture. Notably, the LCA results were 4–5 times higher than those obtained when using the 2006 IPCC Guidelines methodology. A reason for this could be that in the IPCC calculations, only the number of cows is taken into account, and the agricultural feed production side is calculated separately. When evaluating the overall CO2eq, it is evident that larger farms contribute more emissions; however, when recalculating per 1 kg of milk, it becomes clear that large farms actually generate the least emissions between the three groups per 1 kg of FPCM, making them more efficient. A similar result was also obtained when performing the evaluation using the 2006 IPCC Guidelines methodology; that is, the large-sized dairy farms generate the most emissions in CO2eq, but when recalculating not per cow but per 1 kg of FPCM, large dairy farms were again found to generate the least emissions per kilogram of milk.
4. Discussion
4.1. Productivity and Economic Performance
This analysis examines the relationship between farm scale and several economic indicators, including gross and net income, as well as production-based indicators of farming sustainability such as productivity. This study considers the effects of herd size on milk yield, yield components, fat content, and protein content. It is worthwhile to address the reasons why larger agricultural operations produced negative net incomes when their gross revenues can be in the millions of dollars [6]. The economic resilience of small- and medium-sized farms was compared with that of larger farms, indicating vulnerability and economic adaptability in the dairy sector.
The analysis of various-sized dairy farms provides insights into their operational differences, as previously noted by Brkic et al. (2024), which can enable a comprehensive understanding of sustainable dairy production [6]. Additionally, it has been indicated that herd size does influence milk yield and quality, specifically, the fat and protein content, which is a critical area for optimising dairy farm productivity [46]. It was also observed in this study that larger herds yield significantly more milk per cow when compared with those in smaller-sized dairy farms. It can also be assumed that larger herds should benefit from economies of scale regarding infrastructure and bulk purchasing, which could lead to lower per-unit production costs [47]. However, the study of FADN data for Latvia in 2023 indicated that the largest farms (i.e., those with SO > 500 thousand EUR on average) experienced losses per year, when compared with smaller farms.
However, the relationship between herd size and milk quality varies; in particular, smaller farms tend to have higher fat indicators but a more significant deviation from the mean value. In comparison, larger farms have lower fat content with less variation, as shown in this study. Large farms may struggle to maintain consistent feed quality and individual animal health, which can influence the stability of fat and protein content in milk; for example, they try to focus on reducing feed purchase costs while optimising nutrient management. As noted by Holly et al. (2018), feed costs can make up a substantial part of total operating expenses [48]. Notably, feed costs typically represent the most significant single expense for dairy farms, often exceeding 50% of total operating costs; thus, it is essential—regardless of the size of the dairy farm—to maintain efficient feed management [49]. It has been established that the success of dairy farms largely depends on the breeds and productivity of cows, the farming conditions and technologies applied, as well as the quality of feeding and milking practices [50].
4.2. Environmental Impact and Sustainability
As yields and efficiency are crucial for a farm’s survival, it is equally important to evaluate the primary sources of environmental impacts in dairy production, with a particular focus on the milking process and feed production; that is, the processes that contribute most to the environmental footprint of the dairy industry [51]. In this study, how the impacts vary based on the size of farms was investigated. The results indicated a certain level of variability, with larger farms overall having a greater impact on the environment; however, contrasting results were obtained when the impact values were recalculated not per cow but per kilogram of milk, demonstrating that per kilogram of milk, large farms contribute least to environmental impacts. The decrease in the environmental effect per kilogram of milk is associated with the implementation of technologies and the increased efficiency of the system. At the same time, we also need to bear in mind that the lower the emissions, the more resources are used per hectare, which means the reductions are offset by the increases in productivity [52]. Accepting the specifics of the farms—including the strategies and the whole chain connected with the livestock industry—there is a need to generate a clear benchmark, which is developed to fit the different milk production scenarios of various regions, thus rejecting the “one-size-fits-all” approach and allowing for identification of the main impacts based on different production methods [53]. As previously noted, it is necessary to establish the size-specific contributions of farms to human health, ecosystem damage, and resource scarcity impacts [54], which was achieved in this research through an LCA based on the comparison of farms of various sizes. The analysis highlighted the primary areas of environmental impact and illustrated opportunities for targeted efforts to mitigate these impacts, enabling sustainable dairy farming [6]. Furthermore, CO2eq emissions were specifically calculated according to LCA and 2006 IPCC Guidelines methodologies, further comparing the three different sizes of dairy farm. Additionally, total direct GHG emissions were assessed, as well as emissions per kilogram of FPCM, to investigate the variations in efficiency between small, medium, and large dairy operations regarding their environmental performance. This type of analysis regarding the interactions between dairy farming practices and environmental outcomes provides a framework for informed decision-making, supporting the pursuit of more sustainable dairy agriculture [10].
The overall purpose of such framework is to identify potential interventions that could minimise environmental burdens while maintaining economic viability and the social acceptability of dairy production [55]. The quality and nutritional value of the feed given to dairy cattle have a very significant influence on the total environmental impact of a milk production farm. If the feed is of low quality or poorly digestible, the methane emissions from enteric fermentation will increase, as the cows will have to use more energy to digest the fibre. Besides alterations in the composition and proportion of feed or concentrate, fats can also be used as additives in dairy diets to decrease the emission of gases from the respiratory tract. On the other hand, a high-quality, high-energy feed will enhance digestion efficiency and lower methane emissions per litre of milk [10]. Additionally, high-protein diets increase nitrogen excretion, which is the primary source of ammonia and N2O emissions from manure. Precision feeding—that is, providing the right amount and type of feed according to animal’s nutritional needs—has been demonstrated to lower nitrogen emissions and to be beneficial from both environmental and economic perspectives [56]. An LCA-based study of an organic farm in Central Germany revealed that a diet based on grassland for cows with a low-input feeding regime—without maize silage and with limited concentrates— resulted in about 20% lower milk production, thus increasing emissions per kg of milk [57]. Therefore, the exploration of advanced feed practices, such as the use of different feed formulations, may significantly reduce the environmental impact per unit of milk produced, moving towards a more circular agricultural economy [58]. The dairy sector is recognised as a significant contributor to greenhouse gas emissions; therefore, it is necessary to examine the factors contributing to these emissions [59].
4.3. Balancing Productivity, Profitability, and Environmental Performance
The trade-offs between achieving high milk yields, economic viability, and lower environmental impact in the dairy industry are complex. In Latvia, it was observed that the highest milk yields per cow were achieved in large farms, which produce 47% of total milk in Latvia. Simultaneously, these farms had the lowest environmental impact and emissions per 1 kg of produced milk; however, the absolute largest farms experienced economic losses in 2023. While dairy production is essential for global nutrition, it faces significant environmental scrutiny [6]. Growing consumer demands, climate change, and global food security concerns necessitate a re-evaluation of traditional dairy management practices to enhance profitability and sustainability [60]. This re-evaluation should involve searching for strategies through which large farms may boost financial returns while reducing their ecological footprint. The policy and management implications for achieving sustainable intensification should also be examined [61]. Historically, improving productivity in ruminant systems, including dairy, has led to lower resource use and greenhouse gas emissions per unit product, mainly by diluting maintenance effects [9]. With respect to dairy production, high feed efficiency is key to minimising both feed costs and the negative impacts of milk production on the climate and environment. However, understanding of the relationships between feed efficiency, eating behaviour, and activity [62] remains limited. Achieving a balance between these factors is difficult, requiring the careful use of technology and management practices that maximise resource use without compromising animal welfare or economic stability [63]. Genomic selection and precise ration formulation can significantly improve the efficiency of high-performing herds, thus contributing to a lower environmental impact per unit of milk produced [64]. Nevertheless, despite these improvements, dairy systems continue to create environmental pressures, including direct GHG emissions from enteric fermentation, manure management, and feed production, as well as significant water and land usage [10]. On one hand, Salari et al. (2025) [55] argued that due to methodological variability and the much broader range of environmental impacts, the diversity of LCA studies rarely allows for direct comparisons. This level of complexity precludes any reasonable expectation of general conclusions across systems of production in a globally transferable way. Nonetheless, research confirms the importance of milk production in conventional and organic systems, being sustainable and decreasing the ecological burden, which is still possible if appropriate measures of productivity—especially best management practices and specific mitigation strategies—are applied.
The dimensions of a previous study focused on the carbon footprint in different parts of the world, such as the United Kingdom and Italy, were characterised by the researchers as broad. They noted that a broader LCA framework would drive the sustainability of environmental analysis, mainly given the resulting variation stemming from different farm management practices, reflected by factors such as feed digestibility, crude protein content, and environmental conditions [65,66]. Furthermore, farm efficiency causing environmental sustainability was the overall message of the study by Lovarelli et al. (2019) [67], who observed that the most efficient farms are not only the greenest, but also generate more revenue.
O’Brien et al. (2014) suggested that future surveys in Ireland should be conducted as broad-scale studies on larger, more diverse samples of commercial farms, with the purpose of assessing the performance of the full range of production systems and their environmental impacts [68]. On the other hand, researchers in Malta seem to think that alternative feeding strategies remain the only practical solutions if issues relating to energy requirements in processing and transportation are taken into account; they mainly referred to the replacement of protein sources, such as soybeans, due to the low energy cost of processing and the environmental consequences of transportation, making practical recommendations. It seems reasonable for most European countries to follow Proietti et al. (2016) in arguing that dependence on imported feed needs can reduce protein requirements, and that locally sourced materials are a good option for livestock feeding, thereby enabling sustainability [69].
4.4. Methodological Considerations
When comparing dairy production efficiency across different farm systems and genetic lines, accurately normalising for milk yield to a standard such as FPCM is essential. This comprehensive approach is critical as variation in the composition of milk—particularly the amount of fat and protein it contains—can affect the nutritional quality of the milk and how well it can be processed in factories. In this study, it was found that it is especially crucial to determine which FPCM formula to use, through a comparison of the FAO and IDF formulas. The FAO formula resulted in more conservative results compared with that of the IDF; in the case of Latvia, the IDF showed 24–26% higher FPCM results. Notably, these variations influence the environmental implications per unit of functional output [70]. This adjustment also improved the accuracy of the LCA, as obtaining an environmental product measure involves standardising the functional unit. Standardising functional units allows for appropriate comparisons regarding environmental implications, such as greenhouse gas emissions, between different production regimes [64]. This generic methodology distinguishes specific processes, such as feed production, enteric fermentation, and waste management, which significantly affect the environment collectively. This methodology is also expected to help in planning specific reductions [71]. In many situations, the available datasets do not have enough information and/or lack scope, thus limiting the accuracy of assessments. As such, relevant collections of data need to be improved [55].
4.5. Policy Implications and Future Research Directions
The differences in how LCA studies have conceptualised, allocated, and framed (i.e., regarding functional units) make it difficult to compare the results of such studies [16,55]. The issues of differences in conceptualisation make it challenging to provide harmonised data and develop effective policy. Sustainable dairy production practices must therefore be evaluated in terms of their environmental benefits, cost-effectiveness, added value generation, and impacts throughout the supply chain, especially with varying herd composition and levels of milk production [58,72]. Uncertainties in current biodiversity quantification measures within LCAs also highlight the need for less complex frameworks as well as readily applicable tools [13,73].
Future research should focus on several directions: (1) Developing multi-criteria instruments that integrate environmental, economic, and societal elements of dairy systems [74]; (2) standardising and articulating LCA techniques, especially biodiversity concepts and functional units, to facilitate comparison between studies; (3) exploring the optimisation of feed, genetics, and waste management technologies as measures for enhancing efficiency, reducing methane, and limiting nutrient losses [66,71]; (4) assessing the abatement and cost-saving potential of alternative means of producing milk under a range of regional and market conditions; and (5) conducting longitudinal LCAs to track the improvement in GHG efficiency per unit of milk under increasing absolute emissions due to the increasing global demand for dairy products.
Given the consideration that livestock farming occupies 70–80% of agricultural land and contributes significantly to methane emissions [51,75], effective and harmonised LCA practices will be key to achieving climate objectives globally. As the demand for dairy is expected to grow by 70% by 2050, policies should be developed based on studies that aim to maintain production while reducing emissions by up to 80% to mitigate the impacts of climate change [58,76].
5. Conclusions
In Latvia, milk production is dominated by a large number of small farms (1–50 cows), while medium- (51–200 cows) and large-sized farms (201+ cows) produce the majority of milk. The most productive yields per cow (approximately 11,200 kg/year) and consistent milk quality are found on large farms, whereas small farms exhibit higher variability and higher fat content. Economically, data from 2023 reflected robust pressures across all farm sizes. Large farms generated as much as 90 times more gross income than small farms; however, they still reported a negative net income due to high production costs. In contrast, small- and medium-sized farms fared better regarding net-to-gross income ratios, despite lower yields.
Meanwhile, LCA-based environmental assessments indicate that the most significant impacts were on damage of human health, followed by damage to ecosystems, and damage to resource availability, particularly due to the consumption of fossil and mineral resources, particulate matter formation, and global warming. Environmental burdens were found to differ most significantly between small/medium and large farms, with large farms incurring larger absolute burdens. Milking was the most significant contributor (34–40% of total damage source), followed by feed production, for which hay dominates on small farms and alfalfa silage on large farms.
When comparing the production of direct greenhouse gas emissions, the most significant absolute CO2eq contributors were the large farms; however, they were found to have the lowest emission intensity per kilogram of FPCM of all farms. Emissions identified via LCA, considering feed, were 4–5 times greater than those obtained via the 2006 IPCC Guidelines methodology, illustrating the need for careful consideration of the system boundary selection and methodological approach.
Generally, while being more productive, large farms in Latvia are characterised by higher yields and efficiencies per unit of milk; however, they are also the most vulnerable economically and carry high environmental costs. Their smaller counterparts are less productive in terms of emissions and yield per cow but possess greater economic resilience due to their size. These findings highlight key trade-offs between productivity, profitability, and environmental impacts, and indicate the milking operation and feed composition as prime areas for effective mitigation in this regard.
Further research is necessary to advance the development of coupled multi-criteria tools, harmonise LCA methods, and improve feeding approaches to enhance the sustainability of the dairy industry in response to the growing global demand for dairy. Harmonised LCA practices need to be promoted by policymakers, who should encourage innovations to improve the efficiency of this sector while minimising the associated adverse environmental impacts.
Funding
The research was promoted with the support of the project Strengthening Institutional Capacity for Excellence in Studies and Research at LBTU (ANM1), project No. 5.2.1.1.i.0/2/24/I/CFLA/002, sub-project No. 3.2.-10/190 (AF7).
Institutional Review Board Statement
Not applicable.
Data Availability Statement
Pilvere, A. Datasets for Efficiency and Emissions Performance in Latvian Dairy Farming: An LCA-Based Comparison Across Farm Sizes. 2025. Available online: https://dv.dataverse.lv/dataset.xhtml?persistentId=doi:10.71782/DATA/ZRTIQV, DataverseLV (accessed on 10 September 2025).
Conflicts of Interest
The author declares no conflicts of interest.
Abbreviations
The following abbreviations are used in this manuscript:
| CO2 | carbon dioxide |
| CH4 | methane |
| CO2eq | carbon dioxide equivalent |
| EU | European Union |
| EUR | euro |
| FADN | The Farm Accounting Data Network |
| FAO | The United Nations Food and Agriculture Organization |
| FPCM | fat- and protein-corrected milk |
| GHG | greenhouse gas |
| IDF | International Dairy Federation |
| IPCC | The Intergovernmental Panel on Climate Change |
| ISO | International Organization for Standardization |
| kg | kilogram |
| LCA | Life cycle assessment |
| LCI | life cycle inventory |
| LLKC | Latvian Rural Advisory and Training Centre |
| N2O | nitrous oxide |
| SO | Standard Output |
| TMR | total mixed ratio |
Appendix A
Table A1.
The type of fodder and ration in small, medium, and large farms, kg dry matter, daily in Latvia [31,32,33].
Table A1.
The type of fodder and ration in small, medium, and large farms, kg dry matter, daily in Latvia [31,32,33].
| Indicators/Number of Cows per Herd | 1–50 | 51–200 | ≥201 | Total/Overall Average |
|---|---|---|---|---|
| Hay | 5.70 | 2.47 | 2.19 | 3.46 |
| Haylage/Grass silage | 6.20 | 7.02 | 5.80 | 6.34 |
| Legume and grass silage | 9.00 | 8.61 | 4.12 | 7.24 |
| Corn silage | 0.55 | 2.43 | 3.80 | 2.26 |
| Straw | 0.75 | 0.63 | 0.49 | 0.62 |
| Roots | 1.40 | 0.00 | 0.00 | 0.47 |
| Fodder | 4.05 | 4.31 | 3.49 | 3.95 |
| Molasses | 0.35 | 0.33 | 0.45 | 0.38 |
| Expeller and meal | 0.65 | 1.59 | 1.28 | 1.17 |
| Salt | 0.10 | 0.09 | 0.08 | 0.09 |
| Minerals and vitamins | 0.20 | 0.19 | 0.18 | 0.19 |
| Total mixed ratio (TMR) | 10.00 | 21.72 | 24.77 | 18.83 |
Table A2.
Composition of Total Mixed Ratio feed per cow, kg, and its weight in total TMR feed in Latvia [33].
Table A2.
Composition of Total Mixed Ratio feed per cow, kg, and its weight in total TMR feed in Latvia [33].
| Indicators | TMR per Day in kg per Cow | % of Total TMR |
|---|---|---|
| Alfalfa grass silage | 31 | 61% |
| Maize silage | 7 | 14% |
| Wheat | 3 | 6% |
| Barley | 3 | 6% |
| Maize chop | 1.5 | 3% |
| Soy expellers | 2.7 | 5% |
| Molasses | 0.5 | 1% |
| Mineral supplements | 0.18 | 0% |
| Fodder chalk | 0.2 | 0% |
| Sodium | 0.1 | 0% |
| Salt | 0.05 | 0% |
| Water | 2 | 4% |
| Total | 51.23 | 100% |
Table A3.
Nutrient provision in feed rations in Latvia [31].
Table A3.
Nutrient provision in feed rations in Latvia [31].
| Nutrient Provision in Feed Rations/ Number of Cows per Herd | 1–50 | 51–200 | >201 | Total/ Overall Average |
|---|---|---|---|---|
| Dry matter, kg | 18.8 | 23.25 | 25.04 | 22.36 |
| Crude protein, g | 2565.295 | 2681.45 | 3322.59 | 2856.44 |
| Crude fats, g | 565.44 | 698.15 | 730.82 | 664.80 |
| Crude fibber, kg | 5.7 | 5.67 | 5.63 | 5.67 |
| Nitrogen-free extract, kg | 10.4 | 10.60 | 13.33 | 11.44 |
References
- Muska, A.; Pilvere, I.; Viira, A.-H.; Muska, K.; Nipers, A. European Green Deal Objective: Potential Expansion of Organic Farming Areas. Agriculture 2025, 15, 1633. [Google Scholar] [CrossRef]
- Peng, B.; Melnikiene, R.; Baležentis, T.; Agnusdei, G.P. Structural dynamics and sustainability in the agricultural sector: The case of the European Union. Agric. Food Econ. 2024, 12, 31. [Google Scholar] [CrossRef]
- Bórawski, P.; Pawlewicz, A.; Parzonko, A.; Harper, J.K.; Holden, L. Factors Shaping Cow’s Milk Production in the EU. Sustainability 2020, 12, 420. [Google Scholar] [CrossRef]
- Pilvere, I.; Upite, I.; Muska, A.; Zdanovskis, K.; Nipers, A.; Janmere, L. Resilience of Milk Supply Chains during and after the COVID-19 Crisis in Latvia. Rural Sustain. Res. 2021, 45, 53–64. [Google Scholar] [CrossRef]
- Chatellier, V.; Delattre, F.; Rat-Aspert, O. Milk Price in Savoy and Cheese Chain. HAL (Le Centre Pour La Communication Scientifique Directe). 2006. Available online: https://hal.archives-ouvertes.fr/hal-02822243 (accessed on 20 June 2025).
- Brkić, I.; Puvača, N. Economic and Ecological Sustainability of Dairy Production. J. Agron. Technol. Eng. Manag. (JATEM) 2024, 7, 1088. [Google Scholar] [CrossRef]
- Bojovic, M.; McGregor, A. A review of megatrends in the global dairy sector: What are the socioecological implications? Agric. Hum. Values 2022, 40, 373. [Google Scholar] [CrossRef]
- Hynes, D.; Stergiadas, S.; Yan, T. Summaries. Adv. Anim. Biosci. 2016, 7, 1. [Google Scholar] [CrossRef]
- Capper, J.L.; Bauman, D.E. The Role of Productivity in Improving the Environmental Sustainability of Ruminant Production Systems. Annu. Rev. Anim. Biosci. 2012, 1, 469. [Google Scholar] [CrossRef] [PubMed]
- Peterson, C.B.; Mitloehner, F.M. Sustainability of the Dairy Industry: Emissions and Mitigation Opportunities. Front. Anim. Sci. 2021, 2, 760310. [Google Scholar] [CrossRef]
- Slade, P.; Hailu, G. Efficiency and regulation: A comparison of dairy farms in Ontario and New York State. J. Product. Anal. 2015, 45, 103. [Google Scholar] [CrossRef]
- Latruffe, L.; Desjeux, Y.; Hanitravelo, G.L.J.; Hennessy, T.; Bockstaller, C.; Dupraz, P.; Finn, J.A. Tradeoffs Between Economic, Environmental and Social Sustainability: The Case of a Selection of European Farms. HAL (Le Centre Pour La Communication Scientifique Directe). 2016. Available online: https://hal.archives-ouvertes.fr/hal-01611416 (accessed on 4 July 2025).
- Wilfart, A.; Baillet, V.; Balaine, L.; de Otálora, X.D.; Dragoni, F.; Król, D.; Frątczak-Müller, J.; Rychła, A.; Rodriguez, D.G.P.; Breen, J.; et al. DEXi-Dairy: An ex post multicriteria tool to assess the sustainability of dairy production systems in various European regions. Agron. Sustain. Dev. 2023, 43, 82. [Google Scholar] [CrossRef]
- Koutouzidou, G.; Ragkos, A.; Theodoridis, A.; Arsenos, G. Entrepreneurship in Dairy Cattle Sector: Key Features of Successful Administration and Management. Land 2022, 11, 1736. [Google Scholar] [CrossRef]
- Tamburini, E.; Pedrini, P.; Marchetti, M.G.; Fano, E.A.; Castaldelli, G. Life Cycle Based Evaluation of Environmental and Economic Impacts of Agricultural Productions in the Mediterranean Area. Sustainability 2015, 7, 2915. [Google Scholar] [CrossRef]
- McClelland, S.C.; Arndt, C.; Gordon, D.R.; Thoma, G. Type and number of environmental impact categories used in livestock life cycle assessment: A systematic. Livest. Sci. 2018, 209, 39. [Google Scholar] [CrossRef]
- Milani, F.; Nutter, D.W.; Thoma, G. Invited review: Environmental impacts of dairy processing and products: A review. J. Dairy Sci. 2011, 94, 4243. [Google Scholar] [CrossRef]
- SLLC Latvian Environment, Geology and Meteorology Centre (LVMEO). Summary of the 2025 Greenhouse Gas Inventory. Available online: https://videscentrs.lvgmc.lv/lapas/informacija-par-latvijas-seg-emisijam (accessed on 8 September 2025). (In Latvian).
- IPCC. 2006 IPCC Guidelines for National Greenhouse Gas Inventories; Eggleston, H.S., Buendia, L., Miwa, K., Ngara, T., Tanabe, K., Eds.; Prepared by the National. Greenhouse Gas Inventories Programme; IGES: Hayama, Japan, 2006; Available online: https://www.ipcc-nggip.iges.or.jp/public/2006gl/vol1.html (accessed on 17 July 2025).
- Farm Accounting Data Network (FADN). 2023 Data. Available online: https://sudat.arei.lv/Login.aspx?ReturnUrl=%2f (accessed on 14 June 2025).
- Rural Support Service (RSS). 2024 Data. Monitoring Data of Herds in 2023/2024. Available online: https://registri.ldc.gov.lv/lv/parraudziba (accessed on 11 August 2025).
- International Dairy Federation (IDF). A Common Carbon Footprint Approach for Dairy Sector: The IDF Guide to Standard Life Cycle Assessment Methodology. Bulletin of the International Dairy Federation 479/2015. Available online: https://www.fil-idf.org/wp-content/uploads/2016/09/Bulletin479-2015_A-common-carbon-footprint-approach-for-the-dairy-sector.CAT.pdf (accessed on 4 August 2025).
- United Nations Food and Agriculture Organization (FAO). Greenhouse Gas Emissions from the Dairy Sector: A Life Cycle Assessment. 2007. Available online: https://www.fao.org/4/k7930e/k7930e00.pdf (accessed on 11 August 2025).
- SaimnieksLV Portal. Amount of Milk Produced by Cows of Different Sizes in One Day. By LLKC on 02.03.2022. Available online: http://saimnieks.lv/raksts/dazada-auguma-izmera-govju-razotais-piena-daudzums-viena-diena#:~:text=Vid%C4%93jais%20piena%20govju%20produkt%C4%ABv%C4%81s%20dz%C4%ABves,5%20l%C4%ABdz%206%2C5%20gadiem (accessed on 5 September 2025). (In Latvian).
- ISO 14044:2006; Environmental Management—Life Cycle Assessment—Requirements and Guidelines. 4.3.4.2. Section. International Organization for Standardization (ISO): Geneva, Switzerland, 2006.
- European Commission (EC). Annex, I. Product Environmental Footprint Method. 2021. Available online: https://environment.ec.europa.eu/system/files/2021-12/Annexes%201%20to%202.pdf (accessed on 21 August 2025).
- PRé Sustainability, SimaPro Software 10.2.0.2., Using Database Ecoinvent 3.0, Cut-Off by Classification—System, and Using Method ReCiPe 2016 Endpoint (H) V1.11/World (2010) H/A. Available online: https://simapro.com/ (accessed on 5 August 2025).
- ISO 14072:2024; Environmental Management—Life Cycle Assessment—Requirements and Guidance for Organizational Life Cycle Assessment. International Organization for Standardization (ISO): Geneva, Switzerland, 2024.
- Buxel, H.; Esenduran, G.; Griffin, S. Strategic sustainability: Creating business value with life cycle analysis. Bus. Horiz. 2014, 58, 109. [Google Scholar] [CrossRef]
- ISO 14040:2006; Environmental Management—Life Cycle Assessment—Principles and Framework. International Organization for Standardization (ISO): Geneva, Switzerland, 2006.
- Degola, L.; Cielava, L.; Trupa, A.; Aplocina, E. Feed Rations in Different Size Dairy Farms. Scientific Practical Conference „LĪDZSVAROTA LAUKSAIMNIECĪBA”, 25.–26.02.2016., LLU, Jelgava, Latvia. Available online: https://llufb.llu.lv/conference/lidzsvar_lauksaim/2016/Latvia-lidzsvarota-lauksaimnieciba2016-161-168.pdf (accessed on 2 August 2025). (In Latvian).
- Holstein Foundation Inc. Milking and Lactation. 2017. Available online: https://www.holsteinfoundation.org/pdf_doc/workbooks/Milking_Lactation_Workbook.pdf (accessed on 16 August 2025).
- Latvian Rural Advisory and Training Centre (LLKC). The Role of Dairy Cow Nutrition in Changing the Dry Matter Content of Raw Milk. 21 November 2019. Available online: https://arhivs.llkc.lv/lv/nozares/lopkopiba/slaucamo-govju-edinasanas-nozime-svaigpiena-sausnas-satura-izmaina (accessed on 18 August 2025). (In Latvian).
- European Commission. Green Forum, Life Cycle Assessment & the EF Methods, Comprehensive Coverage of Impacts. 2025. Available online: https://green-forum.ec.europa.eu/green-business/environmental-footprint-methods/life-cycle-assessment-ef-methods_en (accessed on 11 August 2025).
- Frazier, R.S.; Jin, E.; Ajay Kumar, A. Life Cycle Assessment of Biochar versus Metal Catalysts Used in Syngas Cleaning. Energies 2015, 8, 621–644. [Google Scholar] [CrossRef]
- Popluga, D. Review of the Implementation of the Scientific Research Project “Adjustment of Marginal Abatement Cost Curves (MACC) of Latvian Agricultural Greenhouse Gas and Ammonia Emissions, as Well as CO2 Sequestration (in Arable land and Grassland) for Use in Agricultural, Environmental and Climate Policy-Making”. 2019. Available online: https://www.lbtu.lv/sites/default/files/files/projects/Popluga_19-00-SOINV05-000018_1.pdf (accessed on 22 August 2025). (In Latvian).
- Trading Economics. Latvia’s Average Temperature. 2025. Available online: https://tradingeconomics.com/latvia/temperature (accessed on 20 August 2025).
- Latvia’s National Inventory Report Greenhouse Gas Emissions in Latvia from 1990 to 2021 in Common Reporting Format (CRF). Riga, 2023; 489p. Available online: https://unfccc.int/documents/627724 (accessed on 15 August 2025).
- ISO 14067/2018; Greenhouse Gases—Carbon Footprint of Products—Requirements and Guidelines for Quantification Standards. International Organization for Standardization (ISO): Geneva, Switzerland, 2018.
- Statistics Netherlands. What Is the Scale of Greenhouse Gas Emissions? 2025. Available online: https://www.cbs.nl/en-gb/dossier/greenhouse-gas-emissions/what-is-the-scale-of-greenhouse-gas-emissions- (accessed on 4 September 2025).
- Statistical Database. Business Sectors: Agriculture. Livestock. LAL090. Number of Livestock and Poultry at the End of the Year (Thousand Heads) 1915–2024. Available online: https://data.stat.gov.lv/pxweb/en/OSP_PUB/START__NOZ__LA__LAL/LAL090/ (accessed on 2 September 2025).
- Statistical Database. Business Sectors: Agriculture. Livestock. LAL070. Livestock Productivity 1940–2024. Available online: https://data.stat.gov.lv/pxweb/en/OSP_PUB/START__NOZ__LA__LAL/LAL070/ (accessed on 2 September 2025).
- Pilvere, A. Datasets for Efficiency and Emissions Performance in Latvian Dairy Farming: An LCA-Based Comparison Across Farm Sizes. 2025; DataverseLV. Available online: https://dv.dataverse.lv/dataset.xhtml?persistentId=doi:10.71782/DATA/ZRTIQV (accessed on 10 September 2025).
- Central Statistical Bureau of Latvia. Agriculture of Latvia. Collection of Statistics. 2025; 84p. Available online: https://admin.stat.gov.lv/system/files/publication/2025-06/Nr_13_Latvijas_Lauksaimnieciba_2025_%2825_00%29_LV_EN_1.pdf (accessed on 31 August 2025).
- PRé Sustainability. SimaPro Database Manual, Methods Library. 2022. Available online: https://simapro.com/wp-content/uploads/2022/07/DatabaseManualMethods.pdf (accessed on 19 August 2025).
- Zanon, T.; Hörtenhuber, S.; Fichter, G.; Peratoner, G.; Zollitsch, W.; Gatterer, M.; Gauly, M. Effect of management system and dietary seasonal variability on environmental efficiency and human net food supply of mountain dairy farming systems. J. Dairy Sci. 2025, 108, 597–610. [Google Scholar] [CrossRef] [PubMed]
- Fariña, S.; Chilibroste, P. Opportunities and challenges for the growth of milk production from pasture: The case of farm systems in Uruguay. Agric. Syst. 2019, 176, 102631. [Google Scholar] [CrossRef]
- Holly, M.A.; Kleinman, P.J.A.; Bryant, R.B.; Bjorneberg, D.L.; Rotz, C.A.; Baker, J.M.; Boggess, M.; Bräuer, D.; Chintala, R.; Feyereisen, G.W.; et al. Short communication: Identifying challenges and opportunities for improved nutrient management through the USDA’s Dairy Agroecosystem Working Group. J. Dairy Sci. 2018, 101, 6632. [Google Scholar] [CrossRef]
- Gillespie, J.; Njuki, E.; Terán, A. Structure, costs, and technology used on U.S. dairy farms. Econ. Res. Serv. 2024, 334, 34. [Google Scholar] [CrossRef]
- Nipers, A.; Pilvere, I.; Valdovska, A.; Proskina, L. Assessment of Key Aspects of Technologies and Cow farming for Milk Production in Latvia. In Proceedings of the 15th International Scientific Conference “Engineering for Rural Development”, Jelgava, Latvia, 25–27 May 2016; pp. 175–181. Available online: https://www.iitf.lbtu.lv/conference/proceedings2016/Papers/N029.pdf (accessed on 15 October 2025).
- Singh, A.B.; Bhakar, V.; Gaurav, G.; Khandelwal, C.; Sarkar, P.K.; Singh, H.; Dangayach, G.S. Environmental sustainability of milk production: A comparative environmental impact analysis and sustainability evaluation. Front. Sustain. 2024, 5, 1352572. [Google Scholar] [CrossRef]
- Herron, J.; O’Brien, D.; Shallo, L. Life cycle assessment of pasture-based dairy production systems: Current and future performance. J. Dairy Sci. 2022, 105, 5849–5869. Available online: https://www.journalofdairyscience.org/article/S0022-0302%2822%2900305-8/fulltext (accessed on 15 October 2025). [CrossRef] [PubMed]
- Zanni, S.; Roccaro, M.; Bocedi, F.; Peli, A.; Bonoli, A. LCA to Estimate the Environmental Impact of Dairy Farms: A Case Study. Sustainability 2022, 14, 6028. [Google Scholar] [CrossRef]
- Kwon, H.-C.; Jung, H.S.; Kothuri, V.; Han, S.G. Current status and challenges for cell-cultured milk technology: A systematic review. J. Anim. Sci. Biotechnol. 2024, 15, 81. [Google Scholar] [CrossRef]
- Salari, F.; Marconi, C.; Sodi, I.; Altomonte, I.; Martini, M. Environmental Sustainability of Dairy Cattle in Pasture-Based Systems vs. Confined Systems. Sustainability 2025, 17, 3976. [Google Scholar] [CrossRef]
- Chase, L.E.; Fortina, R. Environmental and Economic Responses to Precision Feed Management in Dairy Cattle Diets. Agriculture 2023, 13, 1032. [Google Scholar] [CrossRef]
- Eisert, J.; Sahraei, A.; Knob, D.A.; Lambertz, C.; Zollitsch, W.; Hörtenhuber, S.; Kral, I.; Breuer, L.; Gattinger, A. Transforming the feeding regime towards low-input increases the environmental impact of organic milk production on a case study farm in central Germany. Int. J. Life Cycle Assess. 2025, 30, 79–92. [Google Scholar] [CrossRef]
- Reddy, P.R.K.; Kumar, D.; Rao, E.R.; Seshiah, C.V.; Sateesh, K.; Rao, K.A.; Reddy, Y.P.K.; Hyder, I. Environmental sustainability assessment of tropical dairy buffalo farming vis-a-vis sustainable feed replacement strategy. Sci. Rep. 2019, 9, 16745. [Google Scholar] [CrossRef]
- Ni, H.; Zeng, H.; Liu, Z.; Li, W.; Miao, S.; Yang, A.; Wang, Y. Towards decarbonizing the supply chain of dairy industry: Current practice and emerging strategies. Carbon Neutrality 2025, 4, 8. [Google Scholar] [CrossRef]
- Silvi, R.; Pereira, L.G.R.; Paiva, C.A.V.; Tomich, T.R.; Teixeira, V.A.; Sacramento, J.P.; Ferreira, R.; Coelho, S.G.; Machado, F.S.; Campos, M.M.; et al. Adoption of Precision Technologies by Brazilian Dairy Farms: The Farmer’s Perception. Animals 2021, 11, 3488. [Google Scholar] [CrossRef]
- Bhat, R.; Infascelli, F. The Path to Sustainable Dairy Industry: Addressing Challenges and Embracing Opportunities. Sustainability 2025, 17, 3766. [Google Scholar] [CrossRef]
- Thorup, V.; Munksgaard, L.; Terré, M.; Henriksen, J.; Weisbjerg, M.; Løvendahl, P. The relationship between feed efficiency and behaviour differs between lactating Holstein and Jersey cows. J. Dairy Res. 2023, 90, 257–260. [Google Scholar] [CrossRef]
- Clasen, J.; Fikse, W.F.; Ramin, M.; Lindberg, M. Effects of herd management decisions on dairy cow longevity, farm profitability, and emissions of enteric methane—A simulation study of milk and beef production. Animal 2023, 18, 101051. [Google Scholar] [CrossRef] [PubMed]
- Britt, J.H.; Cushman, R.A.; Dechow, C.D.; Dobson, H.; Humblot, P.; Hutjens, M.F.; Jones, G.; Mitloehner, F.M.; Ruegg, P.L.; Sheldon, I.M.; et al. Review: Perspective on high-performing dairy cows and herds. Animal 2021, 15, 100298. [Google Scholar] [CrossRef]
- March, M.D.; Hargreaves, P.; Sykes, A.J.; Rees, R.M. Effect of Nutritional Variation and LCA Methodology on the Carbon Footprint of Milk Production from Holstein Friesian Dairy Cows. Front. Sustain. Food Syst. 2021, 5, 588158. [Google Scholar] [CrossRef]
- Ferronato, G.; Tobanelli, N.; Bani, P.; Cattaneo, L. Carbon Footprint Assessment of Dairy Milk and Grana Padano PDO Cheese and Improvement Scenarios: A Case Study in the Po Valley (Italy). Animals 2025, 15, 811. [Google Scholar] [CrossRef]
- Lovarelli, D.; Bava, L.; Zucali, M.; D’Imporzano, G.; Adani, F.; Tamburini, A.; Sandrucci, A. Improvements to dairy farms for environmental sustainability in Grana Padano and Parmigiano Reggiano production systems. Ital. J. Anim. Sci. 2019, 18, 1035–1048. [Google Scholar] [CrossRef]
- O’Brien, D.; Brennan, P.; Humphreys, J.; Ruane, E.M.; Shalloo, L. An appraisal of carbon footprint of milk from commercial grass-based dairy farms in Ireland according to a certified life cycle assessment methodology. Int. J. Life Cycle Assess. 2014, 19, 1469. [Google Scholar] [CrossRef]
- Proietti, L.; Pauselli, M.; Paolotti, L.; Attard, G. Environmental impact evaluation of dairy farms through life cycle assessment: A case study in Malta. In Proceedings of the 10th Convegno dell’ Associazione Rete Italiana LCA 2016, Ravenna, Italy, 23–24 June 2016; pp. 246–255. Available online: https://backend.orbit.dtu.dk/ws/portalfiles/portal/126944800/ATTI_RETE_LCA_2016.pdf (accessed on 15 October 2025).
- Mondière, A.; Corson, M.S.; Auberger, J.; Durant, D.; Foray, S.; Glinec, J.-F.; Green, P.; Novak, S.; Signoret, F.; Werf, H.v.D. Trade-offs between higher productivity and lower environmental impacts for biodiversity-friendly and conventional cattle-oriented systems. Agric. Syst. 2024, 213, 103798. [Google Scholar] [CrossRef]
- Triky, S.; Kissinger, M. An Integrated Analysis of Dairy Farming: Direct and Indirect Environmental Interactions in Challenging Bio-Physical Conditions. Agriculture 2022, 12, 480. [Google Scholar] [CrossRef]
- Nipers, A.; Krieviņa, A.; Pilvere, I. Projecting Value Added in Agriculture in Latvia. In Proceedings of the 17th International Scientific Conference “En-gineering for Rural Development”, Jelgava, Latvia, 23–25 May 2018; Volume 17, pp. 1084–1090. [Google Scholar] [CrossRef]
- Hamelin, L.; Wenzel, H. Methodological aspects of environmental assessment of livestock production by LCA (Life Cycle Assessment). In Proceedings of the IX International Livestock Environment Symposium (ILES IX), Valencia, Spain, 8–12 July 2023; American Society of Agricultural and Biological Engineers: St. Joseph, MI, USA, 2012. ILES12-0945. [Google Scholar] [CrossRef]
- Díaz de Otálora, X.; del Prado, A.; Dragoni, F.; Estellés, F.; Amon, B. Evaluating Three-Pillar Sustainability Modelling Approaches for Dairy Cattle Production Systems. Sustainability 2021, 13, 6332. [Google Scholar] [CrossRef]
- Neethirajan, S. Innovative Strategies for Sustainable Dairy Farming in Canada amidst Climate Change. Sustainability 2023, 16, 265. [Google Scholar] [CrossRef]
- Berton, M.; Bittante, G.; Sturaro, E.; Gallo, L. Thirty years of global warming potential evolution for the Italian dairy cow sector measured by two different metrics. Ital. J. Anim. Sci. 2024, 23, 1002. [Google Scholar] [CrossRef]


Disclaimer/Publisher’s Note: The statements, opinions and data contained in all publications are solely those of the individual author(s) and contributor(s) and not of MDPI and/or the editor(s). MDPI and/or the editor(s) disclaim responsibility for any injury to people or property resulting from any ideas, methods, instructions or products referred to in the content. |
© 2025 by the author. Licensee MDPI, Basel, Switzerland. This article is an open access article distributed under the terms and conditions of the Creative Commons Attribution (CC BY) license (https://creativecommons.org/licenses/by/4.0/).