Article

Study on Shutdown Process of Agricultural Irrigation Pump Device

1
College of Hydraulic Science and Engineering, Yangzhou University, Yangzhou 225009, China
2
Zhenjiang Engineering Survey, Design and Research Institute Co., Ltd., Zhenjiang 212003, China
3
Yangzhou Port and Waterway Career Development Center, Yangzhou 225000, China
*
Author to whom correspondence should be addressed.
Agriculture 2025, 15(21), 2241; https://doi.org/10.3390/agriculture15212241
Submission received: 22 September 2025 / Revised: 22 October 2025 / Accepted: 24 October 2025 / Published: 28 October 2025
(This article belongs to the Section Agricultural Technology)

Abstract

To improve shutdown safety for agricultural irrigation pumping stations, this study investigates the synchronous and asynchronous shutdown processes of a pump device using numerical simulations validated by model tests. The results show that during the synchronous shutdown process, vortices appear on the inside of gate as its opening decreases, and their ranges expand accordingly. When the gate is 90% closed, negative pressure zones emerge in the outlet passage. As the gate continues to close, the strength and range of negative pressure zones keep expanding, and air is drawn into the outlet passage. After the gate is fully closed, the water flow starts reciprocating motion with strength attenuation due to inertia and water pressure. Compared with the synchronous shutdown method, the asynchronous shutdown-F1 to F4 achieved significant reductions results: the maximum reverse rotation rate decreased by 17.74%, 39.59%, 59.18%, and 83.35%, respectively, while the maximum reverse volumetric flow rate decreased by 17.32%, 38.45%, 59.20%, and 79.19%, respectively. Furthermore, in asynchronous shutdown-F4, no negative pressure occurs in the outlet passage, even if the gate closes suddenly. Therefore, the asynchronous shutdown method is a safer alternative for irrigation pumping stations. This study proposes more appropriate shutdown methods for pumping stations, which has significant practical value.

1. Introduction

In high-standard farmland construction projects, the pumping station is a crucial component which ensures an adequate water supply for agricultural irrigation. Horizontal axial flow pump devices characterized by large volumetric flow rate and low head are commonly employed in irrigation and water transfer projects of the main canal in agricultural irrigation districts [1].
At present, the research on agricultural irrigation pump devices mainly focuses on hydraulic loss [2], cavitation [3], pressure pulsation [4], stall condition [5], and so on. However, few studies investigate the transition process of pump devices. During the shutdown process of the pump device, the water flow in the passage gradually reverses, and the pump starts to rotate in reverse. The subsequent closure of the gate can induce water hammer in the passage [6]. Furthermore, as some pumping stations utilize photovoltaic systems [7] for power, the instability of solar generation can lead to frequent pump starts and stops. Therefore, ensuring a safe shutdown transition process is critical, as it is a fundamental prerequisite for securing agricultural water supply and achieving stable harvests in irrigation districts.
The study of the shutdown transition process in pump devices primarily employs one-dimensional and three-dimensional numerical methods [8]. Some scholars [9,10,11,12] have established mathematical models for the dynamic characteristics of pumping station shutdown and pump conditions, conducting one-dimensional study of the shutdown transition process. Hu [13] and Xu [14] utilized a customized version of the Flowmaster software to convert a three-dimensional model into one dimension for the transition process study, which reduces the calculation cost. Ding [15] employed the Matlab simulation module to model the shutdown transition process of a low-head pump device and simulated its main hydraulic parameters. Xia [16] and Jiao [17,18] utilized FLUENT dynamic mesh technology and User-Defined Function (UDF) macro to analyze the characteristics of a pump device during normal shutdown, concluding that the rapid gate should be closed as quickly as possible in practice. Li [19] and Man [20] applied the entropy production theory to investigate the energy loss mechanism in the pump runaway process. Yang [21] applied the dynamic mesh technology combined with a Volume of Fluid (VOF) multiphase model to simulate the shutdown transition process of the vertical axial flow pump device with rapid gate, specifically studying the effect of an overflow hole. Luo [22] utilized a one-dimensional method to calculate the water hammer pressure in the pipeline when the pump is stopped, while Fan [23] investigated the change in pump rotation rate and pressure behind the valve when the pump was stopped in a high-head water conveyance system. Yang [24] utilized the HAMMER software to analyze potential abnormal water hammer conditions and assessed the pressure loads on pumps, valves, and pipelines. Zhong [25] utilized a VOF model to simulate the transition process of air–water two-phase flow in a centrifugal pump, analyzing the variations in gas phase and pressure in the suction pipe and volute. Kan [26] and Zhao [27] set up the free water surface of the inlet and outlet sump to study the pump transition process and determined the feasibility of this approach.
Air vents in the outlet passages of pumping stations are known to effectively mitigate the water hammer effect [28,29]. However, a three-dimensional analysis of the internal flow during pump shutdown in the presence of air vents remains unexplored. To address this research gap, this study employs FLUENT software to simulate the shutdown transition process of a pump device under the influence of air vents. The simulation utilizes UDF and dynamic mesh technology [30] to simulate the gate closure process, while the VOF is adopted to capture the gas–liquid flow. The study analyzes the characteristics of the pump, including its volumetric flow rate, rotation rate, axial force, and torque during the shutdown process, as well as the evolution of pressure, air-water two-phase flow, and water flow state in the passage. A flowchart of the study is provided in Figure 1.

2. Materials and Methods

2.1. Governing Equation

The continuity equation for the pump device during the shutdown transition process is as follows:
ρ t + ( ρ u i ) x i = 0
where ui is the velocity component of each direction, m/s.
The momentum equation for the pump device during shutdown transition process is as follows:
( ρ u i ) t + ( ρ u i u j ) x j = p x i + τ i j x j + F i
where p is the time average pressure, Pa; τij is the stress tensor; and Fi is the volumetric force acting on the fluid.
Numerical simulation method adopts the Shear Stress Transport (SST) k-ω turbulence model. This turbulence model is widely used in the field of rotating machinery. The SST k-ω model combines the standard k-ω model in the near-wall region and the standard k-ε model in other regions through a mixed-function approach. The governing equations for the SST k-ω model are as follows:
( ρ k ) t + ( ρ k u j ) x j = x j μ + δ k   μ t + P k β ρ k ω
( ρ ω ) t + ( ρ ω u j ) x j = α S 2 β ρ ω 2 + x j μ + δ ω μ t + 2 ( 1 F 1 ) ρ δ ω 2 ω k x j ω x j
u t = ρ a 1 k max ( a 1 ω , S F 2 )
where k is the turbulent kinetic energy; ω is the turbulence dissipation rate; F1 and F2 are mixed functions; S is the constant term of shear stress tensor; and Pk is Turbulent kinetic energy generation;  σ k = F 1 σ k 1 + 1 F 1 σ k 2 , σk1 = 0.85, σk2 = 1;  α = F 1 α 1 + 1 F 1 α 2 , α1 = 0.5556, α2 = 0.44;  β = F 1 β 1 + 1 F 1 β 2 , β1 = 0.075, β2 = 0.0828;  σ ω = F 1 σ ω 1 + 1 F 1 σ ω 2 , σω1 = 0.5; σω2 = 0.856; a1 = 0.31; β′ = 0.09.
The conversion between the k-ω model and the k-ε model is achieved by using the mixed functions F1 and F2.
F 1 = tanh min max k β ω y , 500 v y 2 ω , 4 δ ω 2 k C D k ω y 2 4
F 2 = tanh max 2 k β ω y , 500 v y 2 ω 2
p k = min τ i j u i x j , 10 β k ω
C D k ω = max 2 ρ δ ω 2 1 ω k x i ω x i , 10 10 500 v y 2 ω
where y is the height of the first layer of the near wall grid.
During the shutdown process, considering the effect of air vents. Given that the air flow rate through the air vents is significantly lower than 0.3 Ma, the air was treated as incompressible.
The VOF multiphase model was employed to track the interface between air and water. The model is constructed as a function of the percentage of volume occupied by the fluid within the mesh at each moment. The equations are as follows:
1 ρ q α q ρ q t + 1 ρ q α q ρ q v q = S α q ρ q + 1 ρ q p = 1 n ( m p q m q p )  
q = 1 n α q = 1
where ρ is density; αq is the volume fraction of phase q; Saq = 0; mpq represents the mass transfer from phase p to phase q.; and mqp represents the mass transfer from phase q to phase p.

2.2. Three-Dimensional Model and Grid Division

This study investigates a vertical shaft-positioned rear pumping station. During the shutdown process, the air vents in the outlet passage play the role of air supply. So, the calculation model of the pump device is composed of impeller, guide vane, air vents, rapid gate, inlet passage, outlet passage, suction sump, and outlet sump. In order to ensure that the calculated boundary conditions are in line with the actual operating conditions, both the suction sump and outlet sump are extended, and an air domain is set above the water surface [31]. The calculation model is shown in Figure 2.
The impeller and guide vane adopt the TJ04-ZL-20 pump model which was originally tested on the Tianjin test bench in 2004. The number of impeller blades is 4, and the number of guide vanes is 7. The simulation uses an impeller diameter of D = 3400 mm. The size of air vents is designed according to the “Pumping station design standards: GB 50265-2022” [6], employing 10 air vents with an inner diameter of 250 mm. The water level difference between the upstream and downstream of the pumping station is 2.75 m, and the rotation rate n of the pump is 108 r/min. The moment of inertia is 7703.4 kg·m2 for the impeller and pump shaft, and 806.38 kg·m2 for the motor.
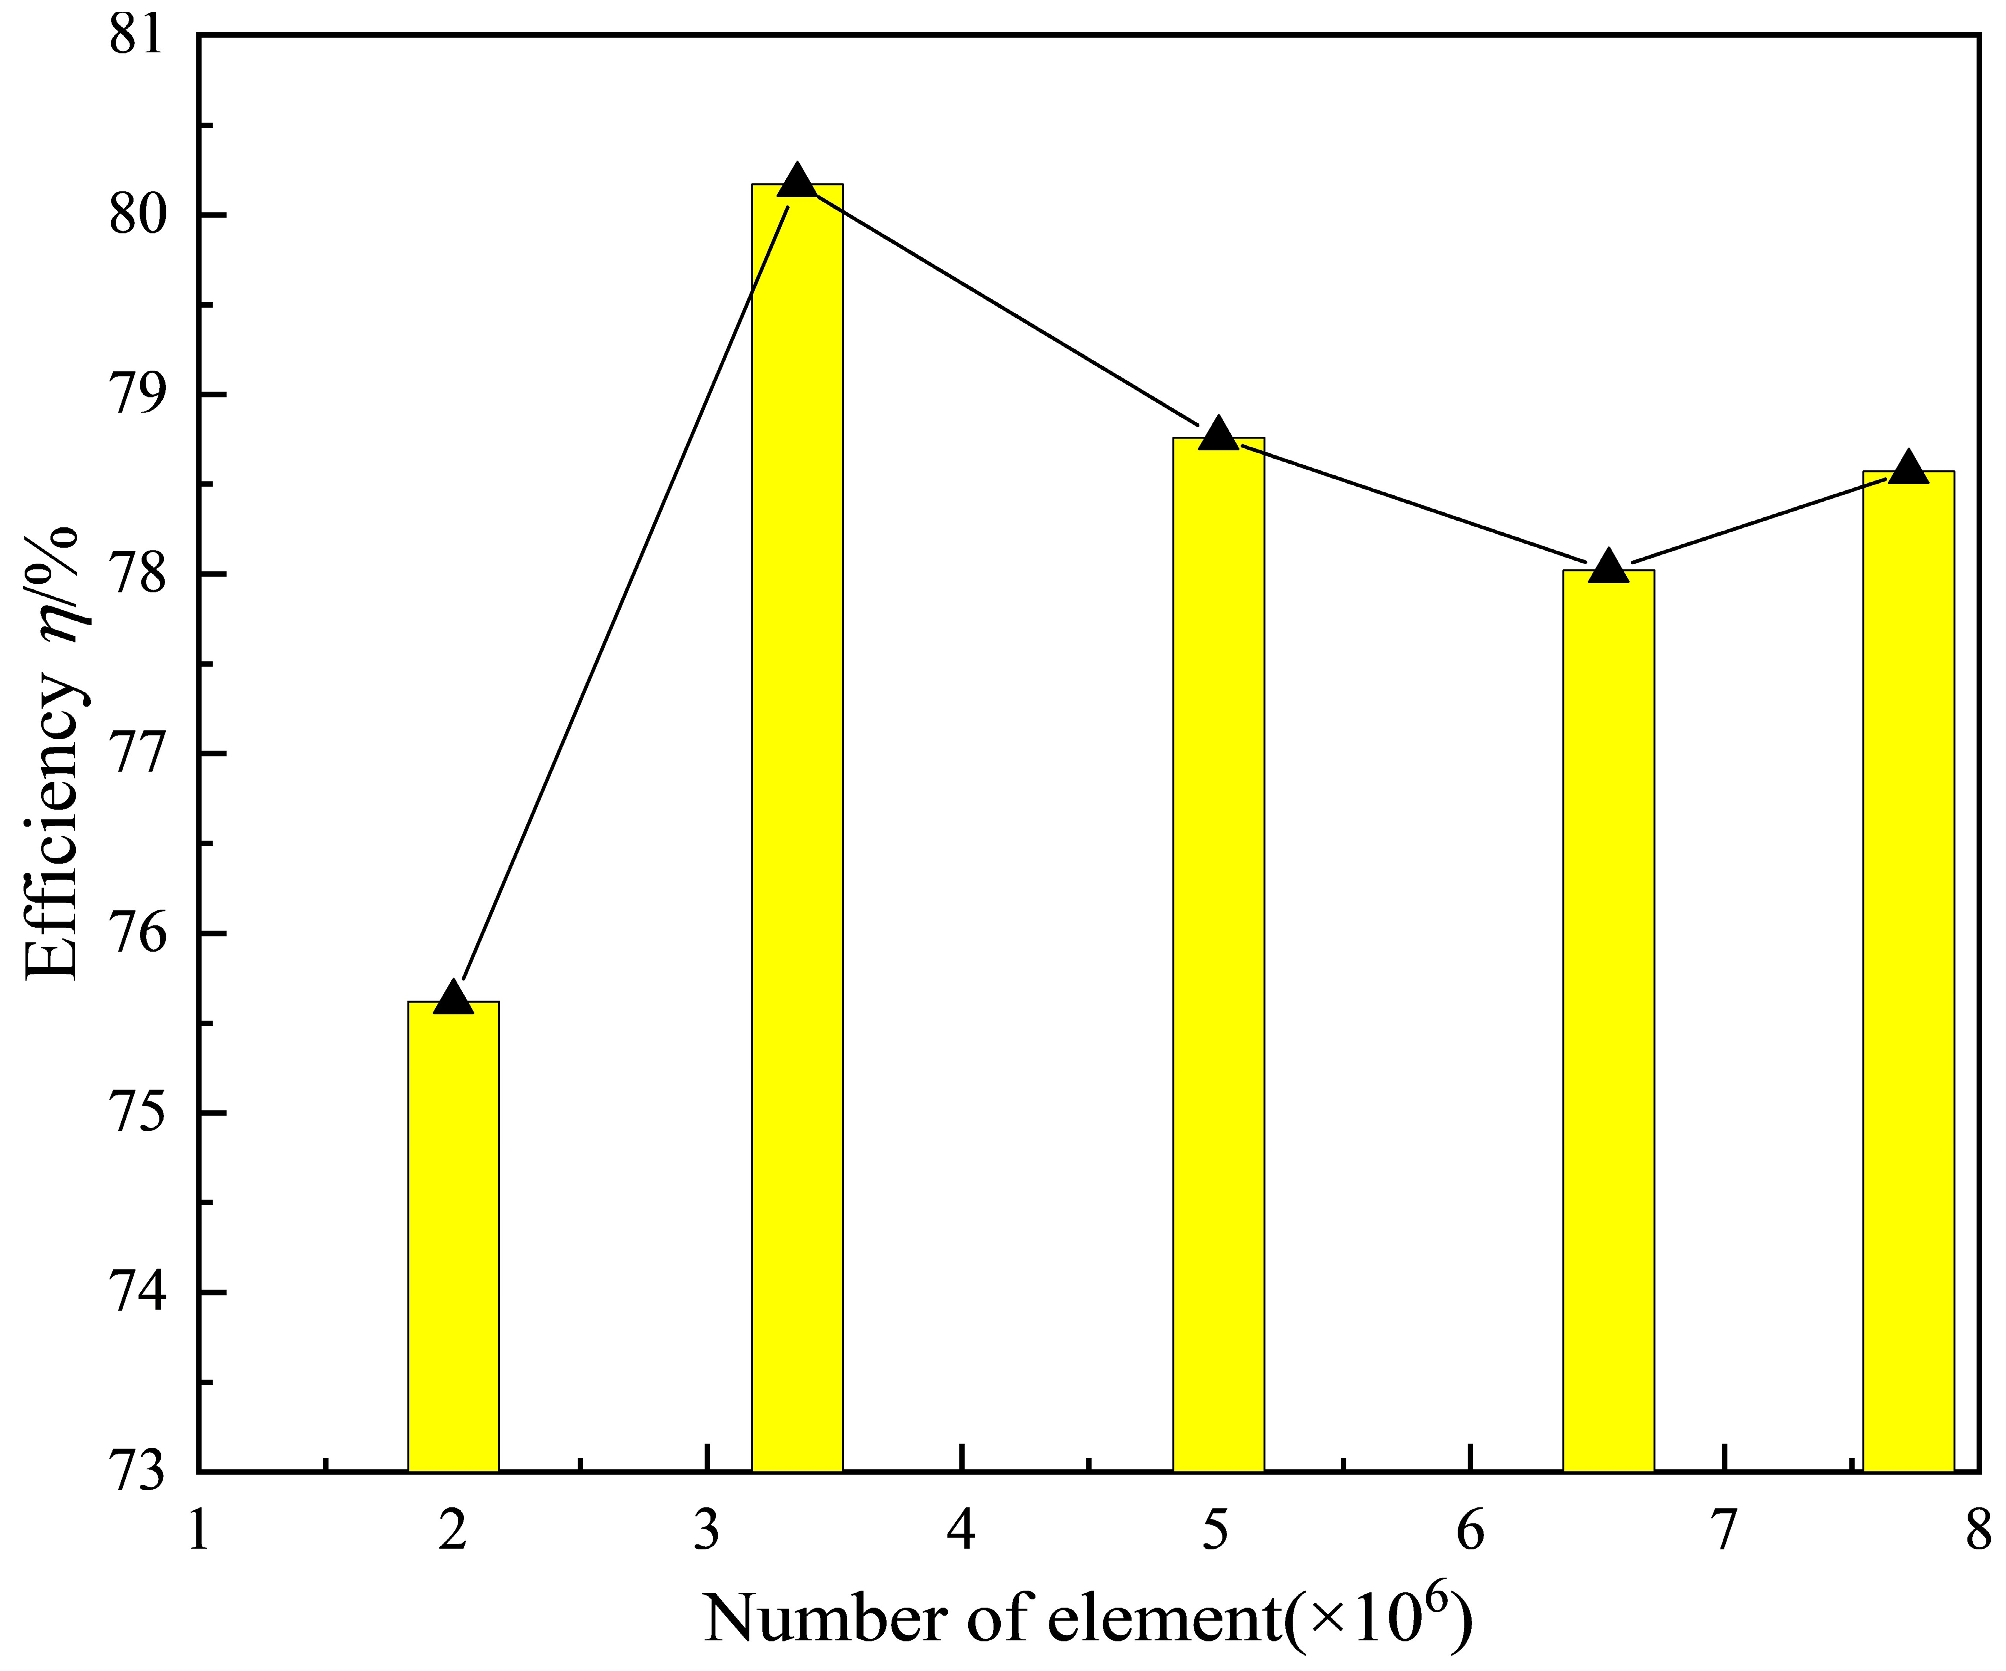
The inlet passage and outlet passage are divided by tetrahedral grids, while the rest are hexahedral grids. Analysis of the grid independence of the pump device is shown in Figure 3. It can be observed that under the design condition, the pump efficiency fluctuates within a narrow range of 78.4% ± 0.35% when the total number of grid elements exceeds 5.01 × 10⁶. Considering both the calculation resources and the accuracy of numerical simulation, the total number of grids is finally selected as 5.01 × 10⁶. The y+ values on the surfaces of the impeller and guide vanes range between 20 and 30. Parts of the grids are shown in Figure 4.

2.3. Calculation Method of Pump Shutdown Process

During the shutdown of the pump device, the cessation of motor power output causes the pump rotation rate to gradually decrease. The pump subsequently begins to rotate in reverse under the influence of the water flow resistance torque.
Ignoring frictional resistance during shutdown, the formula for the moment of inertia is as follows:
M J = ( J G + J D ) d ω * d t = M W
where MJ is the torque of the pump, N·m;
Mw is the resistance torque of water, N·m;
ω *  is the rotation rate of pump, rad/s;
JG is the moment of inertia of impeller and pump shaft, kg·m2;
and JD is the moment of inertia of motor, kg·m2.
The angular velocity of the next moment can be calculated using the parameters of the previous moment and the formula is as follows:
ω i + 1 * = ω i * M W J G + J D Δ t
During the calculation, the rotation rate of the impeller is monitored and updated by using the UDF macro [32]. The normal operation of the pump is taken as an initial condition of shutdown calculation. The motion of impeller for the next time step is calculated based on data from the preceding time step. At the end of each time step, parameters such as volumetric flow rate, torque, and rotation rate were exported. The calculation procedure is shown in Figure 5.
The closure of the rapid gate is controlled by using dynamic mesh technology, which moves the gate downward at a constant speed. To simulate the complete shutdown process, the computational model of the gate structure is optimized. Specifically, during mesh reconstruction, the two to three layers of meshes reserved for deformation are translated downward to a position below the elevation of the outlet passage bottom. The closing motion of the rapid gate over time is also implemented by the UDF macro. A rigid body motion is defined for the top section of the gate, while the rest of the boundaries retain their default settings. The total closure time of the rapid gate is set to 20 s.

2.4. Boundary Conditions and Calculation Settings

The shutdown process of the pump device is simulated by FLUENT(2023R1) software with the simplec algorithm for pressure–velocity coupling. This study employs the open-channel model from the VOF method and uses an implicit method to simulate the interaction between gas and liquid. To maintain consistent boundary conditions during the transition from normal operation to shutdown process of the pump device, the inlet of suction sump is set to pressure inlet, and the outlet of outlet sump is set to pressure outlet. Both the inlet pressure and outlet pressure are defined as a function of water depth [33]. The water depth at the inlet is 7.44 m and at the outlet is 9.84 m. The inlet of air vents and the air above sumps are set as pressure inlet with a pressure of 0 kpa, setting the water surface as a free surface [34]. The impeller domain is defined as the rotation domain with an initial rotation rate of 108 r/min, while other domains are set to stationary domain. Solid walls, including the blades, hub, and passage surfaces, employ a no-slip boundary condition. A transient simulation was conducted with a time step size of 0.01 s and 30 iterations per time step.

2.5. Model Test

2.5.1. Test Equipment

The model test of pump device was conducted on the general hydraulic model test bench of the China Water Resources Beifang Co., Ltd. (Tianjin, China), which is the highest standard pump test bench in China. The specifications of the primary test instruments are listed in Table 1.
The comprehensive allowable uncertainty of test equipment efficiency is better than ±0.3%, with the random uncertainty within ±0.1%. The model test is strictly in accordance with the standard “ Pump Model and Device Model Test Acceptance Regulations” SL140-2006 and “Hydraulic turbines, storage pumps, and pump-turbines- Model acceptance tests” IEC60193-2019. The diameter of the model impeller is 300 mm, with 4 blades and 7 guide vanes. The rotation rate of the pump model test is 1250 r/min. The field picture of the model test is shown in Figure 6.

2.5.2. Experimental Result Conversion Method

The model test does not include the air vents, rapid gate, and breast wall. To ensure a consistent basis for validation, these components were also removed from the numerical model during the verification phase. The reliability of the computational methodology was verified by comparing simulation results against experimental data under identical geometric conditions. The results obtained from the model test were scaled to the prototype pump using the following laws:
Q p Q M = D p D M 3 n p n M
H p H M = D p D M 2 n p n M 2
where Q is volumetric flow rate, m3/s; D is impeller diameter, m; n is rotation rate of pump, rpm; and H is water head of the pump, m. The subscript p represents prototype pump and the subscript M represents model pump.

2.5.3. Verification of Numerical Simulation Accuracy

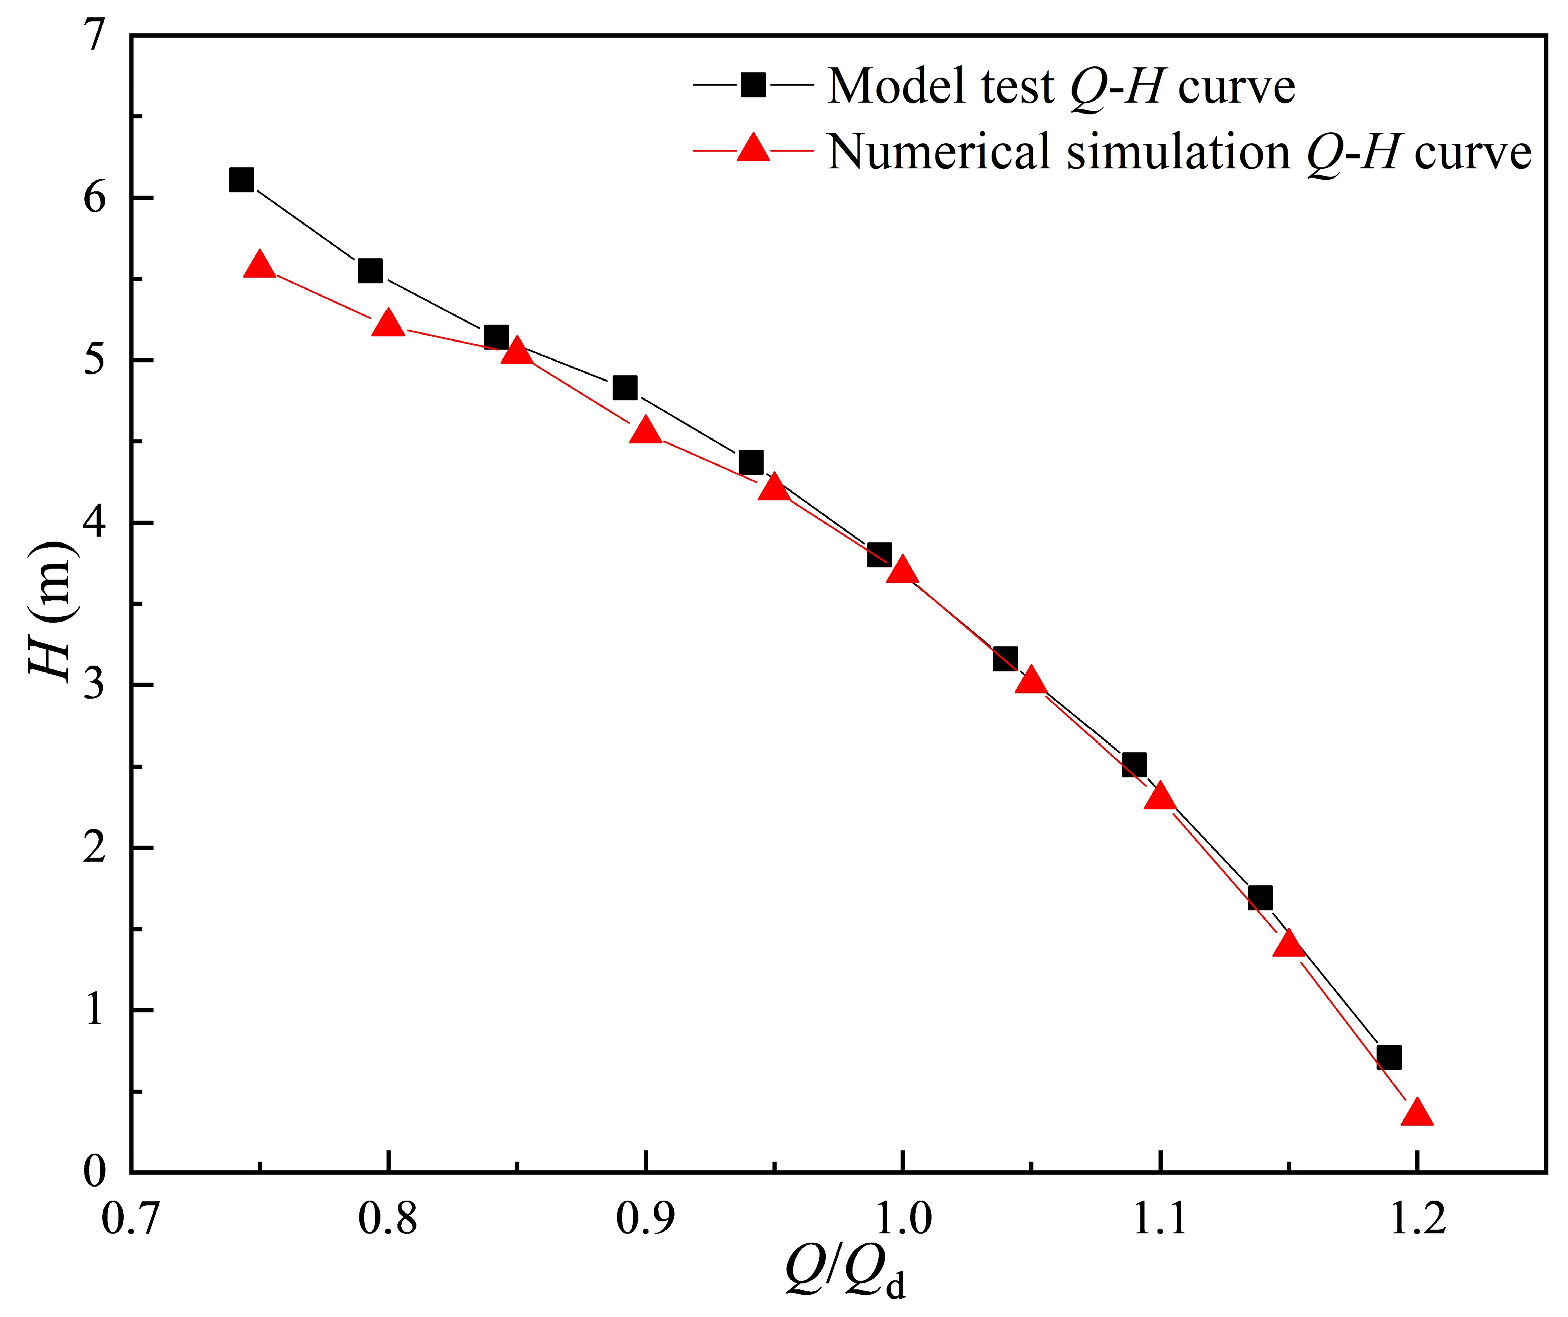
The results of the model test convert into prototype pump and prototype pump numerical calculation are shown in Figure 7. In the figure, the x-axis is Q/Qd and Qd is the design volumetric flow rate, 40 m3/s. Y-axis represents the head of pump.
In order to quantify the calculation error, the deviation of water head is measured by the following formula under the condition of equal flow rate:
deviation = H M H N H M × 100 %
where HM is water head of the model test convert’s prototype pump, m; HN is the water head of the numerical calculation result of prototype pump, m.
It can be seen from Figure 7 that the flow-head curves of numerical calculation and test are well matched near the design working conditions. The deviation is large but not more than 8.5% under small volumetric flow rate. Under the condition of small volumetric flow rate, the operating state of pump is close to unstable state, so the deviation is large. Since this study focuses on the design operating condition, where the discrepancy between simulation and experiment is less than 3%, the accuracy of the adopted numerical methodology is considered satisfactory for the present investigation.

3. Results and Discussion

3.1. Analysis of the Transition Process of Pump Device Synchronous Shutdown

3.1.1. Analysis of the External Characteristics of Pump Device Synchronous Shutdown Process

The transient evolution of the pump device’s external characteristic parameters during the synchronous shutdown process is shown in Figure 8. As shown, at t = 0 s, the motor stops outputting power and the rapid gate begins to close. Between t = 0 s and t = 13.14 s, the water flow in the pump device gradually begins to reverse flow. Concurrently, the rotation rate of the pump continues to decrease until reverse rotation occurs. At t = 13.14 s, the maximum reverse volumetric flow rate is 34.12 m3/s (monitored at the impeller chamber inlet), equivalent to 85.3% of the design volumetric flow rate. The maximum reverse rotation rate of the pump is 117.15 r/min at t = 13.4 s, which is 1.085 times the rotation rate. From t = 13.14 s to t = 20 s, as the gate is closed, both the reverse volumetric flow rate and the pump reversal rotation rate decrease gradually. When the gate is fully closed at t = 20 s, the water flow in the pump device remains in a reverse flow state due to the inertia of water flow and the air supply effect from the air vents, and the pump continues to reverse. At t = 21.1 s, the reverse water flow disappears for the first time, and the water flow begins to flow forward, expelling air from the outlet passage. A portion of the water flow rushes into the air vents. At the same time, the energy is dissipated and then water flows to the inlet side. Subsequently, the water flow in the pump device undergoes a reciprocating motion with gradually diminishing intensity.
The positive and negative axial force and torque of the pump shown in Figure 8 indicate only the direction. It can be observed that the variations in axial force and torque exhibit nearly identical trends. Between t = 4.44 s and t = 5.64 s, as the pump transitions gradually from forward to reverse rotation, both the axial force and torque experience a brief increase. At t = 20.5 s, the axial force of pump reaches a maximum reverse value of 34.56 kN, while the torque of pump also reaches the maximum reverse value of 21.08 kN·m.
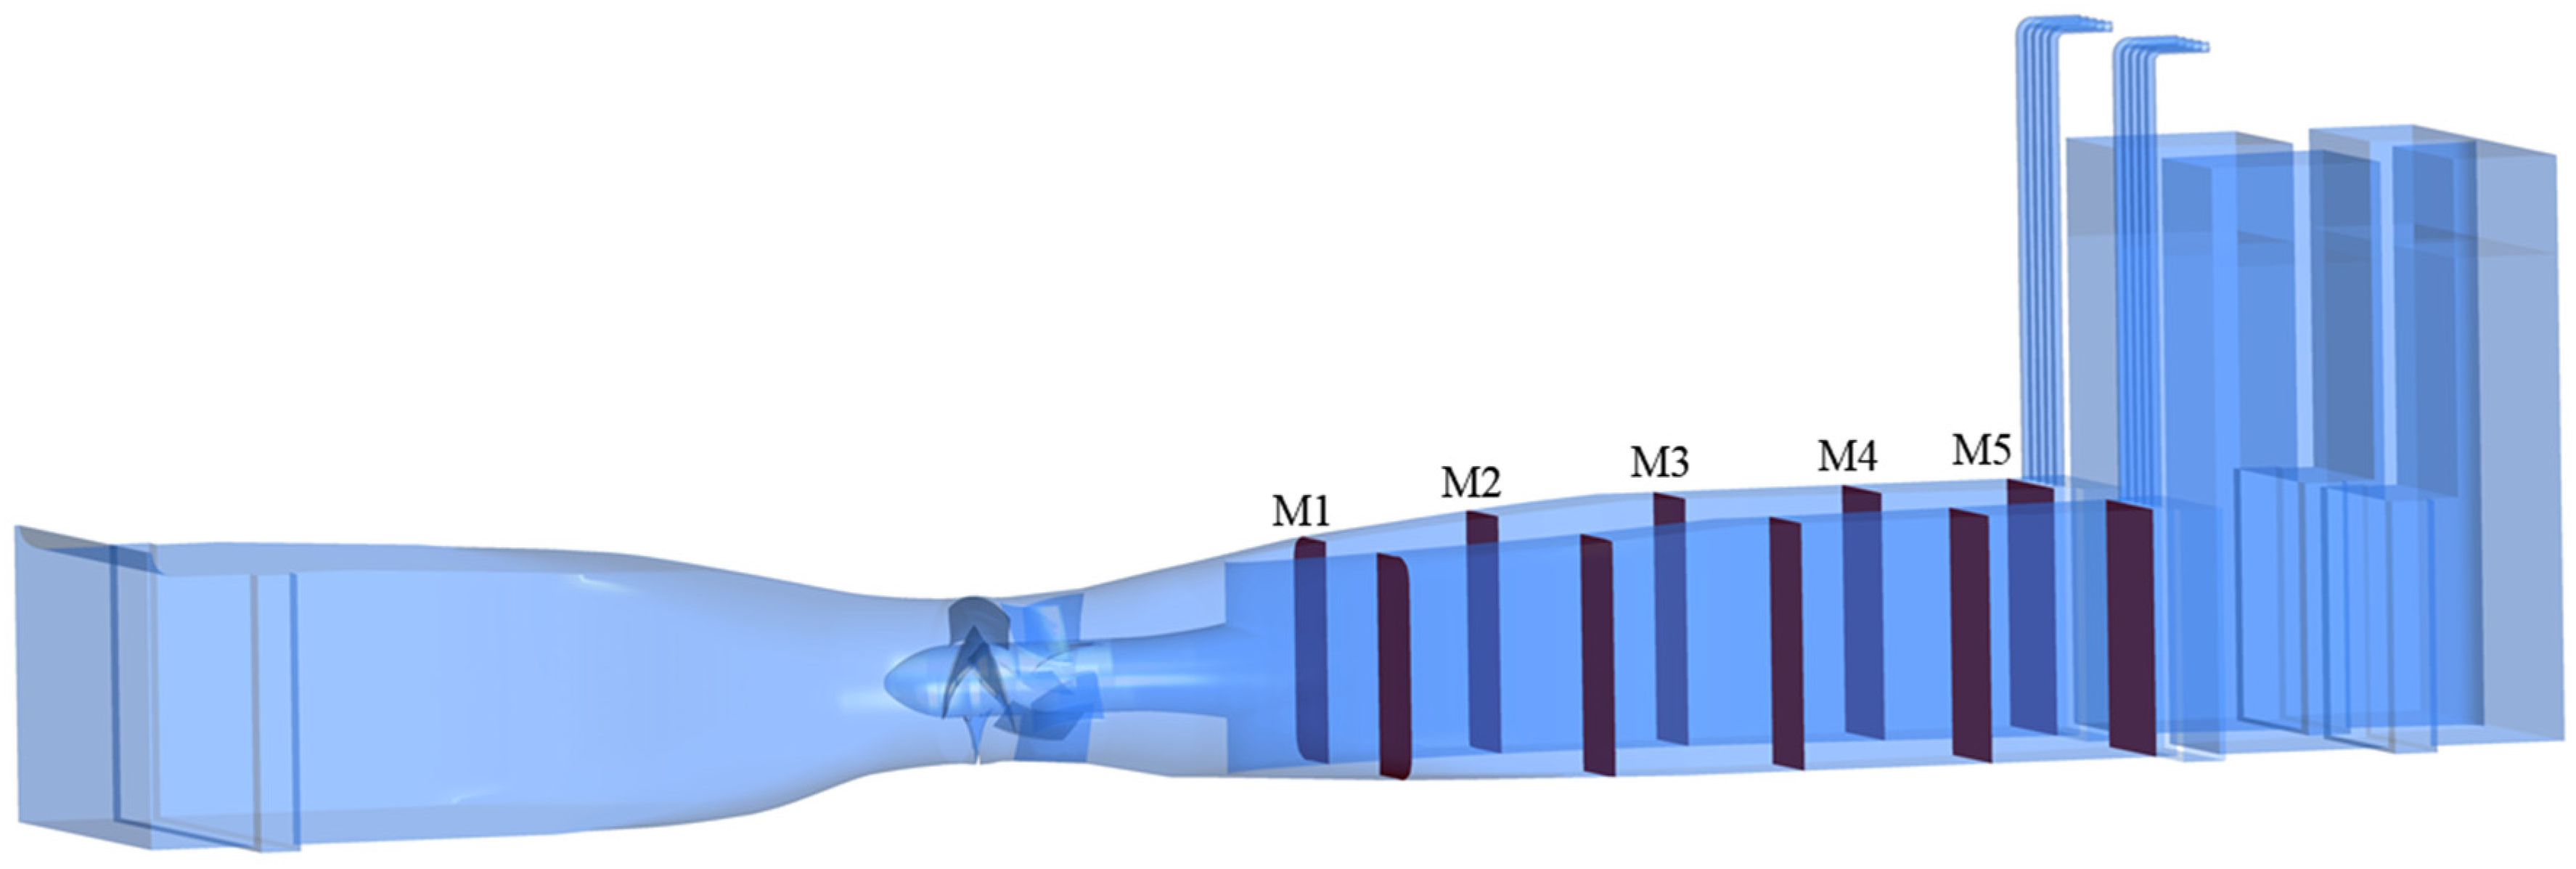
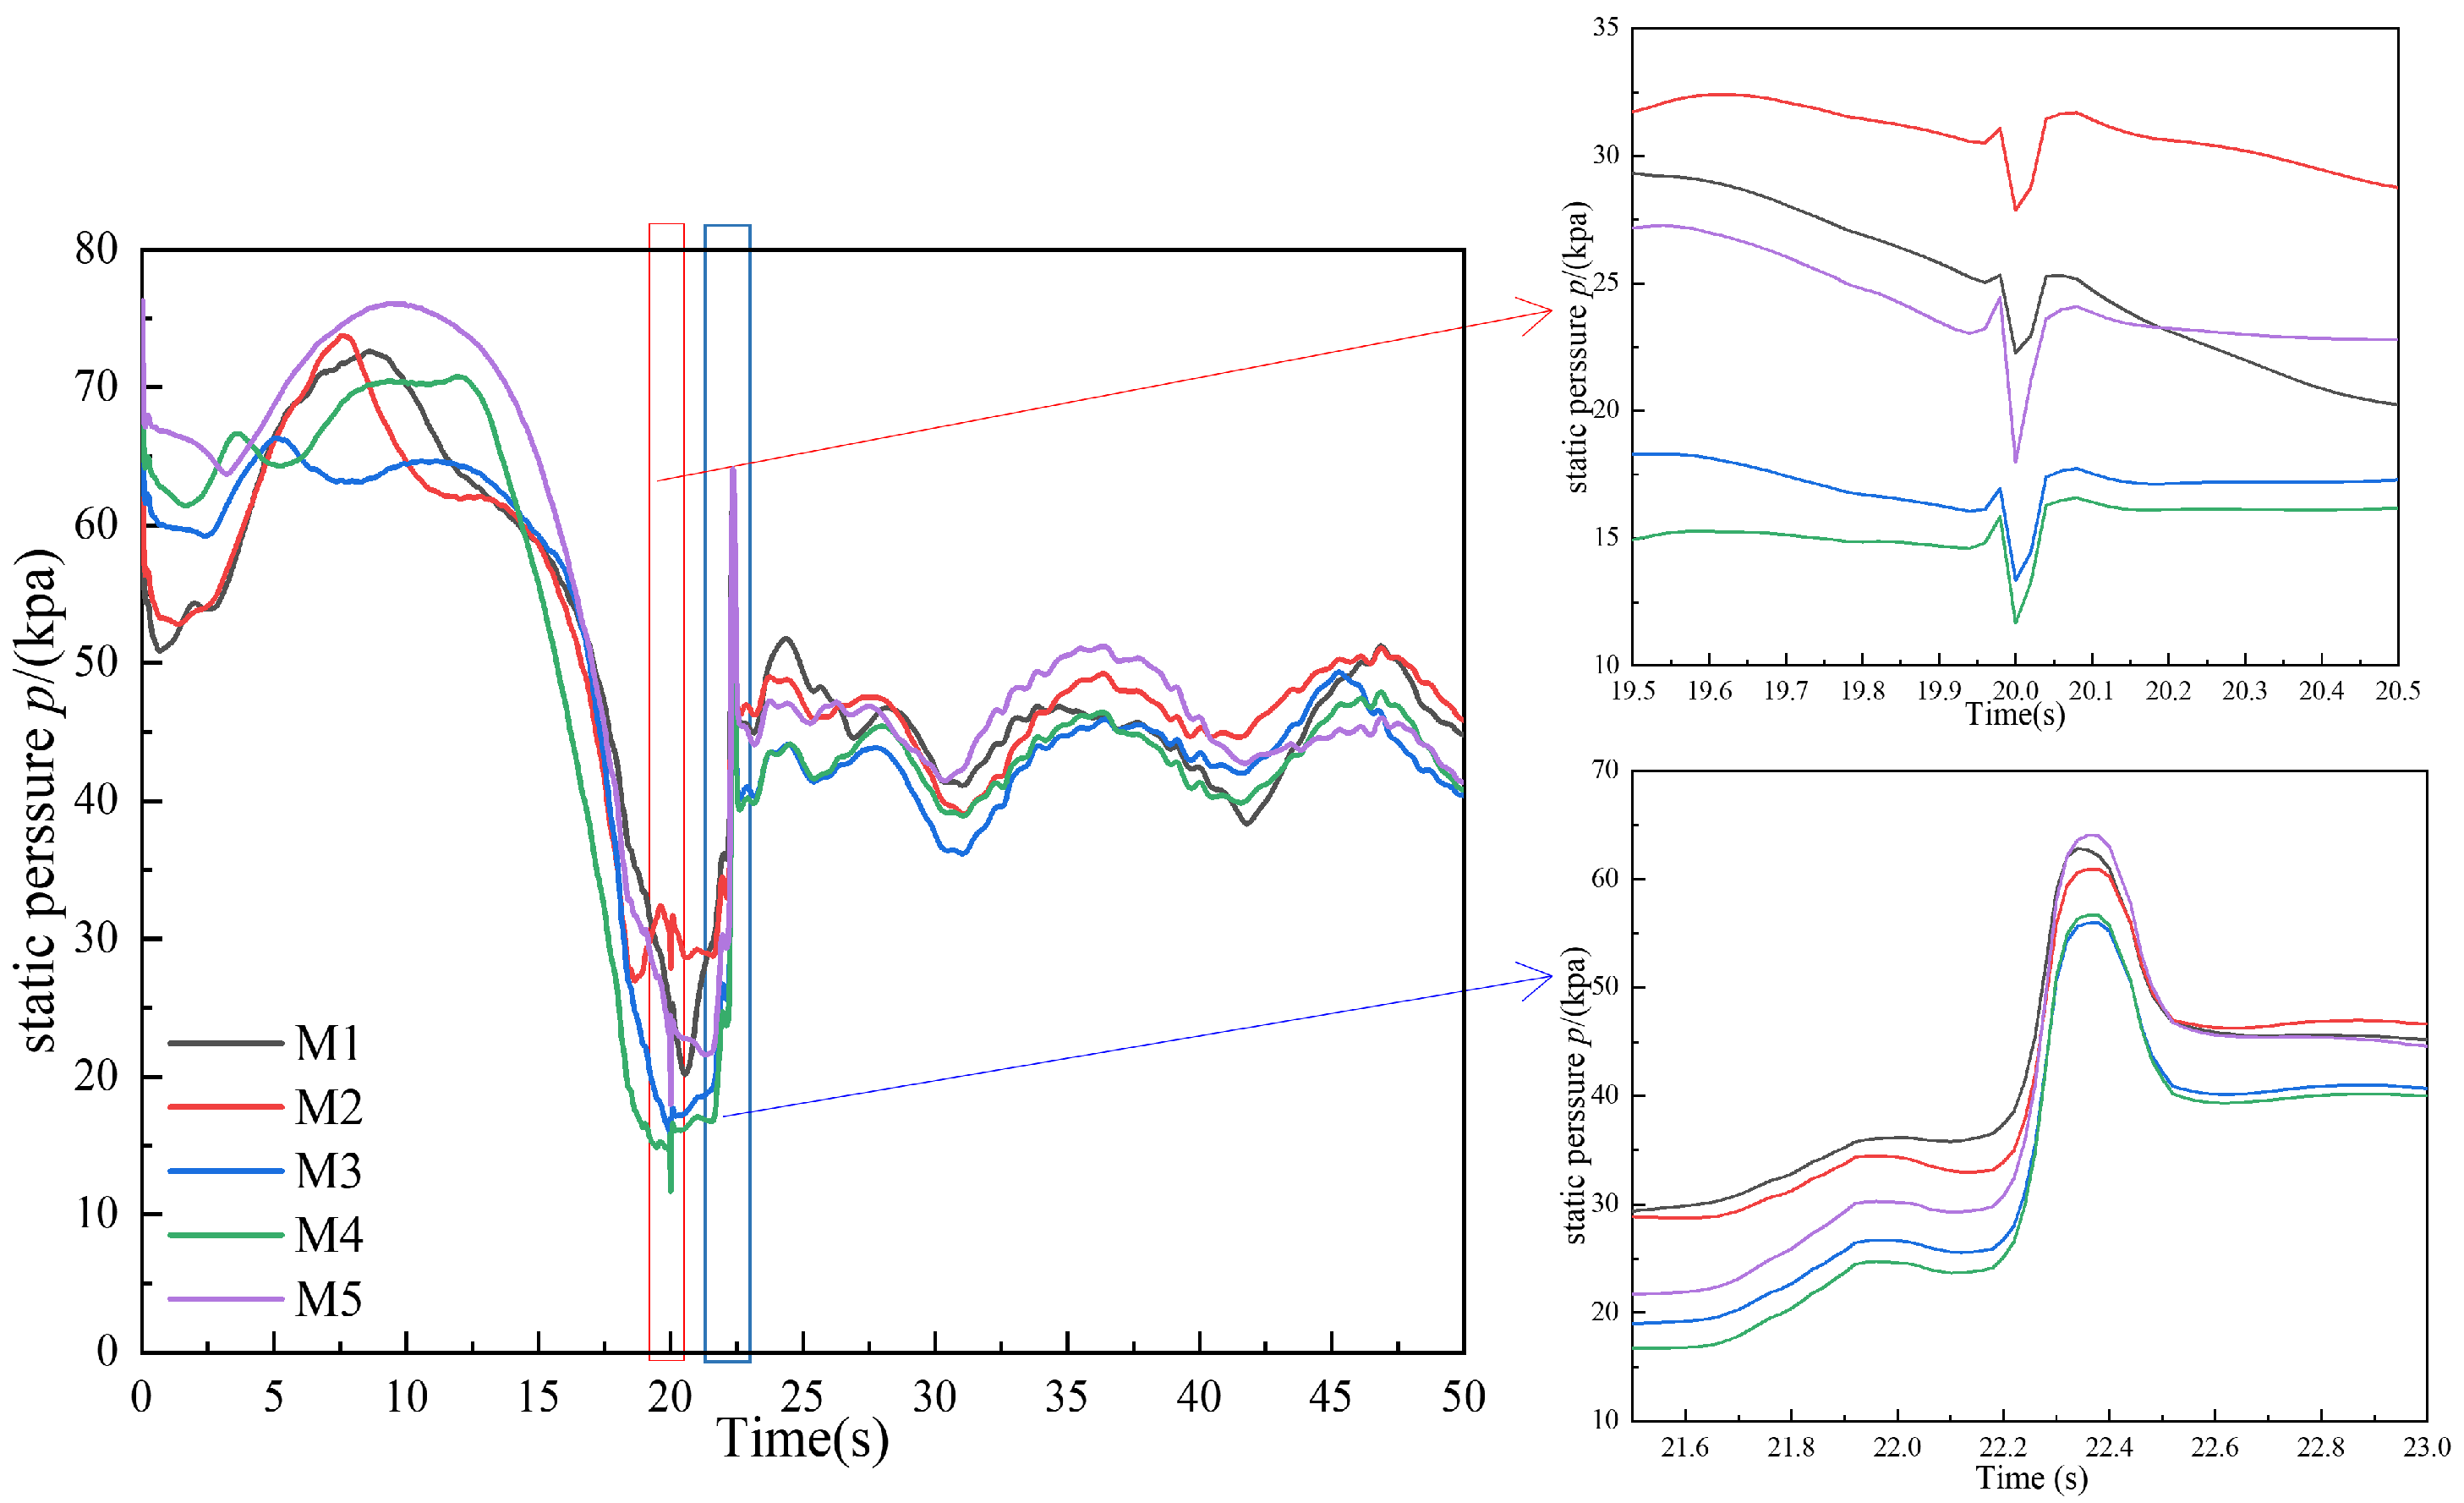
Pressure changes in the outlet passage were monitored at five specific cross-sections, whose locations are indicated in Figure 9. And Figure 10 shows the corresponding pressure variation curves, which are given in terms of gauge pressure.
The pressure in the outlet passage is affected by both the water level and the volumetric flow rate. As shown in Figure 10, before the gate is completely closed, the pressure in the outlet passage rises first and then decreases with the change in volumetric flow rate. This phenomenon is in accordance with the Bernoulli equation. At the moment of complete gate closure, the pressure in each section of the outlet passage reaches its minimum value. This phenomenon can be attributed to the extremely short-duration water hammer effect induced by the sudden gate closure. Owing to the action of the air vents, the average pressure in the outlet passage remains non-negative. After the water hammer disappears, the pressure in each section of the outlet passage begins to rise under the influence of the water level in the suction sump. Between t = 21.5 s and t = 23 s, the pressure in the outlet passage increases first and then decreases, rapidly converging to the same hydraulic pressure as that in the suction sump.
Figure 11 shows the transient pressure at the top of the outlet passage (the bottom of the air vents), air volume, and volumetric flow rate change in the outlet passage. From t = 0 s to t = 18 s, the pressure change at the top of outlet passage is consistent with the pressure change trend of the sections in Figure 10. At t = 18.38 s, air begins to enter the outlet passage through the air vents, causing the pressure at the top to equilibrate to 0 kPa. Upon complete gate closure, the pressure at this location reaches its minimum, while the air volumetric flow rate through the air vents peaks at 6.21 m3/s. At t = 21.08 s, the accumulated air volume in the outlet passage reaches a maximum of 7.95 m3. With the return of water flow, approximately 4.5 m3 of air is rapidly expelled through the vents within 2 s. Subsequently, the reciprocating motion of the water flow induces alternating intake and exhaust fluctuations through the air vents.
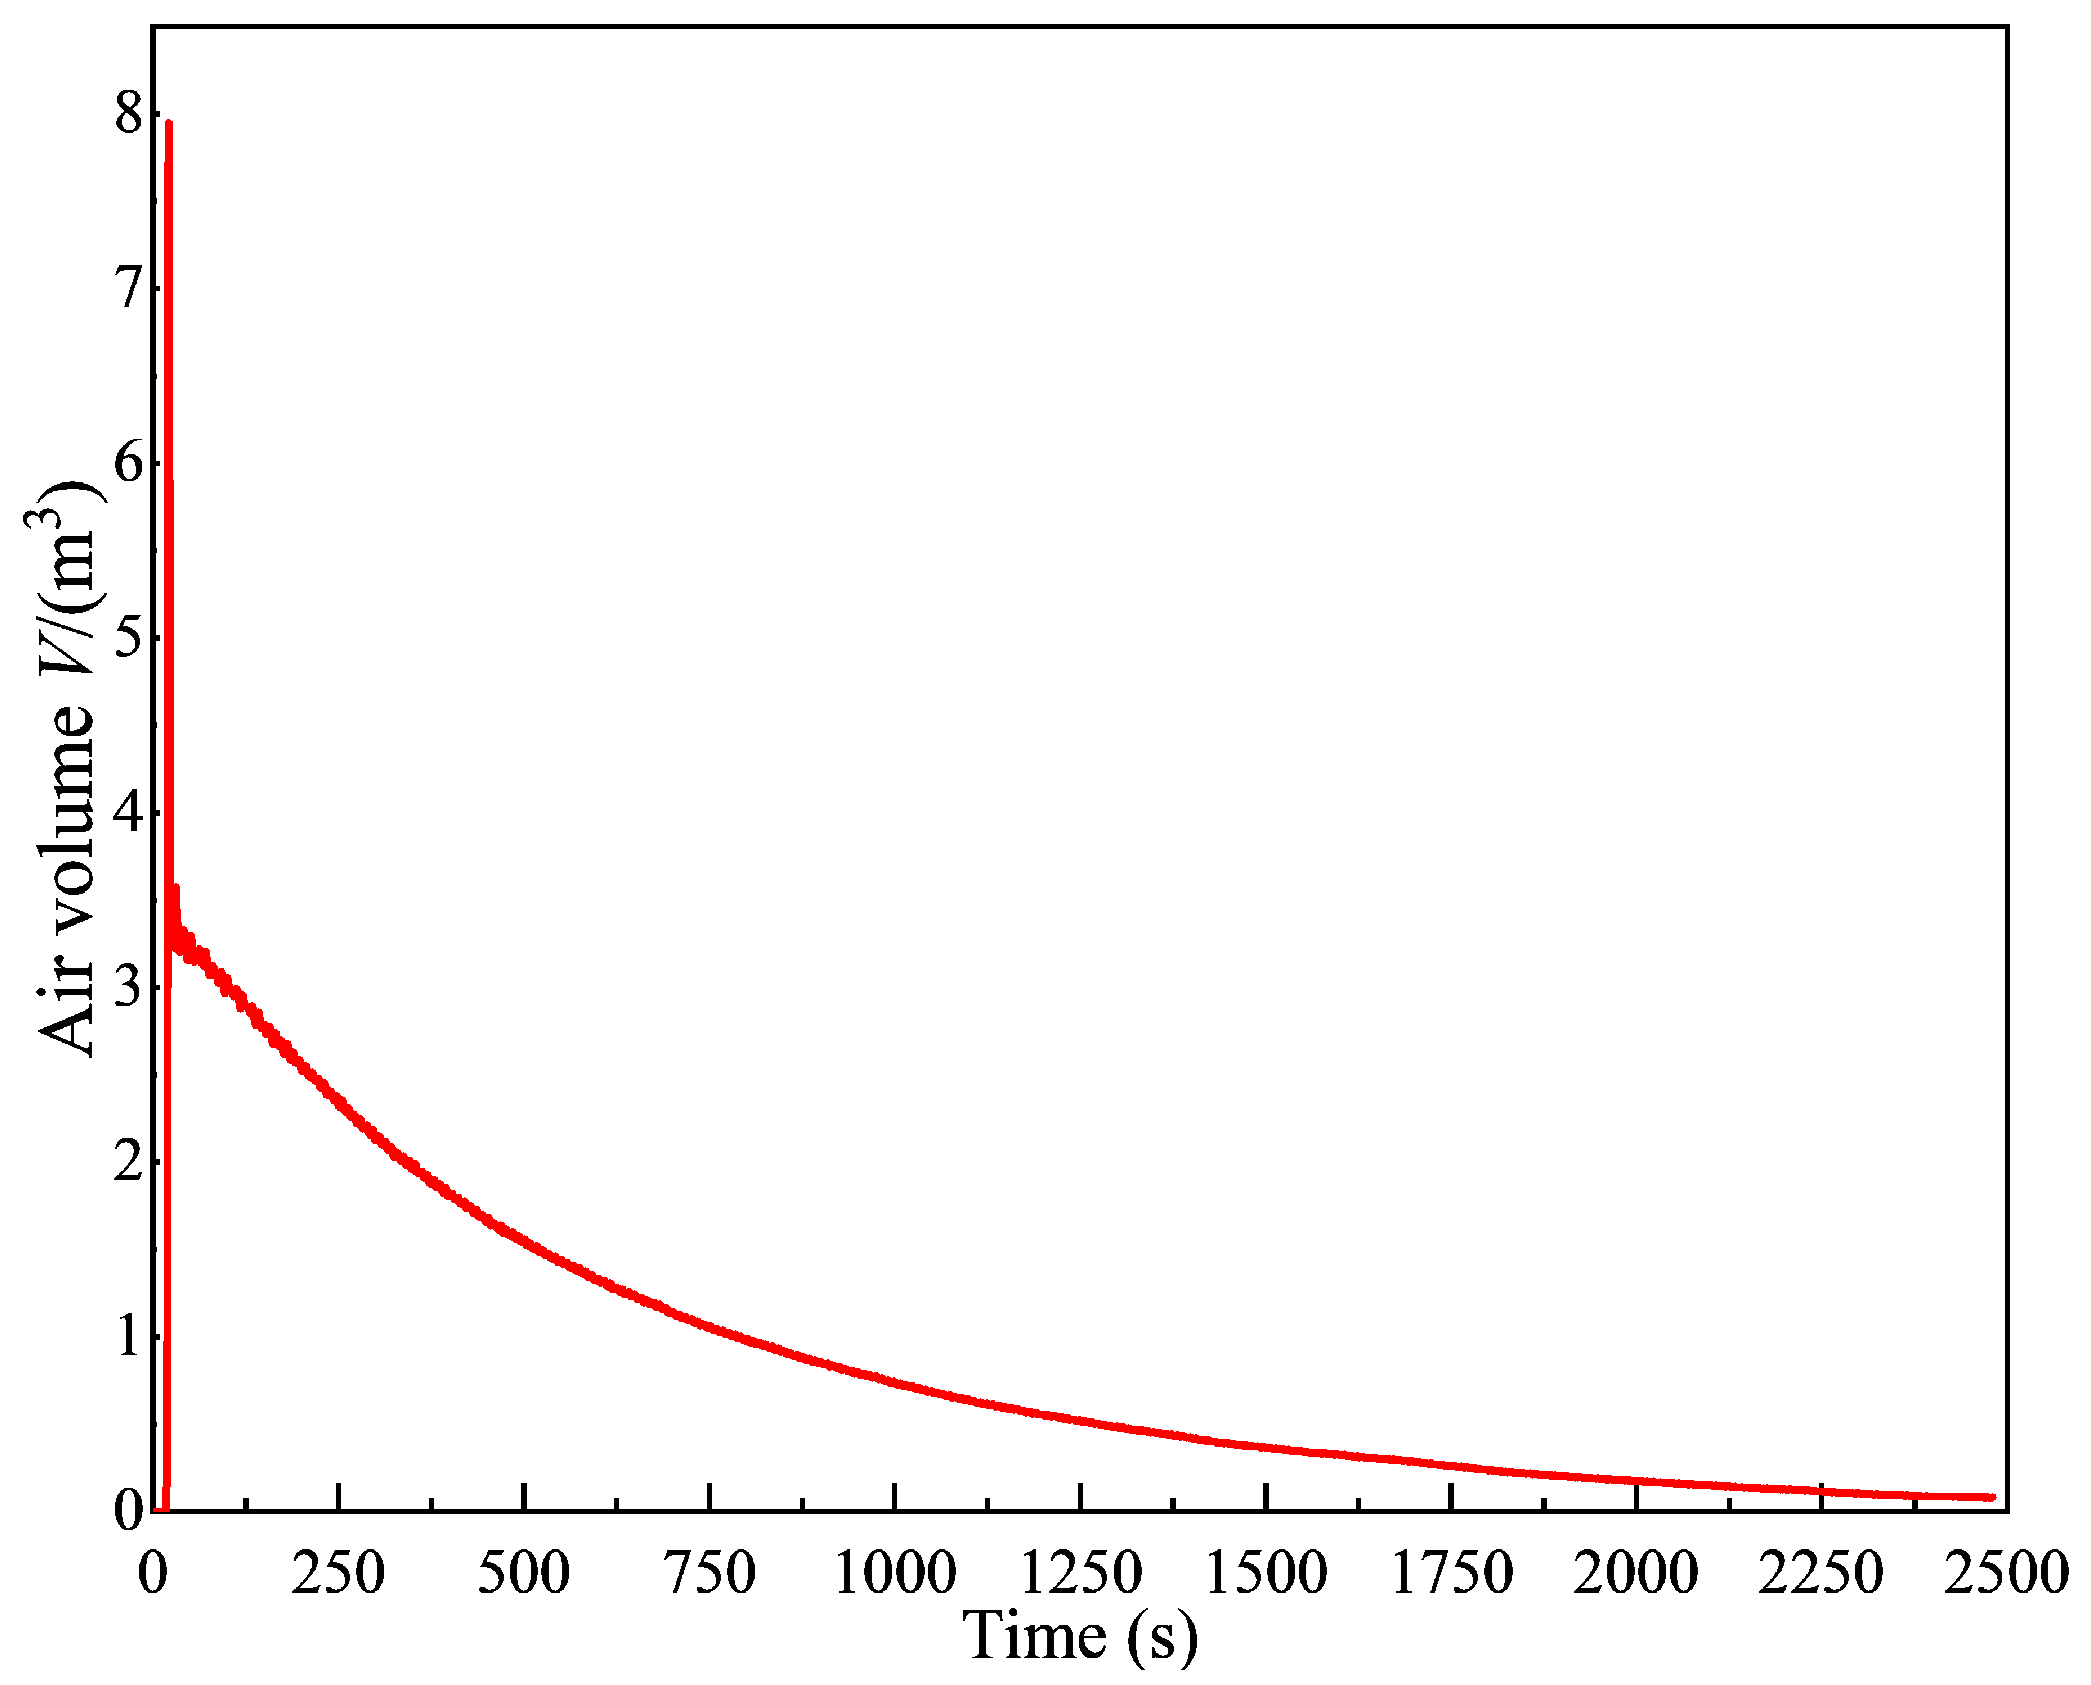
As shown in Figure 11, 3.2 m3 of air remains in the outlet passage after t = 60 s. Figure 12 shows the subsequent process of air ingress and discharging in the outlet passage. The rate of air discharge gradually decreases as the retained air volume diminishes. Approximately 2400 s after pump power-off, the air within the outlet passage is nearly completely discharged.

3.1.2. Evolution of the Internal State of Pump Device

The internal flow state in the outlet passage during shutdown is shown in Figure 13. At t = 0 s, the pump device starts to shut down, and the water flow begins to transition from forward to reverse direction. At stage (b), reverse water flow has just commenced at a low rate of only 5 m3/s. The flow in the outlet passage is highly disordered at this time. The reverse flow interacts with the remaining forward flow in the suction sump, generating a vortex. This phenomenon, characterized by surface flow moving backward from the suction sump, diminishes as the reverse volumetric flow rate increases. From stage (c) to (h), the flow velocity beneath the rapid gate is observed to increase, influenced by the growing reverse flow and the progressive reduction in the gate opening. The water flow in the outlet sump rushes into the outlet passage through the bottom of the rapid gate. This high-rate flow drives the low-rate zone in the inner side of the rapid gate, forming a distinct vortex zone. As the gate opening continues to decrease, the underlying flow rate rises, resulting in a corresponding expansion of this vortex region. Throughout the entire process, the reverse flow in the inlet passage remains highly turbulent due to the influence of the rotating impeller.
The pressure evolution in the outlet passage during shutdown is shown in Figure 14. At t = 0 s, the pump device is running normally, and the pressure exhibits a triangular distribution, increasing linearly with water depth. At t = 17.5 s, due to the influence of the vortex behind the rapid gate, there is a local low-pressure zone in the outlet passage. However, the pressure remains positive. At t = 18 s, this low-pressure zone expands and the pressure drops below atmospheric, forming a small but discernible negative pressure region. Between t = 18 s and t = 20 s, as the increase in the vortex on the inner side of the gate continues, both the strength and range of the negative pressure increase, propagating toward the front section of the outlet passage. After the gate is fully closed, the negative pressure gradually dissipates, and by the time instant shown in Figure 14g, it vanishes completely at the top of the outlet passage. Finally, at t = 2400 s, the air in the outlet passage has been fully discharged. The pressure distribution reverts to a hydrostatic profile, increasing linearly with water depth.

3.1.3. Evolution of Air–Water Two-Phase Inside Pump Device

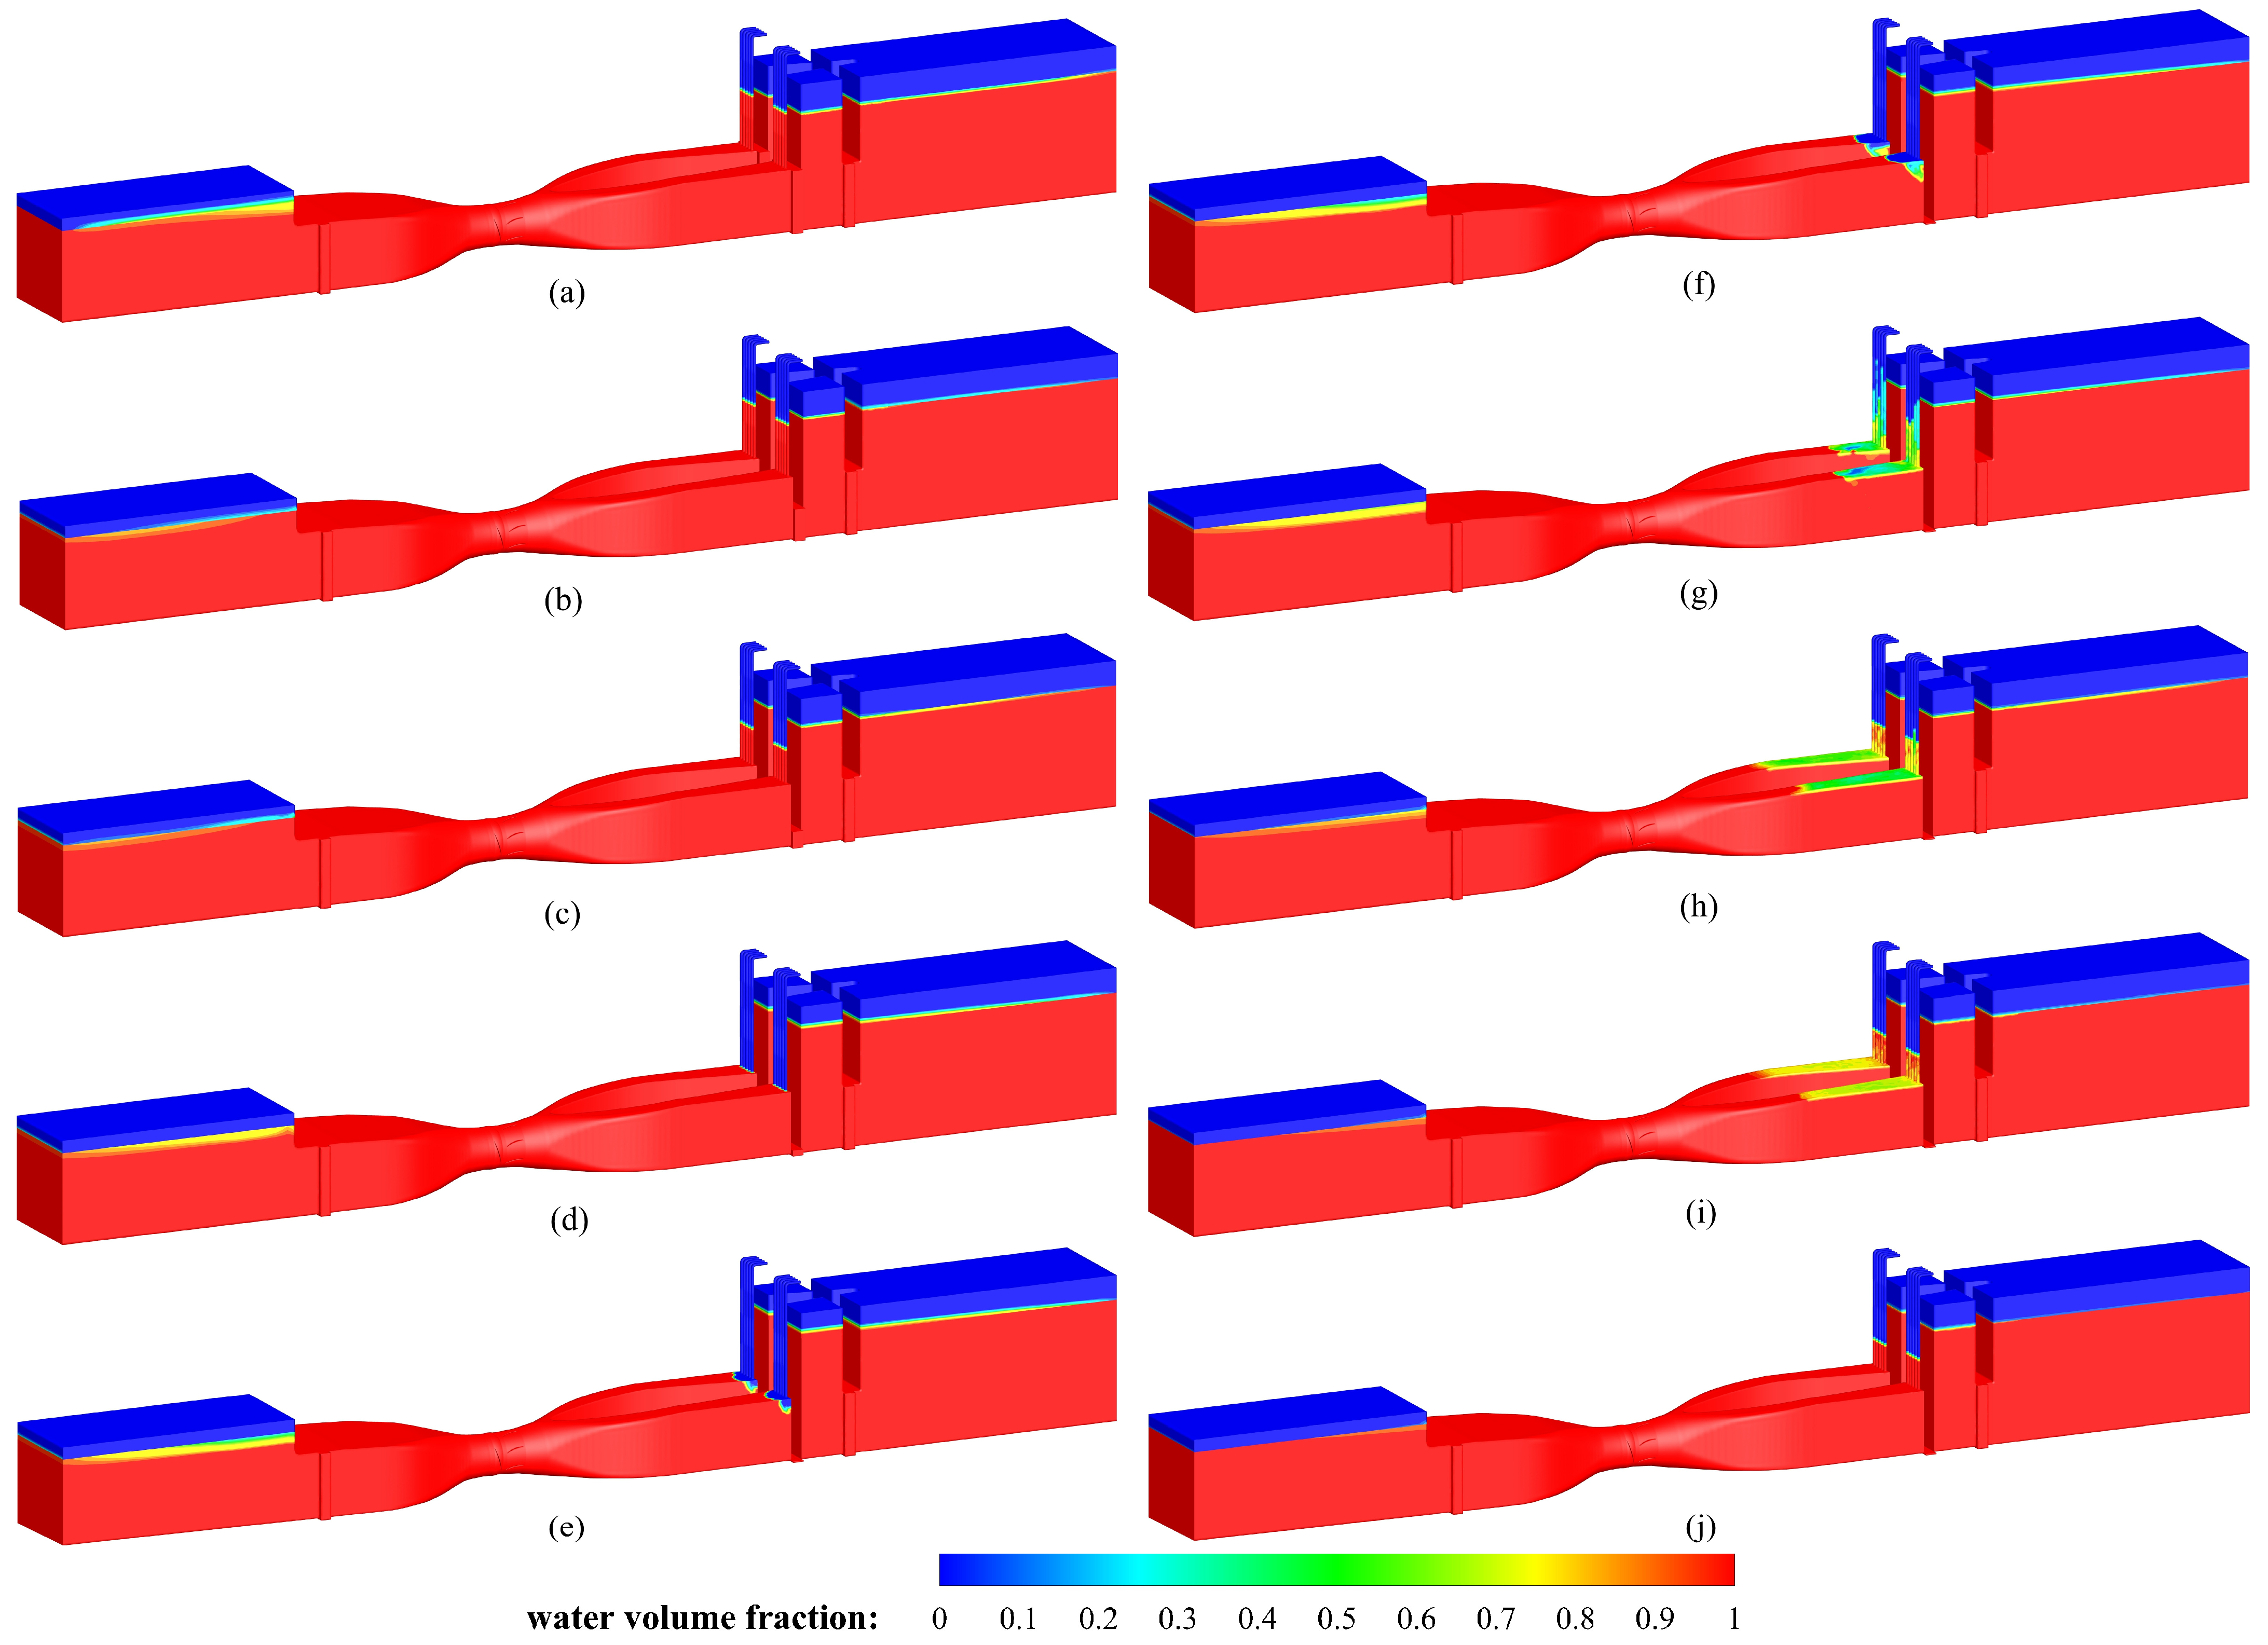
The evolution of the water level in the air vents and the associated air–water interaction is shown in Figure 15. At t = 0 s, the water level inside the air vents coincides with that in the outlet sump [27]. As the shutdown proceeds, the water level inside the air vents decreases. This process can be divided into two phases: a slow decrease from t = 0 s to t = 15 s, followed by a rapid drop between 15 s and 18.38 s. At 18.38 s, the air is drawn into the outlet passage.
The air volume in the outlet passage peaks at t = 21.08 s. Between stages (d) and (f), the air accumulates near the top of the inner side of the gate and has not yet migrated toward the low-pressure region identified in Figure 14. Driven by the negative pressure and water flow motion in the passage, the air subsequently spreads forward to the low-pressure zone at the top of the outlet passage, forming an air–water mixture. Subsequently, under the action of water pressure, the air is gradually expelled, and the water level in the air vents slowly recovers, eventually realigning with that in the suction sump. Until t = 2400 s, as shown in stage (j), the air in the outlet passage is nearly completely discharged, marking the completion of the shutdown process.

3.2. Comparison and Analysis of Synchronous and Asynchronous Shutdown Process

During the process of shutdown, the reverse rotation rate of the pump and the reverse volumetric flow rate are the most important indicators, which are related to the safety of the pump device. Excessive reverse rotation rate and reverse volumetric flow rate can cause damage to the pump and motor. As demonstrated in Section 3.1, the gate provides limited suppression of reverse flow and reverse rotation during the first two-thirds of its closure period. Therefore, this study proposes to adopt the method of asynchronous shutdown, in which the closure of the rapid gate is earlier than the power-off of the pump. A schematic of the strategy is provided in Figure 16. According to the moment when the pump is powered off, the gate is set with different opening degrees. The schemes are shown in Table 2.

3.2.1. Comparison of External Characteristics of Synchronous and Asynchronous Shutdown

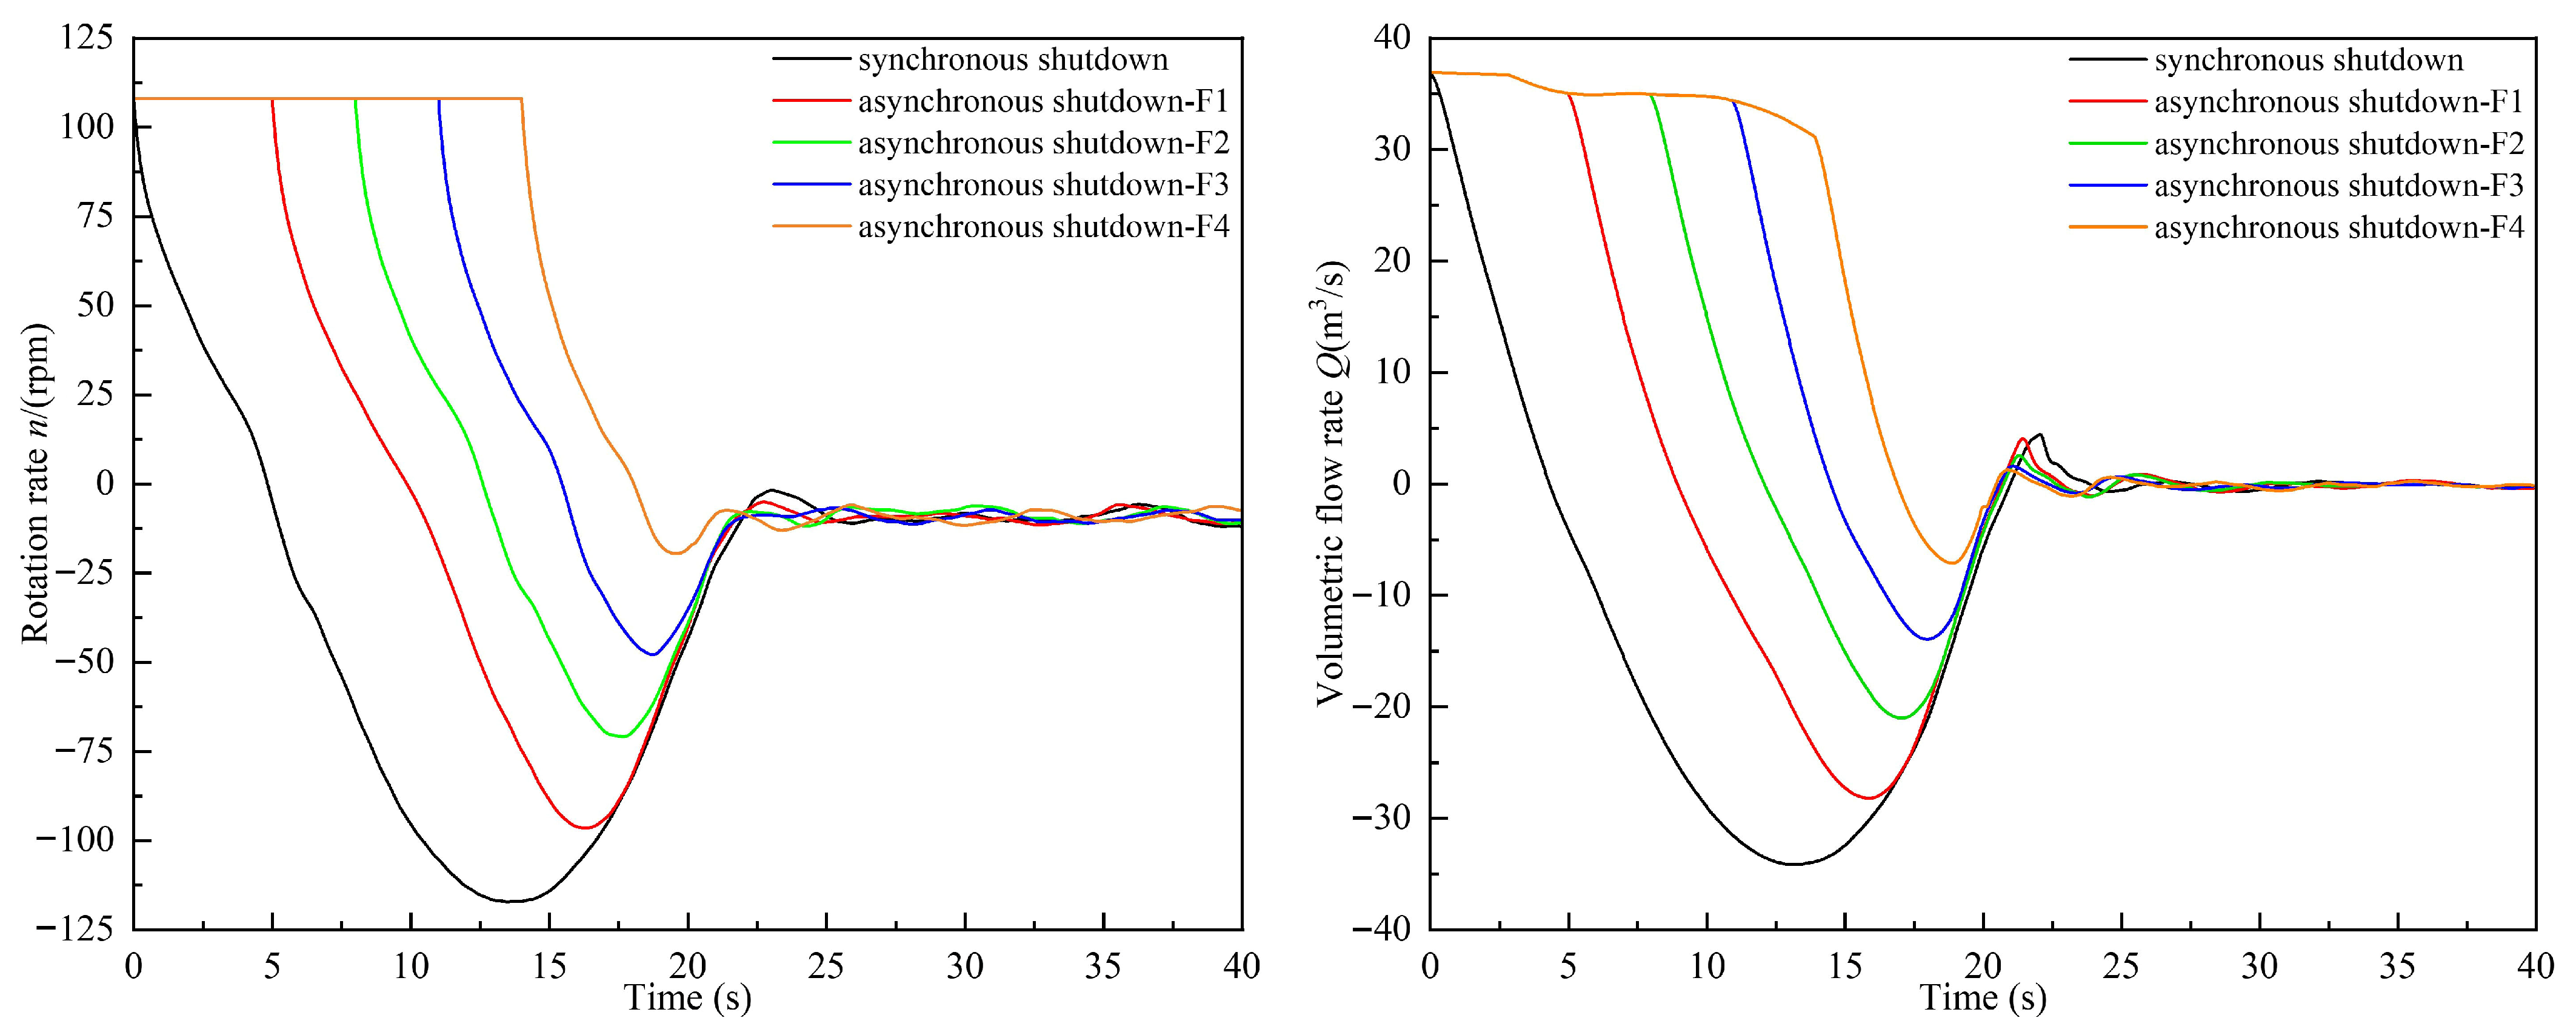
As shown in Figure 17, the maximum reversing rotation rate during shutdown for the asynchronous schemes F1 to F4 are 96.37 rpm, 70.77 rpm, 47.82 rpm, and 19.51 rpm, respectively. Compared to the maximum reverse rotation rate of 117.15 rpm during synchronous shutdown, it is decreased by 17.74%, 39.59%, 59.18%, and 83.35%, respectively. Similarly, the maximum reverse volumetric flow rates for schemes F1 to F4 are 28.21 m3/s, 21.00 m3/s, 13.92 m3/s, and 7.10 m3/s, corresponding to reductions of 17.32%, 38.45%, 59.20%, and 79.19%, respectively, relative to the synchronous shutdown value of 34.12 m3/s. These results demonstrate that the asynchronous shutdown method effectively mitigates both the maximum reverse rotation speed and volumetric flow rate. And in terms of time, it can be seen that the maximum reverse rotation rate of the pump and the maximum reverse volumetric flow rate occur almost at the same time during shutdown.
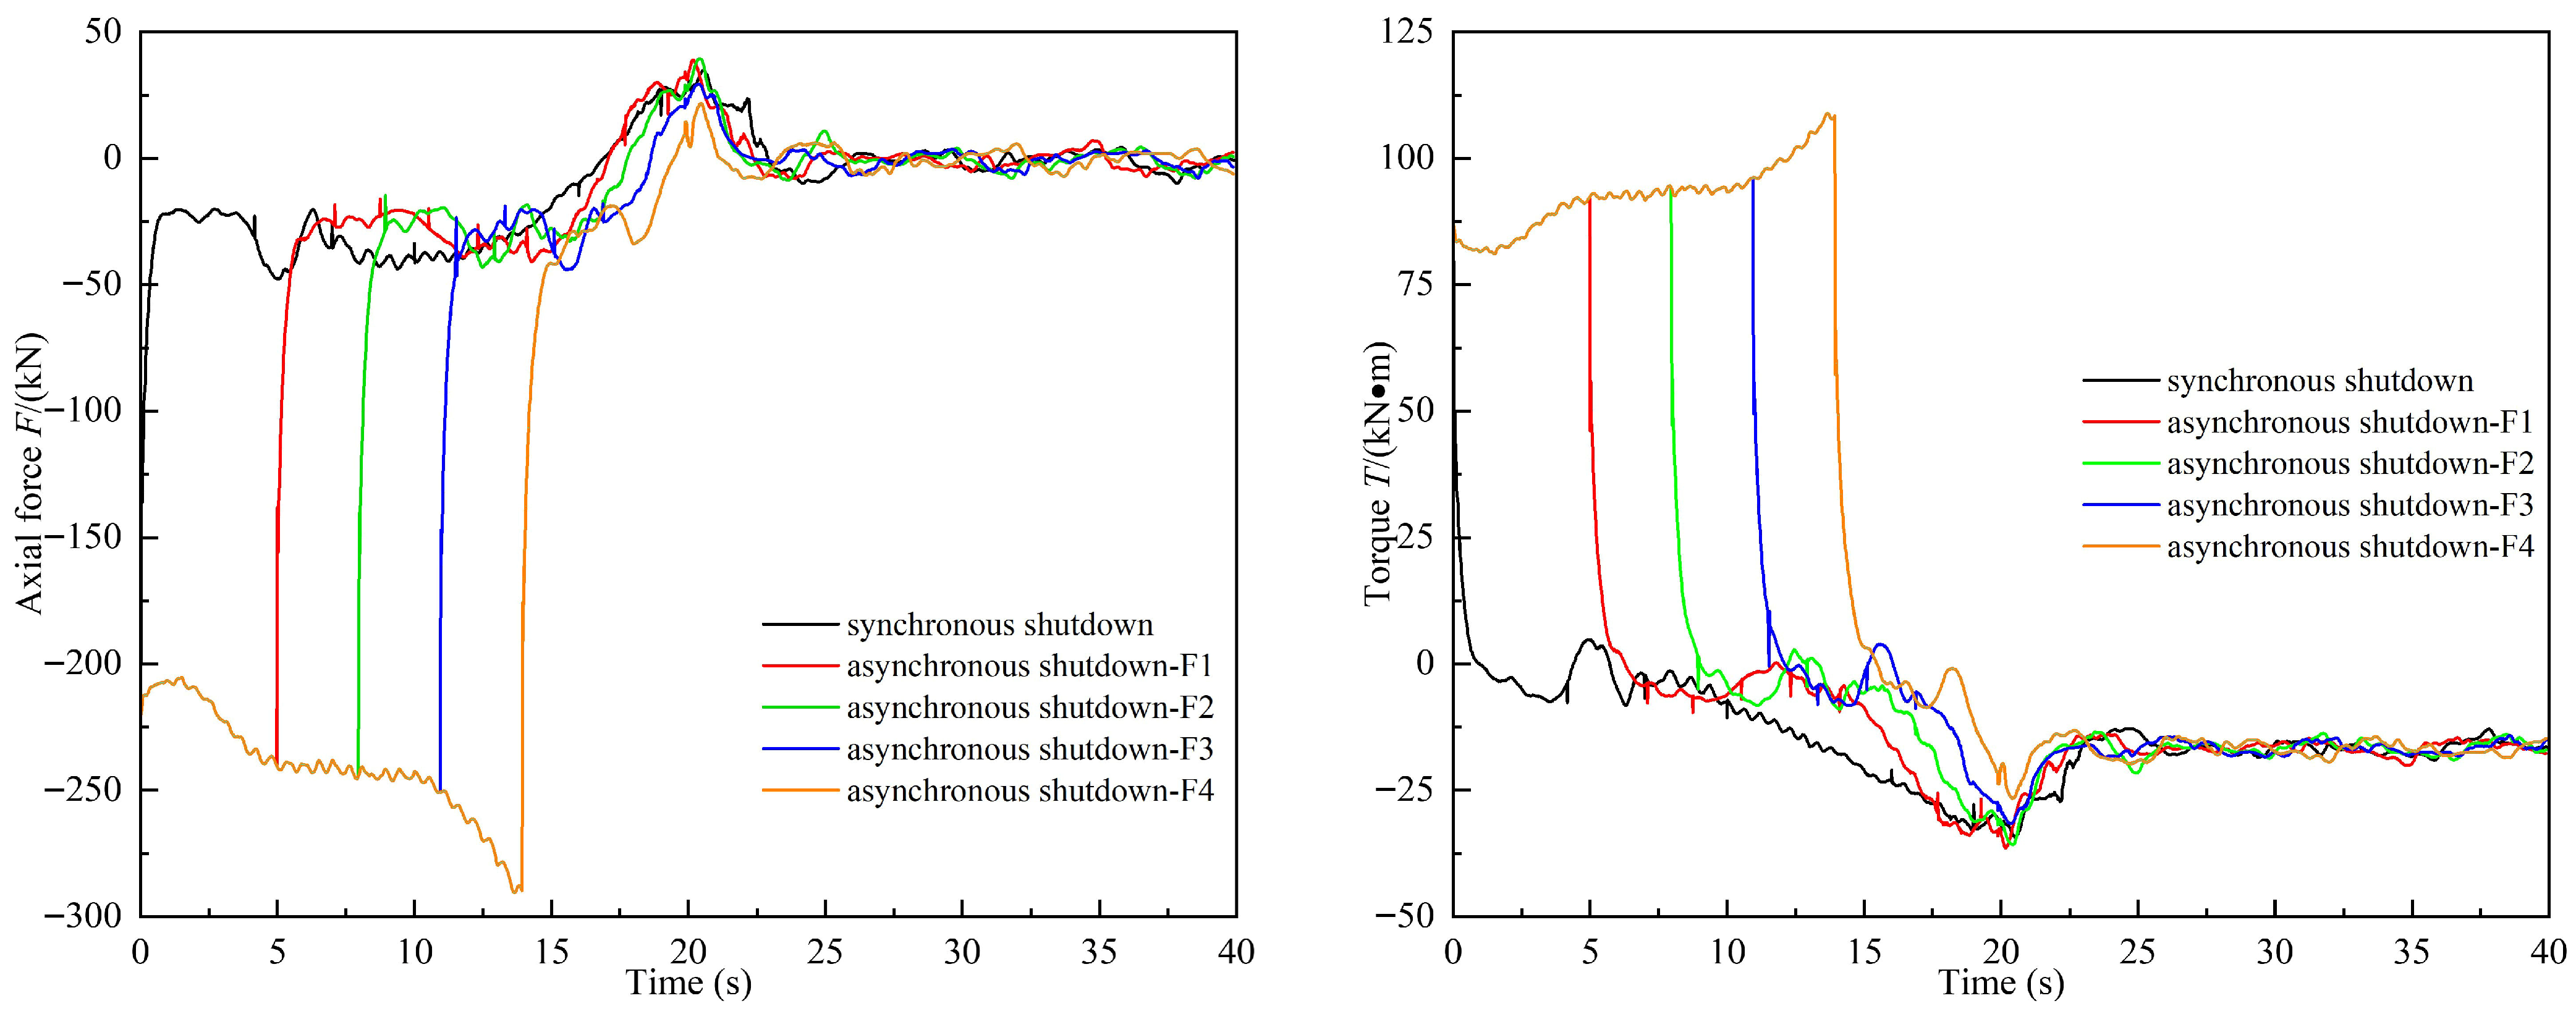
As shown in Figure 18, the maximum reverse axial force and torque schemes F1 to F3 show little difference from those in the synchronous shutdown case. In contrast, scheme F4 results in a significant reduction in both parameters. However, at the moment of pump power-off, the forward axial force and torque in scheme F4 are 289.709 kN and 150.089 kN·m, respectively, whereas the corresponding values during synchronous shutdown are 220.496 kN and 124.169 kN·m. Compared with the synchronous shutdown scheme, the positive axial force and positive torque of scheme F4 are increased by 31.82% and 21.65%. This is caused by the increase in hydraulic loss in the flow passage during the closure of the gate, and the constant head required by the pumping station leads to the change in motor output. Since the motor is designed with sufficient power margin, no overload occurs in scheme F4. Furthermore, the axial force is safely transmitted to the concrete structure through the composite support, thereby preventing damage to pump components.
Figure 19 shows that adopting the asynchronous shutdown method reduces the volume of air entering the outlet passage, with the reduction being more pronounced the earlier the gate is closed at the time of pump power-off. In scheme F4, air ingress through the vents is completely prevented, and consequently, no air enters the outlet passage throughout the entire shutdown process.

3.2.2. Comparison of Internal Characteristics During Shutdown Process of Different Schemes

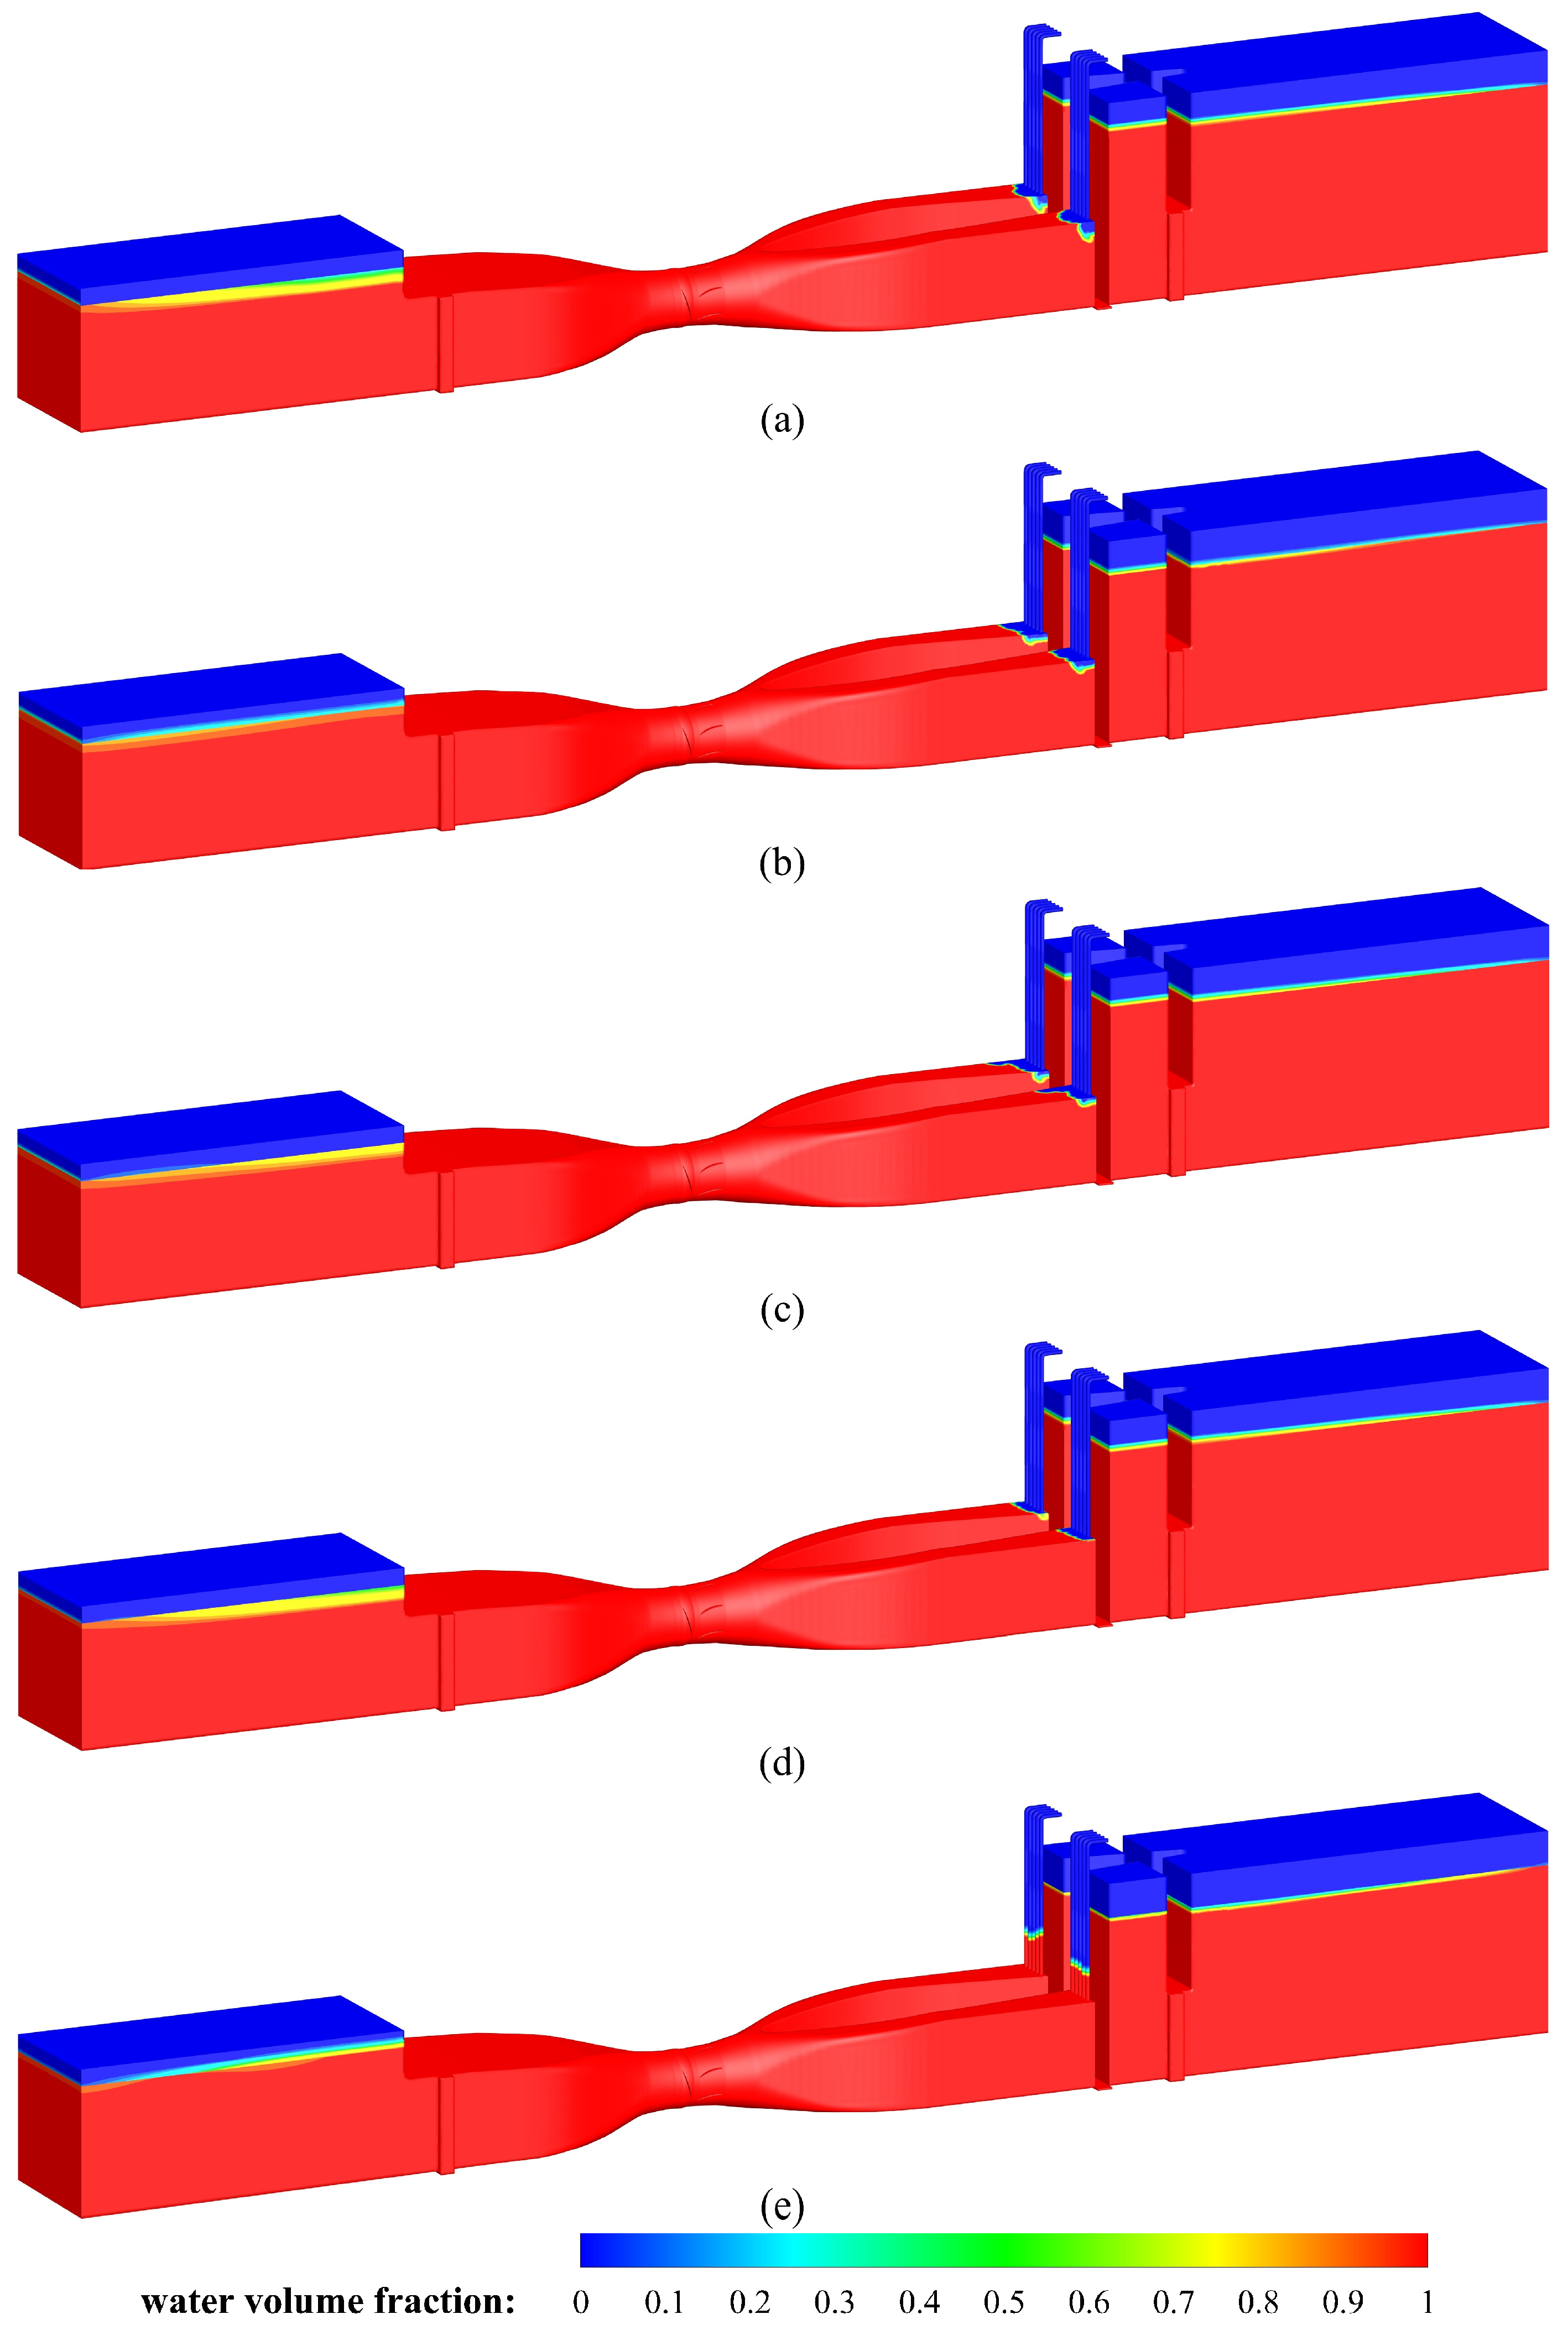
As established in Section 3.1, the lowest pressure in the outlet passage and the most pronounced low-pressure zones and vortices occur when the rapid gate is fully closed. Therefore, this specific moment is selected as a representative time to compare the characteristics across different shutdown schemes. As shown in Figure 20, in asynchronous shutdown schemes F3 and F4, the air volume in the outlet passage is significantly reduced at the time of gate closure. In particular, for scheme F4, the water level in the air vents remains at a considerable height when the gate is fully closed.
Figure 21 and Figure 22 display the internal state in outlet passage during shutdown process. As shown in Figure 21, the extent of the low-pressure zone monitored at the moment of complete gate closure decreases as the gate opening at pump power-off is reduced. There is basically no negative pressure zone in the outlet passage of scheme-F3 and scheme-F4. Figure 22 further shows that the flow rate beneath the rapid gate decreases correspondingly with the initial gate opening. Consequently, the vortex zone on the inner side of the gate also diminishes significantly due to the reduced flow rate.
The asynchronous shutdown method demonstrates significant advantages over the synchronous approach. Specifically, in the asynchronous shutdown-F4, the maximum reverse volumetric flow rate during shutdown is reduced by 79.19%, and the maximum reverse rotation rate is reduced by 83.35% compared to the synchronous method. During synchronous shutdown, the excessive reverse flow creates vortices on the inner side of the rapid gate. This leads to substantial negative pressure zones when the outlet passage gate is fully closed. In contrast, the asynchronous shutdown-F4 eliminates both these vortices and negative pressure zones, resulting in a safer and more stable shutdown process. Therefore, the asynchronous shutdown method presents more suitable solutions for irrigation pumping stations.

4. Conclusions

This study aims to address the current research gap concerning the internal flow characteristics of agricultural irrigation pump systems during the shutdown transition process. The reliability of the calculation model and methodology is verified by experimental data, enabling a high-fidelity numerical simulation of the pump shutdown process. A key contribution of this work is the first-time incorporation of air vent effects into the transition process simulation. Furthermore, the complete shutdown process is accurately captured by translating the two to three layers of mesh reserved for deformation below the elevation of the outlet passage bottom during dynamic mesh reconstruction. The main findings of this study are as follows:
(1)
During the synchronous shutdown, as the rapid gate gradually closes, the water flow rate beneath the rapid gate increases, resulting in a corresponding growth of the vortex zone on its inner side. When the rapid gate is 90% closed, negative pressure zones develop in the outlet passage. A portion of the air drawn into the outlet passage subsequently forms an air–water mixture near the top of the passage. Complete expulsion of this entrapped air requires approximately 40 min.
(2)
Compared with the synchronous shutdown, the asynchronous shutdown method effectively reduces both the reverse rotation rate and the reverse volumetric flow rate of the pump during the shutdown process. It also significantly diminishes the low-pressure zone at the top of the outlet passage and the vortex zone on the inner side of the gate. Although the torque and axial force of the pump increase during shutdown, these do not cause damage to the unit. Therefore, asynchronous shutdown is a safer and more reliable operational strategy.
(3)
During the shutdown process, when the rapid gate is completely closed, the water flow and pump do not stop immediately, and the two are still in reverse motion. A negative pressure condition develops in the outlet passage, which briefly draws in reverse flow. In this study, the adverse effects of water hammer are mitigated by air drawn into the outlet passage through the air vents. The introduced air alleviates the negative pressure and helps maintain flow continuity. Under the influence of inertia and air vents, the water flow appears in a short period of reciprocating motion after the gate closure, while the rotation rate of the pump impeller gradually decays to 0 rpm.
Previous studies on pump shutdown processes relied on one-dimensional computational methods or combined one-dimensional and three-dimensional approaches. These methods provided only partial parameter analysis and were unable to fully capture the internal flow dynamics within the passage during shutdown. This study overcomes these limitations by investigating actual pumping station shutdown processes. The results of this study can provide a reference for the operation and management of agricultural irrigation pumping stations and contribute to enhanced operational safety. While the method presented in this study applies to horizontal pumping stations, its key parameters are dependent on the specific water level, pump device performance, and gate movement relationship. In addition, this study has certain limitations. A limitation of this methodology is its inability to characterize the flow conditions in detail within the air vents and specific passage regions, which warrants further investigation.
Current research on transient processes in pump systems remains in its infancy. Given the similar shutdown mechanisms between vertical and horizontal configurations, the methodology developed in this study can be readily extended to analyze shutdown processes in vertical pump systems. Building upon this work, future research could also investigate pump start-up transients. Unlike shutdown processes, start-up analysis requires additional consideration of motor drag torque. Furthermore, comprehensive computational analysis of optimal shutdown strategies under various water level conditions could establish valuable datasets for pumping station operation. By integrating data-driven approaches such as machine learning, real-time adjustment of shutdown strategies based on actual operating conditions could be achieved, paving the way for intelligent control of pumping station operations.

Author Contributions

W.C.: data curation; software; visualization; writing—original draft preparation. W.L.: resource; writing—original draft preparation; funding acquisition. L.X.: supervision; writing—review and editing. H.D.: software; visualization. B.Z.: software; visualization. All authors have read and agreed to the published version of the manuscript.

Funding

This study was funded by the Water Conservancy Science and Technology Project of Jiangsu Province (Research and Demonstration of Key Technologies for Intelligent Irrigation and Drainage of High-standard Farmland) 2022060.

Institutional Review Board Statement

Not applicable.

Data Availability Statement

The data presented in this study can be made available upon request from the authors. The data are not publicly available due to privacy restrictions.

Conflicts of Interest

Hongfei Duan and Bo Zhu have successfully graduated from the research group with a master’s degree on 10 June 2025 and joined new companies. They participated in the research work of this article during their school years and have no other conflicts of interests. The other authors declare no conflicts of interest.

Abbreviations

The following abbreviations are used in this manuscript:
VOFVolume of Fluid
UDFUser-Defined Function

References

  1. Yan, D.F. Pumping Station Engineering; China Water Power Press: Beijing, China, 2005. [Google Scholar]
  2. Zhang, R.; Tan, S.Y.; Ding, X.J. Flow loss characteristics of a shaft tubular pump based on entropy production theory. Adv. Sci. Technol. Water Resour. 2022, 42, 6–12. [Google Scholar] [CrossRef]
  3. Yuan, R.; Jin, H.Y.; Xu, X.D. Physical model experimental analysis of bi-directional Shaft tubular pump device. Fluid Mach. 2020, 48, 7–13. [Google Scholar] [CrossRef]
  4. Fang, G.C.; Yang, J.F.; Kan, K.; Duan, H.L.; Guo, H.J. Hydraulic stability and dynamic stress analysis of large vertical shaft tubular pump under multiple working conditions. J. Yangtze River 2021, 52, 317–321. [Google Scholar] [CrossRef]
  5. Ji, D.; Lu, W.; Xu, B.; Xu, L.; Jiang, T. Study on the Energy Loss Characteristics of Shaft Tubular Pump Device under Stall Conditions Based on the Entropy Production Method. J. Mar. Sci. Eng. 2023, 11, 1521. [Google Scholar] [CrossRef]
  6. GB 50265-2022; Pumping Station Design Standards. Ministry of Housing and Urban-Rural Development of the People’s Republic of China, China Planning Press: Shanghai, China, 2022.
  7. García-Chica, A.; Rodriguez-Perez, A.M.; Caparros-Mancera, J.J.; Rodríguez-Gonzalez, C.A.; Chica, R.M. Integrated photovoltaic system for rainwater collection and sustainable irrigation. Irrig. Sci. 2025, 1–11. [Google Scholar] [CrossRef]
  8. Li, H.; Yao, G.L. Research development of the Transition Process of Pumping Station System Shutdown. Jilin Water Conserv. 2021, 1, 32–35. [Google Scholar] [CrossRef]
  9. Chen, S.S.; Zhou, Z.F.; He, Z.N.; Ge, Q.; Yan, D.F. Transient process of tubular pumping station with quick-stop gate breaking flow while pump is off. J. Hohai Univ. Nat. Sci. 2008, 36, 179–184. [Google Scholar]
  10. Chen, S.S.; Yan, D.F.; Jiang, L.J.; Lu, W.G.; Wang, L.S. Numerical Calculation of Hydraulic Transients for a Low-head Pumping station during Its Suspending Period. J. Trans. Chin. Soc. Agric. Mach. 2004, 35, 58–60+71. [Google Scholar]
  11. Zhou, D.Q.; Zhang, R.T.; Qu, B.; Wang, X.S.; Yan, Y.F. Research on hydraulic transient of vertical axial-flow pumping station at power failure. J. Hohai Univ. Nat. Sci. 2006, 3, 272–275. [Google Scholar]
  12. Song, J. Numerical Simulation of Dynamic Behavior with Rapid-Drop Gate in Vertical Axial Pumping Station During Its Suspending Period. Ph.D. Thesis, Hohai University, Nanjing, China, 2006. [Google Scholar]
  13. Hu, C.Y.; Zhang, X.W.; Tang, F.P.; Xu, X.D.; Huang, C.B.; Jing, L. Influence of Overflow Hole Diameter on Transition Process of Axial Flow Pump System. J. Trans. Chin. Soc. Agric. Mach. 2023, 54, 181–191. [Google Scholar] [CrossRef]
  14. Xu, W.J.; Xu, G.; Qian, C.; Ding, J.L.; Sun, Y.H.; Zhang, F.X.; Yang, F. Numerical calcu-lation and analysis of transition process of large shaft tubular pumping station. Water Resour. Power 2025, 43, 120–123+184. [Google Scholar] [CrossRef]
  15. Ding, C. Simulink Simulation of Low-Lift Pump Installation during Pump Stop. Guangdong Water Resour. Hydropower 2020, 9, 33–37. [Google Scholar]
  16. Xia, H.P. Study on Transition Process of Starting and Stopping of Vertical Shaft Crossflow Pump System. Ph.D. Thesis, Yangzhou University, Yangzhou, China, 2019. [Google Scholar]
  17. Jiao, H.F. Study on the Characteristics of the Start-up and Shutdown Transition Process of the Bi-Directional Full-Flow Pump. Ph.D. Thesis, Yangzhou University, Yangzhou, China, 2024. [Google Scholar]
  18. Jiao, H.F.; Chen, Z.G.; Wang, W.; Chen, S.S. Hydraulic Characteristics of Motor-pump during Shutdown Transition Process. Trans. Chin. Soc. Agric. Mach. 2023, 54, 236–245. [Google Scholar] [CrossRef]
  19. Li, Y.Y.; Guo, P.P.; Cao, M.J.; Sun, L.G. Investigation into the Energy Loss Mechanism of Pump Turbine During the Runaway Process Based on Entropy Production Theory. J. Phys. Conf. Ser. 2024, 2854, 012047. [Google Scholar] [CrossRef]
  20. Man, Z.; Xu, Z.; Gui, Z.H.; Han, W.F.; Zhao, Y.F.; Zhang, F.; Xu, L.C.; Zheng, Y.; Kan, K. Research on the performance of pump-turbine during the transition process from pump mode to turbine mode. Front. Energy Res. 2024, 12, 1421865. [Google Scholar] [CrossRef]
  21. Yang, L.; Xu, Z.; Zheng, Y. Study on shutdown transition process of large low head pumping station. J. Water Conserv. Constr. Manag. 2020, 40, 73–79. [Google Scholar] [CrossRef]
  22. Luo, W.; Chen, J. The simple algorithm of stop-pump water hammer. J. Drain. Irrig. Mach. Eng. 2005, 2, 16–19. [Google Scholar]
  23. Fan, X.J.; Song, B.B.; Xia, Y.B. Analysis of Water Hammer Protection in High Lift Water Pump System. Yellow River 2022, 44, 136–139+144. [Google Scholar] [CrossRef]
  24. Yang, J.J.; Gao, X.L. Study on transition process calculation and water hammer protection measures of pumping station. Shaanxi Water Resour. 2024, 11, 101–105. [Google Scholar] [CrossRef]
  25. Zhong, G.C.; Shao, C.L. Numerical simulation of gas-liquid twp-phase flow in pump during transition process of cutting off gas. Light Ind. Mach. 2021, 39, 30–36+42. [Google Scholar] [CrossRef]
  26. Kan, K.; Chen, H.; Zheng, Y.; Zhou, D.; Binama, M.; Dai, J. Transient characteristics during power-off process in a shaft extension tubular pump by using a suitable numerical model. Renew. Energy 2020, 164, 109–121. [Google Scholar] [CrossRef]
  27. Zhao, Y.P.; Li, Z.H.; Liao, W.L.; Luo, X.Q. Numerical investigation of free surface effect on performance of bulb turbine. J. Hydroelectr. Eng. 2018, 37, 8–14. [Google Scholar] [CrossRef]
  28. Zhang, F.L. Protection of water hammer in pumping station by air vents. Shandong Water Resour. 2011, 3, 16+18. [Google Scholar] [CrossRef]
  29. Liu, Z.R. Calculation of water hammer and protective measures for stopping pump. Gansu Shuili Shuidian Jishu 2004, 3, 235–236+238. [Google Scholar]
  30. Hua, Y. Analysis of Unsteady Flow in Hydraulic Turbine with Dynamic Mesh Technology. Ph.D. Thesis, Xi’an University of Technology, Xi’an, China, 2009. [Google Scholar]
  31. Kan, K.; Zheng, Y.; Chen, H.X.; Zhou, D.Q.; Dai, J.; Binama, M.; Yu, A. Numerical simulation of transient flow in a shaft extension tubular pump unit during runaway process caused by power failure. Renew. Energy 2020, 154, 1153–1164. [Google Scholar] [CrossRef]
  32. Ge, X.F.; Zhang, J.; Zhang, J.; Liu, D.M.; Zheng, Y.; Chen, H.X. Review of Research on the Three-Dimensional Transition Process of Large-Scale Low-Lift Pump. Energies 2022, 15, 8338. [Google Scholar] [CrossRef]
  33. Zhang, X.W.; Tang, F.P.; Liu, C.; Shi, L.J.; Liu, H.Y.; Sun, Z.Z.; Hu, W.Z. Numerical Simulation of Transient Characteristics of Start-Up Transition Process of Large Vertical Siphon Axial Flow Pump station. Front. Energy Res. 2021, 9, 706975. [Google Scholar] [CrossRef]
  34. Ahn, S.H.; Xiao, Y.; Wang, Z.; Zhou, X.; Luo, Y. Numerical prediction on the effect of free surface vortex on intake flow characteristics for tidal power station. Renew. Energy 2017, 101, 617–628. [Google Scholar] [CrossRef]
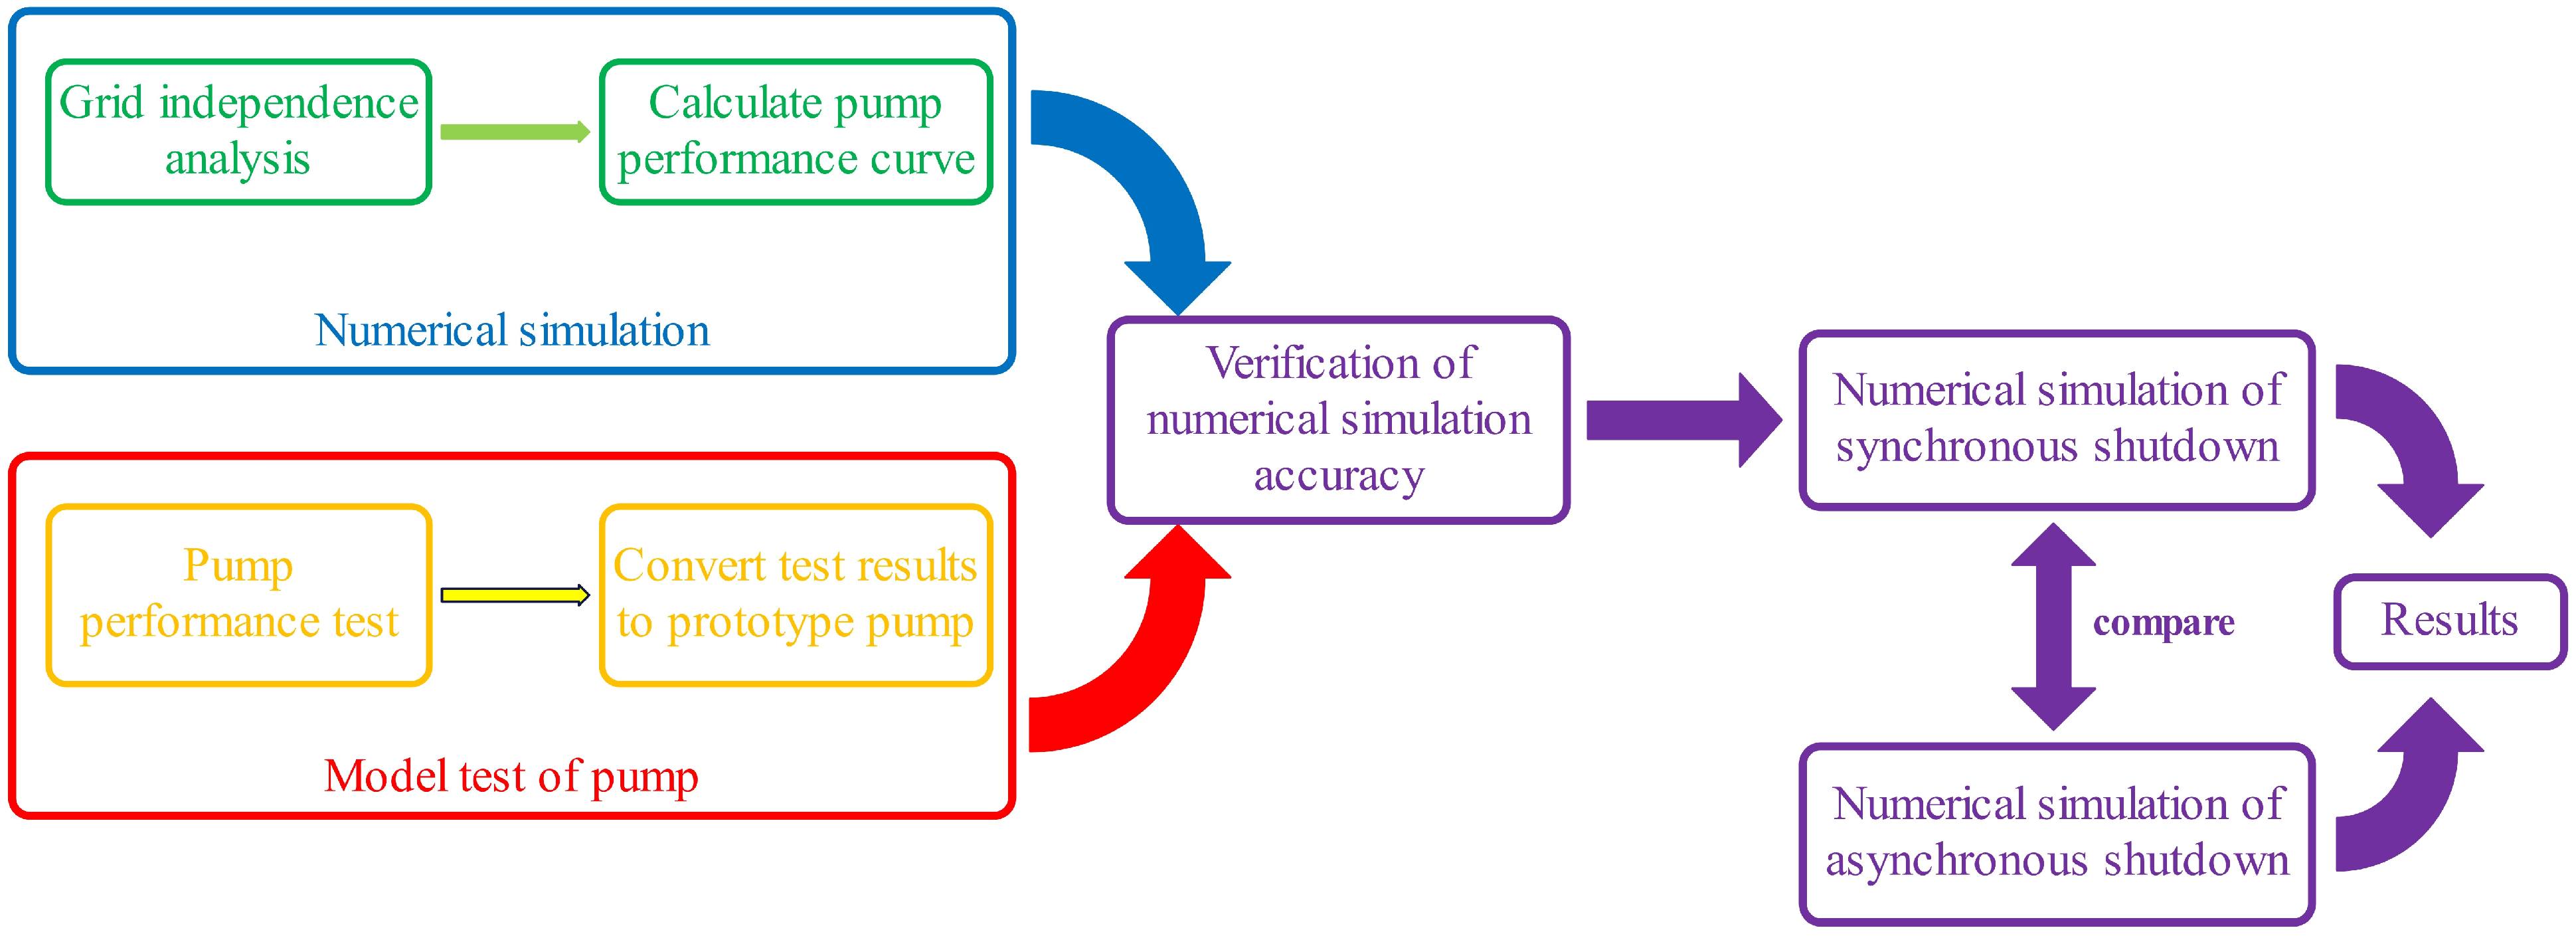
Figure 1. Flow chart of study.
Agriculture 15 02241 g001
Figure 2. Calculation model of pump device. (a) three-dimensional model of pump device; (b) schematic plan view of pump device.
Agriculture 15 02241 g002
Figure 3. Grid independence analysis.
Agriculture 15 02241 g003
Figure 4. Figures of grids (a) impeller; (b) guide vane.
Agriculture 15 02241 g004
Figure 5. Flow chart of the calculation process.
Agriculture 15 02241 g005
Figure 6. Physical diagrams of experiment. (a) pump test bench; (b) impeller; (c) impeller observation window.
Agriculture 15 02241 g006
Figure 7. Comparison of experimental and numerical simulation results.
Agriculture 15 02241 g007
Figure 8. Curves of external characteristic parameters variations during shutdown process.
Agriculture 15 02241 g008
Figure 9. Schematic diagram of the position of the pressure monitoring section.
Agriculture 15 02241 g009
Figure 10. Curves of pressure variations during shutdown process.
Agriculture 15 02241 g010
Figure 11. Curves of pressure and air variations during shutdown process.
Agriculture 15 02241 g011
Figure 12. Curve of air volume change in the outlet passage during shutdown process.
Agriculture 15 02241 g012
Figure 13. Internal flow state of pump device during shutdown process. (a) t = 0 s; (b) t = 5 s; (c) t = 10 s; (d) t = 15 s; (e) t = 17.5 s; (f) t = 18 s; (g) t = 19 s; (h) t = 20 s.
Agriculture 15 02241 g013
Figure 14. Pressure variation of outlet passage during shutdown process. (a) t = 0 s; (b) t = 17.5 s; (c) t = 18 s; (d) t = 18.5 s; (e) t = 20 s; (f) t = 21.08 s; (g) t = 25 s; (h) t = 2400 s.
Agriculture 15 02241 g014
Figure 15. Air–water two-phase distribution of pump device during shutdown process. (a) t = 0 s; (b) t = 10 s; (c) t = 15 s; (d) t = 18.38 s; (e) t = 20 s; (f) t = 21.08 s; (g) t = 40 s; (h) t = 135 s; (i) t = 535 s; (j) t = 2400 s.
Agriculture 15 02241 g015
Figure 16. The position of rapid gate at the moment of motor power-off.
Agriculture 15 02241 g016
Figure 17. Curves of volumetric flow rate and pump rotation rate variation.
Agriculture 15 02241 g017
Figure 18. Curves of axial force and torque variation.
Agriculture 15 02241 g018
Figure 19. Curves of air volume variation in the outlet passage.
Agriculture 15 02241 g019
Figure 20. Comparison of air-water two-phase of different schemes. (a) synchronous shutdown; (b) asynchronous shutdown F1; (c) asynchronous shutdown F2; (d) asynchronous shutdown F3; (e) asynchronous shutdown F4.
Agriculture 15 02241 g020
Figure 21. Comparison of pressure in the outlet passage of different schemes. (a) synchronous shutdown; (b) asynchronous shutdown F1; (c) asynchronous shutdown F2; (d) asynchronous shutdown F3; (e) asynchronous shutdown F4.
Agriculture 15 02241 g021
Figure 22. Comparison of internal flow in the outlet passage of different schemes. (a) synchronous shutdown; (b) asynchronous shutdown F1; (c) asynchronous shutdown F2; (d) asynchronous shutdown F3; (e) asynchronous shutdown F4.
Agriculture 15 02241 g022
Table 1. Main test instruments of test bench.
Measuring ParametersTest InstrumentInstrument ModelMeasuring Error
HeadDifferential pressure transmitterLDG-500s±0.1%
Flow rateElectromagnetic flowmeterV15712-HD1A1D7D±0.2%
Torque and rotation speedTorque and speed sensorJCZL2-500±0.1%
Table 2. Set up comparison schemes.
SchemeOpening Degrees
synchronous shutdown100%
asynchronous shutdown-F175%
asynchronous shutdown-F260%
asynchronous shutdown-F345%
asynchronous shutdown-F430%
Disclaimer/Publisher’s Note: The statements, opinions and data contained in all publications are solely those of the individual author(s) and contributor(s) and not of MDPI and/or the editor(s). MDPI and/or the editor(s) disclaim responsibility for any injury to people or property resulting from any ideas, methods, instructions or products referred to in the content.