Article

Coffee Farming in the Sierra Norte Region of Puebla, Mexico: A Multivariate Analysis Approach to Productive Dedication

by
Zayner Edin Rodríguez-Flores
1,
Cesar San-Martín-Hernández
1,*,
Victorino Morales-Ramos
2,
Victor Hugo Volke-Haller
1,
Juliana Padilla-Cuevas
1 and
Carlos Hernández-Gómez
1
1
Department of Soil Science, College of Postgraduates in Agricultural Sciences Campus Montecillo, Montecillo, Texcoco 56264, MX, Mexico
2
Department of Coffee Science and Technology, College of Postgraduates in Agricultural Sciences Campus Cordoba, Amatlan de los Reyes, Cordoba 94946, VER, Mexico
*
Author to whom correspondence should be addressed.
Agriculture 2025, 15(21), 2192; https://doi.org/10.3390/agriculture15212192
Submission received: 11 September 2025 / Revised: 5 October 2025 / Accepted: 14 October 2025 / Published: 22 October 2025
(This article belongs to the Section Agricultural Systems and Management)

Abstract

Puebla is Mexico’s third largest coffee-producing state, supporting more than 40,000 families in the Sierra Norte region alone. In this area, the heterogeneity of production, which ranges from traditional subsistence methods to technified models, and a significant difference in the level of dedication to production represent major challenges for the sustainability of coffee farming. This study aimed to classify coffee producers in the Tlaxcalantongo ejido, Xicotepec, Puebla, according to their level of productive dedication, using multivariate techniques such as hierarchical clustering, non-metric multidimensional scaling (NMDS), and Random Forest. Data were obtained from a structured questionnaire with 102 questions administered in person to 50 active producers. The cluster analysis found patterns and differences in the productive dedication of coffee growers that allowed them to be differentiated into two groups. Group 1 (8%) showed minimal fertilization practices and low operating expenses, reflecting significant differences in resource management. In contrast, producers in group 2 (92%) had a profile characterized by intensive fertilization practices, greater investment in inputs, and structured agronomic management. In the NMDS analysis, dimension 1 was significantly associated with the group of producers with low productive dedication and dimension 2 was significantly associated with the group with greater dedication, while the third dimension showed no clear differentiation between the groups. The variables that determined the productive dedication profiles were fertilization application, division, type, and expenditure.

1. Introduction

Coffee is one of the most widely consumed agri-food products worldwide [1]. It is a beverage appreciated for its aroma and flavor but also a crop recognized as an economic driver in many countries around the world [2]. In Mexico, coffee cultivation is an important economic pillar for more than 500,000 families, mostly small producers living in mountainous regions with high biodiversity [3]. The different microclimates and altitudes in Mexico allow coffee to be grown in different states of the country, such as Chiapas, Veracruz, and Puebla, the main coffee producers in Mexico, which account for around 80% of the national production of coffee cherries [4].
Puebla ranks third in coffee production volume in the country, contributing around 12% of the national total, with an average yield of 3.37 tons per hectare [5]. Coffee cultivation is strategic for the economic growth of the state of Puebla, as it represents 15% of the state’s agricultural gross domestic product [6]. There are three coffee-growing regions in Puebla, each comprising municipalities and ejidos, the latter being collective territorial units run by producers from a given community that play a key role in agricultural production [5,7]. The region with the largest area and coffee production is the Sierra Norte de Puebla, a staple crop that supports more than 40,000 families [5], where municipalities such as Xicotepec, Zihuateutla, and Cuetzalan del Progreso stand out, with the production of more than 31,000 tons of coffee cherries annually. In some ejidos in the Sierra Norte de Puebla, such as Tlaxcalantongo and Cacahuatlán, coffee farming is deeply linked to the cultural identity of the indigenous and mestizo communities, where this agricultural activity has been developed since the mid-20th century [8,9].
In terms of the agroforestry systems described by Moguel and Toledo (1999), producers in the Tlaxcalantongo ejido tend to maintain a traditional polyculture system, characterized by manipulation of the natural ecosystem, where coffee plants grow in rows under the combined canopy of native and introduced trees [10]. Coffee cultivation in the Sierra Norte de Puebla is an activity that combines ancestral practices with modern production systems, generating employment and conserving mesophilic mountain forest ecosystems [8,9,11,12]. However, this sector faces growing challenges, such as international price volatility, the impacts of climate change, and lack of access to technologies and fair markets [13,14]. In addition to these problems, there is still a marked heterogeneity in production. Traditional low-yield systems coexist in the region with technified models aimed at maximizing productivity [15,16], which in recent decades has become a topic of academic and political interest [17]. In the Sierra Norte region of Puebla, coffee farming has been studied from various perspectives. Barrera et al. (2021) documented models of innovation in coffee production, showing how producers have incorporated technological and organizational changes in a highly heterogeneous context [15]. Hernández-Castaño and Hebert Calderón (2023) analyzed the perception of the effects of climate change and the adaptation practices implemented by coffee growers in Puebla, highlighting the region’s increasing vulnerability [13]. From an ethnobotanical perspective, Martínez et al. (2007) highlighted traditional community knowledge about coffee, its pests, and diseases [12]. Studies show the economic, cultural, and environmental relevance of coffee in Puebla; however, most focus on qualitative or sectoral aspects and do not quantitatively address the productive heterogeneity of coffee growers.
In this coffee-growing region, productive heterogeneity reflects a marked contrast in the production chain, where producers who use extractive and subsistence methods coexist and those who apply greater productive dedication, a latent variable defined as the level of commitment that producers devote to the crop, measured through indicators such as the number of days worked, investment in fertilizers and agrochemicals, the implementation of agronomic practices (pruning, shade management, pest control), and the use of agricultural technologies to improve efficiency. In this sense, productive dedication is a multidimensional concept that integrates key dimensions: economic (amount invested in inputs and fertilization), labor (human effort and number of workdays), and technical (diversity and intensity of agronomic practices). This approach is closely related to the notion of agricultural management intensity, which refers to the degree of effort sustained over time to maintain or increase productivity [18], as well as agricultural complexity, understood as the simultaneous articulation of multiple management practices [19]. By defining these dimensions, productive dedication becomes a useful framework for characterizing the heterogeneity of Puebla’s coffee growers and, at the same time, establishing comparisons with other agricultural systems in Latin America, where typological studies have characterized coffee growers based on criteria such as technological intensity, access to specialized markets, or management complexity [20,21,22].
This divergence reflects inequalities in access to resources, information asymmetries, and differences in productive dedication, with which agronomic practices and resources are applied in crop management.
One of the problems with this heterogeneity is that it limits the implementation of effective public policies and access to resources, and leads to differences in profitability [23]. Furthermore, the lack of studies that characterize this diversity from a quantitative and complex perspective hinders the design of interventions tailored to the different profiles of coffee growers, which would allow for more specific and efficient allocation of support, technical assistance, or resources.
In this scenario, multivariate techniques such as hierarchical clustering, non-metric multidimensional scaling (NMDS), and machine learning models such as Random Forest are essential tools for analyzing complex and heterogeneous systems. These methodologies make it possible to reduce the dimensionality of multiple variables (e.g., agronomic practices, access to resources, technological level) [24], group producers into coherent profiles [25], build clusters by identifying patterns and gaps, and assess the relative contribution of each variable in the formation of these clusters [26]. Its application in agricultural studies has proven particularly useful for designing evidence-based public policies, as it provides a comprehensive view of productive diversity and its determinants [27,28]. In the states of Chiapas and Oaxaca, studies have been developed that seek to understand the heterogeneity of producers, identifying differentiated profiles through multivariate analysis. In Chiapas, for example, producers have been characterized according to their technological intensity, access to specialized markets, and climate resilience, while in Oaxaca, typologies have been established based on agroecological practices, social capital, and links to organic certifications [29,30,31,32]. These studies show that the segmentation of producers does not respond to one-dimensional criteria, but rather to complex configurations where technical, socioeconomic, and cultural variables interact. However, in Puebla, despite the documented coexistence of traditional indigenous systems, contract farming schemes, and technified models, there are no published studies that systematize producer typologies under any criteria. This omission represents a significant gap in the literature, given that the region requires comparative analyses based on numerical evidence to better understand its productive diversity and guide appropriate policies.
In this context, the following working hypothesis was proposed: in the Tlaxcalantongo ejido, there are at least two contrasting levels of productive dedication among coffee producers, defined mainly by differences in the management of fertilization and agronomic resources. To test this hypothesis, the following research questions were formulated: (i) Are there different levels of productive dedication among producers in the Tlaxcalantongo ejido? (ii) What are the characteristics of the different levels of productive dedication?
This study aims to identify and classify coffee producers in the Tlaxcalantongo ejido, Xicotepec, Puebla, according to their level of productive dedication, using a series of multivariate analyses with information on agronomic practices and resource management. The approach is predominantly descriptive and quantitative, focusing on characterizing productive profiles based on variables related to the intensity and technical management of the crop. The aim is to provide empirical information, based on quantifiable data obtained directly from producers, that contributes to the design of strategies aimed at strengthening resilient coffee farming; that is, a system capable of adapting to climatic, economic, and social changes without compromising its long-term viability.

2. Materials and Methods

2.1. Study Site

The study was conducted in the community of Tlaxcalantongo, Xicotepec, located in the Sierra Norte de Puebla at coordinates 20°18′49″ N and 97°52′17″ N at an altitude of 661 m above sea level. (Figure 1). The area corresponding to the Tlaxcalantongo ejido is divided into six non-contiguous zones, named Las Cureñas (LC), San Antonio (SA), San Braulio (SB), Agua Salada (AS), El Conejo (EC), and Nueva Orleans (NO). Within the six zones, the community organization is made up of 205 producers who carry out agricultural activities such as livestock farming, particularly cattle, as well as the production of crops such as oranges, corn, honey, lychee, lemons, ginger, ornamental plants, and coffee. According to the records of the Tlaxcalantongo ejido assembly, only 75 producers have registered coffee cultivation as their main productive activity in five of the six zones (LC, SA, NO, SB, AS).

2.2. Population and Selection Strategy

According to the records of the Tlaxcalantongo ejido assembly, only 75 producers have registered coffee cultivation as their main productive activity in five of the six zones (LC, SA, NO, SB, AS). During the data collection process, it was identified that 25 producers were in the process of transitioning to other crops (mainly ginger and citrus fruits), so they were not included in the study.
During the second quarter of 2024, data was collected through a structured survey consisting of 102 questions administered to active coffee producers in the Tlaxcalantongo ejido (S1). The survey was designed to gather information in three main categories:
Socio-economic data. This included descriptive demographic variables, as well as data related to fertilization costs and operating costs associated with production.
Agronomic data. This covered crop management practices such as fertilization, pruning, pest control, disease control, weed control, and harvesting processes.
Service data. Focused on aspects related to organic production, access to inputs, machinery, availability of technical advice, and marketing channels.
The sampling frame consisted of 50 active coffee growers, all of whom were interviewed, forming a census of the active population in 2024. The surveys were conducted in person by a team of three trained interviewers, accompanied by the ejido authority for the initial contact and during one of the bimonthly sessions held by the ejido. Each interview lasted approximately 30–35 min and was conducted with the prior informed consent of the participants. To ensure the quality of the information, incomplete or inconsistent responses were reviewed in the field, verifying them directly with the respondent at the time of application. In the few cases of omission, the responses were recorded as missing values without subsequent imputation. Likewise, efforts were made to minimize possible self-reporting biases through cross-checking questions and by limiting third-party intervention during the interviews.

2.3. Data Analysis

Sociodemographic and Agricultural Characteristics of Coffee Growers

Initially, descriptive analysis was carried out using statistics such as mean, minimum value, maximum value, frequency, etc., on the general characteristics of the ejido producers.
A set of 12 variables directly related to productive dedication was selected, which were chosen to comprehensively evaluate performance and commitment in the workplace (Table 1). These variables included aspects such as economic expenditure on fertilization per cycle, number of workdays per cycle, application and type of fertilization, management and frequency of pruning of coffee trees and shade trees, pest and disease control, and weed management and control. The analysis of these variables provided a detailed and objective view of the level of dedication and productivity of individuals within a work environment.

2.4. Identification of Homogeneous Groups

Considering that the study population comes from a single ejido, with a limited sample size (n = 50), hierarchical cluster analysis was used to determine homogeneous groups, using Gower’s distance and the average linkage method to identify natural clusters within the data. In addition, the silhouette index was used to determine the optimal number of clusters, allowing for more accurate segmentation. Subsequently, non-metric multidimensional scaling (NMDS) was performed, with three dimensions and a maximum of 100 attempts to achieve convergence, using the same Gower distance.

Factors Determining Productive Dedication Profiles

Finally, to evaluate the contribution of each variable to the separation of the clusters, a Random Forest machine learning model was constructed with 500 trees, taking the group resulting from the cluster analysis as the dependent variable and the 12 variables associated with productive dedication as independent variables. The importance of the variables was calculated using the reduction in model accuracy (Mean Decrease Accuracy) and node purity (Mean Decrease Gini) as parameters. A test set of 30% of the randomly selected data was used to validate the model, and its accuracy was evaluated using a confusion matrix. These combined approaches allowed for a comprehensive exploration of the patterns and relationships present in the analyzed dataset. There are other statistical tools for investigating the effect of independent variables on the probability of belonging to a particular group, such as multinomial logistic models, which require a larger sample size than that obtained in this study.

2.5. Statistical Analysis

Statistical analyses were performed in the RStudio v2024.12.0 environment [33] for the R v4.4.2 programming language [34]. The following packages were used: stats v4.4.2 for descriptive statistical calculations [34], cluster v2.1.6 to implement hierarchical cluster analysis [35], fpc v2.2-13 to visualize the optimal number of clusters using the silhouette index [36], vegan v2.6-6.1 to perform non-metric multidimensional scaling (NMDS) [37], and randomForest v4.7-1.2 for the construction and validation of the Random Forest machine learning model [38].

3. Results

3.1. Sociodemographic and Agricultural Characteristics of Coffee Growers

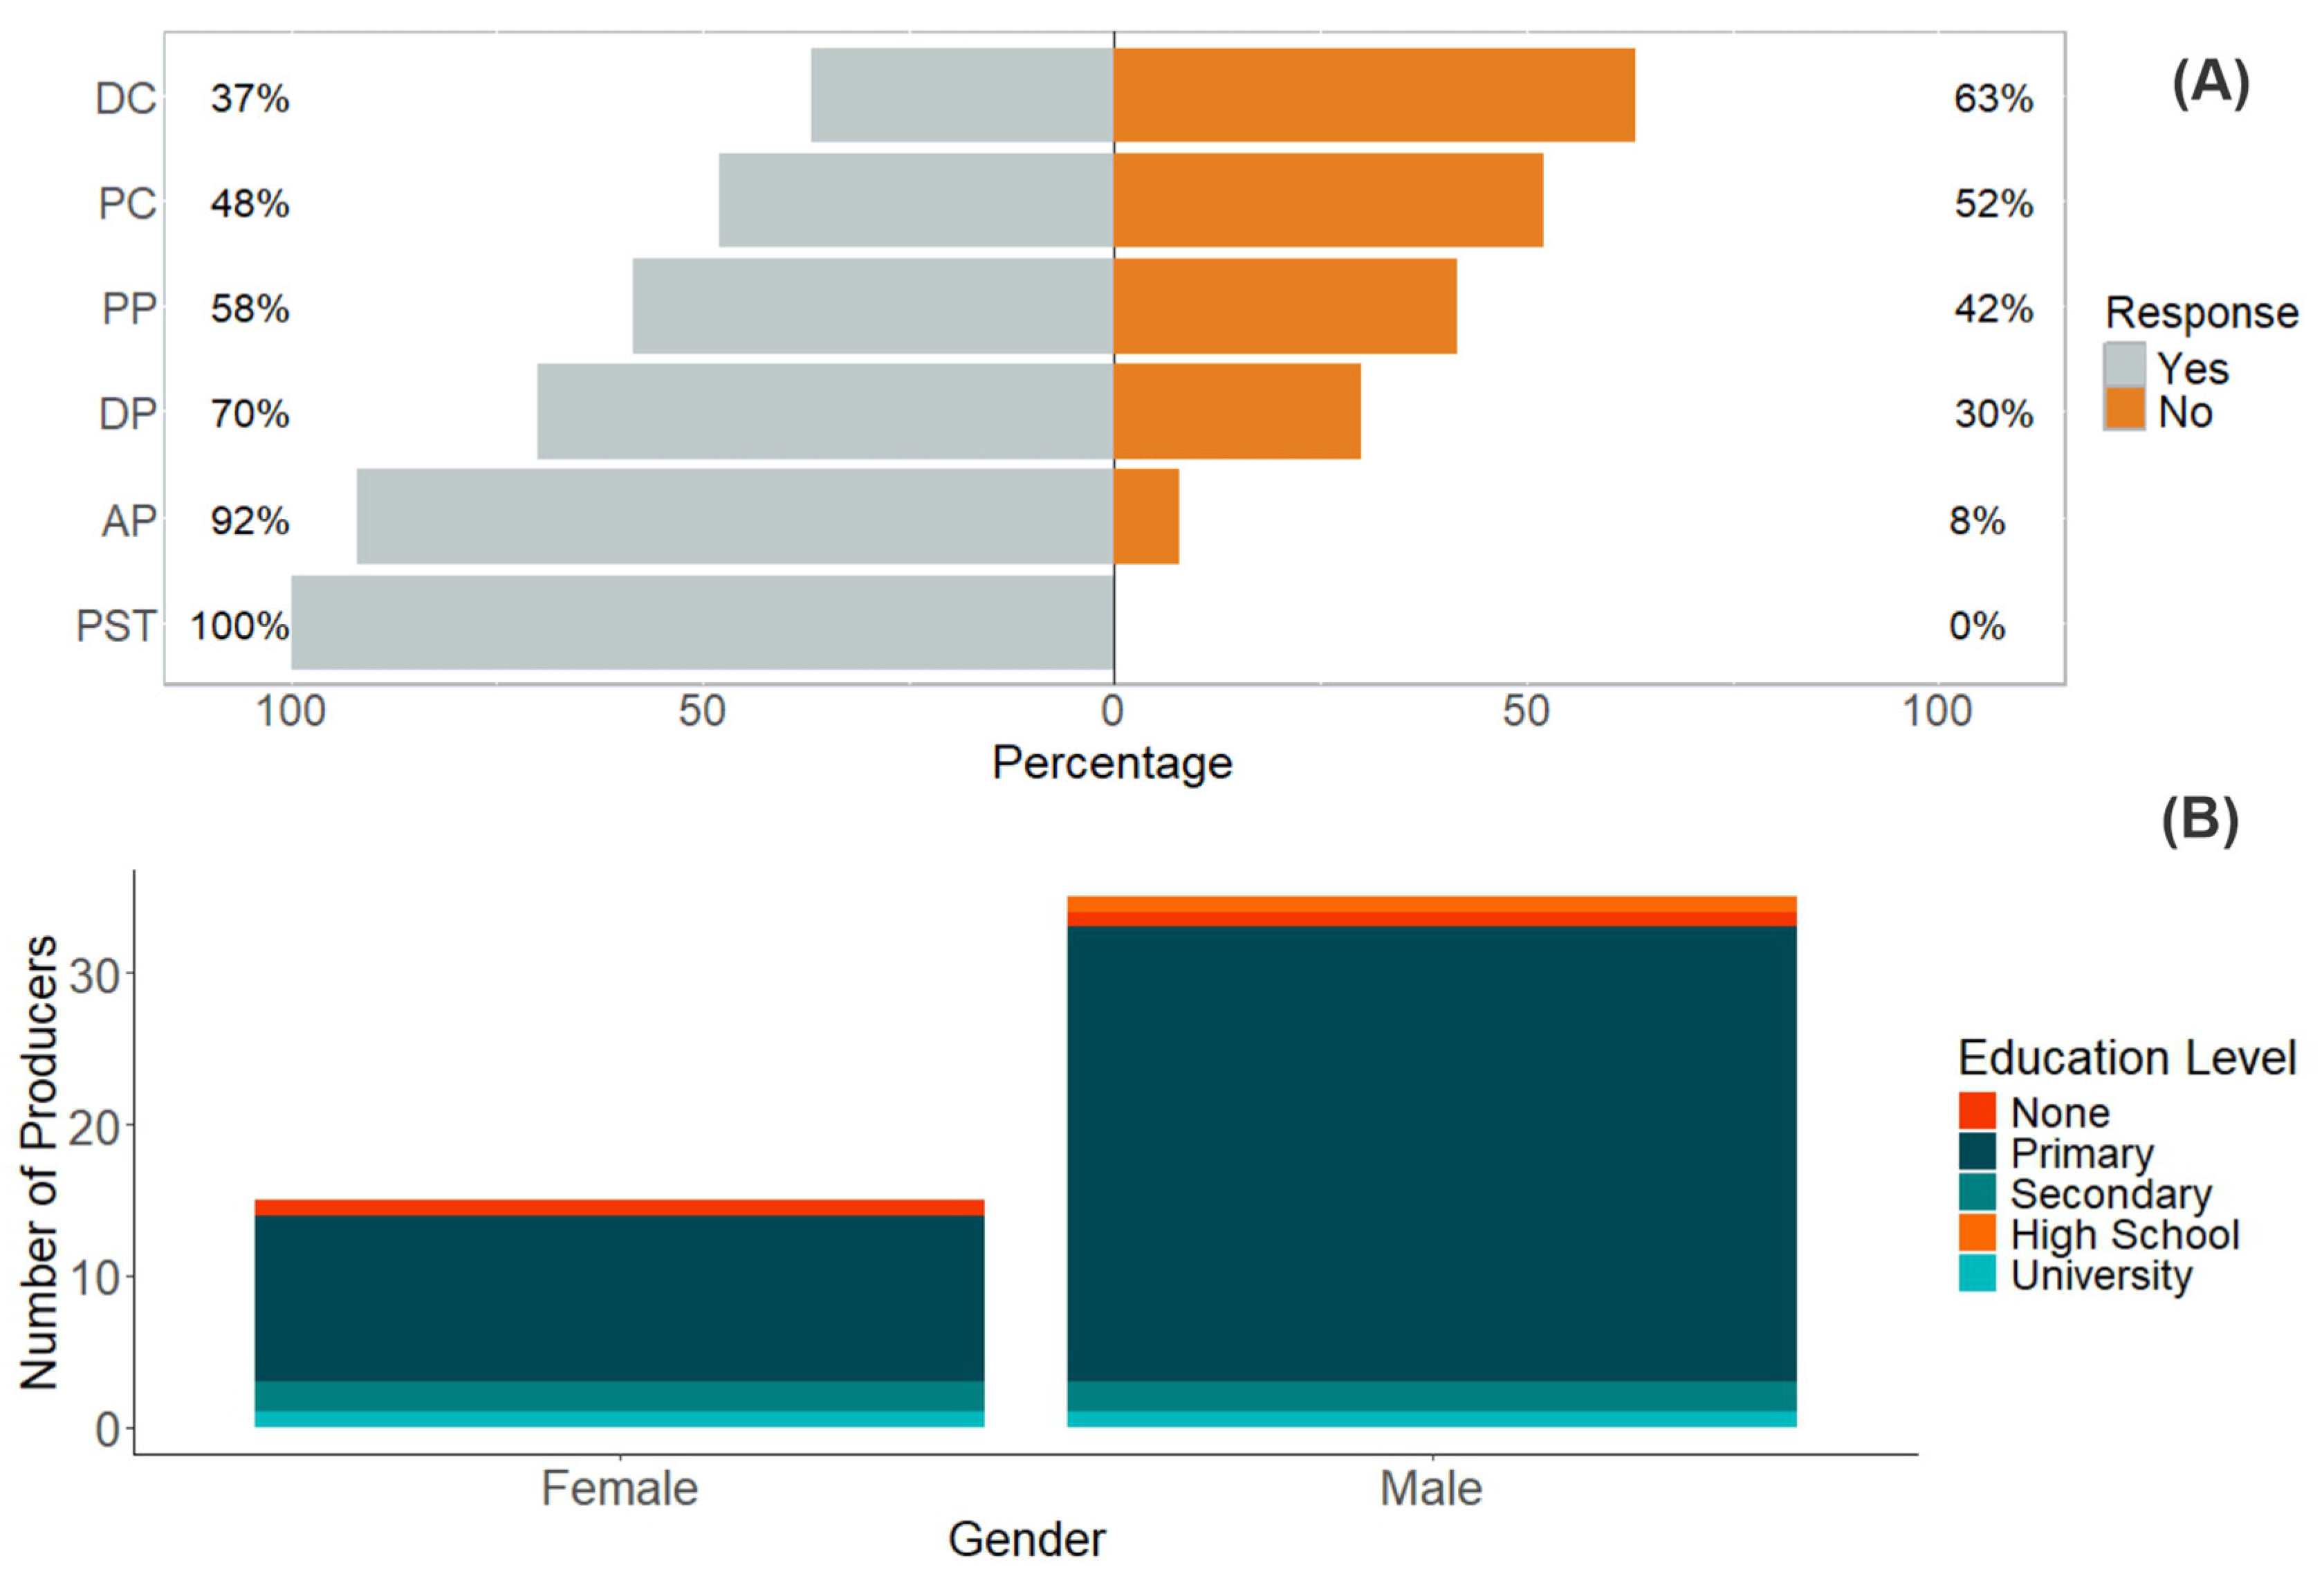
The population of producers studied consists mainly of elderly people, with an average age of 64, reflecting the predominance of coffee farming led by older generations, with little participation by young people in the activity. The gender composition showed a greater presence of men (70%) than women (30%), although several interviews mentioned the active participation of the entire family in the work on the coffee farm. In terms of educational level, a predominantly basic profile was observed: 82% attended primary school and only 14% reached secondary or higher levels, while 4% had no access to formal education. (Figure 2B).
In terms of production, the area cultivated per producer was relatively small, with an average of 1.7 ha (range 0.25–5 ha), indicating a predominance of small family-run production units. Yields averaged 2 Mg ha−1, although with marked variability (0.75–3.75 Mg ha−1). On average, each coffee grower reported having two varieties of coffee on their plots, with a maximum of three; the Catimores family was the most common, present in 84% of cases. In terms of agricultural practices, 92% of producers apply chemical fertilizers directly to the soil. Pruning is widely practiced, although with varying intensity: 6% of respondents indicated that they perform the four recommended types of pruning (sanitation, suckering, rejuvenation/resepa, and plant formation), while the majority (86%) reported performing only suckering. With regard to phytosanitary management, 48% stated that they implement integrated pest control techniques and 36% for diseases. However, when asked about the presence of pests, 58% mentioned the coffee berry borer (Hypothenemus hampei), while 70% indicated having had problems with some disease, including eye spot (Mycena citricolor), leaf rust (Pellicularia koleroga), and coffee rust (Hemileia vastatrix), even in plots with a predominance of Catimores (Figure 2A).
In addition to agronomic and educational characteristics, the study revealed significant limitations in access to services and infrastructure. The community does not have local agricultural machinery services or fertilizer distributors, so producers can only access these inputs and services by traveling to neighboring towns or cities, which increases their costs and hinders their ability to work. In terms of coffee plantation renewal, 50% of producers establish their own nurseries within their plots, while the other 50% acquire plant material from neighboring producers, reflecting the absence of community or institutional nurseries. None of the interviewees reported receiving support from academic or research institutions to solve technical problems in cultivation, and all stated that they did not have private or government advice; only about 30% of producers indicated that they belonged to federal programs such as Sembrando Vida or Fertilizantes para el Bienestar. With regard to marketing, only 10% (5 producers) manage to sell parchment or ground coffee, while the remaining 90% sell cherry coffee, with a lower profit margin, as a result of selling to intermediaries. Likewise, all respondents stated that they had not received training in organic agriculture or participated in certification processes, which limits their possibilities of accessing differentiated markets with greater added value.

Identification of Homogeneous Groups

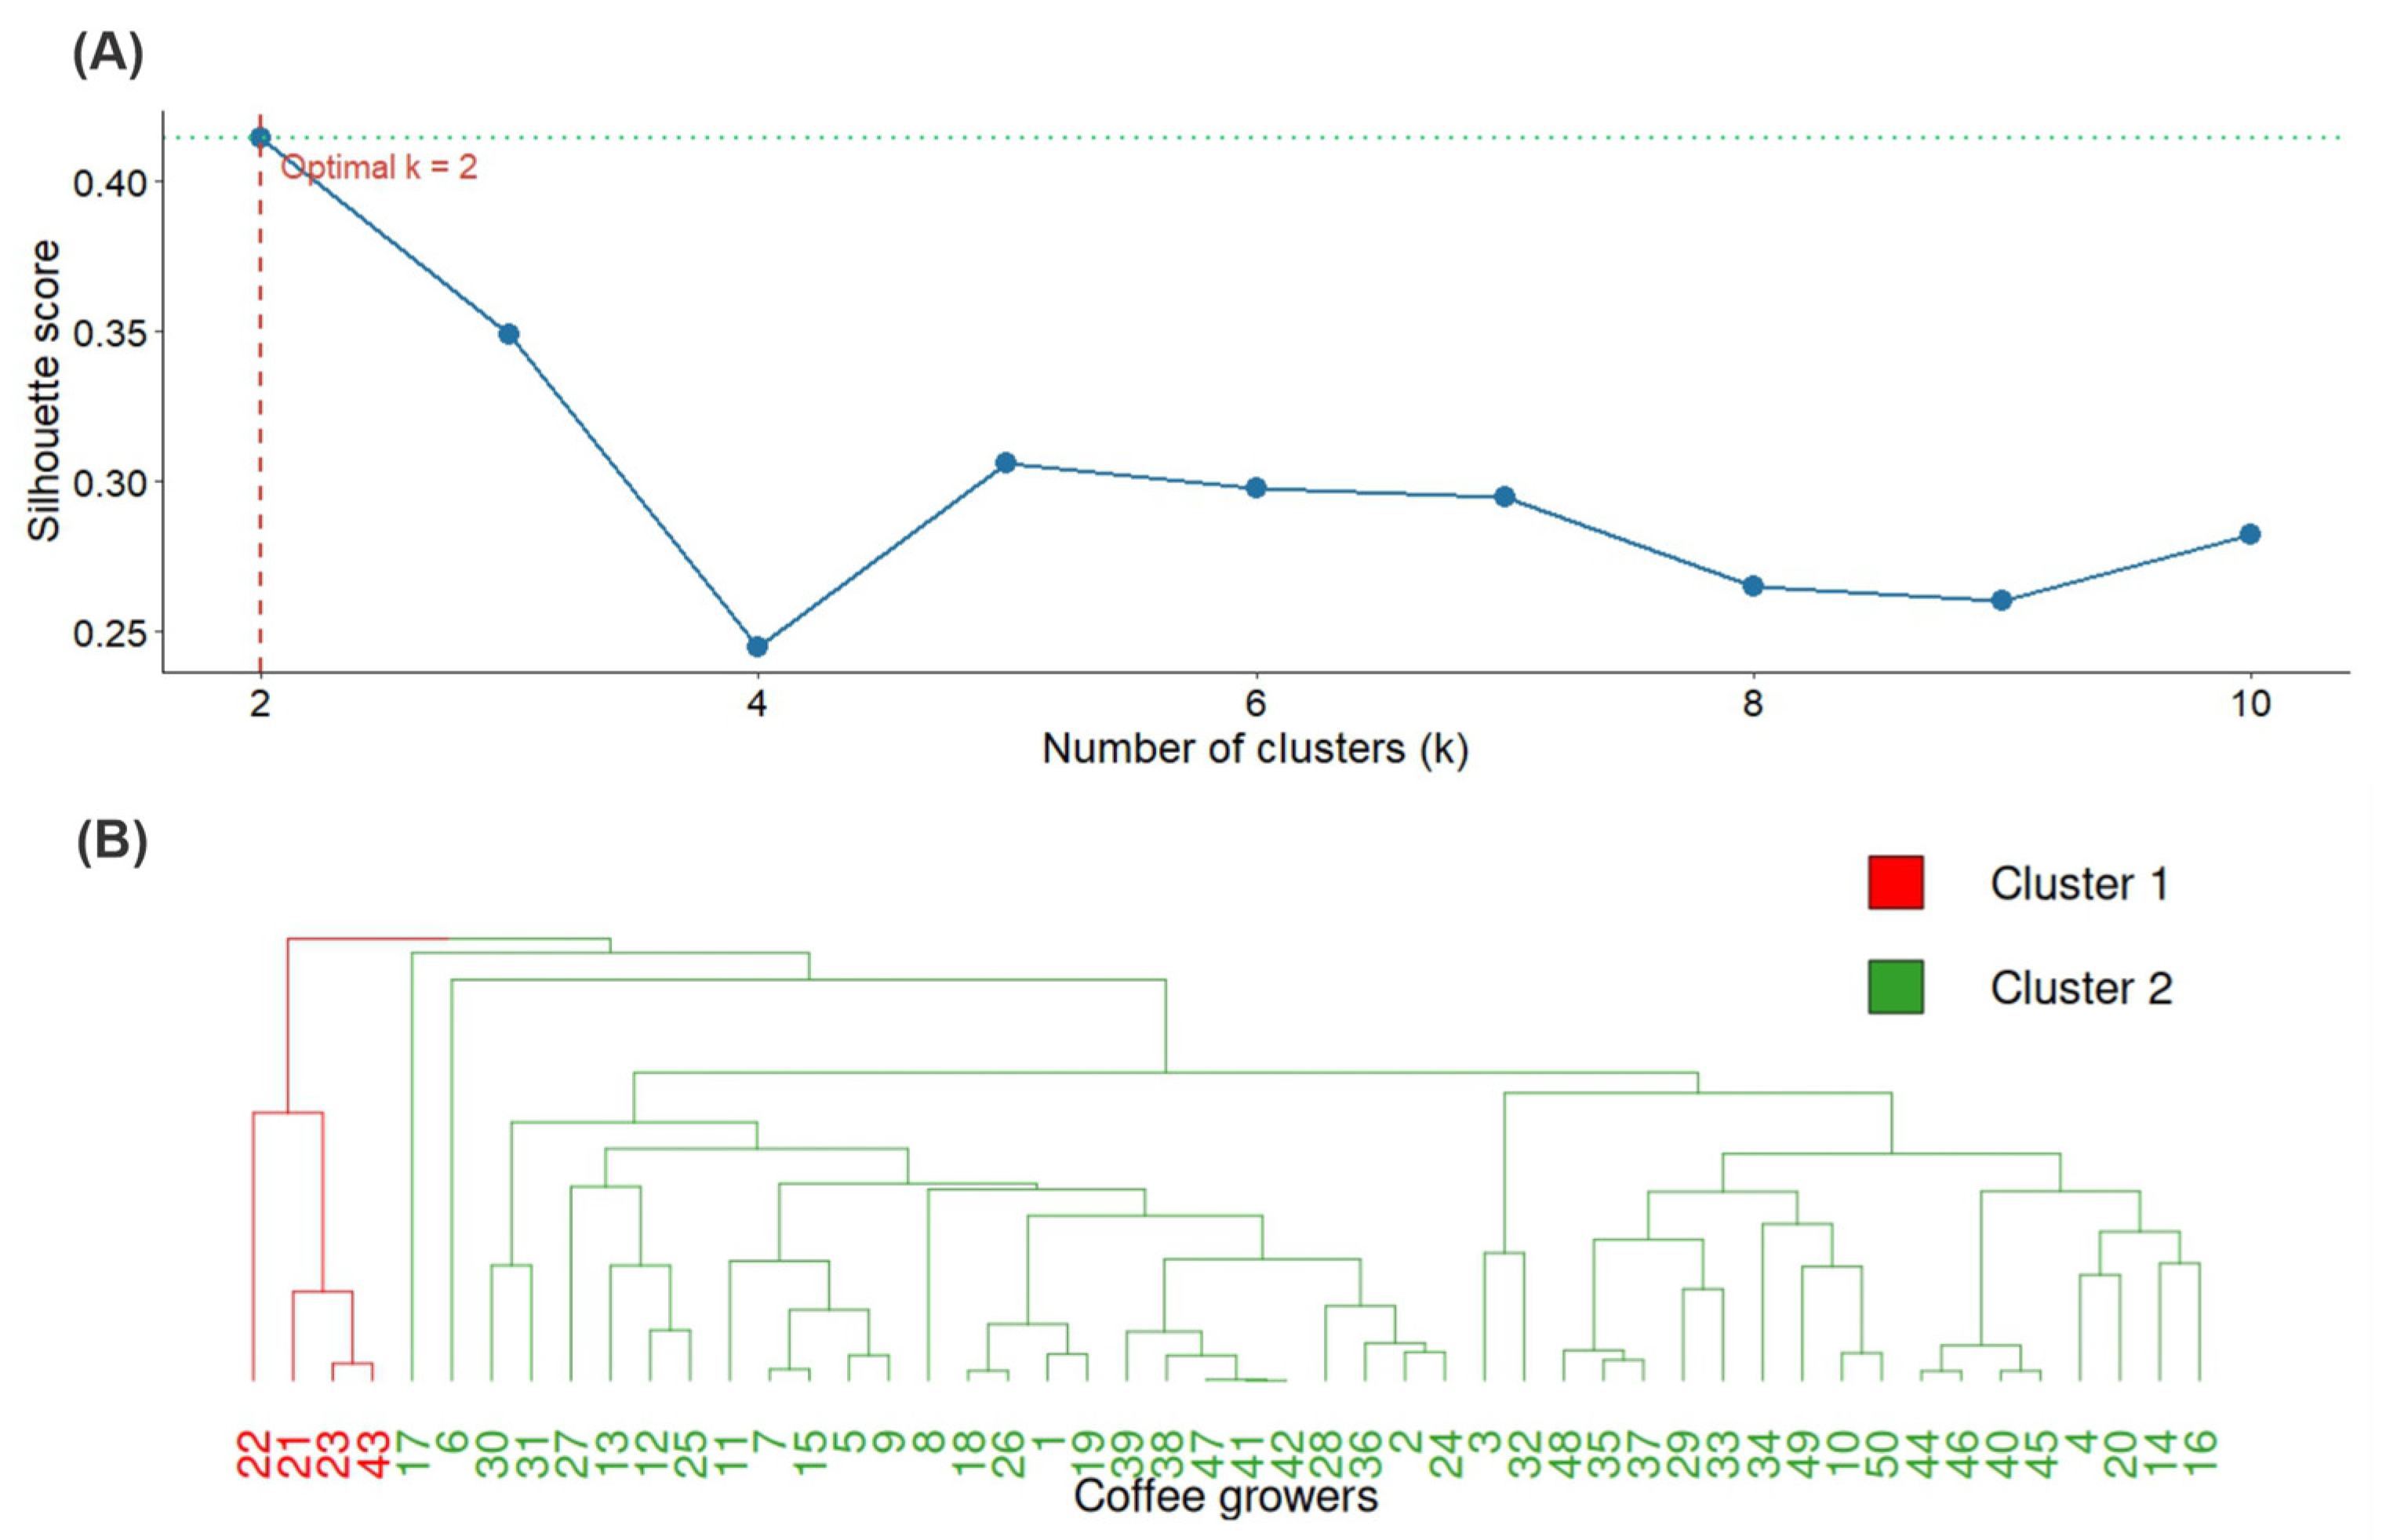
The silhouette index, applied to determine the optimal number of clusters, suggested two groups as the most appropriate configuration (Figure 3A). This choice was based on the point where the reduction in the total sum of intra-cluster squares began to stabilize, indicating that a greater number of clusters would not significantly improve the homogeneity of the groups.
Hierarchical cluster analysis identified two distinct producer profiles (Figure 3B). Cluster 1 (8% of the sample, n = 4) corresponds to coffee growers with lower production intensity, characterized by not applying any type of fertilization, allocating a small number of labor days per cycle, and spending limited amounts on agronomic practices. In contrast, Cluster 2 (92%, n = 46) groups together producers with greater dedication to production, who carry out fertilization activities, allocate more economic resources to this area, employ a greater number of laborers in agronomic tasks (weed control, fertilization, pruning), apply different types of pruning more comprehensively, and report more frequent pest and disease control. It should be noted that producers 6 and 17 presented atypical characteristics within this second cluster, which explains small variations with respect to the general classification without affecting the separation observed between the groups. (Table 2)
The nonmetric multidimensional scaling (NMDS) analysis in three dimensions yielded a stress value of 0.126, indicating an adequate fit of the model to the data in this study. A clear visualization of the Gower distances of coffee growers in a two-dimensional space was obtained, using dimensions 1 and 2 as the principal axes (Figure 4). Dimensions 1 and 2 of the NMDS analysis clearly discriminated between levels of productive dedication: dimension 1 (Low productive dedication) was associated with producers with lower dedication, while dimension 2 (High productive dedication) corresponded to those with higher dedication. In contrast, dimension 3 did not show a clear separation between groups, as both presented a similar distribution along this axis, indicating that it reflects a component common to all coffee growers. Some outliers were identified that did not follow the general pattern, although this did not affect the differentiation observed in the first two axes. Taken together, dimensions 1 and 2 constitute the main axes of separation, while dimension 3 represents a shared variable not directly linked to productive dedication.

3.2. Determining Factors in Productive Dedication Profiles

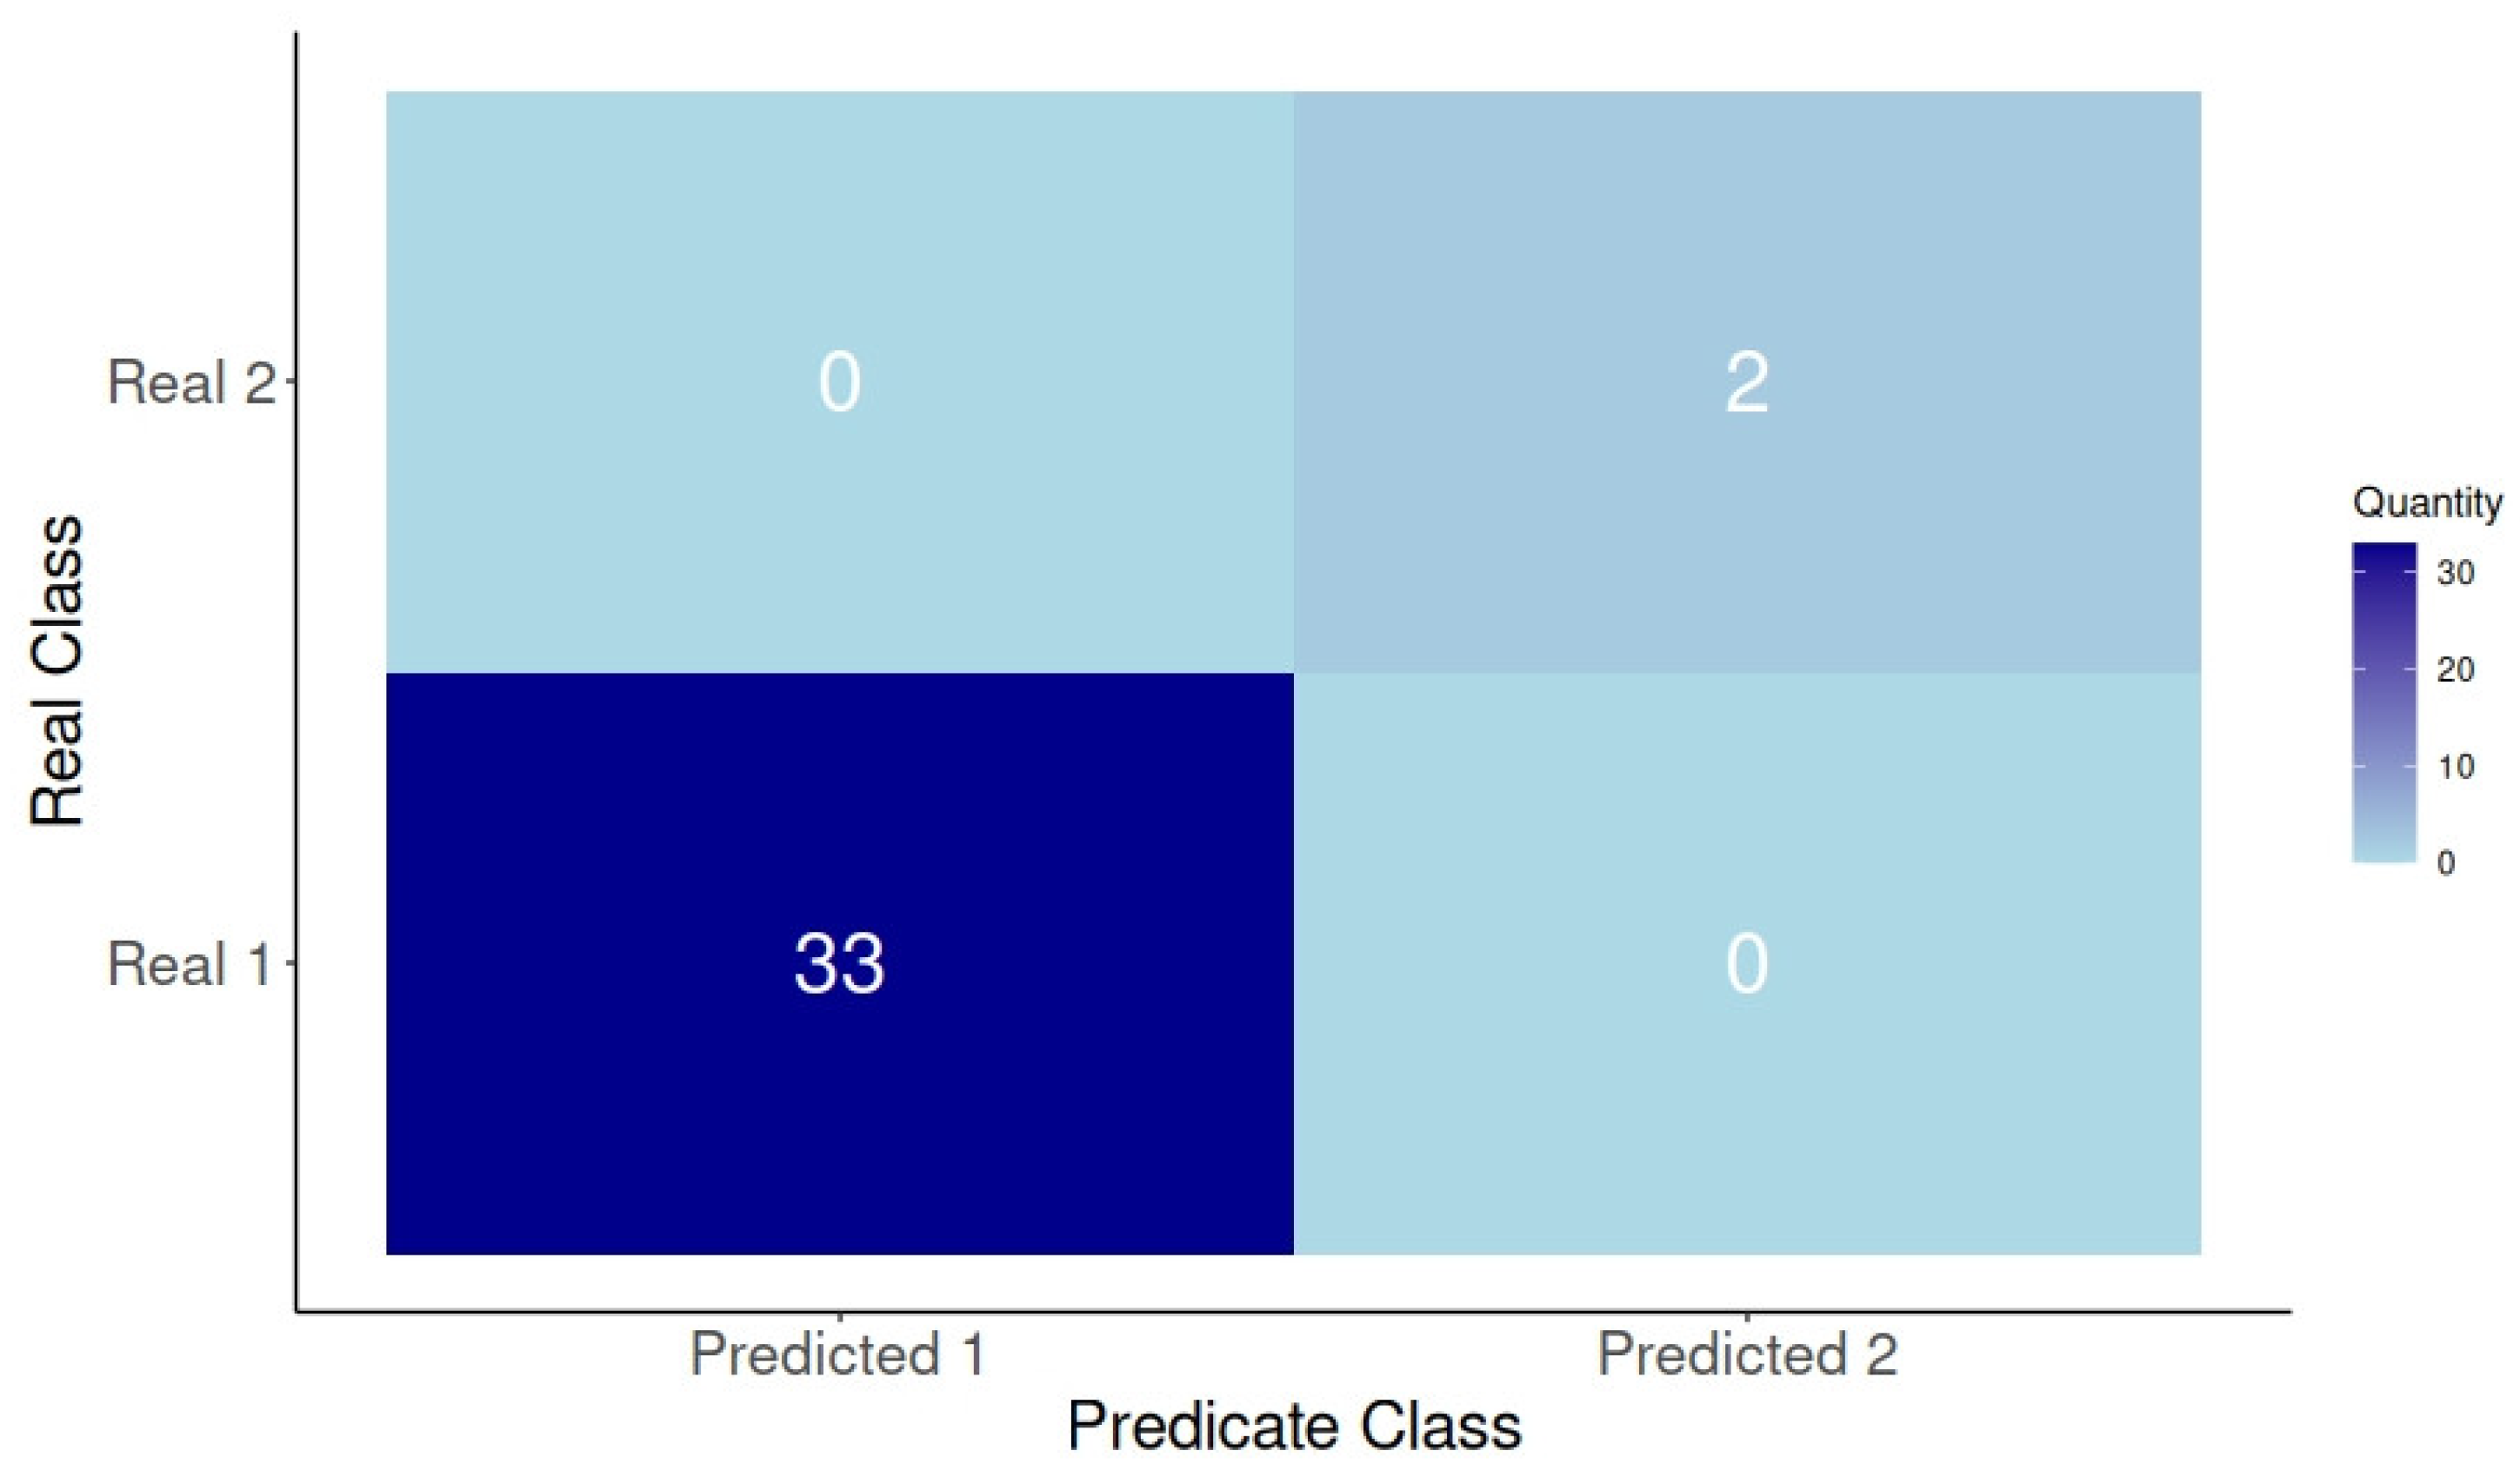
The Random Forest model presented an out-of-bag (OOB) classification error of 0%, meaning that all observations in clusters 1 and 2 were correctly assigned to their corresponding group in the training data (Figure 5).
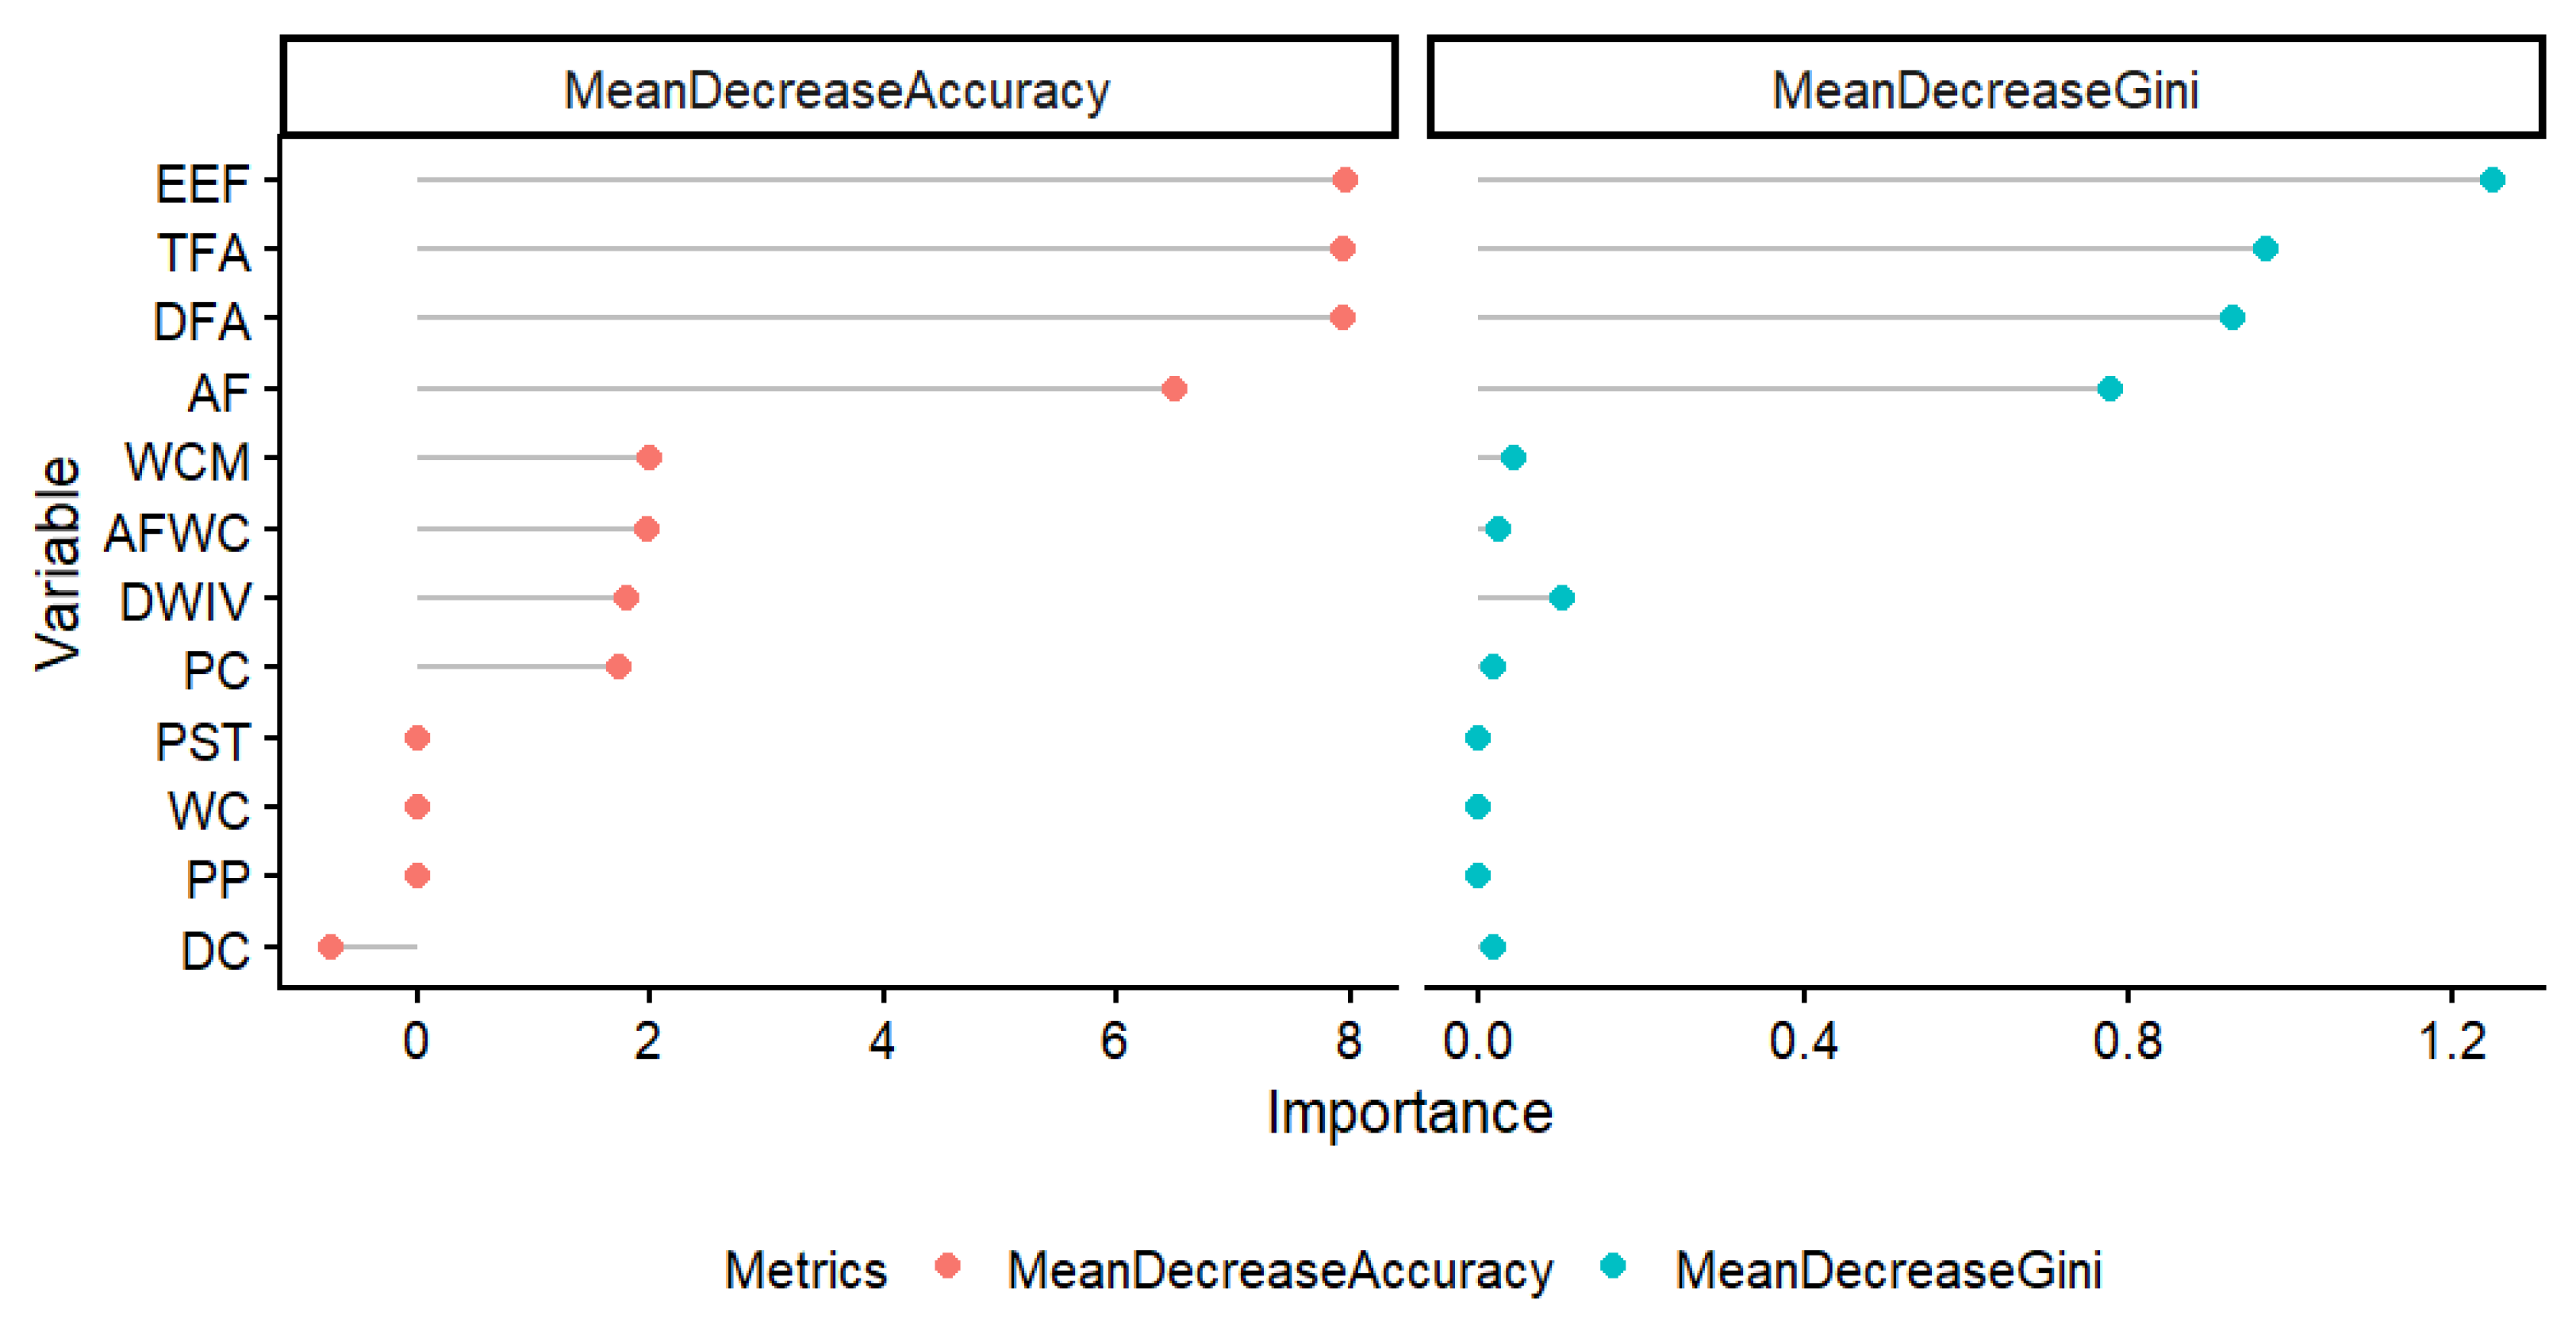
In terms of variable importance, EEF, TFA, DFA, and AF contributed most to the classification, recording the highest values for both MeanDecreaseAccuracy and MeanDecreaseGini (Figure 6). In particular, EEF obtained a MeanDecreaseAccuracy of 7.96 and a MeanDecreaseGini of 1.25; TFA and DFA obtained values of 7.92 and 7.93 in MeanDecreaseAccuracy, and 0.97 and 0.93 in MeanDecreaseGini, respectively; while AF reached 6.49 and 0.78 in the same indicators. In contrast, variables such as PP, PST, and WC had values of zero or close to zero, and DC showed negative contributions in some calculations, indicating an insignificant contribution to the model. These results confirm that the formation of two clusters is mainly explained by a small set of key variables, which reinforces the stability and consistency of the classification.
In validating the model with an independent test data set (test_data), the confusion matrix showed that all observations were classified in the correct group, achieving 100% accuracy. Although the size of the test set was small (with 13 observations from Cluster 1 and 2 from Cluster 2), the result confirms the model’s ability to generalize adequately to data not used in training (Figure 7).

4. Discussion

Multivariate analyses revealed two contrasting profiles of coffee producers in the Tlaxcalantongo ejido, differentiated by their level of productive dedication. This segmentation corroborates previous findings in coffee-growing regions of Latin America, where heterogeneity in agronomic practices and access to resources stratifies producers into groups with varying technical and economic capacities [22]. The predominance of Cluster 2 (92%), characterized by greater investment in fertilization and intensive management, coincides with trends observed in Veracruz and Chiapas, where the adoption of external inputs is associated with more competitive market strategies [39,40,41]. However, the persistence of Cluster 1 (8%), with minimal fertilization practices, reflects realities similar to those documented in subsistence coffee systems, where economic constraints and unequal access to technologies perpetuate low yields [42].
The centrality of variables associated with fertilization (EEF, TFA, DFA) as discriminating factors highlights the critical importance of crop nutrition in mountain coffee systems. Studies have shown that efficient fertilizer management increases not only yields but also resilience to climate stress [18,43,44,45]. The combination of foliar and soil applications in Cluster 2 suggests an assimilation of technical recommendations promoted by institutions such as the Secretaria of Agriculture and Rural Development (SADER), whose programs emphasize integrated nutrient management [46]. However, within this group, there are also particular cases that reflect divergent production strategies. Although the segmentation focuses on clusters 1 and 2, it should be noted that producers 6 and 17 belonging to group 2 are internally distinct from the rest of the members of this group, suggesting certain atypical characteristics in their practices. Producer 6 stands out for employing up to 66 labor days per cycle, a figure that is 110% higher than the group average of 30 labor days. This producer has a high investment in fertilizers and a relatively high number of cherry coffee harvests, in addition to applying foliar and mineral fertilizers to the soil, which contrasts with the rest of the group. On the other hand, producer 17 shows a profile opposite to that of producer 6, with six workdays and a low investment in fertilizers, placing him at the lower end of the group with the highest productive dedication. These differences explain the marginal position of producers 6 and 17 within group 2 in the dendrogram, suggesting that, although they have certain characteristics in common with the group, they also have particular production strategies that separate them from the rest. On the other hand, the absence of mineral fertilization in Cluster 1 could be linked to dynamics documented [47], where marginalized producers prioritize low-cost strategies in the face of price volatility and economic deprivation.
The limited influence of variables such as pruning (PP, PST) and weed control (WC) on segmentation contradicts findings where these practices are decisive in productivity [48]. However, this discrepancy could be explained by the homogeneity in their execution as a traditional practice in Tlaxcalantongo, as pointed out by studies in Chiapas, where traditional knowledge guarantees minimal management across the board, reducing their discriminatory power [49]. The NMDS analysis, by highlighting common factors in dimension 3, coincides with studies that identify systematic threats shared in coffee-growing regions, regardless of the level of technology [20].
Although the clusters show marked differences in agronomic practices such as fertilization, dimension 3 of the NMDS analysis reveals points of convergence between the two groups, particularly in variables related to the structural conditions of the production units. For example, most producers, regardless of cluster, operate on small plots (less than two hectares), with limited mechanization and a high dependence on family labor. In sociodemographic terms, both groups share characteristics such as an average age above 65 and low levels of formal education (primary school), which coincides with widely documented profiles in traditional coffee-growing regions of Mexico [50]. These similarities suggest that, although there are differences in technology adoption, producers share a common structural context that may limit their possibilities for productive transformation without sustained institutional support.
The absence of correlation between demographic variables (age, education) and productive engagement challenges narratives linking formal education with technological adoption [51]. This phenomenon could be attributed to the compensatory role of local knowledge, transmitted between generations, which substitutes formal technical skills, as has been observed [52] in indigenous communities in Puebla. However, the concentration in Cluster 2 suggests a transition toward extensive models, partly linked to participation in government programs. According to the survey, approximately 30% of producers reported belonging to initiatives such as Sembrando Vida or Fertilizantes para el Bienestar, which could be contributing to their greater investment in inputs and agronomic tasks. Additionally, some producers reported links to local cooperatives, which in other contexts have been shown to encourage productivity through credit or support schemes [53].
The policy implications are clear: while Cluster 1 requires interventions to mitigate barriers to access to inputs, Cluster 2 demands strategies to sustain production without compromising the sustainability of the system, such as organic certifications or payments for environmental services [41]. The exclusion of 25 producers in transition to other crops raises a regional risk: migration to more profitable but environmentally risky activities, often driven by price volatility or migration [54,55].
Although the analysis does not causally quantify the specific effects of each variable on yield, the methods used, especially Random Forest, allow us to identify the relative importance of key agronomic factors, such as fertilization, in the formation of groups [26]. This evidence can guide differentiated proposals for short- and medium-term intervention. For example, in the short term, efficient fertilization practices could be reinforced among producers with low production dedication, while in the medium term, it would be feasible to design targeted technical support schemes for those who already show greater investment. In particular, the identification of relevant variables such as fertilizer uses or the number of workdays allows us to infer that there is room for internal improvement in terms of both agronomic efficiency and economic sustainability. In this sense, the study’s approach, although descriptive, contributes to the design of contextualized intervention proposals.
Although the methodological framework applied (cluster analysis, NMDS, and Random Forest) proved adequate for the study objectives, it should be noted that there are other quantitative approaches that could enrich future analyses. Some, such as latent class analysis, have recently been used to classify producers based on their behavior patterns [56]. Similarly, agricultural studies have combined PCA with clustering to construct robust production typologies [57,58]. These examples show the methodological diversity available for addressing agricultural typologies, which opens up opportunities to complement the findings obtained with the techniques applied in this study in the future.
It should be noted that this research has some limitations that must be acknowledged. First, although the sample consisted of the 50 active coffee growers in the ejido, which constitutes a census of the local population, the relatively small size could limit the generalization of the results to other regions. Nevertheless, the findings offer a useful reference point for communities with similar productive and social characteristics. Second, the cross-sectional nature of the survey prevents us from observing changes over time, so future longitudinal studies could more accurately capture the dynamics of productive transition. Finally, reliance on self-reported information may lead to certain biases, despite the measures implemented to control them. Recognizing these limitations allows us to place the results within their actual scope and, at the same time, guide future lines of research, both in the analysis of coffee production systems and in the development of more appropriate public policies.

5. Conclusions

The study identified two contrasting profiles of coffee producers in the Tlaxcalantongo ejido, Puebla, differentiated by their level of productive dedication, determined by hierarchical cluster analysis and supported by Random Forest analysis. The majority of producers (92%) were categorized as having a high level of productive dedication, characterized by the application of soil and foliar fertilization practices, greater investment in inputs, and structured agronomic management (pest and disease control, weed management, and pruning). In contrast, the minority group (8%) with a low level of productive dedication showed minimal or no fertilization practices and low operating expenses, reflecting significant differences in resource management.
The results showed that the variables associated with fertilization (type, division of applications, and economic expenditure) were the critical factors in the differentiation of groups, highlighting their central role in the configuration of production systems. On the other hand, variables such as advanced age and low educational attainment did not influence productive dedication. An additional finding was the transition of 25 registered producers to other crops, a phenomenon that highlights the need for future studies to understand the dynamics of change in land use and its impact on coffee sustainability. From a practical perspective, these results suggest that technical support and public policy interventions should prioritize efficient fertilization and agronomic management, as these have the greatest potential impact on producer differentiation and the permanence of coffee farming in the region.
This work provides a robust methodological framework for segmenting heterogeneous producers using multivariate techniques, which is essential for designing evidence-based policies in contexts of high productive diversity.

Supplementary Materials

The following supporting information can be downloaded at: https://www.mdpi.com/article/10.3390/agriculture15212192/s1, S1: Questionnaire to learn about the productive, economic, and service aspects of coffee production in the Sierra Norte region of Puebla.

Author Contributions

Z.E.R.-F., V.M.-R., C.S.-M.-H., V.H.V.-H. and J.P.-C. contributed to the conceptualization of the study. Material preparation was carried out by Z.E.R.-F., V.M.-R., C.S.-M.-H., J.P.-C. and V.H.V.-H. Data collection was obtained by Z.E.R.-F. and C.H.-G. Statistical analysis was carried out by Z.E.R.-F. and V.M.-R. Supervision and validation were carried by V.M.-R. and C.S.-M.-H. The first draft of the manuscript was prepared by Z.E.R.-F. and all authors (C.S.-M.-H., V.M.-R., V.H.V.-H., J.P.-C. and C.H.-G.) commented on earlier versions of the manuscript. All authors have read and agreed to the published version of the manuscript.

Funding

Secretaria de Ciencia, Humanidades, Tecnologia e Innovación (SECIHTI).

Institutional Review Board Statement

This study was exempt from ethical review and approval because, according to institutional regulations, studies conducted by students who collect information through surveys or field observations do not require formal approval or supervision by the Ethics Committee. However, written informed consent was obtained from all participants prior to their inclusion in the research. The Institutional Ethics Committee of the College of Postgraduates Campus Montecillo confirmed that there is no objection to conducting this type of study and, therefore, did not issue formal authorization. The data obtained were handled in a manner that guaranteed the anonymity and confidentiality of the participating producers.

Informed Consent Statement

Not applicable.

Data Availability Statement

The original contributions presented in the study are included in the article/Supplementary Materials, further inquiries can be directed to the corresponding author.

Acknowledgments

The lead author would like to thank the Secretaria de Ciencia, Humanidades, Tecnologia e Innovación (SECIHTI) for the scholarship awarded (CVU: 1097106) to complete his doctoral studies.

Conflicts of Interest

The authors declare no conflicts of interest.

References

  1. Quadra, G.R.; Paranaíba, J.R.; Vilas-Boas, J.; Roland, F.; Amado, A.M.; Barros, N.; Dias, R.J.P.; Cardoso, S.J. A global trend of caffeine consumption over time and related-environmental impacts. Environ. Pollut. 2020, 256, 113343. [Google Scholar] [CrossRef]
  2. Vegro, C.L.R.; Almeida, L.F. Global coffee market: Socio-economic and cultural dynamics. In En Coffee Consumption and Industry Strategies in Brazil; Elsevier: Amsterdam, The Netherlands, 2020; pp. 3–19. [Google Scholar] [CrossRef]
  3. Secretaría de Agricultura y Desarrollo Rural (SADER). Cultivo de café en México. Gobierno de México. 2022. Available online: https://www.gob.mx/agricultura/articulos/cultivo-de-cafe-en-mexico (accessed on 2 July 2025).
  4. Servicio de Información Agroalimentaria y Pesquera (SIAP). Avance de Siembras y Cosechas 2024. SIAP. 2024. Available online: https://www.gob.mx/siap (accessed on 2 July 2025).
  5. Secretaría de Agricultura y Desarrollo Rural (SADER). Café Poblano: Orgullo Nacional. Gobierno de México. 2024. Available online: https://www.gob.mx/agricultura/puebla/articulos/cafe-poblano-orgullonacional (accessed on 2 July 2025).
  6. Instituto Nacional de Estadística y Geografía (INEGI). Sistema de Cuentas Nacionales de México. INEGI. 2020. Available online: https://cuentame.inegi.org.mx/monografias/informacion/pue/economia/pib.aspx?tema=me&e=21 (accessed on 2 July 2025).
  7. Morales-Ramos, V.; Escamilla-Prado, E.; Muñoz-Rodríguez, M.; Velásquez-Morales, J.A.; Spinoso-Castillo, J.L. Perfiles de calidad del café de México, 1st ed.; Colegio de Postgraduados en Ciencias Agrícolas: Texcoco, Mexico, 2021. [Google Scholar]
  8. Basurto, F.; Mapes, C.; Escobar, T.; González, J.C. Ethnobotany of the Sierra Norte de Puebla. In En Ethnobotany of the Mountain Regions of Mexico; Springer International Publishing: Berlin/Heidelberg, Germany, 2022; pp. 1–29. [Google Scholar]
  9. Villegas Loeza, D. Efectos de la liberalización de la economía en la caficultura: Estudio de caso en la Sierra Norte de Puebla, México. Política Y Cult. 2019, 52, 39–60. Available online: https://www.redalyc.org/journal/267/26761739001/html/ (accessed on 20 August 2025). [CrossRef]
  10. Moguel, P.; Toledo, V.M. Biodiversity conservation in traditional coffee systems of Mexico. Conserv. Biol. 1999, 13, 11–21. [Google Scholar] [CrossRef]
  11. Lugo-Morin, D.R.; Desiderio, E.J.; Fajardo Franco, M.L. Practices and community knowledge of the Sierra Norte de Puebla: The case of coffee, its plagues and diseases. Rev. Investig. Agrar. Y Ambient. 2018, 9, 77–87. [Google Scholar]
  12. Martínez, M.A.; Evangelista, V.; Basurto, F.; Mendoza, M.; Cruz-Rivas, A. Flora útil de los cafetales en la Sierra Norte de Puebla, México. Rev. Mex. Biodivers. 2007, 78, 15–40. [Google Scholar] [CrossRef]
  13. Hernández-Castaño, J.; Hebert-Calderón, G.T. Percepción de los efectos del cambio climático y prácticas de adaptación de los caficultores del Estado de Puebla, México. Rev. Bio Cienc. 2023, 10, e1419. [Google Scholar] [CrossRef]
  14. Rivadeneyra, P.J.I.; Ramírez, V.B. El comercio local del café a raíz de su crisis en la Sierra Norte de Puebla. Rev. Mex. Agronegocios 2006, 10, 1–14. Available online: https://www.redalyc.org/articulo.oa?id=14101807 (accessed on 13 August 2025).
  15. Barrera, R.A.; Ramírez, G.A.G.; Cuevas, R.V.; Espejel, G.A. Modelos de innovación en la producción de café en la Sierra Norte de Puebla, México. Rev. Cienc. Soc. 2021, 27, 443–458. Available online: https://dialnet.unirioja.es/servlet/articulo?codigo=8081783 (accessed on 9 August 2025).
  16. Gómez, V.J.; Vásquez, L.A.; Regino, M.J.; Jurado, C.S.N. A review of local-scale agricultural sustainability in the coffee regions of Mexico. Cienc. E Investig. Agrar. 2023, 50, 23–45. [Google Scholar] [CrossRef]
  17. Goodman, D. The international coffee crisis: A review of the issues. In En Confronting the Coffee Crisis: Fair Trade, Sustainable Livelihoods and Ecosystems in Mexico and Central America; MIT Press: Cambridge, MA, USA, 2008. [Google Scholar] [CrossRef]
  18. Byrareddy, V.; Kouadio, L.; Mushtaq, S.; Stone, R. Sustainable production of Robusta coffee under a changing climate: A 10-year monitoring of fertilizer management in coffee farms in Vietnam and Indonesia. Agronomy 2019, 9, 499. [Google Scholar] [CrossRef]
  19. Potvin, C.; Owen, T.C.; Melzi, S.; Beaucage, P. Biodiversity and modernization in four coffee-producing villages of Mexico. Ecol. Soc. 2005, 10, 1–17. Available online: http://www.jstor.org/stable/26267708 (accessed on 11 August 2025). [CrossRef]
  20. Bhattarai, S.; Alvarez, S.; Gary, C.; Rossing, W.; Tittonell, P.; Rapidel, B. Combining farm typology and yield gap analysis to identify major variables limiting yields in the highland coffee systems of Llano Bonito, Costa Rica. Agric. Ecosyst. Environ. 2017, 243, 132–142. [Google Scholar] [CrossRef]
  21. Galeana-Pizaña, J.M.; Manson, R.H. Mapping coffee intensification in Mexico: A multivariate spatial analysis approach. Front. Sustain. Food Syst. 2025, 9, 1649756. [Google Scholar] [CrossRef]
  22. Hernández-Martínez, G.; Manson, R.H.; Hernández, A.C. Quantitative classification of coffee agroecosystems spanning a range of production intensities in central Veracruz, Mexico. Agric. Ecosyst. Environ. 2009, 134, 89–98. [Google Scholar] [CrossRef]
  23. Wardropper, C. Structural and Financial Constraints for Arabica Coffee Planters. Independent Study Project (ISP) Collection. 2007; Volume 131, pp. 1–47. Available online: https://digitalcollections.sit.edu/isp_collection/131 (accessed on 20 July 2025).
  24. Saxena, A.; Prasad, M.; Gupta, A.; Bharill, N.; Patel, O.P.; Tiwari, A.; Er, M.J.; Ding, W.; Lin, C.-T. A review of clustering techniques and developments. Neurocomputing 2017, 267, 664–681. [Google Scholar] [CrossRef]
  25. Dexter, E.; Rollwagen-Bollens, G.; Bollens, S.M. The trouble with stress: A flexible method for the evaluation of nonmetric multidimensional scaling. Limnol. Oceanogr. Methods 2018, 16, 434–443. [Google Scholar] [CrossRef]
  26. Denisko, D.; Hoffman, M.M. Classification and interaction in random forests. Proc. Natl. Acad. Sci. USA 2018, 115, 1690–1692. [Google Scholar] [CrossRef]
  27. Pavlo, H.; Svitlana, G.; Nila, K.; Tetiana, H. Using non-metric multidimensional scaling for assessment of regions’ economy in the context of their sustainable development. CEUR Workshop Proc. 2020, 2713, 315–333. Available online: http://ceur-ws.org/Vol-2713/paper35.pdf (accessed on 13 August 2025).
  28. Peimer, A.W.; Krzywicka, A.E.; Cohen, D.B.; Van den Bosch, K.; Buxton, V.L.; Stevenson, N.A.; Matthews, J.W. National-level wetland policy specificity and goals vary according to political and economic indicators. Environ. Manag. 2017, 59, 141–153. [Google Scholar] [CrossRef]
  29. López, C.D.; Zuñiga, F.B.; Bautista, H.D.A. Identification of soil properties associated with the peasant perception of the suitability of the land for growing organic coffee: The case of traditional agriculture in the “Mixteca Alta” mountains of Oaxaca, México. Agroecol. Sustain. Food Syst. 2023, 48, 161–182. [Google Scholar] [CrossRef]
  30. Merlín, U.Y.; Charbonnier, F.; Contreras, H.A.; Herrera, H.O.B.; Soto, P.L. Tipología de estrategias campesinas en la caficultura orgánica de la Sierra Madre de Chiapas. Ecosistemas Y Recur. Agropecu. 2018, 5, 411–423. [Google Scholar] [CrossRef]
  31. Rosales, M.V.; Martínez, D.J.P.; Osorio, A.F.; López, R.G.; Asiaín, H.A.; Estrella, C.N. Cultural, social and productive aspects used for a typology of coffee producers. Agric. Soc. Y Desarro. 2018, 15, 47–61. [Google Scholar]
  32. Vázquez, L.P.; Espinoza, A.J.J.; González, M.A.; Guerrero, R.L.A. Characteristics of coffee producers and plantations in the northern region of the state of Chiapas. Rev. Mex. Cienc. Agrícolas 2012, 13, 101–111. [Google Scholar] [CrossRef]
  33. RStudio Team. RStudio: Integrated Development Environment for, R. RStudio, PBC. 2023. Available online: https://www.rstudio.com/ (accessed on 20 August 2025).
  34. R Core Team. R: A Language and Environment for Statistical Computing. R Foundation for Statistical Computing. 2024. Available online: https://www.R-project.org/ (accessed on 20 July 2025).
  35. Maechler, M.; Rousseeuw, P.; Struyf, A.; Hubert, M.; Hornik, K. Cluster: Cluster Analysis Basics and Extensions (R Package Version 2.1.6). CRAN. 2023. Available online: https://CRAN.R-project.org/package=cluster (accessed on 20 July 2025).
  36. Hennig, C. Fpc: Flexible Procedures for Clustering (R Package Version 2.2-13). CRAN. Available online: https://CRAN.R-project.org/package=fpc (accessed on 13 August 2025).
  37. Oksanen, J.; Simpson, G.; Blanchet, F.; Kindt, R.; Legendre, P.; Minchin, P.; O’hara, R.B.; Solymos, P.; Stevens, M.H.; Wagner, H. Vegan: Community Ecology Package (R Package Version 2.6-6.1). CRAN. 2024. Available online: https://CRAN.R-project.org/package=vegan (accessed on 20 July 2025).
  38. Liaw, A.; Wiener, M. Classification and regression by randomForest. R News 2002, 2, 18–22. Available online: https://CRAN.R-project.org/doc/Rnews/ (accessed on 20 July 2025).
  39. Folch, A.; Planas, J. Cooperation, Fair Trade, and the development of organic coffee growing in Chiapas (1980–2015). Sustainability 2019, 11, 357. [Google Scholar] [CrossRef]
  40. Gómez Tovar, L.; Martin, L.; Gómez Cruz, M.A.; Mutersbaugh, T. Certified organic agriculture in Mexico: Market connections and certification practices in large and small producers. J. Rural Stud. 2005, 21, 461–474. [Google Scholar] [CrossRef]
  41. Méndez, V.E.; Bacon, C.M.; Olson, M.; Petchers, S.; Herrador, D.; Carranza, C.; Trujillo, L.; Guadarrama-Zugasti, C.; Cordón, A.; Mendoza, A. Effects of Fair Trade and organic certifications on small-scale coffee farmer households in Central America and Mexico. Renew. Agric. Food Syst. 2010, 25, 236–251. [Google Scholar] [CrossRef]
  42. Rocha-Rodríguez, C.; Mora-Delgado, J.; Romero-Vargas, J.C. Tipología de sistemas de producción en la zona rural del municipio de Ibagué, Colombia. Agron. Mesoam. 2016, 27, 253–264. [Google Scholar] [CrossRef]
  43. Angnes, G.; Martello, M.; Faulin, G.D.C.; Molin, J.P.; Romanelli, T.L. Energy efficiency of variable rate fertilizer application in coffee production in Brazil. AgriEngineering 2021, 3, 815–826. [Google Scholar] [CrossRef]
  44. de Souza, T.L.; de Oliveira, D.P.; Santos, C.F.; Reis, T.H.P.; Cabral, J.P.C.; da Silva Resende, É.R.; Fernandes, T.J.; de Souza, T.R.; Builes, V.R.; Guelfi, D. Nitrogen fertilizer technologies: Opportunities to improve nutrient use efficiency towards sustainable coffee production systems. Agric. Ecosyst. Environ. 2023, 345, 108317. [Google Scholar] [CrossRef]
  45. Sarkis, L.F.; Dutra, M.P.; dos Santos, C.A.; Rodrigues Alves, B.J.; Urquiaga, S.; Guelfi, D. Nitrogen fertilizers technologies as a smart strategy to mitigate nitrous oxide emissions and preserve carbon and nitrogen soil stocks in a coffee crop system. Atmos. Environ. X 2023, 20, 100224. [Google Scholar] [CrossRef]
  46. Secretaría de Agricultura y Desarrollo Rural (SADER). Conoce el Programa Fertilizantes para el Bienestar. Gobierno de México. Febrero. 2024. Available online: https://www.gob.mx/agricultura/articulos/conoce-el-programa-fertilizantes-para-el-bienestar?idiom=es (accessed on 3 July 2025).
  47. Bravo-Monroy, L.; Potts, S.G.; Tzanopoulos, J. Drivers influencing farmer decisions for adopting organic or conventional coffee management practices. Food Policy 2016, 58, 49–61. [Google Scholar] [CrossRef]
  48. Gokavi, N.; Mote, K.; Jayakumar, M.; Raghuramulu, Y.; Surendran, U. The effect of modified pruning and planting systems on growth, yield, labour use efficiency and economics of Arabica coffee. Sci. Hortic. 2021, 276, 109764. [Google Scholar] [CrossRef]
  49. Soto-Pinto, L.; Perfecto, I.; Castillo-Hernandez, J.; Caballero-Nieto, J. Shade effect on coffee production at the northern Tzeltal zone of the state of Chiapas, Mexico. Agric. Ecosyst. Environ. 2000, 80, 61–69. [Google Scholar] [CrossRef]
  50. Pérez-Vázquez, A.; Pérez-Sánchez, O.; Lango-Reynoso, V.; Escamilla-Prado, E. El agroecosistema cafetalero: Policultivo tradicional versus policultivo comercial en Chocamán, Veracruz. Rev. Mex. Cienc. Agrícolas 2024, 15, e3248. [Google Scholar] [CrossRef]
  51. Ngeywo, J.; Basweti, E.; Shitandi, A. Influence of gender, age, marital status and farm size on coffee production: A case of Kisii County, Kenya. Asian J. Agric. Ext. Econ. Sociol. 2015, 5, 117–125. [Google Scholar] [CrossRef] [PubMed]
  52. Sumarti, T.; Falatehan, S.F. The role and position of young coffee farmers: The gap between generations in the coffee business. Agric. Agric. Sci. Procedia 2016, 9, 500–509. [Google Scholar] [CrossRef]
  53. Azibo Balgah, R.; Balgah, R.A. Factors influencing coffee farmers’ decisions to join cooperatives. Sustain. Agric. Res. 2019, 8, 42–58. [Google Scholar] [CrossRef]
  54. Clément, R.; Tuan, D.; Cuong, V.; Le Van, B.; Trung, H.Q.; Long, C.T.M. Transitioning from monoculture to mixed cropping systems: The case of coffee, pepper, and fruit trees in Vietnam. Ecol. Econ. 2023, 214, 107980. [Google Scholar] [CrossRef]
  55. Griffith, D.; Zamudio Grave, P.; Cortés Viveros, R.; Cabrera Cabrera, J. Losing labor: Coffee, migration, and economic change in Veracruz, Mexico. Cult. Agric. Food Environ. 2017, 39, 35–42. [Google Scholar] [CrossRef]
  56. Martínez-Reina, A.M.; Araujo, H.; Regino, S.M.; Espitia, A.; Tordecilla, L.; Grandett, L.; Pérez, S.; Martínez, R.; Rosero, A. Farmers’ typologies for the construction of a technological and socioeconomic baseline of industrial cassava organizations to guide research, production, and policy design in the Colombian Caribbean region. Agriculture 2025, 15, 488. [Google Scholar] [CrossRef]
  57. Niftiyev, I.; Ibadoghlu, G. Longitudinal principal component and cluster analysis of Azerbaijan’s agricultural productivity in crop commodities. Commodities 2023, 2, 147–167. [Google Scholar] [CrossRef]
  58. Siogkas, T.; Melfou, K.; Koutouzidou, G.; Loizou, E.; Ragkos, A. Structural analysis of farming systems in Western Macedonia: A cluster-based approach. Agriculture 2025, 15, 1650. [Google Scholar] [CrossRef]
Figure 1. Study area: Territorial areas of the ejido Tlaxcalantongo, Xicotepec, Puebla, Mexico.
Agriculture 15 02192 g001
Figure 2. (A) Agronomic characteristics of producers; (B) Educational level of producers. Survey variables that defined the sample size by the following acronyms: DC: Disease control; PC: Pest Control; PP: Pest presence; DP: Disease presence; AP: Applies fertilization; PST: Pruning of shade trees.
Agriculture 15 02192 g002
Figure 3. (A) Silhouette index to determine the number of clusters; (B) grouping of coffee growers by hierarchical cluster.
Agriculture 15 02192 g003
Figure 4. Productive dedication of coffee grower groups.
Agriculture 15 02192 g004
Figure 5. Confusion matrix of the Random Forest training model.
Agriculture 15 02192 g005
Figure 6. Mean Decrease Accuracy and Mean Decrease Gini values of the variables. Survey variables by the following acronyms: EEF: Economic expenditure of fertilization; AF: Applies fertilization; DWIV: Daily wages invested per cycle; TFA: Type of fertilization applied; DFA: Division of fertilization application; PP: Pruning performed; PST: Pruning of shade trees; PC: Pest control; DC: Disease control; WC: Weed control; AFWC: Annual frequency of weed control; WCM: Weed control method.
Agriculture 15 02192 g006
Figure 7. Confusion matrix of the Random Forest test model.
Agriculture 15 02192 g007
Table 1. Variables and their acronyms that define the productive dedication of coffee growers.
VariableVariable Types and Units of MeasurementAcronym
1Economic expenditure of fertilization (MXN)EEF
2Applies fertilization (Si/No)AF
3Daily wages invested per cycle (NUM)DWIV
4Type of fertilization applied (Soil, Foliar, Both)TFA
5Division of fertilization application (Yes/No)DFA
6Pruning performed (Yes/No)PP
7Pruning of shade trees (Yes/No)PST
8Pest control (Yes/No)PC
9Disease control (Yes/No)DC
10Weed control (Yes/No)WC
11Annual frequency of weed controlAFWC
12Weed control method (Chemical, Manual, Both)WCM
Table 2. Management characteristics of the two groups of coffee growers.
Handling CharacteristicsCluster 1 (n = 4, 8%)Cluster 2 (n = 46, 92%)
FertilizationNot appliedApplied (different types and split application)
Economic expenditureLimitedHigh
Labor per cycleReducedHigher number (sanitation, fertilization, pruning)
PruningIncompleteMore complete application
Pest and disease controlDo not reportYes, more frequently
Atypical casesDo not reportTwo producers with internal variations (6 y 17)
Disclaimer/Publisher’s Note: The statements, opinions and data contained in all publications are solely those of the individual author(s) and contributor(s) and not of MDPI and/or the editor(s). MDPI and/or the editor(s) disclaim responsibility for any injury to people or property resulting from any ideas, methods, instructions or products referred to in the content.