Article

Hot Pots: Container Color Has a Greater Cooling Effect than Micro-Sprinkler Frequency in Nursery Production

1
North Willamette Research and Extension Center, Department of Horticulture, Oregon State University, Corvallis, OR 97331, USA
2
Application Technology Research Unit, Agricultural Research Service, U.S. Department of Agriculture, Wooster, OH 44691, USA
3
U.S. National Arboretum, Floral and Nursery Plants Research Unit, Agricultural Research Service, Otis L. Floyd Nursery Research Center, U.S. Department of Agriculture, McMinnville, TN 37110, USA
4
Environmental Horticulture Department, University of Florida, Gainesville, FL 32611, USA
*
Authors to whom correspondence should be addressed.
Agriculture 2025, 15(21), 2185; https://doi.org/10.3390/agriculture15212185
Submission received: 5 September 2025 / Revised: 15 October 2025 / Accepted: 17 October 2025 / Published: 22 October 2025
(This article belongs to the Special Issue Abiotic Stress Responses in Horticultural Crops)

Abstract

Container production systems are critical for the horticulture industry but are particularly vulnerable to temperature extremes. This study investigated the effects of pot color (black vs. white) and irrigation frequency (single vs. cyclic) on root zone temperature and the growth of Hydrangea paniculata ‘Limelight’, one of the most popular and widely grown container-grown perennial shrubs in North America. The experiment was conducted at the North Willamette Research and Extension Center in Aurora, Oregon, USA (45°16′51″ N, 122°45′04″ W). A total of 160 Hydrangea paniculata ‘Limelight’ plants were divided into two groups of 80 and potted in black or white 11.4 L nursery containers filled with a bark-based potting mix. Pots were randomly assigned to one of two irrigation treatments based on irrigation frequency: single or cyclic. In the single irrigation treatment, pots received one irrigation event at 07:00 h. In the cyclic irrigation treatment, the same total irrigation volume was divided into three equal applications delivered at 08:00, 12:00, and 16:00 h. Results showed that black pots reached significantly higher root zone temperatures than white pots. Cyclic irrigation effectively reduced the peak root zone temperatures in black pots, cooling by as much as 6 °C during hot afternoons compared with single irrigation. Plants in black pots experienced 6×–7× more hours above critical root-zone temperature thresholds (>38 °C) compared with those in white pots. Although the literature indicates that prolonged exposure above 35–38 °C can inhibit photosynthesis and slow growth, and that root growth may cease at ~38 °C, in our study, plant growth was not significantly affected by pot color, irrigation regime, or their interaction (all p > 0.05). This study emphasizes the importance of optimizing pot color and irrigation practices to address vulnerabilities to extreme temperatures in container production systems.

1. Introduction

Container production systems (pots) underpin the ornamental horticulture industry, but their aboveground design exposes plants to media temperature extremes that threaten root development and crop performance [1,2,3]. Container production systems are the most common nursery production method, representing 68% of nursery crops and the majority of greenhouse crops [4]. In addition, container production systems are increasingly being used for berry production [5,6,7]. Although container production offers growers advantages in nutrient management and shipping, these systems are more vulnerable to temperature stress because root tissues are less tolerant of extremes than aboveground organs [8]. Therefore, managing and mitigating extreme temperatures must be a key part of production decisions to maintain profitability, especially as agriculture faces increasingly frequent temperature extremes [9].
Containerized nursery crops are more vulnerable to temperature extremes than field grown crops because they are commonly above ground, in plastic containers, with a highly drained substrate, and usually placed on groundcovers of gravel or black plastic fabric [10]. At a farm scale, these gravel or black plastic groundcovers can exacerbate temperature extremes by absorbing or reflecting heat differently than a grassed or soil surface. Gravel, in particular, increases the heating rate of the production area while reducing nighttime cooling, leading to more extreme temperature conditions for container-grown plants [11]. At the container level, the plastic pots act as heat sinks, absorbing solar radiation and conducting heat to the substrate, further raising the media temperatures above ambient air temperature for the majority of the day [12,13]. Furthermore, the porous, well-draining organic substrates typically used in containers have limited water storage, thereby decreasing the temperature buffering capacity, thus making pots more prone to temperature shifts than most mineral soils [14]. This multi-scale combination of factors makes open-air containerized cropping systems particularly sensitive to thermal stress, which can negatively affect crop growth.
Temperature plays a crucial role in determining crop growth and health [15,16]. In containers used to produce woody ornamental crops, the root zone temperature (RZT) can exceed 54 °C, which can damage crops even with brief exposure. Direct root injury, such as root cell damage, can occur when the RZT exceed 45 °C for 30 min of exposure, with damage increasing as temperature and exposure time rise [17]. Indirect root injury occurs at a RZT above 38 °C [15], where physiological processes are disrupted, stunting growth even in the absence of visible damage [2]. This thermal stress impairs root function, reducing nutrient uptake. Nutrient uptake is also impaired by the temperature in containers because the controlled-release fertilizers (CRFs) that are widely used in container-based production systems rely on temperature-sensitive coatings to regulate the release of nutrients [18,19]. CRF coatings are less effective during heatwaves, leading to an unanticipated and excessive release of mineral salts at a time when nutrient uptake by the roots is inhibited due to heat stress [1]. This means that high temperatures, which are already a concern for plant health, can exacerbate nitrogen (N) and phosphorus (P) runoff, creating a dual problem of poor plant growth and environmental pollution [20,21].
Irrigation is a potential cooling strategy for crops to combat extreme heatwaves, which will increase in frequency with climate change [22]. Irrigation demand for container nursery crops is notoriously high because of the limited water storage capacity of the confined substrate volume [23]. Excessive nursery irrigation is a known cause of poor crop health and environmental pollution and is a waste of financial resources [20,24,25]. Cyclic irrigation, which distributes water over several daily applications rather than a single event, has been shown to improve water retention and reduce the volume of nutrient-containing leachate [26]. In nursery production, cyclic irrigation works by increasing lateral flow, reducing preferential flow, and replacing water as needed by the plant. Fare et al. [27] demonstrated a 54% reduction in leaching when employing cyclic irrigation with a corresponding 47% reduction in total N leached from a container. By improving irrigation efficiency and reducing nutrient loss, cyclic irrigation also reduces the amount of water used on a daily basis [25]. Additionally, cyclic irrigation increases the irrigation application efficiency and decreases ammonium losses when compared with single, continuous irrigation [28]. While previous research has shown that properly timed irrigation helps cool container-grown crops [29], the difference in cooling capacity between cyclic and single irrigation events has yet to be fully explored.
In addition to irrigation, pot color significantly affects the RZT, with darker pots absorbing more solar radiation than lighter ones, causing excessive heat buildup in the substrate [3]. This effect is most pronounced in the west-facing quadrant of nursery containers, which receives intense afternoon sunlight and consistently reaches the highest peak RZT [12,30]. These dynamics highlight the need for an improved holistic management approach to mitigate heat stress, optimize plant growth, maximize water crop use efficiency, and reduce nutrient leaching in containerized systems.
Despite widespread concern over heat stress in container-grown nursery crops, empirical research quantifying the effects of the RZT under open-air production and varied management practices remains limited. Moreover, developing holistic strategies that mitigate extreme RZT is critical for enhancing crop performance and advancing the sustainability of nursery production systems. To address this, we hypothesized that lower RZT will improve nutrient retention and the growth of container-grown plants. The objectives of this study were to determine how irrigation scheduling and pot color influenced (1) the root zone temperature, (2) plant growth, and (3) nutrient runoff.

2. Materials and Methods

2.1. Plant Material and Experimental Setup

On 18 May 2022, 5.7 cm (2.25-inch) seedlings of ‘Limelight’ hydrangea (Hydrangea paniculata ‘Limelight’) were delivered from a commercial nursery to the North Willamette Research and Extension Center in Aurora, OR, USA (45.264167 N, 122.751111 W). Hydrangea paniculata ‘Limelight’ was selected for this study because hydrangeas are among the most economically important ornamental crops in the United States, with over 10 million plants sold annually and a wholesale value exceeding USD 120 million. ‘Limelight’ is one of the most widely produced and landscape-utilized cultivars of panicle hydrangea, valued for its adaptability, reliability, and broad use across North America. Its commercial relevance and climate adaptability makes it a suitable model species for evaluating the effects of container temperature and irrigation management in nursery production systems. The 180 ‘Limelight’ hydrangea seedlings were planted into 11.4 L plastic nursery containers filled with a substrate consisting of 80% Douglas-fir bark, 10% coir, and 10% perlite. The substate was amended with a medium-high rate (4.27 g L−1) of a 4–5 month (21–27 °C) polymer-coated CRF comprised of 16% N (7.2% nitrate N, 8.8% ammoniacal N; 2.62% P; 9.96% K) with minors (Harrell’s, Lakeland, FL, USA) and a 3 kg m−3 lime package (8% mini prill gypsum, 25% prilled dolomite, 25% prilled lime, 42% pulverized dolomite) to stabilize the pH between 5.5 and 6.5. Half of the containers were black plastic (C1200, Nursery Supplies, Chambersburg, PA, USA; n = 90) and the other half were the same pots but made of white plastic (C1200, Nursery Supplies, Chambersburg, PA, USA; n = 90). The volume of substrate was standardized to ensure the same growing volume and shape, with the only difference being color. After the plants were potted into the black and white pots, the pots were placed on a gravel pad, hand-watered to saturation, and allowed to acclimate for two weeks, with natural rainfall and infrequent supplemental irrigation during this period.

2.2. Irrigation Treatments

On 1 June 2022, all pots were moved to a specially designed gravel-covered gutter leachate collection system, which mimics a nursery-production setting but allows researchers to capture leachate from the pots. The gutter leachate collection system consists of 18 rows, with the two outermost rows used as buffers to mitigate edge effects. The remaining 16 rows were randomly assigned either black or white pots, organized so that each row contained 10 pots of the same color (Figure 1). Irrigation was provided to each pot through two 12 LPH (3.2 GPH) pressure-compensated spray-stake emitters (Netafim USA, Fresno, CA, USA).
The 16 rows were further divided into two irrigation treatments based on the frequency of the irrigation events: single irrigation and cyclic irrigation. For the single irrigation frequency, pots received one irrigation event at 07:00 HR and the cyclic irrigation frequency divided the irrigation volume into three equal parts, with water applied at 08:00, 12:00, and 16:00 HR. From June to July, the single irrigation ran for 9 min, and the cyclic treatment ran 3 times for 3 min. From July–September. the single irrigation ran for 12 min, and the cyclic ran 3 times for 4 min. The irrigation duration was increased during the hotter summer months to match the increased demand by evaporation and the larger plant size.
A plant growth index (PGI) was measured at the end of the experiment, 2 September 2022, and calculated as the average of plant height and two canopy widths [(H + W1 + W2)/3]. Height was measured from the substrate surface to the highest leaf, whereas the two widths were measured monthly in perpendicular angles along the row (in a north–south direction) and across the row (in an east–west direction), using the outermost leaves in each direction.

2.3. Data Collection

Once a week, leachate was collected before noon but after the 07:00 (single) and 08:00 (cyclic) HR events by placing opaque, lidded five-gallon (18.9 L) plastic buckets underneath the PVC pipe designed to collect the leachate. The lids had holes cut into them for the PVC pipe. The leachate was the combined leachate from all 10 pots on each row. Each treatment group had four replicated rows (n = 4). Water samples (50 mL) were then collected from the buckets and stored in a refrigerator at 34 °F. After collecting the water samples, the buckets were rinsed with water, wiped with a cloth, and inverted to dry.
Water samples were analyzed for P using ICP-OES (Optima 3000DV; Perkin Elmer, Wellesley, MA, USA) and total inorganic N using a flow-injection system (FIAlyzer, 1000; FIA Labs, Seattle, WA, USA), while pH and electrical conductivity (EC) were measured using a pH electrode (InLab Expert Pro-ISM, Mettler-Toledo Inc., Columbus, OH, USA) and an EC electrode (InLab 742-ISM, Mettler-Toledo Inc., Columbus, OH, USA) attached to a portable meter (SevenGo Duo Pro SG78, Mettler-Toledo Inc., Columbus, OH, USA).
Weather data (solar radiation, precipitation, air temperature, and relative humidity) were collected from a weather station 100 m from the experiment (Station identification ARAO, AgriMet Cooperative Agricultural Weather Network, U.S. Bureau of Reclamation). Substrate temperature was monitored in six replicate pots per treatment (4 treatments × 6 pots = 24 total) using temperature probes (DS18B20, Maxim Integrated Products, Sunnyvale, CA, USA) installed on the south side of each container, positioned at mid-depth and 7.5 cm (3 in.) from the center. The temperature sensors were connected to an Arduino datalogger (Arduino UNO R3, Monza, Italy), which recorded data at 5 min intervals. The substrate temperature sensor data were cleaned by excluding data points that exceeded the physical limits (above 55 °C or below 0 °C). After data cleaning, the cumulative time each temperature sensor recorded values above three critical thresholds (25 °C, 30 °C, and 35 °C) was calculated for the data collection period (13 June–2 September). The time above each threshold was averaged across the six sensors in each treatment, and the results are presented as the mean and standard deviation for each treatment group.

2.4. Statistical Analyses

The experiment followed a completely randomized design with four treatment combinations (two pot colors × two irrigation regimes) and four replicates per treatment. Each experimental unit consisted of a row of ten plants randomly assigned to one of the treatment combinations.
Nutrient runoff was measured repeatedly throughout the season. To account for the non-independence of observations within rows across sampling dates, linear mixed-effects models (LMMs) were fit with pot color, irrigation regime, sampling date, and their interactions as fixed effects. Row was included as a random effect to account for repeated measures within experimental units.
Treatment effects on the final plant size were analyzed using a separate LMM with plant growth index (PGI) as the response variable, and pot color, irrigation regime, and their interaction as fixed effects. Row was included as a random intercept to account for the row-level application of treatments and subsampling of plants within rows.
In all models, the black pot and single irrigation regime served as the baseline levels for comparison, allowing the effects of other treatment combinations to be interpreted relative to these references. The significance of main effects and interactions was assessed using Type III ANOVA with Satterthwaite’s approximation for denominator degrees of freedom. Models were fit with the lmer function in the lme4 package in R (Version 4.5.1, R Core Team, 2025), and pairwise contrasts of estimated marginal means were computed with Tukey adjustment using the emmeans package (Version 4.5.1, R Core Team, 2025).
Statistical significance was set at p ≤ 0.05 for all tests. All figures were created by the authors using PowerPoint, MATLAB (Version R2025, The MathWorks, Inc., Natick, MA, USA), and SigmaPlot software (Version 15.0, Systat Software, Inc., San Jose, CA, USA).

3. Results

3.1. Weather Conditions

During the experimental period from June to September 2022, typical seasonal weather patterns were recorded at the experimental site in Aurora, Oregon. Solar radiation levels peaked in July, coinciding with the highest temperatures and driest conditions of the season (Table 1). Monthly accumulated solar radiation ranged from 817,497 kJ m−2 in July to 502,786 kJ m−2 in September, illustrating an expected increase in day length through the early summer months and a decline by September. Evapotranspiration (ET) followed a similar pattern, with the highest monthly total observed in July (20.4 cm), reflecting the heightened solar input and reduced humidity. August showed a slightly lower ET, at 18.2 cm, but precipitation remained minimal (0.03 cm), indicating persistently dry conditions. Relative humidity (RH) demonstrated a seasonal decrease, with the highest average of 78.9% in May and the lowest average of 65.8% in August, consistent with the region’s shift toward drier summer months. Air temperatures also varied predictably, with mean temperatures rising from 12.2 °C in May to a peak of 22.0 °C in August before falling to 19.0 °C in September. Maximum daily air temperatures were highest in August (30.3 °C), closely followed by July (29.8 °C), while the minimum temperatures ranged from 7.3 °C in May to 14.3 °C in both July and August. This analysis confirms that the study period captured typical seasonal weather trends for the region, characterized by progressively hotter and drier conditions reaching their peak in mid-summer before a gradual cooling in September.

3.2. Container Temperature

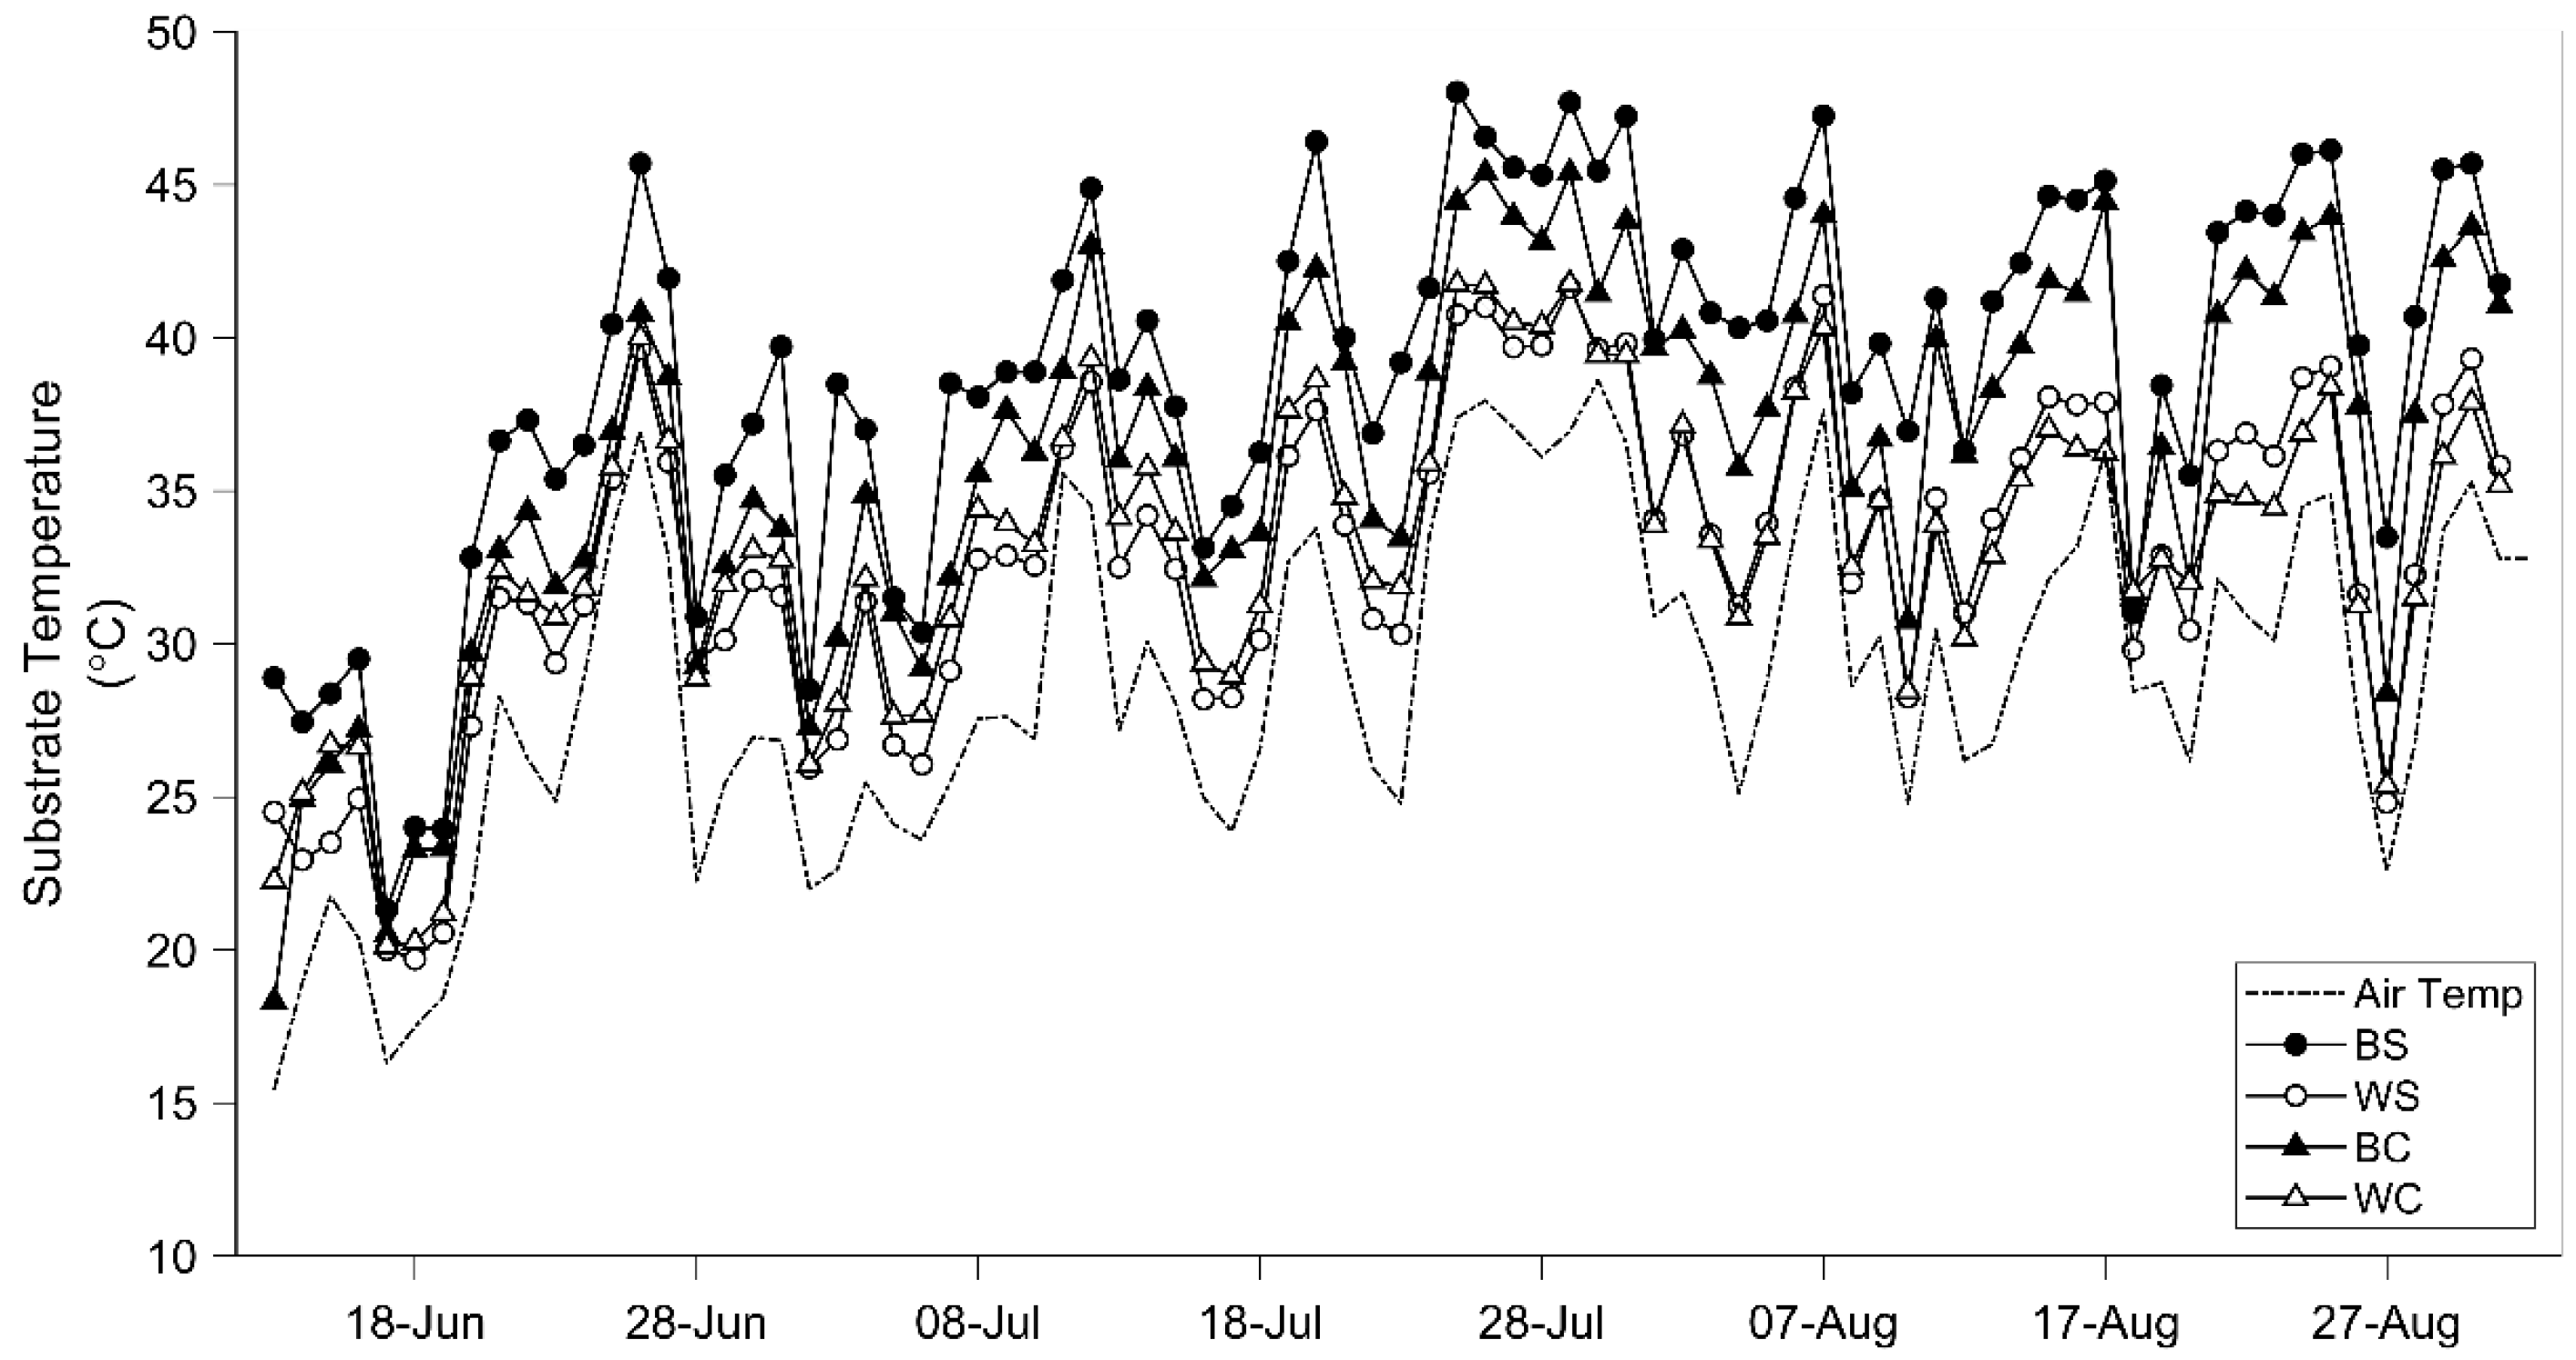
The black pots, single irrigation treatment (BS), consistently accumulated the greatest number of hours above all temperature thresholds (Table 2). It was the only group to exceed 45 °C for more than one hour, and it accumulated >150 h above 38 °C and >286 h above 35 °C. In contrast, the white pots, cyclic irrigation treatment (WC) accumulated only 12 h above 38 °C and 73 h above 35 °C. The analysis revealed that BS had significantly higher daily maximum root-zone temperatures than both the white pots, single irrigation treatment (WS, p < 0.001) and WC (p < 0.001). However, no significant differences were observed between the two white pot treatments (WC vs. WS, p = 0.999) or between BS and black pots, cyclic irrigation (BC, p = 0.096) (Figure 2). These results as well as the temperature thresholds (Table 2) indicate that pot color had a greater influence on the maximum temperature than irrigation frequency under the tested conditions.
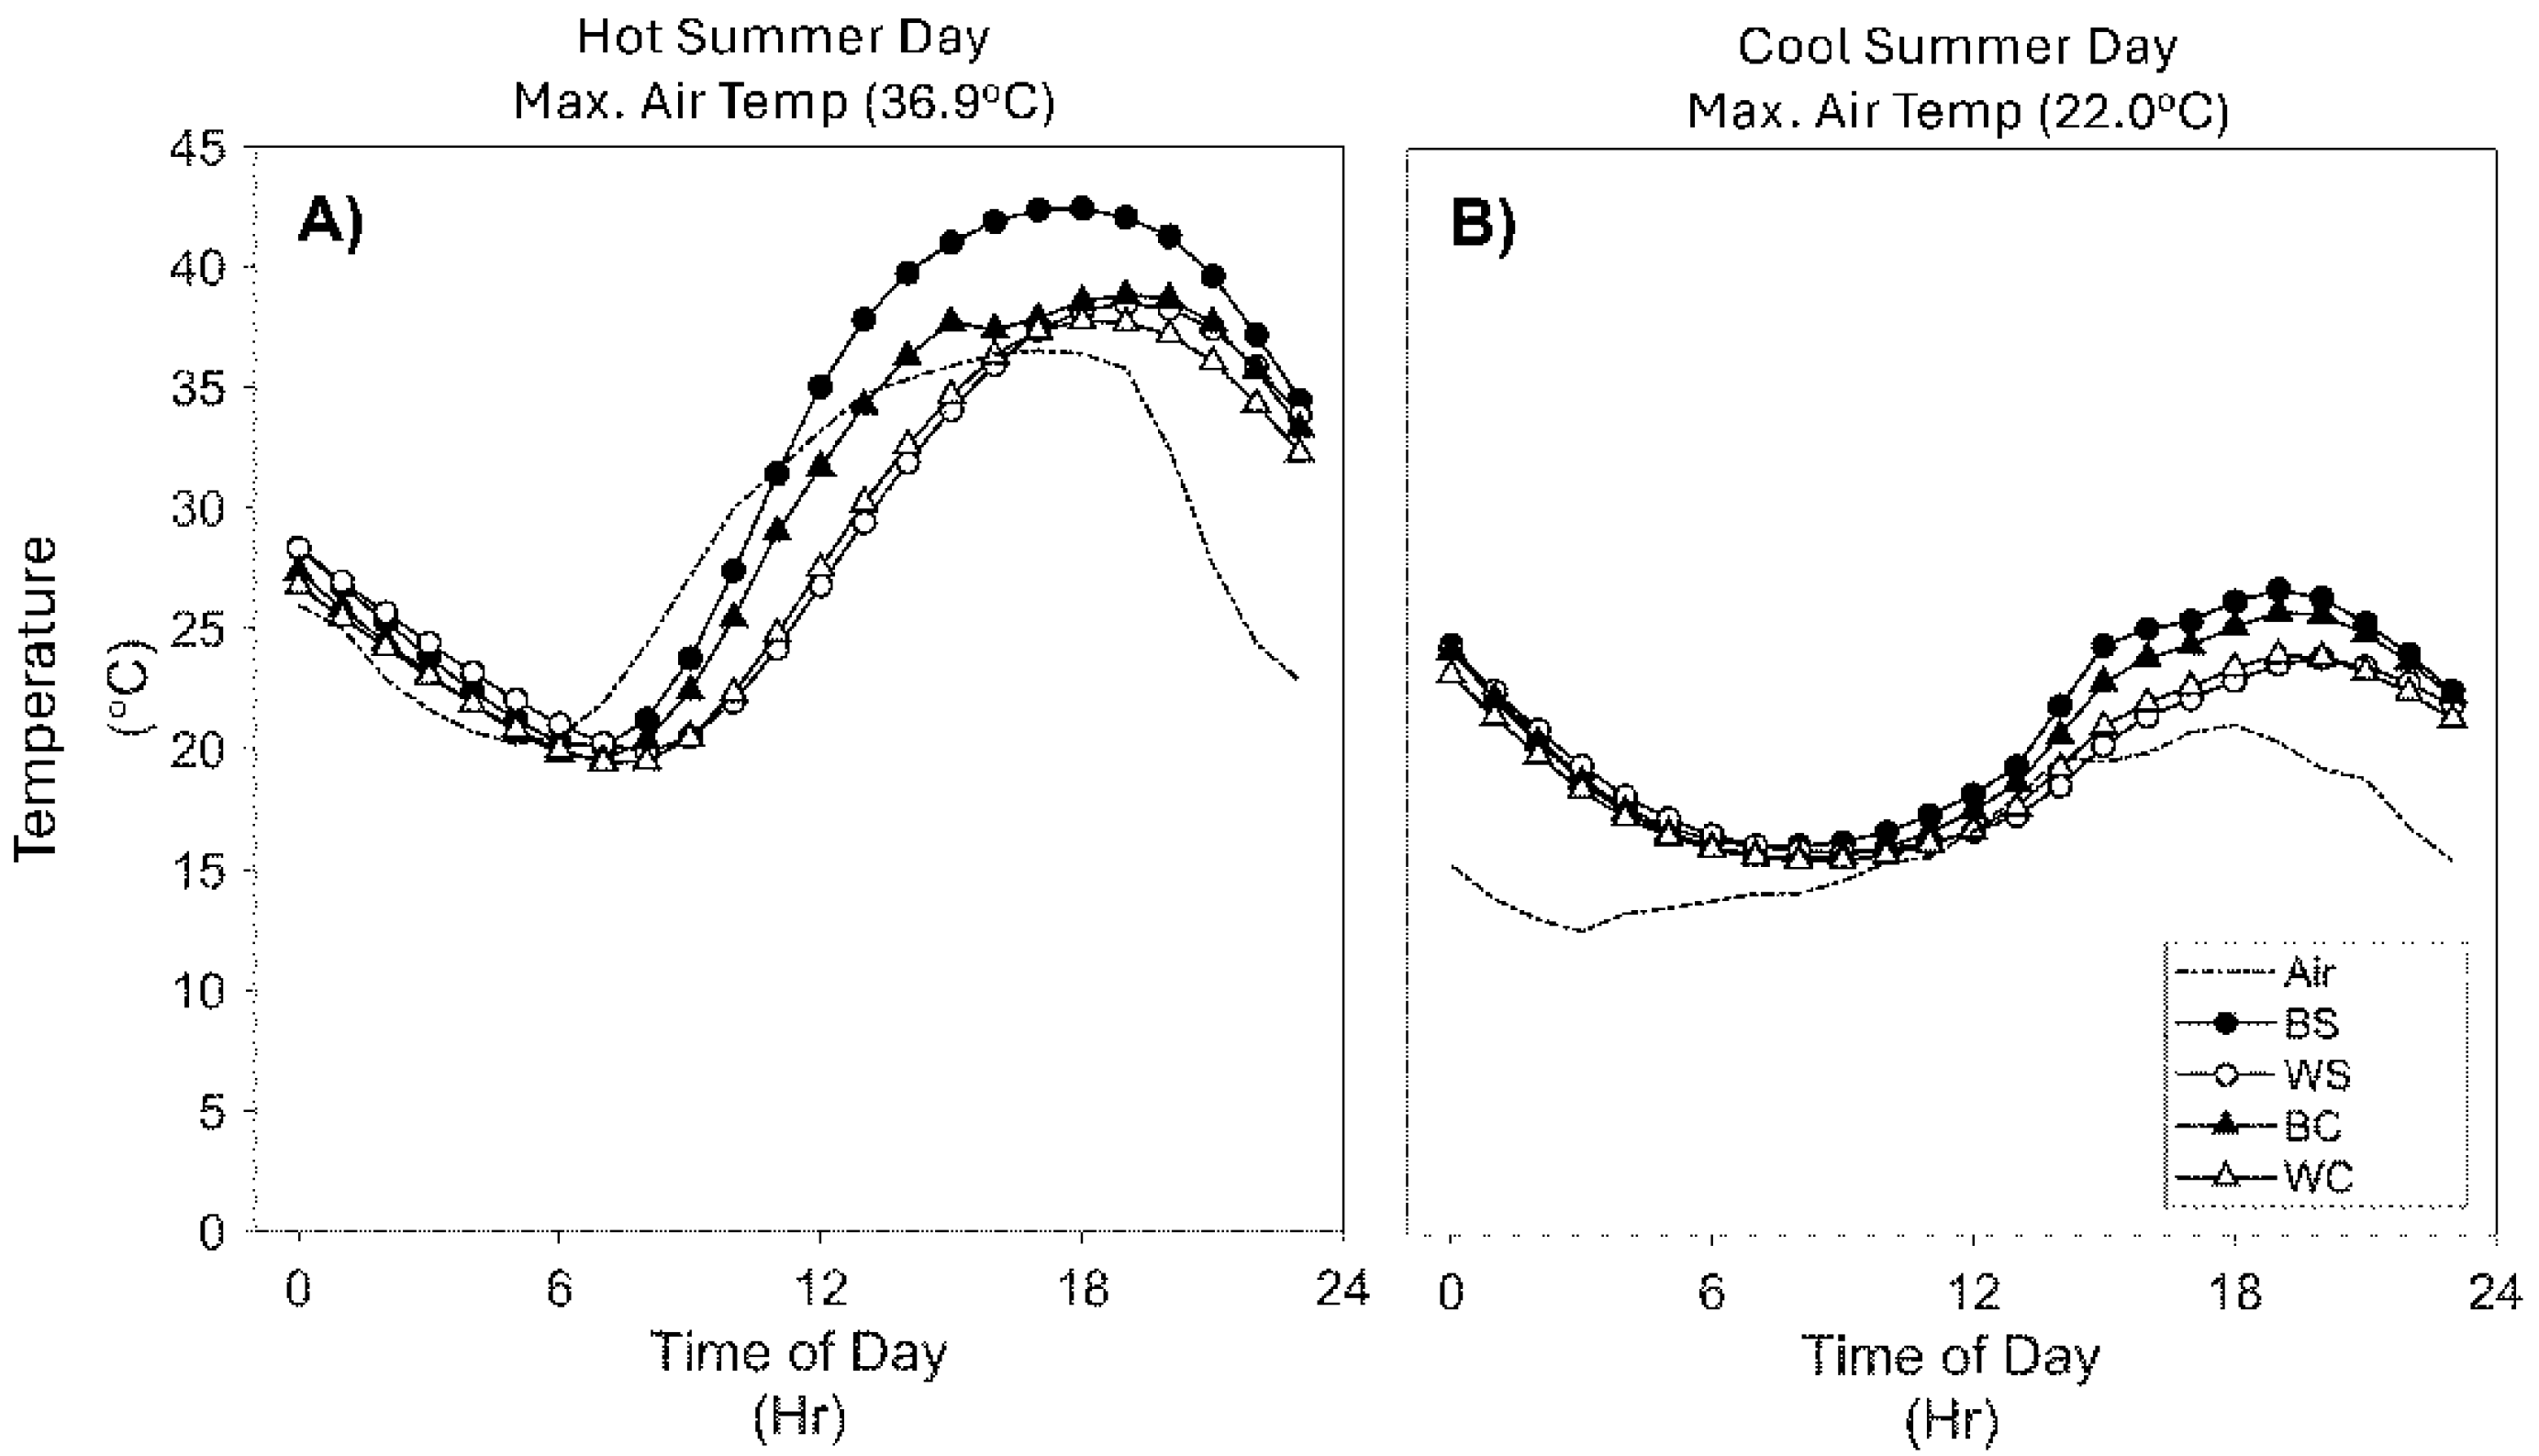
The impact of pot color and irrigation frequency on diurnal temperature fluctuations and average hourly pot temperatures for each treatment group was further illustrated by comparing a hot and cool day within the same week (Figure 3). On the hotter day, 26 Jun 2022, max. air temp. 37 °C, and daily solar radiation of 33,020 kJ m−2, pot temperatures began between 25 °C and 30 °C at midnight and cooled gradually until approximately 06:00. Following sunrise, the pots warmed as solar radiation increased, with the black pot treatments (BS and BC) showing a notably steeper temperature rise compared with the white pots. The BS treatment demonstrated the highest heat accumulation, exceeding 40 °C in the afternoon, indicating that single daily irrigation was less effective at moderating pot temperature than cyclic irrigation. The BC treatment displayed a similar trend of temperature increase during the morning; however, the cyclic irrigation effectively reduced the peak temperatures, resulting in a curve more aligned with the white pot treatments. The WS and WC treatments showed more moderate heat gains throughout the day, with the WC treatment cooling slightly faster in the early evening, presumably due to the cyclic watering event. The temperature curves for the white pot groups were closely aligned, demonstrating that pot color played a significant role in moderating temperature gain, whereas irrigation had a secondary effect.
For comparison, 2 July 2022 featured a peak air temperature of 22 °C and daily solar radiation of 14,983 kJ m−2. On this day, the temperature patterns for all treatments followed a similar diurnal cycle but with a reduced overall magnitude (Figure 3B). Pot temperatures started at approximately 25 °C at midnight, cooled to around 15 °C just after sunrise, and peaked slightly above 25 °C in the late afternoon. While the black pots (BS and BC) still gained more heat than the white pots, the differences between treatment groups were less pronounced compared with the hotter day. The cyclic irrigation for the BC and WC treatments provided a minimal temperature moderation in this cooler context, with WC showing a slight dip in the evening following the cyclic watering event. The overall temperature curves were smoother, with less dramatic shifts compared with the hot day (Figure 3A), underscoring the influence of external weather conditions on pot temperature.

3.3. Nutrient Leaching

3.3.1. Nitrogen

Total nitrogen (TN) concentrations in the leachate were evaluated using a linear mixed-effects model (LMM) with pot color (black vs. white), irrigation strategy (single vs. cyclic), the interaction of pot color and irrigation, and time (as a continuous covariate) as fixed effects. The baseline group was defined as BS, and the model intercept (4.84 mg L−1) represents the estimated TN concentration for this group at day 0. Across all treatment groups, the initial TN concentrations were similar, ranging from 3 to 5 mg L−1, and there were no statistically significant differences. In the mixed model, neither pot color (p = 0.52), irrigation strategy (p = 0.67), nor their interaction (p = 0.43) had significant main or combined effects on the TN levels.
The main effect of pot color showed that white pots had on average, lower TN levels than black pots by approximately 0.55 mg L−1, but this difference was not statistically significant (p = 0.397). Similarly, cyclic irrigation was associated with a slight increase in TN levels by 0.59 mg L−1 compared with single irrigation, though this effect was also not statistically significant (p = 0.366). These results suggest that neither pot color nor irrigation treatment had a major impact on TN leaching when considered independently. Time, however, was a significant factor influencing the TN levels throughout the experiment. The model showed a consistent decrease in TN over time, with an estimated reduction of 0.062 mg L−1 per day (p < 0.001). This decline in TN levels was observed across all treatment groups and suggests a gradual depletion of the nitrogen source as the controlled-release fertilizer was exhausted.
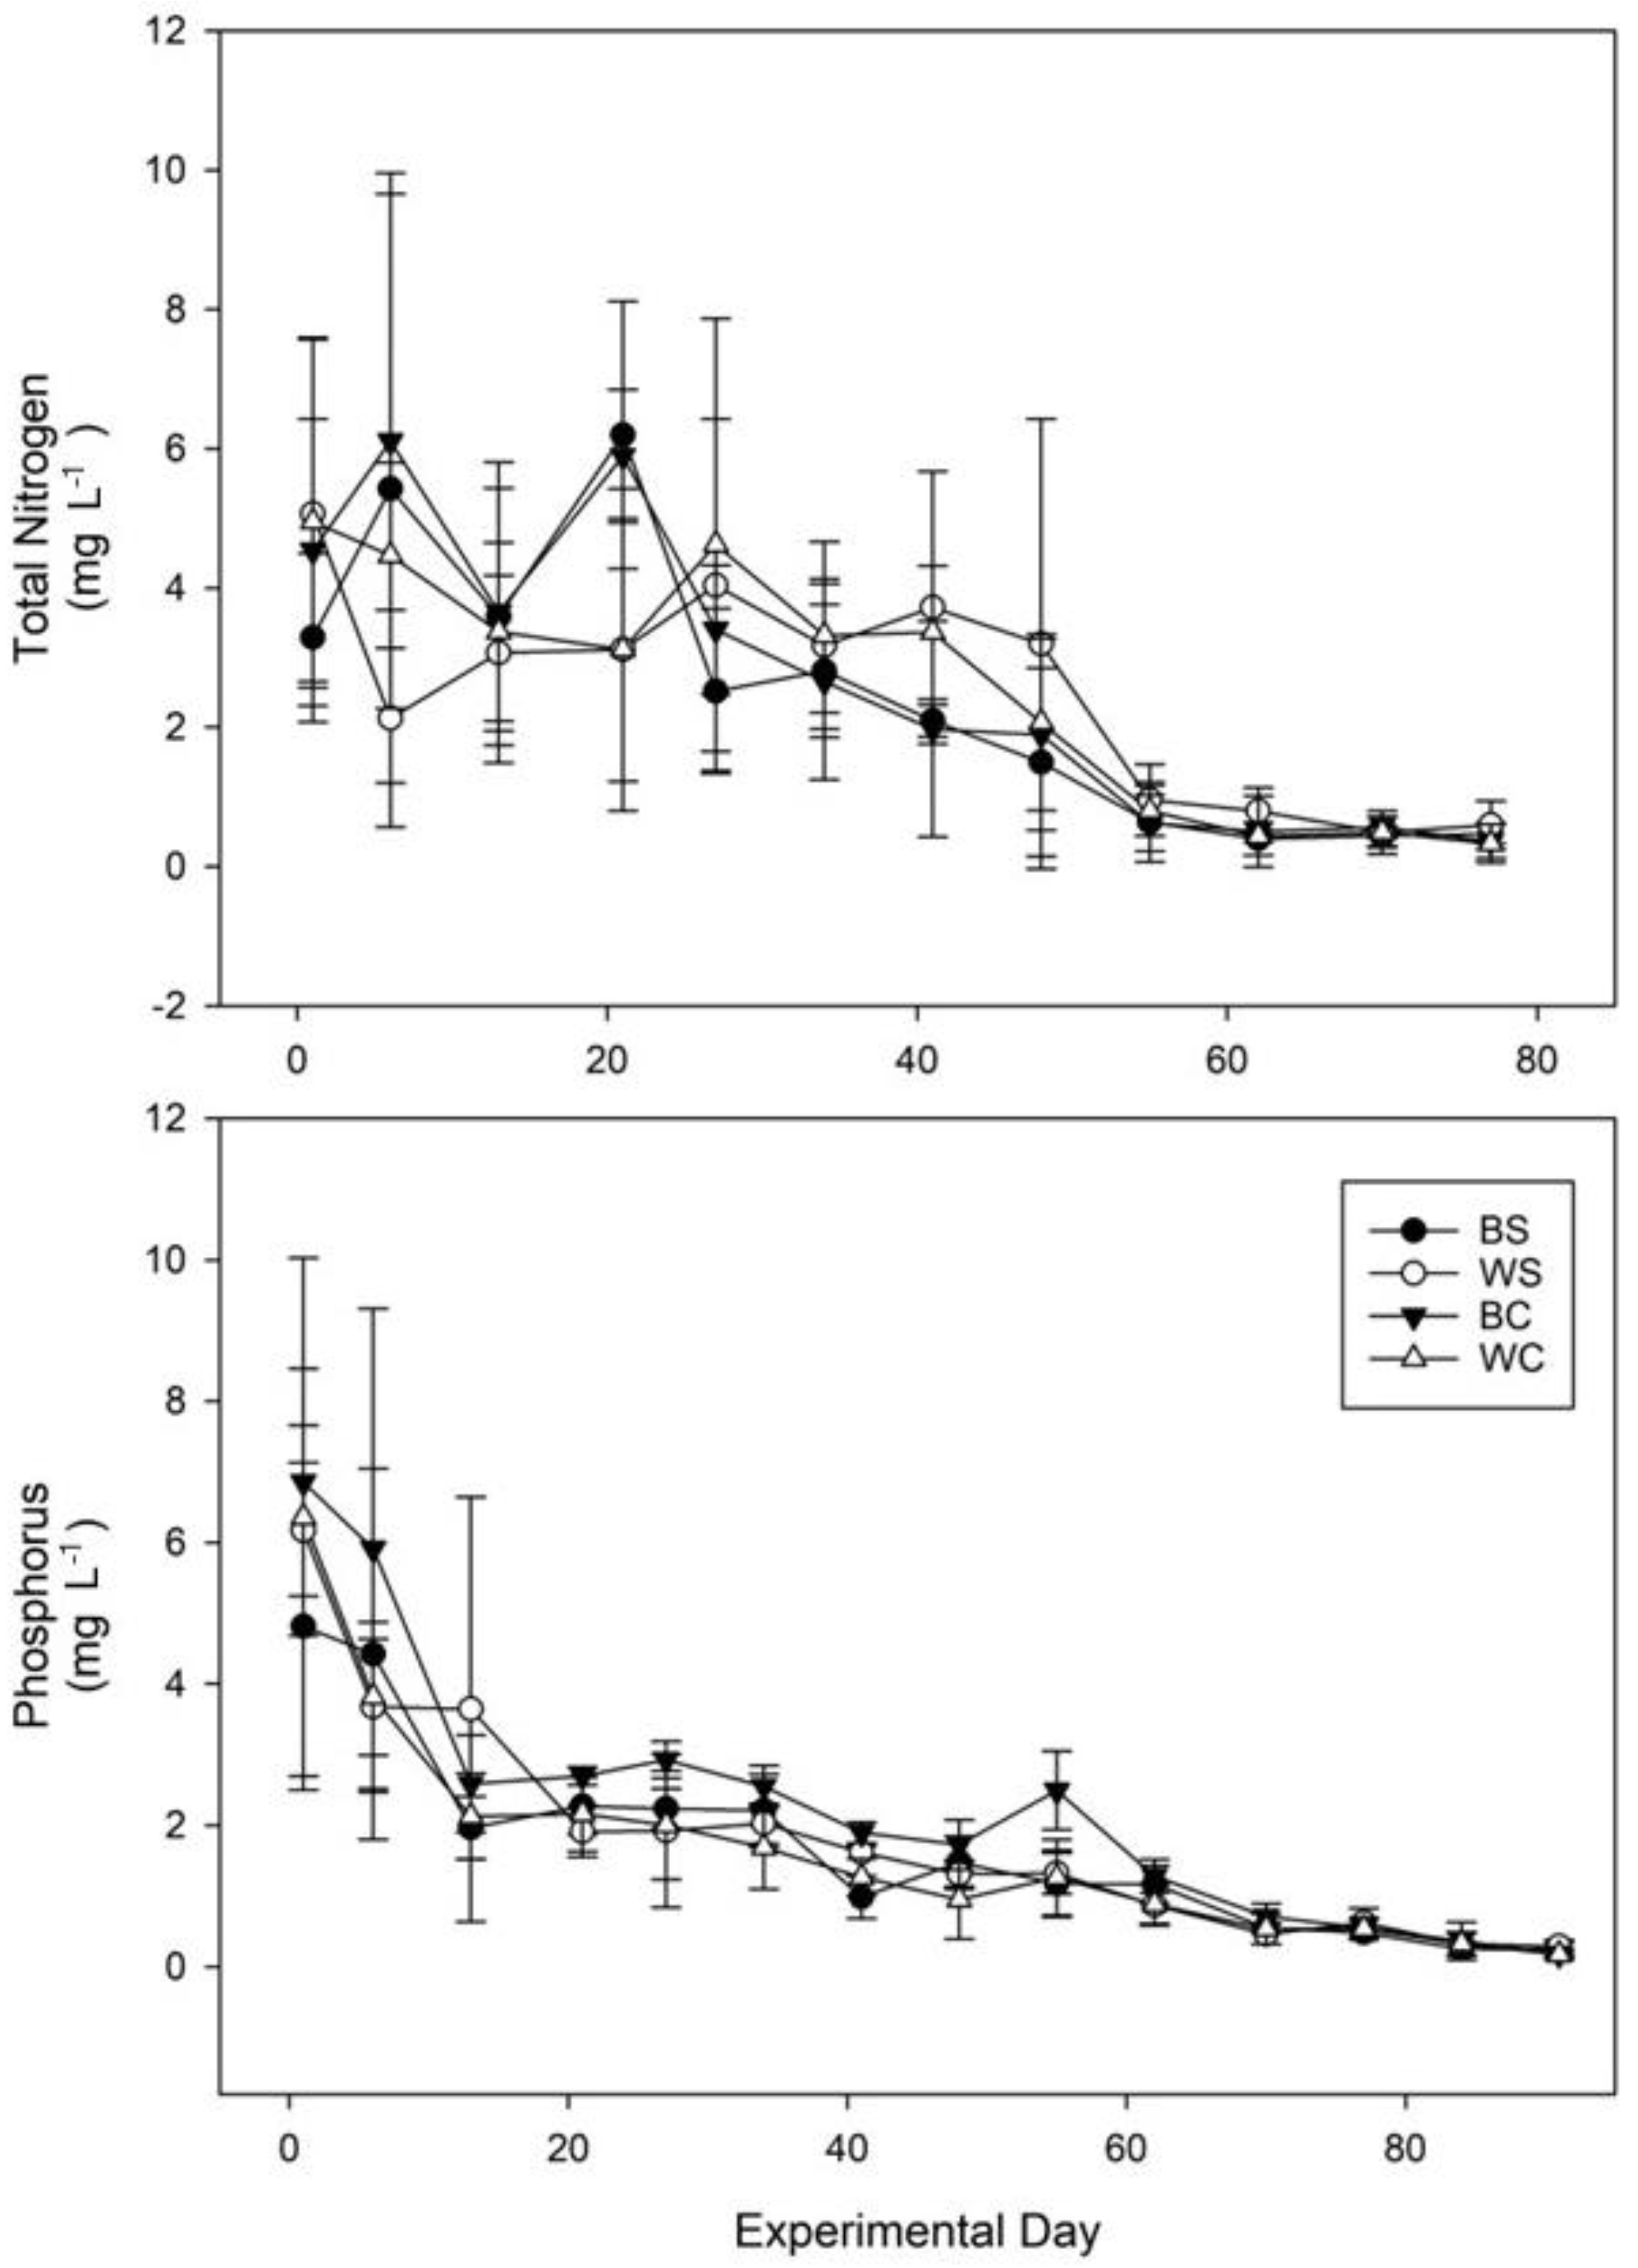
The patterns of TN leaching observed in Figure 4 align with the statistical analysis. The black pots (BS and BC) displayed some initial fluctuations in TN during the first four weeks, with brief increases to approximately 6 mg L−1 followed by declines. However, the differences between single and cyclic irrigation in black pots were minimal, as the TN levels for BS and BC remained similar throughout the experiment. In contrast, the white pot groups (WS and WC) showed lower TN levels than black pots during the initial phase of the experiment, suggesting a potential delay in nitrogen release or reduced leaching from white pots. By the middle of the experiment (weeks 4 to 8), the white pot groups exhibited slightly higher TN concentrations compared with the black pots, which may reflect differences in the timing of nutrient release. By week 9 (day 63), the TN levels for all groups converged, indicating that the majority of the controlled-release fertilizer had been depleted by this point in the experiment. This convergence was followed by a flattening of the TN curves, with little change in concentration observed from day 63 to the end of the study, day 77. The lack of significant interactions involving time (pot color × time, irrigation × time, and the three-way interaction) suggest that TN leaching was primarily governed by the fertilizer release dynamics over time, rather than the treatment effects.

3.3.2. Phosphorus

Phosphorus concentrations in leachate were evaluated using a linear mixed-effects model (LMM), with pot color (black vs. white), irrigation strategy (single vs. cyclic), and time (continuous) as fixed effects. The baseline group was BS, and the model intercept (3.68 mg L−1) represents the estimated P concentration for this group at the start of the experiment (p < 0.001). At baseline, all treatments had similar P concentrations in leachate, ranging from 5 to 7 mg L−1, and there were no statistically significant differences among treatments at day 0. Time had a strong negative effect on P concentration (estimate: −0.043 mg L−1 per day, p < 0.001), reflecting nutrient depletion due to plant uptake and leaching over the 13-week trial.
Irrigation strategy had a significant main effect: cyclic irrigation increased the P concentrations by 1.31 mg L−1 compared with single irrigation (p = 0.014). However, this effect was modified by a significant interaction with pot color (p = 0.031). Specifically, while BC increased P leaching relative to BS, WC exhibited lower P concentrations—1.55 mg L−1 less than expected based on the additive main effects.
The interaction between pot color and time was not significant (p = 0.456), indicating that the rate of P decline over time did not differ meaningfully between black and white pots. Similarly, the interaction between irrigation regime (single vs. cyclic) and time was not statistically significant (p = 0.054), suggesting no reliable difference in the rate of P decline due to irrigation frequency (Figure 4). Although the estimate for this interaction was –0.016 mg L−1 per day, this effect did not meet the threshold for statistical significance and should not be interpreted as evidence of a treatment effect. The three-way interaction among pot color, irrigation regime, and time was also non-significant (p = 0.120), indicating that the combined effects of pot color and irrigation frequency did not significantly alter the overall trend in P leaching over time. All treatment groups exhibited a steady decline in P concentrations, with a rapid decrease in the first three weeks (to approximately 2–4 mg L−1) followed by a gradual reduction of about 0.01 mg L−1 per week. By the end of the experiment (day 91), P levels in all treatments converged near 0 mg L−1, suggesting the near-complete depletion of available P.

3.4. Plant Growth Index (PGI)

There were no statistically significant effects of color, water, or their interaction on PGI. Type III ANOVA with Satterthwaite’s method showed that neither color (p = 0.83), water (p = 0.71), nor the color × water interaction (p = 0.88) influenced the PGI. Pairwise comparisons of estimated marginal means confirmed the absence of meaningful differences between treatment combinations (all p > 0.97). These results indicate that the variability in PGI among individual plants within rows was much larger than any effect of the treatments applied. The box and whisker plot illustrates the distribution of PGI values across the four treatment groups: BS, WS, BC, and WC (Figure 5).

4. Discussion

4.1. Pot Color and Plant Growth

The results of this study highlight the significant role of pot color in regulating RZT. White pots consistently kept the root zone cooler compared with black pots, and in some cases, supported higher growth. Other studies comparing plant growth in white and black containers reported similar findings, with white containers maintaining lower average RZT or shortening the duration above critically high RZT, resulting in larger plants when growing Ilex crenata ‘Soft Touch’ [31], Thuja occidentalis ‘Green Giant’ [3,32], Cercis canadensis, and Acer rubrum [33]. However, white pots should not be immediately considered a panacea, considering that in this experiment, pot color did not have a statistically significant effect on plant growth, and no interaction with irrigation regime was detected (all p > 0.70). Therefore the magnitude of the growth-promoting effects of using white instead of black plastic containers is species- and even cultivar-specific. For example, Markham et al. [33] showed that while both redbud (Cercis canadensis) and red maple (Acer rubrum) benefited from being grown in lighter-colored containers, the redbuds had 44% more shoot biomass and red maples > 120% more shoot biomass when grown in white compared with black plastic containers. In our study, ‘Limelight’ hydrangea did not exhibit significant growth differences between white and black pots, suggesting that under Oregon’s relatively mild climate, pot color alone may not strongly influence growth.
Nonetheless, the pot treatments had a clear impact on the thermal environment. Plants in black pots experienced substantially more hours above critical root-zone temperature thresholds (e.g., >35 °C, >38 °C) compared with those in white pots (Table 2), and the literature indicates that prolonged exposure above 35–38 °C can inhibit photosynthesis and slow growth, and that root growth may cease at ~38 °C [2,32]. Heat-induced root injury can lead to reduced root function and greater susceptibility to root pathogens, particularly under the warm and moist conditions typical of container nursery environments where root rot diseases are well-documented [34,35]. The cooler temperatures in white pots likely reduced stress on the roots through improving both water and nutrient uptake and reducing energy expenditure on root respiration. Altering irrigation frequency can change the availability of N in the growing substrate or the ability of roots to absorb N [36].
In contrast, black pots, which tend to absorb and retain heat, led to w consistently and often drastically higher RZT. The accumulated hours above critical thresholds (>35 °C and >38 °C) in black pots indicate that roots were exposed to conditions associated with indirect injury and potential long-term damage [2,32], even though this did not translate into reductions in PGI in our study. The negative effects of supraoptimal RZT on plant physiological processes that lead to stunted plant growth have been reviewed by several research teams [2,37]. In other studies, increased RZT led to a decrease in chlorophyll and carotenoid concentrations, while the foliar soluble protein levels increased, suggesting that Ilex cornuta ‘Rotundifolia’ is able to adjust its metabolism in response to temperature changes [15]. Additionally, the authors concluded that the root-zone temperature affected RuBisCO activation, which influenced the partitioning of photoassimilates between the shoots and roots, potentially due to reduced chlorophyll levels. These metabolic adjustments are consistent with those found in other studies on supraoptimal root-zone temperatures [3,17]. This reduced growth by supraoptimal root-zone temperatures has been consistently reported for container grown plants [2,17,32]. Overall, our results suggest that while pot color strongly influenced the root thermal environment, the duration of exposure to supraoptimal RZT did not produce detectable growth differences under the conditions of this experiment, likely due to either physiological tolerance or the large variability among plants.

4.2. Nutrient Concentrations and Runoff

Nutrient concentrations in runoff were initially influenced by the irrigation frequency. In BC, which provides shorter and more frequent waterings, the higher leachate P concentrations initially may have been a concentration effect from the presumably lower leachate volume following the 3 to 4 min morning cycle in the cyclic irrigation treatment compared with 9 to 12 min irrigation for the single irrigation treatment. In addition, the continually moist substrate in the cyclic irrigation treatment may have facilitated nutrient diffusion out of the CRF prills, whereas diffusion of nutrients from the prills in the single irrigation pots, particularly in the prills closer to the substrate surface, would have been limited due to substrate drying between irrigations. Over time, P concentrations in the runoff decreased, which was likely a consequence of the diminishing nutrient supply in the CRF and the greater nutrient uptake rate of larger plants with root systems occupying more of the substrate volume compared with earlier in the study [38,39]. Interestingly, compared with BC, the WC treatment showed reduced P runoff, which suggests that the cooler RZT helped retain P in the CRF prills, improve plant uptake, or both. This finding adds a novel perspective to the existing literature, where irrigation volume and frequency are typically considered the primary factors influencing nutrient runoff [36,40]. Lower P runoff from WC compared with BC was surprising because cyclic irrigation frequency alone increased the P concentrations, and white pots also tended to have slightly higher P levels. Unexpectedly low P concentrations in runoff when white containers were paired with cyclic irrigation may be attributed to enhanced plant growth in this treatment combination, as indicated by higher PGI values, which could lead to greater P uptake by the plants.
The total N concentrations followed a similar temporal pattern, with a gradual decrease over the course of the study. Despite no significant interaction between irrigation frequency and pot color on the N concentrations, the N leaching patterns highlight the importance of time in nutrient dynamics, especially with CRF. N release from CRF is known to be gradual, and our results emphasize that a majority of N is leached out early in the growth cycle, a finding consistent with previous research [24,41].

4.3. Implications for Sustainable Nursery Practices

The findings from this study suggest that both pot color and irrigation frequency are important considerations for growers aiming to minimize root-zone heat stress while mitigating runoff of potentially environmentally hazardous nutrients such as P. Using white pots, which naturally maintain cooler RZT, appears to be a simple but effective strategy to improve plant growth in nursery production systems, regardless of the irrigation method. When paired with cyclic irrigation, the white pots reduced nutrient losses, particularly P, when compared to black pots under single irrigation. In contrast, black pots, which had higher RZT, benefited from cyclic irrigation, which mitigated some of the negative effects of heat stress and may have contributed to more consistent nutrient release from the CRF. These results underscore the importance of integrating container properties with irrigation strategy to improve plant performance and support environmental stewardship in nursery systems.
While this study provides valuable insights into the effects of pot color and irrigation on plant health and nutrient dynamics, there are several limitations that warrant future investigation. Different species will exhibit varied responses to temperature and irrigation. Therefore, expanding the study to include a wider range of plants could provide more comprehensive data on the generalizability of these results. Commercial nursery growers have access to a diverse array of CRF products that differ in coating material and thickness, granule size, and nutrient-salt solubility—factors that can impact the thermosensitivity of the CRF. Accordingly, the extent to which root-zone cooling practices mitigate nutrient leaching is likely influenced by the specific characteristics of the CRF employed. Furthermore, the irrigation delivery method may influence both the efficiency of heat displacement from the root zone and the rate of nutrient leaching and runoff from the production site. For example, within a given container, overhead sprinkler irrigation often wets the container substrate more uniformly and completely than microirrigation methods, likely cooling the root zone more effectively. On the other hand, overhead irrigation typically results in substantially greater nutrient runoff than microirrigation, primarily because the high water volume falling between spaced containers mobilizes leached nutrients more readily [42,43]. An additional consideration is the economic and environmental impact of selecting colored versus black pots. Black pots are commonly made from recycled post-consumer and post-industrial plastic waste and are generally less expensive per unit than colored pots, including white ones. In contrast, white pots typically require virgin plastic to maintain their color, making them more resource-intensive and costly. These tradeoffs highlight the need to weigh sustainability alongside production outcomes—raising the question of whether the potential growth gains and nutrient savings justify a shift in purchasing decisions for commercial nurseries that buy thousands of pots each year.

Author Contributions

Conceptualization, L.N. and J.F.; Methodology, L.N. and D.M.; Validation, L.N., D.M., J.O.J., and J.S.; Formal analysis, L.N. and D.M.; Investigation, L.N. and D.M.; Resources, J.O.J.; Data curation, L.N. and D.M.; Writing—original draft preparation, L.N. and D.M.; Writing—review and editing, L.N., D.M., J.S., J.O.J., and J.F.; Visualization, L.N. and D.M.; Supervision, L.N.; Project administration, L.N.; Funding acquisition, L.N., J.O.J., and J.F. All authors have read and agreed to the published version of the manuscript.

Funding

This work was funded in part by the Oregon Agricultural Experiment Station with funding from the Hatch Act capacity funding program, USDA National Institute of Food and Agriculture, Multistate project NC1186, USDA ARS Project #2072-21000-055-000-D, and USDA Floral and Nursery Crop Initiative # 58-5082-3-023.

Data Availability Statement

The data presented in this study are available on request from the corresponding authors due to privacy reasons.

Acknowledgments

We thank Melissa Topping, Brian Christopher Hill, and Carolyn Scagel. Mention of trade names or commercial products in this publication is solely for the purpose of providing specific information and does not imply recommendation or endorsement by the U.S. Department of Agriculture. USDA is an equal opportunity provider and employer. During the preparation of this manuscript, the authors used ChatGPT-5 for the purposes of English language grammar and text editing. The authors have reviewed and edited the output and take full responsibility for the content of this publication.

Conflicts of Interest

The authors declare no conflicts of interest.

Abbreviations

The following abbreviations are used in this manuscript:
LMMLinear mixed-effect model
PGIPlant growth index
RZTRoot zone temperature
CRFControl release fertilizer

References

  1. Nackley, L.; McCauley, D.; Scagel, C.F. Hot Mess: Heatwave Effects on Controlled-Release Fertilizer. HortScience 2023, 58, 1459–1460. [Google Scholar] [CrossRef]
  2. Ingram, D.L.; Ruter, J.M.; Martin, C.A. Review: Characterization and Impact of Supraoptimal Root-Zone Temperatures in Container-Grown Plants. HortScience 2015, 50, 530–539. [Google Scholar] [CrossRef]
  3. Witcher, A.L.; Pickens, J.M.; Blythe, E.K. Container Type and Substrate Affect Root Zone Temperature and Growth of ‘Green Giant’ Arborvitae. Horticulturae 2020, 6, 22. [Google Scholar] [CrossRef]
  4. Fields, J.S.; Owen, J.S.; Lamm, A.; Altland, J.; Jackson, B.; Oki, L.; Samtani, J.B.; Zheng, Y.; Criscione, K.S. Surveying North American Specialty Crop Growers’ Current Use of Soilless Substrates and Future Research and Education Needs. Agriculture 2023, 13, 1727. [Google Scholar] [CrossRef]
  5. Kingston, P.H.; Scagel, C.F.; Bryla, D.R. Suitability of Sphagnum Moss, Coir, and Douglas Fir Bark as Soilless Substrates for Container Production of Highbush Blueberry. HortScience 2017, 52, 1692–1699. [Google Scholar] [CrossRef]
  6. Dickson, R.W.; Machesney, L.M.; Henderson, E.O. Forcing Temperature Effects on Plant Development for Containerized Blackberry Grown Using Long-Cane Techniques. Horticulturae 2023, 9, 1090. [Google Scholar] [CrossRef]
  7. Linnemannstöns, L. Substrate Cultivation of Raspberry in Germany. Acta Hortic. 2020, 1277, 165–172. [Google Scholar] [CrossRef]
  8. Young, R.E.; Bachman, G.R. Temperature Distribution in Large, Pot-in-Pot Nursery Containers. J. Environ. Hortic. 1996, 14, 170–176. [Google Scholar] [CrossRef]
  9. Bartusek, S.; Kornhuber, K.; Ting, M. 2021 North American Heatwave Amplified by Climate Change-Driven Nonlinear Interactions. Nat. Clim. Chang. 2022, 12, 1143–1150. [Google Scholar] [CrossRef]
  10. Cross, J.F.; Owen, J.S.; Shreckhise, J.H.; Fields, J.S.; Nackley, L.; Altland, J.E.; Drewry, D.T. Parsimonious Models of Root Zone Temperature in Soilless Substrates through Ensemble Machine Learning. Smart Agric. Technol. 2025, 12, 101289. [Google Scholar] [CrossRef]
  11. Bonachela, S.; López, J.C.; Granados, M.R.; Magán, J.J.; Hernández, J.; Baille, A. Effects of Gravel Mulch on Surface Energy Balance and Soil Thermal Regime in an Unheated Plastic Greenhouse. Biosyst. Eng. 2020, 192, 1–13. [Google Scholar] [CrossRef]
  12. Martin, C.A.; Ingram, D.L. Container Dimension Affects Rooting Medium Temperature Patterns. HortScience 1993, 28, 18–19. [Google Scholar] [CrossRef]
  13. Nambuthiri, S.; Hagen, E.; Fulcher, A.; Geneve, R. Evaluating a Physiological-Based, On-Demand Irrigation System for Container-Grown Woody Plants with Different Water Requirements. HortScience 2017, 52, 251–257. [Google Scholar] [CrossRef]
  14. Mathers, H.M.; Lowe, S.B.; Scagel, C.; Struve, D.K.; Case, L.T. Abiotic Factors Influencing Root Growth of Woody Nursery Plants in Containers. HortTechnology 2007, 17, 151–162. [Google Scholar] [CrossRef]
  15. Ruter, J.M.; Ingram, D.L. High Root-Zone Temperatures Influence RuBisCO Activity and Pigment Accumulation in Leaves of ‘Rotundifolia’ Holly. J. Am. Soc. Hortic. Sci. 1992, 117, 154–157. [Google Scholar] [CrossRef]
  16. Kerbler, S.M.; Wigge, P.A. Temperature Sensing in Plants. Annu. Rev. Plant Biol. 2023, 74, 341–366. [Google Scholar] [CrossRef]
  17. Ingram, D.L. Modeling High Temperature and Exposure Time Interactions on Pittosporum Tobira Root Cell Membrane Thermostability. J. Amer. Soc. Hort. Sci. 1985, 110, 470–473. [Google Scholar] [CrossRef]
  18. Adams, C.; Frantz, J.; Bugbee, B. Macro- and Micronutrient-release Characteristics of Three Polymer-coated Fertilizers: Theory and Measurements. J. Plant Nutr. Soil Sci. 2013, 176, 76–88. [Google Scholar] [CrossRef]
  19. Ransom, C.J.; Jolley, V.D.; Blair, T.A.; Sutton, L.E.; Hopkins, B.G. Nitrogen Release Rates from Slow- and Controlled-Release Fertilizers Influenced by Placement and Temperature. PLoS ONE 2020, 15, e0234544. [Google Scholar] [CrossRef]
  20. Majsztrik, J.C.; Fernandez, R.T.; Fisher, P.R.; Hitchcock, D.R.; Lea-Cox, J.; Owen, J.S.; Oki, L.R.; White, S.A. Water Use and Treatment in Container-Grown Specialty Crop Production: A Review. Water Air Soil Pollut. 2017, 228, 151. [Google Scholar] [CrossRef]
  21. Yazdi, M.N.; Sample, D.J.; Scott, D.; Owen, J.S.; Ketabchy, M.; Alamdari, N. Water Quality Characterization of Storm and Irrigation Runoff from a Container Nursery. Sci. Total Environ. 2019, 667, 166–178. [Google Scholar] [CrossRef]
  22. Lobell, D.B.; Bonfils, C.J.; Kueppers, L.M.; Snyder, M.A. Irrigation Cooling Effect on Temperature and Heat Index Extremes. Geophys. Res. Lett. 2008, 35, 2008GL034145. [Google Scholar] [CrossRef]
  23. Million, J.B.; Yeager, T.H. Production of Thuja (T. standishii x T. plicata) Using an Automated Micro-Irrigation System and Routine Leaching Fraction Testing in a Container Nursery1. J. Environ. Hortic. 2018, 36, 140–145. [Google Scholar] [CrossRef]
  24. Ammons, A.; LeBude, A.V.; Owen, J.S.; McGinnis, M. Effect of Irrigation, Fertilizer Rate and Placement, and Two Substrates on Growth of Rose and Hydrangea. J. Environ. Hortic. 2022, 40, 123–128. [Google Scholar] [CrossRef]
  25. Mack, R.; Owen, J.S.; Niemiera, A.X.; Sample, D.J. Validation of Nursery and Greenhouse Best Management Practices through Scientific Evidence. HortTechnology 2019, 29, 700–715. [Google Scholar] [CrossRef]
  26. Warren, S.L.; Bilderback, T.E. More Plant per Gallon: Getting More out of Your Water. HortTechnology 2005, 15, 14–18. [Google Scholar] [CrossRef]
  27. Fare, D.C.; Gilliam, C.H.; Keever, G.J.; Olive, J.W. Cyclic Irrigation Reduces Container Leachate Nitrate-Nitrogen Concentration. HortScience 1994, 29, 1514–1517. [Google Scholar] [CrossRef]
  28. Tyler, H.H.; Warren, S.L.; Bilderback, T.E. Cyclic Irrigation Increases Irrigation Application Efficiency and Decreases Ammonium Losses. J. Environ. Hortic. 1996, 14, 194–198. [Google Scholar] [CrossRef]
  29. Warren, S.L.; Bilderback, T.E. Timing of Low Pressure Irrigation Affects Plant Growth and Water Utilization Efficiency. J. Environ. Hortic. 2002, 20, 184–188. [Google Scholar] [CrossRef]
  30. Ingram, D.L. Characterization of Temperature Fluctuations and Woody Plant Growth in White Poly Bags and Conventional Black Containers1. HortScience 1981, 16, 762–763. [Google Scholar] [CrossRef]
  31. McBrayer, R.H.; Pickens, J.M.; Witcher, A.L.; Wells, D.E.; Sibley, J.L. Effects of Nursery Container Color and Spacing on Root Zone Temperatures of ‘Soft Touch’ Holly. Agriculture 2022, 12, 2165. [Google Scholar] [CrossRef]
  32. Witcher, A.L.; Pickens, J.M.; Blythe, E.K. Container Color and Compost Substrate Affect Root Zone Temperature and Growth of “Green Giant” Arborvitae. Agronomy 2020, 10, 484. [Google Scholar] [CrossRef]
  33. Markham, J.W.; Bremer, D.J.; Boyer, C.R.; Schroeder, K.R. Effect of Container Color on Substrate Temperatures and Growth of Red Maple and Redbud. HortScience 2011, 46, 721–726. [Google Scholar] [CrossRef]
  34. Parke, J.L.; Grünwald, N.J. A Systems Approach for Management of Pests and Pathogens of Nursery Crops. Plant Dis. 2012, 96, 1236–1244. [Google Scholar] [CrossRef] [PubMed]
  35. Weiland, J.E. The Challenges of Managing Phytophthora Root Rot in the Nursery Industry. Plant Health Prog. 2021, 22, 332–341. [Google Scholar] [CrossRef]
  36. Scagel, C.F.; Bi, G.; Fuchigami, L.H.; Regan, R.P. Effects of Irrigation Frequency and Nitrogen Fertilizer Rate on Water Stress, Nitrogen Uptake, and Plant Growth of Container-Grown Rhododendron. HortScience 2011, 46, 1598–1603. [Google Scholar] [CrossRef]
  37. Mishra, S.; Spaccarotella, K.; Gido, J.; Samanta, I.; Chowdhary, G. Effects of Heat Stress on Plant-Nutrient Relations: An Update on Nutrient Uptake, Transport, and Assimilation. Int. J. Mol. Sci. 2023, 24, 15670. [Google Scholar] [CrossRef]
  38. Shreckhise, J.H.; Owen, J.S.; Eick, M.J.; Niemiera, A.X.; Altland, J.E.; White, S.A. Dolomite and Micronutrient Fertilizer Affect Phosphorus Fate in Pine Bark Substrate Used for Containerized Nursery Crop Production. Soil Sci. Soc. Am. J. 2019, 83, 1410–1420. [Google Scholar] [CrossRef]
  39. Tolman, D.A.; Niemiera, A.X.; Wright, R.D. Influence of Plant Age on Nutrient Absorption for Marigold Seedlings. HortScience 1990, 25, 1612–1613. [Google Scholar] [CrossRef]
  40. Warsaw, A.L.; Fernandez, R.T.; Cregg, B.M.; Andresen, J.A. Container-Grown Ornamental Plant Growth and Water Runoff Nutrient Content and Volume Under Four Irrigation Treatments. HortScience 2009, 44, 1573–1580. [Google Scholar] [CrossRef]
  41. Cabrera, R.I. Comparative Evaluation of Nitrogen Release Patterns from Controlled-Release Fertilizers by Nitrogen Leaching Analysis. HortScience 1997, 32, 669–673. [Google Scholar] [CrossRef]
  42. Goodwin, P.B.; Murphy, M.; Melville, P.; Yiasoumi, W. Efficiency of Water and Nutrient Use in Containerised Plants Irrigated by Overhead, Drip or Capillary Irrigation. Aust. J. Exp. Agric. 2003, 43, 189. [Google Scholar] [CrossRef]
  43. Rathier, T.M.; Frink, C.R. Nitrate in Runoff Water from Container Grown Juniper and Alberta Spruce Under Different Irrigation and N Fertilization Regimes. J. Environ. Hortic. 1989, 7, 32–35. [Google Scholar] [CrossRef]
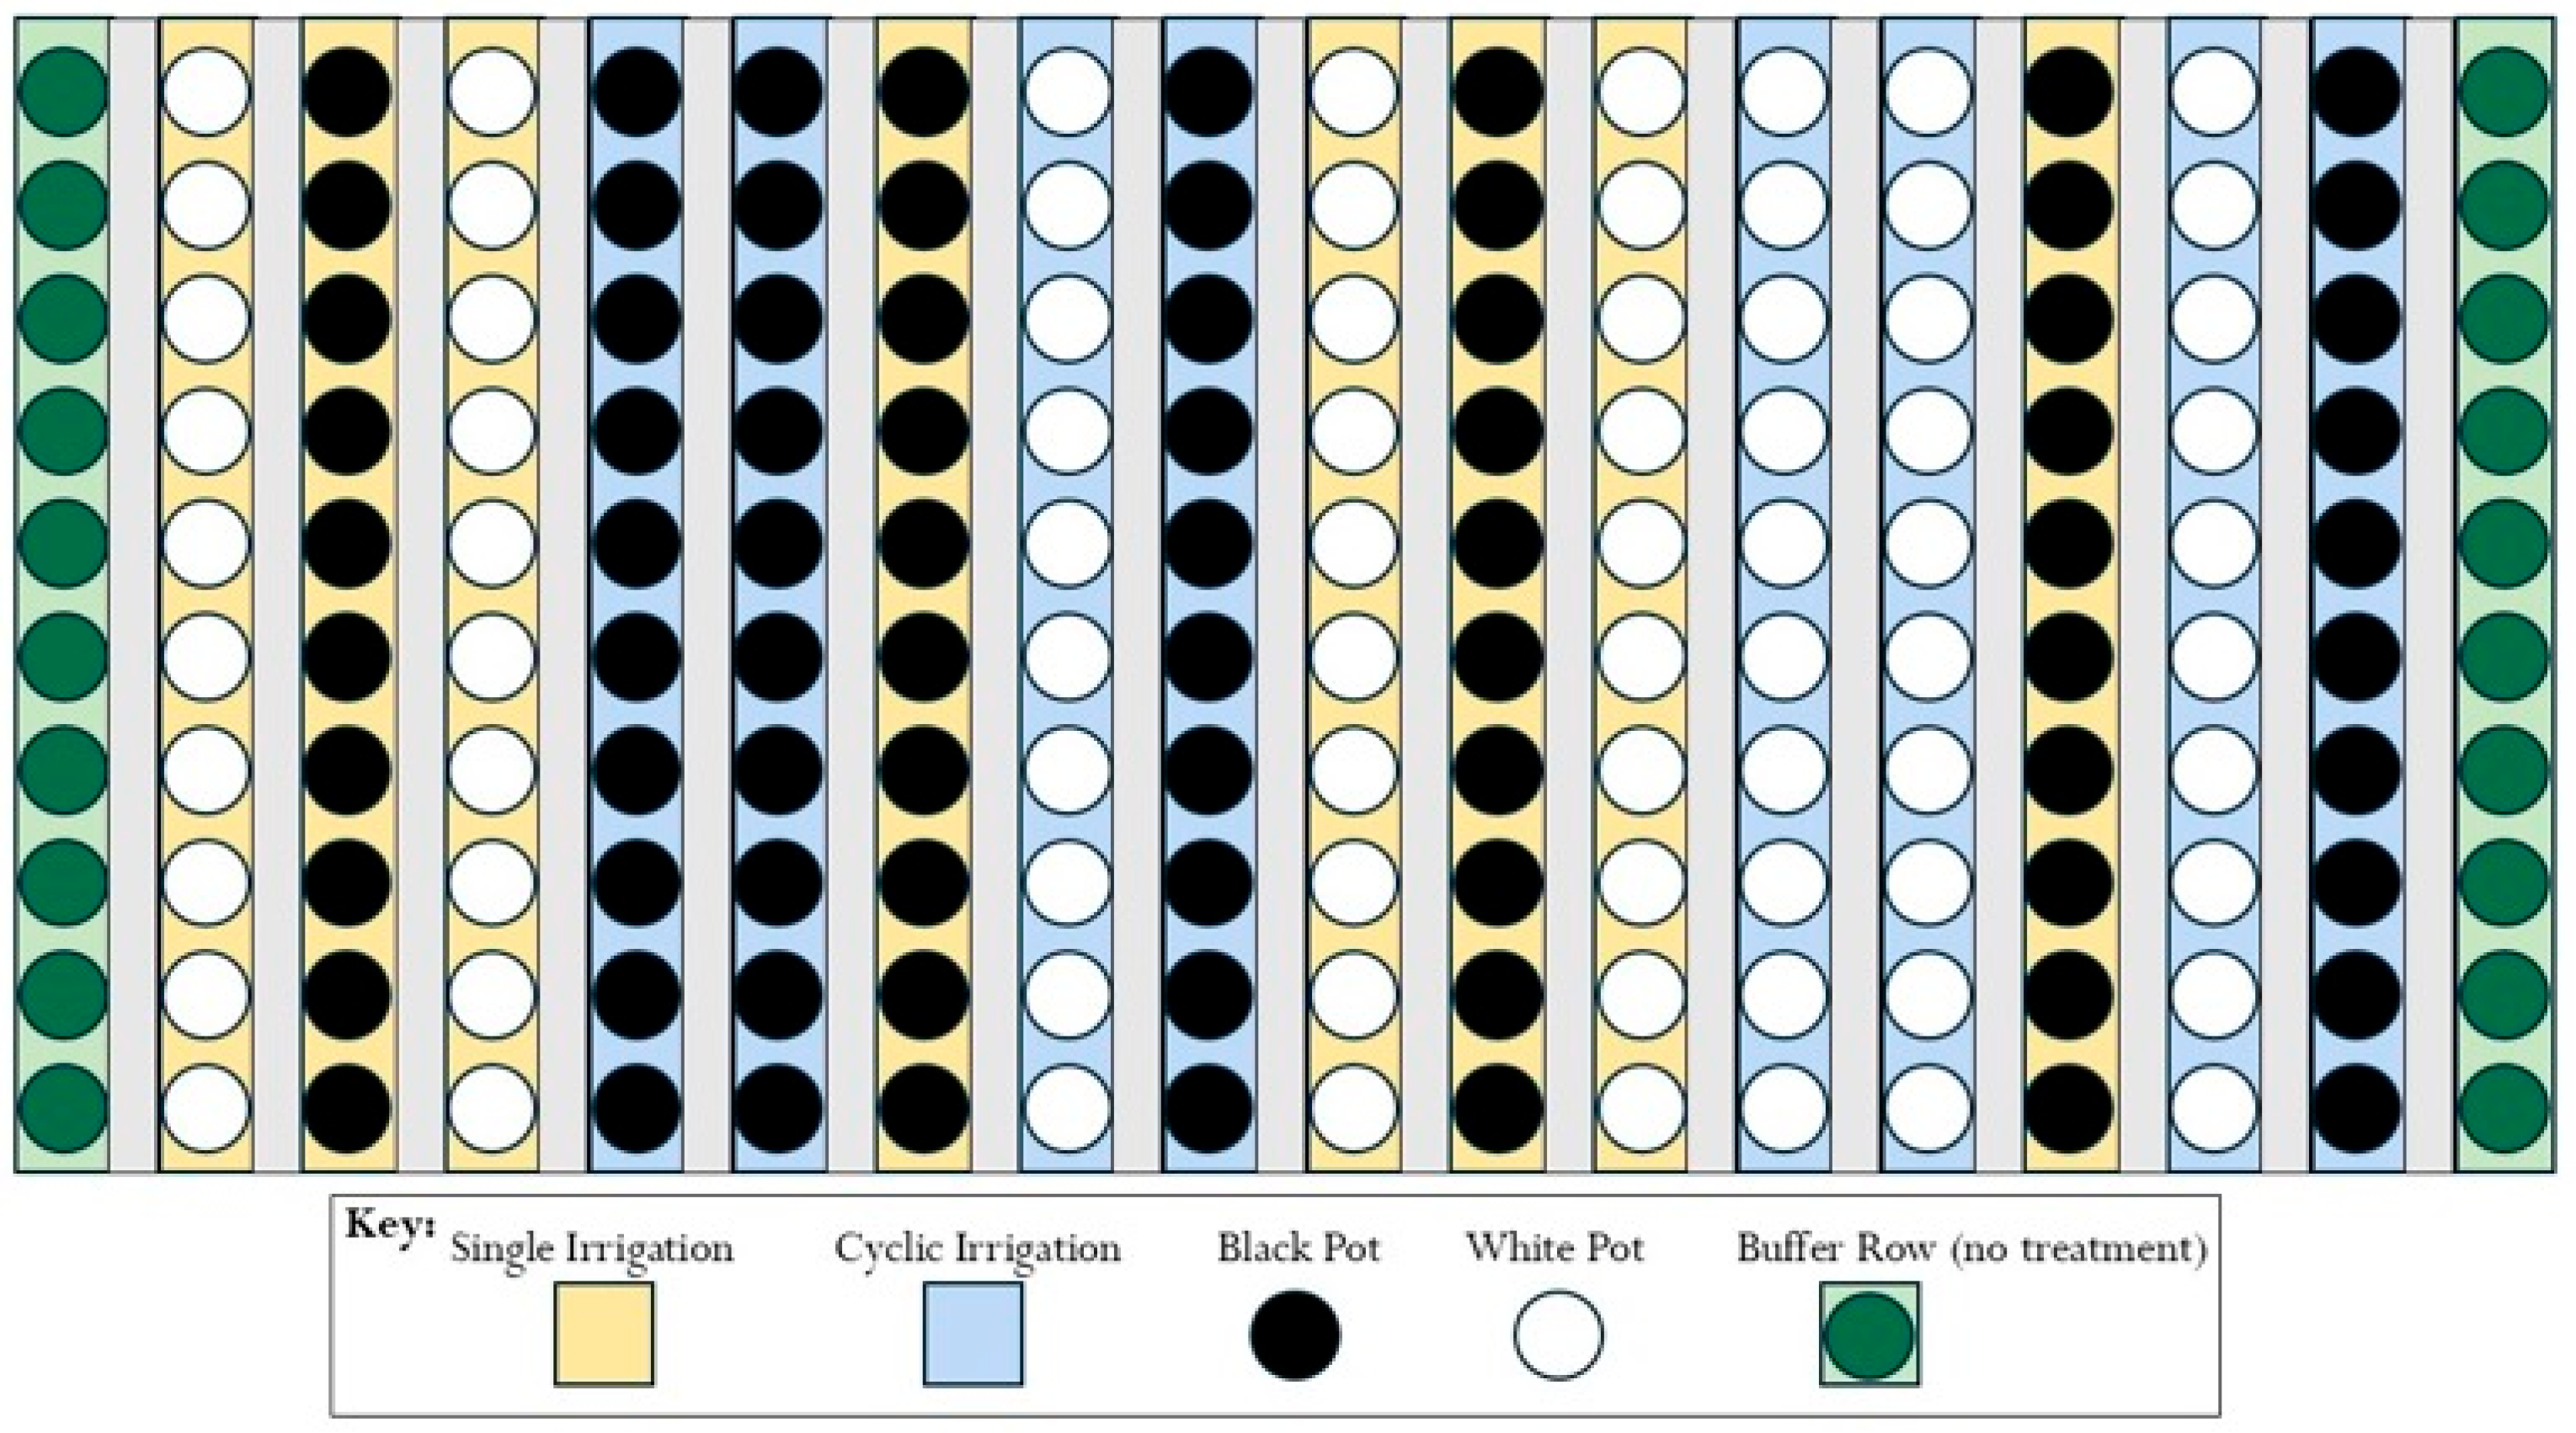
Figure 1. Experimental design illustration. A total of 180 Hydrangea paniculata ‘Limelight’ plants were grown in 11.4 L pots filled with a standard bark-based substrate. Half of the containers were black and half white. Pots were placed on a gravel-covered gutter leachate collection system consisting of 18 rows, with 16 experimental rows randomly assigned to pot color treatments (10 pots per row). Two irrigation regimes were applied: single irrigation (one event at 07:00 HR) and cyclic irrigation (three equal events at 08:00, 12:00, and 16:00 HR). Irrigation durations were adjusted midseason to maintain equivalent total water volumes.
Agriculture 15 02185 g001
Figure 2. Maximum daily substrate temperatures recorded from June through to September. The dashed line represents the daily maximum air temperature. Treatment groups include BS (black pot, single irrigation), WS (white pot, single irrigation), BC (black pot, cyclic irrigation), and WC (white pot, cyclic irrigation). Each symbol represents the mean of six temperature sensors per treatment (n = 6).
Agriculture 15 02185 g002
Figure 3. Substrate temperature in response to pot color and irrigation regime on two summer days, a week apart: (A) hot day (26 June 2022) and (B) cooler day (2 July 2022). Air temp is the dashed line, and the treatments are designated as BS (black pot, single irrigation), WS (white pot, single irrigation), BC (black pot, cyclic irrigation), and WC (white pot, cyclic irrigation).
Agriculture 15 02185 g003
Figure 4. Total nitrogen (top panel) and phosphorus (bottom panel) runoff from containerized plants under different treatments over the study period. Treatments include BS (black pot, single irrigation, black circles), WS (white pot, single irrigation, white circles), BC (black pot, cyclic irrigation, black triangles), and WC (white pot, cyclic irrigation, white triangles). Error bars represent the standard deviation.
Agriculture 15 02185 g004
Figure 5. Effect of pot color and irrigation regime on plant growth index (PGI). The box spans the interquartile range (IQR, 25th to 75th percentile), the line represents the median, and whiskers extend to data within 1.5 times the IQR. Points beyond the whiskers are outliers. There were no statistically significant effects of color, water, or their interaction on the plant growth index.
Agriculture 15 02185 g005
Table 1. Weather data (solar radiation, precipitation, air temperature, and relative humidity) were collected from a weather station 100 m from the experiment (Station identification ARAO, AgriMet Cooperative Agricultural Weather Network, U.S. Bureau of Reclamation) at the experimental site North Willamette Research and Extension Center in Aurora, Oregon (45.264167 N, 122.751111 W). in Aurora, Oregon.
MonthTotal Solar Radiation (kJ/m2)Total ET (cm)Total Precip. (cm)Mean
RH
(%)
Min Temp
(°C)
Mean Temp
(°C)
Max.
Temp (°C)
May597,27511.45549.550478.91 ± 8.407.27 ± 2.9712.20 ± 2.9617.48 ± 3.84
June636,66215.2410.388674.50 ± 16.1711.56 ± 2.7216.99 ± 3.8422.82 ± 5.43
July817,49720.39620.355666.71 ± 8.4014.24 ± 2.4921.67 ± 3.6429.80 ± 5.33
August502,78618.23720.025465.80 ± 7.4014.25 ± 2.2721.96 ± 2.2130.31 ± 3.64
September502,81511.96340.482667.08 ± 13.9311.88 ± 2.5018.99 ± 2.3626.69 ± 3.91
Table 2. Average accumulated hours (±standard deviation) above 25 °C, 30 °C, and 35 °C for each treatment including black pot single irrigation (BS), white pot single irrigation (WS), black pot cyclic irrigation (BC), and white pot cyclic irrigation (WC).
Treatment>25 °C (h)>30 °C (h)>35 °C (h)>38 °C (h)>45 °C (h)
BS974.90 ± 23.13610.60 ± 56.30286.11 ± 97.61154.5 ± 87.58.7 ± 14.1
WS771.72 ± 30.18343.40 ± 49.9389.24 ± 35.8621.8 ± 17.10 ± 0
BC927.89 ± 59.99523.85 ± 81.06178.96 ± 81.3673 ± 77.60.6 ± 1.6
WC769.76 ± 39.51333.57 ± 38.7873.35 ± 25.0412.3 ± 16.50 ± 0
Disclaimer/Publisher’s Note: The statements, opinions and data contained in all publications are solely those of the individual author(s) and contributor(s) and not of MDPI and/or the editor(s). MDPI and/or the editor(s) disclaim responsibility for any injury to people or property resulting from any ideas, methods, instructions or products referred to in the content.