Abstract
This study evaluates the pollution status, ecological risks, health risks, and sources of heavy metals from farmland in a mining city located in the Yangtze River basin, East China. A total of 2361 samples of topsoil were collected and analyzed for the concentration of five heavy metals and pH. The Nemerow index was used to assess integrated pollution, while absolute principal component scores-multiple linear regression (APCS-MLR) was used to identify the sources of heavy metals. The results revealed that, excluding Hg and Cr, the concentrations of Cd, As, and Pb in some samples exceeded intervention values, with Cd concentrations in 19.7% of samples surpassing this threshold. Based on the Nemerow index, 68.8% of sites were contaminated, with 27.4% classified as heavily polluted, indicating significant pollution in this area. Cd posed the primary ecological risk, with 19.8% of sites at high risk or above, also presenting carcinogenic risks to adults. Additionally, As exceeded safety thresholds for hazard quotient (HQ = 1) and carcinogenic risk (CR = 1 × 10⁻⁴). APCS-MLR revealed that heavy metals in farmland were mainly influenced by mining, agricultural activities, and natural soil-forming processes. This study offers insights into farmland heavy metal management and highlights industrial pollution sources in mining areas.
1. Introduction
In recent years, heavy metal contamination in farmland has become a great concern for human health, owing to its ecological risks and tendency to accumulate in the human body and other organisms [1,2]. Heavy metals, for example, cadmium (Cd), mercury (Hg), arsenic (As), lead (Pb), and chromium (Cr), are classified by the US Environmental Protection Agency (EPA) as priority toxic pollutants and given attention in technical guidelines for classification of environmental quality of cultivated soil in China [3,4]. Even at low concentrations, these pollutants pose significant threats to food security and ecosystem stability due to the persistent accumulation of heavy metals [3], which are irreversibly transported into farmland soil, compromising soil fertility, crop yields, and quality [5,6]. Therefore, it is necessary to classify the pollution status of heavy metals and assess potential ecological risks for agricultural environments.
Moreover, agricultural practices can also expose humans to potential health risks through multiple exposure pathways, such as inhalation of soil particles, dermal contact with contaminants, etc. [7]. Due to variations in age and physical condition among individuals, as well as differences in toxicity related to metabolic processes and disease mechanisms, different groups of people exposed to heavy metals may experience varied health risks [8]. For example, infants may be exposed to As primarily through their dietary intake, as certain rice-based foods for infants often contain elevated levels of As [9]. Parents and caregivers typically take measures to minimize this exposure by making careful choices about their child’s diet, aiming to reduce potential health risks associated with arsenic exposure in infants. Similarly, Cd is widely recognized as a significant environmental pollutant, as it tends to accumulate in crops due to its high bioaccessibility and is consequently present in various agricultural products [10]. However, few studies have reported intensive sampling investigations at the regional scale in the middle reaches of the Yangtze River basin and their associated health risks have been reported [11,12,13].
To reduce the human health risks and clarify the pollution sources of heavy metals, source identification is an essential work for distinguishing between natural and anthropogenic activities sources of pollution [14]. Natural sources primarily involve the weathering of parent materials and the decomposition of litter biomass, which naturally flow into the soil [15,16]. Anthropogenic activities include industrial pollutants, traffic emissions, mining, domestic wastes, and agricultural activities [17,18]. Especially for the current study area, it has been a typical mining base for copper, iron, sulfur, and gold, located in the middle reaches of the Yangtze River basin. It is highly likely that both natural and anthropogenic activities have contributed to heavy metal pollution in some farmland. Thus, conducting intensive sampling investigations is of great value for ensuring the safety of local agricultural products and protecting the health of local residents.
Risk assessment and source apportionment can uncover the potential for soil contamination and the likelihood of ecological function impairment due to the presence of relevant heavy metals. The objectives of this article are to (1) quantify the concentrations and contamination status of five heavy metals, (2) estimate the potential ecological risks and health risks of adult residents, and (3) analyze the pollution sources of heavy metals in the farmland of mining area. The results of this study could assist the local residents in understanding the pollution levels of heavy metals in farmland. They could then adjust the structure of agricultural planting to reduce the cropping of edible plants in the heavily polluted areas or decreases the toxic impacts of heavy metals in various ways.
2. Materials and Methods
2.1. Sampling Collection
The study area covers more than 4330 hectares of arable land, including six townships, and is considered as a production area for crops and vegetables, which principally include planted rice, wheat, and maize (Figure 1). The farmland soil types in the area are mainly paddy soil and brown-red soil (ferralosols). The region enjoys a temperate climate, featuring a consistent annual temperature of 16 °C, mean relative humidity oscillating between 75 and 80% during the hydrological year, cumulative annual solar insolation reaching 114.8 kJ cm−2, and a frost-free season spanning approximately 230 days [13]. A total of 2361 samples of topsoil (0−20 cm) were collected using bamboo shovels from June to October in 2023. A random sampling method was employed based on the grid distribution of polluted farmland and its surrounding areas, with a sampling density of 1 sample per 2 hm2. Each sample comprised approximately 2 kg of fresh soil, gathered from five topsoil cores taken at the center, as well as four additional points located towards the north, east, south, and west.
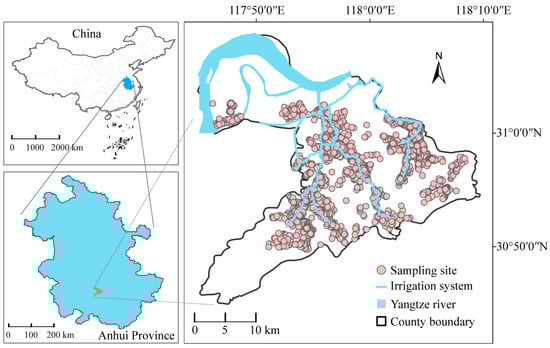
Figure 1.
Location map of the investigation area and sampling sites.
2.2. Sample Analysis
Topsoil specimens (0−20 cm depth) were air-dried under ambient laboratory conditions (25 ± 2 °C, 45 ± 5% RH) following field collection. Dried samples were disaggregated using a porcelain mortar and pestle, then sequentially sieved through 2.0 mm (for pH determination) and 0.15 mm (for heavy metal analysis) sieves. Soil pH was determined in triplicate using a glass electrode with a 1:2.5 soil-to-deionized water suspension. The concentrations of five heavy metals specified in the latest technical guidelines for classification of environmental quality of cultivated soil in China were measured according to the reported methods [19]: A 0.500 g soil was accurately weighed into a 200 mL polytetrafluoroethylene tube, with a 50 mL acid mixture (HNO3:HF:HClO4 = 10:5:2, v:v:v). Samples underwent stepwise temperature programming: 110 °C for 30 min, 140 °C for 30 min, and finally at 180 °C until complete sample clarification using a microwave digestion system. Finally, samples were extracted by 2 mL HNO3, cooled to <40 °C and diluted to 25 mL with deionized water. Heavy metal concentrations (Cd, Hg, As, Pb, Cr) were quantified using ICP-MS (NexlON 1000, PerkinElmer, Waltham, MA, USA). Rigorous quality assurance protocols were established, incorporating reagent blank analysis and certified reference material (CRM GBW 07430) testing in each digestion batch. This framework achieved the relative standard deviations within 5% and the recovery percentages less than 10%. Method detection limits (mg kg−1) were: of Cd (0.07), Hg (0.002), As (0.6), Pb (2), and Cr (4).
2.3. Assessment of Pollution Indices
The single-factor pollution index (Pi) evaluates heavy metal pollution levels in agricultural soils [20], calculated as
where Ci represents the measured concentration of metal i and C0 denotes its corresponding risk screening values in farmland soil [21].
The Nemerow integrated pollution index (PN) was employed to evaluate the comprehensive pollution status of agricultural soils in this study. The PN is calculated as:
where Pimax is the maximum single-factor pollution index (Pi) among all evaluated heavy metals, and Piave represents their average value. Classification thresholds for both Pi and PN follow established criteria from previous studies in Table S1 [20,22], and corresponding site-specific classification results shown in Table S2.
2.4. Potential Ecological Risk
To ascertain the potential hazards posed by a heavy metal element based on its toxicological profile and concentration, the potential ecological risk index (RI) would reflect more information on the potential environmental toxicology [23]. The RI calculation formula is as follows:
where Pi is the single-factor pollution index, and is the toxicity coefficient of the ith heavy metal, indicating the degree of toxic response of each heavy metal to organisms. The toxicity coefficients for Cd, Hg, As, Pb, and Cr in this study are 30, 40, 10, 5, and 2, respectively [23]. Er is the potential ecological risk index for a heavy metal element, while RI is the potential ecological risk index for all heavy metals. Er and RI are classified in Table S3 and shown in Table S4 [8].
2.5. Health Risk Assessment Model
The model developed by the US EPA at health risk assessment serves as a crucial tool for evaluating both carcinogenic and non-carcinogenic impacts upon human exposure to heavy metals. Considering that farmland generally constitutes the main activity space for adults, especially for farmers in southern regions who work there throughout the year, the study aimed to assess the exposure risk of adults by applying relatively strict standards. It would be discerned from given scenarios that humans encounter hazardous contaminants primarily via triadic channels, which can be identified as: ingestion (ing), inhalation (inh), and dermal contact (der). According to estimations derived from the Exposure Factors Handbook [3], computation of average daily intake (ADI) was undertaken deploying the following formulations:
Ingestion:
Inhalation:
Dermal contact:
where C is the concentration of metallic contaminant, and the remaining exposure parameters (IRing, IRinh, EF, ED, SA, AF, ABS, BW, PEF and AT) of the description and values are shown in Table S5.
The non-carcinogenic risk index (HI) and the carcinogenic risk index (CR) are calculated using the following formulae [24]:
where HQ is the hazard quotient, RfD is the reference dose of noncarcinogenic average daily, and SF is the slope factor. The specific values of RfD and SF are shown in Table S6. The HI aggregates cumulative non-carcinogenic risks across all exposure pathways for five target heavy metals. If HQ, or HI > 1, there is a certain non-carcinogenic risk to the human, but the health risk is insignificant when the value is less than one. For carcinogenic risk, CR calculates the carcinogenic risk of a single heavy metal across all exposure routes, and TCR aggregates the total carcinogenic risk for multiple heavy metals across all exposure routes. CR values below 1 × 10⁻⁴ denote risks within tolerable level, while CR values below 1 × 10⁻⁶ represent acceptable risk levels.
2.6. APCS-MLR Model
The absolute principal component scores-multiple linear regression (APCS-MLR) model is employed for the source identification of heavy metals. This model operates under the assumption that a linear relationship exists between the concentration levels of contaminants and the contribution rates from these multiple sources [25]. In the methodology of computations, standardization of heavy metal concentrations through application of the Z-score technique constitutes the preliminary phase. Next, principal components undergo extraction to ascertain scores attributable to each cardinal factor. These scores are then paired with the standardized Z0 values to compute corresponding coefficients ascribed to factor scores. Finally, by regressing the standardized element data on the APCS, we arrive at an overall estimation of the coefficients. These coefficients facilitate the translation of the APCS into a series of contributions attributed to each source for each sample. Thus, they are calculated using the following equations:
where Zij, representing a dimensionless metric, is the normalized valuation of concentration, Cij is the concentration of heavy metal i, is the average concentration of heavy metal i, σi is the standard deviation of heavy metal i, a0i is the multivariate linear regression of heavy metal i, APCSp is the adjusted p score, api is the regression coefficient that elucidates the relation of source p with heavy metal i, APCSp × api represents the influence which emanates from source p to Mi, and Σ(APCSp×api) represents an exposition of the mean absolute value concerning such contribution.
3. Results and Discussion
3.1. Description and Pollution Indices of Heavy Metals
Soil pH is one of the paramount factors related to the behavior of heavy metals in soils, with higher pH generally reducing heavy-metal mobility [22]. In this area, the average soil pH was 6.30, with a low coefficient of variation (CV = 13.7%, Table 1), indicating weakly acidic soils and pH uniformity, facilitating source appointment analysis [26]. The concentrations of Cd, Hg, As, and Pb were 1.93 ± 5.71 mg kg−1, 0.13 ± 0.06 mg kg−1, 27.9 ± 67.5 mg kg−1, and 96.7 ± 111.9 mg kg−1, respectively, exceeding background values by 0.097 mg kg−1, 0.033 mg kg−1, 9 mg kg−1, and 26.6 mg kg−1, except for Cr (43.5 mg kg−1 vs. 66.5 mg kg−1). Among the five heavy metals in farmland soils, Pb exhibited the highest average concentration (96.7 ± 111.9 mg kg−1), followed by Cr (43.5 ± 14.7 mg kg−1) As (27.9 ± 67.5 mg kg−1) Cd (1.93 ± 5.71 mg kg−1), and Hg (0.13 ± 0.06 mg kg−1). Provincial soil background values were exceeded for five heavy metals at some sampling sites, with Hg concentrations, in particular, exhibiting complete exceedance (100%). Compared with the screening values in GB 15618–2018 [21], exceedance rates of Cd, Pb, As, and Hg were 77.30%, 23.10%, 29.8% and 0.04, respectively, but there was no exceedance for Cr. Further comparison with the intervention values showed that 19.7% of Cd, 1.61% of As, and 1.23% of Pb concentrations exceeded them. Our data was fundamentally consistent with the research results in 2016 indicating severe Cd and As pollution [13]. The CV values of Cd (296%), As (242%) and Pb (116%) exceeded 100%, while those of Hg and Cr were 46.2% and 33.9%, respectively. The results for Cd, As and Pb indicated extremely uneven distribution and large spatial differences in the study area, likely influenced by human activities [27].

Table 1.
Statistical data for heavy metals in farmland topsoil (mg kg−1).
Pi and PN were introduced to assess the heavy-metal pollution levels in farmland soils. The average Pi of Cd was 4.79, exceeding those of the other four heavy metals (Hg, As, Pb, and Cr), which ranged from 0.18 to 0.97 (Figure 2). Nearly half of the Cd samples were at the level of high contamination (Table S2), similar to the farmland findings in Jiedong District, Guangdong [28]. As and Pb showed low contamination (grade 2) in 17.8% and 20.4% of the samples, respectively, with few samples at moderate and high contamination levels. For Hg, only 0.04% of the samples had Pi > 1.0 (grade 2), and all Pi values of Cr in farmland topsoils were < 1. The average PN across all samples was 3.61, indicating some level of heavy metal pollution in the soil. Specifically, 27.4% of soils were heavily polluted, 12.2% moderately, and 29.2% lightly. The farmland with heavier integrated pollution was mainly concentrated in the central and eastern regions of this area. Therefore, it was concluded that the soil in our survey area suffered from pollution by heavy metals, particularly Cd, which required urgent attention.
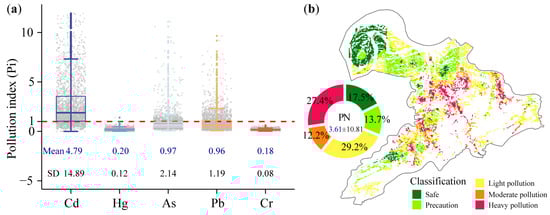
Figure 2.
Pollution index (Pi, (a)) and Nemerow integrated pollution index (PN, (b)) of heavy metals in farmland topsoil.
3.2. Potential Ecological Risk Assessment
In this study, the potential ecological risk of heavy metals in farmland soils was calculated by combining the risk screening values and toxicity coefficients. The results showed that Cd was the most crucial element influencing potential ecological risks and should be prioritized, followed by As, Pb, and Hg (Figure 3). This priority ranking aligns with findings from industrializing agricultural soils in Handan [29] and Turkish farmlands with severe Cd ecological risk [30]. For Cr, ecological risk values were <40, suggesting low or negligible ecological risk in the farmland soils. Ecological risk results also indicated that the impact of heavy metals on ecology was not correlated with their absolute concentrations. Regarding RI, 73.82% of samples were at low risk, 16.65% at moderate risk, 6.27% at considerable risk, and 3.26% at high potential ecological risk (Table S4). Overall, most sampling sites faced moderate to very high risks mainly from Cd, which should be a priority control contaminant. These findings implied that Cd accumulation in the agriculture soil of ming area posed a higher potential ecological risk than other heavy metals, aligning with previous studies in the middle Fenhe River basin and Shanxi Province [31,32]. In a comprehensive investigation, consisting of extensive topsoil sample accumulation exceeding 38,000 from across the nation between April 2005 and December 2013, analogous outcomes were documented [3].
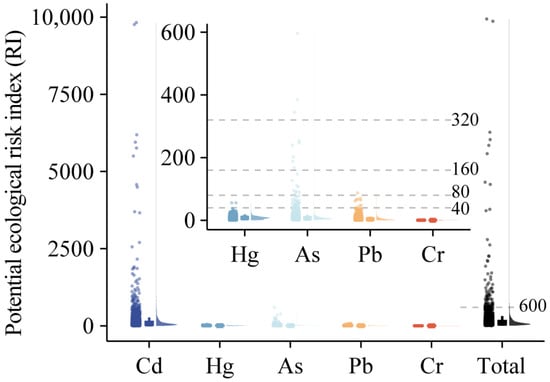
Figure 3.
Potential ecological risk index of heavy metals in farmland topsoil.
3.3. Health Risk Assessment for Humans
Given that agricultural activities predominantly involve adults, this study focused on assessing the carcinogenic and non-carcinogenic risks of adults exposed to farmland soils. As shown in Figure 4, the health risk assessment revealed that the HQ for As and carcinogenic CR for As and Cd exceeded established thresholds (HQ = 1, CR = 1 × 10⁻⁴) at multiple sampling sites. Specifically, the HI for As exceeded the threshold at 1.19% of sampling sites (n = 28/2361), while the CR for As and Cd surpassed the threshold at 0.59% and 1.95% of sites, respectively. These findings indicated the non-negligible carcinogenic and non-carcinogenic risks associated with heavy metal exposure in agricultural settings. Demonstrated through antecedent analyses is that prolonged exposure of the human corporeal form to diminished concentrations of As, evident are toxicological manifestations which compel occurrences such as oncogenesis and malformations [9]. Exposure to Cd in humans can lead to the development of lung cancer, kidney dysfunction, and hypertension [33]. Therefore, the health risks to humans across the entire region caused by As and Cd cannot be ignored.
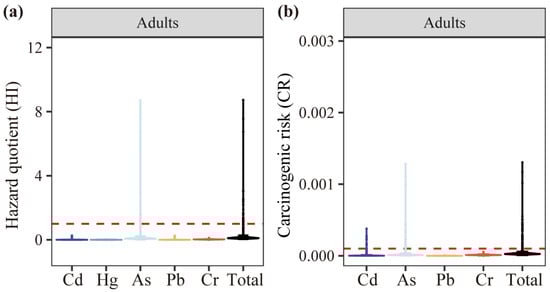
Figure 4.
HI (a) and CR (b) for adults following exposure to heavy metals.
3.4. Sources Identification of Heavy Metals
To explore the pollution sources of heavy metals in contaminated farmland, the APCS-MLR model was applied to identify the sources of the five heavy metals and determine their respective contributions. Four factors were extracted from the five heavy metals due to their eigenvalue exceeding 1.00, which explained 80.4% of the total variance in heavy metal concentrations across farmland along the river (Table S7). PC1, PC2, PC3, and PC4 explained 20.1%, 20.1%, 20.1%, and 20.0% of the variance, respectively. Consequently, the first four principal components were selected for further analysis. The R2 values of all models were greater than 0.96, except for Pb, indicating higher accuracy and reliable results (Table S8) [17]. The ratios between the estimated values and observed values (E/O) for Cr, Hg, As, and Cd ranged from 1.00 to 1.50, whereas that for Pb was 1.74. These results indicated uncertainty in predicting Pb sources, yet they indicate acceptable accuracy of the APCS-MLR model for the other heavy metals [34]. Additionally, soil pH displayed positive correlations with Cr, and Cr was positively correlated with Hg and As (Table S9). Meanwhile, the concentrations of Hg, Cd, As and Pb were extremely significantly positively correlated with each other. Our findings revealed that soil pH had a minor impact on heavy metal content, though it would significantly influence the mobility of heavy metal cations. Specifically, with declining pH, heavy metal cations are more active and mobile [35]. Conversely, organic matter and clay minerals reduce heavy metal bioavailability by forming stable metal–organic complexes and immobilize heavy metals from soil solutions as adsorbents, respectively [1].
In Figure 5 and Table S8, PC1 had the highest loadings of Hg accounting for 90.9%, followed by Pb (38.8%), As (27.3%), Cd (16.7%), and Cr (1.5%). The concentration of Hg was notably higher than the background value (0.13 vs. 0.033 mg kg−1), with Pb, As, and Cd also mostly surpassing the background value. However, only one sample of Hg concentration had a low contamination level. Reports have elucidated, we can infer from records within China that Hg emissions arise mainly thus: through non-ferrous metal smelting contributes approximately 45%,coal combustion accounts for about 38%,while the remainder of 17% is attributable to various other undertakings [36]. Field investigation showed that historically, wastewater from factories involved in heavy metals and other enterprises was discharged into the irrigation canal [26,37]. Therefore, PC1 appears related to industrial irrigation inputs. PC2 was mainly associated with Cd, contributing of 53.4%, followed by As and Pb. Combined with the higher coefficient of variation, it implied that human activities influenced the PC2 in the study. In addition, heavy metal enterprises and tailings ponds are widely distributed in Cd-polluted areas of farmland [12]. Processes encompassing mining, as well as those involved in both metallurgical smelting and refining, have the propensity to engender Cd emissions into air, water, and soil substrates [29]. From this observation, PC2 was similarly controlled by mining smelting.
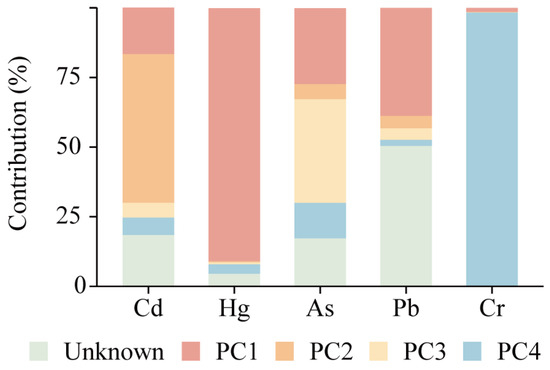
Figure 5.
Source contribution ratios of heavy metals in the contaminated farmland topsoil.
PC3 exhibited a relatively high proportion of 37.2% for As. This study found that As concentrations exceeded the screening value at 23.1% of sampling sites and the intervention value at 1.61% of sites, particularly in regions with intensive agricultural activities and enterprises involved in heavy metals. Arsenic-containing products were once commonly used in feed and medicine [38] and frequently employed for plant growth promotion, disease control, and pest management [39]. Moreover, industrial wastes discharged into farmland can induce soil As contamination [30]. Thus, the combined impacts of agricultural activities and surrounding factories contributed to As presence. In summary, it is likely that PC3 is attributed to anthropogenic contributions, such as agricultural and industrial practices. For PC4, the contribution of Cr (98.1%) was higher than that of the other four heavy metals. There was no sample exceeding the risk screening value, and the majority of samples fell below the background value (66.5 mg kg−1), with the smallest coefficient (Table 1). Our results were consistent with those of a nationwide study conducted in China, which similarly reported that Cr was the least polluted heavy metal across all cities [40]. Additionally, many regional studies in China and other countries considered Cr as an indicator influenced by natural sources [41]. PC4 is likely to be minimally affected by humans activities and instead associated with the weathering of parent rocks and subsequent soil processes [42,43]. Thus, it is more appropriate to attribute PC4 to natural soil-forming processes.
4. Conclusions
In this study, topsoil samples from farmland of mining area were investigated to study the pollution status, human health risk, and pollution source of five heavy metals. The concentrations of three heavy metals (Cd, As and Pb) were mainly higher than those of the screening value, except for Cr and Hg. A substantial 77.3% of the samples exhibited Cd contamination, while 66.7% of the samples posed a moderate or higher potential ecological risk to the soil ecosystem, with As and Pb following in terms of risk severity. The carcinogenic and non-carcinogenic health risks associated with As and Cd in the study region cannot be neglected for humans. The pollution sources of heavy metals in farmland soil were inferred, mainly including mining and smelting, agricultural activities, and natural sources. Therefore, it is essential to implement robust protective measures in mining districts, such as clearing up historical waste slag and minimizing the inputs of agricultural production materials containing heavy metals into farmland. Local residents are advised to improve their awareness of protective measures regarding personal health, particularly for farmers. Further studies are anticipated to provide the foundation for ecological environment control in farmland along the river and surrounding mine areas.
Supplementary Materials
The following supporting information can be downloaded at https://www.mdpi.com/article/10.3390/agriculture15212181/s1, Table S1: The classification of the single pollution index (Pi) and the Nemerow integrated pollution index (PN); Table S2: The proportion of pollution grade of heavy metals in farmland topsoil; Table S3: The classification of the potential ecological risk index for a heavy metal (Er) and the potential ecological risk index for all heavy metals (RI); Table S4: Potential ecological risk of heavy metals in farmland topsoil; Table S5: The parameters for health risk evaluation of heavy metal exposure in adults; Table S6: Values of the reference dose (mg kg−1-day) and the slope factor (per mg kg−1-day) for five heavy metals; Table S7: Rotation matrix for factor analysis of heavy metals; Table S8: Source contributions of heavy metals based on the APCS-MLR model; Table S9: Relationship among soil pH and heavy metals.
Author Contributions
X.S. analyzed the data and wrote the original draft. B.W. conducted the experiments. Z.L. conceived the study and supervised the project. All authors contributed to the discussion and writing of the manuscript. All authors have read and agreed to the published version of the manuscript.
Funding
This research received no external funding.
Institutional Review Board Statement
Not applicable.
Data Availability Statement
The data presented in this study are available upon request from the corresponding authors.
Acknowledgments
We thank Feng Jing (College of Advanced Agricultural Sciences, Zhejiang A&F University) for technical guidance and Nisar Hussain (Department of Production Technology, Kunming 24Hua Modern Agricultural Technology, Kunming, China) for the linguistic modification.
Conflicts of Interest
The authors declare no conflicts of interest. The funders had no role in the design of the study; in the collection, analyses, or interpretation of data; in the writing of the manuscript; or in the decision to publish the results.
Abbreviations
The following abbreviations are used in this manuscript:
| APCS–MLR | Absolute principal component scores–multiple linear regression |
| Pi | Pollution index |
| RI | Potential ecological risk index |
| ADI | Average daily intake |
| HI | Non-carcinogenic risk index |
| CR | Carcinogenic risk index |
References
- Wu, F.; Zhu, D.; Yang, T.; Mao, C.; Huang, W.; Zhou, S.; Yang, Y. Soil heavy metal accumulation and ecological risk in mount wuyi: Impacts of vegetation types and pollution sources. Land 2025, 14, 712. [Google Scholar] [CrossRef]
- Liu, T.; Ni, S.Y.; Wang, Z. Contamination and health risk assessment of heavy metals in soil surrounding an automobile industry factory in Jiaxing, China. Front. Environ. Sci. 2024, 12, 1362366. [Google Scholar] [CrossRef]
- US EPA. Exposure Factors Handbook, Volume 1: General Factors; U.S. Environmental Protection Agency: Washington, DC, USA, 1997. [Google Scholar]
- NY/T 4608-2025; Technical Guidelines for Classification of Environmental Quality of Cultivated Soil. Ministry of Agriculture and Rural Affairs of the People’s Republic of China: Beijing, China, 2025.
- Singh, S.; Maiti, S.K.; Raj, D. An approach to quantify heavy metals and their source apportionment in coal mine soil: A study through PMF model. Environ. Monit. Assess. 2023, 195, 306. [Google Scholar] [CrossRef]
- Yadav, M.; Gupta, P.; Seth, C.S. Foliar application of α-lipoic acid attenuates cadmium toxicity on photosynthetic pigments and nitrogen metabolism in Solanum lycopersicum L. Acta Physiol. Plant. 2022, 44, 112. [Google Scholar] [CrossRef]
- Meng, F.; Liu, D.; Bu, T.; Zhang, M.; Peng, J.; Ma, J. Assessment of pollution and health risks from exposure to heavy metals in soil, wheat grains, drinking water, and atmospheric particulate matter. J. Environ. Manag. 2025, 376, 124448. [Google Scholar] [CrossRef] [PubMed]
- Liu, Z.; Du, Q.; Guan, Q.; Luo, H.; Shan, Y.; Shao, W. A Monte Carlo simulation-based health risk assessment of heavy metals in soils of an oasis agricultural region in northwest China. Sci. Total Environ. 2023, 857, 159543. [Google Scholar] [CrossRef]
- Jallad, K.N. The Hazards of a Ubiquitary Metalloid, Arsenic, Hiding in Infant Diets: Detection, Speciation, Exposure, and Risk Assessment. Biol. Trace Elem. Res. 2019, 190, 11–23. [Google Scholar] [CrossRef] [PubMed]
- Qin, S.; Zhang, H.; He, Y.; Chen, Z.; Yao, L.; Han, H. Improving radish phosphorus utilization efficiency and inhibiting Cd and Pb uptake by using heavy metal-immobilizing and phosphate-solubilizing bacteria. Sci. Total Environ. 2023, 868, 161685. [Google Scholar] [CrossRef]
- Sun, Y.; Liu, D.; Wu, Y.; He, X.; Luo, Y.; Zhou, X.; Chen, W.; Chen, W.; Li, S. Updated spatial distribution and health risk assessment of heavy metals in soils of the Yangtze River Basin, China. Front. Environ. Sci. 2023, 11, 1197634. [Google Scholar] [CrossRef]
- Zhao, K.; Hu, R.; Wan, X.; Zhou, B.; Wang, Y. Heavy metal spatial distribution, sources and ecological risks in farmland soils from three areas in the Yangtze River basin in Anhui. Arab J. Geosci. 2022, 15, 1154. [Google Scholar] [CrossRef]
- Shen, Z.; Xu, D.; Li, L.; Wang, J.; Shi, X. Ecological and health risks of heavy metal on farmland soils of mining areas around Tongling City, Anhui, China. Environ. Sci. Pollut. Res. Int. 2019, 26, 15698–15709. [Google Scholar] [CrossRef]
- Adnan, M.; Zhao, P.; Xiao, B.; Ali, M.U.; Xiao, P. Heavy metal pollution and source analysis of soils around abandoned Pb/Zn smelting sites: Environmentalrisks and fractionation analysis. Environ. Technol. Innov. 2025, 38, 104084. [Google Scholar] [CrossRef]
- Liu, Y.; Chen, Z.; Xiao, T.; Zhu, Z.; Jia, S.; Sun, J.; Ning, Z.; Gao, T.; Liu, C. Enrichment and environmental availability of cadmium in agricultural soils developed on Cd-rich black shale in southwestern China. Environ. Sci. Pollut. Res. 2022, 29, 36243–36254. [Google Scholar] [CrossRef] [PubMed]
- Wu, W.; Qu, S.; Nel, W.; Ji, J. The influence of natural weathering on the behavior of heavy metals in small basaltic watersheds: A comparative study from different regions in China. Chemosphere 2021, 262, 127897. [Google Scholar] [CrossRef] [PubMed]
- Zhang, H.; Zhang, F.; Song, J.; Tan, M.L.; Kung, H.-T.; Johnson, V.C. Pollutant source, ecological and human health risks assessment of heavy metals in soils from coal mining areas in Xinjiang, China. Environ. Res. 2021, 202, 111702. [Google Scholar] [CrossRef]
- Abdelgawad, Z.A.; Abd El-Wahed, M.N.; Ahmed, A.A.; Madbouly, S.M.; El-Sayyad, G.S.; Khalafallah, A.A. Assessment of heavy metal accumulation and health risk in three essential edible weeds grown on wastewater irrigated soil. Sci. Rep. 2023, 13, 21768. [Google Scholar] [CrossRef]
- Liu, B.; Ma, X.; Ai, S.; Zhu, S.; Zhang, W.; Zhang, Y. Spatial distribution and source identification of heavy metals in soils under different land uses in a sewage irrigation region, northwest China. J. Soil Sediment 2016, 16, 1547–1556. [Google Scholar] [CrossRef]
- Yang, L.; Ren, Q.; Zheng, K.; Jiao, Z.; Ruan, X.; Wang, Y. Migration of heavy metals in the soil-grape system and potential health risk assessment. Sci. Total Environ. 2022, 806 Pt 2, 150646. [Google Scholar] [CrossRef]
- GB15618-2018; Soil Environmental Quality Risk Control Standard for Soil Contamination of Agricultural Land. Ministry of Ecology and Environment of the People’s Republic of China: Beijing, China, 2018.
- Deng, Y.; Jiang, L.; Xu, L.; Hao, X.; Zhang, S.; Xu, M.; Zhu, P.; Fu, S.; Liang, Y.; Yin, H.; et al. Spatial distribution and risk assessment of heavy metals in contaminated paddy fields—A case study in Xiangtan City, southern China. Ecotoxicol. Environ. Saf. 2019, 171, 281–289. [Google Scholar] [CrossRef]
- Hakanson, L. An ecological risk index for aquatic pollution control. a sedimentological approach. Water Res. 1980, 14, 975–1001. [Google Scholar] [CrossRef]
- Miletić, A.; Lučić, M.; Onjia, A. Exposure factors in health risk assessment of heavy metal(loid)s in soil and sediment. Metals 2023, 13, 1266. [Google Scholar] [CrossRef]
- Thurston, G.D.; Spengler, J.D. A quantitative assessment of source contributions to inhalable particulate matter pollution in metropolitan Boston. Atmos. Environ. 1985, 19, 9–25. [Google Scholar] [CrossRef]
- Zhang, Y.; Wang, S.; Gao, Z.; Zhang, H.; Zhu, Z.; Jiang, B.; Liu, J.; Dong, H. Contamination characteristics, source analysis and health risk assessment of heavy metals in the soil in Shi River Basin in China based on high density sampling. Ecotoxicol. Environ. Saf. 2021, 227, 112926. [Google Scholar] [CrossRef]
- Yan, D.; Bai, Z.; Liu, X. Heavy-Metal Pollution Characteristics and Influencing Factors in Agricultural Soils: Evidence from Shuozhou City, Shanxi Province, China. Sustainability 2020, 12, 1907. [Google Scholar] [CrossRef]
- Jiang, H.-H.; Cai, L.M.; Wen, H.-H.; Hu, G.C.; Chen, L.G.; Luo, J. An integrated approach to quantifying ecological and human health risks from different sources of soil heavy metals. Sci. Total Environ. 2020, 701, 134466. [Google Scholar] [CrossRef]
- Hu, Y.; He, K.; Sun, Z.; Chen, G.; Cheng, H. Quantitative source apportionment of heavy metal(loid)s in the agricultural soils of an industrializing region and associated model uncertainty. J. Hazard. Mater. 2020, 391, 122244. [Google Scholar]
- Varol, M.; Gunduz, K.; Sunbul, M.R. Pollution status, potential sources and health risk assessment of arsenic and trace metals in agricultural soils: A case study in Malatya province, Turkey. Environ. Res. 2021, 202, 111806. [Google Scholar] [CrossRef]
- Liu, M.; Han, Z.; Yang, Y. Accumulation, temporal variation, source apportionment and risk assessment of heavy metals in agricultural soils from the middle reaches of Fenhe River basin, North China. RSC Adv. 2019, 9, 21893–21902. [Google Scholar] [CrossRef]
- Qi, H.; Zhao, B.; Li, L.; Chen, X.; An, J.; Liu, X. Heavy metal contamination and ecological risk assessment of the agricultural soil in Shanxi Province, China. R. Soc. Open Sci. 2020, 7, 200538. [Google Scholar] [CrossRef]
- Zerizghi, T.; Guo, Q.; Tian, L.; Wei, R.; Zhao, C. An integrated approach to quantify ecological and human health risks of soil heavy metal contamination around coal mining area. Sci. Total Environ. 2022, 814, 152653. [Google Scholar] [CrossRef]
- Zhao, R.; Guan, Q.; Luo, H.; Lin, J.; Yang, L.; Wang, F.; Pan, N.; Yang, Y. Fuzzy synthetic evaluation and health risk assessment quantification of heavy metals in Zhangye agricultural soil from the perspective of sources. Sci. Total Environ. 2019, 697, 134126. [Google Scholar] [CrossRef] [PubMed]
- Haji Gholizadeh, M.; Melesse, A.M.; Reddi, L. Water quality assessment and apportionment of pollution sources using APCS-MLR and PMF receptor modeling techniques in three major rivers of South Florida. Sci. Total Environ. 2016, 566–567, 1552–1567. [Google Scholar] [CrossRef]
- Streets, D.; Hao, J.; Wu, Y.; Jiang, J.; Chan, M.; Tian, H.; Feng, X. Anthropogenic mercury emissions in China. Atmos. Environ. 2005, 39, 7789–7806. [Google Scholar] [CrossRef]
- Fei, X.; Lou, Z.; Xiao, R.; Ren, Z.; Lv, X. Contamination assessment and source apportionment of heavy metals in agricultural soil through the synthesis of PMF and geogdetector models. Sci. Total Environ. 2020, 747, 141293. [Google Scholar] [CrossRef]
- Xiao, R.; Guo, D.; Ali, A.; Mi, S.; Liu, T.; Ren, C.; Li, R.; Zhang, Z. Accumulation, ecological-health risks assessment, and source apportionment of heavy metals in paddy soils: A case study in Hanzhong, Shaanxi, China. Environ. Pollut. 2019, 248, 349–357. [Google Scholar] [CrossRef] [PubMed]
- Gupta, P.; Seth, C.S. 24-Epibrassinolide Regulates Functional Components of Nitric Oxide Signalling and Antioxidant Defense Pathways to Alleviate Salinity Stress in Brassica juncea L. cv. Varuna. J. Plant Growth Regul. 2022, 42, 4207–4222. [Google Scholar] [CrossRef]
- Wei, B.; Yang, L. A review of heavy metal contaminations in urban soils, urban road dusts and agricultural soils from China. Microchem. J. 2010, 94, 99–107. [Google Scholar] [CrossRef]
- Hani, A.; Pazira, E. Heavy metals assessment and identification of their sources in agricultural soils of Southern Tehran, Iran. Environ. Monit. Assess. 2011, 176, 677–691. [Google Scholar] [CrossRef]
- Li, Y.; Zhang, Y.; Chen, J.; Yang, G.; Li, H.; Wang, J.; Li, W. Ecological risk assessment and source analysis of heavy metals in farmland soil in Yangchun city based on APCS-MLR and geostatistics. Agriculture 2024, 14, 309. [Google Scholar] [CrossRef]
- Huang, Y.; Wang, L.; Wang, W.; Li, T.; He, Z.; Yang, X. Current status of agricultural soil pollution by heavy metals in China: A meta-analysis. Sci. Total Environ. 2019, 651, 3034–3042. [Google Scholar] [CrossRef]
Disclaimer/Publisher’s Note: The statements, opinions and data contained in all publications are solely those of the individual author(s) and contributor(s) and not of MDPI and/or the editor(s). MDPI and/or the editor(s) disclaim responsibility for any injury to people or property resulting from any ideas, methods, instructions or products referred to in the content. |
© 2025 by the authors. Licensee MDPI, Basel, Switzerland. This article is an open access article distributed under the terms and conditions of the Creative Commons Attribution (CC BY) license (https://creativecommons.org/licenses/by/4.0/).