Abstract
The diameter of the sunflower flower head and the thickness of its margins are important crop phenotypic parameters. Traditional, single-dimensional two-dimensional imaging methods often struggle to balance precision with computational efficiency. This paper addresses the limitations of the YOLOv11n-seg model in the instance segmentation of floral disk fine structures by proposing the MBLA-YOLO instance segmentation model, achieving both lightweight efficiency and high accuracy. Building upon this foundation, a non-contact measurement method is proposed that combines an improved model with three-dimensional point cloud analysis to precisely extract key structural parameters of the flower head. First, image annotation is employed to eliminate interference from petals and sepals, whilst instance segmentation models are used to delineate the target region; The segmentation results for the disc surface (front) and edges (sides) are then mapped onto the three-dimensional point cloud space. Target regions are extracted, and following processing, separate models are constructed for the disc surface and edges. Finally, with regard to the differences between the surface and edge structures, targeted methods are employed for their respective calculations. Whilst maintaining lightweight characteristics, the proposed MBLA-YOLO model achieves simultaneous improvements in accuracy and efficiency compared to the baseline YOLOv11n-seg. The introduced CKMB backbone module enhances feature modelling capabilities for complex structural details, whilst the LADH detection head improves small object recognition and boundary segmentation accuracy. Specifically, the CKMB module integrates MBConv and channel attention to strengthen multi-scale feature extraction and representation, while the LADH module adopts a tri-branch design for classification, regression, and IoU prediction, structurally improving detection precision and boundary recognition. This research not only demonstrates superior accuracy and robustness but also significantly reduces computational overhead, thereby achieving an excellent balance between model efficiency and measurement precision. This method avoids the need for three-dimensional reconstruction of the entire plant and multi-view point cloud registration, thereby reducing data redundancy and computational resource expenditure.
1. Introduction
Sunflowers rank among the world’s most significant economic crops [1], finding extensive application in vegetable oil processing and seed consumption. Their seeds are rich in unsaturated fatty acids and protein, constituting an essential nutritional component of balanced, healthy diets [2] with considerable nutritional and health benefits. According to statistics from the Food and Agriculture Organisation of the United Nations, sunflower oil has become one of the world’s primary vegetable oil sources [3]. Current global oil consumption totals approximately 85 million tonnes, with vegetable oils accounting for 75% of this figure, where sunflower oil holds a leading position [4]. As consumer demands for high oil content and seed quality continue to rise, the stability of sunflower’s commercial traits is receiving increasing attention. Particularly, sunflower phenotypic factors such as flower head size and marginal thickness increasingly influence marketability and economic value, progressively becoming key indicators for assessing ‘consistency of marketability’ and ‘oil stability’. Consequently, sunflower structural phenotypes are not only crucial for vegetable oil supply security but also closely linked to sustainable agricultural development [5].
To address the pressure on grain and oil demand arising from population growth, enhancing sunflower yield, improving quality, and strengthening stress tolerance have become core tasks in crop breeding and agricultural production. In this process, the precise acquisition of crop phenotypes has become a critical step. Phenotypic analysis not only provides vital information on plant morphology, physiology, and developmental status but also serves as an indispensable tool for variety improvement, agronomic optimisation, and high-throughput breeding [6]. However, current research on sunflower phenotyping predominantly focuses on traits such as plant height and leaf area index. Although some studies have addressed geometric characteristics like flower head diameter [7], quantitative analysis of flower head size and marginal thickness remains severely inadequate. Indeed, these two structural parameters not only determine the spatial distribution and filling uniformity of seeds but also directly influence final seed yield and oil accumulation levels [8]. As key phenotypic indicators, flower head diameter and rim thickness exert direct effects on seed filling, oil accumulation, and performance during mechanised seed harvesting. The seed portion of sunflower seeds accounts for approximately 70% of total seed weight, with oil content comprising about 55%. This indicates that overall flower head size and marginal thickness play a decisive role in determining seed plumpness and oil quality performance [9].
Furthermore, studies have revealed that east-facing flower heads exhibit an 11.2% increase in average seed weight compared to west-facing treatments, with more fully filled grains. This indirectly corroborates the importance of flower head structure in pollination efficiency and grain development [10]. Further investigations reveal that plants with more uniform disc rim thickness exhibit lower grain damage rates during harvesting, alongside superior grain plumpness and oil stability [11]. During mechanised harvesting, adaptive picking based on glume diameter and marginal thickness is crucial for reducing grain shedding and damage rates. This is because varying marginal thicknesses directly impact the gripping stability, mechanical control, and path planning of harvesting robot arms, thereby determining both harvesting efficiency and the integrity of marketable seed. Research indicates that seed loss increases approximately twofold by the fifth day after harvesting commences beyond full ripeness, rising to a tenfold to twelvefold increase by the fifteenth day [12]. This further underscores the importance of precision harvesting and timing control based on flower head diameter and rim thickness. Consequently, achieving efficient identification and adaptive harvesting of sunflowers with varying flower head diameters and rim thicknesses has become a critical technical bottleneck in intelligent breeding and precision agricultural management. Currently, measuring sunflower phenotypic parameters primarily relies on manual methods, such as rulers, protractors, and other handheld devices, to obtain data including plant height, stem diameter, leaf width, flower head diameter, and rim thickness [13]. Whilst these methods offer simplicity and practicality, they suffer from limitations including time-consuming and labour-intensive procedures, high costs, significant human error, and poor repeatability. Furthermore, repeated measurements often cause plant damage, making it difficult to meet demands for efficient and real-time feedback.
With the advent of non-contact technologies such as remote sensing, image processing, and artificial intelligence, crop phenotyping has progressively evolved towards automation and digitalisation [14]. For instance, Fieuzal et al. achieved high-precision estimation of sunflower leaf area index and plant height using multi-temporal optical and SAR satellite data [15]. Additionally, Sunoj et al. employed digital image processing techniques to measure inflorescence size, attaining considerable accuracy and semi-automated results [16]. Other studies have attempted to utilise techniques such as threshold segmentation and image binarisation for identifying flower heads, receptacles, and petals. While possessing a degree of automation capability, these methods face significant challenges in terms of recognition accuracy and robustness under field conditions involving natural lighting, complex backgrounds, and petal occlusion. These limitations make it difficult for such approaches to reliably obtain geometric structure parameters of flower heads, particularly regarding marginal thickness and overall integrity. Consequently, integrating advanced deep learning models with three-dimensional reconstruction techniques has emerged as a novel research trend. Furthermore, the recent combination of instance segmentation models with depth cameras has opened new avenues for phenotyping research. For instance, YOLO v11 can reliably identify targets in complex environments by learning the morphological and textural features of the receptacle, while the point cloud data generated by depth cameras provides a robust foundation for true geometric measurements [17].
To address the aforementioned issues, this paper proposes a non-contact measurement method integrating instance segmentation with three-dimensional point cloud analysis, specifically designed for the precise identification and estimation of sunflower flower head diameter and edge thickness. Although this method can directly estimate flower head thickness and diameter through single-angle lateral observation, front-view observations are additionally employed to validate diameter measurements, ensuring rigorous results. During the training phase, the model learns structural features of the flower head surface and edge regions through image annotation, while actively excluding non-target interference by omitting annotated petals and calyxes. Following mapping of recognition results into a three-dimensional point cloud space, denoising is performed using accelerated filtering and statistical filtering. Missing regions are then completed via interpolation and upsampling. Combined with PCA for pose standardisation, this generates structurally complete and unified standardised point cloud models for both the disc surface and margins. Considering the central disc faces directly forward with an approximately flat structure, while the margins exhibit curved, winding patterns with indistinct thickness and highly variable growth forms, this study employs differentiated geometric extraction strategies: within the central disc point cloud, the disc diameter is calculated using principal plane projection combined with boundary maximum diameter measurement; within the marginal point cloud, PCA principal axis fitting analysis is employed to precisely determine margin thickness. This approach fully accommodates the three-dimensional structural characteristics of different flower head regions, effectively enhancing measurement completeness and accuracy. It avoids redundant point cloud stitching and error accumulation, significantly reduces computational burden on equipment, and better meets the requirements for real-time performance and stability in field environments.
In summary, existing research still exhibits several shortcomings in non-contact measurement and three-dimensional point cloud analysis: Firstly, multi-view point cloud registration relies on complex alignment algorithms, prone to cumulative errors and resulting in insufficient real-time performance; Secondly, quantitative studies on key parameters such as sunflower head edge thickness remain scarce, with existing methods struggling to balance computational efficiency and accuracy; Thirdly, existing deep learning models impose excessive computational overhead when deployed on resource-constrained edge devices, limiting their real-time application in field scenarios.
To address these technical gaps, this study proposes a non-contact measurement method combining an improved MBLA-YOLO approach with dual-view point clouds. Its innovations manifest in three key aspects: (1) Methodological: Enhancing feature representation capabilities for complex boundaries and small targets through the introduction of the CKMB module and LADH detection head; (2) Process: Designing a ‘dual-view direct measurement’ strategy that bypasses traditional multi-view point cloud fusion, reducing error accumulation and improving real-time performance; (3) Application level: Integrates PCA pose standardisation for efficient edge thickness estimation, delivering a scalable lightweight solution for intelligent harvesting equipment and high-throughput agronomic phenotyping research.
Consequently, this study not only addresses methodological shortcomings in existing techniques regarding precise edge thickness measurement and lightweight deployment but also provides novel insights and technical support for intelligent equipment design and efficient field measurement in precision agriculture.
Subsequent sections outline the methodology: Section 2 details data acquisition, model refinement, and point cloud geometric analysis; Section 3 presents experimental results and analysis; Section 4 discusses performance variations, application strategies, and limitations; Section 5 concludes the paper.
2. Method
2.1. Overall System Process
In traditional three-dimensional measurement workflows, point cloud registration typically involves the following steps: first, acquiring point cloud data of the target from multiple distinct angles; second, registering multi-view point clouds using algorithms such as feature point matching or Iterative Closest Point (ICP) to align them within a common coordinate system; finally, fusing and reconstructing the aligned point clouds to generate a complete three-dimensional structure. This process is computationally intensive and prone to cumulative errors when feature point extraction is inaccurate, occlusions occur, or lighting conditions vary, leading to reduced reconstruction accuracy.
To address these issues, this study proposes a ‘dual-view measurement’ strategy, assigning the tasks of measuring flower disk diameter and edge thickness to front-view and side-view point clouds, respectively. The frontal-view point cloud is directly utilised for calculating the flower disc diameter, while the side-view point cloud focuses exclusively on extracting the edge thickness. This division of labour eliminates the need for cross-view point cloud registration and stitching, fundamentally avoiding cumulative errors and redundant computations, thereby enhancing the system’s real-time performance and stability.
Building on this strategy, the overall workflow is illustrated in Figure 1, this method aims to achieve non-contact structural measurement of sunflower heads during the ripening stage. The overall workflow encompasses data acquisition, image processing, instance segmentation, point cloud construction, and geometric parameter estimation. First, images and point clouds of the disc surface and edge thickness are captured using dual-view perspectives. These undergo filtering, data augmentation, and manual annotation to generate a training dataset. Subsequently, an instance segmentation model extracts the disc surface and edge contours, mapping segmentation results to a three-dimensional point cloud space. Two types of filtering for noise reduction, interpolation for data completion, and PCA pose correction are then applied to construct point cloud models for the disc surface and edges. Finally, the disc diameter is calculated via principal plane projection, while edge thickness is estimated through projection along the principal axis. This workflow not only reduces data redundancy and computational overhead but also balances measurement accuracy with field adaptability, providing reliable data support for subsequent crop phenotyping and agricultural equipment control. In summary, the dual-view measurement strategy maintains measurement accuracy while circumventing the high computational costs and cumulative error issues associated with traditional point cloud registration procedures. This significantly enhances the method’s simplicity and practicality. Detailed explanations of each step follow.
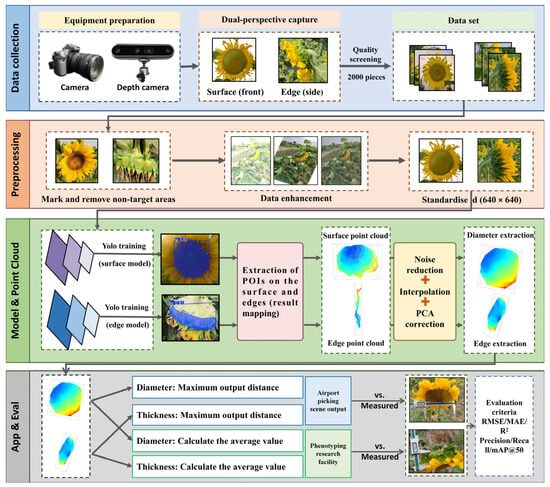
Figure 1.
Overall Framework of the Sunflower Phenotypic Parameter Measurement System.
2.2. Data Collection and Preprocessing
2.2.1. Data Acquisition
The image data employed in this study were captured using a Canon EOS 70D digital single-lens reflex camera (equipped with an EF-S 18-135mm f/3.5-5.6 ISTM lens, resolution 5472 × 3648 pixels, manual mode, ISO 200 (as defined in ISO 12232:2006 [18]), shutter speed 1/125 s, aperture f7.8).The manufacturer of the Canon EOS 70D digital single-lens reflex camera is Canon Inc., Tokyo, Japan. This resolution represents the camera’s native output size, ensuring all image details are fully preserved [19]. This is crucial for subsequent image processing or analysis tasks involving texture, edge, and structural information extraction. All data were captured at the experimental base of Shanxi Agricultural University. All images were taken under natural lighting conditions, spanning different time periods throughout the morning and afternoon. Although light intensity was not precisely quantified, the naturally distributed shooting times objectively encompassed diverse illumination environments ranging from soft light to intense sunlight. This provides a rich sample foundation for the model to learn features under varying lighting conditions. It should be specifically noted that this image collection did not include nocturnal scenes, nor were any artificial lighting devices employed. Consequently, this study primarily focuses on image processing under natural daylight conditions. A total of 2170 images were collected. Following quality screening and annotation completeness review, 2000 images were ultimately retained for model training and testing. The remaining 170 images were discarded due to issues such as blurring or missing subjects. Among the retained 2000 images, 1000 each captured the flower head from a frontal and a lateral perspective, encompassing diverse spatial orientations and shooting angles. This enhances sample diversity for recognition tasks. All images were taken from sunflowers at maturity, explicitly excluding samples from earlier developmental stages where the flower head had not yet formed.
The depth camera employed for three-dimensional data acquisition is the Intel RealSense D457, operating within a working distance range of 0.6 m to 6 m. supporting a maximum resolution of 1280 × 720 and a frame rate of 90 FPS. Its horizontal and vertical fields of view are 87° and 58° (±3°), respectively, with dimensions of 124 mm × 29 mm × 36 mm. This device acquires depth information of the sunflower head and generates corresponding three-dimensional point cloud data, serving as the foundation for geometric parameter calculations. For depth cameras, colour cameras and infrared depth sensors constitute distinct imaging units, differing in optical axis positioning, field of view, and distortion characteristics. Colour imagery is frequently employed for point cloud texture mapping or depth registration, where its geometric accuracy directly influences colour-depth consistency. Without calibration, distortion may cause texture misalignment and reconstruction errors, compromising overall precision. Calibration yields the colour camera’s intrinsic and distortion parameters, enabling distortion correction and precise modelling to ensure accurate alignment between colour and depth data. In contrast, the intrinsic and extrinsic parameters of infrared depth sensors undergo high-precision factory calibration and are embedded within the firmware. Parallax calculations relying on these parameters suffice for most application requirements. Therefore, in practical applications, calibration is typically required only for the colour camera to enhance point cloud reconstruction quality and ensure the accuracy of multi-sensor fusion. During camera calibration, a standard chessboard pattern was employed as the calibration target, comprising 5 × 8 internal corner points with each square measuring 27 mm in length. During acquisition, the colour camera was set to a resolution of 848 × 480 pixels, capturing a total of 33 checkerboard images. To enhance accuracy and stability, three images exhibiting significant reprojection errors were excluded based on their distribution. Ultimately, 30 valid images were selected for parameter estimation. Utilising OpenCV’s (3.4.16) corner extraction and camera calibration functions, the colour camera’s intrinsic matrix and distortion coefficients were obtained (as shown in Table 1). OpenCV 3.4.16 is an open-source computer vision library developed by the OpenCV organization under the Open Source Vision Foundation (Palo Alto, CA, USA).Additionally, the average reprojection error for the entire calibration process was assessed, and a line chart depicting the reprojection error for each image was plotted, with the legend indicating the average reprojection error value (as shown in Figure 2).

Table 1.
Internal Reference for Colour Camera.
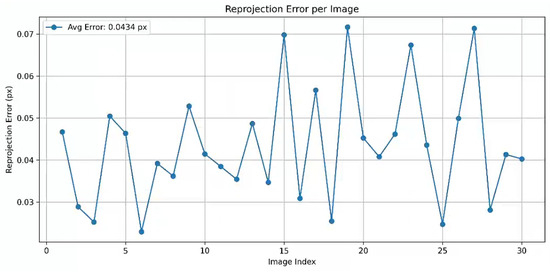
Figure 2.
Analysis of Reprojection Error.
These results further validate the rationality and stability of the calibration parameters, providing a robust foundation for subsequent image distortion correction and precise registration of colour-depth data. During the 3D point cloud data acquisition phase, an Intel RealSense D457 depth camera, calibrated using the colour camera, was employed to capture point clouds of the experimental materials. The Intel RealSense Depth Camera D457 was sourced from Intel Corporation, headquartered in Santa Clara, CA, USA. Specifically, sunflower heads were selected as the research subject, with point cloud data collected from both frontal and lateral perspectives to ensure comprehensive and diverse morphological information. A total of 100 specimens were sampled, encompassing the geometric characteristics and growth states of different individuals, thereby providing rich and reliable foundational data for subsequent morphological analysis and feature extraction.
Finally, to obtain precise measured reference values, both the diameter and edge thickness of the flower disc were independently measured three times using a digital micrometer with an accuracy of 0.01 mm and a measuring range of 35 cm. The average value was then calculated. The resulting data will serve as the basis for comparative analysis against the model’s predicted values.
2.2.2. Data Augmentation Strategies
To enhance the robustness and generalisation capability of instance segmentation models under variable natural lighting conditions, this study incorporates data augmentation strategies based on the Albumentations library during the training phase. The complexity of lighting, backgrounds, and imaging conditions in natural field environments often renders images captured under single conditions insufficient to cover practical application scenarios, thereby increasing the risk of model overfitting to specific patterns. To address this issue, three representative random augmentation methods were selected, with parameters strictly constrained to ensure controllable and diverse enhancement effects: (1) Random brightness adjustment, with a variation range set at ±50%, to simulate imaging differences across varying time periods, weather conditions, and light intensities; (2) Random rotation, with a rotation angle range set at ±45°, to enhance the model’s adaptability to changes in shooting angles; (3) Random Gaussian noise addition, with noise variance controlled between 30% and 40%, to simulate imaging sensor noise and potential field-acquisition interference. These enhancement strategies significantly increased training dataset diversity, thereby effectively improving the model’s contour segmentation accuracy and stability across varied natural environments. This provides a more reliable foundation for feature learning in sunflower head surface and edge segmentation tasks. Figure 3 illustrates examples of the augmentation effects: (a) represents the original image, (b) shows the brightness-adjusted image, (c) displays the randomly rotated image, and (d) presents the image with added Gaussian noise.
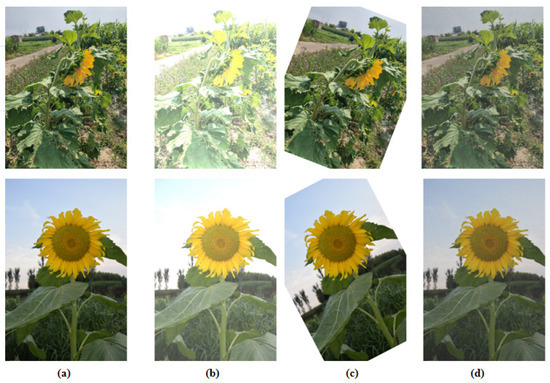
Figure 3.
Demonstration of Data Augmentation Effects on Sunflower Images ((a) represents the original image, (b) shows the brightness-adjusted image, (c) displays the randomly rotated image, and (d) presents the image with added Gaussian noise.).
2.2.3. Data Annotation and Set Partitioning
To ensure the accuracy of model training data and the geometric consistency of measurement tasks, this study established explicit image annotation methods and standards specifically for structural recognition in sunflower flower head images during the maturation stage. Annotation targets focus on functionally significant areas of the disc surface and its marginal thickness structure [20], explicitly excluding peripheral non-functional, non-structural distractors such as ligulate florets and involucral bracts.
Unlike approaches annotating only surface areas, this study separately annotates two distinct regions: the disc surface (front view) and disc marginal thickness (side view), thereby fully presenting the structural characteristics of both components within three-dimensional space. Specifically, in frontal images, annotation is strictly confined to the densely packed tubular flowers [21] at the central disc surface, excluding marginal ornamental structures like ligulate flowers [22]. In lateral images, only the effective thickness structure of the disc is delineated, preventing erroneous inclusion of triangular involucral bracts [23] extending beyond the disc margin, which hold no physiological measurement value. During annotation, polygon tools were employed to meticulously delineate boundaries, ensuring annotations precisely aligned with functional tissue areas. Petals and sepals (corresponding to ligulate flowers and involucral bracts) appearing in the image were actively excluded if obscuring or extending beyond the target region. Through targeted annotation of the disc surface and marginal thickness combined with interference structure removal, this method not only possesses rigorous morphological theoretical foundations but also enhances the geometric precision of phenotypic parameter extraction and the robustness of model training in practice. It provides a reliable data foundation for intelligent mechanical harvesting devices and pre-harvest phenotypic detection.
Image annotation was performed using the LabelMe (v4.5.13) [24] tool, employing manual polygon-based labelling to delineate the boundaries of sunflower heads. The annotated results were subsequently converted uniformly into YOLO format. To meet this study’s requirement for high-precision annotation of complex-edged targets (such as sunflower heads), LabelMe was selected as the image annotation tool. Its intuitive operation and streamlined interface, particularly suited to polygon annotation, facilitate rapid and meticulous data processing. The choice of YOLO format for annotation stems from its advantages in real-time processing and conciseness. Although formats like VOC and COCO offer richer semantic information (such as multi-class support, bounding box attributes, segmentation details) and more robust structural organisation, their annotation files (e.g., XML or JSON) feature complex structures with higher production and parsing costs. Given this project’s focus on single-category object recognition and emphasis on lightweight deployment and rapid annotation, the YOLO format proves more suitable due to its conciseness. Consequently, the integration of LabelMe with the YOLO format achieves a favourable balance between accuracy and efficiency, better aligning with the practical application requirements of this research. The image dataset of flower panicles and their margins was randomly partitioned into training, validation, and test sets at an 8:1:1 ratio, comprising 800, 100, and 100 images, respectively. The model development process adheres to standard protocols in artificial intelligence research to ensure experimental reproducibility and objective evaluation. During training, a validation set was employed to monitor model convergence and mitigate overfitting, whilst enhancing the model’s generalisation capability through diverse imaging conditions and target morphologies. All results herein derive from an independent test set to guarantee that model performance reflects genuine generalisation ability.
2.3. Instance Segmentation Models
2.3.1. Model Training Settings
This research was implemented within the PyTorch deep learning framework and experimentally conducted on the following hardware environment: a 13th Gen Intel® CoreTM i7-13700KF 3.40 GHz processor, 64GB RAM, and an RTX 4080 GPU, operating under Windows 11. The Intel Core i7-13700KF 3.40 GHz processor is part of the 13th Generation Intel Core i7 (“Raptor Lake”) family. It is manufactured by Intel Corporation, headquartered in Santa Clara, CA, USA. The software environment comprised Python 3.10, PyTorch 1.13, and CUDA 11.7. During training, the batch size was set to 32, resolution to 640 × 640, and 300 training epochs were completed. The optimiser employed SGD with an initial learning rate of 0.01, utilising a cosine annealing strategy for learning rate decay to enhance convergence speed and stability. The loss function selected was Complete IoU (CIoU), thereby enhancing the model’s capability and precision in fitting object boundaries [25].
2.3.2. Model Introduction
This study selected YOLO as the foundational framework, primarily considering its lightweight architecture and real-time inference advantages, which can meet the efficiency requirements for target recognition in complex field environments. Compared to more complex detection networks, YOLO significantly reduces computational overhead and latency while maintaining accuracy. It also possesses good scalability, facilitating further enhancements to improve recognition capabilities for small targets and complex edges.
Although YOLOv11-seg demonstrates commendable computational efficiency as a lightweight instance segmentation framework for segmentation tasks, it exhibits notable shortcomings when processing agricultural applications featuring intricate structures and diverse target morphologies, such as sunflower flower heads and their peripheral regions. On the one hand, the original C3k2 module is constrained by its fixed small-scale convolutional kernels and lack of channel selection mechanisms, resulting in limited feature extraction capabilities that struggle to fully capture the complex geometric structures and textural information of flower head margins [26]. On the other hand, the original instance segmentation detector head exhibits limitations in spatial modelling capabilities and task decoupling, impairing accurate recognition of small objects, occluded objects, and surface details [27]. To address these issues, this paper proposes the MBLA-YOLO instance segmentation model, building upon YOLOv11n-seg. By introducing the CKMB module and LADH detection head, the model enhances feature representation and spatial perception capabilities. While maintaining lightweight characteristics, it significantly improves segmentation accuracy and robustness in complex agricultural scenarios. The original YOLOv11n-seg network architecture is depicted in Figure 4, while the overall MBLA-YOLO framework is illustrated in Figure 5.
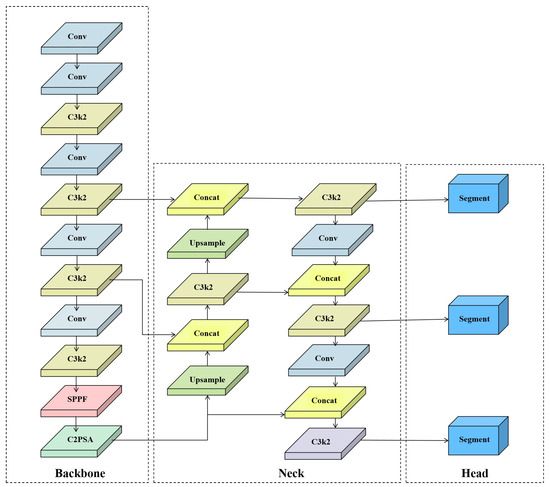
Figure 4.
YOLOv11-seg Network Architecture Diagram.
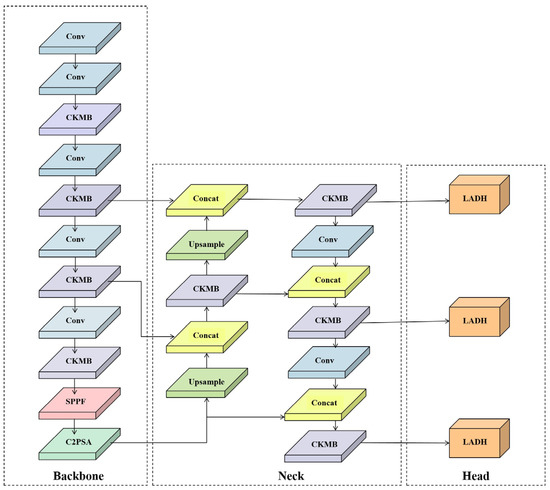
Figure 5.
MBLA-YOLO Network Architecture Diagram.
The CKMB module builds upon the original C3k2 architecture by incorporating the MBConv (Mobile Inverted Bottleneck Convolution) module, which possesses enhanced modelling capabilities. This aims to strengthen the network’s ability to express salient features and model attention across channel dimensions, particularly in segmentation tasks involving structurally intricate and diverse target morphologies such as sunflower heads and their margins. Consequently, overall detection performance is improved, as illustrated in Figure 6. The CKMB module incorporates MBConv (Mobile Inverted Bottleneck Convolution) into the C3k2 architecture to enhance salient feature representation and channel attention modelling. This proves particularly advantageous in segmentation tasks involving intricate structures and diverse forms, such as sunflower heads and their margins. C3k2 adopts CSPNet’s cross-stage feature fusion approach, splitting inputs into local feature extraction and original information retention streams before reintegration.
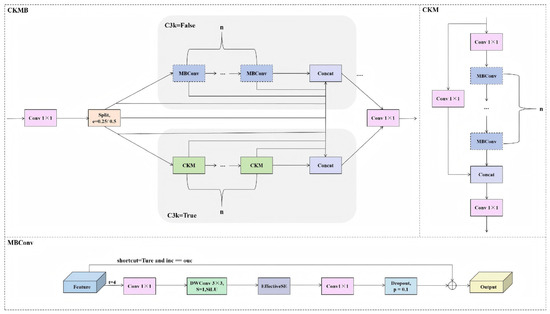
Figure 6.
MBConv Network Architecture Diagram.
While computationally efficient, it suffers from limited receptive fields, absent channel selection mechanisms, and insufficient discrimination in complex scenes. To address these limitations, this paper replaces the Bottleneck layer with the more expressive MBConv module. As illustrated in Figure 6, the CKMB module is designed based on a typical CSP framework. Input features first undergo a 1 × 1 convolution, then split into two branches according to a scaling factor e (0.25 or 0.5): the main branch employs MBConv or CKM (depending on the c3k parameter) to replace the original Bottleneck, thereby enhancing nonlinear expressive capability; the bypass branch maintains a lightweight direct connection without complex transformations. After stacking n modules, the two feature streams are concatenated and fused via a 1 × 1 convolution for output. The division of the overall information flow, feature paths, and merging sequence are all annotated in Figure 6, ensuring complete reproducibility.
Regarding the channel dimension, the backbone network starts from layer P1 (output channel 64), proceeding sequentially as 64 → 128 (P2) → 256 → 512 (P4) → 1024 (P5), doubling the channel count at each subsampling stage. Intermediate channels C_mid = C_out × e, where e = 0.25 at P2 and P3, and e = 0.5 at P4 and P5. The CKMB module within the Neck section does not specify e independently, defaulting to e = 0.5 to ensure consistency with the Backbone’s output channels, thereby achieving dimensional alignment during feature fusion.
MBConv’s specific parameters are: expansion ratio t = 4, depth of convolutional kernel size 3 × 3, stride 1, and activation function SiLU. Following DWConv, an SE module employs EffectiveSE (r = 1) without channel compression. It directly generates channel attention weights via a single 1 × 1 convolution, substituting Hard-Sigmoid for standard Sigmoid. This module omits normalisation and supports adding a max-pooling branch to global average pooling, enhancing channel-aware capabilities. Dropout is set to 0.1, positioned after the final 1 × 1 linear convolution (PW-linear) and before the residual connection. Residual connections are enabled only when `shortcut = True’ and input/output channel dimensions are identical.
For normalisation, BatchNorm is employed across all convolutional layers; LayerNorm or GroupNorm are not utilised. BatchNorm parameters align with PyTorch defaults: eps = 1 × 10⁻⁵, momentum = 0.1, ensuring numerical stability and inference compatibility.
Regarding C3k2 specifics, the ‘k2’ denotes a module containing two convolutional computation paths (i.e., two MBConv or two CKM units), formally termed CSP Bottleneck with Two Convolutional Layers. The channel splitting ratio for the CSP branch is similarly controlled by parameter e, typically set to 0.25 or 0.5, corresponding to allocating 25% or 50% of input channels to the main branch. Only the main branch utilises MBConv or CKM, while the bypass branch maintains lightweight pass-through. Regarding network replacements, we substituted the original C3k2 modules with CKMB modules at stages P2, P3, P4, and P5 of the backbone network, stacking them twice (n = 2) at each stage, including P4. Similarly, the original C3k2 modules in the upsampling and downsampling paths of the Neck are replaced with CKMB modules, each stacked twice. All replacement locations are explicitly annotated in Structural Diagram 5 and align with the configuration file.
Regarding training settings, the introduction of CKMB modules did not necessitate modifications to the original loss functions; loss functions for bounding boxes, categories, and mask branches remain unchanged. Furthermore, the data augmentation strategy and learning rate scheduling remain identical to the original settings to ensure evaluation results accurately reflect the impact of the CKMB architecture itself on performance.
These design and configuration details guarantee the complete reproducibility of the CKMB module, preventing discrepancies arising from differing implementations across teams.
To enhance the adaptability and deployment efficiency of instance segmentation models in multi-task scenarios, this paper introduces a lightweight asymmetric detection head architecture—LADH (Lightweight Asymmetric Detection Head)—on top of the original detection head. This module not only optimises bounding box and class prediction capabilities for detection tasks but also provides higher-quality spatial awareness support for instance mask generation, representing a structural-level advancement tailored for instance segmentation tasks.
As shown in Figure 7, The LADH detection head adopts a three-branch architecture, responsible for classification (Cls), confidence prediction (IoU), and bounding box regression (Reg), respectively. As shown in Figure 7, the LADH detection head adopts a three-branch architecture, responsible for classification (Cls), bounding box regression (Reg), and confidence prediction (IoU). Each branch employs a differentiated structural design: the classification and regression paths focus on channel-wise feature extraction through stacked convolutions, while the IoU branch enhances spatial modelling via depthwise separable convolutions.
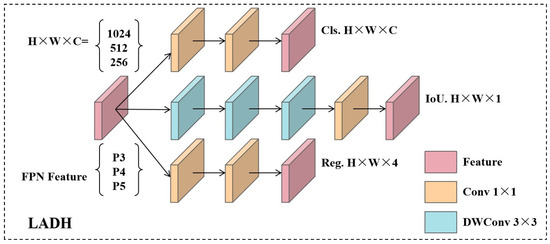
Figure 7.
LADH Network Architecture Diagram.
In terms of implementation, both the classification and regression branches are constructed with 3 convolutional layers, whereas the IoU branch is deeper with 5 layers. Channel dimensions vary with the FPN stage (256/512/1024 for P3/P4/P5). Intermediate layers compress channels to one-quarter of the input and then expand them again, following a “compression–expansion” rule that reduces computation while maintaining representation capability. All convolutional units adopt SiLU activation and Batch Normalization (BN) with PyTorch default parameters (eps = 1 × 10⁻⁵, momentum = 0.1), without bias. The operator sequence strictly follows Conv → BN → SiLU, and Dropout is not employed.
Within the IoU branch, the first 3 layers are depthwise separable convolutions (3 × 3 depthwise + 1 × 1 pointwise), followed by a 1 × 1 convolution and the final output layer. All convolutions use stride = 1 and dilation = 1, preserving spatial resolution. The detection head outputs per-scale independent predictions under an anchor-free paradigm: bounding box regression is parameterized in xywh format with DFL, and classification logits are produced via sigmoid activation.
Regarding the loss functions, regression is based on predicted IoU rather than objectness proxies, using CIoU as the main loss combined with DFL for refined localisation. While focal loss is not explicitly applied, foreground weighting through target scores achieves a similar effect. Task weights are not fixed but adaptively adjusted according to prediction scores.
For instance segmentation, LADH integrates a YOLACT-style mask generation strategy: high-resolution features produce global mask prototypes, while multi-scale features provide mask coefficients for each predicted box. The masks are then generated by linearly combining prototypes with coefficients. The mask branch shares features with detection, requiring no extra branches, resulting in a compact and efficient design.
Finally, to facilitate deployment, LADH employs lightweight convolutions, static inference paths, and standard output formats. This architecture maintains portability and inference efficiency suitable for edge or embedded devices, ensuring practical applicability in resource-constrained environments.
2.4. Point Cloud Construction and Preprocessing
This study eschews conventional multi-view registration during point cloud construction, instead proposing a ‘dual-view direct measurement’ strategy: utilising the frontal point cloud to extract flower disk diameter, while employing the lateral point cloud to estimate edge thickness. As the research focuses on key geometric parameters rather than complete 3D reconstruction, this approach avoids cumulative errors from cross-view registration whilst reducing computational complexity. It is thus better suited for real-time field deployment on edge devices such as handheld terminals. Concurrently, during point cloud preprocessing, beyond voxel filtering and statistical filtering, interpolation and upsampling are further employed to compensate for local missing data and restore edge continuity. In recent years, deep learning-based point cloud completion methods have been proposed, such as Point-KAN [28], which demonstrates excellent performance in restoring missing point cloud structures. Drawing upon the completion principles of such approaches, this study balances geometric continuity with computational efficiency through interpolation and upsampling, tailored to meet the real-time and lightweight requirements of field applications.
By integrating instance segmentation results with depth maps, this paper maps two-dimensional image information into three-dimensional space following regional structural segmentation, thereby generating a three-dimensional point cloud corresponding to the flower disk region. To enhance point cloud quality and computational efficiency, a two-stage denoising strategy is employed: first, voxel filtering is applied to downsample the point cloud [29], reducing data density and accelerating processing speed; Subsequently, statistical outlier filtering is applied to remove local anomalies, eliminating background and structural noise to accommodate geometric measurement requirements [30]. To address potential point cloud gaps caused by non-vertical capture angles and occlusion zones in depth cameras, the denoised 3D point cloud undergoes interpolation and upsampling to reconstruct boundary discontinuities and local concavities. Finally, pose standardisation is achieved through PCA to align poses, providing standardised input for subsequent geometric estimation. Principal Component Analysis (PCA), as a mature and classical method, can extract the principal directions of point clouds with low computational overhead, offering excellent determinacy and reproducibility [31]. Given that the geometric variations in sunflower heads and edges are predominantly concentrated in a few key directions, PCA proves sufficient to effectively capture their principal features. This approach thus balances precision with lightweight processing and real-time requirements.
During point cloud preprocessing, voxel filtering was first applied to the flower disc point cloud, with a voxel size set to 0.02 m. This parameter effectively reduced point cloud density and noise while preserving overall geometric integrity, thereby enhancing subsequent processing efficiency. It proved suitable for measuring structural features such as diameter and thickness. Subsequently, statistical outlier filtering (k = 20, standard deviation threshold = 2) is employed to remove locally isolated points, preserving the primary structural features. For point cloud completion, a two-dimensional projection and rasterised interpolation method is employed: a regular 200 × 200 grid is constructed on the XY plane, with cubic interpolation used to restore missing depth values. Nearest neighbour, MLS, or Poisson reconstruction methods are not utilised to ensure smoothness and moderate density.
Contour extraction employed the convex hull method, calculating boundary point sets on the XY plane to obtain outer envelope structures, without utilising alpha shapes or morphological closing operations. The projection plane for the point cloud is defined by the first two principal components of PCA, adaptively reflecting the actual spatial structure to mitigate errors caused by pose variations. For excluding ligulate flowers and bracts, this study relies entirely on the masks generated by the YOLO instance segmentation model, without introducing additional geometric heuristic thresholding methods.
During normalisation, the point cloud is aligned via PCA to a local coordinate system constructed based on its intrinsic geometry. The first principal component direction is defined as the ‘longest axis’, while the second principal component serves as an orthogonal plane, though not forcibly aligned with the global Z-axis. For thickness estimation, only the difference between the maximum and minimum Z-coordinates of the entire point cloud in the PCA-aligned coordinate system is employed as the thickness metric. This constitutes a global single-section estimation rather than segmented sampling.
The entire workflow is implemented using Open3D and Python, leveraging interpolation and geometric processing functions provided by NumPy, SciPy, and scikit-learn. PCL or MATLAB are not utilised. Common operations such as point cloud filtering, statistical outlier removal, bounding box fitting, and visualisation are performed via the Open3D API, whilst geometric completion and PCA processing are implemented through the aforementioned Python toolchain, offering flexibility and controllability. Result accuracy is assessed by comparing the measured diameters and thicknesses from the point cloud with actual values obtained using a vernier caliper, without setting a fixed tolerance threshold.
The model’s predicted values in this study utilise measurement data from the denoised and reconstructed point cloud. This processing enhances surface continuity and morphological integrity, yielding more stable extracted geometric features, hence its selection as the source for predicted values. It should be noted that the numerical differences between pre- and post-processing results are generally minor, primarily reflecting optimisation of morphology and local noise rather than significant numerical shifts.
2.4.1. Estimation of Flower Disc Diameter (Frontal View)
For point cloud data acquired from a forward-facing perspective, considering the characteristic that the entire surface structure faces forward and exhibits a nearly flat morphology [32], this paper employs a diameter estimation strategy based on principal plane projection. The specific workflow is illustrated in Figure 8: First, raw point cloud data captured by the depth camera is acquired and undergoes denoising and completion processing to enhance geometric integrity. Subsequently, the point cloud with unified orientation is projected onto the principal plane, from which its boundary contour is extracted. The maximum distance between any two points along this contour is then calculated as the estimated flower disc diameter. During preprocessing, the detection region excludes peripheral interference structures such as ligulate flowers, thereby effectively preventing diameter overestimation. This method offers a streamlined and efficient workflow, suitable for analysing flower disk structures of varying sizes and orientations. Additionally, the thickness estimation value (147.07 mm) is displayed in the top-left corner of the interface.
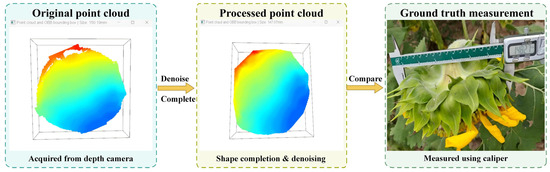
Figure 8.
Estimation Process for Disc Diameter Based on Frontal Point Cloud.
2.4.2. Estimation of the Thickness of the Periphery of the Flower Disc (Side View)
For edge point cloud data acquired from a side-view perspective, considering the significant principal axis characteristics of the flower disk edge structure along the thickness direction, this paper employs a thickness estimation strategy based on principal axis direction analysis. The specific workflow is illustrated in Figure 9: First, raw point cloud data captured by the depth camera is acquired and undergoes denoising and completion processing to enhance geometric integrity. Subsequently, the edge point cloud set is extracted from the detection region, and the principal axis direction of the point cloud is calculated using Principal Component Analysis (PCA). On the sampling cross-section, the maximum distance between the farthest point pairs along the normal vector direction is extracted between the upper and lower boundaries to obtain the local thickness value, thereby completing the estimation of the receptacle thickness. During preprocessing, interference from the involucral bracts and other redundant parts is eliminated from the detection area, effectively preventing systematic errors in thickness estimation. This method focuses on the effective structural region of the receptacle, demonstrating robust performance and adaptability. Furthermore, the numerical output of the thickness estimation (48.50 mm) is displayed in the top-left corner of the interface.
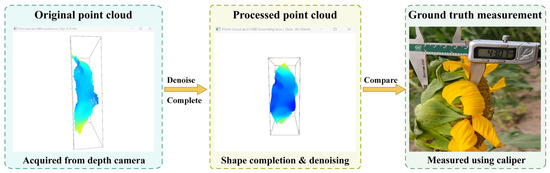
Figure 9.
Edge Thickness Estimation Process Based on Side-View Point Clouds.
In summary, within the proposed method for estimating flower head diameter and edge thickness, the ‘maximum distance’ is uniformly adopted as the core geometric measurement metric. Its design is grounded not only in the objective geometric characteristics of structural recognition but also fully considers the application requirements of intelligent agricultural harvesting equipment. During actual harvesting operations, robotic arms, grippers, or cutting devices typically require reference to the maximum spatial dimensions of crop structures to prevent issues such as misalignment, accidental damage, or failure to secure the crop. Therefore, compared to average dimensions or fitted radii, the maximum distance offers greater enveloping capability and engineering safety margins, providing the most conservative and stable dimensional reference for end-effectors [33].
Furthermore, this maximum spatial geometric dimension can serve as a scale reference benchmark within multi-sensor fusion systems. It can subsequently be integrated with force and tactile sensors, position feedback, or visual error correction mechanisms to achieve dynamic contact correction. When executing grasping or cutting tasks in real-world scenarios, the estimated maximum dimension pre-defines the desired contact area and serves as a preset boundary for the target space. This endows the device with fundamental adaptive adjustment capabilities, thereby enhancing harvesting precision and structural protection. It is worth emphasising that the estimation method proposed herein exhibits excellent scenario adaptability: for applications centred on device control, such as agricultural harvesting, the maximum distance is recommended as the final output parameter. Conversely, for research tasks driven by scientific questions, such as plant phenotyping studies or group structure analysis, the local thickness or edge cross-section information derived from this work can be further utilised to compute robust metrics like the mean or median [34]. Compared to maximum values, such statistical measures exhibit reduced sensitivity to local protrusions or noise points, more accurately reflecting overall structural trends, variability, and inter-population differences.
This renders them well-suited for scientific research and data modelling tasks. Moreover, this measurement strategy features straightforward algorithmic implementation and low computational load, making it suitable for deployment on edge computing terminals or lightweight embedded systems in field environments. This embodies a design philosophy that balances engineering adaptability with research scalability within integrated agricultural intelligent systems encompassing perception, decision-making, and execution.
2.5. Evaluation Indicators
To quantitatively analyse the model’s performance in predicting sunflower head surface area and edge thickness on the test set, this study employs three metrics: root mean square error (RMSE), mean absolute error (MAE), and coefficient of determination (R2). These, respectively, measure overall error, average deviation, and the model’s goodness of fit. Through these evaluation metrics, the model’s accuracy in measuring sunflower head surface area and edge thickness can be effectively assessed. Moreover, the evaluation results provide crucial reference for subsequent improvements to measurement methods and model optimisation.
2.5.1. Root Mean Square Error
Root Mean Square Error (RMSE) measures the mean square root of prediction errors [35]. It is sensitive to outliers (large errors) and is suitable for reflecting model error fluctuations under special growth conditions such as irregular edge thickening or plate surface distortion. The formula is as follows:
In the formula, denotes the actual angle, denotes the predicted angle, and denotes the total number of samples.
2.5.2. Mean Absolute Error
MAE assesses the mean absolute error of predictions, emphasising overall forecasting accuracy while exhibiting low sensitivity to extreme errors [36]. For samples exhibiting relatively stable variations in disc diameter and edge thickness, MAE effectively reflects the model’s average prediction deviation. Its calculation formula is:
In this formula, denotes the actual angle, represents the predicted angle, and signifies the total number of samples.
2.5.3. Coefficient of Determination
reflects the model’s ability to explain data variation, with values ranging from [0, 1]. The closer the value is to 1, the better the model’s fitting performance [37]. It is particularly suitable for comparing the stability and reliability of prediction results for different features (such as plate size and edge thickness):
In the formula, denotes the actual angle, denotes the predicted angle, denotes the mean of the actual angles, and denotes the total number of samples.
3. Results
Given that CKMB and LADH operate independently on trunk extraction and detection head stages, respectively, this paper designed a series of ablation experiments. By sequentially introducing CKMB and LADH, we compared the performance differences between the original YOLOv11n-seg model, single-module improved versions, and the integrated version MBLA-YOLO. This systematically evaluated the impact of each module on segmentation accuracy, edge detection capability, and inference efficiency, thereby validating the effectiveness of structural optimisation and providing theoretical foundations for subsequent model deployment and lightweight adaptation.
Given the differences in texture structure and boundary characteristics between the two regions, this paper conducts independent training and evaluation for the disc surface and edge tasks to better accommodate their respective segmentation requirements. This approach ensures fair comparison and accurate reflection of performance metrics. All comparison models were trained using identical training datasets and parameter settings to guarantee the scientific validity and comparability of experimental results. The ablation study findings are presented in Table 2 and Table 3.
Table 2.
Results of the Peripheral Dissolution Experiment on the Flower Disc.
Table 3.
Results of the disk surface ablation experiment.
In the baseline model YOLOv11n-seg without introduced enhancements, the Precision on flower disk edges reached 0.961, Recall reached 0.939, and mAP50 was 0.960. For the flower disk surface, Precision reached 0.967, Recall reached 0.946, and mAP50 was 0.971. The model parameters amounted to 2.83 million, with GFLOPs at 10.2 G. While demonstrating respectable segmentation performance under standard testing conditions, the model exhibits room for improvement in detection accuracy within complex scenarios characterised by diverse morphologies and significant perspective variations. This indicates that both feature extraction and robustness require further refinement.
Upon replacing the C3k2 module in the backbone network with the proposed CKMB module, the model achieved improvements in Precision, Recall, and mAP50 for flower disk edges to 0.984, 0.945, and 0.972, respectively. while Precision, Recall, and mAP50 for the disc surface improved to 0.987, 0.951, and 0.978, respectively. This demonstrates the module’s significant advantage in enhancing feature extraction capabilities. By incorporating the MBConv architecture and channel attention mechanism, the CKMB module further enhances the network’s perception and modelling capabilities for key region features, thereby improving overall segmentation performance. Although the number of parameters slightly increased to 3.12 million, the GFLOPs requirement decreased to 10.0 G, demonstrating that this structure maintains high computational efficiency while improving accuracy, exhibiting favourable lightweight characteristics.
Furthermore, upon replacing the original detector head with the LADH detector head proposed herein, the Precision, Recall, and mAP50 metrics for the flower disk edge improved to 0.988, 0.953, and 0.978, respectively. while Precision, Recall, and mAP50 on the flower disk surface improved to 0.99, 0.958, and 0.983, respectively. Concurrently, the number of parameters was significantly reduced to 2.40 million, and GFLOPs decreased to 8.60. These results demonstrate that LADH’s asymmetric tri-branch architecture, through decoupled modelling of classification, regression, and confidence prediction tasks combined with lightweight convolution design, effectively enhances detection accuracy while substantially reducing model complexity. This further boosts inference efficiency and deployment adaptability. As illustrated in Figure 7, the asymmetric three-branch design of LADH simplifies the detection head architecture by separating classification, regression, and IoU prediction into lightweight convolutional branches. This architectural modification achieves improved accuracy while significantly reducing parameter count (from 2.83 million to 2.40 million) and computational cost (from 10.2 GFLOPS to 8.6 GFLOPS). The ablation study results in Table 2 and Table 3 further validate the effectiveness of this lightweight design.
In summary, the proposed CKMB module and LADH detection head both demonstrate significant performance advantages in instance segmentation tasks. The jointly constructed MBLA-YOLO model not only enhances the precision of segmenting both the surface and edges of flower heads but also effectively controls model complexity. This achieves a favourable balance between accuracy and efficiency, exhibiting superior practicality and deployment potential. It is particularly well-suited for resource-constrained agricultural scenarios demanding high real-time performance.
Figure 10 illustrates the comparison between model predictions and measured averages across 100 plate samples. The horizontal axis denotes sample identification (Plant ID) for individual differentiation; the left vertical axis displays measured averages (mm, blue broken line), while the right vertical axis shows model predictions (mm, orange broken line). It can be observed that the predicted curve aligns closely with the measured curve at peak and trough positions, indicating the model effectively captures relative variation trends across samples. This correlates with the goodness-of-fit coefficient R2 = 0.95, signifying the model explains approximately 95% of measured value variation. Prediction errors were generally small for most samples (MAE = 0.64 mm, RMSE = 0.69 mm), with only a few samples exhibiting notable discrepancies. Predictions tended to be slightly lower than actual measurements in the high-value range, while some samples showed slightly higher predictions in the low-value range. However, no significant unidirectional systematic bias was observed overall. Furthermore, the magnitude of errors remained relatively stable across sample IDs, with no discernible drift phenomenon.
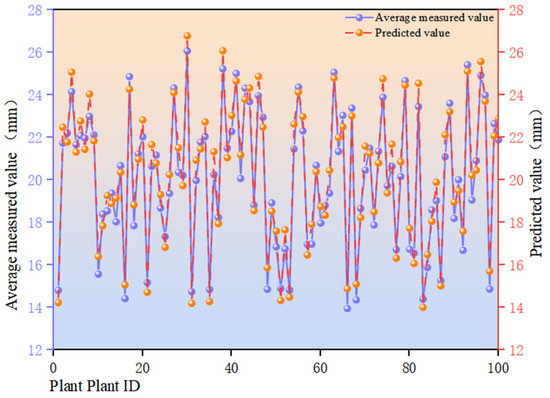
Figure 10.
Comparison of predicted and measured values for sunflower disc diameter in the sample.
Figure 11 presents a three-dimensional scatter plot of positive and negative residuals between measured and predicted values. The X-axis represents model predictions (mm), the Y-axis denotes measured averages (mm), and the Z-axis indicates residuals (mm). Red spheres denote positive residuals (model underestimation), blue spheres indicate model overestimation, while the grey plane signifies the ideal prediction state (zero residual). The results indicate that the residual point cloud exhibits broadly symmetrical distribution above and below the zero plane, with comparable numbers of positive and negative residuals, showing no significant overall unidirectional bias. Blue points demonstrate slightly greater vertical deviation than red points in certain samples, potentially indicating slightly larger error margins during overestimation. The residual distribution spans the entire magnitude range between predicted and measured values without clustering within specific intervals, though dispersion increases marginally in regions of extreme high and low values.
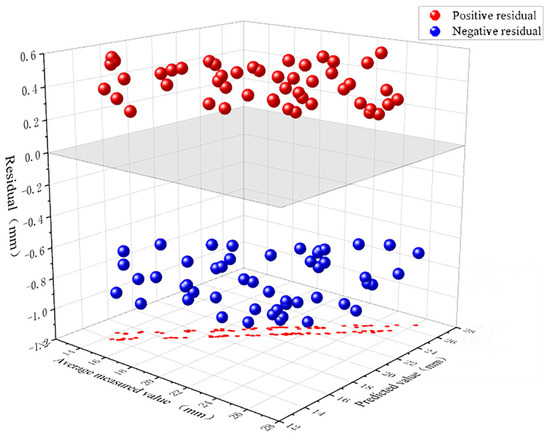
Figure 11.
Residual distribution plot for predicted pan diameter values, with red indicating underestimation and blue indicating overestimation.
The causes of the aforementioned phenomenon may include: an insufficient number of extreme value samples in the dataset, resulting in limited generalisation capability of the model in both high-value and low-value regions. The disc surface, as the central area of the flower head, exhibits a relatively flat structure but may feature central depressions or localised protrusions. These subtle undulations can vary significantly across different samples, particularly during the later stages of development, where disc thickness, density, and colouration fluctuate in response to pollen development status and humidity changes. Certain samples exhibiting large localised errors may stem from measurement inaccuracies, calibration discrepancies, or individual sample variations (such as morphological anomalies, uneven development, or external environmental factors). If extreme-value samples themselves contain substantial noise—for instance, due to damage to the central disk, surface contamination by foreign matter, or intense light reflection—this can further amplify residuals.
Furthermore, the disc surface’s numerous tubular flowers, complex textures, and high light-shadow contrast can cause features extracted by the model to deviate from actual morphology, with these variations not fully captured by the model. To address these issues, the proportion of samples exhibiting significant central variation, differing developmental stages, and morphological abnormalities should be increased during training to ensure the model adequately learns feature representations across various growth stages and structural states. During subsequent data collection, maintaining uniform illumination and avoiding strong reflective interference will enhance the consistency between captured images and actual morphology. Furthermore, to evaluate the model’s predictive performance across different structural types of the surface, the data has been segmented into the following ranges (low, medium, high values) for analysis. This provides targeted insights for model optimisation.
The numerical indicators in Table 4 demonstrate the model’s exceptional regression capability in predicting flower head size. With an R2 value as high as 0.95, the model accounts for the majority of variation in flower head size. The Mean Absolute Error (MAE) stands at 0.64 mm and the Root Mean Square Error (RMSE) at 0.69 mm. All three metrics indicate the prediction results possess high precision and practical applicability. This study not only analyses the model holistically but also conducts a stratified analysis across different flower head size intervals to further validate its robustness and stability.
Table 4.
Model Performance Evaluation Results for the Calyx Model Across Different p-Value Ranges.
The partitioned analysis revealed the model performed most effectively in the larger flower head range (p > 22 mm), exhibiting the lowest errors (MAE = 0.578 mm; RMSE = 0.631 mm). This indicates the model extracts features more stably and delivers accurate predictions when target structures are distinct and boundary contours well-defined. The high-precision predictions within this range also demonstrate the model’s strong generalisation capability when processing image targets with high contrast and structural integrity. In contrast, the medium-sized range (17 ≤ p ≤ 22 mm) exhibited a slight increase in error, with RMSE reaching 0.74 mm, suggesting some uncertainty in handling near-critical-sized pistils. Potential causes include reduced contour sharpness and less pronounced texture features within this size range, coupled with increased background interference in images. These factors collectively impacted the model’s accuracy in estimating boundary positions and dimensions. Within the small-size range (p < 17 mm), although the model’s predicted values were slightly underestimated, its overall fitting capability remained high (R2 = 0.742), with errors controlled within reasonable limits. Analysis suggests that smaller pollen heads exhibit limited pixel distribution within images, possess fewer structural details, and display weaker boundary-background contrast. Consequently, they are particularly susceptible to factors such as image resolution and minor imaging angle deviations, which complicate feature contour recognition and thereby compromise prediction accuracy.
Figure 12 presents a comparison of predicted values against measured averages (sorted by Plant ID). The horizontal axis denotes sample identification (Plant ID) for individual differentiation; the left vertical axis displays measured averages (mm, blue broken line), while the right vertical axis shows model predictions (mm, orange broken line). The predicted curve exhibits a high degree of consistency with the measured curve in overall trend. Predicted values closely align with measured values for the majority of samples, with only minor amplitude differences observed at isolated peaks and troughs. The model exhibits an R2 = 0.93 coefficient of determination for this metric, explaining approximately 93% of observed variance. The Mean Absolute Error (MAE) is 0.27 mm, while the Root Mean Square Error (RMSE) is 0.28 mm, indicating low error levels and high predictive accuracy and stability.
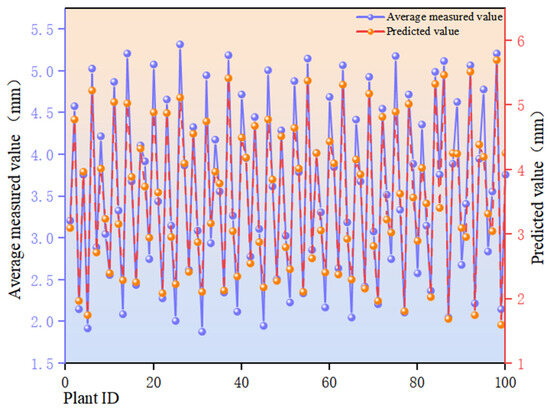
Figure 12.
Comparison of predicted and measured values for the edge thickness of sunflower discs in the sample.
Figure 13 depicts the three-dimensional distribution of positive and negative residuals between measured and predicted values. The X-axis represents model predictions (mm), the Y-axis denotes measured averages (mm), and the Z-axis indicates residuals (mm). Positive residuals (red spheres) signify model underestimation, while negative residuals (blue spheres) indicate overestimation. The grey plane represents the ideal prediction state. Residual points are uniformly distributed above and below the zero plane, with nearly equal numbers of positive and negative residuals, indicating no significant overall bias. The dispersion of overestimation and underestimation is relatively balanced, though residual fluctuations are slightly greater in extreme value regions. This suggests a slight reduction in prediction stability for samples exhibiting extreme morphological patterns at the disk margins.
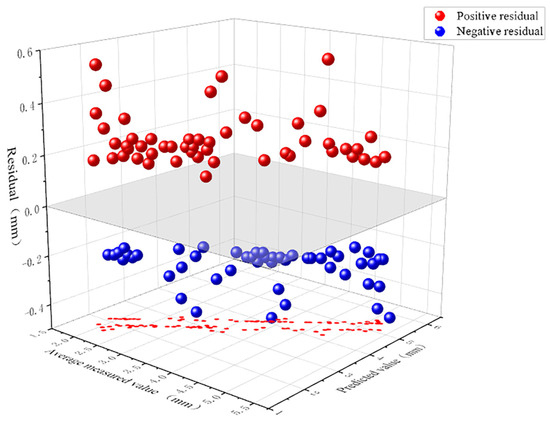
Figure 13.
Residual distribution plot for edge thickness predictions, simultaneously displaying underestimation (red) and overestimation (blue) scenarios.
The aforementioned issues may arise because the disc margins, as annular continuous structures, exhibit uneven surfaces and irregular geometric variations in some specimens. Whilst most samples provide stable and clear feature information for the model, their overall prediction accuracy falls short of that achieved for the disc surface. In specimens with extreme thickness or localised curling, the marginal contours become more susceptible to growth morphology and angular influences within the image, leading to increased edge detection errors.
Furthermore, samples exhibiting abnormal morphology (such as damage, disease spots, or uneven development) may present gaps or protrusions at the edges, introducing additional noise into predictions and amplifying residual errors. To address these issues, the proportion of thin-edged and morphologically anomalous samples can be purposefully increased to broaden the model’s training coverage of extreme forms. During imaging, uniform lighting should be maintained to minimise contour distortion. Regarding feature extraction, edge enhancement algorithms alongside geometric features such as local curvature and width variation rate can be employed to improve recognition of irregular edges. Furthermore, segmented data analysis (low, medium, high value intervals) has been supplemented to precisely evaluate prediction performance across different ranges.
The numerical indicators in Table 5 demonstrate that the model exhibits satisfactory fitting performance relative to the measured mean values. Overall trend analysis reveals that predicted and measured values fluctuate synchronously across plant ID dimensions, exhibiting highly consistent periodic variation characteristics. Minor deviations occur only at isolated sample points, with no systemic errors emerging. This indicates the model possesses robust trend capture capability and strong predictive stability, accurately reflecting the pattern of inflorescence characteristics across samples. Further spatial visualisation of prediction errors via three-dimensional residual plots revealed performance variations across different thickness intervals. Within the lower thickness range (b < 2.8 mm), predicted values exhibited a systematic tendency towards underestimation, with negative residuals concentrated in this zone. Conversely, positive deviations were observed in the higher thickness region (b > 3.5 mm). This asymmetric residual distribution indicates relatively weaker model fitting capability at boundary intervals, potentially attributable to uneven data distribution or insufficient data volume in these regions. The model demonstrated overall excellent performance, achieving an R2 value of 0.926, indicating strong explanatory power for the response variable.
Table 5.
Model performance evaluation results for the edge model across different p-value intervals.
Concurrently, the Mean Absolute Error (MAE) and Root Mean Square Error (RMSE) were 0.27 mm and 0.28 mm, respectively, keeping overall errors within a manageable range and demonstrating strong practical applicability. However, upon grouping samples by thickness intervals, the model’s goodness-of-fit diminishes across segments, particularly within the b < 2.8 mm range where R2 drops to 0.484, indicating markedly reduced predictive capability. This phenomenon arises not only from potential sample size limitations but also from inherent physical constraints in image recognition processes. Specifically, when the disc margin is thin, its contour area appears minute and blurred within the image. During actual capture, it is prone to partial occlusion by adjacent structures such as petals or leaf margins, leading to incomplete image information or unclear edge extraction. This not only compromises the accuracy of subsequent feature extraction but also introduces interference to model learning. Furthermore, as the disc margin occupies the image periphery, variations in illumination, shadow effects, and minor shifts in imaging sharpness may cumulatively introduce prediction errors. Particularly during automated image capture, non-standardised angles or focal lengths can further amplify recognition inaccuracies for smaller structures. In contrast, the thickness boundaries of medium to thicker regions (2.8 mm ≤ b ≤ 5 mm) exhibit clearer delineation, with contours more readily and stably recognisable within images. Consequently, models demonstrate greater reliability and stability within this range.
In summary, this study constructed predictive models based on two dimensions: disc diameter and edge thickness, systematically evaluating their overall and zoned-level predictive performance. Results indicate the model significantly outperforms edge thickness prediction in disc diameter estimation, achieving a coefficient of determination (R2) exceeding 0.95. It demonstrates high fitting accuracy and stability across all size intervals. The model’s effectiveness is particularly pronounced in larger flower head regions, primarily due to the inherent advantages of their overall structural morphology: regularity, near-circular shape, closed boundaries, and complete contours. This morphological characteristic facilitates easier segmentation and recognition of the target region within images. Consequently, it significantly reduces identification challenges arising from occlusion, reflections, and background interference during modelling, enabling the model to learn and converge more stably. In contrast, predicting petal edge thickness presents greater difficulty, exhibiting particular instability in low-thickness regions (e.g., b < 2.8 mm). The edge structure itself is minute and morphologically complex, prone to occlusion by surrounding petals, leaves, and other elements within the image. Furthermore, the edge contour is often difficult to extract precisely due to blurring, variations in illumination, or changes in viewing angle, resulting in incomplete feature representation. This limits the model’s accuracy and generalisation capability. Consequently, although the overall model has achieved a high standard, edge thickness prediction remains a relatively weaker aspect of the current system.
Figure 14 Visual comparison of detection results between the baseline YOLOv11n-seg model and the proposed MBLA-YOLO on sunflower heads. (a) Original image; (b) Detection results of the baseline YOLOv11n-seg; (c) Detection results of the proposed MBLA-YOLO.As evident from the figures, MLBA-YOLO achieves performance enhancements across multiple aspects. Firstly, in detecting the flower head region, MLBA-YOLO’s segmentation mask provides more complete coverage of the flower head area with more precise boundary localisation. Secondly, regarding the identification of flower head edge regions, the improved model effectively detects multiple edge areas, whereas the original model exhibits missed detections. This demonstrates MLBA-YOLO’s superior perceptual capability in recognising fine structural details. Furthermore, MLBA-YOLO demonstrates superior robustness in multi-object detection tasks, capable of simultaneously identifying multiple flower disk targets while maintaining high confidence levels. Overall, the improved model outperforms the original YOLOv11n-seg in detection accuracy, edge structure reconstruction capability, and multi-object recognition performance, rendering it more suitable for plant detection tasks involving complex structures in natural environments.
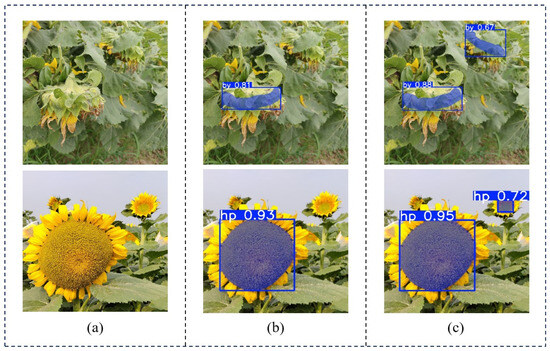
Figure 14.
Visual comparison of detection results between baseline YOLOv11n-seg and the proposed MBLA-YOLO on sunflower heads ((a) Original image; (b) Detection results of the baseline YOLOv11n-seg; (c) Detection results of the proposed MBLA-YOLO).
4. Discussion
The overall results of this study demonstrate that the proposed MBLA-YOLO model significantly outperforms the baseline YOLOv11n-seg in terms of accuracy, robustness, and efficiency. For the flower disk edge task, Precision, Recall, and mAP50 improved by approximately 3.2%, 2.3%, and 2.7%, respectively; for the disk surface task, improvements were approximately 2.7%, 1.9%, and 1.5%, respectively. Concurrently, the model’s parameter count decreased from 2.83 million to 2.69 million (a reduction of approximately 4.9%), while GFLOPs decreased from 10.2 G to 8.4 G (a reduction of approximately 17.6%). This achieves lightweight design and enhanced inference efficiency while maintaining high accuracy. Ablation studies further demonstrate that the CKMB module enhances feature extraction and boundary perception capabilities, while the LADH module significantly reduces model complexity whilst improving detection accuracy. The combination of both achieves optimal overall performance (pavement mAP50 = 0.986, edge mAP50 = 0.988), fully validating the synergistic gains and application potential of the proposed architecture. Please verify the accuracy of the calculated test values.
Experimental results validated the improved network architecture’s adaptability to complex field environments. However, variations in predictive performance across different measurement metrics and size ranges revealed both the method’s advantages and limitations in practical application. For diameter measurement, the overall R2 reached 0.95, with a Mean Absolute Error (MAE) of 0.64 mm and Root Mean Square Error (RMSE) of 0.69 mm, indicating the model’s effective capture of key geometric features of the flower head surface. Regarding partition performance, large-sized flower heads (p > 22 mm) exhibited optimal prediction (R2 = 0.76, MAE = 0.58 mm, RMSE = 0.63 mm), primarily due to their distinct boundaries, regular morphology, and high feature extraction stability. whereas errors increased for medium-sized (17 ≤ p ≤ 22 mm) and small-sized (p < 17 mm) flower heads. Small-sized targets exhibited reduced prediction accuracy. This may be related to limited pixel coverage, blurred contours, and higher susceptibility to occlusion, which warrants further validation with expanded datasets.
The overall R2 for edge thickness measurement was 0.93, with an MAE of 0.27 mm and an RMSE of 0.28 mm, similarly demonstrating high accuracy. However, partition analysis revealed significant under performance in the low-thickness range (b < 2.8 mm), where R2 was only 0.48 and a systematic negative bias was present. This may be associated with low pixel proportion in edge regions, occlusion effects, or sensitivity to illumination and resolution limits. Prediction performance was optimal in the medium thickness range (2.8–4 mm) (R2 = 0.71), slightly lower in thicker regions (b > 4 mm) (R2 = 0.65), indicating that boundary clarity and texture significantly influence thickness prediction. In contrast, diameter prediction exhibited relatively minor performance variations across different ranges, demonstrating the advantage of morphological structural features for model stability.
In terms of network architecture enhancements, the CKMB module improves the network’s ability to capture subtle curvature variations and textural details along the flower head margins during feature extraction, outperforming the traditional C3k2 module. The LADH detection head enhances spatial information decoupling through its asymmetric multi-branch structure, significantly improving both mask generation quality and localisation accuracy. The combined MBLA-YOLOv11-seg model outperforms baseline models in both diameter and thickness prediction, achieving lightweight efficiency by reducing parameter counts and computational demands while maintaining high precision. LADH not only improves segmentation accuracy but also demonstrates strong lightweight characteristics. Its simplified tri-branch structure (Figure 7) directly reduces parameters and computational cost, which is crucial for deployment in embedded and edge devices operating under resource constraints. It is worth emphasising that lightweight design is not merely an ancillary advantage of model architecture, but rather a prerequisite for deployment on edge computing platforms such as handheld devices and drones. This research effectively reduces model complexity through structural refinements, enabling high-precision real-time inference on computationally constrained devices. This enhances the feasibility and practical value of agricultural field applications.
Compared to conventional two-dimensional methods reliant on threshold segmentation and contour extraction, this approach employs organ-level recognition to distinctly separate the flower head from non-target areas. It combines deep point cloud measurement to obtain true geometric parameters and utilises interpolation upsampling to compensate for point cloud deficiencies caused by occlusion, thereby enhancing the stability of geometric analysis. This method shows potential scalability to other crops and may be deployed on drones and edge devices for real-time recognition and measurement, though further validation is needed.
In terms of application strategy, for equipment control scenarios such as agricultural mechanical harvesting, it is recommended to directly adopt the maximum distance obtained from two structural measurements as the critical dimension to ensure safety redundancy for gripping or cutting devices. Conversely, in plant phenotyping research and population structure analysis, robust statistical indicators such as averages are more suitable for accurately reflecting overall structural trends and variation characteristics. It should be noted that whilst a single lateral angle observation suffices to estimate both flower head thickness and diameter in this experimental measurement process, an additional frontal perspective was incorporated to validate diameter measurements, thereby ensuring rigorous results. This design, whilst increasing data acquisition and computational demands to some extent, enhances the reliability of conclusions. Future research may explore lightweight measurement approaches based on a single angle, provided accuracy is maintained. This could further reduce computational resource consumption and enhance the flexibility of system deployment.
Nevertheless, this study retains certain limitations. Variations in illumination during the image recognition phase may interfere with YOLO detection results, and the stability of predicting low-thickness, small-sized structures remains inadequate [38]. It should be noted that this study is primarily based on relatively uniform field conditions and has not yet been validated under varying planting densities. Future comparative experiments could be conducted in both dense (such as dense sunflower fields) and sparse environments to further examine the model’s robustness and adaptability under conditions of occlusion, blurred boundaries, and multiple targets.
Furthermore, in the prediction of geometric parameters based on point cloud data, this paper ultimately selected point cloud results processed through denoising and imputation as the predicted values for thickness and diameter. This choice was primarily based on their advantages in terms of morphological integrity and geometric continuity, which effectively mitigate the interference of anomalous noise points and missing regions on the fitting results, thereby enhancing measurement stability. Nevertheless, this choice does not imply that processed values universally outperform raw data. Under varying sample morphologies, noise distribution characteristics, and interpolation parameter settings, predicted values may still exhibit fluctuations.
Consequently, application of these results should involve comprehensive assessment considering practical requirements, tolerance for accuracy, and specific contextual factors to ensure methodological reliability and applicability. Future research may explore enhancing robustness by increasing the proportion of low-thickness and small-sized samples, incorporating edge enhancement or background suppression algorithms tailored for fine structures during image preprocessing, integrating multi-modal fusion of near-infrared and multispectral information, and implementing illumination normalisation. Concurrently, the method’s real-time performance and resource consumption on low-power edge computing platforms should be evaluated to ensure its feasibility and practical value for deployment on devices such as drones and mobile terminals.
5. Conclusions
This study proposes a non-contact measurement method for sunflower flower heads that integrates an enhanced MBLA-YOLOv11 model with deep point cloud analysis, enabling high-precision estimation of both flower head diameter and edge thickness. The approach demonstrates robust stability and adaptability in complex field environments, yielding particularly notable results for targets with well-defined structural boundaries. The introduced CKMB module and LADH detection head effectively enhance feature extraction and spatial perception capabilities while maintaining lightweight and efficient operation, demonstrating potential for widespread application in complex scenarios. Notably, this approach directly utilises dual-view data for measurement, circumventing cumbersome processes such as whole-plant 3D reconstruction, cross-view point cloud stitching, and redundant data fusion. This significantly reduces data processing complexity and computational resource consumption. Whilst a single side-view perspective suffices for obtaining both structural parameters, this study incorporates a front-view validation for rigorous verification, providing more reliable reference for subsequent applications.
Future research will focus on enhancing robustness to natural illumination variations through light normalization and multimodal spectral fusion. In addition, targeted strategies will be developed to improve the accuracy of edge thickness prediction in fine-scale structures, particularly under conditions of occlusion and morphological irregularities. Moreover, more detailed analysis will be conducted in dense sunflower fields and coarse-field environments, where overlapping plants, complex backgrounds, and uneven terrain pose additional challenges for non-contact measurement. Addressing these aspects will further strengthen the applicability and reliability of the proposed method in real-world agricultural scenarios.
Author Contributions
Q.W.: Writing—review and editing, Formal Analysis, Methodology, Data curation, Software, Writing—original draft, Conceptualization. K.L.: Software, Writing—original draft, Validation. B.C.: Data curation, Investigation, Writing—original draft. X.W.: Writing—original draft, Data curation, Project administration. K.L.: Methodology, Writing—original draft, Data curation. X.W.: Investigation, Validation, Writing—original draft. W.Z.: Writing—original draft, Writing—review and editing, Funding acquisition, Methodology. All authors have read and agreed to the published version of the manuscript.
Funding
This research received no external funding.
Institutional Review Board Statement
Not applicable.
Data Availability Statement
The raw data supporting the conclusions of this article will be made available by the authors on request.
Acknowledgments
We would like to express our sincere gratitude to Zhang for his careful guidance and strong support throughout the research project. We would also like to thank the team members for their hard work and contributions, as it is their efforts that have made this research project a success.
Conflicts of Interest
The authors declare no conflicts of interest.
References
- Tursunov, I.; Fayzullayev, A.; Jurayeva, S.; Azimova, G.A. Characteristics of the sunflower plant, its importance in agriculture and its role in food security. Ethiop. Int. J. Multidiscip. Res. 2023, 10, 167–174. [Google Scholar]
- Adeleke, B.S.; Babalola, O.O. Nutrition, Oilseed crop sunflower (Helianthus annuus) as a source of food: Nutritional and health benefits. Food Sci. Nutr. 2020, 8, 4666–4684. [Google Scholar] [CrossRef]
- Pilorgé, E.J.O. Sunflower in the global vegetable oil system: Situation, specificities and perspectives. OCL 2020, 27, 34. [Google Scholar] [CrossRef]
- Ali, K.A.M.; Huang, X.-m.; Zong, W.-y.; Abdeen, M.A. Mechanical structure and operating parameters of sunflower harvesting machines: A review. Machines 2020, 29, 143–153. [Google Scholar]
- Puttha, R.; Venkatachalam, K.; Hanpakdeesakul, S.; Wongsa, J.; Parametthanuwat, T.; Srean, P.; Pakeechai, K.; Charoenphun, N.J.H. Exploring the potential of sunflowers: Agronomy, applications, and opportunities within bio-circular-green economy. Horticulturae 2023, 9, 1079. [Google Scholar] [CrossRef]
- Centorame, L.; Gasperini, T.; Ilari, A.; Del Gatto, A.; Foppa Pedretti, E.J.A. An overview of machine learning applications on plant phenotyping, with a focus on sunflower. Agronomy 2024, 14, 719. [Google Scholar] [CrossRef]
- Sunoj, S.; Subhashree, S.; Dharani, S.; Igathinathane, C.; Franco, J.; Mallinger, R.; Prasifka, J.; Archer, D. Sunflower head, disc, and ray florets dimensions measurement using image processing. In Proceedings of the ASABE 2018 Annual International Meeting, Detroit, MI, USA, 29 July–1 August 2018. [Google Scholar]
- Sala, C.A.; Bulos, M.; Altieri, E.; Ramos, M.L. Sunflower: Improving Crop Productivity and Abiotic Stress Tolerance; Wiley: Sydney, NSW, Australia, 2012; pp. 1203–1249. [Google Scholar]
- Grompone, M.A. Sunflower and high-oleic sunflower oils. In Bailey’s Industrial Oil and Fat Products; Wiley: Sydney, NSW, Australia, 2005; pp. 1–54. [Google Scholar]
- Takács, P.; Slíz-Balogh, J.; Száz, D.; Horváth, G. East-facing Helianthus annuus has maximal number and mass of kernel-filled seeds: Seed traits versus head orientation. Plant Environ. Interact. 2022, 3, 130–139. [Google Scholar] [CrossRef]
- López Pereira, M.; Sadras, V.O.; Batista, W.; Casal, J.J.; Hall, A.J. Light-mediated self-organization of sunflower stands increases oil yield in the field. Proc. Natl. Acad. Sci. USA 2017, 114, 7975–7980. [Google Scholar] [CrossRef]
- Stepanenko, S.; Aneliak, M.; Kuzmych, A.; Kustov, S.; Lysaniuk, V. Improving the efficiency of harvesting sunflower seed crops. INMATEH Agric. Eng. 2022, 67, 331–340. [Google Scholar] [CrossRef]
- DeValk, E.M.; Koehler, B.D.; Hulke, B.S. Precision, quantitative measurement of sunflower capitulum inclination: A trigonometry-based approach. Agron. J. 2024, 116, 2783–2790. [Google Scholar] [CrossRef]
- Zhang, Y.; Zhang, N. Engineering, Imaging technologies for plant high-throughput phenotyping: A review. Front. Agric. Sci. Eng. 2018, 5, 406–419. [Google Scholar]
- Fieuzal, R.; Baup, F. Estimation of leaf area index and crop height of sunflowers using multi-temporal optical and SAR satellite data. Int. J. Remote Sens. 2016, 37, 2780–2809. [Google Scholar] [CrossRef]
- Sunoj, S.; Subhashree, S.N.; Dharani, S.; Igathinathane, C.; Franco, J.; Mallinger, R.; Prasifka, J.; Archer, D. Sunflower floral dimension measurements using digital image processing. Comput. Electron. Agric. 2018, 151, 403–415. [Google Scholar] [CrossRef]
- Chen, C.; Li, J.; Liu, B.; Huang, B.; Yang, J.; Xue, L. A robust vision system for measuring and positioning green asparagus based on YOLO-seg and 3D point cloud data. Comput. Electron. Agric. 2025, 230, 109937. [Google Scholar] [CrossRef]
- ISO 12232:2006; Photography—Digital Still Cameras—Determination of Exposure Index, ISO Speed Ratings, Standard Output Sensitivity, and Recommended Exposure Index. International Organization for Standardization: Geneva, Switzerland, 2006.
- Pouliot, D.; King, D.; Bell, F.; Pitt, D.G. Automated tree crown detection and delineation in high-resolution digital camera imagery of coniferous forest regeneration. Remote Sens. Environ. 2002, 82, 322–334. [Google Scholar] [CrossRef]
- Kaya, Y.; Jocic, S.; Miladinovic, D. Sunflower. In Technological Innovations in Major World Oil Crops; Springer: Berlin/Heidelberg, Germany, 2011; Volume 1, pp. 85–129. [Google Scholar]
- Seiler, G.J. Anatomy and morphology of sunflower. In Sunflower Technology and Production; Wiley: Sydney, NSW, Australia, 1997; Volume 35, pp. 67–111. [Google Scholar]
- Hastings, G.T. Common names of common plants: Plant lore from the dictionary. JSTOR 1937, 37, 1–9. [Google Scholar]
- Singh, D.; Sairam, R.; Srivastava, G.J. Activity of antioxidant enzymes in leaves and bracts of sunflower (Helianthus annuus L.). Indian J. Plant Physiol. 2004, 9, 36–41. [Google Scholar]
- Russell, B.C.; Torralba, A.; Murphy, K.P.; Freeman, W.T. LabelMe: A database and web-based tool for image annotation. Int. J. Comput. Vis. 2008, 77, 157–173. [Google Scholar] [CrossRef]
- He, J.; Ren, Y.; Li, W.; Fu, W. YOLOv11-RCDWD: A new efficient model for detecting maize leaf diseases based on the improved YOLOv11. Appl. Sci. 2025, 15, 4535. [Google Scholar] [CrossRef]
- Chen, Q.; Xiong, Q.; Huang, H.; Tang, S. An Efficient and Lightweight Surface Defect Detection Method for Micro-Motor Commutators in Complex Industrial Scenarios Based on the CLS-YOLO Network. Electronics 2025, 14, 505. [Google Scholar] [CrossRef]
- Zhong, W.; Li, X.; Yue, X.; Feng, W.; Yu, Q.; Chen, J.; Chen, B.; Zhang, L.; Cai, X.; Wen, J. A Classification Method for the Severity of Aloe Anthracnose Based on the Improved YOLOv11-seg. Agronomy 2025, 15, 1896. [Google Scholar] [CrossRef]
- Sangaiah, A.K.; Anandakrishnan, J.; Kumar, S.; Bian, G.-B. Point-KAN: Leveraging Trustworthy AI for Reliable 3D Point Cloud Completion with Kolmogorov Arnold Networks for 6G-IoT Applications. IEEE Internet Things J. 2025, 1. [Google Scholar] [CrossRef]
- Lyu, W.; Ke, W.; Sheng, H.; Ma, X.; Zhang, H. Dynamic downsampling algorithm for 3D point cloud map based on voxel filtering. Appl. Sci. 2024, 14, 3160. [Google Scholar] [CrossRef]
- Zhao, Q.; Gao, X.; Li, J.; Luo, L. Optimization algorithm for point cloud quality enhancement based on statistical filtering. J. Sensors 2021, 2021, 7325600. [Google Scholar] [CrossRef]
- Maćkiewicz, A.; Ratajczak, W.J.C. Geosciences, Principal components analysis (PCA). Comput. Geosci. 1993, 19, 303–342. [Google Scholar] [CrossRef]
- Mathai, A.; Davis, T. Constructing the sunflower head. Math. Biosci. 1974, 20, 117–133. [Google Scholar] [CrossRef]
- Tommasino, D.; Bottin, M.; Cipriani, G.; Doria, A.; Rosati, G. Development and validation of an end-effector for mitigation of collisions. J. Mech. Des. 2022, 144, 043301. [Google Scholar] [CrossRef]
- Qiu, T.; Wang, T.; Han, T.; Kuehn, K.; Cheng, L.; Meng, C.; Xu, X.; Xu, K.; Yu, J. AppleQSM: Geometry-Based 3D Characterization of Apple Tree Architecture in Orchards. Plant Phenomics 2024, 6, 0179. [Google Scholar] [CrossRef]
- Willmott, C.J.; Matsuura, K. Advantages of the mean absolute error (MAE) over the root mean square error (RMSE) in assessing average model performance. Clim. Res. 2005, 30, 79–82. [Google Scholar] [CrossRef]
- Hodson, T.O. Root mean square error (RMSE) or mean absolute error (MAE): When to use them or not. Geosci. Model Dev. 2022, 2022, 1–10. [Google Scholar] [CrossRef]
- Saunders, L.J.; Russell, R.A.; Crabb, D.P. The coefficient of determination: What determines a useful R2 statistic? Investig. Ophthalmol. Vis. Sci. 2012, 53, 6830–6832. [Google Scholar] [CrossRef] [PubMed]
- Pereira, M.I.R. A Machine Learning Approach for Predicting Docking-Based Structures. Master’s Thesis, Universidade do Porto, Porto, Portugal, 2020. [Google Scholar]
Disclaimer/Publisher’s Note: The statements, opinions and data contained in all publications are solely those of the individual author(s) and contributor(s) and not of MDPI and/or the editor(s). MDPI and/or the editor(s) disclaim responsibility for any injury to people or property resulting from any ideas, methods, instructions or products referred to in the content. |
© 2025 by the authors. Licensee MDPI, Basel, Switzerland. This article is an open access article distributed under the terms and conditions of the Creative Commons Attribution (CC BY) license (https://creativecommons.org/licenses/by/4.0/).