Article

Molecular and Agro-Morphological Diversity of Undercharacterized Local Bread Wheat Genetic Resources from Serbia and Bulgaria

by
Sanja Mikić
1,*,
Nikolai Kirilov Christov
2,3,
Stefan Tsonev
2,3,
Elena Georgieva Todorovska
2,3,
Dragana Trkulja
1,
Ankica Kondić-Špika
1 and
Verica Zelić
1
1
Institute of Field and Vegetable Crops, 21000 Novi Sad, Serbia
2
Department of Functional Genetics, Abiotic and Biotic Stress, AgroBioInstitute, Agricultural Academy, 1164 Sofia, Bulgaria
3
Center of Competence Agrifood Systems and Bioeconomy, 4000 Plovdiv, Bulgaria
*
Author to whom correspondence should be addressed.
Agriculture 2025, 15(20), 2127; https://doi.org/10.3390/agriculture15202127
Submission received: 16 September 2025 / Revised: 11 October 2025 / Accepted: 11 October 2025 / Published: 13 October 2025
(This article belongs to the Special Issue Genetic Diversity Assessment and Phenotypic Characterization of Crops)

Abstract

Unlocking the potential for adaptability across different conditions or environments of under-characterized local bread wheat from Serbia and Bulgaria remains critical for resilient breeding. This study aimed to assess the diversity and potential for adaptability of 76 accessions (35 from Serbia and 41 from Bulgaria) by integrating molecular and agro-morphological approaches. Plant height ranged from 101.1 cm in Bulgarian cultivars to 130.1 cm in Serbian landraces, while the flowering time varied from 134.9 days in Bulgarian cultivars to 139.7 days in Serbian landraces. SSR markers detected 446 alleles (mean 9.49 per locus; PIC = 0.646), with Serbian landraces exhibiting the highest allelic richness (7.23 alleles per locus) and 106 private alleles. Bayesian clustering and UPGMA analyses revealed clear genetic differentiation between Serbian and Bulgarian accessions, with Serbian landraces showing higher admixture and substructure. Principal coordinate analysis confirmed these patterns and highlighted the intermediate positions of pre-Green Revolution Serbian cultivars. The local wheat germplasm harbors high genetic diversity and potential for adaptability, particularly for traits critical to environmental resilience. These findings underline the value of local wheat germplasm as a resource for developing sustainable breeding and conservation strategies.

1. Introduction

Local wheat (Triticum aestivum L.) cultivars and traditional landraces featuring unique genetic characteristics are of global interest as they contribute to the universal crop diversity heritage. While landraces were shaped for centuries by farmers and specific local environmental selection pressure, old cultivars were developed through breeding for lower-input farming several decades ago [1]. They both, however, harbor greater heterogeneity and broader adaptation than modern cultivars, which, on the other hand, have undergone intensive selection for yield and uniformity, and have been tailored for high-input industry-oriented cultivation [2,3]. Indeed, molecular analyses of wheat landraces from Eastern Europe and the Black Sea region have confirmed their high allelic diversity and substantial agro-morphological variability, highlighting their untapped potential for breeding programs [4].
The expansion of modern high-yielding cultivars during the 20th century, particularly in the Green Revolution era, resulted in the widespread loss of local wheat cultivars and traditional landraces. This replacement process reflects the phenomenon of crop genetic erosion, in which the substitution of diverse, locally adapted germplasm with uniform modern cultivars leads to a progressive narrowing of crop diversity at global and regional scales [5]. In wheat, the consequences of genetic erosion have been particularly severe: genome-wide SNP (single-nucleotide polymorphism) analyses of Central European germplasm revealed an approximate 97% loss of allelic diversity within just six decades of modern breeding [6]. Comparable trends were observed in Bulgaria, where genomic analyses of wheat genetic resources demonstrated clear genetic differentiation between older landraces and modern cultivars, with the former exhibiting shorter linkage disequilibrium decay and higher allelic richness [7]. By narrowing the crop genetic base and reducing on-farm diversity, modern agricultural systems are becoming more vulnerable to biotic stresses and environmental fluctuations.
The Balkan region harbors rich wheat diversity, with Serbia and Bulgaria in particular maintaining a broad spectrum of local wheat cultivars well into the mid-20th century, largely due to long-standing traditions of small-scale farming [8]. In the second half of the 20th century, they began to be replaced by modern cultivars in fertile lowland areas and persisted longest in marginal environments less suited to intensive agriculture [9]. Despite this decline, both countries made substantial efforts to collect and safeguard traditional wheat germplasm in gene banks. Such efforts align closely with international frameworks, including the Convention on Biological Diversity, the International Treaty on Plant Genetic Resources for Food and Agriculture, and the Sustainable Development Goals, which emphasize the critical role of genetic resource conservation in sustainable development [10]. Their genetic diversity provides essential raw material for breeding programs addressing challenges such as climate change, emerging diseases, and the need for low-input agriculture [11].
Studies across the Mediterranean basin, including analyses of durum wheat landraces, have shown strong geographic structuring and high allelic diversity, reflecting adaptation to local climates and potential for breeding stress-resilient lines [12,13,14]. These studies illustrate the broader adaptive value of traditional germplasm and highlight the importance of undertaking similarly detailed studies for traditional local bread wheat. Despite their importance, landraces remain largely undercharacterized, which constrains their effective use in pre-breeding and breeding programs. Comprehensive studies that combine multiple molecular markers with phenotyping across Serbian and Bulgarian collections are still scarce. Most previous studies of local bread wheat germplasm in this region have relied either on SSR (simple sequence repeat) markers or SNP genotyping, or were confined to material from a single country [15,16,17]. Bulgarian wheat germplasm has been more extensively characterized, with larger-scale and more detailed molecular and phenotypic studies compared to those available for Serbian accessions [7,18,19]. Analyses of older Bulgarian cultivars revealed higher allelic richness than modern semi-dwarf cultivars, reflecting post-Green Revolution genetic bottlenecks [18]. Recent research emphasizes that combining SSR markers with detailed phenotyping is necessary to capture adaptive diversity, particularly for climate-relevant traits [19]. This disparity highlights the need for detailed studies on the landraces collected in Serbia to balance the regional knowledge base and fully utilize these genetic resources.
Important agronomic traits that directly affect wheat adaptation and productivity are plant height and flowering time [20]. Plant height influences crop performance and lodging susceptibility [21]. Flowering time is equally critical for environmental adaptation. Early-flowering cultivars may escape terminal drought and heat stress [22], while later-flowering types benefit from longer grain filling, resulting in improved yield and grain quality [23,24,25]. Maintaining variation in these traits within local traditional germplasm is therefore essential for balancing grain production with multifunctional roles and for sustaining resilience under diverse and changing agro-ecological conditions. This study applies both SSR markers and high-density SNP genotyping, together with agro-morphological trait assessments, on the same set of accessions, providing complementary insights into genetic diversity and adaptive traits. The results will not only provide insights into the genetic structure of wheat genetic resources from this region but will also highlight their potential role in strengthening food security and crop improvement under changing climatic conditions.
The primary aim of this study is to provide a thorough characterization of bread wheat landraces and traditional cultivars from Serbia and Bulgaria by applying molecular markers (SSR and high-density SNP arrays) alongside key agro-morphological traits. Specifically, we seek to (i) assess the genetic diversity and population structure of these genotypes, (ii) evaluate adaptive phenotypic variation relevant to agronomic performance (i.e., plant height, flowering time), (iii) elucidate the relationships between genetic makeup, phenotypic traits, and geographic origin to uncover patterns of adaptation and historical differentiation, and (iv) highlight the value of local wheat landraces as unique genetic reservoirs with significant potential for future breeding and conservation efforts. By adopting this integrated approach, this study aims to fill critical knowledge gaps. It also advances the conservation and sustainable utilization of these genetic resources, supporting future wheat improvement and food security endeavors.

2. Materials and Methods

2.1. Plant Material

A total of 76 bread wheat accessions were analyzed, comprising 35 collected and maintained in Serbia (including accessions originally from the former Yugoslavia, i.e., such as present-day Serbia and Croatia, as well as accessions that were historically grown more widely, including in Hungary) and 41 collected in Bulgaria. The set included both traditional cultivars and local landraces, representing the historical diversity preserved in national gene banks and research collections (Supplementary Table S1). The plant material was provided by the Institute of Field and Vegetable Crops, Novi Sad, and the gene bank of the Institute of Plant Genetics and Resources, Sadovo. Passport data for each accession, including geographic origin (latitude, longitude, and elevation where available), collection site, and year of introduction, were compiled to support geographic analyses. The materials were selected to maximize representation of the diversity present in both countries, spanning different eco-geographical zones and historical breeding backgrounds.

2.2. Phenotypic Evaluation

Field trials were conducted at the Institute of Field and Vegetable Crops, Novi Sad, Serbia, at the Rimski šančevi experimental station (45°19′26″ N, 19°50′31″ E) during two consecutive growing seasons (2021/22 and 2022/23). Sowing was performed on 21 October 2021, and 25 October 2022, within the recommended sowing period for wheat in Serbian agro-ecological conditions. Trials were arranged in a randomized complete block design with three replicates. Each accession was grown in 5 m2 plots, with standard agronomic practices applied uniformly across the field. Flowering time (FT) was recorded as the number of days from January 1st until anthesis (Zadoks growth stage 65), defined as the stage when 50% of plants within a plot reached flowering. Observations were made visually at the plot level. Plant height (PH) was measured at maturity as the distance from the soil surface to the tip of the spike (excluding awns). For each plot, 5–10 representative plants were measured, and mean values were calculated. Trait definitions for plant height and flowering time followed Crop Ontology CO_323:0000012 and CO_323:0000024, respectively. For each accession, phenotypic data for FT and PH were averaged across replicates and across the two seasons.

2.3. Molecular Characterization

Seeds were germinated on moist filter paper in Petri dishes at 22 °C with a 16 h light/8 h dark photoperiod and ~70% relative humidity. Young leaf tissue was collected from 10-day-old seedlings for DNA extraction. Genomic DNA was extracted using a standard CTAB protocol [26]. DNA quality was assessed by agarose gel electrophoresis and quantified spectrophotometrically. A total of 47 polymorphic SSR markers distributed across the 21 wheat chromosomes were used to assess genetic diversity. Total PCR mix contained 25 ng genomic DNA, 1× Taq buffer with KCl, 2 mM MgCl2, 0.2 mM dNTPs, 1U recombinant Taq DNA polymerase and 0.5 pmol of each primer (Thermo Fisher Scientific, Wilmington, DE, USA). The specific cycling conditions for each marker, including annealing temperatures, are provided in Supplementary Table S2. The list of primers used for SSR marker amplification [27,28,29] are detailed in the Supplementary Table S3. Amplification products were separated by capillary electrophoresis on ABI Prism 3130 (Thermo Fisher Scientific, Wilmington, DE, USA). The 10 μL reaction volume for fragment analysis contained 2 μL mixtures of differently labelled PCR products, 0.2 μL GeneScan500 LIZ size standard (Thermo Fisher Scientific, Wilmington, DE, USA) and 7.8 μL Hi-Di™ formamide (Thermo Fisher Scientific, Wilmington, DE, USA). The allele sizes were scored using GeneMapper v4.0 software (Thermo Fisher Scientific, Wilmington, DE, USA). All accessions were genotyped using the Illumina 25K Infinium iSelect SNP array, which interrogates 25,000 polymorphic SNP loci distributed across the wheat genome. Genotyping was performed at SGS—Institut Fresenius TraitGenetics Section, following the manufacturer’s protocol. Raw data were filtered to remove monomorphic markers, loci with >10% missing data, and markers with minor allele frequency < 0.05 using TASSEL v5.0 [30].

2.4. Data Analysis

The variability in plant height and flowering time was evaluated to illustrate the diversity of agro-morphological traits among the studied accessions. Descriptive statistics were calculated in XLSTAT v2025.1 (Addinsoft, Paris, France) and presented separately for the two growing seasons (2021/2022 and 2022/2023) as well as for accession status (cultivars vs. landraces). Summary statistics (mean, range, standard deviation, and coefficient of variation) were calculated for each accession, with values averaged across replicates and years to capture the extent of trait variability. In addition, analysis of variance (ANOVA) was conducted to test for significant differences among accessions, treating accession as a fixed effect and replicates and years as random effects. A Type III ANOVA, which is robust to unequal sample sizes, was employed to account for the differing numbers of observations across groups. When significant variation was detected, Tukey’s honestly significant difference test was applied for post hoc pairwise comparisons at the 0.05 significance level. All statistical analyses were performed in R v4.5.1 using the package agricolae.
Genetic diversity and population structure were assessed using 47 polymorphic SSR markers scored across the 76 hexaploid wheat accessions. Standard genetic diversity parameters were calculated, including the number of alleles per locus, mean alleles per locus, number of private alleles, frequency of rare alleles (<5%), major allele frequency (MAF), observed heterozygosity (Ho), expected heterozygosity (He), and polymorphism information content (PIC). These parameters were calculated using Power Marker v3.25 software [31].
The genetic structure of the collection was inferred using a Bayesian clustering approach implemented in STRUCTURE v2.3.4. [32,33]. Ten independent runs were performed for each K value ranging from 1 to 10, applying an admixture model with correlated allele frequencies. Each run consisted of a burn-in period of 50,000 iterations and 2,000,000 MCMC replicates. The most likely number of clusters (K) was determined using the LnP(K) and ΔK methods of Evanno et al. [34] as implemented in StructureSelector server [35]. The visualization of the resulting clusters was carried out using a docker implementation of pophelperShiny v2.1.1 [36].
Genetic relationships among accessions were further evaluated by cluster analysis based on Nei83 DA genetic distance matrix [37]. An UPGMA dendrogram was constructed by Power Marker v3.25 software [31] using the unweighted pair group method with arithmetic mean. The resulting tree was visualized and annotated by using the Evolview v2 webserver [38].
A genetic distance matrix for the SNP dataset was first calculated in TASSEL v5.0 [30]. Principal Coordinate Analysis (PCoA) was then performed in R using the ape package v5.8-1 on this distance matrix. The resulting coordinates were visualized with ggplot2 package v4.0.0 to illustrate the distribution of Serbian and Bulgarian accessions in reduced dimensional space. SNP data were used solely to evaluate genetic relationships and population structure among accessions.
Both molecular and phenotypic analyses were performed on the same set of accessions, while the datasets were analyzed independently.

3. Results

3.1. Phenotypic Variation of Plant Height and Flowering Time

Levene’s test confirmed homogeneity of variances for plant height and flowering time (p = 0.202 and p = 0.981, respectively). Plant height ranged from 63 cm to 149 cm, with mean values of 100.9 cm (Bulgarian cultivars), 111.4 cm (Serbian cultivars), and 130.1 cm (Serbian landraces) (Table 1). The Bulgarian cultivars showed the larger variability in terms of value range, variance and standard deviation.
ANOVA indicated significant effects of group, year, and their interaction on height (all p < 0.001). Tukey post hoc tests revealed that all pairwise differences were significant: Serbian landraces were tallest, 29 cm taller than Bulgarian cultivars and 19 cm taller than Serbian cultivars; Serbian cultivars were 10 cm taller than Bulgarian cultivars (Table 2).
Flowering time varied less, with means of 133.8, 135.5, and 139.7 days for Bulgarian cultivars, Serbian cultivars, and Serbian landraces, respectively. Among the studied groups, Serbian landraces exhibited the highest variability, evident in their broader value range, increased variance, and higher standard deviation (Table 1). ANOVA showed a significant group effect, year and interaction (Table 2). Tukey tests indicated that Bulgarian cultivars flowered significantly earlier than both Serbian cultivars and Serbian landraces, while Serbian cultivars flowered significantly earlier than the landraces.
ANOVA results indicate that, the effects of the group and the season are very large (partial η2 = 0.62 and partial η2 = 0.56, respectively), while the group × year interaction has a moderate effect (partial η2 = 0.21), highlighting the strong influence of genetic background and annual conditions on plant height. For flowering time, the effects are more evenly distributed, with the group explaining a smaller portion of variance (partial η2 = 0.14), the year having a moderate effect (partial η2 = 0.25), and the interaction showing a moderate-to-large effect (partial η2 = 0.32), consistent with the observed differences among cultivars and landraces across years.

3.2. Genetic Diversity Within Cultivars and Landraces Based on SSR Markers

The 47 SSR loci revealed substantial diversity, which was further compared among Bulgarian cultivars, Serbian cultivars and landraces (Table 3). In total, 446 alleles were detected, with the number of alleles per locus ranging from 3 (Xbarc1096_4B) to 22 (Xwmc607_7A) and a mean of 9.49 alleles per locus (Supplementary Table S4). Mean gene diversity (GD) was 0.675, with values spanning from 0.460 (Xcfd3_5D) to 0.887 (Xwmc607_7A). Polymorphism information content (PIC) values followed a similar pattern, averaging 0.646 and ranging from 0.391 to 0.886. Observed heterozygosity was generally low (mean = 0.201), although some loci, such as Xgwm408_5B (0.711), showed higher values. Genome-wise comparisons revealed slightly higher diversity within the B genome (mean GD = 0.698; mean PIC = 0.668) relative to the A genome (GD = 0.658; PIC = 0.629), while the D genome exhibited the lowest diversity (GD = 0.628; PIC = 0.603). Overall, SSR markers were highly informative, with >50% of loci exhibiting PIC >0.70. The highest diversity was captured by markers such as Xwmc607_7A (22 alleles, PIC = 0.886) and Xwmc14_7D (PIC = 0.833), while several loci showed reduced informativeness (e.g., Xbarc1096_4B, PIC = 0.391).
Group-level comparisons revealed clear contrasts in SSR diversity among the three sets of accessions (Table 3). Serbian landraces exhibited the highest allelic richness per locus (7.23) and the greatest expected heterozygosity (He = 0.675), alongside the highest PIC (0.671) and the lowest major allele frequency (MAF = 0.429). They also contained the largest number of private (106) and rare alleles (73, <5%).
Bulgarian cultivars, despite a larger sample size (n = 41), displayed lower diversity indices (alleles/locus = 5.89, He = 0.566, PIC = 0.534) but still harbored 42 private alleles and 45 rare alleles. Serbian cultivars (n = 21) were intermediate, with moderate allelic richness (5.36 alleles/locus), He = 0.602, PIC = 0.597, 30 private alleles, and 18 rare alleles.

3.3. Genetic Diversity Within Cultivars and Landraces Based on SNPs

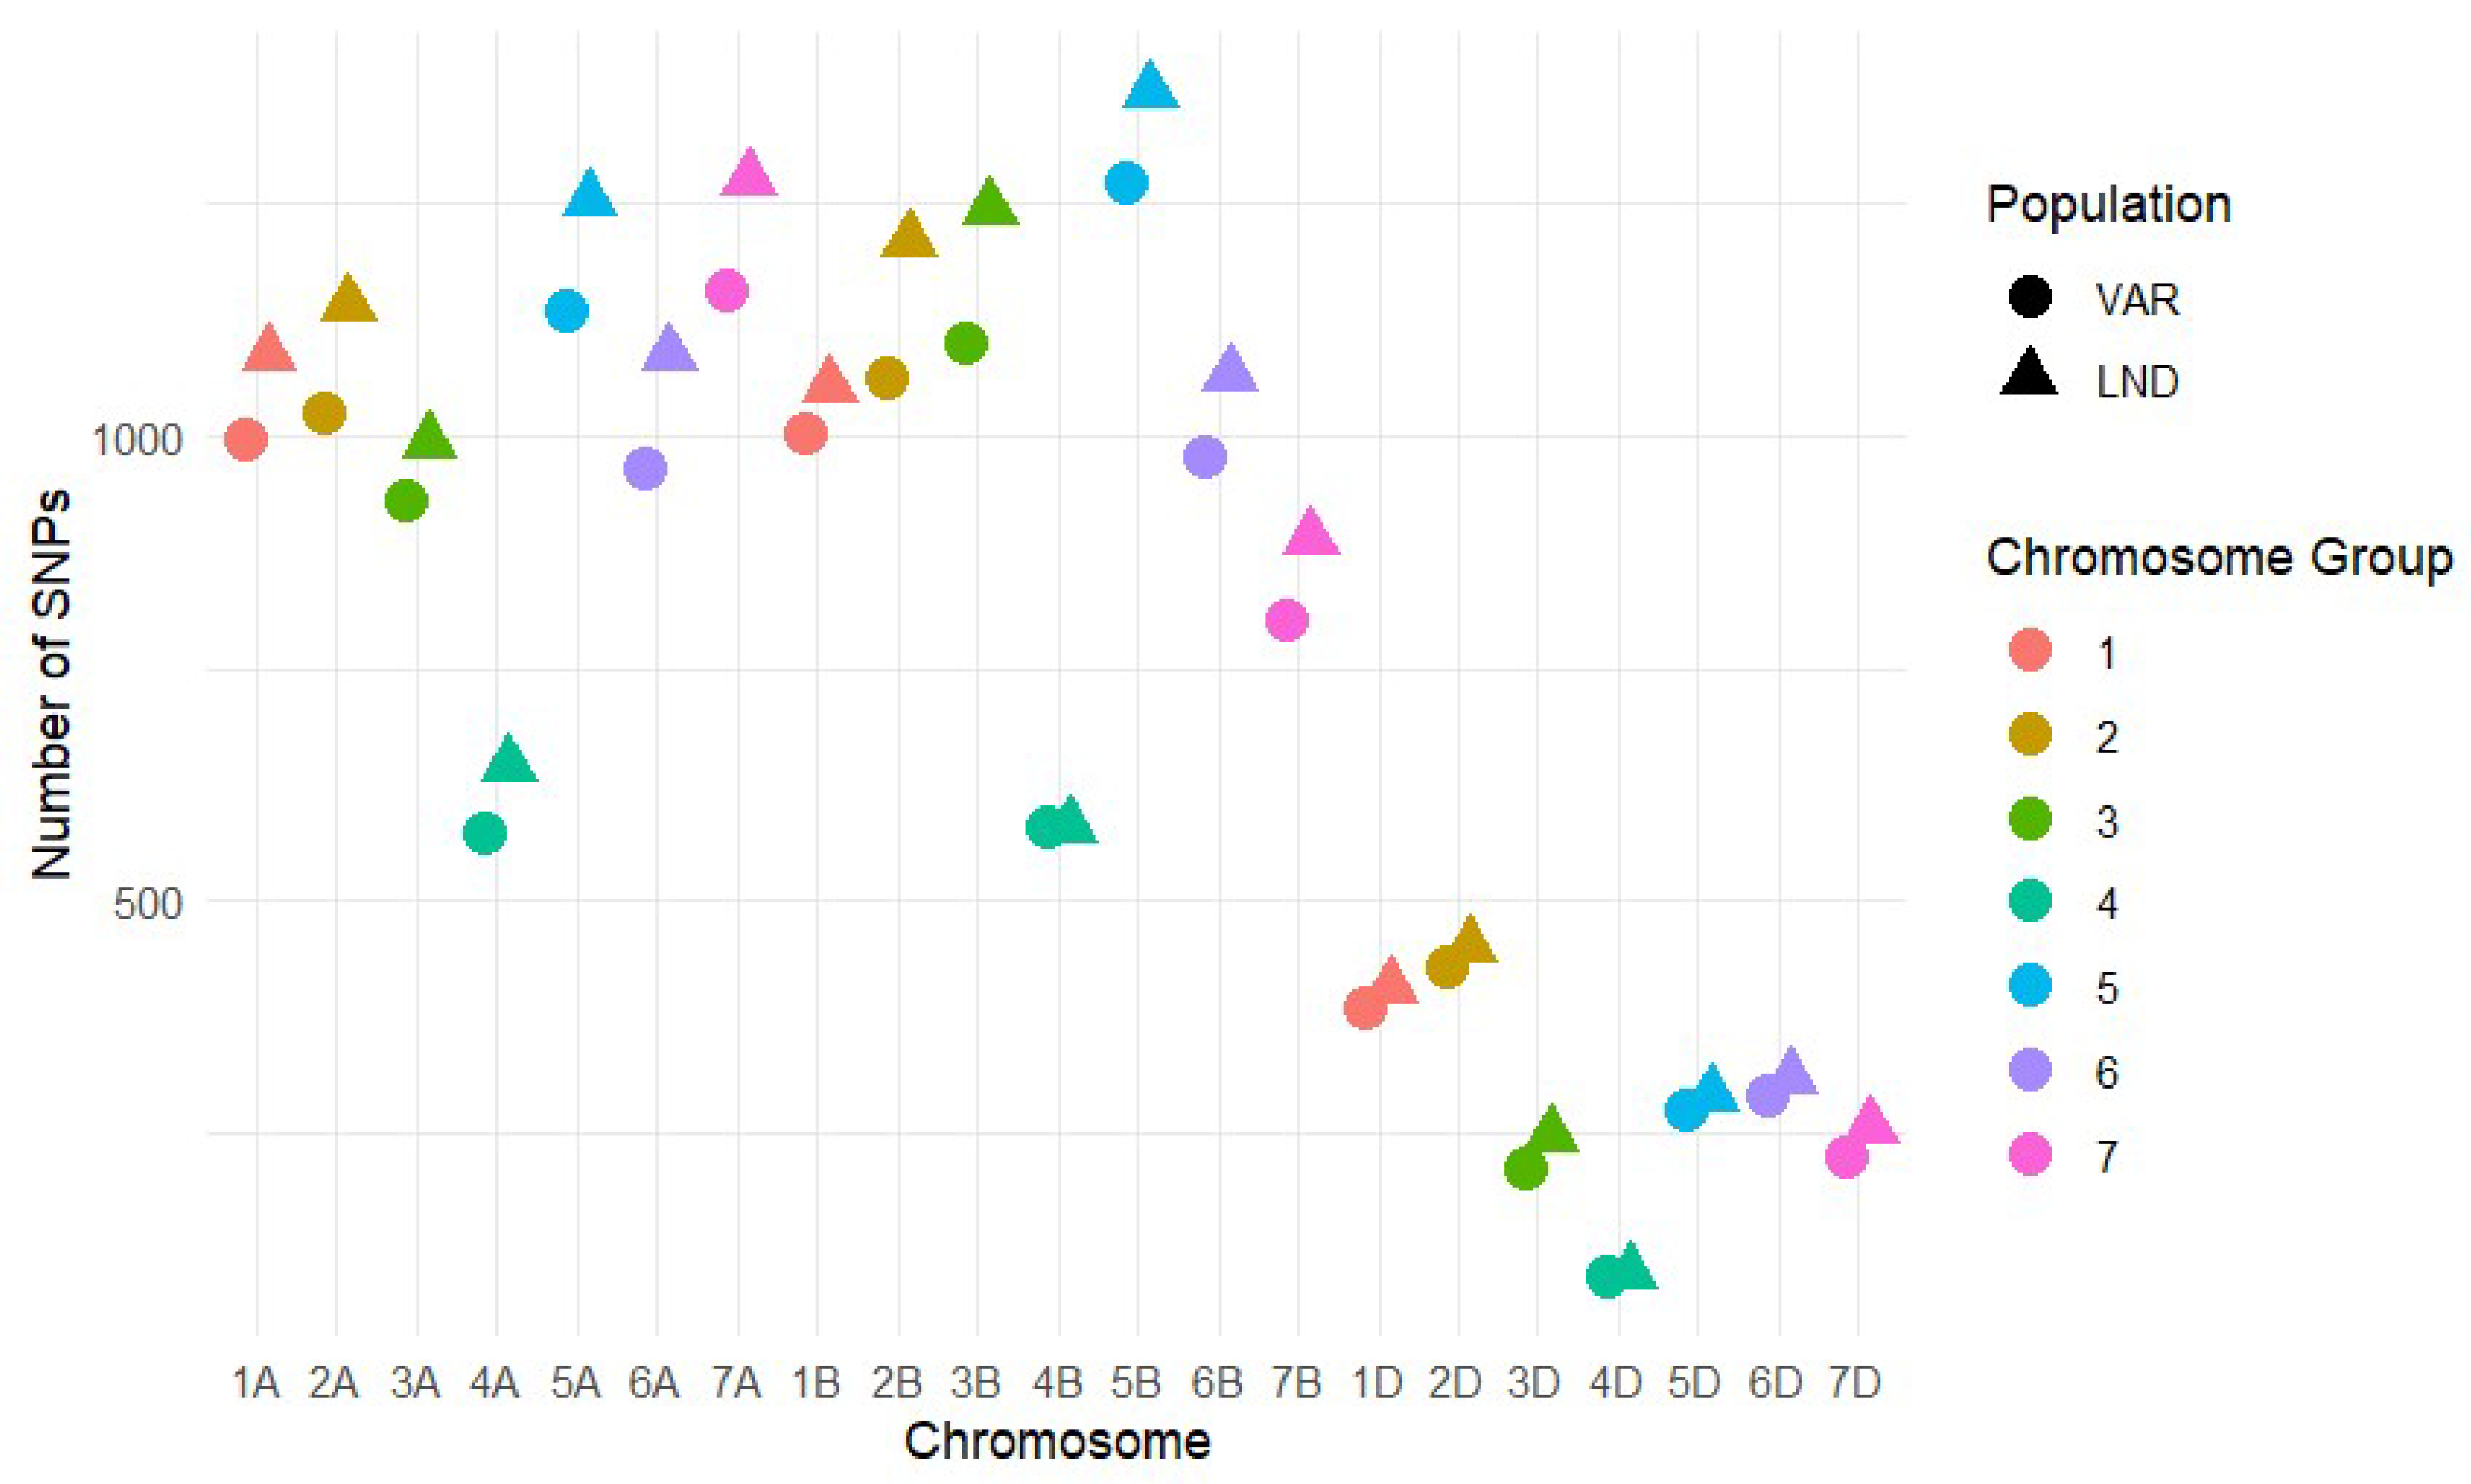
The genotyping using the Illumina 25K Infinium iSelect SNP array revealed a total of 16,948 high-quality SNPs that were retained after filtering across the 76 hexaploid wheat accessions. These SNPs were distributed across all 21 wheat chromosomes, ranging from 97 sites on chromosome 4D to 1323 on 5B, ensuring coverage of all three wheat subgenomes (A, B, D). The markers were most abundant in the A genome (44.2%), followed by the B genome (43.5%), while the D genome showed the lowest proportion (12.3%) (Figure 1).
To assess variability within groups, filtering was applied separately to landraces and cultivars. A total of 16,205 SNPs were detected in the 21 landraces, compared with 15,484 SNPs in the 55 cultivars. Despite their smaller sample size, landraces retained a higher number of SNPs, reflecting their broader genetic diversity. Chromosome-level comparisons showed the lowest SNP counts on group 4 for both sets (1322 in landraces and 1246 in cultivars), whereas the largest numbers were observed on chromosome group 5, with 2914 SNPs in landraces and 2683 SNPs in cultivars (Figure 2).

3.4. Population Structure and UPGMA Analysis

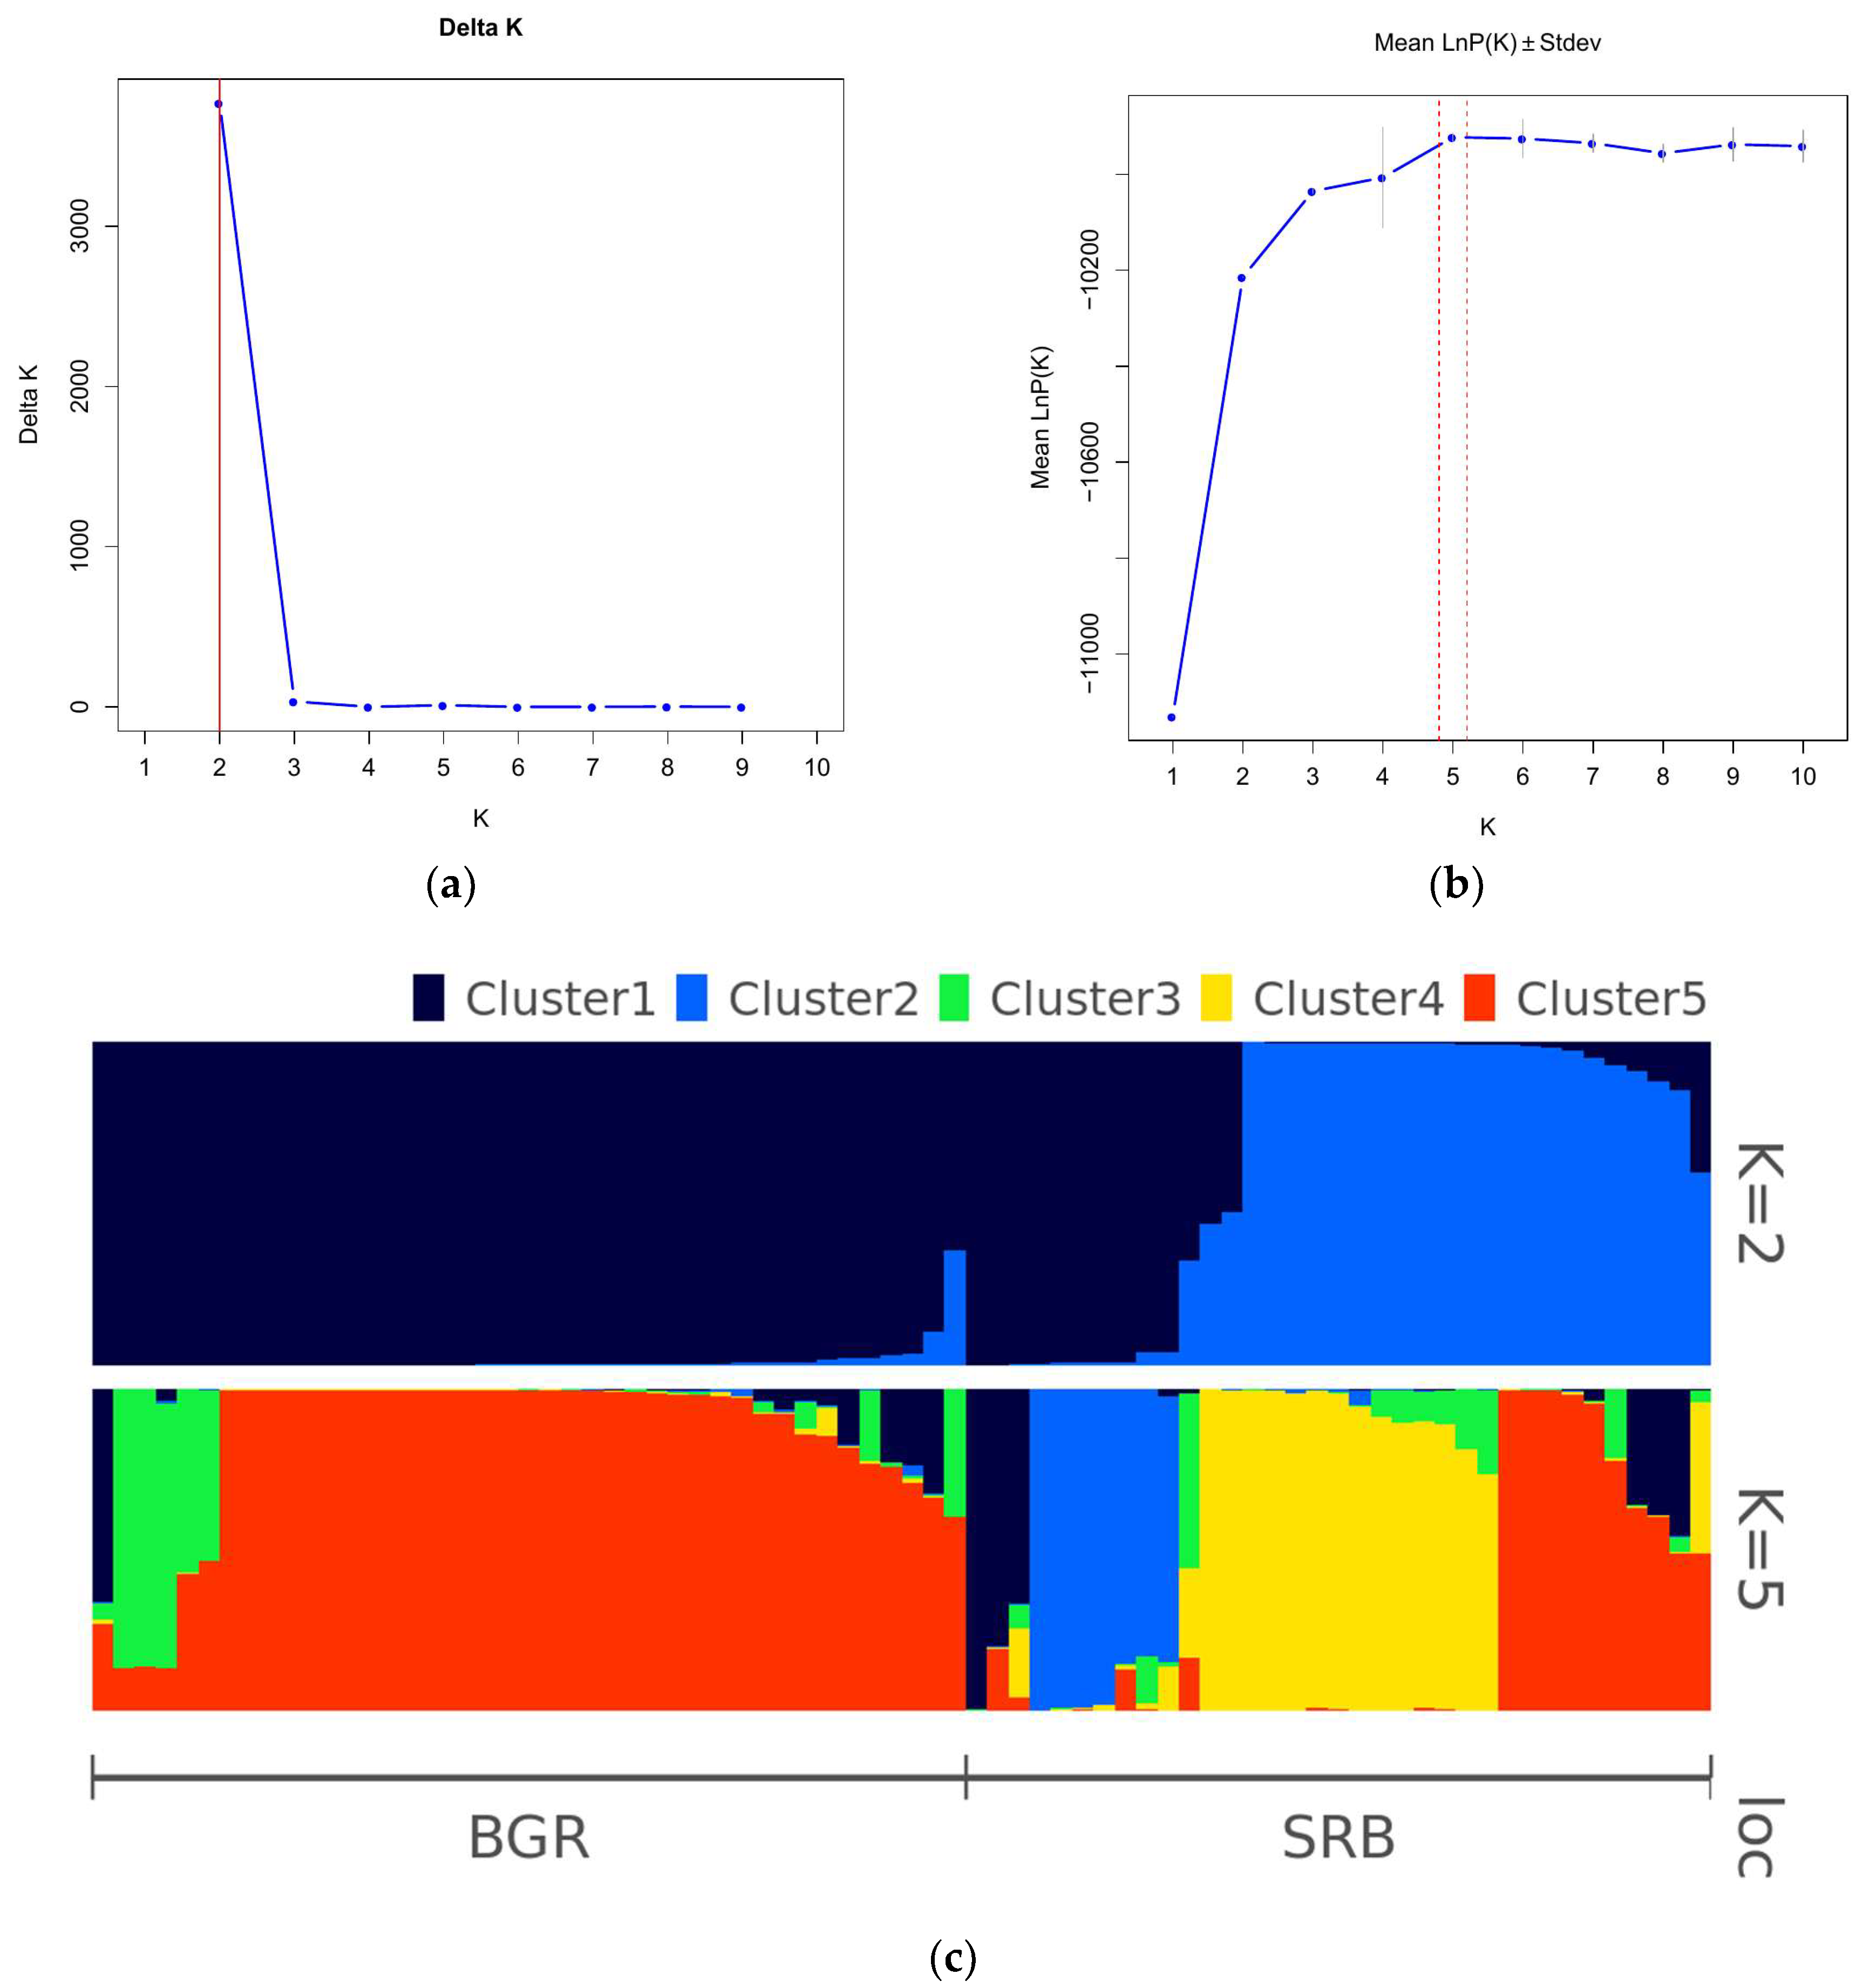
Population structure was investigated using a Bayesian clustering approach. The ΔK method identified the strongest signal at K = 2 (Figure 3a), whereas the log-likelihood values (LnP(K)) continued to increase until K = 5 (Figure 3b), suggesting additional substructure beyond the primary division. At K = 2, the accessions clearly separated into two major genetic groups corresponding broadly to their geographic origin.
Bulgarian accessions were predominantly assigned to one cluster, while Serbian accessions were assigned mainly to the second cluster, with a portion of individuals showing mixed ancestry. At K = 5, a finer substructuring of the collection was observed (Figure 3c). Within the Bulgarian set, most accessions grouped into two clusters, with limited admixture. In contrast, Serbian accessions exhibited higher genetic heterogeneity, forming multiple clusters with notable admixture patterns.
Several Serbian accessions displayed mixed membership across clusters, reflecting either shared ancestry or gene flow between groups. Overall, the STRUCTURE analysis revealed a primary genetic differentiation between Bulgarian and Serbian accessions (K = 2), with evidence for further subdivision, especially among Serbian wheat (K = 5). The higher level of admixture observed in Serbian accessions suggests a more complex breeding history and possibly greater genetic exchange with diverse germplasm sources.
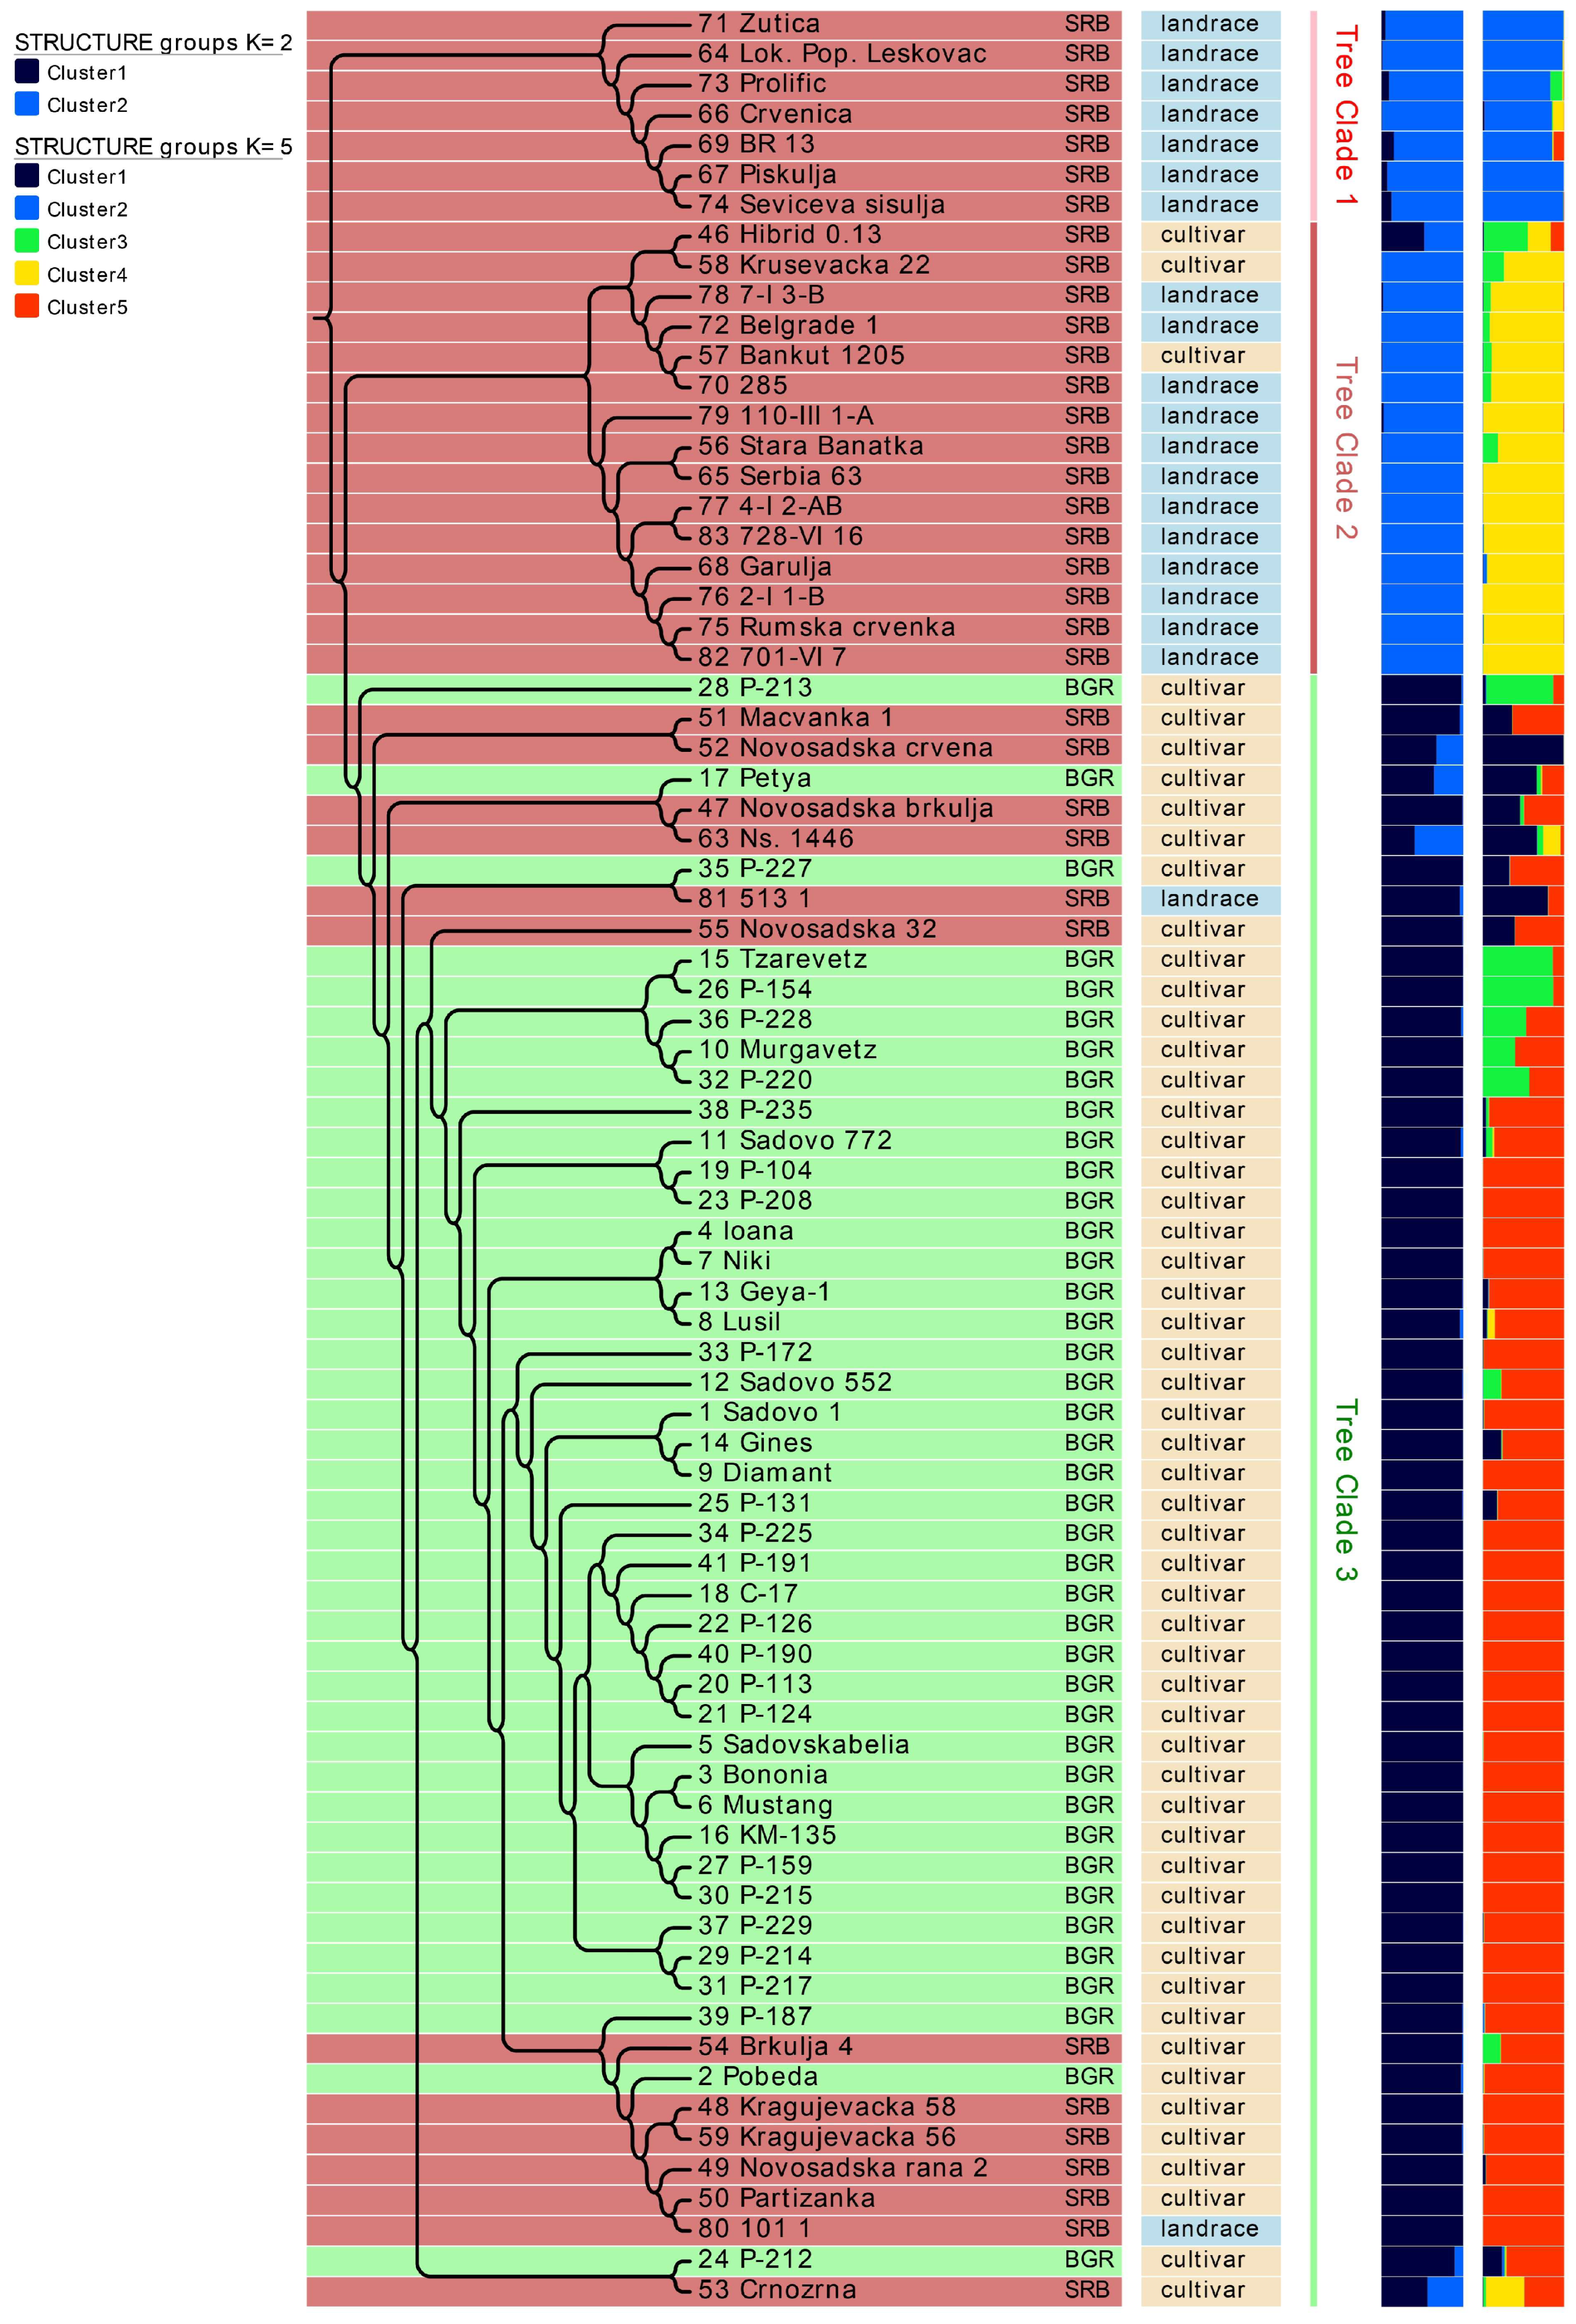
The UPGMA dendrogram constructed from 47 SSR markers for the 76 hexaploid wheat accessions revealed a clear hierarchical genetic structure, broadly reflecting geographic origin, breeding history, and accession type (Figure 4). The first major branching separated a distinct cluster consisting of seven Serbian landraces, which diverged early from the rest of the collection. This group corresponds closely with one of the STRUCTURE clusters identified at K = 5, highlighting its unique genetic identity and relatively isolated evolutionary history. The second major split divided the remaining accessions into two primary branches. One branch contained all remaining accessions from Serbia, predominantly landraces (n = 11), with a few cultivars (n = 4) interspersed. Notably, these cultivars—Krusevacka 22, Rumska crvenka, Hibrid 0.13, and Bankut 1205—either originated from a local landrace (Stara Banatka) or were pre-Green Revolution crosses lacking reduced-height Rht genes and widely cultivated in the Pannonian lowlands, reflecting their historical breeding context. Their inclusion alongside landraces underscores shared ancestry and limited introduction of modern breeding alleles in these lines. The other major branch encompassed the remaining genotypes, primarily Bulgarian and Serbian cultivars along with two Serbian landraces (101/1 and 513/1). Within this branch, several relatively small subclusters (2–7 accessions each) were observed, combining Serbian and Bulgarian accessions, which suggests historical admixture or shared breeding backgrounds. A large central group of Bulgarian cultivars formed a cohesive cluster, indicating relatively low internal divergence and strong genetic similarity among these accessions.

3.5. PCoA Based on SNPs and Clustering Pattern Analysis

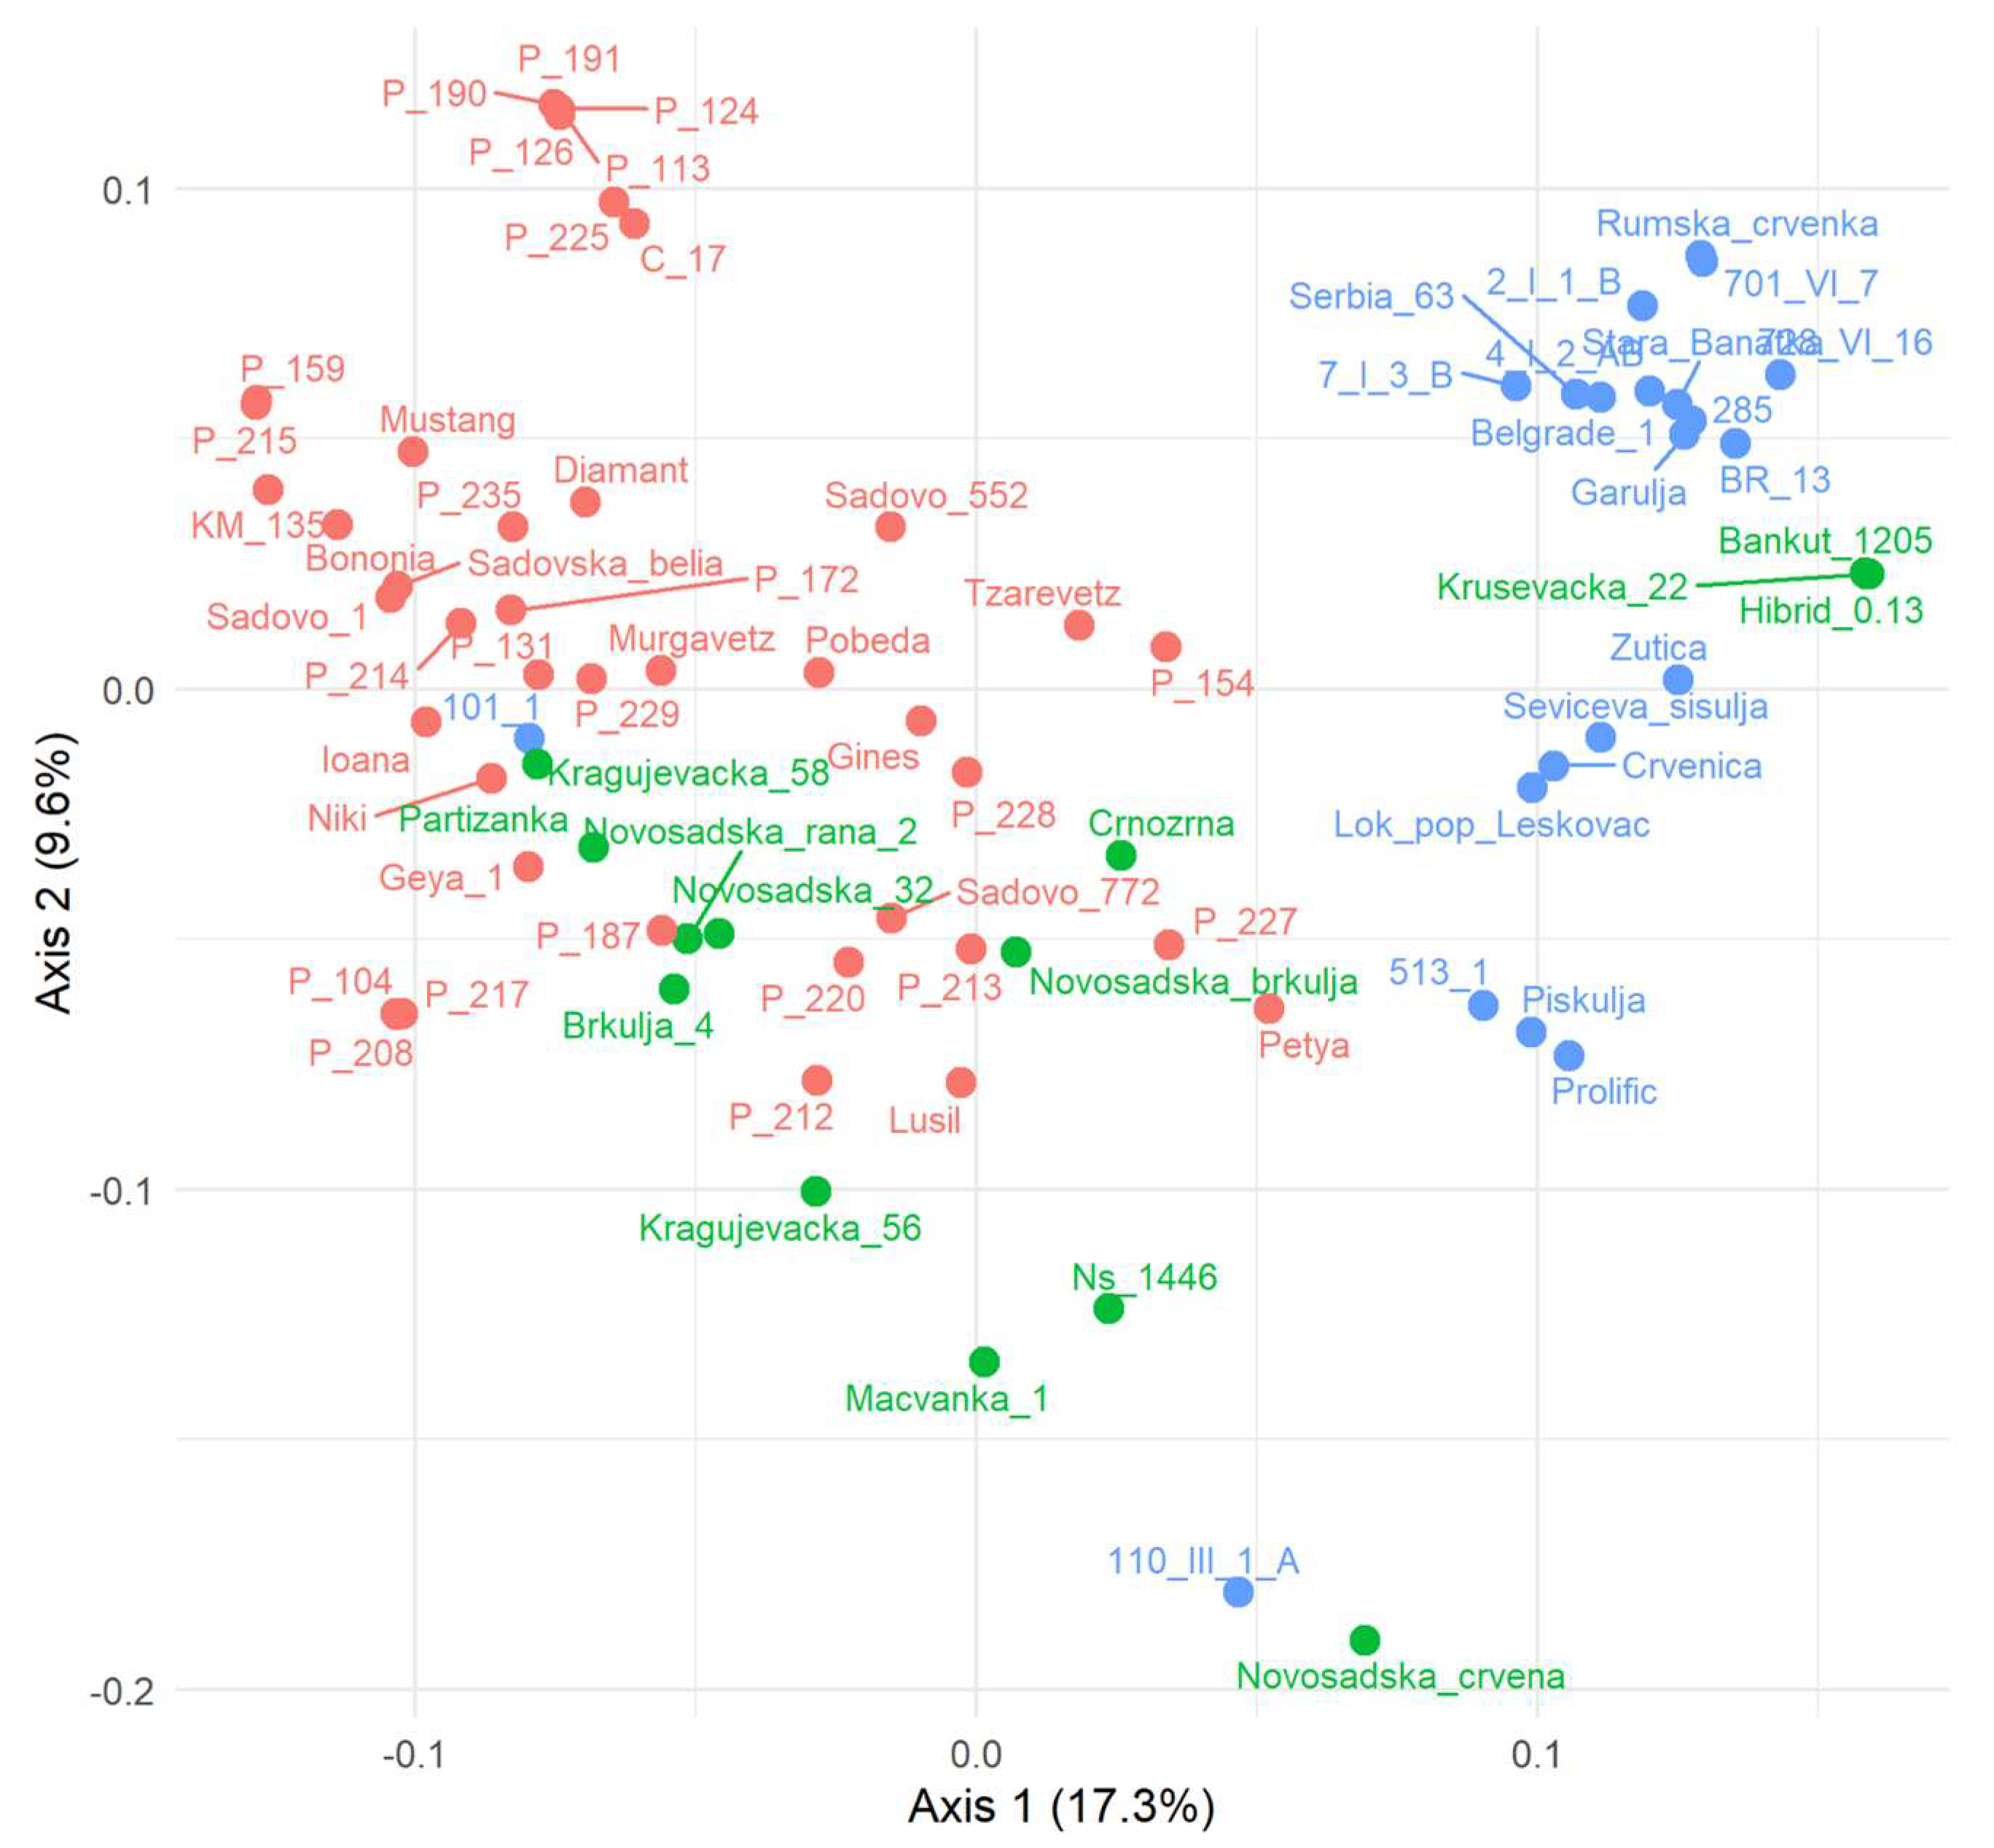
The principal coordinate analysis (PCoA) based on SNP markers revealed clear genetic structuring among the studied wheat accessions (Figure 5). The first two axes accounted for 17.3% and 9.6% of the total genetic variation, respectively. Three main clusters were observed, corresponding broadly to Serbian landraces, Bulgarian cultivars, and Serbian cultivars. Serbian landraces (blue) were predominantly positioned on the right-hand side of the plot, whereas Bulgarian cultivars (red) were mainly located on the left. Serbian cultivars (green) exhibited the greatest dispersion, occurring both on the right and left sides but concentrated toward the lower region of the plot, indicating high genetic variability within this group. Interestingly, three historical cultivars cultivated in Serbia—Krusevacka 22, Bankut 1205, and Hibrid 0.13—clustered within the landrace group. These cultivars are pre-Green Revolution genotypes, originating either from early selections or from local landraces, reflecting their intermediate genetic position between modern cultivars and landraces. One Serbian landrace, namely 101/1, was grouped among cultivars on the left side of the plot, suggesting a possible mislabeling or documentation issue in its genebank record or historical admixture. Another landrace, 110-III/1A, was distinctly separated from the main landrace cluster at the bottom of the plot, indicating a more divergent genetic profile. The PCoA plot revealed a closer overlap between Serbian and Bulgarian cultivars compared to other group combinations. Within the Bulgarian cultivar group, a subset comprising P-190, P-191, P-113, P-124, P-126, P-225, and C-17 formed a tightly clustered group in the upper-left corner, reflecting their shared pedigrees derived from crosses involving KS and Madara lines. (Supplementary Table S1). Another group included P-104, P-217, and P-208, tracing back to crosses involving Asenovka and Tangra. These patterns highlight the differentiation between landraces and modern cultivars while also indicating the persistence of historical genetic relationships among older cultivars, bridging the gap between landraces and modern breeding material.

4. Discussion

Our findings indicate the existence of high molecular and agro-morphological diversity within the investigated local genetic resources, highlighting their value as a long-term reservoir for breeding and adaptation. This diversity is also reflected in distinct phenotypic patterns. The Serbian landraces were generally taller and flower slightly later than the cultivars from both countries, while Bulgarian cultivars showed the largest variability in plant height. The greater stature of Serbian landraces likely reflects their lower degree of selection for reduced height, a major target in modern breeding programs. While the Serbian cultivars predominantly carry Rht8 [39] and Bulgarian cultivars often carry Rht8 either alone or combined with Rht-B1b [40,41], the landraces do not carry Rht genes. In the past, they were not only selected for grain yield but also for their utility in multiple traditional farming practices. Consequently, farmer selection favored maintaining longer stems, valued for valuable straw biomass for livestock, bioenergy, traditional crafts, and contributions to soil fertility [42,43]. In contrast, modern improved cultivars have been intentionally selected for shorter height and a higher harvest index, enhancing assimilate allocation to the grain and thereby increasing productivity compared with older landraces, underlining the physiological and breeding basis of the observed height differences and their relevance to yield improvement.
Variation in flowering time is shown to be linked to allele combinations at Xgwm261 (Rht-B1b) and Ppd-D1a, which confer photoperiod insensitivity in modern Bulgarian cultivars [40,41]. Beyond historical selection, environmental changes have further shaped plant height and flowering time. Increasing temperatures and the higher frequency of drought events associated with climate change have accelerated developmental cycles in modern cultivars, a trend further reinforced by breeders selecting for drought and heat escape strategies [44,45,46]. These pressures result in earlier flowering, shorter vegetative phases, and consequently reduced plant height. In contrast, landraces typically retain longer vegetative cycles, leading to later flowering and greater biomass accumulation [47]. Regional climatic differences further could also contribute to these patterns. Bulgaria, located slightly south of the main wheat production regions of Serbia, experiences a warmer climate, which could amplify these effects by promoting earlier maturity.
The SSR dataset revealed substantial variation, with Serbian landraces showing the highest allelic richness, expected heterozygosity, and PIC, alongside the largest number of private and rare alleles. These results emphasize their role as reservoirs of allelic diversity for breeding and conservation programs. The wide geographic range of collection sites in Serbia, spanning both large latitude and altitude gradients and elevations between 80 and 1709 m a.s.l. (Supplementary Table S1), likely contributed to the observed diversity and reflects local adaptation to distinct agro-ecological conditions [14,48]. In contrast, Bulgarian and Serbian cultivars displayed somewhat lower diversity than landraces, which is in line with the gradual narrowing of the genetic base through breeding and selection for uniformity. Similar patterns of reduced variation have been documented across European wheat breeding programs [49,50].
Genome-level comparisons confirmed that the D genome harbored the lowest diversity, in line with its evolutionary history and reduced contribution from Aegilops tauschii during wheat polyploidization [51,52]. Both SSR and SNP datasets supported this trend. Chromosome-level comparisons were generally consistent across groups, although the relatively low number of SNPs on chromosome 4 is noteworthy. Previous studies have described chromosome 4A as structurally complex due to translocations and inversions [53,54], carrying important adaptive loci [55], the reduced SNP counts observed here may reflect limitations in marker distribution on the array rather than true biological absence of variation—an issue that warrants further investigation.
The combined analyses using SSR and SNP markers provide a detailed view of the genetic relationships among Serbian and Bulgarian wheat collections. STRUCTURE analysis separated Bulgarian and Serbian accessions, with further substructuring, reflecting subtle differences within the local landrace pool and cultivars. These patterns were corroborated by UPGMA clustering based on SSR markers, which highlighted early-diverging Serbian landraces and the tight clustering of Bulgarian cultivars, consistent with their centralized breeding history. PCoA based on SNPs revealed three main clusters corresponding to Serbian landraces, Serbian cultivars, and Bulgarian cultivars, further confirming the distinction between landraces and modern breeding material.
Interestingly, no clear relationship was observed between the clustering of Serbian landraces and their collection site, latitude, altitude, or collection date, regardless of whether SSR-based UPGMA or SNP-based PCoA was used. This suggests that local adaptation and historical seed exchange patterns may have maintained high genetic heterogeneity within the landraces across Serbia, rather than promoting spatially structured divergence. Thus, geographic proximity did not predict genetic similarity among landraces, reflecting either historical admixture, farmer-mediated seed exchange, or shared ancestry across distant regions. Similar findings have been reported in other studies, where geographic origin did not correlate with genetic clustering in wheat landraces [56].
The clustering of cultivars closely matched known pedigrees. Bulgarian cultivars formed two closed clusters in both UPGMA and PCoA, consistent with their breeding origins. Some cultivars collected in Serbia that clustered with landraces reflected their historical breeding origins from local landraces or pre-Green Revolution crosses lacking modern reduced-height alleles, which were widely cultivated not only in Serbia but also across the broader Pannonian Plain (e.g., Bankut 1205). The grouping of five Serbian cultivars and the Bulgarian cultivar Pobeda (Figure 4) also reflects a shared Bezostaya-1 lineage, demonstrating how pedigree information can explain observed genetic clustering in cultivars.
However, not all observed clusters could be directly explained by the disclosed pedigrees. For example, the accessions Macvanka 1 and Novosadska crvena clustered together across all analyses despite having apparently unrelated pedigrees. Scrutiny of the pedigrees reveals that one parental component is shared between the two lines, illustrating a common limitation in historical pedigree records: breeders often report only selected parental names, omitting further ancestral components. Such incomplete or simplified pedigree documentation can obscure true genetic relationships, which molecular markers can reveal more accurately. This highlights the added value of SSR and SNP analyses in uncovering hidden relationships and validating historical breeding information. Studies have shown that incomplete pedigree records can lead to misinterpretations of genetic relationships in crops like wheat [57].
The genetic and phenotypic variation identified in this study provides valuable insights for practical breeding applications. Accessions exhibiting shorter biological cycles or earlier flowering could serve as potential donors in breeding programs targeting environments prone to terminal drought or high-temperature stress, where accelerated development enhances grain filling before the onset of heat. Conversely, taller landraces with longer growth cycles and greater biomass production could be explored for use in regions with cooler or more humid climates, or in programs aiming to increase straw yield and improve soil organic matter. Moreover, allelic diversity detected at loci associated with height and photoperiod sensitivity (e.g., Rht and Ppd loci) offers a foundation for developing pre-breeding materials adapted to variable climatic conditions and farming systems. Integrating these locally adapted genotypes into modern breeding pipelines would contribute to widening the genetic base of cultivated wheat and enhancing its resilience to future climatic challenges.
Our findings suggest that Serbian wheat landraces exhibit unique alleles and diverse phenotypic traits, underscoring their significant value as genetic resources for future breeding and adaptation to local conditions. Wheat landraces have evolved over centuries under diverse agro-ecological conditions, leading to a rich reservoir of genetic diversity that is crucial for enhancing crop resilience and productivity in the face of climate change and other challenges [58]. The preservation of local landraces, combined with the use of historical cultivars, can enrich breeding programs and maintain Balkan wheat germplasm for future crop improvement. Such conservation efforts are vital for safeguarding genetic resources that are essential for sustainable agriculture and food security. While adaptation to climate change is increasingly critical, sustaining high and stable grain yields remains important for maintaining agro-ecological resilience, ensuring that wheat crops continue to thrive under changing environmental conditions while supporting global food supply.

5. Conclusions

Serbian and Bulgarian wheat germplasm exhibits considerable agro-morphological and molecular diversity and clear genetic structuring shaped by both geographic origin and breeding history. Serbian landraces, in particular, show the highest diversity, allelic richness, and numbers of private and rare alleles. Genetic structure and UPGMA analyses revealed two main clusters separating Serbian and Bulgarian genotypes, reflecting both historical breeding and local adaptation. SNP analyses further confirmed elevated variability in landraces across all three wheat subgenomes, highlighting their value as reservoirs of unique alleles. These findings underscore the importance of conserving Serbian landraces and using them in breeding programs aimed at developing wheat cultivars resilient to climatic stresses while providing a reference framework for crop improvement in the Balkan region.

Supplementary Materials

The following supporting information can be downloaded at: https://www.mdpi.com/article/10.3390/agriculture15202127/s1, Supplementary Table S1: The passport data of 76 bread wheat accessions from Bulgaria and Serbia; Supplementary Table S2: The specific PCR cycling conditions for each marker; Supplementary Table S3: The list of primers used for SSR marker amplification; Supplementary Table S4: Molecular diversity statistics by markers and wheat genomes.

Author Contributions

Conceptualization, S.M., N.K.C. and E.G.T.; methodology, N.K.C. and D.T.; validation, E.G.T.; formal analysis, N.K.C. and D.T.; investigation, S.T. and V.Z.; resources, A.K.-Š.; data curation, S.T.; writing—original draft preparation, S.M.; writing—review and editing, All authors; visualization, N.K.C., D.T. and S.M.; supervision and funding acquisition, S.M. All authors have read and agreed to the published version of the manuscript.

Funding

This research was funded by The Benefit-Sharing Fund of the International Treaty on Plant Genetic Resources for Food and Agriculture, grant number PR-166-Serbia and the project BG16RFPR002-1.014-0012-C01 “Establishment and sustainable development of a Center of Competence “Agrifood Systems and Bioeconomy”, financed by the European Regional Development Fund through the Programme “Program for Research, Innovation and Digitalisation for Smart Transformation” (PRIDST)”.

Institutional Review Board Statement

Not applicable.

Data Availability Statement

The raw data supporting the conclusions of this article will be made available by the authors on request.

Acknowledgments

This study was supported by The Benefit-Sharing Fund of the International Treaty on Plant Genetic Resources for Food and Agriculture PR-166-Serbia project “Redesigning the exploitation of small grains genetic resources towards increased sustainability of grain-value chain and improved farmers’ livelihoods in Serbia and Bulgaria—GRAINEFIT”. It is a part of the activities of the Center of Excellence for Innovations in Breeding of Climate Resilient Crops—Climate Crops, Institute of Field and Vegetable Crops, Novi Sad, Serbia.

Conflicts of Interest

The authors declare no conflicts of interest.

Abbreviations

The following abbreviations are used in this manuscript:
PICPolymorphism Information Content
UPGMAUnweighted Pair Group Method with Arithmetic mean
SSRSimple Sequence Repeat
SNPSingle-Nucleotide Polymorphism
FTFlowering Time
PHPlant Height
DNADeoxyriboNucleic Acid
PCRPolymerase Chain Reaction
CTABCetylTrimethylAmmonium Bromide
dNTPDeoxyNucleotideTriPhosphates
MAFMajor Allele Frequency
ANOVAAnalysis of Variance
GDGene Diversity
HeExpected Heterozigosity
HoObserved Heterozigosity
PCoAPrincipal Coordinate Analysis

References

  1. Korpetis, E.; Ninou, E.; Mylonas, I.; Ouzounidou, G.; Xynias, I.N.; Mavromatis, A.G. Bread wheat landraces adaptability to low-input agriculture. Plants 2023, 12, 2561. [Google Scholar] [CrossRef]
  2. Villa, T.C.C.; Maxted, N.; Scholten, M.; Ford-Lloyd, B. Defining and identifying crop landraces. Plant Genet. Resour. 2005, 3, 373–384. [Google Scholar] [CrossRef]
  3. Berg, T. Landraces and folk varieties: A conceptual reappraisal of terminology. Euphytica 2009, 166, 423–430. [Google Scholar] [CrossRef]
  4. Landjeva, S.; Ganeva, G.; Korzun, V.; Palejev, D.; Chebotar, S.; Kudrjavtsev, A. Genetic diversity of old bread wheat germplasm from the Black Sea region evaluated by microsatellites and agronomic traits. Plant Genet. Resour. 2015, 13, 119–130. [Google Scholar] [CrossRef]
  5. Khoury, C.K.; Brush, S.; Costich, D.E.; Curry, H.A.; De Haan, S.; Engels, J.M.; Guarino, L.; Hoban, S.; Mercer, K.L.; Miller, A.J.; et al. Crop genetic erosion: Understanding and responding to loss of crop diversity. New Phytol. 2022, 233, 84–118. [Google Scholar] [CrossRef]
  6. Cseh, A.; Poczai, P.; Kiss, T.; Balla, K.; Berki, Z.; Horváth, Á.; Kuti, C.; Karsai, I. Exploring the legacy of Central European historical winter wheat landraces. Sci. Rep. 2021, 11, 23915. [Google Scholar] [CrossRef]
  7. Aleksandrov, V.; Kartseva, T.; Alqudah, A.M.; Kocheva, K.; Tasheva, K.; Börner, A.; Misheva, S. Genetic diversity, linkage disequilibrium and population structure of Bulgarian bread wheat assessed by genome-wide distributed SNP markers: From old germplasm to semi-dwarf cultivars. Plants 2021, 10, 1116. [Google Scholar] [CrossRef]
  8. Dimitrijević, M.; Petrović, S.; Cîmpeanu, C.; Bucur, D.; Belić, M. Cereals and Aegilops genus biodiversity survey in the west Balkans: Erosion and preservation. J. Food Agric. Environ. 2011, 9, 219–225. [Google Scholar]
  9. Petrović, S.; Dimitrijević, M. Genetic erosion of diversity in cereals. Genetika 2012, 44, 217–226. [Google Scholar] [CrossRef]
  10. Louafi, S.; Manzella, D. The benefit-sharing mechanisms under the International Treaty: Heterogeneity and equity in global resources management. In The Commons, Plant Breeding and Agricultural Research; Routledge: Abingdon, UK, 2018; pp. 255–271. [Google Scholar]
  11. Adhikari, S.; Kumari, J.; Jacob, S.R.; Prasad, P.; Gangwar, O.P.; Lata, C.; Thakur, R.; Singh, A.K.; Bansal, R.; Kumar, S.; et al. Landraces-potential treasure for sustainable wheat improvement. Genet. Resour. Crop Evol. 2022, 69, 499–523. [Google Scholar]
  12. Soriano, J.M.; Villegas, D.; Aranzana, M.J.; García del Moral, L.F.; Royo, C. Genetic structure of modern durum wheat cultivars and Mediterranean landraces matches with their agronomic performance. PLoS ONE 2016, 11, e0160983. [Google Scholar] [CrossRef]
  13. Rufo, R.; Alvaro, F.; Royo, C.; Soriano, J.M. From landraces to improved cultivars: Assessment of genetic diversity and population structure of Mediterranean wheat using SNP markers. PLoS ONE 2019, 14, e0219867. [Google Scholar] [CrossRef]
  14. Velimirović, A.; Jovović, Z.; Perović, D.; Lehnert, H.; Mikić, S.; Mandić, D.; Pržulj, N.; Mangini, G.; Finetti-Sialer, M.M. SNP diversity and genetic structure of “Rogosija”, an old Western Balkan durum wheat collection. Plants 2023, 12, 1157. [Google Scholar] [CrossRef] [PubMed]
  15. Kobiljski, B.; Denčić, S.; Pilipović, J. Molecular screening of domestic germplasm for allelic variants at the dwarfing gene Rht8 locus in wheat. Genetika 2006, 38, 67–74. [Google Scholar] [CrossRef]
  16. Kondić-Špika, A.; Denčić, S.; Mladenov, N.; Trkulja, D.; Mikić, S.; Hristov, N.; Marjanović-Jeromela, A. Polymorphism of microsatellite loci in bread wheat (Triticum aestivum L.): And related species. Zb. Matice Srp. Prir. Nauk. 2016, 81–89. [Google Scholar] [CrossRef]
  17. Mladenov, V.; Dimitrijević, M.; Petrović, S.; Boćanski, J.; Banjac, B.; Kondić-Špika, A.; Trkulja, D. Genetic analysis of spike length in wheat. Genetika 2019, 51, 167–178. [Google Scholar] [CrossRef]
  18. Ganeva, G.; Korzun, V. Microsatellite genetic diversity analysis and allelic variation comparison of obsolete and modern Bulgarian bread wheat (Triticum aestivum L.) varieties. Cereal Res. Commun. 2012, 40, 14–23. [Google Scholar] [CrossRef]
  19. Tsonev, S.; Christov, N.K.; Mihova, G.; Dimitrova, A.; Todorovska, E.G. Genetic diversity and population structure of bread wheat varieties grown in Bulgaria based on microsatellite and phenotypic analyses. Biotechnol. Biotechnol. Equip. 2021, 35, 1520–1533. [Google Scholar] [CrossRef]
  20. Chen, Y.; Dong, H.-B.; Peng, C.-J.; Du, X.-J.; Li, C.-X.; Han, X.-L.; Sun, W.-X.; Zhang, Y.-M.; Hu, L. Phenotypic plasticity of flowering time and plant height related traits in wheat. BMC Plant Biol. 2025, 25, 636. [Google Scholar] [CrossRef]
  21. Khobra, R.; Sareen, S.; Meena, B.K.; Kumar, A.; Tiwari, V.; Singh, G.P. Exploring the traits for lodging tolerance in wheat genotypes: A review. Physiol. Mol. Biol. Plants 2019, 25, 589–600. [Google Scholar] [CrossRef]
  22. Shavrukov, Y.; Kurishbayev, A.; Jatayev, S.; Shvidchenko, V.; Zotova, L.; Koekemoer, F.; De Groot, S.; Soole, K.; Langridge, P. Early flowering as a drought escape mechanism in plants: How can it aid wheat production? Front. Plant Sci. 2017, 8, 1950. [Google Scholar] [CrossRef]
  23. Xie, Q.; Mayes, S.; Sparkes, D.L. Carpel size, grain filling, and morphology determine individual grain weight in wheat. J. Exp. Bot. 2015, 66, 6715–6730. [Google Scholar] [CrossRef]
  24. Chapman, E.A.; Orford, S.; Lage, J.; Griffiths, S. Delaying or delivering: Identification of novel NAM-1 alleles that delay senescence to extend wheat grain fill duration. J. Exp. Bot. 2021, 72, 7710–7728. [Google Scholar] [CrossRef]
  25. Wingler, A.; Soualiou, S. Overcoming physiological trade-offs between flowering time and crop yield: Strategies for a changing climate. J. Exp. Bot. 2025, 76, 2646–2658. [Google Scholar] [CrossRef]
  26. Doyle, J.J.; Doyle, J.L. A rapid DNA isolation procedure for small quantities of fresh leaf tissue. Phytochem. Bull. 1990, 19, 11–15. [Google Scholar]
  27. Röder, M.S.; Korzun, V.; Wendehake, K.; Plaschke, J.; Tixier, M.H.; Leroy, P.; Ganal, M.W. A microsatellite map of wheat. Genetics 1998, 149, 2007–2023. [Google Scholar] [CrossRef] [PubMed]
  28. Song, Q.J.; Shi, J.R.; Singh, S.; Fickus, E.W.; Costa, J.M.; Lewis, J.; Gill, B.S.; Ward, R.; Cregan, P.B. Development and mapping of microsatellite (SSR) markers in wheat. Theor. Appl. Genet. 2005, 110, 550–556. [Google Scholar] [CrossRef] [PubMed]
  29. GrainGenes, a Database for Triticeae and Avena. Available online: https://graingenes.org/cgi-bin/GG3/browse.cgi (accessed on 9 May 2025).
  30. Bradbury, P.J.; Zhang, Z.; Kroon, D.E.; Casstevens, T.M.; Ramdoss, Y.; Buckler, E.S. TASSEL: Software for association mapping of complex traits in diverse samples. Bioinformatics 2007, 23, 2633–2635. [Google Scholar] [CrossRef] [PubMed]
  31. Liu, K.; Muse, S.P. PowerMarker: An integrated analysis environment for genetic marker analysis. Bioinformatics 2005, 21, 2128–2129. [Google Scholar] [CrossRef]
  32. Pritchard, J.K.; Stephens, M.; Donnelly, P. Inference of population structure using multilocus genotype data. Genetics 2000, 155, 945–959. [Google Scholar] [CrossRef]
  33. Hubisz, M.J.; Falush, D.; Stephens, M.; Pritchard, J.K. Inferring weak population structure with the assistance of sample group information. Mol. Ecol. Resour. 2009, 9, 1322–1332. [Google Scholar] [CrossRef] [PubMed]
  34. Evanno, G.; Regnaut, S.; Goudet, J. Detecting the number of clusters of individuals using the software STRUCTURE: A simulation study. Mol. Ecol. 2005, 14, 2611–2620. [Google Scholar] [CrossRef]
  35. Li, Y.-L.; Liu, J.-X. StructureSelector: A web-based software to select and visualize the optimal number of clusters using multiple methods. Mol. Ecol. Resour. 2018, 18, 176–177. [Google Scholar] [CrossRef]
  36. Francis, R.M. pophelper: An R package and web app to analyse and visualize population structure. Mol. Ecol. Resour. 2017, 17, 27–32. [Google Scholar] [CrossRef] [PubMed]
  37. Nei, M.; Tajima, F.; Tateno, Y. Accuracy of estimated phylogenetic trees from molecular data. J. Mol. Evol. 1983, 19, 153–170. [Google Scholar] [CrossRef]
  38. He, Z.; Zhang, H.; Gao, S.; Lercher, M.J.; Chen, W.-H.; Hu, S. Evolview v2: An online visualization and management tool for customized and annotated phylogenetic trees. Nucleic Acids Res. 2016, 44, 236–241. [Google Scholar] [CrossRef]
  39. Tošović-Marić, B.; Kobiljski, B.; Obreht, D.; Vapa, L. Evaluation of wheat Rht genes using molecular markers. Genetika 2008, 40, 31–38. [Google Scholar] [CrossRef]
  40. Ganeva, G.; Korzun, V.; Landjeva, S.; Tsenov, N.; Atanasova, M. Identification, distribution and effects on agronomic traits of the semi-dwarfing Rht alleles in Bulgarian common wheat cultivars. Euphytica 2005, 145, 305–315. [Google Scholar] [CrossRef]
  41. Kolev, S.; Vassilev, D.; Kostov, K.; Todorovska, E. Allele variation in loci for adaptive response in Bulgarian wheat cultivars and landraces and its effect on heading date. Plant Genet. Resour. 2011, 9, 251–255. [Google Scholar] [CrossRef]
  42. Srivastava, N.; Shrivastav, A.K.; Srivastava, M.; Mishra, P.K. Biofuels production using wheat straw. In Recent Developments in Bioenergy Research; Elsevier: Amsterdam, The Netherlands, 2020; pp. 433–441. [Google Scholar]
  43. Ninkuu, V.; Liu, Z.; Qin, A.; Xie, Y.; Song, X.; Sun, X. Impact of straw returning on soil ecology and crop yield: A review. Heliyon 2025, 11, e41651. [Google Scholar] [CrossRef] [PubMed]
  44. Munns, R.; Richards, R.A. Recent Advances in Breeding Wheat for Drought and Salt Stresses. In Advances in Molecular Breeding Toward Drought and Salt Tolerant Crops; Jenks, M.A., Hasegawa, P.M., Jain, S.M., Eds.; Springer: Berlin/Heidelberg, Germany, 2007; pp. 565–585. [Google Scholar]
  45. Veteläinen, M.; Negri, V.; Maxted, N. European Landraces: On-farm Conservation, Management and Use; Bioversity International: Rome, Italy, 2009. [Google Scholar]
  46. Takács, G.; Gergely, I.; Ördög, V.; Vörös, L.; Iváncsics, J. Approaches to studying wheat and maize drought stress responses. Plant Soil. 2025, 1–8. [Google Scholar] [CrossRef]
  47. Lopes, M.S.; El-Basyoni, I.; Baenziger, P.S.; Singh, S.; Royo, C.; Ozbek, K.; Aktas, H.; Ozer, E.; Ozdemir, F.; Manickavelu, A.; et al. Exploiting genetic diversity from landraces in wheat breeding for adaptation to climate change. J. Exp. Bot. 2015, 66, 3477–3486. [Google Scholar] [CrossRef]
  48. Baresel, J.P.; Bülow, L.; Finckh, M.R.; Frese, L.; Knapp, S.; Schmidhalter, U.; Weedon, O. Performance and evolutionary adaptation of heterogeneous wheat populations. Euphytica 2022, 218, 137. [Google Scholar] [CrossRef]
  49. Reif, J.C.; Zhang, P.; Dreisigacker, S.; Warburton, M.L.; van Ginkel, M.; Hoisington, D.; Bohn, M.; Melchinger, A.E. Wheat genetic diversity trends during domestication and breeding. Theor. Appl. Genet. 2005, 110, 859–864. [Google Scholar] [CrossRef]
  50. Fu, Y.-B.; Somers, D.J. Genome-wide reduction of genetic diversity in wheat breeding. Crop Sci. 2009, 49, 161–168. [Google Scholar] [CrossRef]
  51. Cavanagh, C.R.; Chao, S.; Wang, S.; Huang, B.E.; Stephen, S.; Kiani, S.; Forrest, K.; Saintenac, C.; Brown-Guedira, G.L.; Akhunova, A.; et al. Genome-wide comparative diversity uncovers multiple targets of selection for improvement in hexaploid wheat landraces and cultivars. Proc. Natl. Acad. Sci. USA 2013, 110, 8057–8062. [Google Scholar] [CrossRef] [PubMed]
  52. Pont, C.; Leroy, T.; Seidel, M.A.; Tondelli, A.; Duchemin, W.; Armisen, D.; Lang, D.; Bustos-Korts, D.; Goué, N.; Balfourier, F.; et al. Tracing the ancestry of modern bread wheats. Nat. Genet. 2019, 51, 905–911. [Google Scholar] [CrossRef] [PubMed]
  53. Ma, J.; Stiller, J.; Wei, Y.; Zheng, Y.L.; Devos, K.M.; Doležel, J.; Liu, C. Extensive pericentric rearrangements in the bread wheat (Triticum aestivum L.) genotype “Chinese Spring” revealed from chromosome shotgun sequence data. Genome Biol. Evol. 2014, 6, 3039–3048. [Google Scholar] [CrossRef] [PubMed]
  54. Dvorak, J.; Wang, L.; Zhu, T.; Jorgensen, C.M.; Luo, M.C.; Deal, K.R.; Gu, Y.Q.; Gill, B.S.; Distelfeld, A.; Devos, K.M.; et al. Reassessment of the evolution of wheat chromosomes 4A, 5A, and 7B. Theor. Appl. Genet. 2018, 131, 2451–2462. [Google Scholar] [CrossRef]
  55. Zhao, X.; Fu, X.; Yin, C.; Lu, F. Wheat speciation and adaptation: Perspectives from reticulate evolution. Abiotech 2021, 2, 386–402. [Google Scholar] [CrossRef]
  56. Liu, Y.; Fu, B.; Zhang, Q.; Cai, J.; Guo, W.; Zhai, W.; Wu, J. Genetic diversity and population structure of wheat landraces in Southern Winter Wheat Region of China. BMC Genom. 2024, 25, 664. [Google Scholar] [CrossRef] [PubMed]
  57. Fradgley, N.; Gardner, K.A.; Cockram, J.; Elderfield, J.; Hickey, J.M.; Howell, P.; Jackson, R.; Mackay, I.J. A large-scale pedigree resource of wheat reveals evidence for adaptation and selection by breeders. PLoS Biol. 2019, 17, e3000071. [Google Scholar] [CrossRef] [PubMed]
  58. Cheng, S.; Feng, C.; Wingen, L.U.; Cheng, H.; Riche, A.B.; Jiang, M.; Leverington-Waite, M.; Huang, Z.; Collier, S.; Orford, S.; et al. Harnessing landrace diversity empowers wheat breeding. Nature 2024, 632, 823–831. [Google Scholar] [CrossRef] [PubMed]
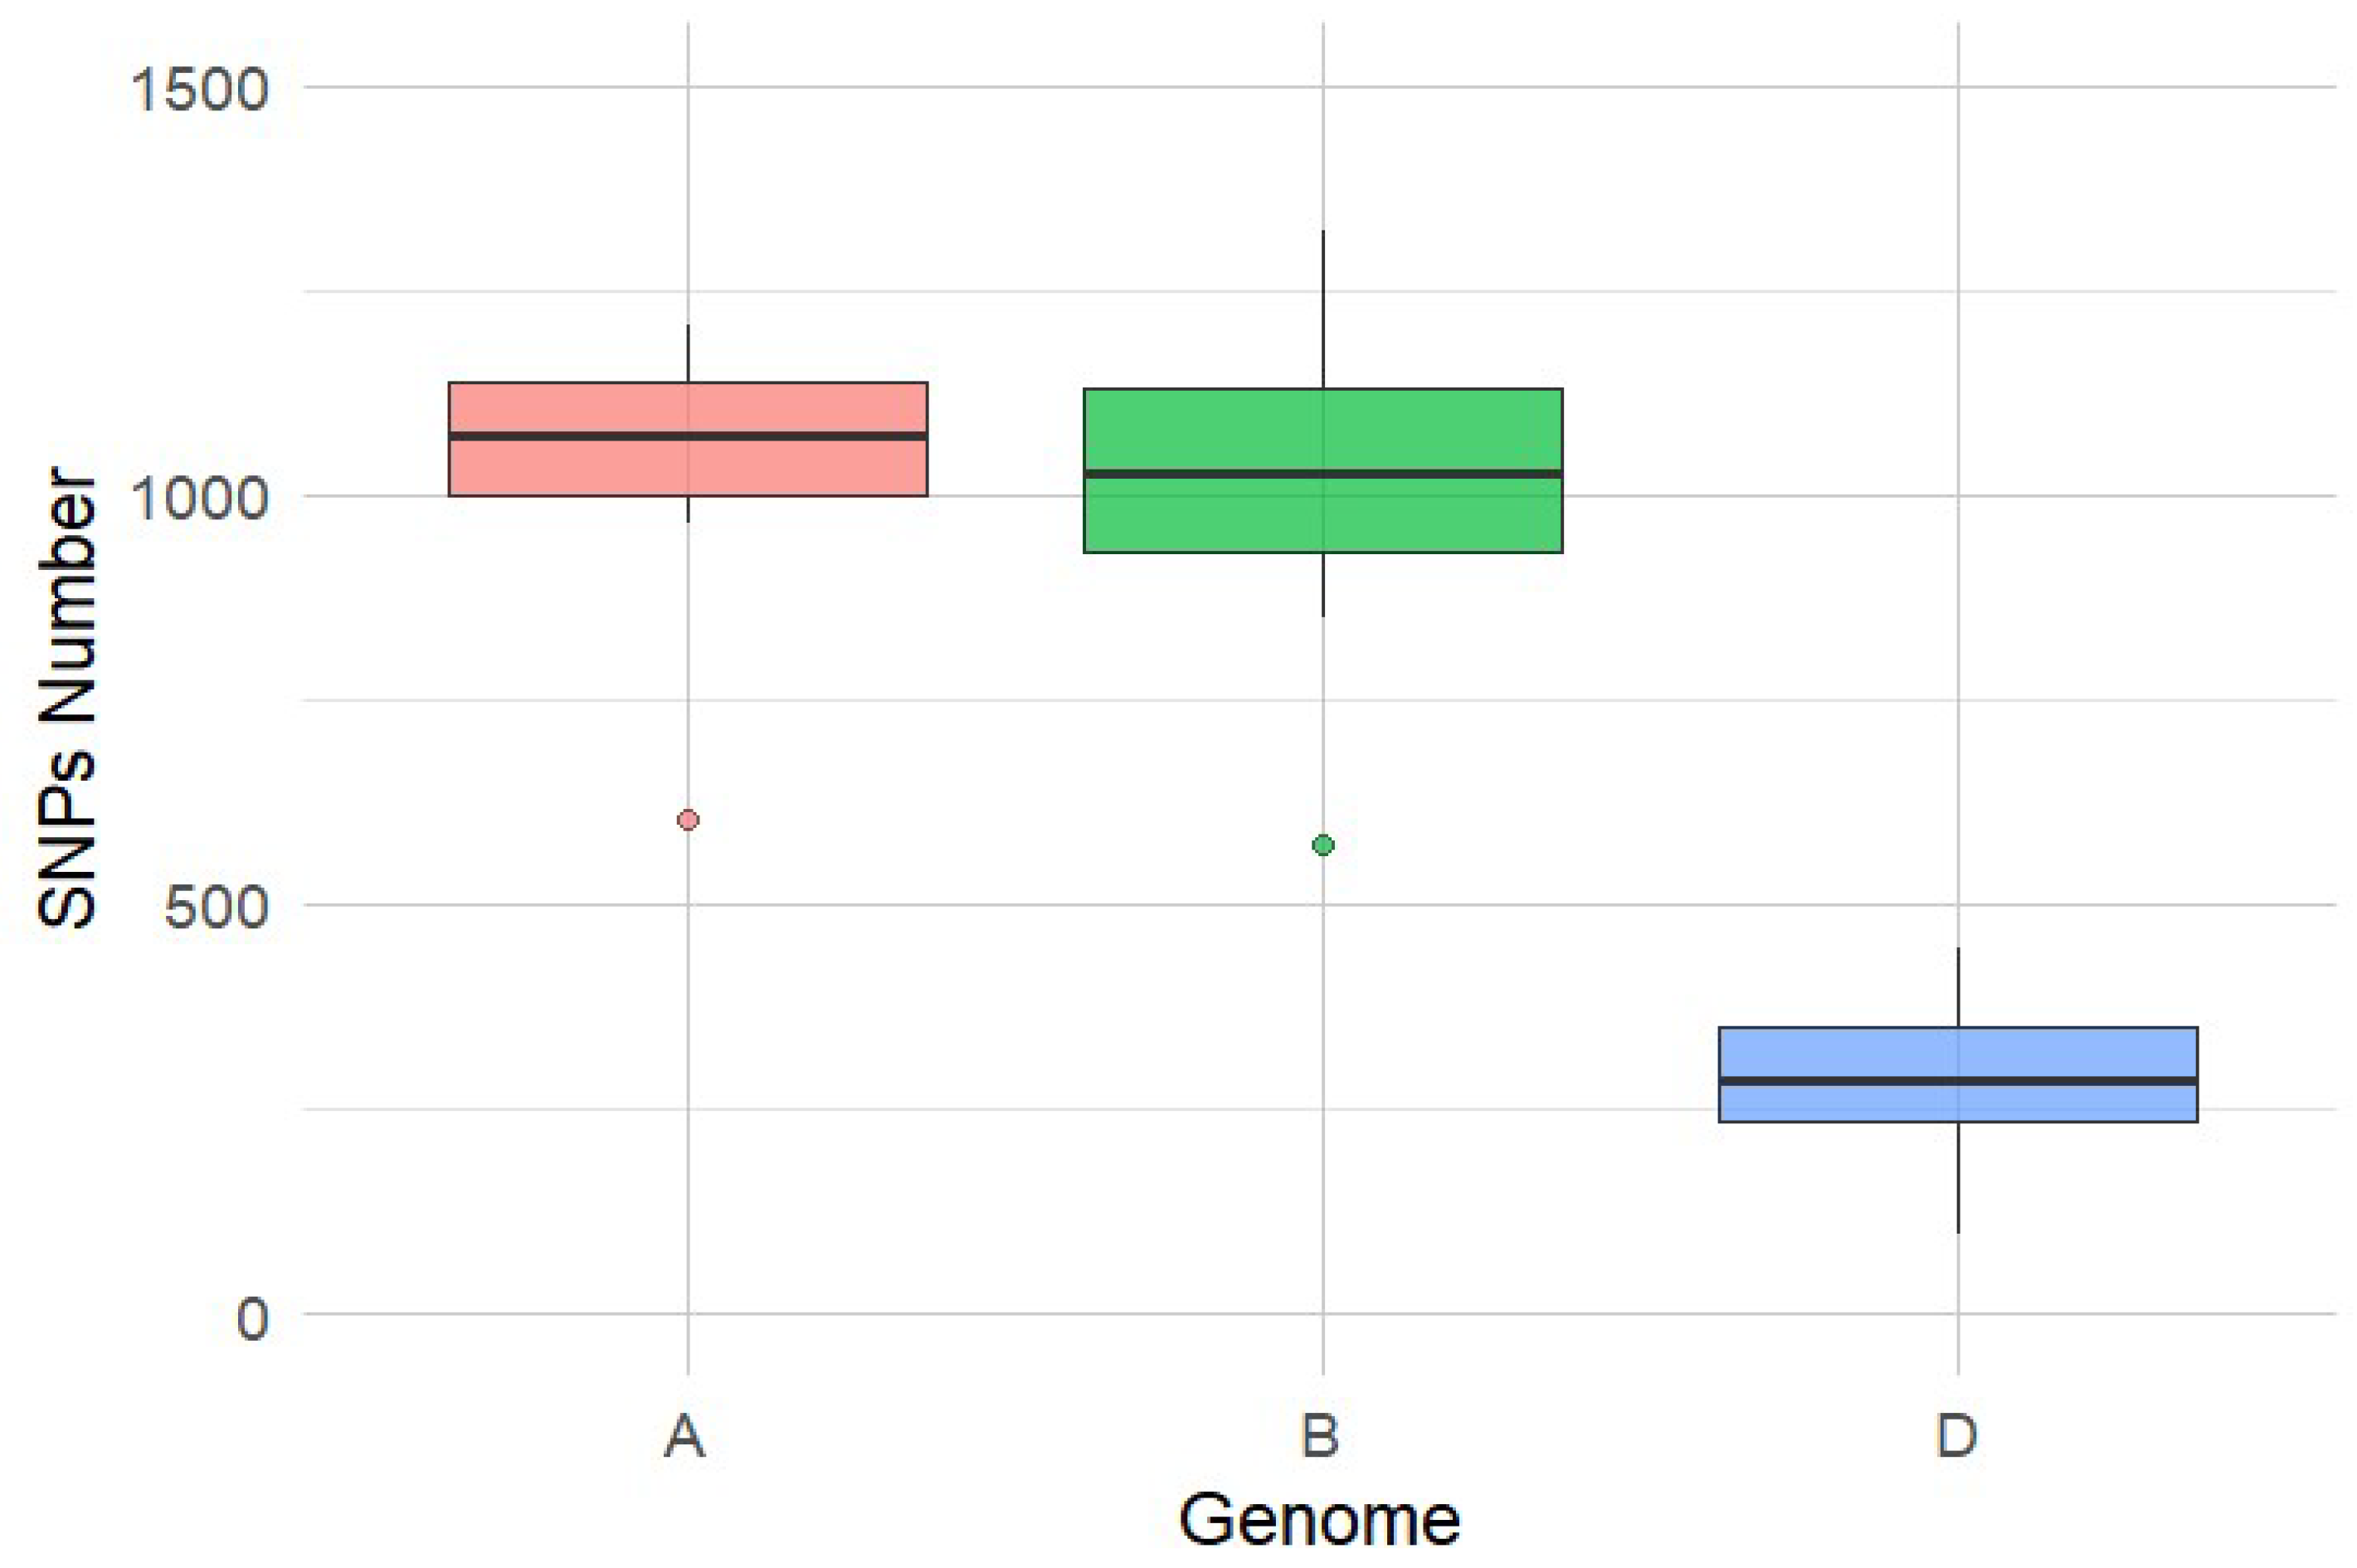
Figure 1. Number of SNP markers per chromosome across A (red), B (green) and D (blue) genomes based on SNPs retained after filtering (Illumina 25K Infinium iSelect array).
Agriculture 15 02127 g001
Figure 2. Number of SNP markers across the chromosomes in three wheat genomes for cultivars and landraces; VAR—varieties (cultivars); LND—landraces.
Agriculture 15 02127 g002
Figure 3. STRUCTURE results of 76 local wheat accessions based on Bayesian clustering: (a) delta K method, (b) log-likelihood method, (c) bar plot of ancestry proportions; BGR—Bulgaria; SRB—Serbia; loc—location (country).
Agriculture 15 02127 g003
Figure 4. SSR-based cluster analysis using Nei83 DA genetic distance and the unweighted pair group method with arithmetic mean (UPGMA).
Agriculture 15 02127 g004
Figure 5. Principal coordinate analysis (PCoA) b of 76 wheat accessions based on SNP-derived genetic distance. Red—Bulgarian cultivars; Green—Serbian cultivars; Blue—Serbian landraces.
Agriculture 15 02127 g005
Table 1. Descriptive statistics for plant height and flowering time by wheat groups.
TraitGroupMinMaxQ1MedianQ3VarianceSDMean
Plant height (cm)Bulgarian cultivars6312986.099.0115.7279.916.7100.9 a
Serbian cultivars8214196.7112.5121.2257.316.0111.4 b
Serbian landraces97149126.5133.5136.0122.011.0130.1 c
Flowering time (days)Bulgarian cultivars128139132.0135.0135.06.42.5133.8 a
Serbian cultivars128141134.0135.0137.28.042.8135.5 b
Serbian landraces132145138.0139.0142.010.83.3139.7 c
Min—minimum value, Max—maximum value, Q1—first quartile (25th percentile), Q3—third quartile (75th percentile), SD—standard deviation. Means in the same column with different superscript letters are significantly different p < 0.05.
Table 2. ANOVA for plant height and flowering time.
TraitSource of VariationdfSum SquareMean SquareF Valuep (>F)Partial η2
Plant height (cm)Group222,99711,498117.76<2 × 10⁻¹⁶ **0.62
Year118,09218,092185.28<2 × 10⁻¹⁶ **0.56
Group:Year23843192119.682.71 × 10−8 **0.21
Residuals14614,25697.6
Flowering time (days)Group212963.511.951.561 × 10−5 **0.14
Year126026048.081.228 × 10−10 **0.25
Group:Year2183183.033.8528.34 × 10−13 **0.32
Residuals1467895.4
df—degrees of freedom, **—significance at 0.01 probability level.
Table 3. Standard genetic diversity parameters based on SSR markers.
ParameterAllBulgarian CultivarsSerbian CultivarsSerbian Landraces
MAF0.4690.5780.4960.429
Sample size76412114
Allele No.446277252340
Allele/Locus9.495.895.367.23
GD (He)0.6750.5660.6020.675
Ho0.2010.2060.1750.209
PIC0.6460.5340.5970.671
No. of private alleles-4230106
No. of rare alleles (<5%)-451873
MAF—major allele frequency; GD (He)—gene diversity (expected heterozygosity); Ho—observed heterozygosity; PIC—polymorphism information index.
Disclaimer/Publisher’s Note: The statements, opinions and data contained in all publications are solely those of the individual author(s) and contributor(s) and not of MDPI and/or the editor(s). MDPI and/or the editor(s) disclaim responsibility for any injury to people or property resulting from any ideas, methods, instructions or products referred to in the content.