Article

Tracking Soil Organic Carbon and Nitrogen Under Organic Management: A Temporal Perspective

by
Daniel Bragg
1,2,*,
Joan Romanyà
3,4,
José M. Blanco-Moreno
1,2 and
Francesc Xavier Sans
1,2
1
Department of Evolutionary Biology, Ecology and Environmental Sciences, Universitat de Barcelona, 08028 Barcelona, Spain
2
Institut de Recerca de la Biodiversitat, 08028 Barcelona, Spain
3
Department of Biology, Health and Environment, Universitat de Barcelona, 08028 Barcelona, Spain
4
Institut de Recerca en Nutrició i Seguretat Alimentària, 08921 Santa Coloma de Gramenet, Spain
*
Author to whom correspondence should be addressed.
Agriculture 2025, 15(20), 2117; https://doi.org/10.3390/agriculture15202117 (registering DOI)
Submission received: 5 September 2025 / Revised: 1 October 2025 / Accepted: 9 October 2025 / Published: 11 October 2025
(This article belongs to the Section Agricultural Soils)

Abstract

Understanding the long-term impact of agricultural practices on soil parameters is essential for improving soil quality and sustainability. Soil Organic Carbon (SOC) and total Nitrogen (N) are key indicators due to their influence on crop productivity, nutrient cycling, and microbial activity. This study assesses the effects of tillage intensity (inversion vs. non-inversion) and organic amendments (manure vs. no manure) on SOC and total N dynamics in Mediterranean rain-fed arable systems. Data were collected over a ten-year field trial (2011–2020) in Catalonia, under cereal–legume rotation and organic management, focusing on two soil depths (0–10 and 10–20 cm). Fertilization was the main driver of SOC and N changes. Non-inversion tillage promoted topsoil accumulation and microbial colonization, especially during the first period (2011–2015). The combination of manure and reduced tillage led to faster and greater SOC increases. Moreover, initial SOC levels were negatively related to SOC changes in the topsoil. These results revealed the combination of manure and non-inversion tillage as the more suitable management practice to preserve soil quality in organic arable rain-fed systems, emphasizing the importance of understanding the impact of agricultural management in the long-term under Mediterranean conditions.

1. Introduction

Although soil is one of the main nonrenewable resources for agriculture, it is seldom sustainably managed [1]. It is estimated that between 60 and 70% of soils in the European Union have suffered some sort of degradation [2]. Soil quality indicators are widely used as tools to evaluate soil conditions due to their ability to provide valuable insights into environmental sustainability and agricultural productivity. Among these indicators, Soil Organic Carbon (SOC) is particularly important because of its positive relationship with crop production, owing to its influence on soil properties such as water retention capacity and nutrient content [3,4]. Furthermore, the SOC content is also related to microbial biomass as it enhances microbial activity and nutrient cycling [5,6] and to soil organic matter potential as a climate change mitigation agent through carbon sequestration [7,8,9]. Similarly, Nitrogen (N) availability is a critical factor for crop growth and production, especially in organic farming [10,11]. Furthermore, microbial communities are increasingly being employed as ecological indicators across a wide range of environments, owing to their rapid specific responsiveness to environmental variations, including chemical and mechanical disturbances [12]. Moreover, SOC and N inputs (through fertilization) and outputs (such as harvest and volatilization) derived from agricultural management directly affect SOC and N dynamics [13,14].
Therefore, understanding the effects of agricultural management on SOC and N can allow for the identification of the most suitable practices to improve soils. Some agricultural practices (e.g., intensive tillage, the use of artificial fertilizers and pesticides) can lead to negative impacts on soil, such as soil erosion and water and aerial contamination [15]. Therefore, some alternatives have been proposed. Farming practices such as reduced tillage, the use of organic fertilizers, cover crops, cereal–legume crop rotation, or crop residue incorporation to the soil are known to preserve soil properties such as aggregate stability and water retention, reduce soil erosion, and increase key soil parameters such as SOC [16,17,18,19]. However, the changes in C and N in soils related to farming practices are usually slow, and for this reason, medium to long-term studies are needed to assess their impact.
Reducing the intensity or suppressing tillage can limit soil erosion [20] and increase SOC and nutrient concentrations. It can also increase the SOC by reducing soil disruption [21] and promoting microbial activity and nutrient cycling [22,23]. However, this reduced soil disturbance lessens the movement across the soil profile, and thus, SOC accumulates primarily in topsoil, causing stratification [24,25], as different soil layers remain separated [26].
Fertilization is also a practice with major effects on SOC fluctuations. Organic fertilizers, such as farmyard manure, directly provide organic carbon to the soil [27], enhancing SOC levels and microbial activity [28]. Organic fertilization and non-inversion tillage have a proven potential to increase SOC compared to conventional tillage or the lack of organic amendments [29]. Moreover, organic fertilization can also increase N content in the soil over the long term, with a higher proportion of N retained in more stable, recalcitrant forms compared to inorganic fertilizers [30].
However, information regarding the combined effects of reduced tillage and organic fertilization is limited [31,32], and this is even more so in the Mediterranean area. Despite the studies on the separate effects of fertilization and tillage under organic farming that have been conducted [33,34,35,36], information on their combined effects on soil carbon and nutrient content in Mediterranean arable crop systems is scarce. The Mediterranean climate presents a great interannual variability, low water availability, and seasonal drought. Mediterranean arable soils are characterized by their low SOC compared to other European regions [37,38] and by a high mineralization rate [39,40]. SOC depletion can also contribute to soil degradation and desertification [41], particularly under high disturbance regimes that increase respiration rates and expose organic matter to oxidation in contact with the atmosphere [42,43]. As a consequence, Mediterranean arable soils’ low SOC content can lead to significant reductions in both soil functioning and agronomic productivity [44]. In addition, highly degraded soils exhibit greater mineralization of the SOC compared to partially degraded soils [45]. Moreover, as soil approaches SOC saturation, the rate of carbon sequestration diminishes, thus hindering further carbon gains [46]. However, soils with a lower baseline carbon content may be more resilient to environmental or management disturbances, as their capacity to protect SOC is expected to be high [47]. Therefore, on such soils, it is of the utmost importance that the medium- and long-term assessments of practices contribute to maintaining and increasing SOC content relative to baseline SOC conditions.
We studied changes in SOC, total N, and microbial biomass during a 10-year experiment that combined reduced and conventional tillage with organic fertilization under organic farming. This study seeks to address the aforementioned scarcity of information regarding the effects of tillage and fertilization on soil properties under arable organic farming for rain-fed Mediterranean soils. To achieve this, it is essential to conduct medium- and long-term studies, as they can generate valuable data on the impact of management on soil dynamics. The objective of the trial is to investigate the effect of tillage intensity (non-inversion tillage vs. inversion tillage) and organic fertilization (fertilization vs. no fertilization) on SOC, total N, and microbial biomass changes at two soil depths (topsoil (0–10 cm) and subsurface (10–20 cm)). We also aimed to relate the combined effects of reduced tillage and organic fertilization to the initial SOC content. We hypothesized that, under organic farming conditions, the combination of reduced tillage and organic fertilization would have a positive effect on soil organic matter and microbial biomass, especially in soils with low organic C content in the topsoil, whereas organic matter accumulation would be less effective in soils with a higher SOC content.

2. Materials and Methods

2.1. Study Site

In 2011, a field trial was established in the Espai Rural de Interès Natural de Gallecs (41°33′31.9″ N, 2°11′59.5″ E), a peri-urban agricultural area of 753 ha situated 15 km north of Barcelona (Catalonia, Spain) (Figure A1). Gallecs experiences a Mediterranean climate, presenting a mean annual temperature of 15.9 °C and precipitation of 446.6 mm.
Prior to the start of the study, soil properties were assessed. On average, the mineral fraction was composed of 43.3 ± 6.9% sand, 26.9 ± 4.7% silt, and 29.7 ± 3.7% clay; the texture was classified as clay loam [48]; the soil type was Haplic Luvisol [49]; the average SOC content was 1.13 ± 0.1% (Walkley–Black); and the average total N content was 0.12 ± 0.002%, and the pH (H2O) was 8.1 ± 0.1.

2.2. Long-Term Trial

The long-term trial was established in 2011. Prior to the trial, the field had been managed organically for five years, following a typical dryland Mediterranean crop rotation that alternated winter cereals with spring legumes for human consumption. The experiment initially planned a four-year cereal–pulse crop rotation in a strip-split-block design, incorporating three factors, each with two levels: tillage system (inversion tillage (I) vs. non-inversion tillage (NI)), fertilization (composted farmyard manure (F+) vs. no fertilizer (F−), and green manure (with green manure vs. no green manure) (Figure 1). The experimental layout featured annual tillage treatments arranged in strips, with fertilization applied in perpendicular blocks across the entire setup (Figure 1). These tillage strips were further divided into plots for the green manure treatment in a checkerboard design. A total of 32 plots, each measuring 13 m × 12 m, were established, with four replicates for each treatment (Figure 1).
Inversion tillage consisted in the yearly use of a moldboard plow (at 25 cm depth), while non-inversion tillage was chisel plow (no soil inversion at 25 cm depth). The fertilization treatment consisted of the application of partially composted farmyard manure, in contrast with the absence of fertilization (Table A1). The amount of manure applied each year differed between crop type and year (Table 1) and was incorporated into the soil by the primary tillage operations (moldboard or chisel). After 2016, no farmyard manure was applied, thus generating two differentiated periods in terms of fertilization. To facilitate machinery operation, manure was applied on groups of four adjacent plots, each group representing a fertilization block (Figure 1). In September 2012 and 2014, cover crops were established as the green manure treatment, consisting of a mixture of Oat (Avena sativa L.), white mustard (Sinapis alba L.), bitter vetch (Vicia ervilia (L.) Willd.), and common vetch (Vicia sativa L.). At the end of March of the following year, cover crops were incorporated into the soil. However, as it presented no significant effect [50] and conditioned too serious sowing times for subsequent legume crops, the usage of green manure was discontinued in 2014. Crop rotation consisted of a sequence of cereals and legumes (Spelt (Triticum aestivum L. subsp. spelta (L.) Thell)—Chickpea (Cicer arietinum L.)—Winter wheat (Triticum aestivum L.)—Lentil (Vicia lens (L.) Coss & Germ)—Spelt (Triticum aestivum L. subsp. spelta (L.) Thell)—Alfalfa (Medicago sativa L.)—Oat (Avena sativa L.) + Vetch (Vicia sativa L.)—Winter wheat (Triticum aestivum L.)—Chickpea (Cicer arietinum L.)) (Table 1). Stubble and weed above-ground biomass were incorporated to the soil (Table 2). Weeds were controlled during the second, third and fourth years of the crop rotation with different mechanical or manual methods (Table 2).

2.3. Soil Sampling and Analyses of SOC and Total N

Soil analyses were conducted at the beginning (t0 = 2011), 5 years (t1 = 2015), and 10 years (t2 = 2020) of the experiment. In November 2011, 2015, and 2020, soil samples were collected at two depths, from 0 to 10 cm (topsoil) and from 10 to 20 cm (subsurface), which broadly correspond to the depths that are disturbed by both tillage and seeding operations and only by tillage operations, respectively.
We extracted 20 soil cores with a 2.5 cm diameter on a grid every 2 m within a 6 m × 8 m area centered in each plot. Each group of 20 cores were mixed by plot and depth, constituting one sample. Soil samples were stored in a fridge at 4 °C until preparation for analysis. Samples were air dried and sieved on a 2 mm mesh. At least 50 g of dried soil was prepared for SOC and N analysis, and 100 g were kept for the soil microbial analyses. SOC content was estimated from organic matter results following Walkley–Black procedure due to high content of carbonates [51]. Total N was determined following Kjeldahl method [52].

2.4. Soil Microbial Biomass Analyses

Water content of the soil samples was adjusted to 40–50% of maximum water retention capacity for the microbial biomass analysis. The soil microbial biomass was estimated by using chloroform fumigation extraction (CFE) following Vence et al. [53]. CFE was made for three 20 g of dried soil subsamples treated with 80 mL of a 0.55M K2SO4 solution. Soil microbial biomass was calculated according to Joergensen [54], following this formula: microbial carbon (Cmic) (μg g−1 oven dry soil) = EC/kEC. Where EC (extractable carbon) = (SOC in fumigated samples − SOC in control samples) and kEC (conversion factor for microbial carbon) = 0.45.
The Cmic/SOC ratio was calculated as an indicator of microbial activity and the degree of stabilization of soil organic matter. A high Cmic/SOC ratio can indicate high microbial activity and that SOC is presented in labile forms, making it more easily accessible to soil microorganisms.

2.5. Statistical Analyses

Temporal changes in SOC, total N, and Cmic within each of four experimental conditions and each soil layer were evaluated using ANOVA and Tukey’s HSD post hoc test. Evaluation of changes by treatment considered the three sampled points (t0, t1, and t2). The main and interaction effects of tillage, fertilization, and initial SOC on changes in SOC, N, and Cmic were assessed using linear mixed effects models (LMM). Tillage and fertilization were used as fixed effects factors, initial SOC was included as a covariable, and fertilization block was introduced as a random effect factor. Initial SOC values corresponded to SOC2011 in the analysis of the 2011–2015 period and to SOC2015 in the analyses of the 2015–2020 period. All model residuals were diagnosed with package DHARMa [55]. Changes in soil indicators were first considered in the period between initial and final samplings (∆t = t2 − t0) to determine the effects of each treatment (LMM). To capture the effects of differential application of farmyard manure between periods, we consider analyzing changes between initial and mid (∆t = t1 − t0) and mid and final samplings (∆t = t2 − t1) by fertilization regime and depth. As the model was divided into four, significance was considered when p-value < 0.01. All analyses were performed in R version 4.2.3 [56].

3. Results

3.1. Changes in SOC, Total N, and Cmic per Combination of Treatments

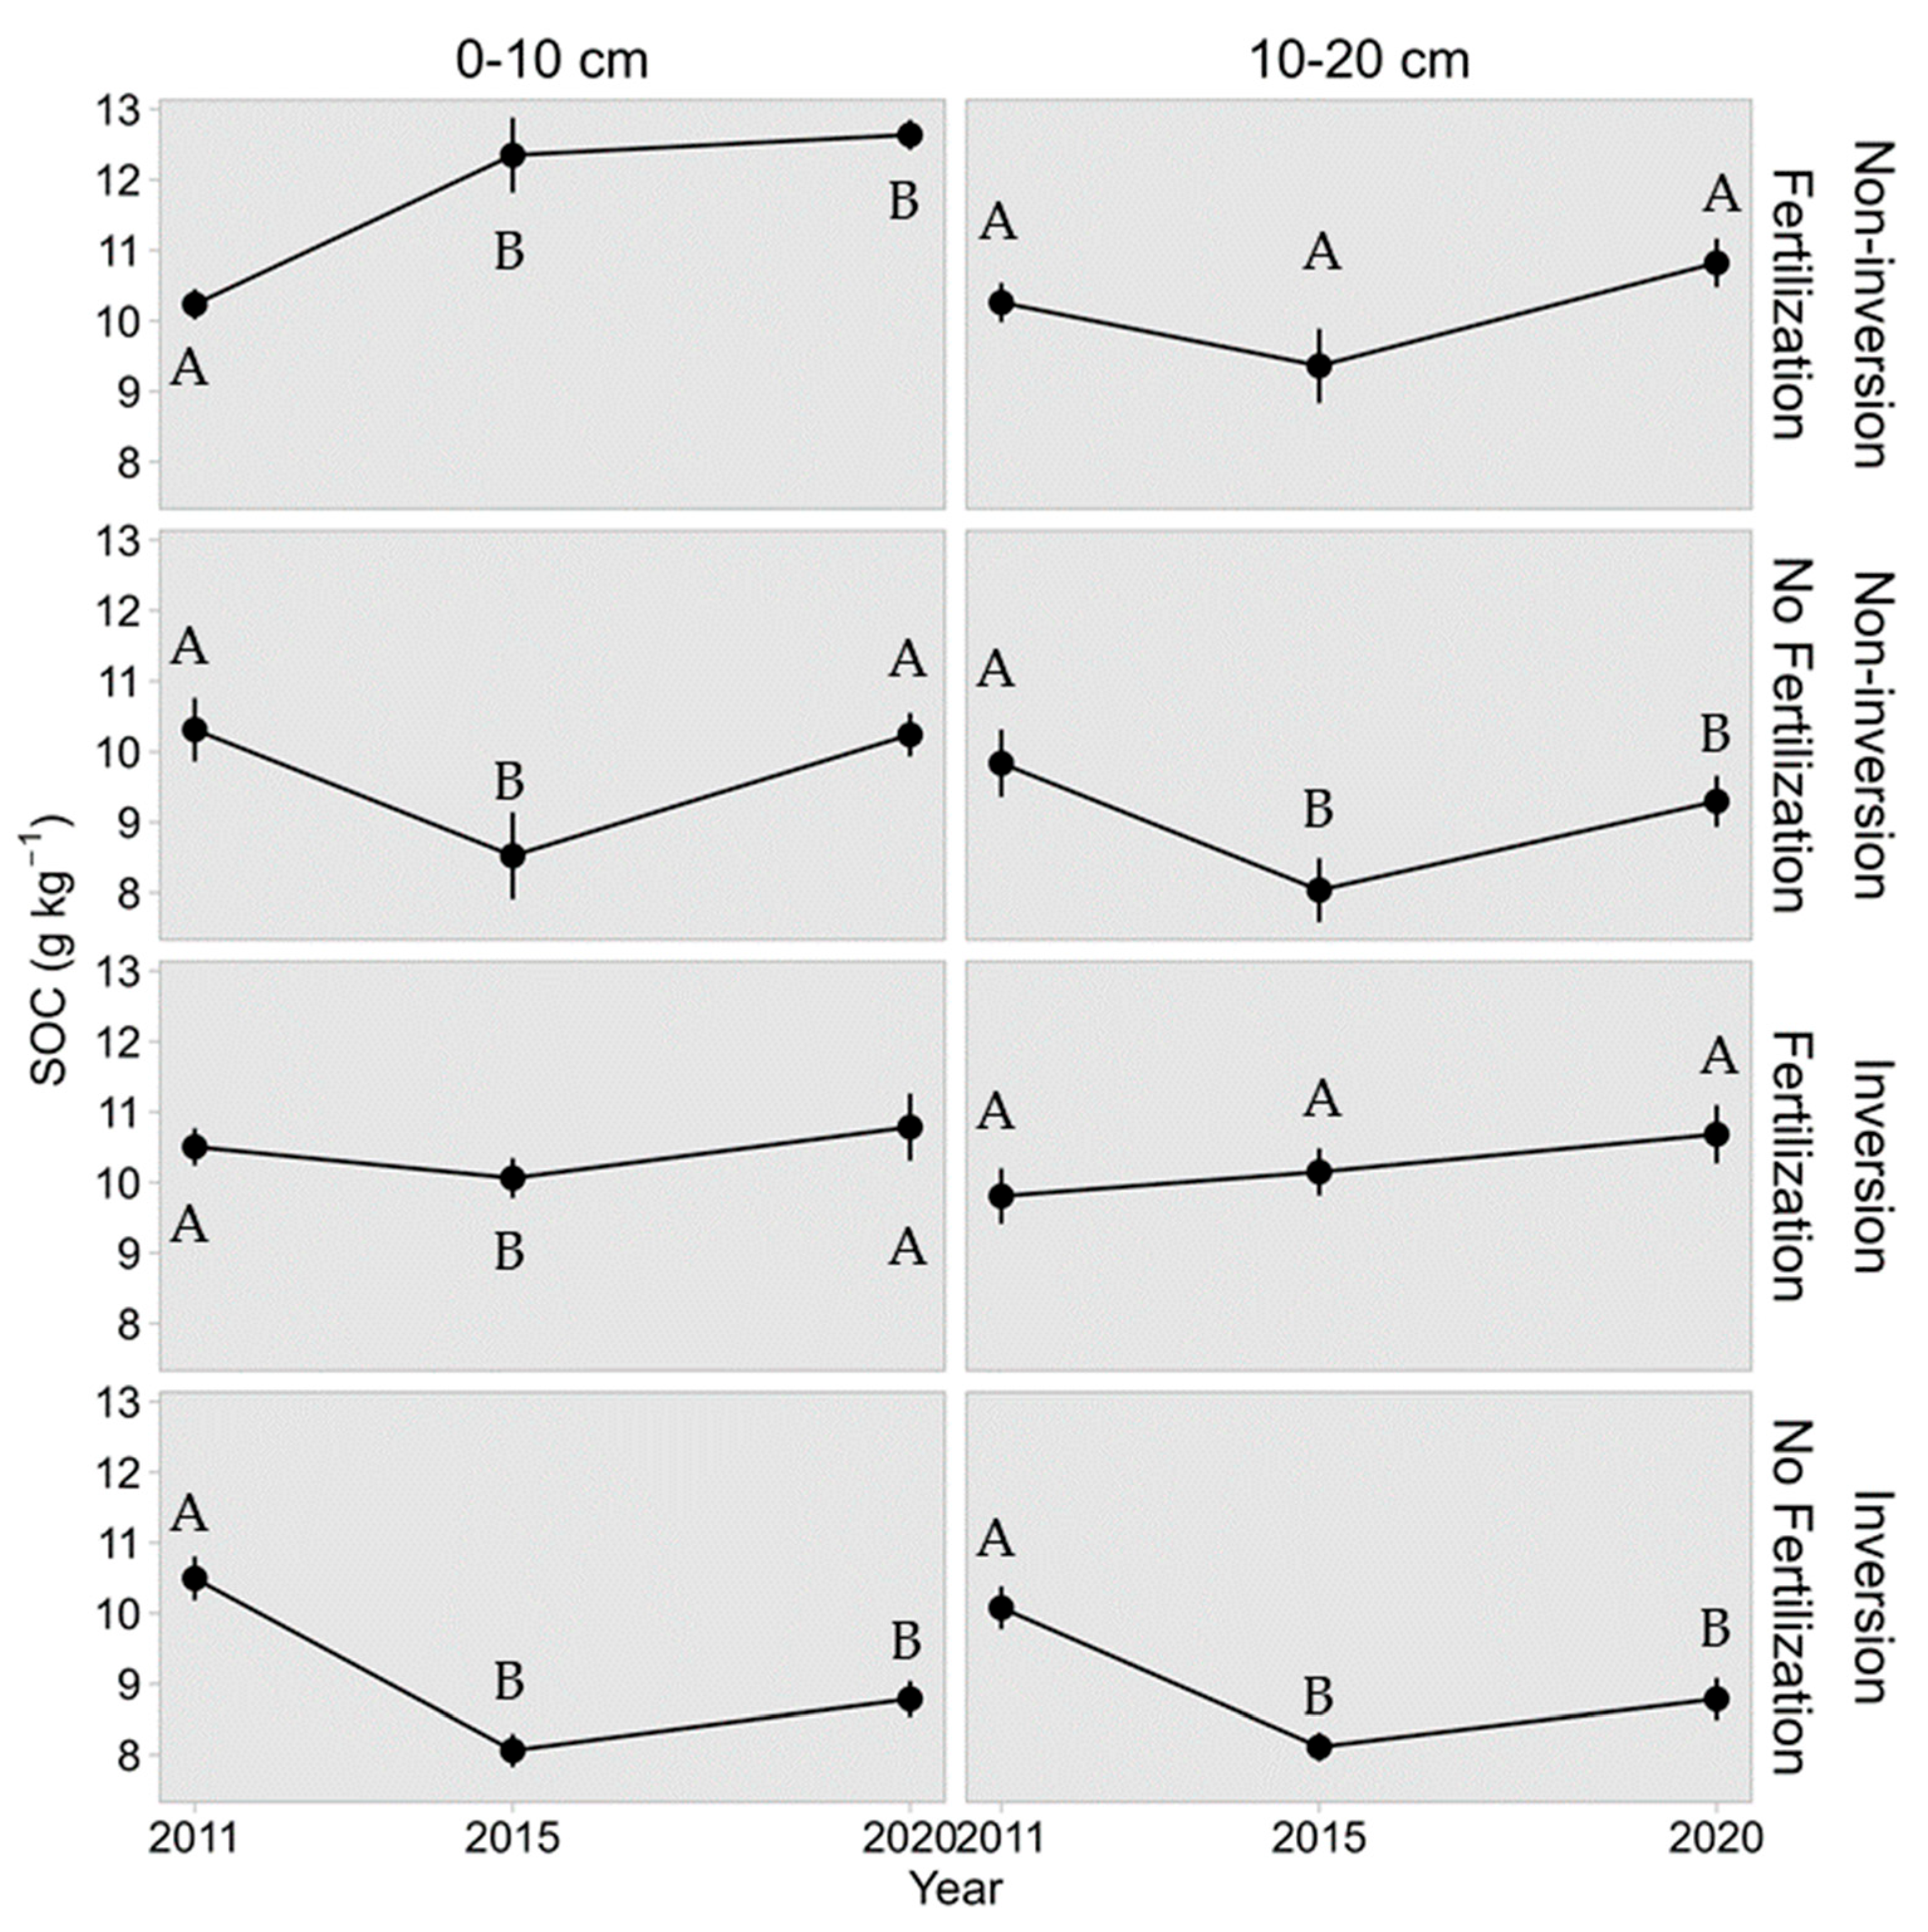
During the first 5 years of the experiment (Figure 2), increases in the SOC occurred only in topsoil of fertilized plots with non-inversion tillage. No changes were observed in the subsurface of fertilized plots. The unfertilized soils showed a decrease in SOC, regardless of the tillage applied. After 10 years, net increases in SOC (+23.5% over baseline) were detected in the topsoil of fertilized plots when non-inversion tillage was used.
The total N content underwent a different pattern since a general increase for all combinations of factors occurred during the first five years (on average + 22%) (Figure 3). This increase was larger in the topsoil of fertilized plots when non-inversion tillage was applied (+45.7%) (Figure 3). However, during the second period, the general increase in N ceased. N gains in the topsoil of fertilized plots were no longer observed when non-inversion tillage was used. Similarly, in both depths of fertilized plots, N levels no longer increased during the second period when inversion tillage was applied.
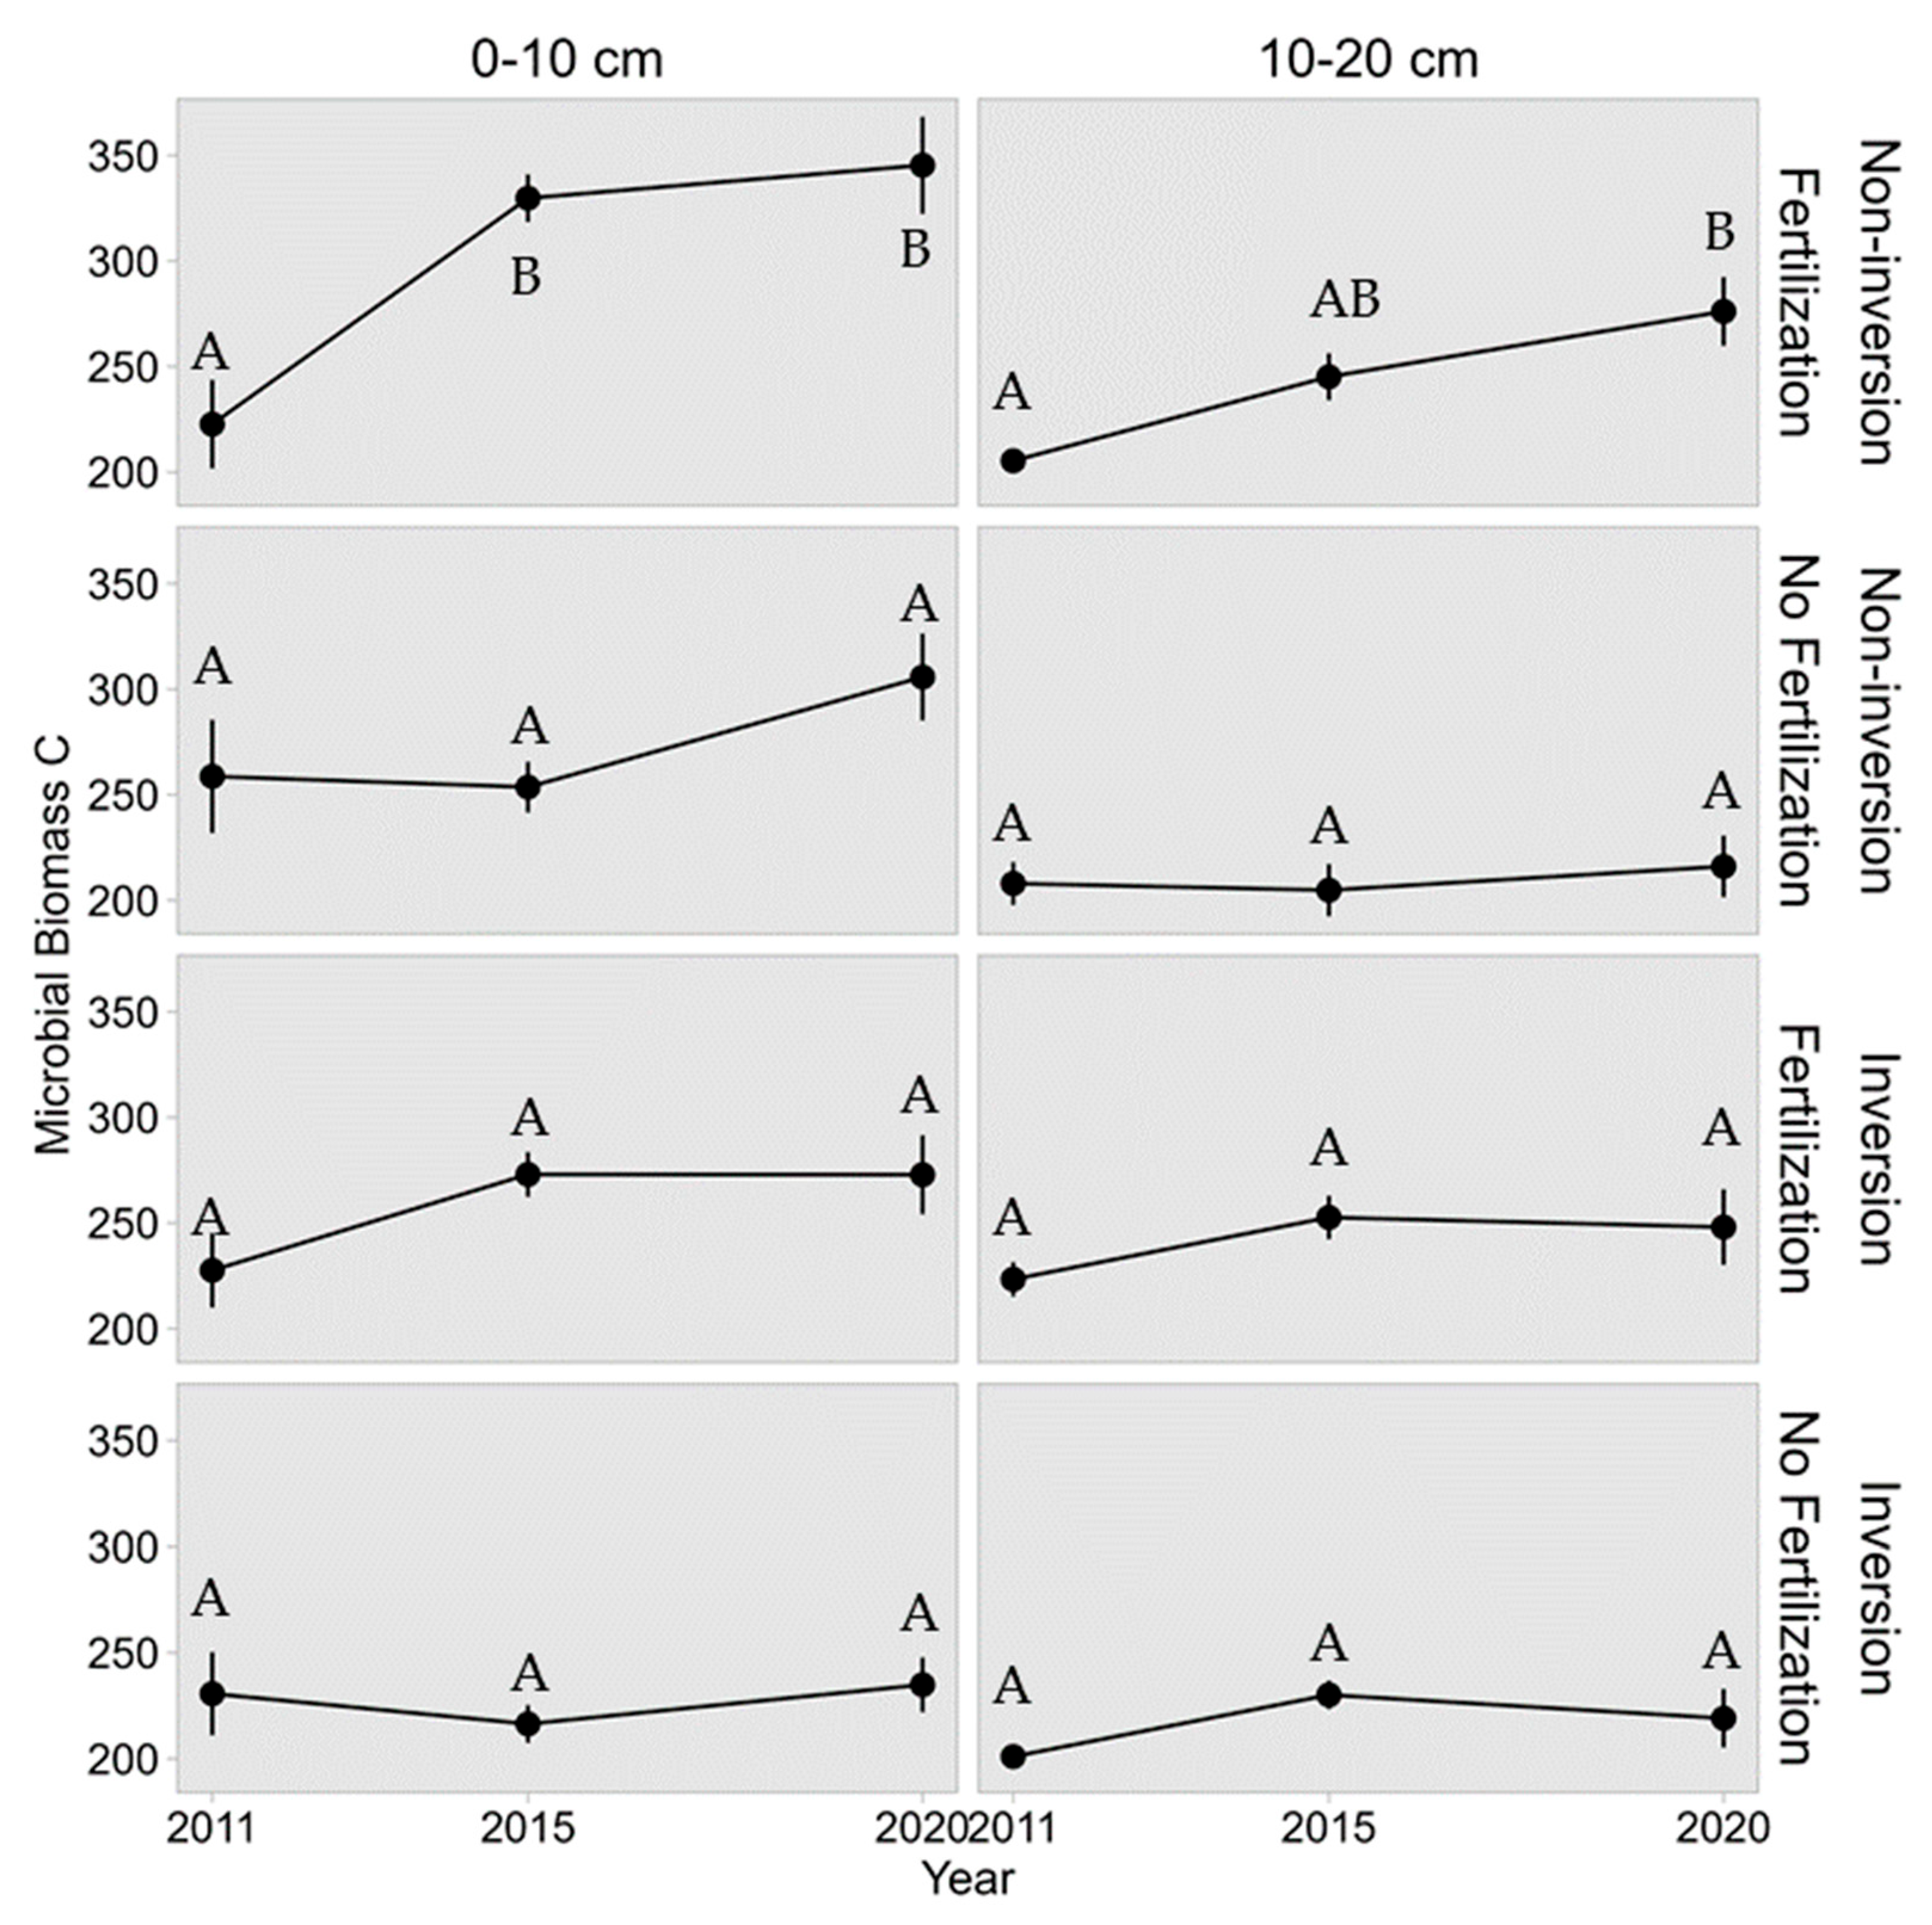
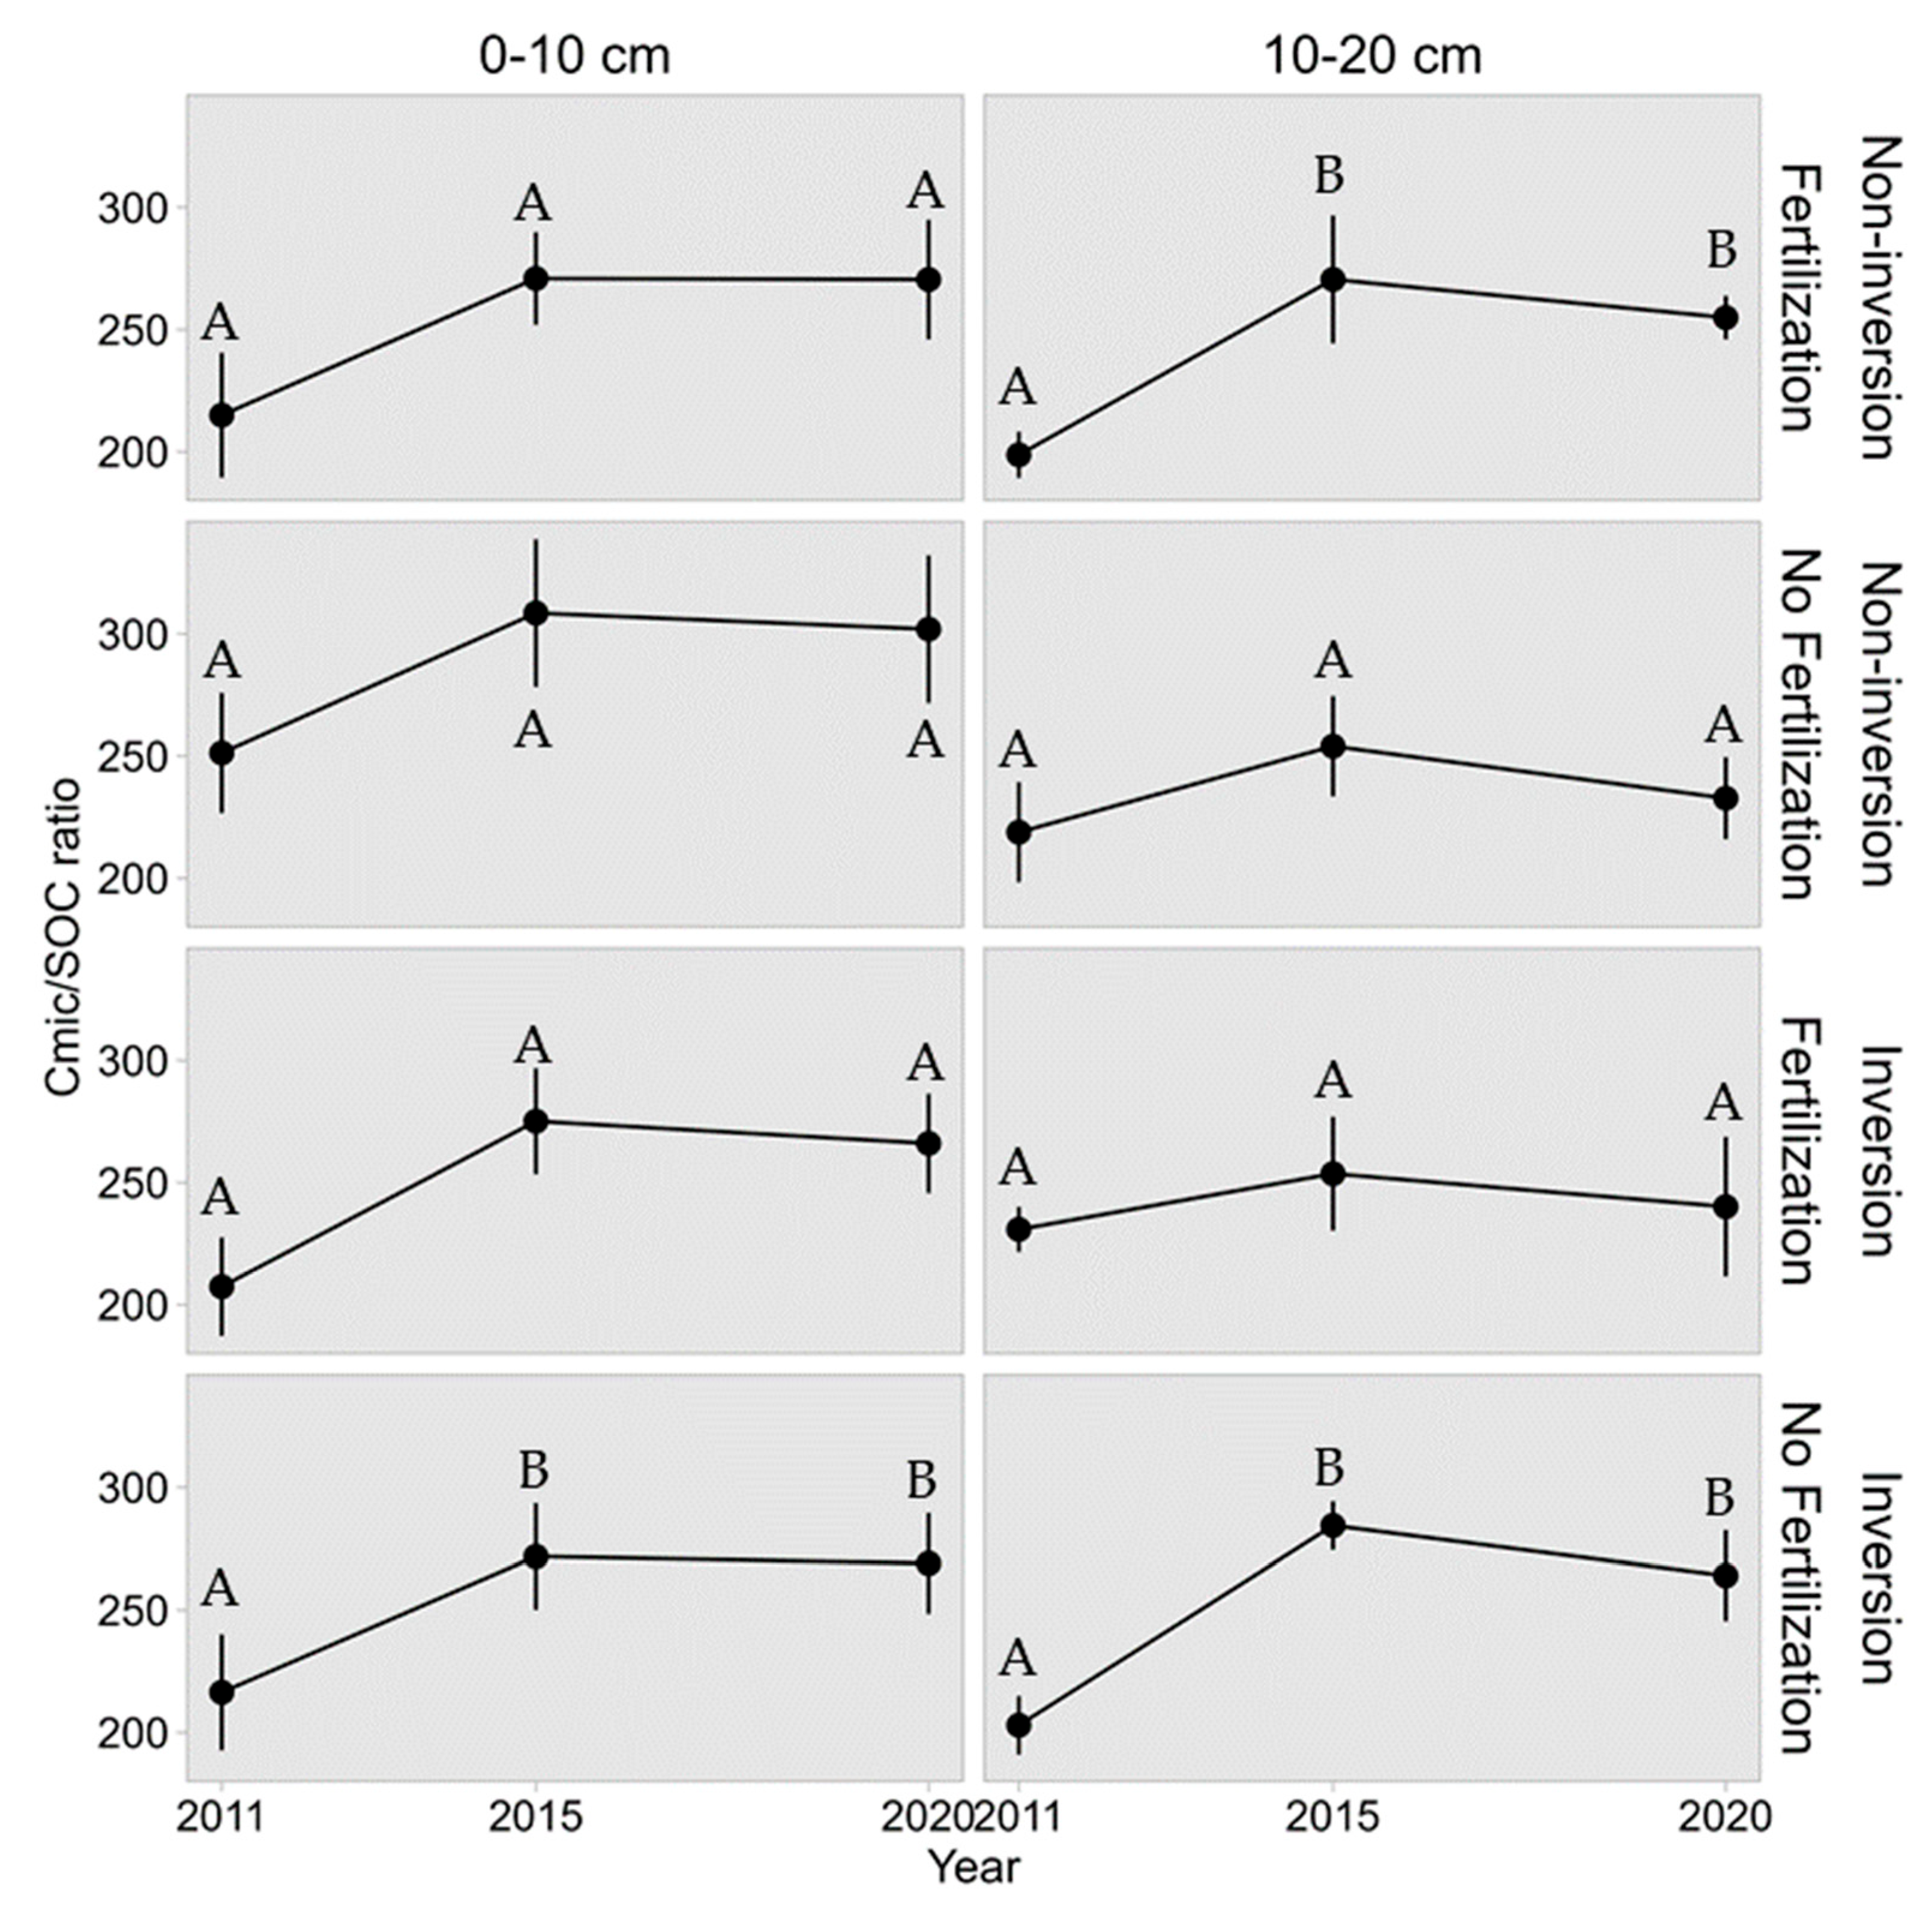
Cmic remained stable for most combinations of factors; only fertilized plots with non-inversion tillage increased their Cmic (Figure 4, Table A4). This increase occurred during the first 5 years of experimentation for the topsoil and during the second 5-year period for the subsurface. The Cmic/SOC ratio increased significantly in the subsurface of fertilized plots under non-inversion tillage, concurrently with an increase in Cmic (Figure 5, Table A5). On the contrary, in unfertilized plots with inversion tillage, increases in the Cmic/SOC ratio coincided with losses in SOC.

3.2. Response of SOC and Total N to Experimental Factors

During the 10-year duration of the experiment, fertilization was the main factor explaining SOC increases and N. However, changes in fertilization application generated two contrasted periods in which the soil parameters’ change presented a different pattern.

3.2.1. 2011–2015

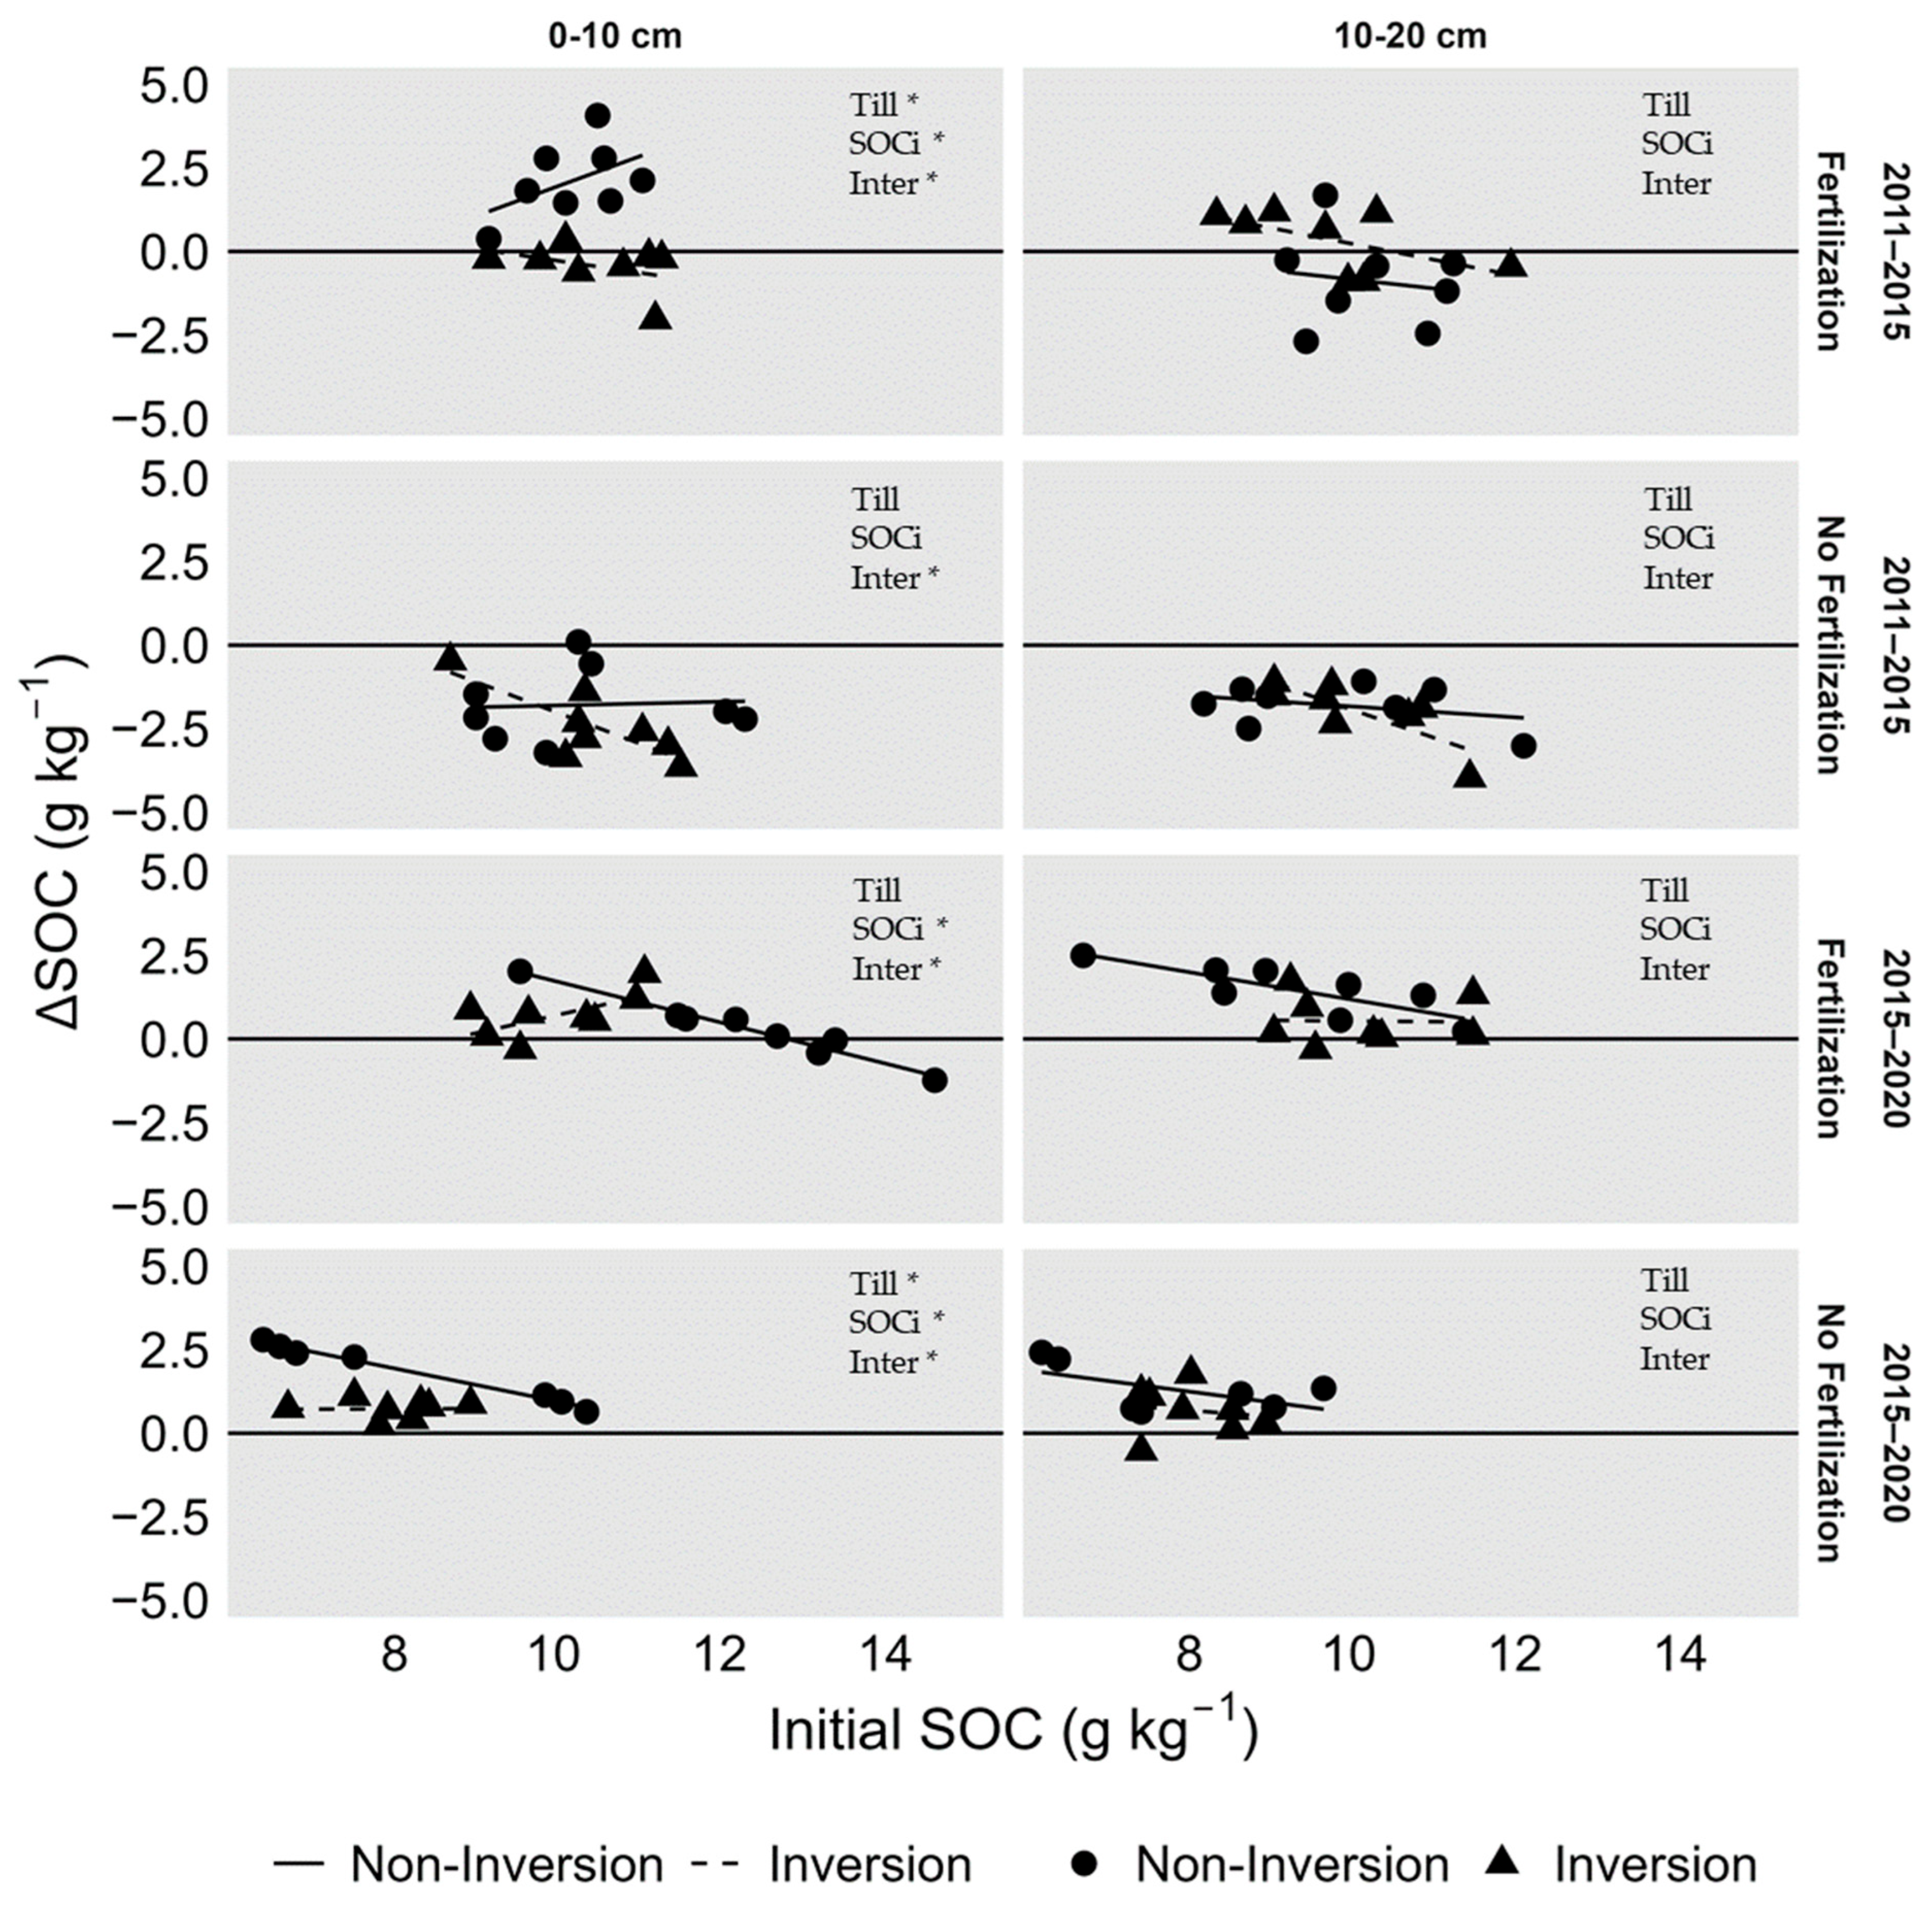
In the first period, tillage intensity affected SOC changes (Table A2, Figure 6). Significant gains in SOC occurred only in the surface of fertilized plots. However, inversion tillage caused no changes for the same situation. Unfertilized plots experienced significant SOC losses for both inversion and non-inversion tillage. The initial SOC also played a significant role in SOC changes in the topsoil (Table A2). In fertilized plots, non-inversion tillage promoted SOC gains in topsoil soils, which positively related to the initial SOC. Conversely, in unfertilized subsurface soils, SOC losses showed a negative correlation with the initial SOC but only in inversion tillage soils. In the subsurface layer, the initial SOC had no measurable effect on SOC changes.
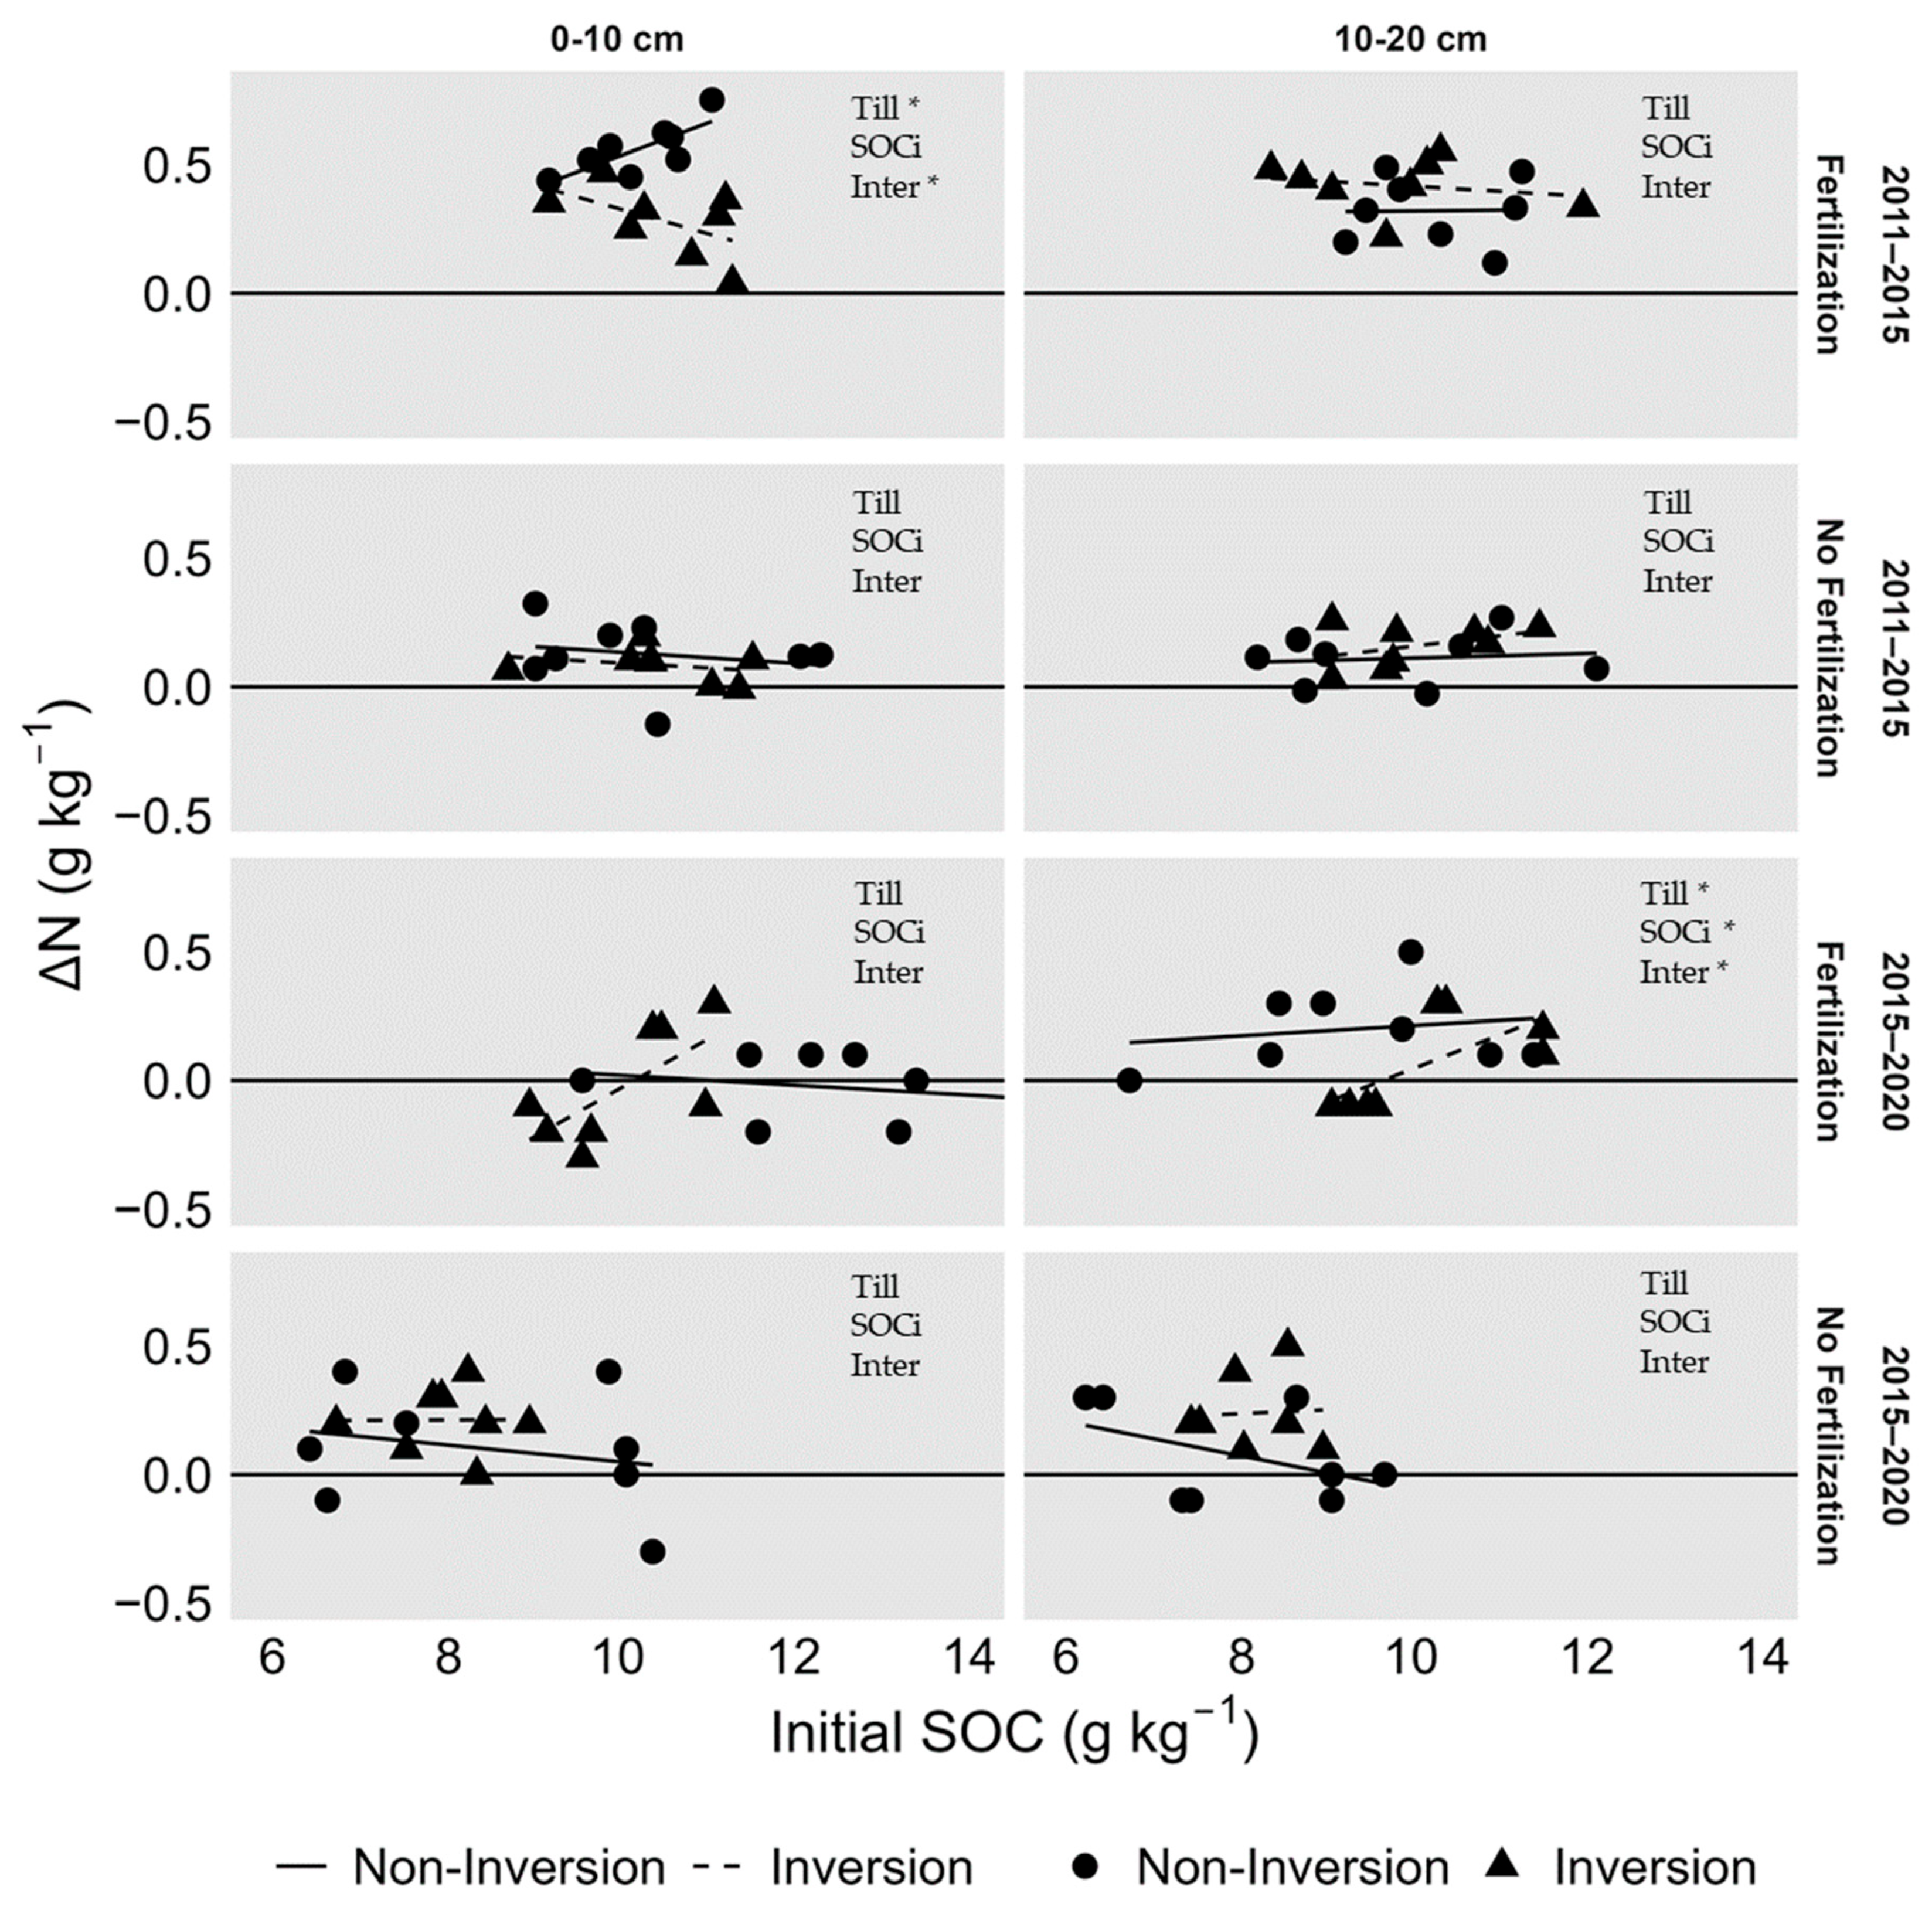
Increases in total N were detected for all treatments (Table A2, Figure 7). In the topsoil of fertilized plots, non-inversion tillage favored greater gains in soils with a higher initial SOC, whereas the opposite trend was observed with inversion tillage. Similarly to the observations for SOC changes, no effects of the initial SOC on N changes were detected.

3.2.2. 2015–2020

During the second period, a general increase in the SOC occurred for all combinations of factors (Table A2, Figure 6). In the topsoil of fertilized plots, non-inversion tillage favored larger gains of SOC, and the initial SOC showed significant effects but only in the topsoil, as also occurred in the first period. In this case, the increase in SOC was negatively correlated with the initial SOC when non-inversion tillage was used in both fertilized and unfertilized plots. On the other hand, SOC presented a negative correlation with the initial SOC in unfertilized plots regardless of tillage.
Increases in N (Table A2, Figure 7) under the fertilization regime occurred only in the subsurface, favored by non-inversion tillage. On the contrary, under no fertilization, the use of inversion tillage caused gains in the N content.

4. Discussion

The present study shows that SOC and N content responded to the combined effects of fertilization and tillage. This response was sensitive to the initial SOC content and specific to each soil layer.
Our long-term experiment revealed that soil management practices, particularly tillage and organic fertilization, had a marked influence on the dynamics of SOC, N, and microbial biomass. Over the 10-year period, non-inversion tillage promoted SOC accumulation and stratification in the topsoil, while inversion tillage led to depletion. The application of farmyard manure further enhanced SOC and N stocks, with effects persisting several years after the last application, suggesting a long-lasting impact under Mediterranean conditions. Cmic and the Cmic/SOC ratio also responded positively to the combined effect of non-inversion tillage and organic fertilization, particularly in subsurface layers

4.1. Response of SOC, Total N, and Microbial Biomass to Management

4.1.1. Response of SOC

During the 10 years of the experiment, SOC increased in the topsoil under non-inversion tillage, which also caused the stratification of SOC (Figure 2). These increases were especially significant during the first five years (Figure 6, Table A2). Conversely, SOC depletion occurred when inversion tillage was used. Similar results have been previously reported.
Hernanz et al. [57] associated SOC increases derived from the use of non-inversion and zero tillage to the soil aggregate stability increase under the Mediterranean climate and SOC conditions. Under similar conditions, Martinez-Mena et al. [58] attributed 44% higher SOC increments caused by reduced tillage compared to inversion tillage in the topsoil to soil improvement and its resilience to intense rainfall events and to the increased incorporation of weed biomass. Mihelič et al. [59] detected SOC increases of 12% after 5 years of the experiment under non-inversion tillage in a continental climate and attributed them to slower decomposition and to greater carbon inputs from weed incorporation into the soil. Swanepoel et al. [60] found, for SOC values similar to our experiment, that reduced tillage was the only significant experimental factor explaining SOC increases. Comparable trends have been shown in soils richer in SOC under organic farming in different climatic areas in Europe when fertilization and reduced tillage were applied [25,31,61]. In contrast, other authors like Sacco et al. [62] observed no SOC changes six years after conversion to organic farming in the Mediterranean area, and Martin-Lammerding et al. [63] found no effect of tillage under similar conditions in Spain. In our case, the differences in SOC accumulation between both tillage strategies occurred during the first five years of the experiment when fertilization was applied (Figure 6, Table A2). In contrast, the differences in SOC between non-inversion and inversion tillage were evidenced only during the second period under no fertilization (Figure 6, Table A2).
Our experiment showed that SOC depletion occurred only under no fertilization. On the contrary, the addition of farmyard manure resulted in SOC increases in topsoil during the first and second period and in the subsurface in the second period. This is in line with previous studies showing manure’s capacity to positively impact SOC [34,64]. Organic fertilization helps increasing SOC as manure organic carbon is partially incorporated into soil organic matter [65]. In our study, the effects of fertilization were persistent after 4 years since the last manure application (Table A2), suggesting an extended influence in the time of farmyard manure despite the high mineralizer conditions. Our results also evidenced that SOC increases at the subsurface derived from manure application take more time to occur. These findings are in line with those of Reimer et al. [30] who found +13% of SOC with no fertilization even 18 years after the last composted manure application. In our case, increases in SOC detected during the second period with no fertilization could be partially attributed to crop and weed biomass incorporation to the soil after harvest (Table 2), which is consistent with the findings also reported under a continental climate [66].

4.1.2. Response of Total N

Whereas the SOC undergoes different dynamics in accordance with specific experimental factor combinations, we detected a general increase in N across treatments (Figure 3). This increase was not homogeneous across combinations of factors. Similarly to the effects on SOC, changes in N are influenced by similar physical processes [67]. The fertilization effect in N has been widely reported [68].
In our experiment, the combination of fertilization and non-inversion tillage favored larger N increases than when inversion tillage was applied (Figure 7, Table A3). N increases occurred faster in topsoil than in the subsurface. Despite farmyard manure’s application effect on N increases, these changes in N may also be explained by other factors, such as atmospheric deposition, biological fixation, and N-rich legume biomass incorporation into the soil [69,70,71].

4.1.3. Response of Cmic

Increases in Cmic only occurred under fertilization combined with non-inversion tillage and were evident earlier in the topsoil (Figure 5, Table A4). Our results align with the general trends previously found. Manure application is an influential factor determining the diversity of soil microbiota [72]. D’Hose et al. [22] in a meta-analysis covering the effects of non-inversion tillage and organic amendments in Europe, point out that microbial populations are enhanced by organic fertilization and non-inversion tillage compared to inversion tillage, especially in topsoil. Their combined effect facilitates the accumulation of resources in topsoil that are available for microorganisms. In our study, this buildup in the subsurface coincides with an increase in the Cmic/SOC ratio. Li et al. [73] found that the Cmic/SOC ratio was one of the most important factors affecting microbial dynamics, and it has a crucial role in agricultural sustainability, as soil microbiota are the link between carbon inputs and the soil ecosystem. Ulrich et al. [74] detected increases in the Cmic/SOC ratio in topsoil and showed that microbial communities formed under non-inversion tillage have a lower capacity to degrade organic matter and to stabilize humus than the communities formed under inversion tillage. Therefore, the increases in both Cmic and the Cmic/SOC ratio we detected in subsurface soils (Figure 4 and Figure 5; Table A4 and Table A5) allowed us to determine that the combination of organic fertilization and non-inversion tillage favored the stabilization of soil organic matter through changes in microbiota composition.

4.2. Response of SOC and Total N to Initial SOC

Low SOC concentrations and a high depletion potential due to mineralization under Mediterranean climate restrict agricultural practices’ ability to enhance soil properties. To restore SOC concentrations above the degradation threshold (1.1–1.5%), it is crucial to reduce or even overturn soil degradation trends [75]. Therefore, assessing the effects of initial soil conditions on SOC and N changes is of great importance.

4.2.1. SOC Response

In our study, a significant relationship between the initial SOC and SOC changes was only detected in topsoil, where higher increases in SOC occurred and varied depending on the tillage and fertilization regime. Under no fertilization, a negative relationship was present during the first 5 years of the experiment when inversion tillage was used (Figure 6). During the second period of the experiment, this relationship was also detected under non-inversion tillage, while the effect of the initial SOC under inversion tillage was no longer detected. Our results showed that the negative relationship with the initial SOC primarily occurs in topsoil when SOC increased. A decrease in SOC gain when starting from a higher initial SOC has been previously detected, but different mechanisms may be behind this relationship. Francaviglia et al. [76] hypothesized that it may be a consequence of carbon accumulation in stable aggregates. In contrast, results obtained by Sun et al. [77] evidenced that a lower initial SOC favored carbon sequestration in soil. Moreover, Pezzuolo et al. [78] showed that the SOC loss rate positively escalated with initial soil organic matter. This negative relation could be explained by soil carbon saturation, where higher SOC values approach a saturation point, leading to increasingly smaller gains in the SOC [46,79], even exhibiting asymptotic behavior [80]. Our results are consistent with this concept, as SOC changes presented a negative correlation with the initial SOC as a general trend. However, results showed an exception. When farmyard manure was applied annually, this relation was inverted in the topsoil when non-inversion tillage was used, and a higher initial SOC correlated with larger increases in SOC during the first 5 years of the experiment. It therefore appears that, in our particular case, the mechanism governing the relationship between SOC changes and its initial condition remain unclear, as it exhibited an opposed behavior under certain conditions. This may be attributed to external factors, such as climate, as well as the low SOC content that characterized the soil.

4.2.2. Total N Response

Regarding N, the initial SOC presented a significant effect only in topsoil under non-inversion tillage when farmyard manure was applied. The trend is similar to that of SOC under the same regime, having a positive relationship with the initial SOC under non-inversion tillage and, conversely, a negative relationship under inversion tillage (Figure 7). These results suggest that, in soils with a low initial SOC, the combination of fertilization and non-inversion tillage may initially favor faster N increases.

5. Conclusions

Our study has shed some light on the effects that contrasting tillage and fertilization practices have on SOC and total N behavior under organic farming. We found a contrasted effect in changes, as they occur faster under non-inversion tillage and the use of farmyard manure, conditions that favor SOC and N accumulation and microbial biomass. SOC and N increases in the topsoil showed the potential to mitigate degradation in Mediterranean arable soils with low organic matter derived from agricultural practices and the climate. Our results also indicate that the enhancement of SOC and N occurred more superficially than previously found by the literature, and that soil changes at greater depth soil may take longer time spans to occur.
Additionally, the initial SOC levels play a role in SOC and N changes in the topsoil, where increases were higher. However, the concise response of changes to initial conditions remained uncertain. Nevertheless, our results showed that it is possible to promote SOC and N even in poor soils under Mediterranean conditions through the combination of reduced tillage and organic fertilization in organic farming.

Author Contributions

Conceptualization, F.X.S. and J.R.; methodology, F.X.S. and J.R.; software, J.M.B.-M. and D.B.; validation, J.M.B.-M.; formal analysis, J.M.B.-M. and D.B.; investigation, F.X.S., J.R., J.M.B.-M. and D.B.; resources, F.X.S.; data curation, J.M.B.-M. and D.B.; writing—original draft preparation, D.B.; writing—review and editing, F.X.S., J.R., J.M.B.-M. and D.B.; visualization, F.X.S., J.R., J.M.B.-M. and D.B.; supervision, F.X.S., J.R. and J.M.B.-M.; project administration, F.X.S. and J.M.B.-M.; funding acquisition, F.X.S. and J.M.B.-M. All authors have read and agreed to the published version of the manuscript.

Funding

This work was supported by PID2021-127575OB-I00 from the Spanish Ministry of Science and Innovation; the European Union’s Horizon 2020 research and innovation program under Grant Agreement no. 773554; the Ministry of Economy and Competitiveness through the National Institute of Agrarian and Food Research and Technology (INIA), part of the CORE Organic Plus funding bodies, which in turn are partners of FP7 ERA-Net and financed by the European Commission through projects TILMAN-ORG (249667) and FERTILCROP (618107); the Department of Agriculture, Livestock, Fisheries and Food of Catalonia (projects 2011 AGEC 001, 2012 AGEC 00027, 53 05007 2015).

Institutional Review Board Statement

Not applicable.

Data Availability Statement

Restrictions apply to the datasets: The data presented in this article are already stored and published in Zenodo (https://doi.org/10.5281/zenodo.15267727) and will be public once the embargo finishes.

Acknowledgments

During the preparation of this manuscript, the authors used Microsoft Copilot for the purposes of improving clarity and conciseness throughout the writing process. The authors have reviewed and edited the output and take full responsibility for the content of this publication.

Conflicts of Interest

Daniel Bragg reports financial support was provided by the Government of Spain Ministry of Universities in form of a PhD scholarship (FPU code FPU21/03708). The other authors declare that they have no known competing financial interests or personal relationships that could have appeared to influence the work reported in this paper. The funders had no role in the design of the study; in the collection, analyses, or interpretation of data; in the writing of the manuscript; or in the decision to publish the results.

Appendix A

Figure A1. Photos showing the study site. The image on the left corresponds to the Espai Rural de Interès Natural de Gallecs, while the one on the right shows the Gallecs long-term experimental field.
Agriculture 15 02117 g0a1
Table A1. Values for the total Nitrogen content (expressed in g kg−1) present in the manure applied each year were calculated using the Kjeldahl method.
Year201220132014201520162021
N kje23.82635.630.135.626.2
Table A2. Estimates and statistical significance from LMM analyses of changes in SOC (g kg−1) in response to tillage and initial SOC (g kg−1) between 2011–2015 and 2015–2020 by fertilization and depth. “*” indicates a significant effect (p < 0.01).
2011–20152015–2020
ΔSOC (Estimate ± Standard Error)
Fertilization
0–10 cm
Intercept (average in chisel)2.24 ± 0.39 * 1.25 ± 0.24 *
Tillage (T) (chisel vs. moldboard)−2.55 ± 0.19 *−0.20 ± 0.33
Initial SOC0.62 ± 0.2 *−1.39 ± 0.17 *
Interaction−1.27 ± 0.26 *1.86 ± 0.26 *
Fertilization
10–20 cm
Intercept (average in chisel)−0.81 ± 0.481.29 ± 0.21 *
Tillage (T) (chisel vs. moldboard)0.95 ± 0.40−0.75 ± 0.30
Initial SOC−0.39 ± 0.41−0.54 ± 0.22
Interaction−0.47 ± 0.49 0.51 ± 0.35
No Fertilization
0–10 cm
Intercept (average in chisel)−1.79 ± 0.39 *1.87 ± 0.13 *
Tillage (T) (chisel vs. moldboard)−0.56 ± 0.25−1.2 ± 0.07 *
Initial SOC−0.001 ± 0.22−0.84 ± 0.06 *
Interaction−0.98 ± 0.30 *0.54 ± 0.11 *
No Fertilization
10–20 cm
Intercept (average in chisel)−1.82 ± 0.19 *1.24 ± 0.26 *
Tillage (T) (chisel vs. moldboard)−0.04 ± 0.28−0.544 ± 0.25
Initial SOC−0.18 ± 0.17−0.44 ± 0.2
Interaction−0.75 ± 0.32−0.12 ± 0.40
Table A3. Estimates and statistical significance from LMM analyses of changes in N (g kg−1) in response to tillage and initial SOC (g kg−1) between 2011–2015 and 2015–2020 by fertilization and depth; “*” indicates a significant effect (p < 0.01).
2011–20152015–2020
ΔN (Estimate ± Standard Error)
Fertilization
0–10 cm
Intercept (average in chisel)0.58 ± 0.03 *0.02 ± 0.07
Tillage (T) (chisel vs. moldboard)−0.28 ± 1.9 × 10⁻⁹ *−0.12 ± 0.14
Initial SOC0.09 ± 0.04 −0.06 ± 0.07
Interaction−0.15 ± 0.05 *0.30 ± 0.12
Fertilization
10–20 cm
Intercept (average in chisel)0.33 ± 0.05 *0.2 ± 0.06 *
Tillage (T) (chisel vs. moldboard)0.09 ± 0.05−0.18 ± 0.07
Initial SOC−0.02 ± 0.050.01 ± 0.05
Interaction0.02 ± 0.060.12 ± 0.08
No Fertilization
0–10 cm
Intercept (average in chisel)0.13 ± 0.03 *0.11 ± 0.06
Tillage (T) (chisel vs. moldboard)−0.04 ± 0.050.11 ± 0.09
Initial SOC−0.02 ± 0.03−0.04 ± 0.05
Interaction0.002 ± 0.050.04 ± 0.14
No Fertilization
10–20 cm
Intercept (average in chisel)0.11 ± 0.04 *0.07 ± 0.07
Tillage (T) (chisel vs. moldboard)0.05 ± 0.030.17 ± 0.05
Initial SOC−0.01 ± 0.03−0.007 ± 0.04
Interaction0.04 ± 0.04−0.06 ± 0.08
Table A4. Mean and standard error of Cmic values per year and experimental factors. Different letters indicate significant differences between Cmic values of the same row. Cmic is expressed in mg total organic carbon g of soil−1.
201120162020
0–10 cmFertilizationNon-Inversion222.70 ± 20.98 A329.75 ± 11.29 B345.35 ± 23.04 B
Inversion227.60 ± 17.65 A273.01 ± 10.65 A272.85 ± 18.72 A
No FertilizationNon-Inversion258.70 ± 26.85 A253.64 ± 12.03 A305.77 ± 20.58 A
Inversion230.70 ± 19.64 A216.43 ± 8.93 A234.92 ± 12.95 A
10–20 cmFertilizationNon-Inversion205.40 ± 5.30 A245.16 ± 11.15 A B276.12 ± 16.3 B
Inversion223.40 ± 8.16 A252.63 ± 10.3 A260.72 ± 18.77 A
No FertilizationNon-Inversion207.96 ± 10.22 A204.81 ± 12.39 A216.06 ± 14.61 A
Inversion203.59 ± 5.64 A230.14 ± 6.70 A231.60 ± 17.04 A
Table A5. Mean and standard error of Cmic/SOC ratio values per year and experimental factors. Different letters indicate significant differences between Cmic/SOC values of the same row. Cmic/SOC is expressed in mg total organic carbon g of soil−1.
201120162020
0–10 cmFertilizationNon-Inversion214.97 ± 25.6 A270.89 ± 18.99 A270.48 ± 24.52 A
Inversion207.43 ± 20.14 A275.14 ± 21.71 A266.06 ± 20.39 A
No FertilizationNon-Inversion251.3 ± 24.61 A308.55 ± 30.22 A301.96 ± 30.27 A
Inversion216.45 ± 23.71 A271.86 ± 21.75 B269.04 ± 20.59 B
10–20 cmFertilizationNon-Inversion198.72 ± 9.46 A270.52 ± 26.18 B254.89 ± 8.93 B
Inversion230.86 ± 9.25 A253.66 ± 23.32 A240.17 ± 28.58 A
No FertilizationNon-Inversion218.85 ± 20.5 A254.03 ± 20.55 A232.76 ± 16.83 A
Inversion202.99 ± 12.01 A284.45 ± 9.91 B264.04 ± 18.56 B

References

  1. Gebremedhin, M.; Coyne, M.S.; Sistani, K.R. How Much Margin Is Left for Degrading Agricultural Soils? The Coming Soil Crises. Soil Syst. 2022, 6, 22. [Google Scholar] [CrossRef]
  2. European Commission: Directorate-General for Research and Innovation; Veerman, C.; Pinto Correia, T.; Bastioli, C.; Biro, B.; Bouma, J.; Cienciala, E.; Emmett, B.; Frison, E.A.; Grand, A.; et al. Caring for Soil is Caring for Life—Ensure 75% of Soils Are Healthy by 2030 for Food, People, Nature and Climate—Report of the Mission Board for Soil Health and Food; EU publications: Luxembourg, 2020; Available online: https://data.europa.eu/doi/10.2777/821504 (accessed on 7 February 2024).
  3. Grilli, E.; Carvalho, S.C.P.; Chiti, T.; Coppola, E.; D’Ascoli, R.; La Mantia, T.; Marzaioli, R.; Mastrocicco, M.; Pulido, F.; Rutigliano, F.A.; et al. Critical Range of Soil Organic Carbon in Southern Europe Lands under Desertification Risk. J. Environ. Manag. 2021, 287, 112285. [Google Scholar] [CrossRef]
  4. Lal, R. Soil Carbon Sequestration Impacts on Global Climate Change and Food Security. Science 2004, 304, 1623–1627. [Google Scholar] [CrossRef]
  5. Gama-Rodrigues, A.C. Soil Organic Matter, Nutrient Cycling and Biological Dinitrogen-Fixation in Agroforestry Systems. Agroforest Syst 2011, 81, 191–193. [Google Scholar] [CrossRef]
  6. Molina-Herrera, S.; Romanyà, J. Synergistic and Antagonistic Interactions among Organic Amendments of Contrasted Stability, Nutrient Availability and Soil Organic Matter in the Regulation of C Mineralisation. Eur. J. Soil Biol. 2015, 70, 118–125. [Google Scholar] [CrossRef]
  7. González-Sánchez, E.J.; Ordóñez-Fernández, R.; Carbonell-Bojollo, R.; Veroz-González, O.; Gil-Ribes, J.A. Meta-Analysis on Atmospheric Carbon Capture in Spain through the Use of Conservation Agriculture. Soil Tillage Res. 2012, 122, 52–60. [Google Scholar] [CrossRef]
  8. Janzen, H.H. The Soil Carbon Dilemma: Shall We Hoard It or Use It? Soil Biol. Biochem. 2006, 38, 419–424. [Google Scholar] [CrossRef]
  9. Paustian, K.; Lehmann, J.; Ogle, S.; Reay, D.; Robertson, G.P.; Smith, P. Climate-Smart Soils. Nature 2016, 532, 49–57. [Google Scholar] [CrossRef]
  10. Robertson, G.P.; Vitousek, P.M. Nitrogen in Agriculture: Balancing the Cost of an Essential Resource. Annu. Rev. Environ. Resour. 2009, 34, 97–125. [Google Scholar] [CrossRef]
  11. Seufert, V.; Ramankutty, N.; Foley, J.A. Comparing the Yields of Organic and Conventional Agriculture. Nature 2012, 485, 229–232. [Google Scholar] [CrossRef]
  12. Ma, F.; Wang, C.; Zhang, Y.; Chen, J.; Xie, R.; Sun, Z. Development of Microbial Indicators in Ecological Systems. Int. J. Environ. Res. Public Health 2022, 19, 13888. [Google Scholar] [CrossRef]
  13. Busari, M.A.; Kukal, S.S.; Kaur, A.; Bhatt, R.; Dulazi, A.A. Conservation Tillage Impacts on Soil, Crop and the Environment. Int. Soil Water Conserv. Res. 2015, 3, 119–129. [Google Scholar] [CrossRef]
  14. Liang, B.; Yang, X.; He, X.; Zhou, J. Effects of 17-Year Fertilization on Soil Microbial Biomass C and N and Soluble Organic C and N in Loessial Soil during Maize Growth. Biol. Fertil. Soils 2011, 47, 121–128. [Google Scholar] [CrossRef]
  15. Stoate, C.; Báldi, A.; Beja, P.; Boatman, N.D.; Herzon, I.; van Doorn, A.; de Snoo, G.R.; Rakosy, L.; Ramwell, C. Ecological Impacts of Early 21st Century Agricultural Change in Europe—A Review. J. Environ. Manag. 2009, 91, 22–46. [Google Scholar] [CrossRef] [PubMed]
  16. Blanco-Canqui, H.; Ruis, S.J.; Francis, C.A. Do Organic Farming Practices Improve Soil Physical Properties? Soil Use Manag. 2024, 40, e12999. [Google Scholar] [CrossRef]
  17. Francaviglia, R.; Almagro, M.; Vicente-Vicente, J.L. Conservation Agriculture and Soil Organic Carbon: Principles, Processes, Practices and Policy Options. Soil Syst. 2023, 7, 17. [Google Scholar] [CrossRef]
  18. Gattinger, A.; Muller, A.; Haeni, M.; Skinner, C.; Fliessbach, A.; Buchmann, N.; Mäder, P.; Stolze, M.; Smith, P.; Scialabba, N.E.-H.; et al. Enhanced Top Soil Carbon Stocks under Organic Farming. Proc. Natl. Acad. Sci. USA 2012, 109, 18226–18231. [Google Scholar] [CrossRef] [PubMed]
  19. Hewelke, E.; Weber, J.; Mielnik, L.; Spaccini, R.; Gozdowski, D.; Podlasiński, M.; Ćwieląg-Piasecka, I.; Jamróz, E.; Jerzykiewicz, M.; Perzanowska, A.; et al. Effect of 55 Years of Different Soil Management on Soil Physical Properties and Stability of Soil Organic Matter. Agric. Ecosyst. Environ. 2026, 396, 110005. [Google Scholar] [CrossRef]
  20. Bilibio, C.; Uteau, D.; Horvat, M.; Rosskopf, U.; Junge, S.M.; Finckh, M.R.; Peth, S. Impact of Ten Years Conservation Tillage in Organic Farming on Soil Physical Properties in a Loess Soil—Northern Hesse, Germany. Agriculture 2023, 13, 133. [Google Scholar] [CrossRef]
  21. West, T.O.; Post, W.M. Soil Organic Carbon Sequestration Rates by Tillage and Crop Rotation. Soil Sci. Soc. Am. J. 2002, 66, 1930–1946. [Google Scholar] [CrossRef]
  22. D’Hose, T.; Molendijk, L.; Van Vooren, L.; Van Den Berg, W.; Hoek, H.; Runia, W.; Van Evert, F.; Ten Berge, H.; Spiegel, H.; Sandèn, T.; et al. Responses of Soil Biota to Non-Inversion Tillage and Organic Amendments: An Analysis on European Multiyear Field Experiments. Pedobiologia 2018, 66, 18–28. [Google Scholar] [CrossRef]
  23. Li, Y.; Wang, Y.; Qiu, G.; Yu, H.; Liu, F.; Wang, G.; Duan, Y. Conservation Tillage Facilitates the Accumulation of Soil Organic Carbon Fractions by Affecting the Microbial Community in an Eolian Sandy Soil. Front. Microbiol. 2024, 15, 1394179. [Google Scholar] [CrossRef]
  24. Alvarez, R. A Review of Nitrogen Fertilizer and Conservation Tillage Effects on Soil Organic Carbon Storage. Soil Use Manag. 2005, 21, 38–52. [Google Scholar] [CrossRef]
  25. Krauss, M.; Wiesmeier, M.; Don, A.; Cuperus, F.; Gattinger, A.; Gruber, S.; Haagsma, W.K.; Peigné, J.; Palazzoli, M.C.; Schulz, F.; et al. Reduced Tillage in Organic Farming Affects Soil Organic Carbon Stocks in Temperate Europe. Soil Tillage Res. 2022, 216, 105262. [Google Scholar] [CrossRef]
  26. Luo, Z.; Wang, E.; Sun, O.J. Can No-Tillage Stimulate Carbon Sequestration in Agricultural Soils? A Meta-Analysis of Paired Experiments. Agric. Ecosyst. Environ. 2010, 139, 224–231. [Google Scholar] [CrossRef]
  27. Edmeades, D.C. The Long-Term Effects of Manures and Fertilisers on Soil Productivity and Quality: A Review. Nutr. Cycl. Agroecosyst. 2003, 66, 165–180. [Google Scholar] [CrossRef]
  28. Simon, C.; Miltner, A.; Mulder, I.; Kaiser, K.; Lorenz, M.; Thiele-Bruhn, S.; Lechtenfeld, O. Long-Term Effects of Manure Addition on Soil Organic Matter Molecular Composition: Carbon Transformation as a Major Driver of Energetic Potential. Soil Biol. Biochem. 2025, 205, 109755. [Google Scholar] [CrossRef]
  29. Crystal-Ornelas, R.; Thapa, R.; Tully, K.L. Soil Organic Carbon Is Affected by Organic Amendments, Conservation Tillage, and Cover Cropping in Organic Farming Systems: A Meta-Analysis. Agric. Ecosyst. Environ. 2021, 312, 107356. [Google Scholar] [CrossRef]
  30. Reimer, M.; Kopp, C.; Hartmann, T.; Zimmermann, H.; Ruser, R.; Schulz, R.; Müller, T.; Möller, K. Assessing Long Term Effects of Compost Fertilization on Soil Fertility and Nitrogen Mineralization Rate. J. Plant Nutr. Soil Sci. 2023, 186, 217–233. [Google Scholar] [CrossRef]
  31. Govednik, A.; Potočnik, Ž.; Eler, K.; Mihelič, R.; Suhadolc, M. Combined Effects of Long-Term Tillage and Fertilisation Regimes on Soil Organic Carbon, Microbial Biomass, and Abundance of the Total Microbial Communities and N-Functional Guilds. Appl. Soil Ecol. 2023, 188, 104876. [Google Scholar] [CrossRef]
  32. Haddaway, N.R.; Hedlund, K.; Jackson, L.E.; Kätterer, T.; Lugato, E.; Thomsen, I.K.; Jørgensen, H.B.; Isberg, P.-E. How Does Tillage Intensity Affect Soil Organic Carbon? A Systematic Review. Environ. Evid. 2017, 6, 30. [Google Scholar] [CrossRef]
  33. Aguilera, E.; Lassaletta, L.; Gattinger, A.; Gimeno, B.S. Managing Soil Carbon for Climate Change Mitigation and Adaptation in Mediterranean Cropping Systems: A Meta-Analysis. Agric. Ecosyst. Environ. 2013, 168, 25–36. [Google Scholar] [CrossRef]
  34. Bertora, C.; Zavattaro, L.; Sacco, D.; Monaco, S.; Grignani, C. Soil Organic Matter Dynamics and Losses in Manured Maize-Based Forage Systems. Eur. J. Agron. 2009, 30, 177–186. [Google Scholar] [CrossRef]
  35. Chocano, C.; García, C.; González, D.; Melgares de Aguilar, J.; Hernández, T. Organic Plum Cultivation in the Mediterranean Region: The Medium-Term Effect of Five Different Organic Soil Management Practices on Crop Production and Microbiological Soil Quality. Agric. Ecosyst. Environ. 2016, 221, 60–70. [Google Scholar] [CrossRef]
  36. Laudicina, V.A.; Badalucco, L.; Palazzolo, E. Effects of Compost Input and Tillage Intensity on Soil Microbial Biomass and Activity under Mediterranean Conditions. Biol. Fertil. Soils 2011, 47, 63–70. [Google Scholar] [CrossRef]
  37. Gardi, C.; Visioli, G.; Conti, F.D.; Scotti, M.; Menta, C.; Bodini, A. High Nature Value Farmland: Assessment of Soil Organic Carbon in Europe. Front. Environ. Sci. 2016, 4, 47. [Google Scholar] [CrossRef]
  38. Jones, R.J.A.; Hiederer, R.; Rusco, E.; Montanarella, L. Estimating Organic Carbon in the Soils of Europe for Policy Support. Eur. J. Soil Sci. 2005, 56, 655–671. [Google Scholar] [CrossRef]
  39. Jarvis, P.; Rey, A.; Petsikos, C.; Wingate, L.; Rayment, M.; Pereira, J.; Banza, J.; David, J.; Miglietta, F.; Borghetti, M.; et al. Drying and Wetting of Mediterranean Soils Stimulates Decomposition and Carbon Dioxide Emission: The “Birch Effect”. Tree Physiol. 2007, 27, 929–940. [Google Scholar] [CrossRef] [PubMed]
  40. Kurganova, I.N.; Lopes de Gerenyu, V.O.; Gallardo Lancho, J.F.; Oehm, C.T. Evaluation of the Rates of Soil Organic Matter Mineralization in Forest Ecosystems of Temperate Continental, Mediterranean, and Tropical Monsoon Climates. Eurasian Soil Sci. 2012, 45, 68–79. [Google Scholar] [CrossRef]
  41. Lorenz, K.; Lal, R.; Ehlers, K. Soil Organic Carbon Stock as an Indicator for Monitoring Land and Soil Degradation in Relation to United Nations’ Sustainable Development Goals. Land Degrad. Dev. 2019, 30, 824–838. [Google Scholar] [CrossRef]
  42. Fiedler, S.R.; Buczko, U.; Jurasinski, G.; Glatzel, S. Soil Respiration after Tillage under Different Fertiliser Treatments—Implications for Modelling and Balancing. Soil Tillage Res. 2015, 150, 30–42. [Google Scholar] [CrossRef]
  43. Gambolati, G.; Putti, M.; Teatini, P.; Camporese, M.; Ferraris, S.; Stori, G.G.; Nicoletti, V.; Silvestri, S.; Rizzetto, F.; Tosi, L. Peat Land Oxidation Enhances Subsidence in the Venice Watershed. Eos Trans. Am. Geophys. Union 2005, 86, 217–220. [Google Scholar] [CrossRef]
  44. Loveland, P.; Webb, J. Is There a Critical Level of Organic Matter in the Agricultural Soils of Temperate Regions: A Review. Soil Tillage Res. 2003, 70, 1–18. [Google Scholar] [CrossRef]
  45. Kimetu, J.M.; Lehmann, J.; Kinyangi, J.M.; Cheng, C.H.; Thies, J.; Mugendi, D.N.; Pell, A. Soil Organic C Stabilization and Thresholds in C Saturation. Soil Biol. Biochem. 2009, 41, 2100–2104. [Google Scholar] [CrossRef]
  46. Stewart, C.E.; Paustian, K.; Conant, R.T.; Plante, A.F.; Six, J. Soil Carbon Saturation: Concept, Evidence and Evaluation. Biogeochemistry 2007, 86, 19–31. [Google Scholar] [CrossRef]
  47. Senthilkumar, S.; Basso, B.; Kravchenko, A.N.; Robertson, G.P. Contemporary Evidence of Soil Carbon Loss in the U.S. Corn Belt. Soil Sci. Soc. Am. J. 2009, 73, 2078–2086. [Google Scholar] [CrossRef]
  48. Soil Survey Staff. Illustrated Guide to Soil Taxonomy; U.S. Department of Agriculture, Natural Resources Conservation Service, National Soil Survey Center: Lincoln, NE, USA, 2015.
  49. IUSS Working Group WRB. World Reference Base for Soil Resources 2014, Update 2015. International Soil Classification System for Naming Soils and Creating Legends for Soil Maps; FAO: Rome, Italy, 2015. [Google Scholar]
  50. Baldivieso-Freitas, P.; Blanco-Moreno, J.M.; Armengot, L.; Chamorro, L.; Romanyà, J.; Sans, F.X. Crop Yield, Weed Infestation and Soil Fertility Responses to Contrasted Ploughing Intensity and Manure Additions in a Mediterranean Organic Crop Rotation. Soil Tillage Res. 2018, 180, 10–20. [Google Scholar] [CrossRef]
  51. Shamrikova, E.V.; Vanchikova, E.V.; Lu-Lyan-Min, E.I.; Kubik, O.S.; Zhangurov, E.V. Which Method to Choose for Measurement of Oranic and Inorganic Carbon Content in Carbonate-Rich Soils? Advantages and Disadvantages of Dry and Wet Chemistry. CATENA 2023, 228, 107151. [Google Scholar] [CrossRef]
  52. FAO. Standard Operating Procedure for Soil Nitrogen—Kjeldahl Method; FAO: Rome, Italy, 2021. [Google Scholar]
  53. Vance, E.D.; Brookes, P.C.; Jenkinson, D.S. An Extraction Method for Measuring Soil Microbial Biomass C. Soil Biol. Biochem. 1987, 19, 703–707. [Google Scholar] [CrossRef]
  54. Joergensen, R.G. The Fumigation-Extraction Method to Estimate Soil Microbial Biomass: Calibration of the kEC Value. Soil Biol. Biochem. 1996, 28, 25–31. [Google Scholar] [CrossRef]
  55. Hartig, F. DHARMa: Residual Diagnostics for Hierarchical (Multi-Level/Mixed) Regression Models. R Package Version 0.4.7. 2024. Available online: https://github.com/florianhartig/dharma (accessed on 3 September 2025).
  56. R Core Team. R: A Language and Environment for Statistical Computing, Version 4.2.3; R Foundation for Statistical Computing: Vienna, Austria, 2022. [Google Scholar]
  57. Hernanz, J.L.; López, R.; Navarrete, L.; Sánchez-Girón, V. Long-Term Effects of Tillage Systems and Rotations on Soil Structural Stability and Organic Carbon Stratification in Semiarid Central Spain. Soil Tillage Res. 2002, 66, 129–141. [Google Scholar] [CrossRef]
  58. Martínez-Mena, M.; Carrillo-López, E.; Boix-Fayos, C.; Almagro, M.; García Franco, N.; Díaz-Pereira, E.; Montoya, I.; de Vente, J. Long-Term Effectiveness of Sustainable Land Management Practices to Control Runoff, Soil Erosion, and Nutrient Loss and the Role of Rainfall Intensity in Mediterranean Rainfed Agroecosystems. CATENA 2020, 187, 104352. [Google Scholar] [CrossRef]
  59. Mihelič, R.; Pintarič, S.; Eler, K.; Suhadolc, M. Effects of Transitioning from Conventional to Organic Farming on Soil Organic Carbon and Microbial Community: A Comparison of Long-Term Non-Inversion Minimum Tillage and Conventional Tillage. Biol. Fertil. Soils 2024, 60, 341–355. [Google Scholar] [CrossRef]
  60. Swanepoel, C.M.; Rötter, R.P.; van der Laan, M.; Annandale, J.G.; Beukes, D.J.; du Preez, C.C.; Swanepoel, L.H.; van der Merwe, A.; Hoffmann, M.P. The Benefits of Conservation Agriculture on Soil Organic Carbon and Yield in Southern Africa Are Site-Specific. Soil Tillage Res. 2018, 183, 72–82. [Google Scholar] [CrossRef]
  61. Gadermaier, F.; Berner, A.; Fließbach, A.; Friedel, J.K.; Mäder, P. Impact of Reduced Tillage on Soil Organic Carbon and Nutrient Budgets under Organic Farming. Renew. Agric. Food Syst. 2012, 27, 68–80. [Google Scholar] [CrossRef]
  62. Sacco, D.; Moretti, B.; Monaco, S.; Grignani, C. Six-Year Transition from Conventional to Organic Farming: Effects on Crop Production and Soil Quality. Eur. J. Agron. 2015, 69, 10–20. [Google Scholar] [CrossRef]
  63. Martín-Lammerding, D.; Tenorio, J.L.; Albarrán, M.M.; Zambrana, E.; Walter, I. Influence of Tillage Practices on Soil Biologically Active Organic Matter Content over a Growing Season under Semiarid Mediterranean Climate. Span. J. Agric. Res. 2013, 11, 232–243. [Google Scholar] [CrossRef]
  64. Allam, M.; Radicetti, E.; Quintarelli, V.; Petroselli, V.; Marinari, S.; Mancinelli, R. Influence of Organic and Mineral Fertilizers on Soil Organic Carbon and Crop Productivity under Different Tillage Systems: A Meta-Analysis. Agriculture 2022, 12, 464. [Google Scholar] [CrossRef]
  65. Grignani, C.; Zavattaro, L.; Sacco, D.; Monaco, S. Production, Nitrogen and Carbon Balance of Maize-Based Forage Systems. Eur. J. Agron. 2007, 26, 442–453. [Google Scholar] [CrossRef]
  66. Lehtinen, T.; Schlatter, N.; Baumgarten, A.; Bechini, L.; Krüger, J.; Grignani, C.; Zavattaro, L.; Costamagna, C.; Spiegel, H. Effect of Crop Residue Incorporation on Soil Organic Carbon and Greenhouse Gas Emissions in European Agricultural Soils. Soil Use Manag. 2014, 30, 524–538. [Google Scholar] [CrossRef]
  67. Navas, A.; Gaspar, L.; Quijano, L.; López-Vicente, M.; Machín, J. Patterns of Soil Organic Carbon and Nitrogen in Relation to Soil Movement under Different Land Uses in Mountain Fields (South Central Pyrenees). CATENA 2012, 94, 43–52. [Google Scholar] [CrossRef]
  68. Wang, Y.; Tu, C.; Cheng, L.; Li, C.; Gentry, L.F.; Hoyt, G.D.; Zhang, X.; Hu, S. Long-Term Impact of Farming Practices on Soil Organic Carbon and Nitrogen Pools and Microbial Biomass and Activity. Soil Tillage Res. 2011, 117, 8–16. [Google Scholar] [CrossRef]
  69. Drinkwater, L.E.; Wagoner, P.; Sarrantonio, M. Legume-Based Cropping Systems Have Reduced Carbon and Nitrogen Losses. Nature 1998, 396, 262–265. [Google Scholar] [CrossRef]
  70. Goulding, K.W.T.; Bailey, N.J.; Bradbury, N.J.; Hargreaves, P.; Howe, M.; Murphy, D.V.; Poulton, P.R.; Willison, T.W. Nitrogen Deposition and Its Contribution to Nitrogen Cycling and Associated Soil Processes. New Phytol. 1998, 139, 49–58. [Google Scholar] [CrossRef]
  71. Rochester, I.J.; Peoples, M.B.; Hulugalle, N.R.; Gault, R.R.; Constable, G.A. Using Legumes to Enhance Nitrogen Fertility and Improve Soil Condition in Cotton Cropping Systems. Field Crops Res. 2001, 70, 27–41. [Google Scholar] [CrossRef]
  72. Hartmann, M.; Frey, B.; Mayer, J.; Mäder, P.; Widmer, F. Distinct Soil Microbial Diversity under Long-Term Organic and Conventional Farming. ISME J. 2015, 9, 1177–1194. [Google Scholar] [CrossRef]
  73. Li, J.; Li, Y.; Yang, X.; Zhang, J.; Lin, Z.; Zhao, B. Microbial Community Structure and Functional Metabolic Diversity Are Associated with Organic Carbon Availability in an Agricultural Soil. J. Integr. Agric. 2015, 14, 2500–2511. [Google Scholar] [CrossRef]
  74. Ulrich, S.; Tischer, S.; Hofmann, B.; Christen, O. Biological Soil Properties in a Long-Term Tillage Trial in Germany. J. Plant Nutr. Soil Sci. 2010, 173, 483–489. [Google Scholar] [CrossRef]
  75. Lal, R. Restoring Soil Quality to Mitigate Soil Degradation. Sustainability 2015, 7, 5875–5895. [Google Scholar] [CrossRef]
  76. Francaviglia, R.; Di Bene, C.; Farina, R.; Salvati, L.; Vicente-Vicente, J.L. Assessing “4 per 1000” Soil Organic Carbon Storage Rates under Mediterranean Climate: A Comprehensive Data Analysis. Mitig. Adapt. Strat. Glob. Change 2019, 24, 795–818. [Google Scholar] [CrossRef]
  77. Sun, W.; Huang, Y.; Zhang, W.; Yu, Y. Carbon Sequestration and Its Potential in Agricultural Soils of China. Glob. Biogeochem. Cycles 2010, 24, 3. [Google Scholar] [CrossRef]
  78. Pezzuolo, A.; Dumont, B.; Sartori, L.; Marinello, F.; De Antoni Migliorati, M.; Basso, B. Evaluating the Impact of Soil Conservation Measures on Soil Organic Carbon at the Farm Scale. Comput. Electron. Agric. 2017, 135, 175–182. [Google Scholar] [CrossRef]
  79. Rosinger, C.; Keiblinger, K.; Bieber, M.; Bernardini, L.G.; Huber, S.; Mentler, A.; Sae-Tun, O.; Scharf, B.; Bodner, G. On-Farm Soil Organic Carbon Sequestration Potentials Are Dominated by Site Effects, Not by Management Practices. Geoderma 2023, 433, 116466. [Google Scholar] [CrossRef]
  80. Six, J.; Conant, R.T.; Paul, E.A.; Paustian, K. Stabilization Mechanisms of Soil Organic Matter: Implications for C-Saturation of Soils. Plant Soil 2002, 241, 155–176. [Google Scholar] [CrossRef]
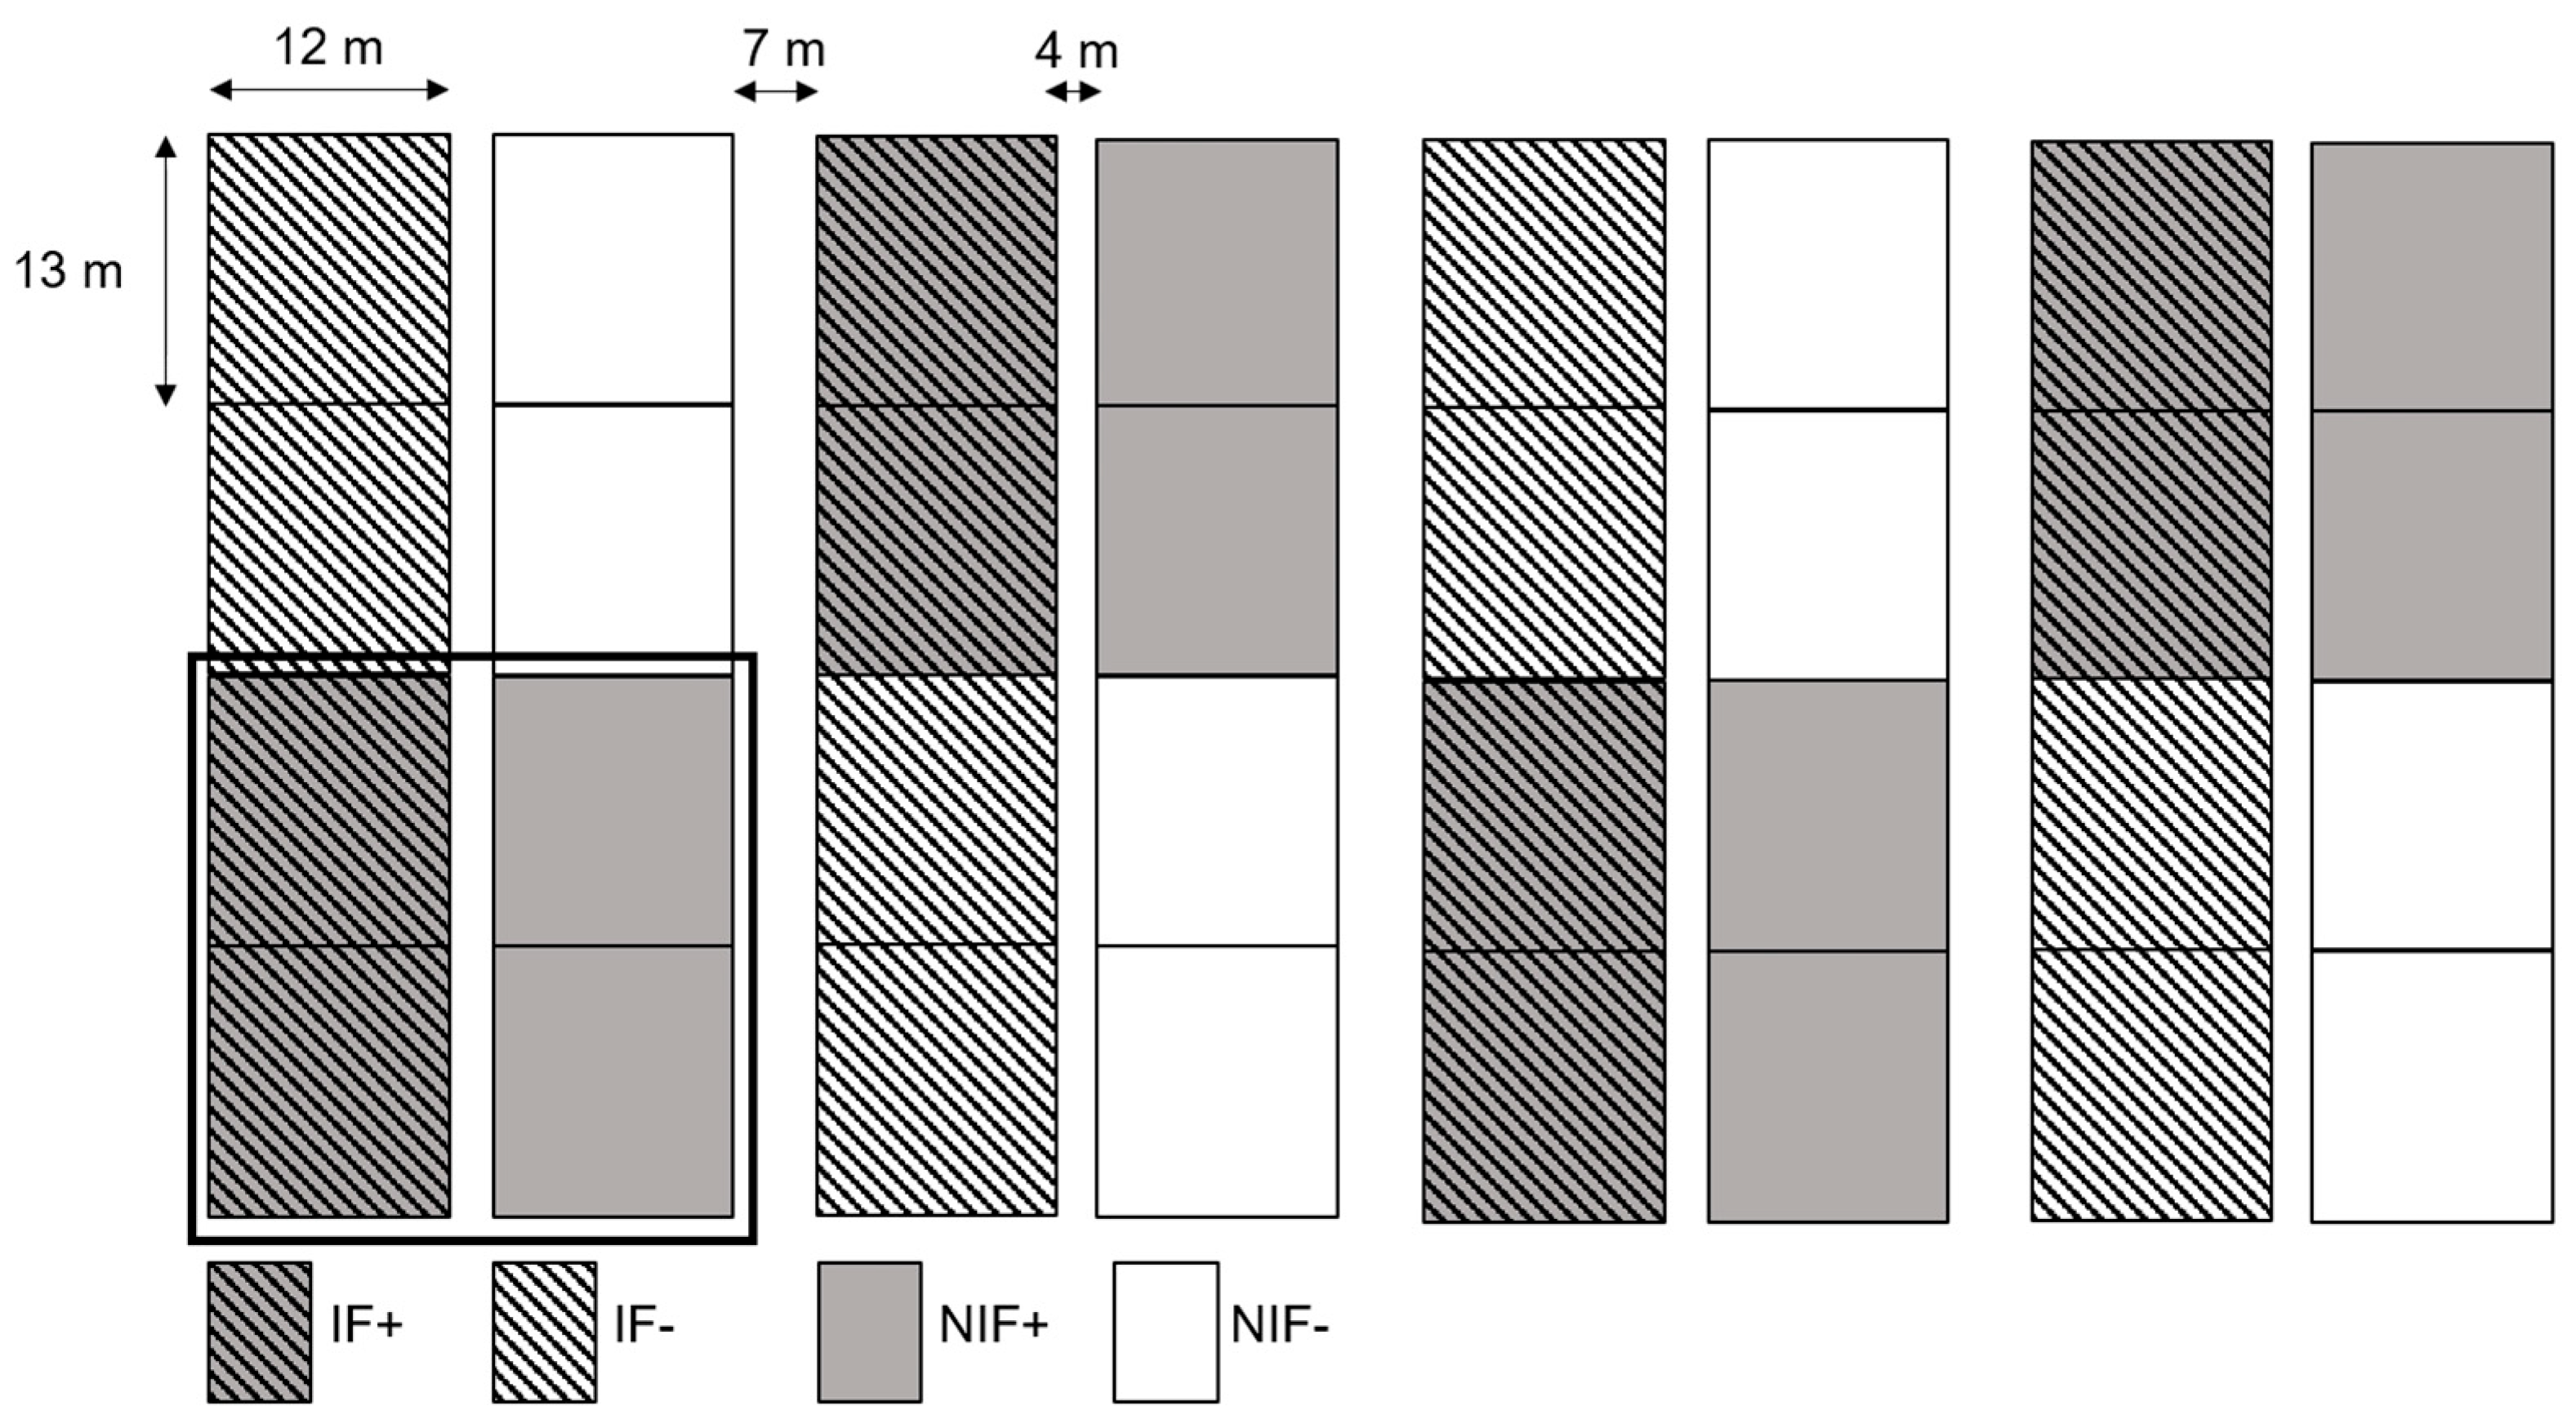
Figure 1. Gallecs long-term trial experimental design representing two factors with two levels each. F+ = fertilization with farmyard manure; F− = no fertilization; I = inversion tillage; and NI = non-inversion tillage. Black square represents one of the eight fertilization blocks.
Agriculture 15 02117 g001
Figure 2. Mean SOC content and standard error under different fertilization and tillage treatments at two depths at three different sampling times (2011, 2015, and 2020). Within each figure, different letters indicate significant differences between samples obtained from the Tukey test.
Agriculture 15 02117 g002
Figure 3. Mean total N content and standard error under different fertilization and tillage treatments at two depths at three different sampling times (2011, 2015, and 2020). Within each figure, different letters indicate significant differences between samples obtained from the Tukey test.
Agriculture 15 02117 g003
Figure 4. Mean Cmic content and standard error under different fertilization and tillage treatments at two depths at three different sampling times (2011, 2015, and 2020). Within each figure, different letters indicate significant differences between samples obtained from the Tukey test.
Agriculture 15 02117 g004
Figure 5. Mean Cmic/SOC ratio and standard error under different fertilization and tillage treatments at two depths at three different sampling times (2011, 2015, and 2020). Within each figure, different letters indicate significant differences between samples obtained from the Tukey test.
Agriculture 15 02117 g005
Figure 6. Relationship between SOC changes and initial SOC from 2011 to 2015 and from 2015 to 2020 under different tillage and fertilization regimes at two soil depths. “*” indicates significant effect of the factor (tillage (Till), initial SOC (SOCi), or interaction (Inter)). Legend corresponds to the type of tillage. Lines have been added to facilitate the visualization of trends in data.
Agriculture 15 02117 g006
Figure 7. Relationship between total N changes and initial SOC from 2011 to 2015 and from 2015 to 2020 under different tillage and fertilization regimes at two soil depths. “*” indicates significant effect of the factor (tillage (Till), initial SOC (SOCi), or interaction (Inter)). Legend corresponds to the type of tillage. Lines have been added to facilitate the visualization of trends in data.
Agriculture 15 02117 g007
Table 1. Data of crop rotation, fertilization, and field operations for every year of the experiment.
Year201220132014201520162017201820192020
CropSpeltChickpeaWinter wheatLentilSpeltAlfalfa (Medicago sativa) (failed: fallow)Oat + VetchWinter wheatChickpea
(Triticum spelta)(Cicer arietinum)(Triticum aestivum)(Vicia lens)(Triticum spelta)(Avena sativa + Vicia sativa)(Triticum aestivum)(Cicer arietinum)
Fertilization (kg N/ha)134.640.04138.2862.36127.49No fertNo fertNo fertNo fert
Tillage date12 December 201128 March 201310 December 201320 March 201513 November 20151 March 201710 March 20187 January 201910 March 2020
Sowing date14 December 201113 April 201316 December 201331 March 201519 November 201520 March 201714 March 201810 January 20199 March 2020
Sowing density (kg/ha)195302201802002060 Oat 100 Vetch20030
Weed control method-Inter-row cultivatorFlex-tine harrowHand weeding-----
Weed control date-30 May 20134 March 20142 June 2015-----
Harvest12 July 201231 July 201312 August 201420 September 201513 July 201612 October 2017No harvest22 July 201927 July 2020
Table 2. Mean and standard error of crop dry aboveground biomass (cereal and legume) and weed dry aboveground biomass between 2011–2015 and 2015–2020 in plots under different combinations of factors in Gallecs trial.
Biomass (kg ha−1)CerealLegumeWeed
2011–2015F+NI5474.5 ± 735.51931.4 ± 430.81261.7 ± 239
I5643.2 ± 761.51919 ± 399.41109 ± 221.4
F−NI4336.5 ± 633.52165.1 ± 435829.7 ± 140.9
I4542.2 ± 666.22401.9 ± 447.1787.6 ± 145.3
2015–2020F+NI5708.2 ± 777.62866.9 ± 615.5275 ± 55.1
I6004.3 ± 779.32540 ± 470.1143.5 ± 58.8
F−NI4774.8 ± 588.53261.1 ± 537.4227.5 ± 73.4
I5115 ± 606.43697.2 ± 579104.5 ± 22.3
Disclaimer/Publisher’s Note: The statements, opinions and data contained in all publications are solely those of the individual author(s) and contributor(s) and not of MDPI and/or the editor(s). MDPI and/or the editor(s) disclaim responsibility for any injury to people or property resulting from any ideas, methods, instructions or products referred to in the content.