Article

Stratified Nitrogen Application Enhances Subsoil Carbon Sequestration via Enzyme-Mediated Pathways in Straw-Incorporated Croplands of North China Plain

1
State Key Laboratory of North China Crop Improvement and Regulation, Hebei Agricultural University, Baoding 071000, China
2
Key Laboratory of Farmland Ecological Environment of Hebei Province, Hebei Agricultural University, Baoding 071000, China
3
College of Resources and Environmental Sciences, Hebei Agricultural University, Baoding 071000, China
4
College of Land and Resources, Hebei Agricultural University, Baoding 071000, China
5
Institute of Environment and Sustainable Development in Agriculture, Chinese Academy of Agricultural Sciences, Beijing 100081, China
*
Authors to whom correspondence should be addressed.
Agriculture 2025, 15(19), 2098; https://doi.org/10.3390/agriculture15192098
Submission received: 8 September 2025 / Revised: 30 September 2025 / Accepted: 1 October 2025 / Published: 9 October 2025
(This article belongs to the Section Agricultural Soils)

Abstract

Nitrogen (N) fertilization critically regulates the storage and availability of soil carbon (C) and N pools. However, the internal mechanism through which stratified N application affects soil organic carbon (SOC) sequestration and soil quality index (SQI) remains unclear. To investigate the effects of stratified N application on C sequestration and SQI in both topsoil and subsoil, this study established six treatments (N0:0, N1:0, N4:1, N3:2, N2:3, N1:4) and analyzed soil biochemical indicators. The results showed that compared to N1:0, stratified N fertilization did not significantly improve soil C and N content in the 0–20 cm layer. In contrast, the N2:3 and N1:4 treatments even led to a significant reduction in soil C and N pools in the topsoil. In the 20–40 cm, compared to N1:0, stratified N fertilization increased SOC, TN, labile C fractions, N fractions (particulate organic N and microbial biomass N), enzyme activity and C pool management index (CPMI), increasing by 0.52–7.94%, 2.05–8.42%, 4.77–42.59%, 14.46–56.01%, 6.34–45.82%, and 31.26–51.93%, respectively. In 0–20 cm, compared to N0:0, N application increased SQI by 24.84–45.77%, and N2:3 and N1:4 treatments were lower SQI than N1:0. Furthermore, N2:3, N3:2, and N1:4 treatments in 20–40 cm were higher than other treatments. N fertilizer application drives the synergistic changes in C and N fractions by regulating enzyme activity and stoichiometric ratio, thus affecting CPMI and SQI. Thus, the 3:2 stratified N fertilization (0–20 cm:20–40 cm) method achieves synergistic dual-layer enhancement-maintaining surface C and N pools while boosting subsoil C sequestration and quality-through enzyme-mediated precision regulation of C/N stoichiometry. The study provides a scientific foundation for integrated C emission reduction and cropland quality enhancement in the North China.

1. Introduction

The soil carbon (C) pool, as the core organic C reservoir in terrestrial ecosystems, serves dual functions as both a “C sink” and a “C source” [1]. In the context of China’s “Dual C” goals (C peak and C neutrality), enhancing soil carbon sequestration is crucial [2,3]. Soil organic C (SOC) content and quality are significantly regulated by agricultural measures, such as fertilization, tillage, straw returning, and crop rotation. Liu et al. [1] found that fertilization exerts a more substantial influence on the soil C pool than tillage practices, underscoring the pivotal role of fertilization in SOC dynamics. Previous studies have shown that fertilization amount, fertilizer type, and have fertilization method have significant effects on soil C pools [4,5,6,7]. Fertilization increases exogenous C inputs by enhancing crop growth through improved soil nutrient availability [8], thereby significantly increasing above-and below-ground biomass deposition [9]. Concurrently, it alleviates microbial nutrient limitation [10], optimizes soil nutrient stoichiometric balance, and activates the synthesis of extracellular enzymes, which accelerate the turnover of labile C fractions [11,12]. Furthermore, fertilization promotes the secretion of microbially derived binding agents, facilitating aggregate formation and increasing SOC stability [4,9].
However, not all fertilization practices enhance soil C pools [4,5,7], and strategically implementing science-based nutrient management (e.g., fertilization application rates, methods, types) is critical for enhancing soil C sequestration. Previous studies have indicated that nitrogen (N) application rates of 150–240 kg hm−2 could increase both SOC and labile C fractions [13,14]. Liu et al. [6] found that excessive N application (>300 kg hm−2 year−1) and low N use efficiency led to N leaching and soil structural deterioration, thereby negatively affecting C sequestration. The method of N application also plays an important role. Traditional shallow application often causes nutrient accumulation in the topsoil, resulting in subsurface nutrient depletion and limiting the synergistic benefits of C and N. In contrast, deep N application has been shown to increase soil organic matter by 8–11% [15]. However, a long-term study by Xie et al. observed that increasing the application depth did not significantly alter SOC content in the topsoil layer (0–20 cm) of rice paddies [7]. This phenomenon may be attributed to variations in soil physical properties and microbial activity. The response of SOC to management measures tends to be lagging, making it difficult to reflect real-time changes in soil quality [16]. In contrast, soil labile organic C fractions are highly sensitive to disturbances from tillage and fertilization, and thus can serve as effective early indicators for short-term dynamics of the soil C pool [17]. Furthermore, to comprehensively evaluate the synergistic effects of management practices on SOC stability and turnover, the C pool management index (CPMI) is widely employed as a quantitative measure of C pool quality. Nevertheless, the regulatory mechanisms by which stratified N application influences SOC dynamics and labile C fractions remain unclear.
The soil N pool supplies available N for plant growth, and the soil N transformation process is closely coupled with the C cycle, which affects soil C sequestration [18,19]. N application not only directly enhances the storage and transformation rate of the soil N pool, promotes inorganic N accumulation, but also drives microbial biomass N (MBN) turnover by regulating microbial activity, thus optimizing N fixation and release [20,21]. Yan et al. showed that moderate N application can boost particulate organic N (PON) and MBN by improving stubble decomposition and root growth [20], thereby alleviate microbial N limitation [10]. In contrast, excessive N application can induce nitrate leaching, soil acidification, and suppresses MBN [22,23]. Deep N application has been demonstrated to increase soil N content, improve N recycling efficiency, and reduce leaching loss [7,15,24]. Furthermore, N addition typically lowers the soil C/N ratio by accelerating organic matter turnover and mineralization [25].
Soil enzymes are central to the formation and stabilization of soil C and N pools, serving as key biological indicators of microbial activity and soil fertility [26]. Soil urease (UG), N-acetylglucosaminidase (N-AG), β-glucosidase (β-G), and β-xylosidase (β-X) are the key enzymes driving soil C and N transformation [12,27,28]. Soil enzyme activity significantly affects the chemical decomposition process of microbial available C sources and organic C and N [29], making it a critical factor in regulating organic C turnover and microbial metabolism [30]. N fertilization significantly influences enzyme functions. Appropriate N input can enhance microbial growth and enzyme production, thereby supporting C and N cycling processes [31]. Liu et al. [32] reported that stratified fertilization increases phosphatase activity. However, Fan et al. [33] showed that deep N fertilizer application inhibited the accumulation of polysaccharides and lipids within the light fraction organic matter and reduced the activity of β-G and N-AG (22.2–48.9% and 32.7–40.4%, respectively). In summary, while soil enzymes are established indicators of soil fertility and C/N cycling, the mechanisms through which stratified N fertilization regulates enzyme activity to influence soil C and N pool dynamics remain inadequately understood.
Soil quality index (SQI), as an index for the comprehensive evaluation of soil quality, can reflect the overall situation of soil physical, chemical, and biological properties [34]. Previous studies have indicated that SQI is significantly affected by multiple factors, including land use patterns, rainfall patterns, and tillage-fertilization systems [35,36]. Huang et al. [36] showed that the key factors affecting SQI are vegetation coverage, precipitation, wind erosion intensity, and land use patterns, and the interaction between these factors exerts a more significant impact on soil quality than a single factor. However, Li et al. [35] showed that fertility indicators such as SOC, soil total N (TN), and cation exchange capacity play a dominant role in the spatial variability of farmland soil quality. Therefore, the establishment of an SQI framework centered on soil C and N content and enzymatic function can evaluate soil ecological quality more systematically and accurately.
The traditional shallow fertilization method in the North China Plain often leads to nutrient enrichment in the surface layer, while the nutrient supply in the deep soil is insufficient, resulting in a limited accumulation of SOC in the deep soil. Stratified fertilization improves soil structure and the distribution of water and nutrients by breaking the plow pan, and enhances fertilizer use efficiency, which has been promoted to a certain extent in this area. The application of fertilizer into deeper soil layers influences the labile organic C fractions and soil enzyme activity, thereby significant effect on soil C and N pools [24,36,37]. However, it remains unclear whether stratified fertilization can simultaneously improve the C and N sequestration in both surface and subsurface soils, and the underlying mechanisms involved require further elucidation. This study investigated the integrated effects of stratified N application on soil C and N content, labile organic C and N fractions, enzyme activity, CPMI and SQI. We also evaluated the mediating roles of enzyme activity and elemental stoichiometry in driving C and N dynamics and SQI variation. The study aims to clarify the influence of stratified N application on soil C sequestration and soil quality. We hypothesized that (1) Stratified N application would significantly alter the vertical distribution of SOC, TN, labile C and N fractions and enzyme activity in 0–20 and 20–40 cm soil layers; (2) The accumulation and qualitative improvement of subsoil soil C pools are regulated by multiple factors, including soil enzymatic activity, C/N ratio, and the input of exogenous organic matter.

2. Materials and Methods

2.1. Experimental Materials

The field experiment site is located in Baimu Village, Ningjin County, Hebei Province, China (115°5′28″ E, 37°37′21″ N). This region has a temperate continental monsoonal climate with an annual mean temperature of 12.8 °C and an annual mean precipitation of 449.1 mm. The dominant agricultural system is a continuous wheat-maize rotation system, in which winter wheat is sown in October and harvested in June, followed by summer maize planted in July and harvested maize grain in October. According to the World Reference Base for Soil Resources (WRB, 2022), the soil is classified as Stagnic Luvisols. The predominant soil types and agricultural practices in this region are representative of the North China Plain. The initial 0–20 cm soil had an organic matter of 18.75 g kg−1, NH4+-N of 6.07 mg kg−1, NO3-N of 8.23 mg kg−1, available phosphorus of 8.77 mg kg−1, and rapidly available potassium of 66.18 mg kg−1, with a pH of 7.69. 20–40 cm soil had an organic matter of 9.22 g kg−1, NH4+-N of 3.88 mg kg−1, NO3-N of 4.62 mg kg−1, available phosphorus of 3.68 mg kg−1, and rapidly available potassium of 49.3 mg kg−1, with a pH of 7.43.

2.2. Experimental Design

The study utilized a field micro-plot experimental design, with the experiment established in June 2022 (during the maize growing season). To investigate the effects of nitrogen fertilizer application positions and ratios on summer maize, identical treatments were maintained continuously for three consecutive years. This paper presents the analysis of data collected over two summer maize growing seasons from June 2023 to October 2024. The experiment was performed under full straw return conditions, with six N application depths (surface-layer 0–20 cm, and stratified 0–20 cm and 20–40 cm) and distribution ratios: no N application (N0:0), surface-layer N application at 0–20 cm (N1:0), and four different ratios of two-layer N application at 0–20 cm and 20–40 cm (N4:1, N3:2, N2:3, N1:4), with three replicates per treatment. The treatments involved the application of pure N, P2O5, and K2O at rates of 225, 120, and 150 kg hm−2, respectively. The fertilizers used were controlled-release urea (44% N), calcium superphosphate (16% P2O5), and potassium chloride (57% K2O). According to our previous study [38], phosphorus and potassium fertilizers exhibit higher utilization efficiency when applied once as basal dressing in the 20–40 cm soil layer.
N fertilizer was applied to the designated soil layers at different positions and proportions according to the experimental design. Fertilizers were applied by in situ soil mixing: the tillage layer soil was excavated at 0–20 cm and 20–40 cm depths, thoroughly mixed with the designated fertilizer ratios, and backfilled to the original layers. All fertilizers were applied as a one-time basal application before sowing, with no topdressing during the growing season. Each micro-plot measures 4 m2 (2 m × 2 m). Before the experiment, the soil within plots was kept undisturbed, while the surrounding soil was removed according to plot boundaries. The plots were separated by 4 mm-thick PVC boards, buried 40 cm deep with 5 cm protruding above the ground to prevent lateral nutrient and water movement between plots. Each micro-plot was planted with 28 maize plants, with a row spacing of 50 cm and plant spacing of 25 cm. Specific experimental treatments and corresponding fertilizer application rates are shown in Table 1. The experiment followed a wheat-maize rotation system. Every year, winter wheat (cv. Jimai 22) was sown in early October and harvested in mid-June, followed by summer maize (cv. Weike 702) which was planted. After the maize harvest, straw stubble was fully incorporated into the field through manual spade tillage to a depth of 30 cm. Following wheat harvest, the straw was chopped into 5–10 cm segments, uniformly distributed on the soil surface, and subsequently manually incorporated to a depth of 30 cm. While wheat season fertilizer applications were standardized across all treatments to assess residual effects, maize season management adhered to local high-yield practices with the sole exception of N application depth and distribution ratios.

2.3. Sample Collection and Determination

In 2023 and 2024, soil samples of 0–20 cm and 20–40 cm depths were collected in each micro-plot using the five-point sampling method at the maturity stage. The five identical soil samples in each micro-plot were thoroughly mixed and passed through a 2 mm sieve and then divided into two parts. One part was naturally air-dried for the analysis of SOC, particulate organic C (POC), readily oxidizable C (ROC), TN, PON, and UG. The other portion was stored at 4 °C for the prompt determination of β-G, β-X, N-AG, MBC, dissolved organic C (DOC), MBN, NH4+-N, and NO3-N.
SOC was determined using the potassium dichromate external heating method [39]. POC and PON were extracted using the sodium hexametaphosphate dispersion method, followed by separation through a 53 μm sieve. The soil retained on the sieve was analyzed for organic C content using the potassium dichromate external heating method [40]. ROC was determined using the 333 mmol L−1 potassium permanganate oxidation method [41]. DOC was measured using the deionized water extraction method and determined using a TOC analyzer. The MBC and MBN were determined using chloroform fumigation-K2SO4 extraction and the chloroform fumigation-total N measurement method, respectively [42]. TN contents were determined using the Kjeldahl method. UG activity was determined using the phenol-sodium hypochlorite colorimetry [37]. β-G, β-X, and N-AG were determined using the microplate fluorescence method [43].
From 2022 to 2024, all aboveground biomass (grain and straw) from each micro-plot was harvested at physiological maturity for both wheat and maize crops. Samples were air-dried to constant weight before measuring to determine grain yield and aboveground biomass accumulation. Straw C inputs were calculated by multiplying dry matter mass by crop-specific C conversion coefficients.

2.4. Data Processing and Analysis

2.4.1. CPMI Calculation

Taking no fertilization as a control, the CPMI of each treatment was calculated. The calculation method is [44,45] as follows:
C pool index (CPI) = SOC content of each treatment/SOC content of CK treatment;
C pool activity (A) = ROC content/(SOC content-ROC content);
C pool activity index (AI) = C pool activity of each treatment/C pool activity of CK treatment;
CPMI = C pool index × C pool activity index × 100%.

2.4.2. C Input Calculation

The calculation formula of root C input (t hm−2) in the growth period is as follows [46]:
Cinput = (M × (0.26/0.74)) × (1 − 14%) × 0.444;
Cinput = (W × (0.30/0.70) + W1) × (1 − 14%) × 0.399.
In the formula, M represents maize aboveground biomass, W denotes wheat aboveground biomass, and W1 indicates the quantity of wheat straw returned to the field. The root: shoot ratios were 0.26 for maize and 0.30 for wheat. The surface root proportions were 0.74 for maize and 0.70 for wheat. Air-dried plant samples contained 14% moisture on average. The organic C conversion factors were 0.444 for maize [11] and 0.399 for wheat [47].

2.4.3. Calculation of SQI

SQI was derived from an integrated dataset encompassing soil C and N fractions (e.g., SOC, TN, MBC, MBN, etc.), and enzyme activities (β-G, β-X, N-AG, UG) [43]. First, soil indicators were transformed into a scale of 0–1 using the following equation [43]:
FNL   =   1 ( 1   +   ( x / x i ) m ) .
Among them, FNL represents the nonlinear conversion score of each index, X represents the actual value of the index, and Xi represents the mean value of the index. The score of each indicator is determined in two opposite directions: m = -2.5 means “the more, the better”, and m = 2.5 means “the less, the better”.
Finally, according to the calculation model proposed by Andrews [48], the calculation formula of SQI is
SQI = i = 1 n W i ×   FNL i .
FNL, which represents the score of index i; n represents the number of indexes, W represents the weight of index i, and the weight (Wi) of each index is determined by the eigenvalue contribution rate of the principal component and its factor load.

2.4.4. Data Analysis

Microsoft Excel 2019 was used for data processing and analysis, and SPSS 27 software was used to analyze the SPSS 27 software was used to analyze the significance by the Duncan test, at a significance level of p < 0.05. To assess the relationships among the measured between indicators. Pearson correlation analysis was conducted. The correlation matrix was generated, and the significance levels (p < 0.05) were determined using SPSS 27. The resulting matrix was then visualized as a heatmap with correlation coefficients using Origin 2021 software Structural equation models (SEMs) were used to reveal the direct and in-direct effects of different N treatments on soil CPMI and SQI using the ‘plspm’ and ‘vegan’ R packages. Origin 2021 was used for drawing other figures.

3. Results

3.1. SOC and TN Content

N fertilization significantly increased SOC content (Figure 1a). SOC levels in the 0–20 cm layer were significantly higher than in the 20–40 cm layer across all treatments. In 2023, compared to N0:0 treatment, N application increased SOC in the 0–20 cm layer by 3.34–10.41%. Among N application treatments, N2:3 and N1:4 decreased SOC by 5.09% and 2.01% relative to N1:0, whereas no significant differences were observed among N4:1, N3:2, and N1:0 treatments. In the 20–40 cm layer, stratified N application increased SOC by 5.20–8.17% compared to N0:0 and by 4.99–7.94% compared to N1:0. In 2024, N treatments increased 0–20 cm SOC by 6.52–12.77% versus N0:0. N1:4 showed a 4.38% significant reduction compared to N1:0. While N4:1, N3:2, and N2:3 exhibited no significant differences from N1:0. In the 20–40 cm layer, stratified N application raised SOC by 1.94–7.11% compared to N0:0. It also increased SOC by 0.52–5.63% compared to N1:0. Over the two years, the N3:2 treatment showed the highest SOC content in the 0–20 cm layer, whereas the N2:3 treatment was the most effective in the 20–40 cm layer, although there were no significant differences among the stratified N treatments.
TN content decreased with increasing soil depth (Figure 1b). In 2023, N application increased TN by 8.38–11.86% at 0–20 cm. The N2:3 and N1:4 decreased TN by 2.12% and 3.11%, respectively, compared to N1:0. Meanwhile, N4:1 and N3:2 were similar to N1:0. In the 20–40 cm layer, stratified N application raised TN by 5.20–10.19% over N0:0 and by 3.51–8.42% over N1:0, with N1:4 exceeding N4:1 by 4.74%. In 2024, N treatments increased TN in the 0–20 cm layer by 8.30–14.73%. The N3:2, N2:3, and N1:4 were 1.62–5.60% lower than N1:0. N4:1 stayed statistically similar. In the 20–40 cm layer, stratified N application significantly increased TN by 15.14–21.75% compared to N0:0. N3:2, N2:3, and N1:4 treatments increased by 2.05–7.03% compared to N1:0. Also, N1:4 treatment rose by 5.42% when compared to N4:1.

3.2. Labile Organic C and N Fractions

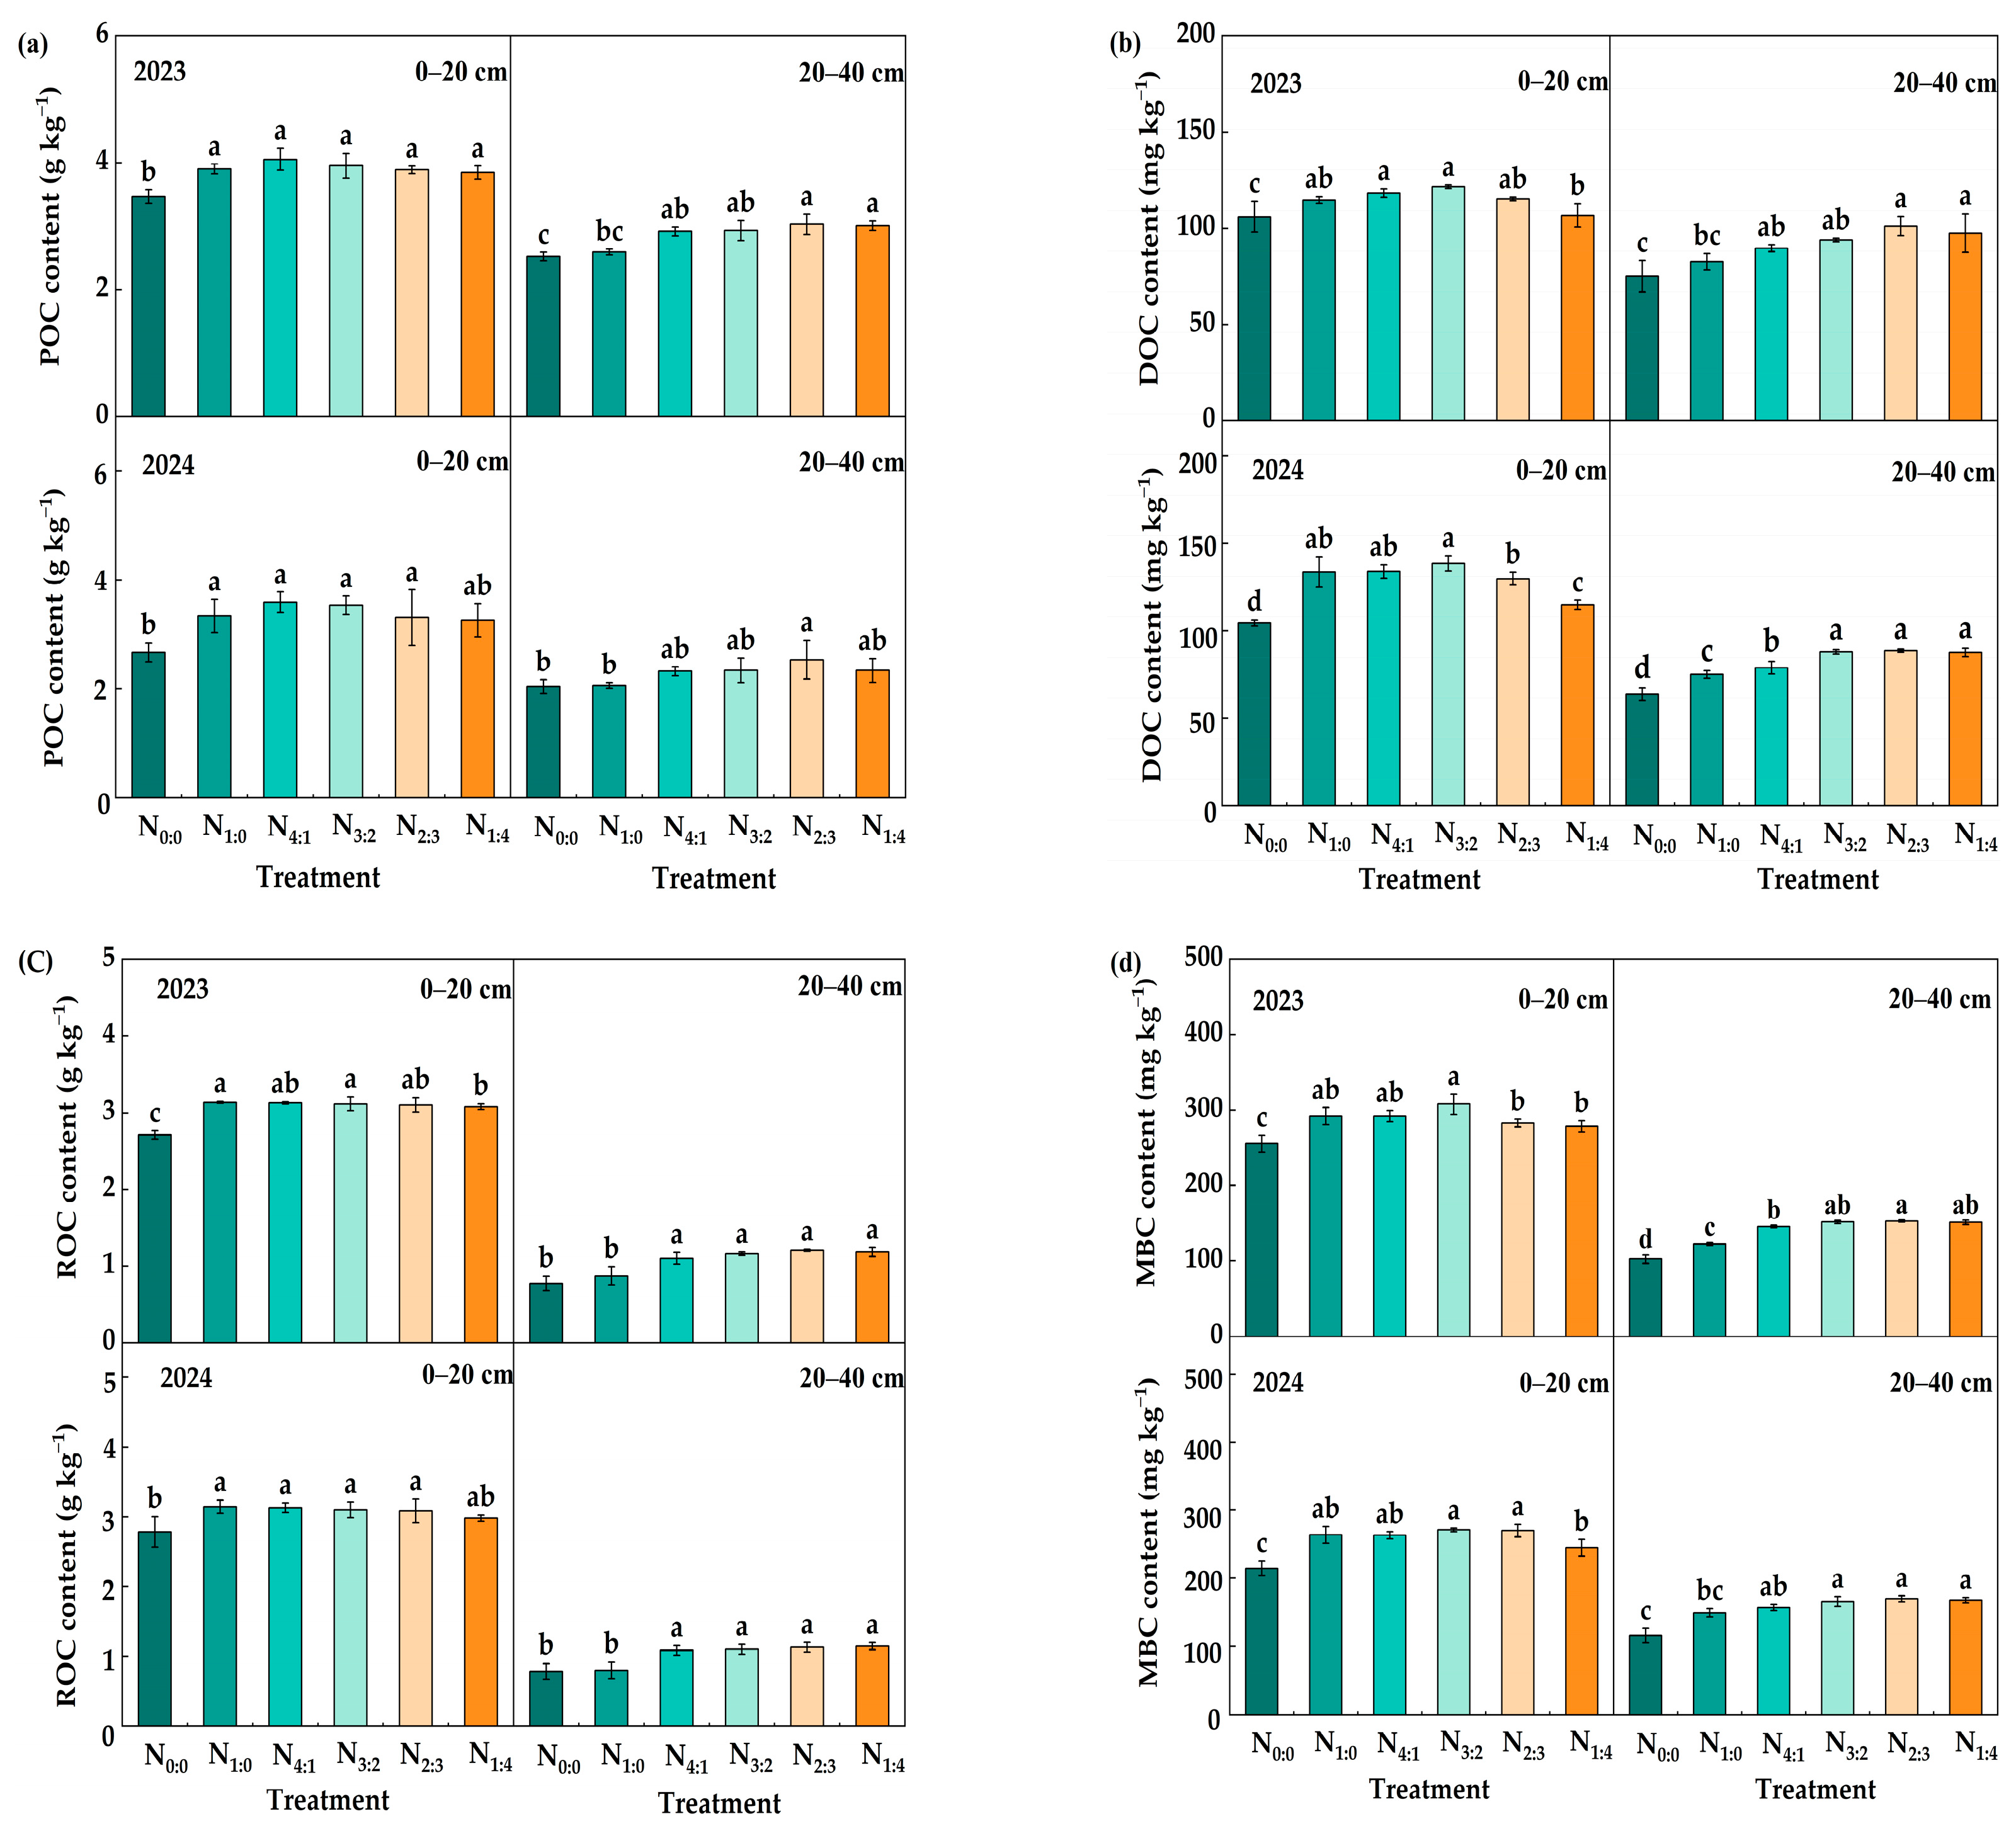
N application significantly enhanced the contents of all soil labile organic C fractions (POC, DOC, ROC, and MBC) in every layer. The surface layer showed higher levels than the subsurface layer (Figure 2a–d). In 2023, N application increased POC, DOC, ROC, and MBC contents in the 0–20 cm layer. The increases were 10.92–16.99%, 0.68–14.68%, 13.82–15.95%, and 9.04–20.45%, respectively, compared to the N0:0 treatment. Compared to N1:0, the N1:4 decreased DOC, ROC, and MBC by 6.86%, 1.83%, and 4.58%, respectively, while the N2:3 reduced MBC by 3.10%. No significant differences were observed among the N3:2, N4:1, and N1:0 treatments. In the 20–40 cm layer, stratified N application increased POC, DOC, ROC, and MBC by 12.63–16.99%, 8.46–22.53%, 26.39–37.94%, and 15.23–19.98%, respectively, compared to N1:0. N4:1 had 3.56–4.69% lower MBC than the other stratified treatments. In 2024, N treatments improved POC, DOC, ROC, and MBC in the 0–20 cm layer by 21.90–34.31%, 9.76–32.58%, 7.20–13.07%, and 14.03–26.40%, respectively, compared to N0:0. Compared to N1:0, N1:4 significantly reduced DOC and MBC by 16.47% and 7.21%, and N2:3 decreased DOC by 2.91%. There was no significant difference between N3:2, N4:1, and N1:0. In the subsurface layer, stratified N application increased POC, DOC, ROC, and MBC by 12.74–23.08%, 5.24–18.37%, 35.19–42.59%, and 4.77–12.23%, respectively, compared to N1:0. N4:1 showed 9.99–11.09% lower DOC than other stratified treatments.
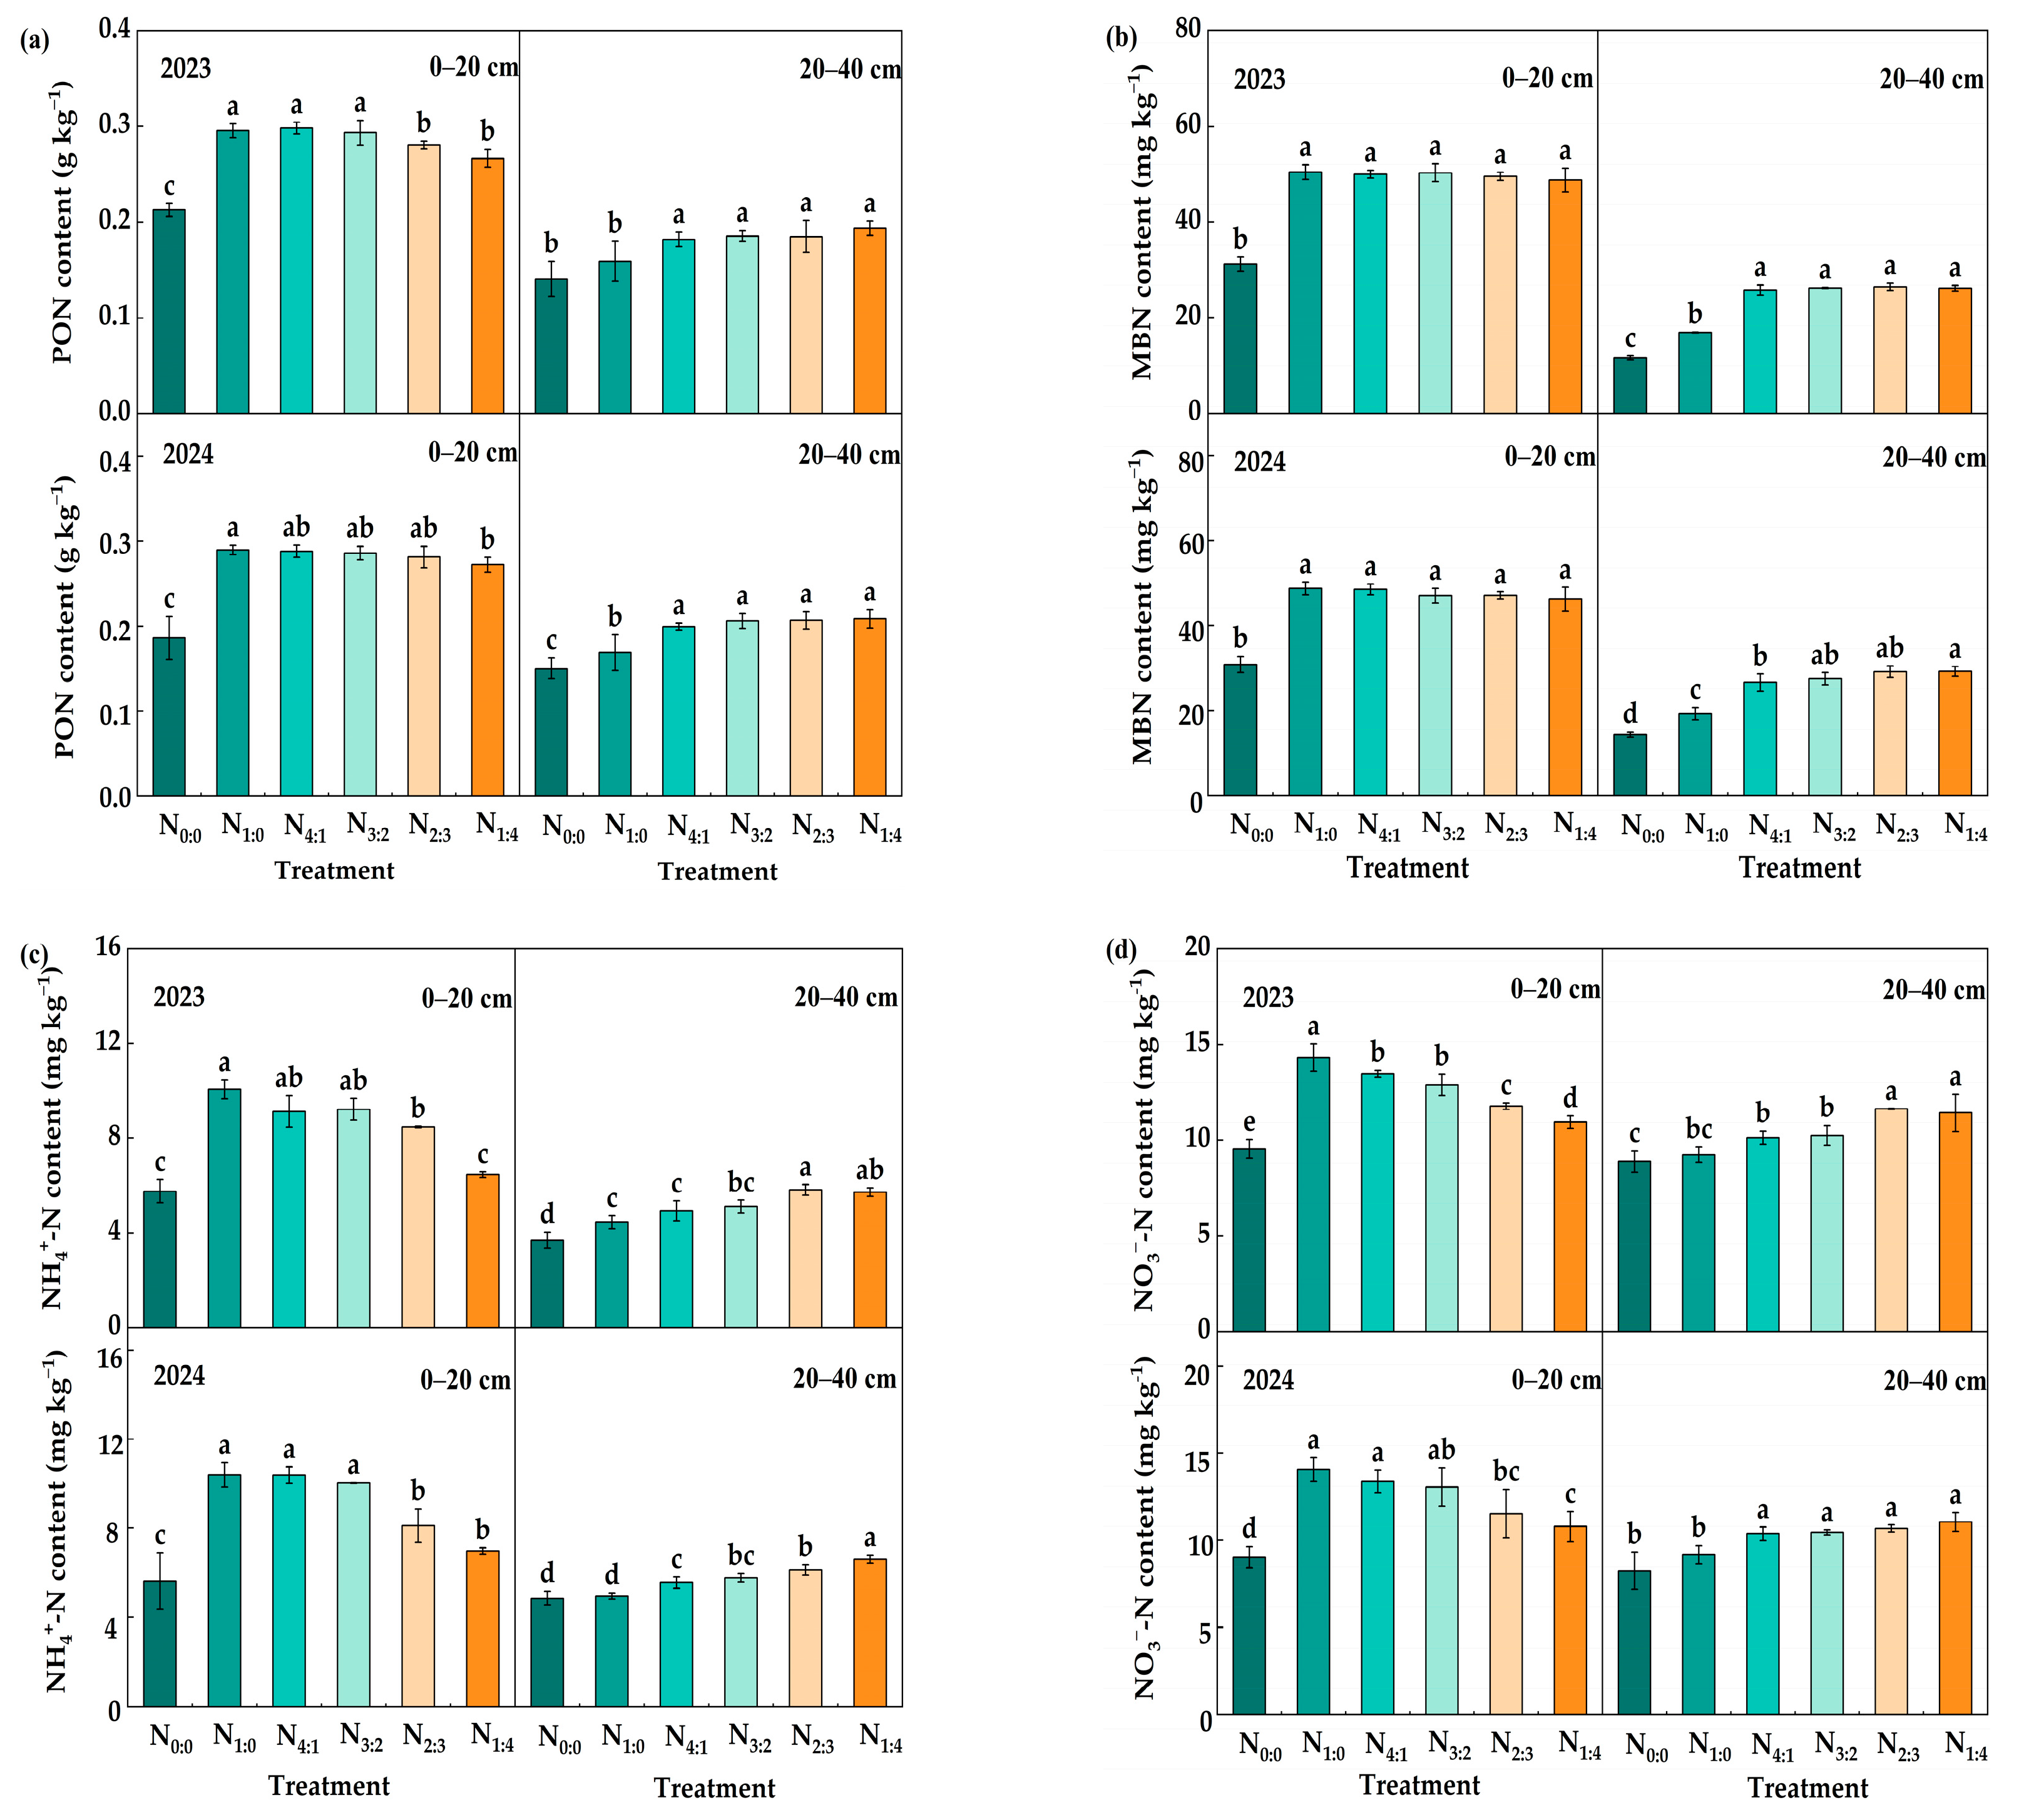
N application depth significantly influenced soil N forms under full straw return (Figure 3a–d). In 2023, N treatments increased PON, MBN, NH4+-N and NO3-N in the 0–20 cm layer by 25.33–40.21%, 56.61–62.03%, 12.20–74.70%, and 14.63–50.05%, respectively, compared to N0:0. Compared to N1:0, N2:3 and N1:4 significantly reduced PON by 4.99% and 9.76% and NH4+-N by 15.77% and 35.78%, respectively. All stratified treatments decreased NO3-N by 5.97–23.61%. In the 20–40 cm layer, stratified N application increased PON, MBN, NH4+-N and NO3-N by 14.46–21.84%, 52.08–56.01%, 10.72–32.13%, and 9.57–26.05% compared to N1:0. In 2024, N application increased 0–20 cm PON, MBN, NH4+-N and NO3-N by 46.23–55.67%, 49.76–57.90%, 23.98–84.86%, and 19.63–56.02%, respectively, compared to N0:0. The N1:4 and N2:3 treatments significantly reduced NH4+-N by 21.96% and 32.93% and NO3-N by 18.06% and 23.32%, respectively, compared to N1:0. Compared to N1:0, the N1:4 treatment also showed a 6.06% decrease in PON. No significant differences were found among the N3:2, N4:1, and N1:0 treatments. In the subsurface layer, stratified N application increased PON, MBN, NH4+-N, and NO3-N by 18.06–23.51%, 37.89–51.62%, 12.03–33.01%, and 13.13–20.56%, respectively, compared to N1:0.

3.3. Soil Enzyme Activities

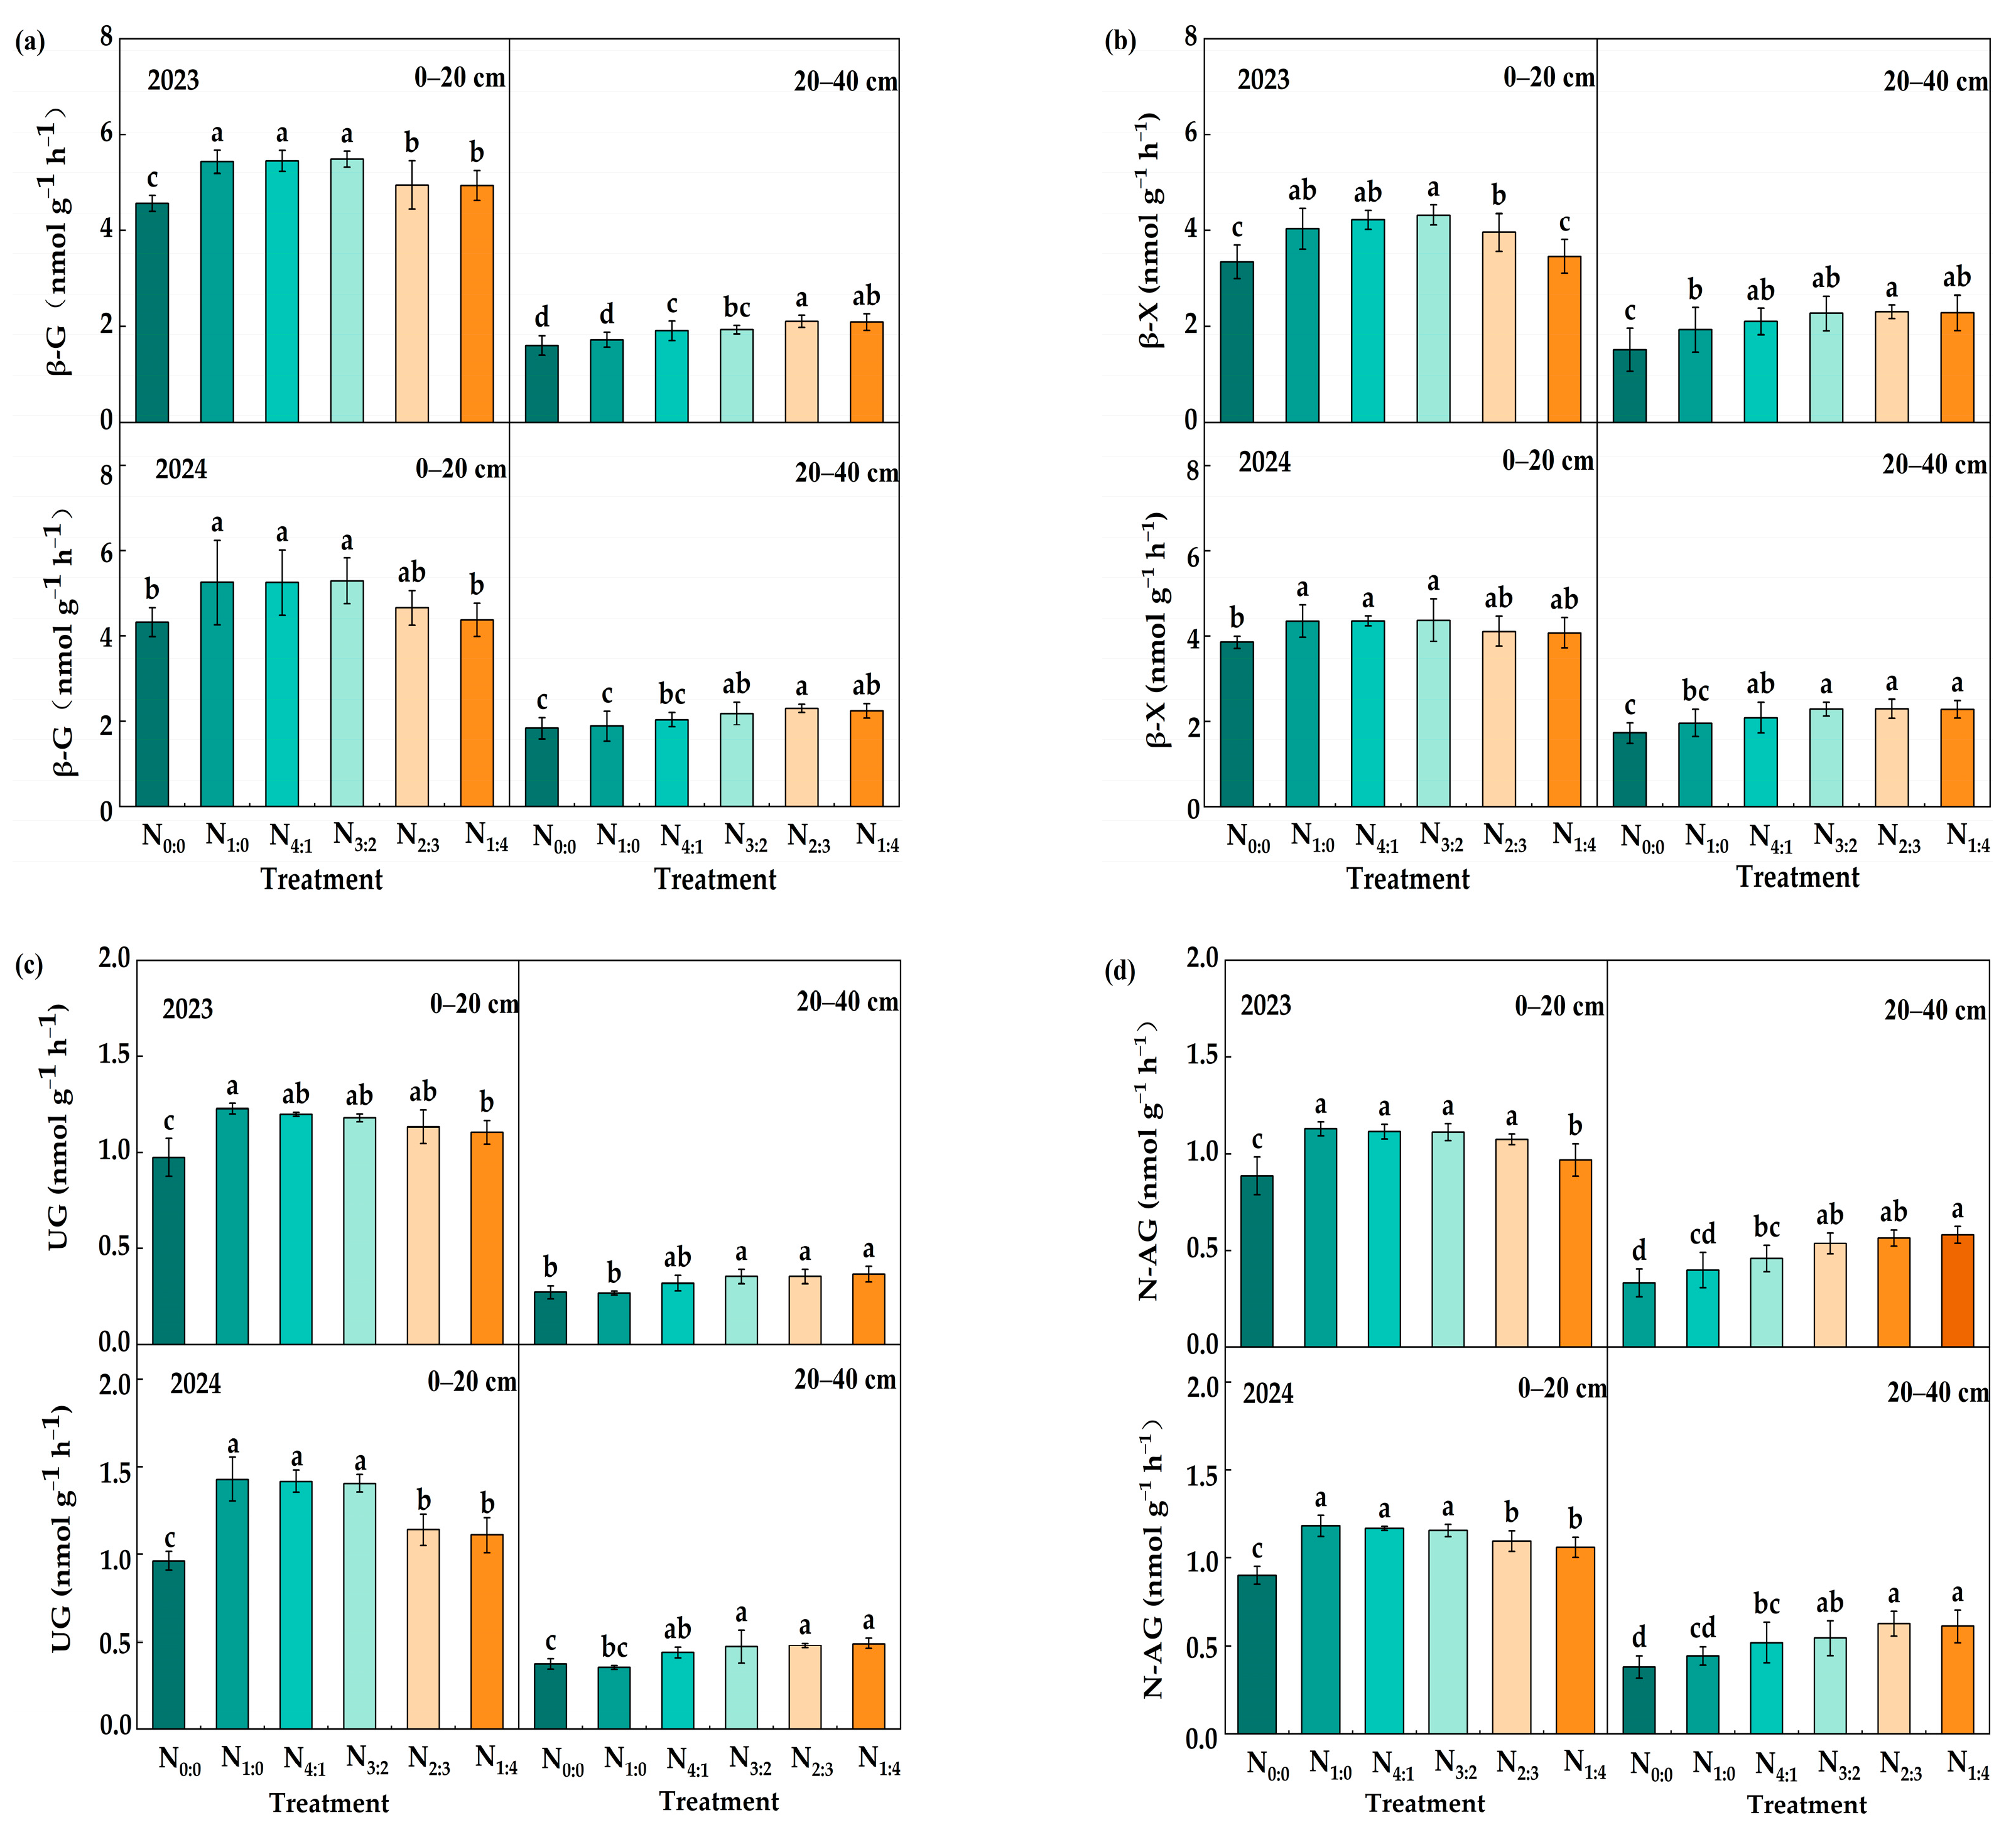
N application improved the activities of β-G, β-X, urease UG, and N-AG during both maize growing seasons (Figure 4). Higher enzymatic activities were observed in the surface layer than in the subsurface layer. In 2023, N fertilization increased β-G, β-X, UG, and N-AG activities in the 0–20 cm layer by 8.12–20.05%, 3.42–29.22%, 13.38–26.14%, and 9.42–27.49%, respectively, compared to the N0:0 treatment. Compared to N1:0, the N2:3 and N1:4 treatments significantly reduced β-G activity by 8.88% and 9.09%, respectively. These treatments also reduced β-X activity by 1.84% and 14.20%, respectively. N1:4 also decreased UG and N-AG activities by 10.12% and 14.31%. The N3:2 and N4:1 treatments showed no significant differences from N1:0. In the subsurface layer, stratified N application enhanced β-G, β-X, UG, and N-AG activities by 10.85–22.04%, 8.83–19.27%, 20.01–37.80%, and 15.07–45.82%, respectively, compared to N1:0. In 2024, N treatments increased 0–20 cm β-G, β-X, UG, and N-AG activities by 7.70–22.27%, 5.84–13.55%, 15.39–48.62%, and 17.69–31.36%, respectively, compared to N0:0. The N2:3 and N1:4 treatments significantly reduced UG activity by 20.29% and 22.36% and N-AG activity by 7.40% and 10.41%, respectively, compared to N1:0. The N1:4 also showed a 16.71% decrease in β-G activity. N3:2 and N4:1 remained statistically similar to N1:0. In the 20–40 cm layer, stratified N application enhanced β-G, β-X, UG, and N-AG activities by 10.77–25.51%, 6.34–17.12%, 23.86–38.55%, and 16.87–40.77%, respectively, compared to N1:0.

3.4. The Amount of Straw and Root Returning to the Field

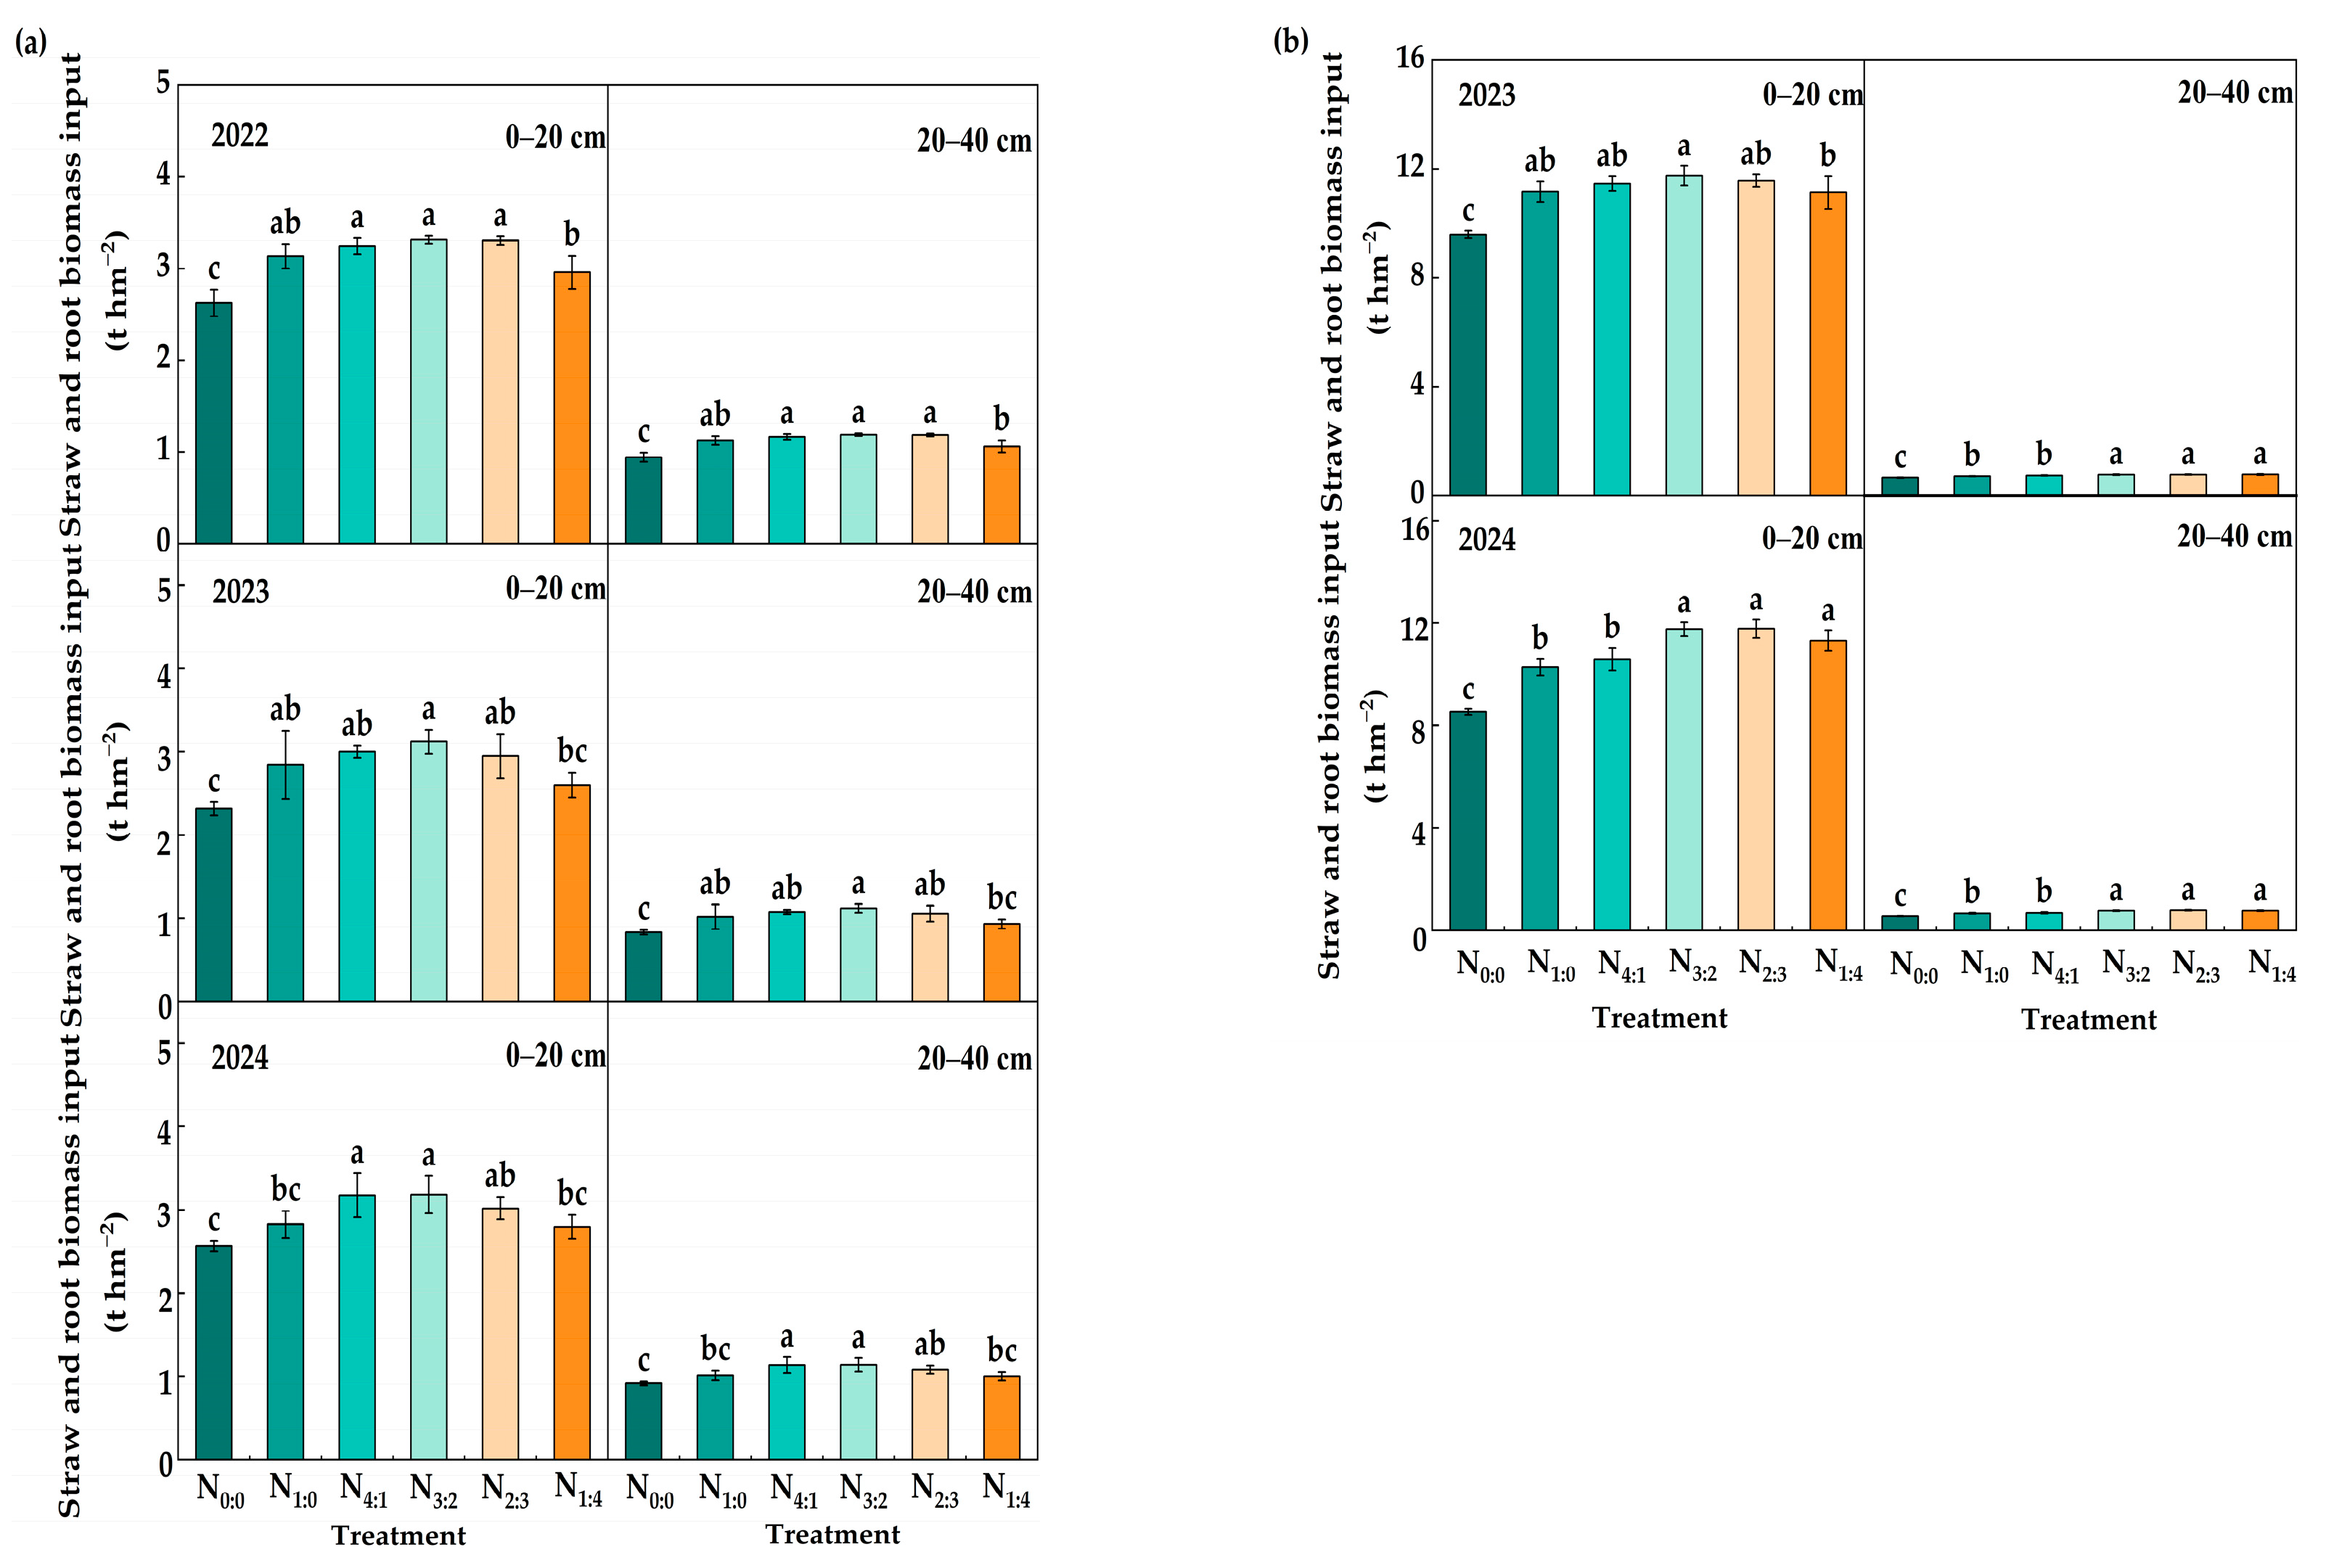
The amounts of straw and root inputs under different treatments are shown in Figure 5. During the wheat season (Figure 5a), in the 0–20 cm soil layer, N application treatments increased residue input by 8.92–34.60% compared to the N0:0 treatment. The N4:1, N3:2 and N2:3 treatments showed 3.49–12.63% higher input than N1:0. In the 20–40 cm layer, stratified N application significantly increased residue input by 8.92–34.60% compared to N0:0. During the maize season (Figure 5b), in the 0–20 cm layer, N application treatments significantly increased residue input by 16.06–38.10% compared to N0:0. The N3:2 and N2:3 treatments showed 3.65–14.50% higher input than N1:0. In the 20–40 cm layer, N3:2, N2:3 and N1:4 treatments enhanced root C input by 7.98–18.51% and 16.94–42.32% compared to N1:0 and N0:0 treatments, respectively.

3.5. Stoichiometric Ratio

Soil C/N ratio analysis (Figure 6a) showed higher values in the 0–20 cm layer than in the 20–40 cm layer for both years. However, no significant differences were found among treatments. In 2024, N application decreased the C/N ratio by 6.70–11.61% in the 20–40 cm layer compared to N0:0. Across both experimental years, N fertilization reduced POC/PON, MBC/MBN, and β-G/N-AG ratios to varying degrees (Figure 6b–d). However, it increased the MBC/SOC and MBN/TN ratios. In the 0–20 cm layer, compared to N0:0, N treatments significantly decreased POC/PON by 14.47–20.88% and MBC/MBN by 17.26–30.45%. At the same time, MBN/TN increased by 34.95–44.92%. In 2024, these treatments increased MBC/SOC by 7.78–13.31%, but β-G/N-AG showed no significant differences among treatments in either year. In the 20–40 cm layer, compared to N1:0, the N1:4 treatment significantly reduced POC/PON by 5.85% and 9.42% in both experimental years. Stratified N application reduced MBC/MBN and β-G/N-AG by 18.81–26.24% and 1.97–22.21% compared to N1:0. These treatments also decreased MBC/SOC and MBN/TN by 4.77–15.49% and 36.15–46.82%.

3.6. Soil C Pool Management Index and Quality Index

In the 0–20 cm soil layer, CPMI was much higher with N fertilizer (Table 2). The CPMI increased by 1.66–19.15% compared to the N0:0 treatment. In the 20–40 cm layer, stratified N application significantly enhanced CPMI by 49.29–69.29% compared to N0:0. These treatments also increased CPMI by 31.26–51.93% compared to N1:0 treatments. However, there were no significant differences among the stratified application treatments.
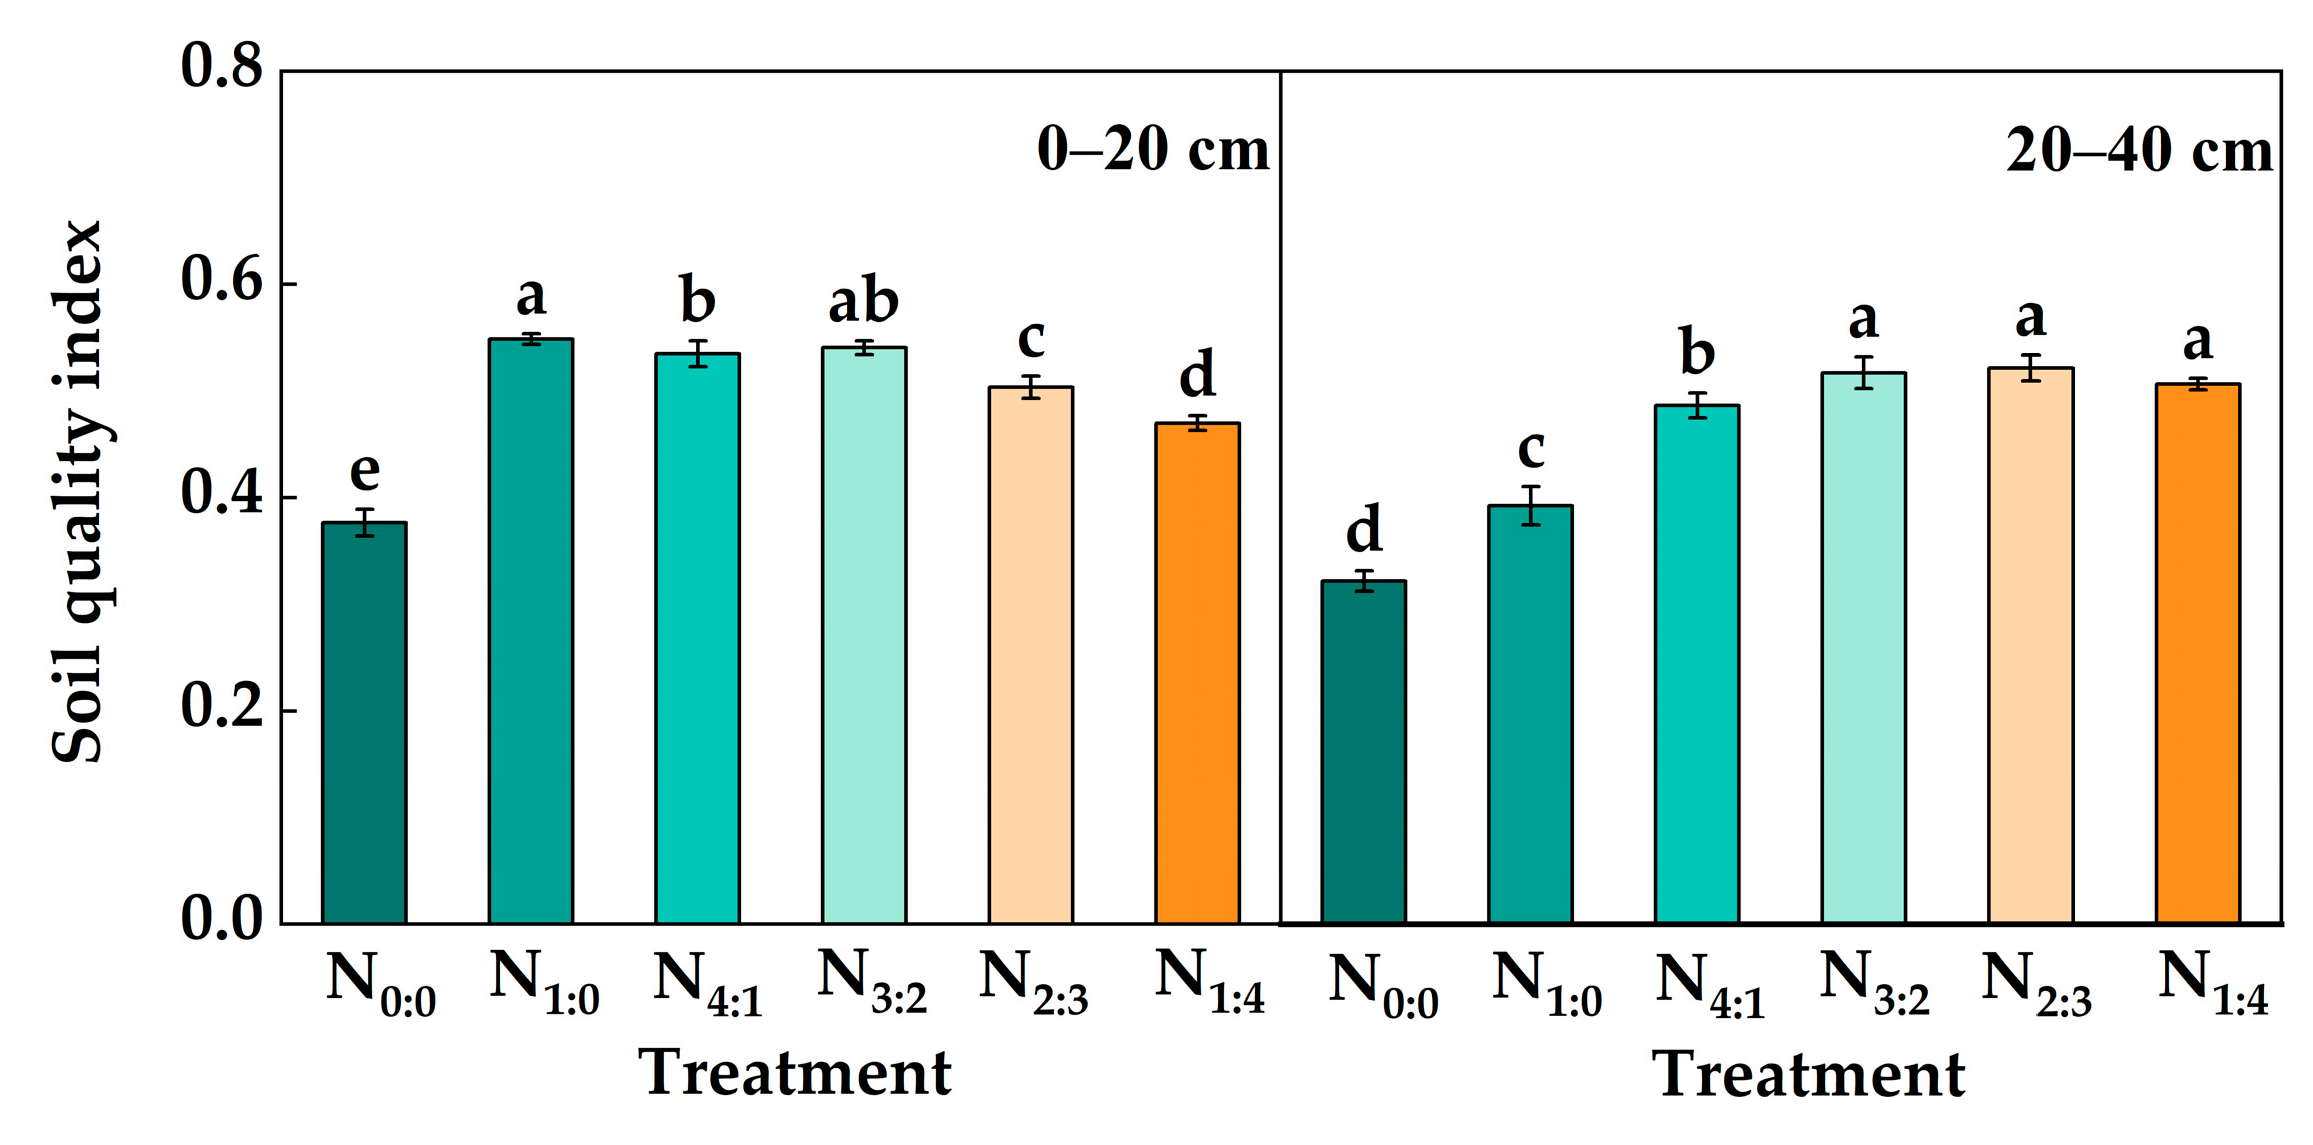
N application strategies also significantly influenced the SQI (Figure 7). N fertilization significantly increased SQI in both soil layers. In the 0–20 cm layer, all N treatments increased SQI by 24.84–45.77% compared to N0:0. The N1:0 treatment was 1.49% to 16.77% higher than the other N treatments. Specifically, N4:1, N2:3, and N1:4 treatments reduced SQI by 2.51%, 8.23% and 14.36%, respectively, compared to N1:0. In the 20–40 cm layer, stratified N application increased SQI by 51.42–62.98% compared to N0:0. It also increased by 24.06–33.54% compared to N1:0 treatments. The N2:3 treatment resulted in the highest SQI, followed by N3:2 treatment.

3.7. Correlation Between Indicators

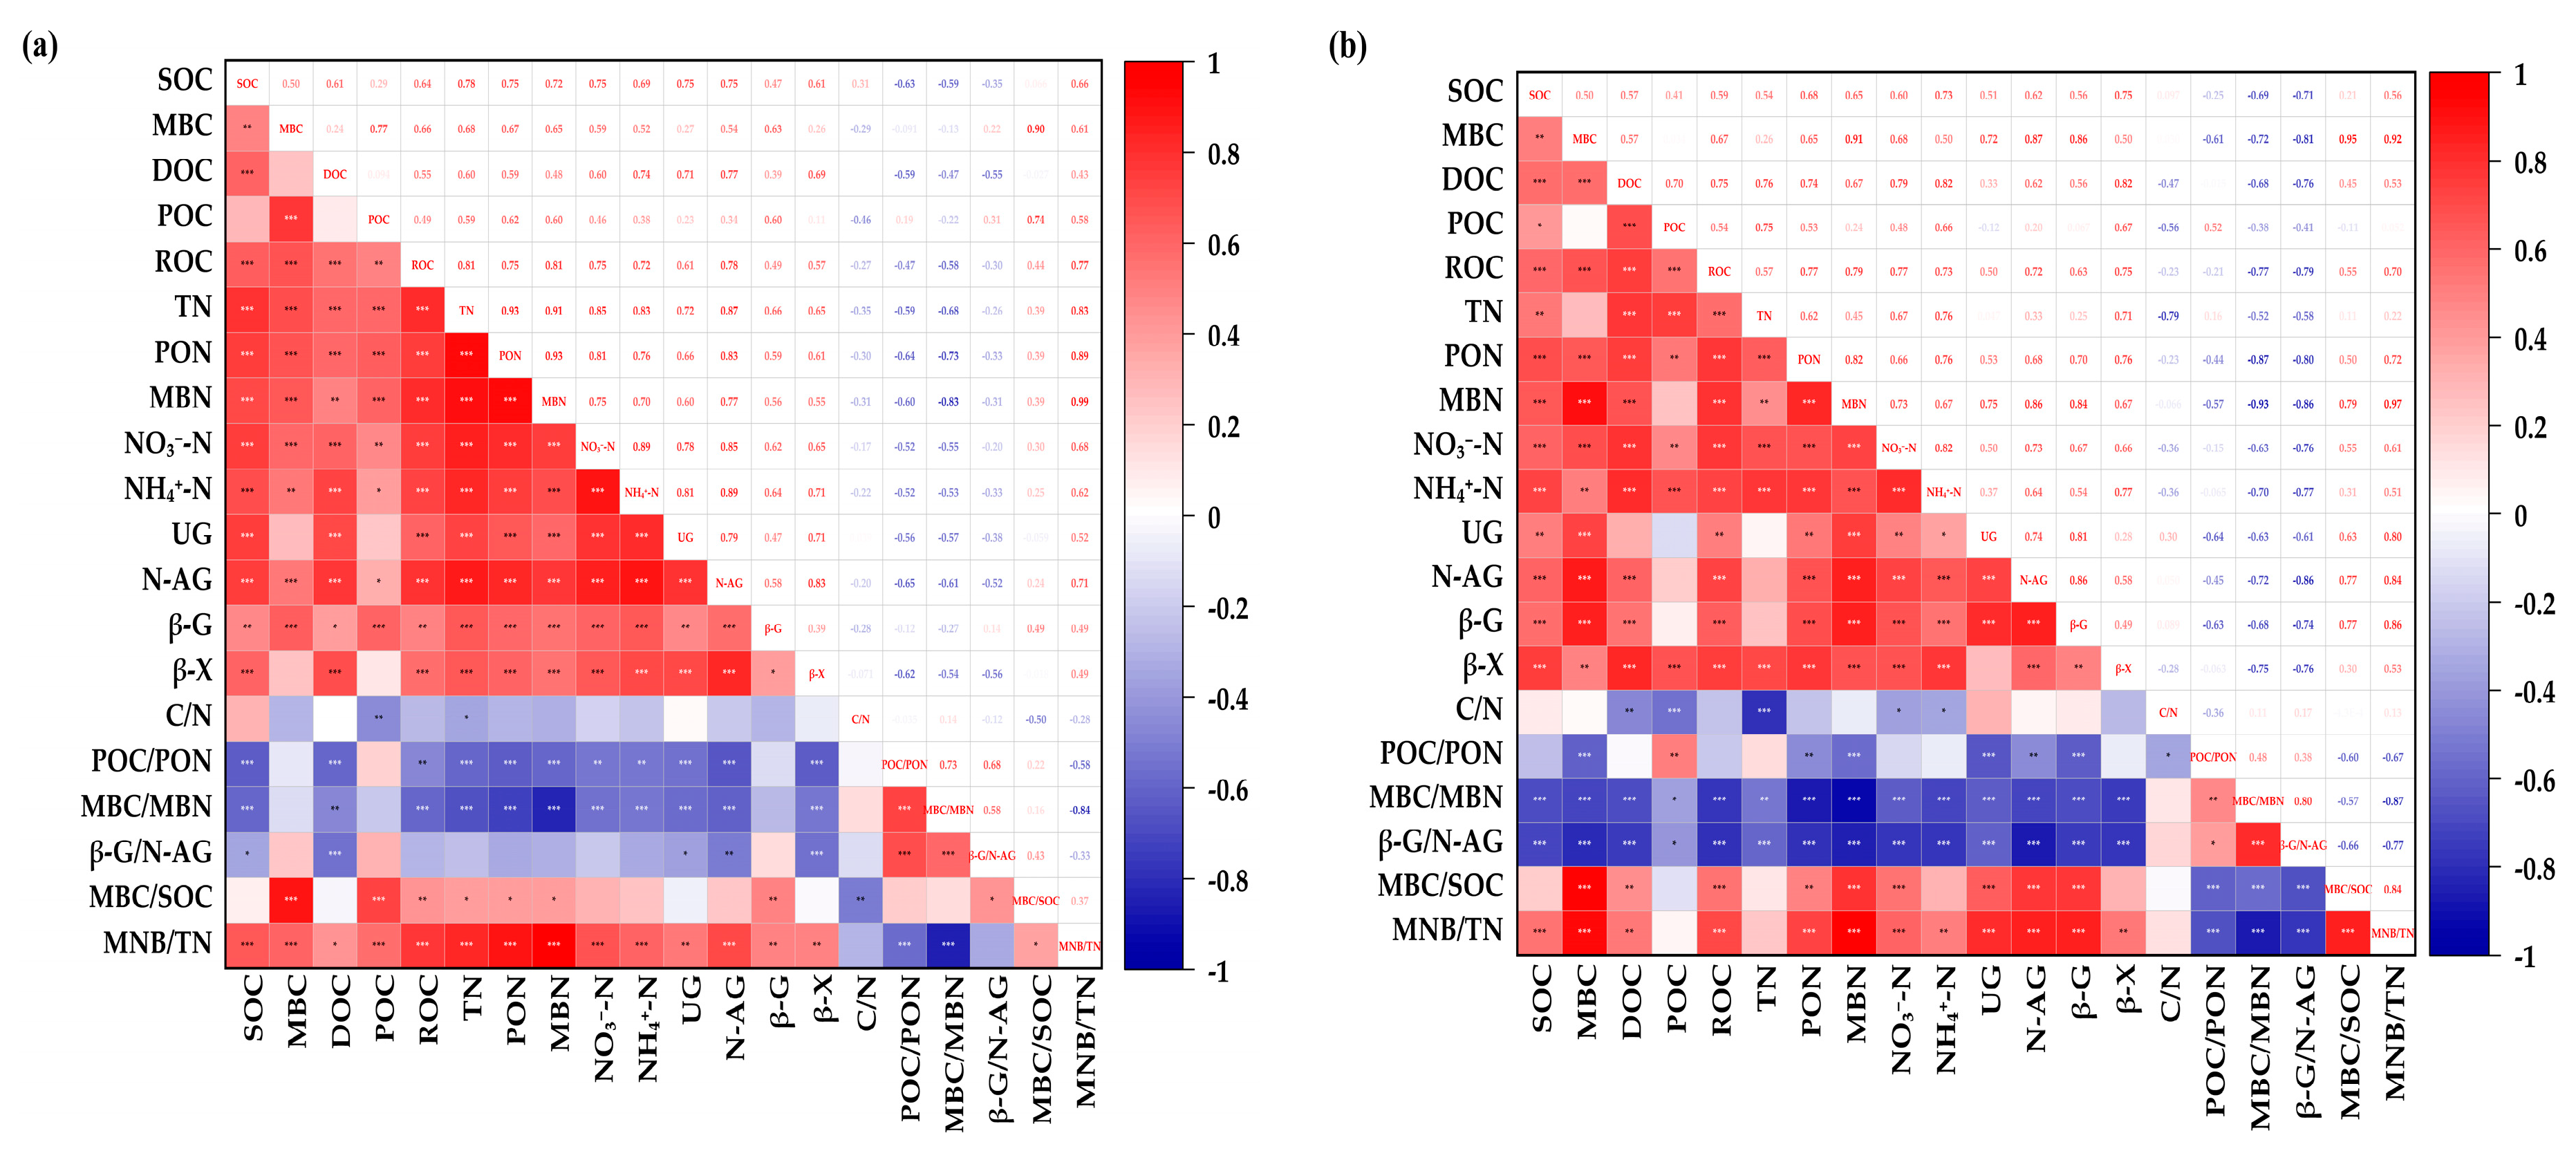
The correlation analysis of each index is shown in Figure 8. In the 0–20 cm layer, enzyme activities (β-G, β-X, N-AG, UG) correlated with several soil parameters, such as SOC, DOC, ROC, TN, NO3-N, NH4+-N, PON, and MBN. β-G was strongly correlated with POC, while N-AG was correlated with MBC. In the 20–40 cm layer, β-G, β-X, and N-AG also positively correlated with SOC, MBC, DOC, ROC, PON, MBN, NO3-N, and NH4+-N. UG activity was specifically linked to MBC, ROC, PON, and MBN. Notably, β-X also correlated with POC and TN. Both layers had positive correlations between SOC and labile C fractions, and TN and labile N fractions.
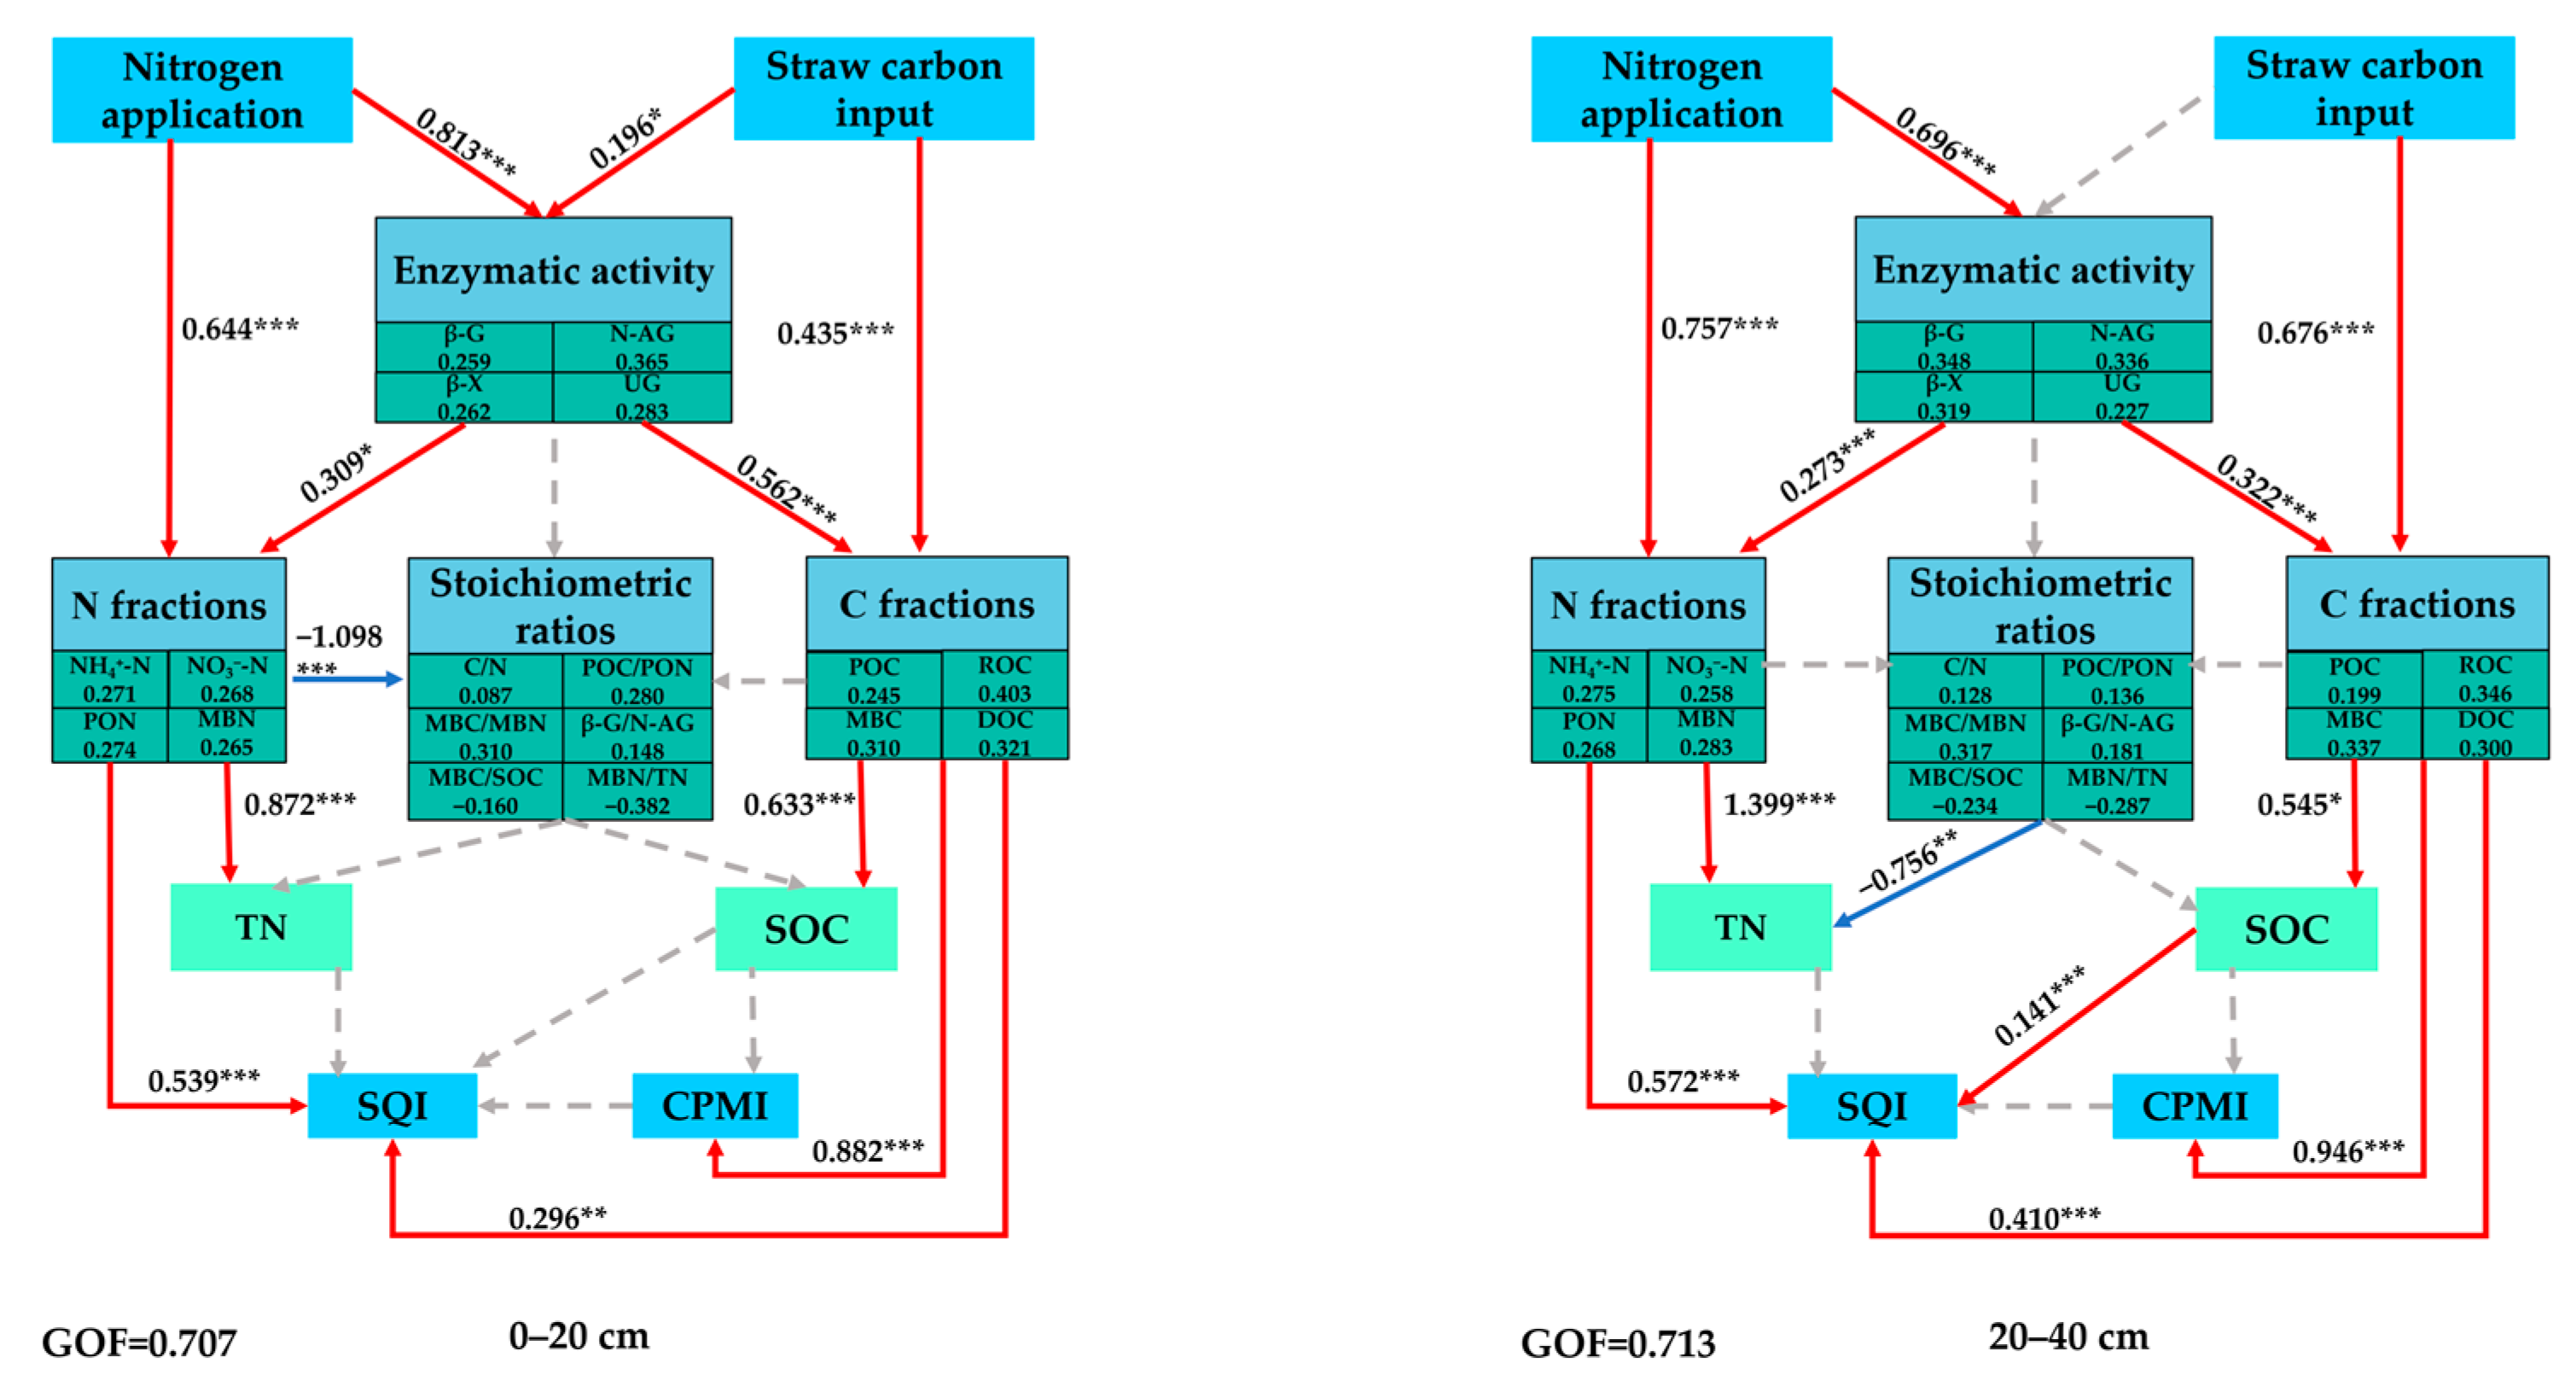
Partial least squares path modeling was employed to assess the direct and indirect impacts of biochemical factors on the CPMI and SQI under different fertilizing treatments (Figure 9). The goodness-of-fit (GOF) values for 0–20 cm and 20–40 cm layer were 0.707 and 0.713, respectively, indicating an overall satisfactory model fit. Enzyme activities and stoichiometric ratios acted as key mediators in the influence of N fertilization treatments within different soil layers on CPMI and SQI. In the 0–20 cm layer, N fractions exhibited the strongest direct effect on SQI, followed by C fractions; N application and straw C inputs directly modified enzyme activities. These changes in TN and SOC ultimately affected the CPMI and SQI. This occurred mainly through the following ways: (1) altering labile organic C and N fractions to change soil pools; (2) balancing stoichiometric ratios for elemental cycling. These fractions impacted TN and SOC, linking to the final SQI and CPMI. In the 20–40 cm layer, N fractions had the strongest direct effect, followed by C fractions and SOC. N fertilization exerted a stronger direct effect on enzyme activities while still interacting with straw-C. Enzyme activities inversely regulated stoichiometric ratios (−0.503). In the subsurface layer, the pathways for C and N fractions to SQI and CPMI were similar to the surface layer. However, the role of labile organic N fractions in the SQI was weaker compared to the topsoil.

4. Discussion

4.1. Effects of Stratified Application of N Fertilizer on SOC Pools

In this study, it was found that the application of N fertilizer significantly increased the content of SOC and labile C fractions in 0–20 and 20–40 cm soil layers in two consecutive growing seasons (Figure 1a and Figure 2), which is consistent with previous studies [39]. This enhancement can be attributed to straw providing sufficient exogenous C input for microbial growth and activity, while N fertilizer as a nutrient accelerates the turnover of straw C by microorganisms and promotes the accumulation of SOC. Previous studies have shown that there is a nonlinear relationship between N fertilizer application and SOC sequestration. Appropriate N application (100–300 kg hm−2) is beneficial to C accumulation, while insufficient or excessive N will have adverse effects [6]. In the 0–20 cm soil layer, there was no significant difference in SOC and labile C fractions were observed among N1:0, N4:1, and N3:2 treatments; however, these three treatments exhibited significantly higher levels than the N2:3 and N1:4 treatments. This was attributed to the fact that the appropriate amount of N fertilizer input (135–225 kg hm−2) in N1:0, N4:1 and N3:2 treatments being able to maintain the available N supply in the surface soil, promote plant growth and root C input, but N2:3 and N1:4 treatments (<100 kg hm−2) led to N deficiency, which may have forced the soil to accelerate the decomposition of SOC to meet crop demand, resulting in C depletion [6,49]. In addition, the dynamic balance between the C input from straw and the C loss caused by microbial decomposition may weaken the difference in SOC content under different N application levels to a certain extent, resulting in no significant difference between N1:0, N4:1, and N3:2 treatments [39]. The study demonstrates that stratified deep N application combined with straw return effectively enhances C sequestration in subsurface soils. In the long-term rice-wheat rotation experiment, Kan et al. [50] found that increasing the buried depth of straw at 20 cm could increase the SOC storage of sub-surface soil (10–40 cm) by 17.2 t hm−2. Liu et al. [51] found that deep N application could increase SOC content and reduce its degradation rate. Our experimental results also confirm the above conclusion. N fertilizer, reasonable stratified application can improve the 20–40 cm SOC content. The primary mechanism involves the disruption of the plow pan by deep fertilization, which improves subsoil aeration and water permeability, optimizes the microenvironment for microbial activity, and facilitates the continuous production of stable SOC through microbial [52]. Secondly, the optimization of N spatial distribution significantly stimulated the extension of maize roots to the subsurface layer, and the increased root biomass directly enhanced the input of root litter [32]. In addition, the enhancement of deep root activity promoted the rhizosphere deposition process and increased SOC input together. This process is consistent with the control effect of root-derived C on SOC dynamics reported by Dijkstra et al. [53].
Stratified N application supplements deep N, alleviates microbial N limitation, promotes the allocation of more C to growth rather than respiratory consumption, and improves microbial C use efficiency (CUE) [54]. This elevated CUE drives the soil microbial C pump (MCP) effect [55], which is manifested by a significant increase in MBC and enzyme activity in the subsurface layer. This is consistent with the study of Wu et al. [56]: reducing microbial C and N limitations and improving microbial C utilization efficiency are conducive to promoting SOC stability. The increase in MBC in the subsurface layer further promoted the secretion of extracellular enzymes (β-G, N-AG) by microorganisms, enhanced the decomposition of polysaccharides and chitin, and its metabolites were easily combined with minerals to form stable SOC, which was reflected in the increased MBC/SOC ratio (Figure 6) [32,52,55,57]. In addition, MBC was significantly positively correlated with β-G, β-X, and UG activities, further emphasizing the key role of the enzymatic process in mediating SOC accumulation [12]. PLS-PM analysis revealed that the direct effect coefficient of enzyme activity on labile C fractions in the subsurface layer was 0.322 (Figure 9), confirming that enhanced enzyme activity is a key mediator for N fertilizer to promote the increase in labile C fractions, confirming the assertion of Xing et al. [58] that microbial activity drives C conversion. Straw returning combined with stratified deep application of N fertilizer significantly improved the C sequestration efficiency of subsurface soil by synergistically improving the subsurface physical environment, increasing root C input, enhancing enzymatic C stabilization, and maintaining a favorable C and N balance.

4.2. Effects of Stratified Application of N Fertilizer on N Pools

N fertilization altered soil N mineralization and fixed effects of the N accumulation process [39]. This study confirmed that N fertilizer application significantly increased the content of TN and labile N fractions in each soil layer, and that stratified N application reconstructed the vertical distribution pattern of soil N (Figure 1B and Figure 3). This finding is consistent with the law of N decreasing with depth reported by Wang et al. [59]. The traditional surface application treatment (N1:0) showed significant N enrichment in the 0–20 cm soil layer, which was due to the direct N input to provide an exogenous supplement. The enrichment of surface root exudates and the peak of microbial biomass jointly activate the N invertase system, while straw decomposition couples with organic N mineralization and inorganic N fixation through the excitation effect [59,60].
In the 20–40 cm layer, stratified N application demonstrated core regulatory advantages: TN and labile N fractions were significantly higher than those of surface N application. The accumulation of N in this subsurface layer is mainly because on the one hand, the downward movement of N application ratio directly supplements sufficient N and reduces the loss of nitrification and denitrification [24]; on the other hand, the stratified N application treatment stimulated the maize roots to submerge, and the root exudates promoted microbial activity, enhanced the transformation of N and then fixed [32,61]. Previous studies have shown that β-G produces monosaccharides by hydrolyzing oligosaccharides, providing easy-to-use C sources and energy for soil microorganisms. N-AG catalyzes the hydrolysis of chitin and peptidoglycan to release C and N nutrients in soil organic matter, and its activity directly reflects soil N availability [62]. This study further revealed that under the condition of stratified N application, the contents of PON and MBN in the subsurface layer increased significantly and were positively correlated with the activities of β-G and N-AG. This finding indicates that stratified N application increased enzyme activity. On the one hand, the increase in enzyme activity stimulated microbial activity; on the other hand, it accelerated the mineralization and decomposition of complex organic N in organic materials such as straw. The N released via mineralization, together with supplemented exogenous N, was transformed into MBN and PON by microbial activity, thereby significantly promoting the fixation and accumulation of organic N fractions in the subsoil [60]. Furthermore, the more pronounced reduction in POC/PON and MBC/MBN ratios under stratified N application (Figure 6) suggests that microbial C-N metabolic strategies exhibit heightened sensitivity to exogenous N inputs-likely a result of optimized microbial efficiency and modified resource allocation patterns driven by enhanced N use efficiency. PLS-PM analysis showed that subsurface enzyme activity had a significant direct effect on the labile N fractions (path coefficient = 0.273) (Figure 9), confirming that deep N application can influence the soil N pool through enzyme-mediated pathways.

4.3. Effect of Stratified Application of N Fertilizer on Soil Enzyme Activities

Soil enzyme activity is a key link connecting the soil C and N cycles, and its dynamic change reflects the intensity of nutrient transformation. Sinsabaugh et al. [27] demonstrated that N addition can significantly enhance enzyme activity by regulating microbial metabolic substrate preferences. This study showed that N fertilizer application significantly increased the activities of β-G, β-X, N-AG, and UG (Figure 4). N fertilizer application enhances crop root metabolism and increases root exudation, creating favorable conditions for microbial proliferation. Rhizosphere microorganisms utilize soil nutrients to form a slow-release nutrient reservoir near roots, which in turn elevates soil enzyme activity while helping regulate the soil C/N ratio, thereby establishing optimal conditions for enzymatic function [11,32]. Moreover, straw returning coupled with N fertilizer provides additional bioavailable C sources to drive microbial metabolism and enzyme secretion [10]. Notably, N fertilizer reduced the β-G/N-AG ratio while increasing the overall enzyme activity (Figure 4 and Figure 6). This shift indicates a microbial transition from a C-acquisition to an N-acquisition strategy, confirming the dual role of N fertilizer in promoting the N cycle by optimizing microbial nutrient use efficiency, which is consistent with the findings of Sinsabaugh et al. [27]. This study showed that stratified deep fertilization significantly enhanced subsoil enzyme activity compared to surface application. The reason is that stratified N application promotes maize root development and exudate release, thereby directly stimulates microbial extracellular enzyme synthesis [32,63].
In this study, stratified deep application (N1:4 and N2:3 treatments) significantly increased the contents of NH4+-N and NO3-N in the subsurface layer, forming a synergistic relationship with the increased enzyme activity [64]. This result confirms the strong correlation between inorganic N availability and enzyme activity proposed by Nevins et al. [65]. Studies have shown that soil enzymes drive the C and N cycle by decomposing exogenous organic matter, catalyzing the mineralization of organic matter, and participating in the N conversion process. It is related to soil organisms, easy to determine, and reflects soil C and N availability [12,66]. This study showed that UG activity was positively correlated with MBC, ROC, PON, and MBN contents, indicating that optimized N input increased enzyme levels by amplifying microbial populations and activities. The significant positive correlation between β-G activity and DOC confirms its core function of catalyzing the degradation of polysaccharides into readily available microbial substrates [62]. Previous studies have shown that soil enzymes play a dual role in the C cycle. On the one hand, by decomposing plant macromolecules, they provide energy for microorganisms and affect the subsequent production of microbial-derived C; on the other hand, unused plant residues can accumulate in the soil and regulate the accumulation of soil–plant-derived C [52,55]. The PLS-PM analysis, this study showed that N fertilizer application regulated soil stoichiometric stoichiometry and labile C and N fractions via an enzyme-mediated pathway, thereby improving CPMI and SQI, highlighting the pivotal role of the enzyme system in coupling soil C and N cycles.

4.4. Effects of Stratified Application of N Fertilizer on CPMI and SQI

This study confirmed that soil CPMI confirmed a positive correlation between soil fertility. N fertilizer application significantly increased CPMI in the 0–20 cm soil layer (Table 2), which verified the mechanism of straw returning combined with N fertilizer to increase surface carbon pool by increasing exogenous carbon input and promoting microbial transformation [14]. It was found that the increase in CPMI slowed down when the N application rate exceeded 135 kg hm−2 (0–20 cm), indicating the existence of an optimal N application threshold. This finding is consistent with previous studies on the threshold effect of N fertilizer on SOC [6,67]. However, the specific threshold is different from previous reports. But the specific threshold was different: Hu et al. [67] found that high N fertilizer (450 kg hm−2) combined with less tillage could improve SOC fixation. A meta-analysis showed that medium N fertilizer (100–300 kg hm−2 year−1) was most effective [6]. These discrepancies may arise because the response of the soil functional carbon pool to N application depends on the initial SOC content and is regulated by plant, geochemical, and microbial factors [68]. In the 20–40 cm soil layer, stratified N application significantly increased soil CPMI compared to N0:0 and N1:0 treatments. This increase in CPMI was positively correlated with the elevated levels of SOC and labile organic C resulting from stratified N application. Therefore, the increase in subsoil CPMI fundamentally reflects enhanced SOC accumulation [14].
This study found that stratified N application significantly affected SQI (Figure 7). In the 0–20 cm soil layer, the N3:2 treatment not only met microbial metabolic demands, promotes enzyme secretion and nutrient transformation, but also avoided leaching losses associated with excessive N, thereby improving the SQI. The results are consistent with the improvement of SQI by medium N application (150 kg hm−2) combined with straw incorporation in East China [69]. However, a discrepancy exists when compared with findings from the Loess Plateau, where straw mulching with a high N rate (240 kg hm−2) yielded the best effect [70]. This regional disparity is primarily attributed to differences in climatic conditions, management practices, and inherent soil properties. The semi-arid Loess Plateau requires high N inputs to offset the inhibitory effect of straw mulching on N mineralization, whereas the present study area necessitates controlled N application to prevent leaching losses. Furthermore, there were significant differences in N use efficiency between straw incorporation and straw mulching practices. These observed variations confirm the finding of Wang et al. [71] that improving soil quality requires multi-dimensional synergy. As studies have shown, soil quality improvement depends on the integrated regulation of multiple factors, including N distribution, organic C stability, and enzyme activity [35,36,72]. Xiao et al. [73] showed that the enhancement of soil N availability was beneficial to alleviate MBC limitation and increase the activity of C-acquiring enzymes. This study found that optimizing the vertical distribution of N fertilizer enhanced the SQI. This enhancement is attributed to the stratified N application increasing the TN and SOC content in the subsoil and activating key enzymes involved in C and N transformations. PLS-PM analysis further revealed that enzyme activity and the soil C/N stoichiometric ratio were key mediating factors through which stratified N application affects the SQI. Stratified N application improved the coupling efficiency of C and N by influencing enzyme activity and labile C and N fractions, thereby optimizing the C/N stoichiometric ratio of the subsurface layer. In the 0–20 cm soil layer, N had the most direct effect on SQI, which was due to the increase in UG and N-AG activities by N input, thereby promoting the increase in labile organic N fractions. In the 20–40 cm soil layer, the increase in enzyme activity and microbial biomass C and N promoted the transformation of C and N in the subsurface soil. Total effect analysis showed that N fertilizer, enzyme activity, and labile C and N fractions were positive drivers of the SQI. However, an excessively high C/N ratio exerted a negative impact.

5. Conclusions

In the wheat-maize rotation system of the North China Plain, stratified deep placement of N fertilizer significantly enhanced soil C sequestration and soil quality by regulating enzyme-mediated C and N turnover processes. A two-year field experiment demonstrated that compared to traditional surface application, the stratified deep placement of N fertilizer at a 3:2 ratio (N3:2) improved the SOC and TN content in the 20–40 cm soil layer while maintaining topsoil quality. This practice optimized the stoichiometric characteristics of soil C and N by activated subsoil enzyme activity, promoted the accumulation of microbial biomass C and N, and ultimately increased the CPMI and SQI in the subsoil. The study indicates that under straw return conditions, the 3:2 ratio for stratified deep placement of N fertilizer is the optimal proportion for achieving synchronous improvement in C sequestration and soil quality in both the topsoil and subsoil in the North China Plain. This study employed a micro-plot experimental approach, and comparisons may differ from large-scale mechanized field trials. Subsequent work should validate this stratified fertilization method under mechanized field conditions to assess its applicability and potential for broader adoption. The study confirmed that the stratified N fertilizer technique can simultaneously enhance SOC storage, reduce N loss, and improve soil biochemical properties. This finding provides a practical pathway for promoting soil health globally through optimized N fertilizer management.

Author Contributions

B.W.: Writing-review and editing, writing—original draft, visualization, validation, methodology, investigation, formal analysis, data curation. Y.W.: Writing-review and editing, visualization, conceptualization. J.L.: Investigation. R.H.: Investigation. Y.L. (Yulong Liu): Investigation. X.F.: Writing-review and editing, visualization, conceptualization. J.M.: Writing-review and editing, conceptualization. Y.L. (Yingchun Li): Writing-review and editing, supervision, conceptualization. Z.P.: Writing-review and editing, Resources, project administration, funding acquisition, data curation, conceptualization. All authors have read and agreed to the published version of the manuscript.

Funding

This study was supported by National Key R&D Program of China (Grant No. 2023YFD2301500).

Data Availability Statement

The datasets generated during and/or analyzed during the current study are available from the corresponding author on reasonable request.

Conflicts of Interest

The authors declare no conflicts of interest.

References

  1. Liu, C.; He, C.H.; Chang, S.X.; Chen, X.L.; An, S.S.; Wang, D.W.; Yan, J.; Zhang, Y.H.; Li, P. Fertilization and tillage influence on soil organic carbon fractions: A global meta-analysis. Catena 2024, 246, 108404. [Google Scholar] [CrossRef]
  2. Lal, R. Soil carbon sequestration impacts on global climate change and food security. Science 2004, 304, 1623–1627. [Google Scholar] [CrossRef]
  3. Liu, J.; Fang, L.C.; Qiu, T.Y.; Chen, J.; Wang, H.; Liu, M.X.; Yi, J.; Zhang, H.L.; Wang, C.; Sardans, J.; et al. Crop residue return achieves environmental mitigation and enhances grain yield: A global meta-analysis. Agron. Sustain. Dev. 2023, 43, 78. [Google Scholar] [CrossRef]
  4. Jha, P.; Hati, K.M.; Dalal, R.C.; Dang, Y.P.; Kopittke, P.M.; Menzies, N.W. Soil carbon and nitrogen dynamics in a Vertisol following 50 years of no-tillage, crop stubble retention and nitrogen fertilization. Geoderma 2020, 358, 113996. [Google Scholar] [CrossRef]
  5. Chahal, I.; Hooker, D.C.; Deen, B.; Janovicek, K.; Van Eerd, L.L. Long-term effects of crop rotation, tillage, and fertilizer nitrogen on soil health indicators and crop productivity in a temperate climate. Soil Tillage Res. 2021, 213, 105121. [Google Scholar] [CrossRef]
  6. Liu, Y.H.; Li, C.; Cai, G.; Sauheitl, L.; Xiao, M.L.; Shibistova, Q.; Ge, T.; Guggenberger, G. Meta-analysis on the effects of types and levels of N, P, and K fertilization on organic carbon in cropland soils. Geoderma 2023, 437, 116580. [Google Scholar] [CrossRef]
  7. Xie, Q.H.; Yao, X.B.; Yang, Y.; Li, D.J.; Qi, J.Y. Effects of Deep Application of Fertilizer on Soil Carbon and Nitrogen Functions in Rice Paddies. Agronomy 2025, 15, 938. [Google Scholar] [CrossRef]
  8. Yan, L.M.; Xu, X.N.; Xia, J.Y. Different impacts of external ammonium and nitrate addition on plant growth in terrestrial ecosystems: A meta-analysis. Sci. Total Environ. 2019, 686, 1010–1018. [Google Scholar] [CrossRef]
  9. Tao, J.Y.; Liu, X.Y. Combined application of nitrogen and phosphorus fertilizers increases soil organic carbon storage in cropland soils. Eur. J. Agron. 2025, 168, 127607. [Google Scholar] [CrossRef]
  10. Song, J.J.; Song, J.H.; Xu, W.; Gao, G.X.; Bai, J.Z.; Zhang, Z.H.; Yu, Q.; Hao, J.Q.; Yang, G.H.; Ren, G.X.; et al. Straw return with fertilizer improves soil CO2 emissions by mitigating microbial nitrogen limitation during the winter wheat season. Catena 2024, 241, 108050. [Google Scholar] [CrossRef]
  11. Yue, K.; Fornara, D.A.; Yang, W.Q.; Peng, Y.; Peng, C.H.; Liu, Z.L.; Wu, F.Z. Influence of multiple global change drivers on terrestrial carbon storage: Additive effects are common. Ecolo Lett. 2017, 20, 663–672. [Google Scholar] [CrossRef] [PubMed]
  12. Chen, X.; Cao, J.J.; Sinsabaugh, R.L.; Moorhead, D.L.; Bardgett, R.D.; Fanin, N.; Nottingham, A.T.; Zheng, X.H.; Chen, J. Soil extracellular enzymes as drivers of soil carbon storage under nitrogen addition. Biol. Rev. 2025, 100, 1716–1733. [Google Scholar] [CrossRef] [PubMed]
  13. Wang, L.F.; Sun, J.T.; Kang, J.; Zhang, Z.Y.; Shangguan, Z.P.; Wang, C.Y. Influence of nitrogen addition on the changes in nitrogen and carbon fractions in soil profiles of wheat fields. Land Degrad. Dev. 2021, 32, 2540–2553. [Google Scholar] [CrossRef]
  14. Anning, D.K.; Ghanney, P.; Qiu, H.Z.; Abalori, T.A.; Zhang, C.H.; Luo, C.Y. Stimulation of soil organic matter fractions by maize straw return and nitrogen fertilization in the Loess Plateau of Northwest China. Appl. Soil Ecol. 2023, 191, 105061. [Google Scholar] [CrossRef]
  15. Zhang, M.; Yao, Y.L.; Zhao, M.; Zhang, B.; Tian, Y.H.; Yin, B.; Zhu, Z.L. Integration of urea deep placement and organic addition for improving yield and soil properties and decreasing N loss in paddy field. Agric. Ecosyst. Environ. 2017, 247, 236–245. [Google Scholar] [CrossRef]
  16. Hassink, J.; Whitmore, A.P.; Kubát, J. Size and density fractionation of soil organic matter and the physical capacity of soils to protect organic matter. Eur. J. Agron. 1997, 7, 189–199. [Google Scholar] [CrossRef]
  17. Yan, H.M.; Cao, M.K.; Liu, J.Y.; Tao, B. Potential and sustainability for carbon sequestration with improved soil management in agricultural soils of China. Agric. Ecosyst. Environ. 2007, 121, 325–335. [Google Scholar] [CrossRef]
  18. Battye, W.; Aneja, V.P.; Schlesinger, W.H. Is nitrogen the next carbon? Earths Future 2017, 5, 894–904. [Google Scholar] [CrossRef]
  19. Luo, X.Z.; Zhang, L.L.; Lin, Y.D.; Wen, D.Z.; Hou, E.Q. Nitrogen availability mediates soil organic carbon cycling in response to phosphorus supply: A global meta-analysis. Soil Biol. Biochem. 2023, 185, 109158. [Google Scholar] [CrossRef]
  20. Yan, D.Z.; Wang, D.J.; Yang, L.Z. Long-term effect of chemical fertilizer, straw, and manure on labile organic matter fractions in a paddy soil. Biolog. Fert. Soils. 2007, 44, 93–101. [Google Scholar] [CrossRef]
  21. Gentile, R.; Vanlauwe, B.; Chivenge, P.; Six, J. Trade-offs between the short- and long-term effects of residue quality on soil C and N dynamics. Plant Soil 2011, 338, 159–169. [Google Scholar] [CrossRef]
  22. Li, K.; Lin, H.; Han, M.; Yang, L. Soil metagenomics reveals the effect of nitrogen on soil microbial communities and nitrogen-cycle functional genes in the rhizosphere of Panax ginseng. Front. Plant Sci. 2024, 15, 1411073. [Google Scholar] [CrossRef]
  23. Sun, L.F.; Qiao, Y.C.; Wanek, W.; Moorhead, D.L.; Cui, Y.X.; Peng, Y.J.; Song, L.Q.; Hu, B.Q.; Zhang, T.; Li, S.L. Nitrogen input decreases microbial nitrogen use efficiency in surface soils of a temperate forest in northeast China. Geoderma 2025, 453, 117159. [Google Scholar] [CrossRef]
  24. Liu, C.H.; Pang, S.Y.; Li, X.F.; Li, Y.Q.; Li, J.W.; Ma, R.L.; Lin, X.; Wang, D. Nitrogen losses trade-offs through layered fertilization to improve nitrogen nutrition status and net economic benefit in wheat-maize rotation system. Field Crops Res. 2024, 312, 109406. [Google Scholar] [CrossRef]
  25. Yang, Y.; Chen, X.L.; Liu, L.X.; Li, T.; Dou, Y.X.; Qiao, J.B.; Wang, Y.Q.; An, S.S.; Chang, S.X. Nitrogen fertilization weakens the linkage between soil carbon and microbial diversity: A global meta-analysis. Glob. Chang. Biol. 2022, 28, 6446–6461. [Google Scholar] [CrossRef]
  26. Zhu, Y.P.; Zhang, H.P.; Wang, Q.X.; Zhu, W.D.; Kang, Y.H. Soil extracellular enzyme activity linkage with soil organic carbon under conservation tillage: A global meta-analysis. Eur. J. Agron. 2024, 155, 127135. [Google Scholar] [CrossRef]
  27. Sinsabaugh, R.L.; Lauber, C.L.; Weintraub, M.N.; Ahmed, B.; Allison, S.D.; Crenshaw, C.; Contosta, A.R.; Cusack, D.; Frey, S.; Gallo, M.E.; et al. Stoichiometry of soil enzyme activity at global scale. Ecol. Lett. 2008, 11, 1252–1264. [Google Scholar] [CrossRef]
  28. Zhu, Z.K.; Fang, Y.Y.; Liang, Y.Q.; Li, Y.H.; Liu, S.L.; Li, Y.F.; Li, B.Z.; Gao, W.; Yuan, H.Z.; Kuzyakov, Y.; et al. Stoichiometric regulation of priming effects and soil carbon balance by microbial life strategies. Soil Biol. Biochem. 2022, 169, 108669. [Google Scholar] [CrossRef]
  29. Moorhead, D.L.; Sinsabaugh, R.L. A theoretical model of litter decay and microbial interaction. Ecol. Monogr. 2006, 76, 151–174. [Google Scholar] [CrossRef]
  30. Marx, M.C.; Wood, M.; Jarvis, S.C. A microplate fluorimetric assay for the study of enzyme diversity in soils. Soil Biol. Biochem. 2001, 33, 1633–1640. [Google Scholar] [CrossRef]
  31. Meng, X.T.; Zhang, X.C.; Li, Y.N.; Jiao, Y.P.; Fan, L.C.; Jiang, Y.J.; Qu, C.Y.; Filimonenko, E.; Jiang, Y.H.; Tian, X.H.; et al. Nitrogen fertilizer builds soil organic carbon under straw return mainly via microbial necromass formation. Soil Biol. Biochem. 2024, 188, 109223. [Google Scholar] [CrossRef]
  32. Liu, C.H.; Pang, S.Y.; Li, X.F.; Liu, P.; Zhou, Y.; Lin, X.; Gu, S.B.; Wang, D. Layered nitrogen fertilization regulates root morphology to promote synergistic nitrogen and phosphorus absorption in maize (Zea mays L.). Field Crops Res. 2025, 322, 109737. [Google Scholar] [CrossRef]
  33. Fan, D.J.; Li, C.F.; Cao, G. Effects of nitrogen deep placement on chemical properties of soil organic matter and extracellular enzyme activity in no-tillage paddy fields. J. Agron. Environ. Sci. 2021, 40, 621–630. [Google Scholar]
  34. Bünemann, E.K.; Bongiorno, G.; Bai, Z.G.; Creamer, R.E.; De Deyn, G.; de Goede, R.; Fleskens, L.; Geissen, V.; Kuyper, T.W.; Mäder, P.; et al. Soil quality-a critical review. Soil Biol. Biochem. 2018, 120, 105–125. [Google Scholar] [CrossRef]
  35. Li, Y.J.; Ma, J.W.; Li, Y.Q.; Jia, Q.M.; Shen, X.Y.; Xia, X.H. Spatiotemporal variations in the soil quality of agricultural land and its drivers in China from 1980 to 2018. Sci. Total Environ. 2023, 892, 164649. [Google Scholar] [CrossRef]
  36. Huang, M.Z.; Lu, R.J.; Wu, Y.Q.; Zhao, T.J.; Zhao, J.; Ma, L. Spatiotemporal dynamics and influencing factors of soil quality in aeolian desertified lands of the Qinghai-Tibet Plateau. Ecol. Indic. 2025, 172, 113264. [Google Scholar] [CrossRef]
  37. Zhang, J.W.; Li, H.; Chai, X.T.; Zhao, S.; Li, L.W.; Jia, L.J.; Zhang, J.H.; Wang, G.Y. Effects of fertilization with subsoiling of maize and limited irrigation of wheat on soil microbial biomass carbon, nitrogen and enzymes activities. J. Soil Water Conserv. 2022, 36, 346–355. [Google Scholar] [CrossRef]
  38. Shi, J.Y. Effects of Location and Rate of Mechanized Application of Nitrogen, Phosphorus and Potassium Fertilizers on Growth and Soil Properties of Maize. Master’s Thesis, Hebei Agricultural University, Baoding, China, 2024. [Google Scholar]
  39. Ren, G.C.; Zhang, X.F.; Xin, X.L.; Yang, W.L.; Zhu, A.N.; Yang, J.; Li, M.R. Soil organic carbon and nitrogen fractions as affected by straw and nitrogen management on the North China Plain. Agric. Ecosyst. Environ. 2023, 342, 108248. [Google Scholar] [CrossRef]
  40. Wu, L.L.; Song, Z.L.; Zhang, X.Y.; Guo, Y.; Wang, Y.D.; Yu, C.X.; Fang, Y.Y.; Hartley, I.P.; Chen, J.; Xia, S.P.; et al. Patterns and drivers of soil organic carbon fractions and persistence in coastal wetlands of China. Catena 2025, 257, 109186. [Google Scholar] [CrossRef]
  41. Li, Y.N.; Wang, C.Y.; Wu, J.N.; Zhang, Y.M.; Li, Q.; Liu, S.X.; Gao, Y.H. The Effects of Localized Plant-Soil-Microbe Interactions on Soil Nitrogen Cycle in Maize Rhizosphere Soil under Long-Term Fertilizers. Agronomy 2023, 13, 2114. [Google Scholar] [CrossRef]
  42. Yu, Q.G.; Hu, X.; Ma, J.W.; Ye, J.; Sun, W.C.; Wang, Q.; Lin, H. Effects of long-term organic material applications on soil carbon and nitrogen fractions in paddy fields. Soil Tillage Res. 2020, 196, 104483. [Google Scholar] [CrossRef]
  43. Yang, L.; Wang, L.H.; Chu, J.C.; Zhao, H.L.; Zhao, J.; Zang, H.D.; Yang, Y.D.; Zeng, Z.H. Improving soil quality and wheat yield through diversified crop rotations in the North China Plain. Soil Tillage Res. 2024, 244, 106231. [Google Scholar] [CrossRef]
  44. Chen, Z.; Wang, Q.; Wang, H.; Bao, L.; Zhou, J. Crop yields and soil organic carbon fractions as influenced by straw incorporation in a rice-wheat cropping system in southeastern China. Nutr. Cycl. Agroecosyst. 2018, 112, 61–73. [Google Scholar] [CrossRef]
  45. Begum, R.; Jahangir, M.M.R.; Jahiruddin, M.; Islam, M.R.; Bokhtiar, S.M.; Islam, K.R. Reduced tillage with residue retention improves soil labile carbon pools and carbon lability and management indices in a seven-year trial with wheat-mung bean-rice rotation. Pedosphere 2022, 32, 916–927. [Google Scholar] [CrossRef]
  46. Wang, J.; Fu, X.; Sainju, M.U.; Zhao, F.Z. Soil carbon fractions in response to straw mulching in the Loess Plateau of China. Biol. Fertil. Soils. 2018, 54, 423–436. [Google Scholar] [CrossRef]
  47. Yu, H.L.; Zhang, E.H.; Wang, Q.; Liu, Q.H.; Liu, C.W.; Wang, T.T.; Yin, H. Effects of irrigation and N supply levels on soil organic carbon, total nitrogen and grain yield of spring wheat on no-tillage farmland with standing stubble. Acta Prat. Sci. 2013, 22, 227–233. [Google Scholar] [CrossRef]
  48. Andrews, S.S.; Karlen, D.L.; Mitchell, J.P. A comparison of soil quality indexing methods for vegetable production systems in Northern California. Agric. Ecosyst. Environ. 2002, 90, 25–45. [Google Scholar] [CrossRef]
  49. Zhang, W.; Ni, B.; Xu, X.C.; Yang, X.; Meng, F.Q. Impacts of Nitrogen Application on Ammonia Volatilization During Maize Season in Northern China. Environ. Sci. 2020, 41, 5176–5184. [Google Scholar] [CrossRef]
  50. Kan, Z.R.; Li, Z.Z.; Amelung, F.; Zhang, H.L.; Lal, R.; Bol, R.; Bian, X.M.; Liu, J.; Xue, Y.G.; Li, F.M.; et al. Soil carbon accrual and crop production enhanced by sustainable subsoil management. Nat. Geosci. 2025, 18, 631–638. [Google Scholar] [CrossRef]
  51. Liu, T.Q.; Li, S.H.; Guo, L.G.; Cao, C.G.; Li, C.F.; Zhai, Z.B.; Zhou, J.Y.; Mei, Y.M.; Ke, H.J. Advantages of nitrogen fertilizer deep placement in greenhouse gas emissions and net ecosystem economic benefits from no-tillage paddy fields. J. Cleaner Prod. 2020, 263, 121322. [Google Scholar] [CrossRef]
  52. Liang, C.; Zhu, X.F. The soil microbial carbon pump as a new concept for terrestrial carbon sequestration. Sci. China Earth Sci. 2021, 64, 545–558. [Google Scholar] [CrossRef]
  53. Dijkstra, F.A.; Zhu, B.; Cheng, W.X. Root effects on soil organic carbon: A double-edged sword. New Phytol. 2020, 230, 60–65. [Google Scholar] [CrossRef]
  54. Liu, M.H.; Lin, H.Y.; Li, J.M. Are there links between nutrient inputs and the response of microbial carbon use efficiency or soil organic carbon? A meta-analysis. Soil Biol. Biochem. 2025, 201, 109656. [Google Scholar] [CrossRef]
  55. Liang, C.; Schimel, J.P.; Jastrow, J.D. The importance of anabolism in microbial control over soil carbon storage. Nat. Microbiol. 2017, 2, 17105. [Google Scholar] [CrossRef] [PubMed]
  56. Wu, M.Y.; Chen, L.; Chen, S.G.; Chen, Y.L.; Ma, J.P.; Zhang, Y.Q.; Pang, D.D.; Li, X.B. Soil microbial carbon and nitrogen limitation constraints soil organic carbon stability in arid and semi-arid grasslands. J. Environ. Manag. 2025, 373, 123675. [Google Scholar] [CrossRef]
  57. Serna-Chavez, H.M.; Fierer, N.; van Bodegom, P.M. Global drivers and patterns of microbial abundance in soil. Global Ecol. Biogeogr. 2013, 22, 1162–1172. [Google Scholar] [CrossRef]
  58. Xing, W.; Hu, N.; Li, Z.F.; Feng, L.S.; Zhang, W.D.; Preez, G.D.; Zhang, H.M.; Li, D.C.; Lu, S.B.; Chang, S.X.; et al. Soil enzyme profile analysis for indicating decomposer micro-food web. IMeta 2024, 3, e161. [Google Scholar] [CrossRef]
  59. Wang, Y.Q.; Zhang, P.P.; Sun, H.; Jia, X.X.; Zhang, C.C.; Liu, S.Z.; Shao, M.A. Vertical patterns and controlling factors of soil nitrogen in deep profiles on the Loess Plateau of China. Catena 2022, 215, 106318. [Google Scholar] [CrossRef]
  60. Wang, J.J.; Sun, X.; Du, L.N.; Sun, W.L.; Wang, X.L.; Gaafar, A.R.Z.; Zhang, P.; Cai, T.; Liu, T.N.; Jia, Z.K.; et al. Appropriate fertilization increases carbon and nitrogen sequestration and economic benefit for straw-incorporated upland farming. Geoderma 2024, 441, 116743. [Google Scholar] [CrossRef]
  61. Liu, Y.; Evans, S.E.; Friesen, M.L.; Tiemann, L.K. Root exudates shift how N mineralization and N fixation contribute to the plant-available N supply in low fertility soils. Soil Biol. Biochem. 2022, 165, 108541. [Google Scholar] [CrossRef]
  62. Luo, L.; Meng, H.; Gu, J.D. Microbial extracellular enzymes in biogeochemical cycling of ecosystems. J. Environ. Manag. 2017, 197, 539–549. [Google Scholar] [CrossRef]
  63. Zhang, X.C.; Dippold, M.A.; Kuzyakov, Y.; Razavi, B.S. Spatial pattern of enzyme activities depends on root exudate composition. Soil Biol. Biochem. 2019, 133, 83–93. [Google Scholar] [CrossRef]
  64. Bowles, T.M.; Acosta-Martínez, V.; Calderón, F.; Jackson, L.E. Soil enzyme activities, microbial communities, and carbon and nitrogen availability in organic agroecosystems across an intensively-managed agricultural landscape. Soil Biol. Biochem. 2014, 68, 252–262. [Google Scholar] [CrossRef]
  65. Nevins, C.J.; Lacey, C.; Armstrong, S. The synchrony of cover crop decomposition, enzyme activity, and nitrogen availability in a corn agroecosystem in the Midwest United States. Soil Tillage Res. 2020, 197, 104518. [Google Scholar] [CrossRef]
  66. Bao, Y.Y.; Dolfing, J.; Guo, Z.Y.; Chen, R.R.; Wu, M.; Li, Z.P.; Lin, X.G.; Feng, Y.Z. Important ecophysiological roles of non-dominant in plant residue decomposition, especially in less fertile soils. Microbiome 2021, 9, 84. [Google Scholar] [CrossRef] [PubMed]
  67. Hu, H.L.; Zhao, L.; Tan, W.B.; Wang, G.A.; Xi, B.D. Discrepant responses of soil organic carbon dynamics to nitrogen addition in different layers: A case study in an agroecosystem. Front. Agric. Sci. Eng. 2024, 11, 314–325. [Google Scholar] [CrossRef]
  68. Ling, J.; Dungait, J.A.J.; Delgado-Baquerizo, M.; Cui, Z.L.; Zhou, R.R.; Zhang, W.S.; Gao, Q.; Chen, Y.X.; Yue, S.C.; Kuzyakov, Y.; et al. Soil organic carbon thresholds control fertilizer effects on carbon accrual in croplands worldwide. Nat. Commun. 2025, 16, 3009. [Google Scholar] [CrossRef]
  69. Li, Q.; Liu, Z.T.; Wang, L.A.; Zhang, Y.; Guo, M.Y.; Jin, W.; Hu, W.; Meng, Y.L.; Yang, H.S.; Zhou, Z.G. Enhancement joint fertilization efficacy of straw and nitrogen fertilizer on soil quality and seedcotton yield for sustainable cotton farming. Resour. Environ. Sustain. 2025, 20, 100218. [Google Scholar] [CrossRef]
  70. Chen, Q.Y.; Liu, Z.J.; Zhou, J.B.; Xu, X.P.; Zhu, Y.J. Long-term straw mulching with nitrogen fertilization increases nutrient and microbial determinants of soil quality in a maize–wheat rotation on China’s Loess Plateau. Sci. Total Environ. 2021, 775, 145930. [Google Scholar] [CrossRef]
  71. Wang, C.L.; Ma, Y.Q.; He, W.H.; Kuzyakov, Y.; Bol, R.; Chen, H.Q.; Fan, M.S. Soil quality and ecosystem multifunctionality after 13-year of organic and nitrogen fertilization. Sci. Total Environ. 2024, 931, 172789. [Google Scholar] [CrossRef]
  72. He, L.Y.; Lu, S.X.; Wang, C.G.; Mu, J.; Zhang, Y.L.; Wang, X.D. Changes in soil organic carbon fractions and enzyme activities in response to tillage practices in the Loess Plateau of China. Soil Tillage Res. 2021, 209, 104940. [Google Scholar] [CrossRef]
  73. Xiao, H.; Yang, H.L.; Zhao, M.L.; Monaco, T.A.; Rong, Y.P.; Huang, D.; Song, Q.; Zhao, K.; Wang, D.P. Soil extracellular enzyme activities and the abundance of nitrogen-cycling functional genes responded more to N addition than P addition in an Inner Mongolian meadow steppe. Sci. Total Environ. 2021, 759, 143541. [Google Scholar] [CrossRef]
Figure 1. (a) SOC content of different treatments; (b) TN content of different treatments. Lowercase letters indicate statistically significant differences among N treatments according to Duncan’s test (p < 0.05).
Agriculture 15 02098 g001
Figure 2. The content of soil labile organic C fractions in different treatments. (a) POC content; (b) DOC content; (c) ROC content; (d) MBC content. Lowercase letters indicate statistically significant differences among N treatments according to Duncan’s test (p < 0.05).
Agriculture 15 02098 g002
Figure 3. The content of labile organic N fractions in soil under different treatments. (a) PON content; (b) MBN content; (c) NH4+-N content; (d) NO3-N content. Lowercase letters indicate statistically significant differences among N treatments according to Duncan’s test (p < 0.05).
Agriculture 15 02098 g003
Figure 4. Soil enzyme activity content under different treatments. (a) β-G content; (b) β-X content; (c) UG content; (d) N-AG content. Lowercase letters indicate statistically significant differences among N treatments according to Duncan’s test (p < 0.05).
Agriculture 15 02098 g004
Figure 5. The amount of straw and root returning to the field under different treatments. (a) The amount of straw and root returning in wheat season, (b) The amount of straw and root returning to the field in maize season. Lowercase letters indicate statistically significant differences among N treatments according to Duncan’s test (p < 0.05).
Agriculture 15 02098 g005
Figure 6. Soil stoichiometric ratio under different treatments. (a) C/N; (b) POC/PON; (c) MBC/MBN; (d) β-G/N-AG; (e) MBC/SOC; (f) MBN/TN. Lowercase letters indicate statistically significant differences among N treatments according to Duncan’s test (p < 0.05).
Agriculture 15 02098 g006
Figure 7. SQI of different treatments. To improve statistical power, the SQI for the years 2023–2024 was calculated by combining the data. Lowercase letters indicate statistically significant differences among N treatments according to Duncan’s test (p < 0.05).
Agriculture 15 02098 g007
Figure 8. Correlation analysis between indicators. (a) The correlation between the indexes of 0–20 cm soil layer; (b) The correlation between the indexes of 20–40 cm soil layer. *** represents the correlation at the level of p ≤ 0.001; ** represents the correlation at the level of p ≤ 0.01; * represents thecorrelation at the p ≤ 0.05 level.
Agriculture 15 02098 g008
Figure 9. The structural equation model (SEM) was used to study the effects of different indicators on CPMI and SOI. Note: The box represents the variables contained in the model. The significant effect (p < 0.05) was drawn with a solid line, and the non-significant effect was drawn with a dotted line. The number at the arrow represents the standardized path coefficient. The thickness of the arrow indicates the strength of the relationship. The red and blue arrows represent the positive and negative flow of causality, respectively. *** represents the correlation at the level of p ≤ 0.001; ** represents the correlation at the level of p ≤ 0.01; * represents the correlation at the p ≤ 0.05 level.
Agriculture 15 02098 g009
Table 1. Position and proportion of N fertilizer application in each experimental treatment.
TreatmentProportionApplication of Pure N Amount at 0–20 cm (kg hm−2)Application of Pure N Amount at 20–40 cm (kg hm−2)
N0:00:000
N1:01:02250
N4:14:118045
N3:23:213590
N2:32:390135
N1:41:445180
Table 2. CPMI of different treatments.
YearTreatment0–20 cm20–40 cm
CPIAAICPMI(%)CPIAAICPMI(%)
2023N0:01.000 ±
0.000 d
0.362 ±
0.019 c
1.000 ±
0.000 c
100.00 ±
0.00 b
1.000 ±
0.000 b
0.171 ±
0.029 b
1.000 ±
0.000 b
100.00 ±
0.00 b
N1:01.090 ±
0.019 ab
0.390 ±
0.021 b
1.078 ±
0.058 b
117.48 ±
5.02 a
1.002 ±
0.042 b
0.199 ±
0.042 b
1.161 ±
0.246 b
115.66 ±
19.74 b
N4:11.099 ±
0.011 a
0.389 ±
0.006 b
1.076 ±
0.018 b
118.19 ±
0.92 a
1.052 ±
0.032 ab
0.248 ±
0.029 a
1.446 ±
0.168 a
151.81 ±
13.91 a
N3:21.104 ±
0.018 a
0.385 ±
0.005 b
1.065 ±
0.014 b
117.56 ±
1.19 a
1.080 ±
0.033 a
0.255 ±
0.010 a
1.487 ±
0.056 a
160.48 ±
3.60 a
N2:31.034 ±
0.021 c
0.417 ±
0.006 a
1.152 ±
0.017 a
119.15 ±
4.13 a
1.082 ±
0.043 a
0.269 ±
0.016 a
1.567 ±
0.092 a
169.29 ±
3.62 a
N1:41.068 ±
0.010 b
0.395 ±
0.011 ab
1.091 ±
0.030 b
116.48 ±
2.28 a
1.077 ±
0.035 a
0.262 ±
0.025 a
1.531 ±
0.148 a
164.53 ±
11.09 a
2024N0:01.000 ±
0.000 b
0.374 ±
0.034 a
1.000 ±
0.000 a
100.00 ±
0.00 b
1.000 ±
0.000 c
0.175 ±
0.031 b
1.000 ±
0.000 b
100.00 ±
0.00 b
N1:01.106 ±
0.055 a
0.380 ±
0.033 a
1.051 ±
0.091 a
115.94 ±
6.16 a
1.016 ±
0.024 bc
0.176 ±
0.034 b
1.027 ±
0.196 b
104.06 ±
17.99 b
N4:11.106 ±
0.043 a
0.388 ±
0.037 a
1.071 ±
0.102 a
118.25 ±
6.66 a
1.021 ±
0.022 bc
0.251 ±
0.021 a
1.463 ±
0.125 a
149.29 ±
11.86 a
N3:21.119 ±
0.022 a
0.378 ±
0.016 a
1.044 ±
0.044 a
116.81 ±
3.72 a
1.067 ±
0.032 a
0.241 ±
0.013 a
1.407 ±
0.077 a
150.12 ±
10.70 a
N2:31.110 ±
0.013 a
0.375 ±
0.027 a
1.036 ±
0.075 a
114.96 ±
8.42 a
1.073 ±
0.025 a
0.248 ±
0.015 a
1.444 ±
0.089 a
154.99 ±
11.12 a
N1:41.057 ±
0.058 b
0.383 ±
0.021 a
1.058 ±
0.058 a
111.66 ±
0.04 a
1.060 ±
0.031 ab
0.256 ±
0.023 a
1.493 ±
0.131 a
158.10 ±
9.94 a
Note: Lowercase letters indicate statistically significant differences among N treatments according to Duncan’s test (p < 0.05).
Disclaimer/Publisher’s Note: The statements, opinions and data contained in all publications are solely those of the individual author(s) and contributor(s) and not of MDPI and/or the editor(s). MDPI and/or the editor(s) disclaim responsibility for any injury to people or property resulting from any ideas, methods, instructions or products referred to in the content.